New Moored buoy network in Northern Indian Ocean with ... · with surface/subsurface Measurements,...
62
New Moored buoy network in Northern Indian Ocean with surface/subsurface Measurements, their analysis and applications Dr.G.Latha Scientist F and Project Director National Institute of Ocean Technology, Chennai (Earth Science Systems Organization Ministry of Earth Sciences, Govt of India)
Transcript of New Moored buoy network in Northern Indian Ocean with ... · with surface/subsurface Measurements,...

New Moored buoy network in Northern Indian Ocean with surface/subsurface
Measurements, their analysis and applications
Dr.G.Latha Scientist F and Project Director
National Institute of Ocean Technology, Chennai
(Earth Science Systems Organization Ministry of Earth Sciences, Govt of India)

MCPAs in South Asia
UNEP - EU funded project South Asia Coal Reef Task Force Monitoring mechanism, Institutional linkages,
Capacity building, awareness, Science, participatory approach , Eco-development
National task Force Managers training programme Small funded projects to 5 countries on education Regional communication strategy International Year of Coral Reef
ARINE OASTAL ESOURCES ONSERVATION OUNDATIONM & C R C F
fly ; k w ;W k ; fiu N a h u ts g h J fh g ;G ];jh g d k ;
id .r y d fjr< iu z m ;a ix r la IK m o k u
NIOT CHENNAI
The Indian Ocean is unique among the three tropical ocean basins in that it is blocked at 25°N by the Asian landmass. Seasonal heating and cooling of the land sets the stage for dramatic monsoon wind reversals, strong ocean–atmosphere interactions, and intense seasonal rains over the Indian subcontinent, Southeast Asia, East Africa, and Australia. Scientific need to have long term ocean observation.

MET OCEAN BUOY OMNI BUOY TSUNAMI BUOY
Met Ocean OMNI
Ocean Observation Systems • Under the Ocean observation systems programme of Ministry
of Earth Sciences, Gov. of India, NIOT has the mandate to establish and maintain moored buoy network in Indian seas.
• Real time data transmission to INCOIS via FTP/Email for dissemination to user agencies.

12 OMNI, 6 Met Ocean & 4 Tsunami buoys
Nu
mb
er
of
Bu
oys
Moored Buoy network in Indian seas

Y • Surface meteorological
– Wind speed and direction
– Air temperature
– Air pressure
– Humidity
– Short wave radiation
– Incoming long wave radiation
– Precipitation
• surface Ocean parameters
– Sea surface temperature
– Conductivity
– Wave
– Current speed and direction
• Sub surface parameters
– Temperature and salinity at depths starting from 5m, 10m, 15m, 20m, 30m, 50m, 75m, 100m, 200m and 500m
– Currents at depth levels 10m, 20m, 30m, 50m and 100m
NEW OMNI BUOYS

MOORED BUOY DATA ANALYSIS
Response of the Bay of Bengal to Cyclone forcing
Does cyclonic forcing warm the ocean surface in the Bay of Bengal?
Warm pool analysis in the Arabian sea and Bay of Bengal
Interannual variations of SST and its impact on coral reef near the
Andaman Islands
Wave Forecasting using Artificial Neural Network
Wave data assimilation

BAY OF BENGAL AND CYCLONE
• Bay of Bengal is home to about three or four named
tropical cyclones every year.
• Cyclones are formed within the lower tropospheric
equatorial troughs and propagates westward
• The strong winds associated with cyclone causes mixing of
the ocean with higher rate of exchange between ocean and
atmosphere.
• The ocean response is three times larger during pre-
monsoon than compared to post-monsoon season.

RESPONSE OF THE BAY OF BENGAL TO CYCLONE FORCING

CYCLONES IN THE BAY OF BENGAL during October 2010 to October 2013
JAL CYCLONE during NOVEMBER 2010
THANE CYCLONE during DECEMBER 2011
NILAM CYCLONE during OCTOBER 2012
MAHESAN CYCLONE during MAY 2013
PHAILIN CYCLONE during OCTOBER 2013

Phailin cyclone October 8-13, 2013
Significant Observations during Cyclone PHAILIN

Significant Observations during Cyclone PHAILIN
27.5
28
28.5
29
29.5
30
08 Oct 09 Oct 10 Oct 11 Oct 12 Oct 13 Oct 14 Oct
Tem
pe
ratu
re (
de
g C
)
SST
CB01 at 1.2m 2013 2013
29.5
30
30.5
31
31.5
32
32.5
33
33.5
08 Oct 09 Oct 10 Oct 11 Oct 12 Oct 13 Oct 14 Oct
Salin
ity
(pp
t)
SALINITY
CB01 at 1.2m 2013 2013
0
200
400
600
800
1000
1200
08 Oct 09 Oct 10 Oct 11 Oct 12 Oct 13 Oct 14 Oct
Irra
dia
nce
(W
/m2
IRRADIANCE
BD12 BD08 BD09 2013 2013

MAHESAN CYCLONE MAY 2013

RESPONSE IN THE WIND AND ATMOSPHERIC PRESSURE
20 m/s

OCEANIC RESPONSE IN THE SUBSURFACE TEMPERATURE
LEFT SIDE OF THE
CYCLONE TRACK
BUOY ON THE
CYCLONE TRACK
1 deg drop
0-50m water column
2.5 deg drop

OCEANIC RESPONSE IN THE SUBSURFACE SALINITY
LEFT SIDE OF THE
CYCLONE TRACK
BUOY ON THE
CYCLONE TRACK

OCEANIC RESPONSE IN THE CURRENT SPEED Inertial
Oscillation

THANE CYCLONE DECEMBER 2011
86.5E 11N
83E 14N

RESPONSE ON THE ATMOSPHERIC PARAMETERS
22 m/s
4.5 deg drop

OCEANIC RESPONSE AT 14N/83E BD11 1 deg rise
Increased
by 2 p.s.u.

OCEANIC RESPONSE IN THE CURRENT SPEED

CONCLUSION
Buoy data are useful to study the oceanic response to cyclonic forcing during various seasons in the bay of bengal.
Cyclones have resulted in cooling and entrainment of subsurface high saline waters at the buoy locations.
The temperature inversion in the subsurface layer during December has resulted in an increase in surface temperature and salinity.
The cyclonic forcing has resulted in inertial oscilation in the thermocline

• Buildup and collapse of warm pool using SST data collected from the
moored buoy network in the eastern Arabian Sea and the Bay of Bengal.
• To characterize the observed intraseasonal variability of SST in the deep and shallow waters of Arabian sea
Warm pool studies

SST Variability at 15N, 69E during February- May (1998, 1999, 2000, 2001 and 2007)
ARABIAN SEA - BUILD UP OF WARM POOL
• A diurnal cycle is seen overriding in the seasonal cycle
• Similar features occurring in the DS2 location

SST Variability at 15N, 69E during May - September (1998, 1999 and 2000)
COLLAPSE OF WARM POOL
• The collapse is dramatic during 1998 due to passage of onset vortex
• The intraseasonal variability during the collapse phase is relatively weak
• Diurnal scale variability is also very small

A comparison of SST record in the deep (11N, 72E) and shallow (13N, 75E) water region during May- September 2002
COLLAPSE OF WARM POOL
• These intraseasonal oscillation are only seen in the coastal SST record

The warm pool in the Arabian Sea shows a progressive build up
during February – May and collapse during summer monsoon season. The collapse is dramatic during the years of onset vortex
Relatively weaker amplitude intraseasonal oscillations are seen during the summer monsoon season in the deep waters of eastern Arabian Sea.
Relatively large amplitude oscillations are seen in the coastal SST records in the Arabian Sea.
CONCLUSIONS

Coastal Buoys

Inter-annual variations of Sea Surface Temperature and its impact on coral reef near the Andaman Island
SAC Meeting Aug 2013.

Coral reef map of India

• Coral reefs are the most remarkable and diverse marine ecosystems on the planet
• Crucial Role in the sources of Income and resources
• Indian ocean witnessed coral reef bleaching events during 1998, 2002, 2005 and 2010 (J.Ravindran et al 1999, Arthur 2000, Kumaraguru et al. 2003, Vivekanandan et al.2009, Krishnan et al.2010)
• Intensity and frequency of bleaching was more in Andaman Islands compared to Lakshadweep and Gulf of Mannar (KohTao 2010)

NIOT Coral Reef Data Buoy System
Need for the continuous time series of in-situ data from the coral reef environment
Request from Department of Environment and Forest
NIOT developed a met data buoy called “ Coral Reef Data Buoy System” and deployed at Grub Island of Mahatma Gandhi Marine National Park, Wandoor, Andaman on 23 February 2011.
Coral Reef Buoy (11.58N&92.60) in the Andaman Island provides continuous time series measurements of Met-ocean parameters like SST, Wind speed and direction, Air pressure, Air temperature, Air humidity, current speed and direction and conductivity.

Buoy Location

Soft corals found at the bottom of the buoy hull retrieved after one year
CORAL REEF BUOY – Andaman
Mooring Layout

Objectives
• To examine the evolution of SST near the Andaman Island by using the buoy data during March-June months of the years 2011-2012.
• To compare the differences in the thermal stress over the coral reef region during the years 2010, 2011 and 2012 by using ‘Hotspot’ analysis.

Data Sets Utilised for SST
Daily averaged Buoy SST @ 1m depth (11.58N & 92.60E).
Weekly and Monthly averaged AVHRR-Pathfinder V4-SST.

Monthly SST Climatology of Andaman Reef region (11.5-14N, 91.5-94E) for the period of 1985-2012 by using AVHRR
0C

Comparison of AVHRR SST during 2010, 2011 and 2012
Andaman Sea witnessed mass coral reef bleaching during April-May months of the year 2010 (Krishnan et al. 2010)
0C
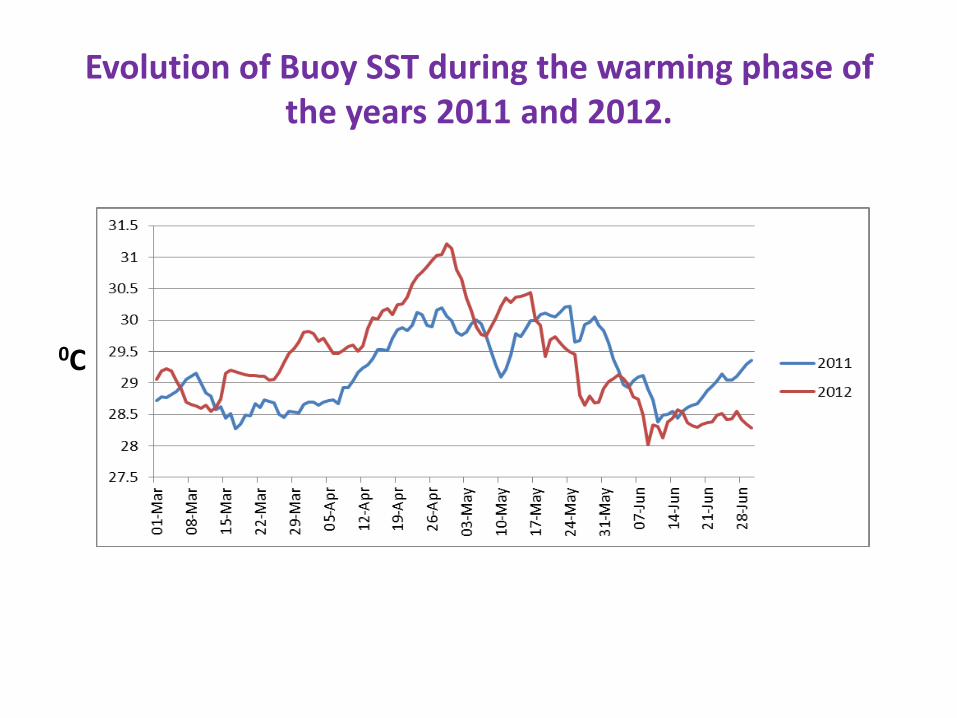
Evolution of Buoy SST during the warming phase of the years 2011 and 2012.
0C

Hot Spot
• Large scale coral bleaching follows high temperature extremes when the weekly average SST values reach 10C above normal maximum monthly averages.
• Hot spot is the areas of the ocean with SST anomalies over 1ᴼC above long-term averages of monthly maximum. (‘Hot Spots’, as defined by Goreau & Hayes, 1994).
• Monthly Mean Maximum SST for the Andaman Sea (29.84°C) is calculated by using AVHRR v4 (9x9km) SST data for the period of 1985-2012.
• In Andaman, the region where the SST crossed the value of 30.84°C can be considered as Hot spot region

Hot Spot Around Andaman Islands: March – May, 2010

Hot Spot Around Andaman Islands: March – May, 2011

Hot Spot Around Andaman Islands: March – May, 2012

Conclusions
• Based on the buoy data and satellite data, it has become clear that the year 2011
was a cooling phase for the Andaman reef region.
• Hotspot shows interannual variability with maximum duration (6weeks) in the
year 2010.
• Co-occurrence of SST anomaly maxima and the climatological maxima and the
resultant development of Hot spot pattern may be the probable causes for the
mass bleaching happened during the year 2010.
Wave data analysis and applications

NIOT Wave Buoy Locations
• Six Buoys have been deployed in the Arabian Sea and the Bay Bengal for wave
measurement

Wave Forecasting using Artificial Neural Network
• To develop a model for wave forecasting using soft computing techniques such as Artificial Neural Networks (ANN)

Buoy Details
Buoy Id DS3
Lat 120 11’ 20”N
Long 900 43’ 30”E
Depth 3100 m
Training – 70% data (Jan 2003-Dec 2003 )
Testing – 30% data (July 2004- Nov 2004)
Wind data input To Forecasting Significant Wave Height An attempt to made use wind data to predict SWH since maintenance of wave buoy is very difficult
Study Parameters

Time series plot for Significant wave height
Correlation Coefficient : 0.9 Time series plot for Significant wave height at Station DS3 with input wind speed – Prediction by ANN
Wind data input
Observe Model

Study Period: DS5 – September 2007 – December 2007
Buoy Details
Buoy Id DS5
Lat 15 N
Long 83 E
Depth 3267 m
Real time wave forecasting using ANN

12th and 24th hrs Real time forecasting Significant Wave Height Forecasting– DS5
Error Statistics
Buoy
Forecast
interval
‘Hrs’
Correlation
coefficient
‘r’
DS5
3 0.97
6 0.95
12 0.91
24 0.83

Wave data assimilation


Numerical Frame Work
Wave Model : WAM III Cycle 4 Wave Parameter: Significant wave height Wind forcing ECMWF wind data : 10 x 1.250 (Old buoy network) ECMWF wind data : 0.50 x 0.50 (New buoy network)
Bathymetry: Etopo2 Model Grid resolution : 0.50 x 0.50 Model domain:Easting:30-120; Northing:-50S – 30N Observed data : NIOT Moored buoy network program Data Assimilation technique: Optimum Interpolation(correction to the output)
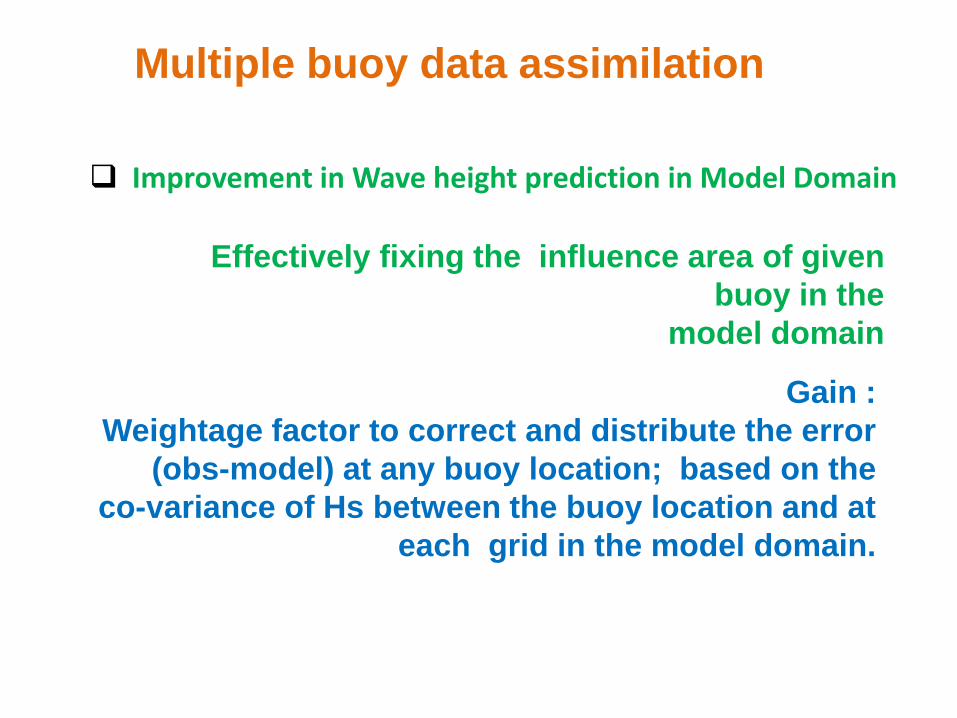
Improvement in Wave height prediction in Model Domain
Effectively fixing the influence area of given
buoy in the
model domain
Multiple buoy data assimilation
Gain :
Weightage factor to correct and distribute the error
(obs-model) at any buoy location; based on the
co-variance of Hs between the buoy location and at
each grid in the model domain.

Reason for performing Multiple Buoy Assimilation- Case: Buoy off MB12 - Gain Distribution
MB12-Single
Buoy
MB12-Three Buoys
(mb12+mb11+ds4)
MB12- Four Buoys
(mb12+mb11+ds4+ds
3)
MB12- Five Buoys
(mb12+mb11+ds4+ds3
+ob8)

0
1
2
3
4
5
6
18-Jul-04 28-Jul-04 7-Aug-04 17-Aug-04
MB12-observation MB12-WAM model MB12-WAM -afetr Assimilation
Improvement in WAM model Prediction after Assimilation at MB12
0
1
2
3
4
5
6
18-Jul-04 28-Jul-04 7-Aug-04 17-Aug-04
MB11-observations
MB11-WAM model
MB11-WAM -afetr Assimilation
Improvement in WAM model Prediction after Assimilation at MB11
0
1
2
3
4
5
6
18-Jul-04 28-Jul-04 7-Aug-04 17-Aug-04
DS4-Observations
DS4-WAM model
DS4-WAM -afetr Assimilation
Improvement in WAM model Prediction after Assimilation at
DS4
Comparison of Buoy Observations with WAM Wave Model Predictions Before and After Buoy
Data Assimilation
SW monsoon

Effect of Neighboring Buoys Assimilation on MB12

Influence of Neighbouring Buoys (MB11 & DS4) on MB12

Capacity Building Sensors and Buoy system
1. Regional Workshop on Best Practices for instruments and Methods of Ocean Observation from 19th – 21st November 2012
2. National Training for Data Collection in the Ocean by Seabird Electronics and WET Labs from 22nd – 27th November 2012
3. 2011 Regional workshop on awareness on protection of buoys
4. Prof Eric & Prof Craig Lee on Oceanographic Glider and Floats University of Washington February 2013
5. Training on OMNI buoy systems at NIOT by Fugro Oceanor Norway October 2012.
6. Training by Pacific Marine Environmental Laborato
Data Quality
1. Training by National Data Buoy Center USA at NIOT
2. Technical challenges on Oceanographic sensors by Dr.Paul Freitag of NOAA-PMEL during November 2012.
3. Training planned for 3 staff at PMEL and NDBC from 4 August to 14 August 2013
4. ADCP DATA NIO GOA
Calibration
1. WMO training 2013, July 2013 FIO China
2. NOAA PMEL
New observation tools
1. Dr Vembu US Ocean Observation network SECOORA
2. Mini workshop on 26 February 2013 at IIT Madras .

Participant Countries : 19 Number of Industries : 26 Number of presentations : 33
Regional Workshop on Best Practices for instruments and Methods of Ocean Observation
Objective: Capacity building of scientists, researchers, engineers and managers on best of practices on calibration and testing instruments for ocean observation systems
Date : 19th– 21st November 2012.
Release of Training manual
and Foot Print
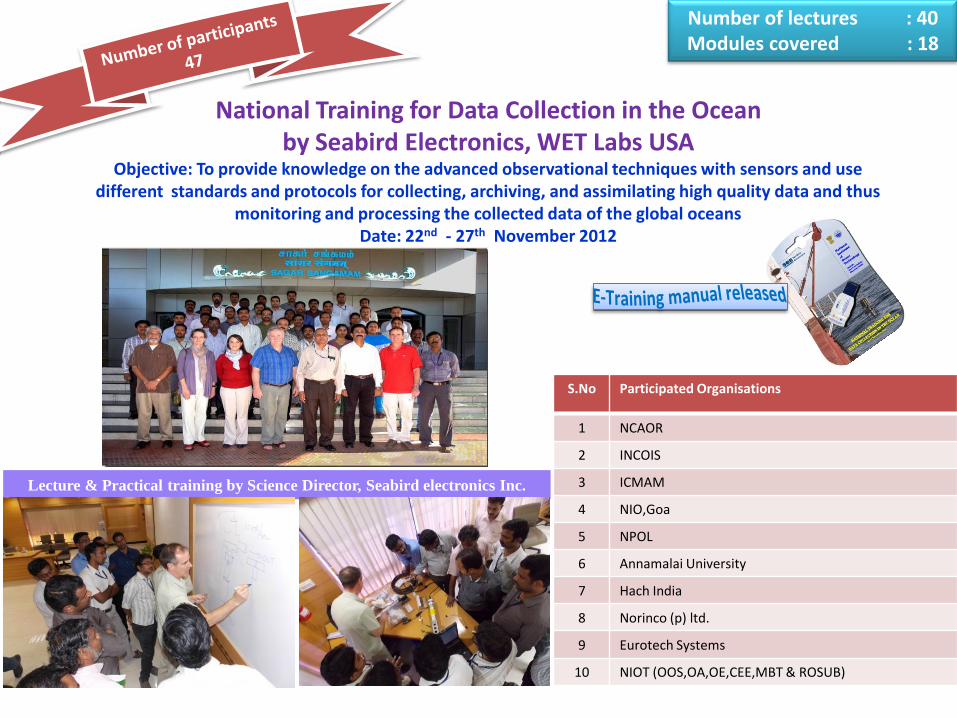
National Training for Data Collection in the Ocean by Seabird Electronics, WET Labs USA
Objective: To provide knowledge on the advanced observational techniques with sensors and use different standards and protocols for collecting, archiving, and assimilating high quality data and thus
monitoring and processing the collected data of the global oceans Date: 22nd - 27th November 2012
Lecture & Practical training by Science Director, Seabird electronics Inc.
S.No Participated Organisations
1 NCAOR
2 INCOIS
3 ICMAM
4 NIO,Goa
5 NPOL
6 Annamalai University
7 Hach India
8 Norinco (p) ltd.
9 Eurotech Systems
10 NIOT (OOS,OA,OE,CEE,MBT & ROSUB)
Number of lectures : 40 Modules covered : 18

Thank You