New Methods of Capacity Determination for Rural Roads...
28
New Methods of Capacity Determination for Rural Roads in Mountainous Terrain ] HARRY C. SCHWENDER, State Road Commission, West Virginia, O. K. NORMANN, Bureau of Public Roads, and JAMES O. GRANUM, Automotive Safety Foundation # IN A comprehensive survey of highway needs, it is essential to establish a certain level of performance for each highway system in a state and then determine the con- struction, reconstruction, and improvements needed to bring the existing systems up to these performance levels. The levels of performance which are established must be { feasible and based on the current desires of traffic to move safely and efficiently, with due consideration being given to the future demands of highway transportation since it is such an important factor in the national economy. Performance levels may be measured, and also specified, in terms of safe operating speeds. Comprehensive studies as well as past practices have shown that drivers de- mand, and that it is more feasible to construct, facilities that will permit higher operat- ing speeds in level terrain than in rough or mountainous terrain, on primary highways carrying most of the long-distance travel than on local roads where the average trip 1 length is shorter, and for roads on the same system carrying the higher traffic volumes than for those carrying the lower traffic volumes. Although the type of service to be provided by a highway under construction is largely an administrative decision, this ' decision must be based on driver desires and traffic demand. ! Once having established the type of service which a highway or a system of highways should provide, it is necessary to specify this service in terms of design speed and ( operating speed. The design speed is a speed determined for design and correlation of j the physical features of a highway that influence vehicle operation. It is the maximum ^ safe speed that can be maintained over a specif ied section of the highway when conditions are j so favorable that the designfeatures of the highway govern.^ In short, it is the maximum safe speed that vehicles can safely travel over any section of the highway during extreme-l ly low traffic densities. In the design of a highway, the assumed design speed automati- ( cally establishes such items as the minimum stopping sight distance, the minimum sight | distance at intersections, the maximum curvature, and the superelevation. Other fea- | tures, such as widths of pavements and shoulders and clearances to walls and rails, are i not directly related to design speed but they should be accorded higher standards for the higher design speeds. I The operating speed is the highest over-all speed exclusive of stops at which a driver i can safely travel on a given highway under the prevailing traffic conditions without at any time exceeding the speed which is compatible with the design features of the high- | way. For this discussion it applies to the conditions during the 30th highest hourly 1 traffic volume for the year under consideration. It is, therefore, a measure of the type | of service which a highway provides during most of the hours of peak flow. The operat- ^ ing speed on an existing hi^way is affected by design speed, traffic volume, and number of lanes. Also, for two-lane roads, it is affected by the availability of sections on which } the sight distance is of sufficient length to perform passing maneuvers safely. In the design of a new highway, it is the one factor which together with the traffic volume and assumed design speed determines the needed geometric features of a highway. Drivers will accept as reasonable a somewhat lower operating speed, or a higher degree of congestion, on a highway that has been in existence for several years than they will accept or expect on a new highway or one recently reconstructed. Also, for a needs study to be realistic, there must necessarily be some overlap in the standards by which existing highways are judged for adequacy and those used for the construction of a new highway. ^AASHO definition. 10
Transcript of New Methods of Capacity Determination for Rural Roads...

New Methods of Capacity Determination for Rural Roads in Mountainous Terrain ] HARRY C. SCHWENDER, State Road Commission, West Virginia, O. K. NORMANN, Bureau of Public Roads, and JAMES O. GRANUM, Automotive Safety Foundation
# IN A comprehensive survey of highway needs, it is essential to establish a certain level of performance for each highway system in a state and then determine the construction, reconstruction, and improvements needed to bring the existing systems up to these performance levels. The levels of performance which are established must be { feasible and based on the current desires of traffic to move safely and efficiently, with due consideration being given to the future demands of highway transportation since i t is such an important factor in the national economy.
Performance levels may be measured, and also specified, in terms of safe operating speeds. Comprehensive studies as well as past practices have shown that drivers demand, and that i t is more feasible to construct, facilities that will permit higher operating speeds in level terrain than in rough or mountainous terrain, on primary highways carrying most of the long-distance travel than on local roads where the average trip 1 length is shorter, and for roads on the same system carrying the higher traffic volumes than for those carrying the lower traffic volumes. Although the type of service to be provided by a highway under construction is largely an administrative decision, this ' decision must be based on driver desires and traffic demand. !
Once having established the type of service which a highway or a system of highways should provide, i t is necessary to specify this service in terms of design speed and ( operating speed. The design speed is a speed determined for design and correlation of j the physical features of a highway that influence vehicle operation. It is the maximum ^ safe speed that can be maintained over a specif ied section of the highway when conditions are j so favorable that the designfeatures of the highway govern.^ In short, i t is the maximum safe speed that vehicles can safely travel over any section of the highway during extreme-l ly low traffic densities. In the design of a highway, the assumed design speed automati- ( cally establishes such items as the minimum stopping sight distance, the minimum sight | distance at intersections, the maximum curvature, and the superelevation. Other fea- | tures, such as widths of pavements and shoulders and clearances to walls and rails, are i not directly related to design speed but they should be accorded higher standards for the higher design speeds. I
The operating speed is the highest over-all speed exclusive of stops at which a driver i can safely travel on a given highway under the prevailing traffic conditions without at any time exceeding the speed which is compatible with the design features of the high- | way. For this discussion it applies to the conditions during the 30th highest hourly 1 traffic volume for the year under consideration. It is, therefore, a measure of the type | of service which a highway provides during most of the hours of peak flow. The operat- ^ ing speed on an existing hi^way is affected by design speed, traffic volume, and number of lanes. Also, for two-lane roads, it is affected by the availability of sections on which } the sight distance is of sufficient length to perform passing maneuvers safely. In the design of a new highway, i t is the one factor which together with the traffic volume and assumed design speed determines the needed geometric features of a highway.
Drivers wi l l accept as reasonable a somewhat lower operating speed, or a higher degree of congestion, on a highway that has been in existence for several years than they wi l l accept or expect on a new highway or one recently reconstructed. Also, for a needs study to be realistic, there must necessarily be some overlap in the standards by which existing highways are judged for adequacy and those used for the construction of a new highway.
^AASHO definition. 10
11
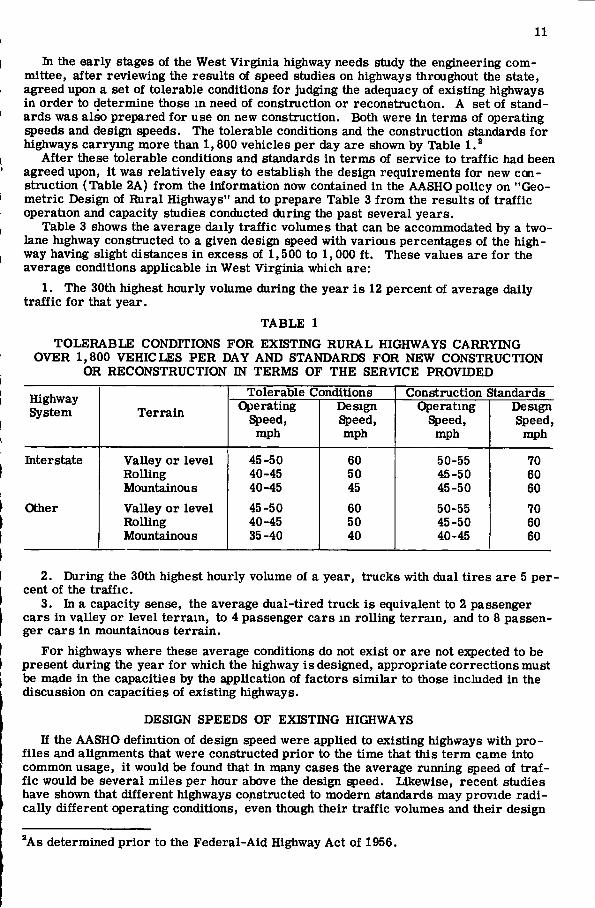
hi the early stages of the West Virginia highway needs study the engineerii^ committee, after reviewing the results of speed studies on highways throughout the state, agreed upon a set of tolerable conditions for judging the adequacy of existing highways in order to determine those in need of construction or reconstruction. A set of standards was also prepared for use on new construction. Both were in terms of operating speeds and design speeds. The tolerable conditions and the construction standards for highways carrying more than 1,800 vehicles per day are shown by Table 1.^
After these tolerable conditions and standards in terms of service to traffic had been agreed upon, i t was relatively easy to establish the design requirements for new construction (Table 2A) from the information now contained in the AASHOpolicy on "Geometric Design of Rural Highways" and to prepare Table 3 from the results of traffic operation and capacity studies conducted during the past several years.
Table 3 shows the average daily traffic volumes that can be accommodated by a two-lane highway constructed to a given design speed with various percentages of the highway having slight distances in excess of 1,500 to 1,000 f t . These values are for the average conditions applicable in West Virginia which are:
1. The 30th highest hourly volume during the year is 12 percent of average daily traffic for that year.
TABLE 1 TOLERABLE CONDITIONS FOR EXISTING RURAL HIGHWAYS CARRYING
OVER 1,800 VEHICLES PER DAY AND STANDARDS FOR NEW CONSTRUCTION OR RECONSTRUCTION IN TERMS OF THE SERVICE PROVIDED
Highway System Terrain
Tolerable Conditions Construction Standards Highway System Terrain Operating
Speed, mph
Design Speed, mph
Operating Speed, mph
Design Speed, mph
Interstate Valley or level 45-50 60 50-55 70 Rolling 40-45 50 45-50 60 Mountainous 40-45 45 45-50 60
Other Valley or level 45-50 60 50-55 70 Rolling 40-45 50 45-50 60 Mountainous 35-40 40 40-45 60
2. During the 30th highest hourly volume of a year, trucks with dual tires are 5 percent of the traffic.
3, In a capacity sense, the average dual-tired truck is equivalent to 2 passenger cars in valley or level terrain, to 4 passenger cars in rolling terrain, and to 8 passenger cars In mountainous terrain.
For highways where these average conditions do not exist or are not expected to be present during the year for which the highway is designed, appropriate corrections must be made in the capacities by the application of factors similar to those included in the discussion on capacities of existing highways.
DESIGN SPEEDS OF EXISTING HIGHWAYS If the AASHO defimtion of design speed were applied to existing highways with pro
files and alignments that were constructed prior to the time that this term came into common usage, i t would be found that in many cases the average running speed of traffic would be several miles per hour above the design speed. Likewise, recent studies have shown that different highways constructed to modern standards may provide radically different operating conditions, even though their traffic volumes and their design
As determined prior to the Federal-Aid Highway Act of 1956.
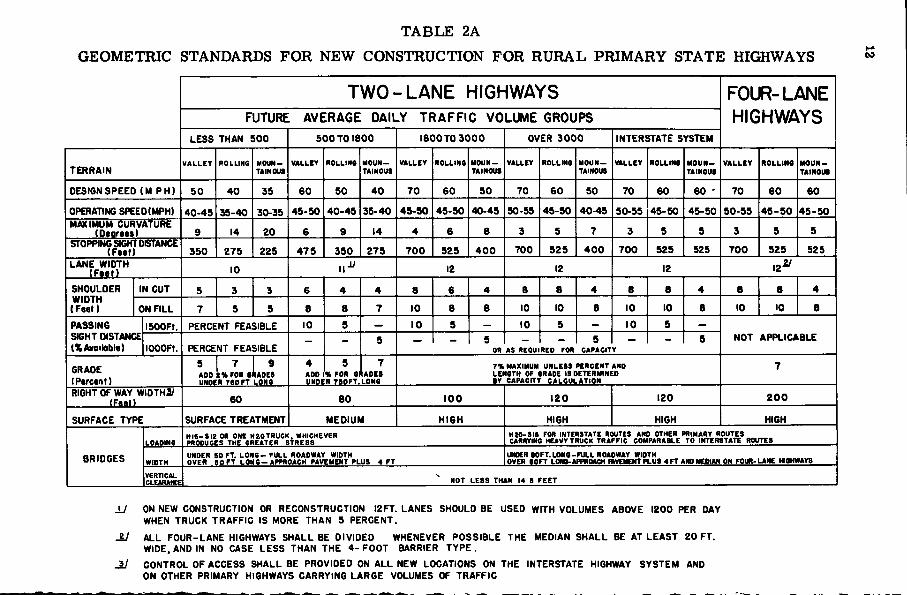
T A B L E 2A
GEOMETRIC STANDARDS FOR NEW CONSTRUCTION FOR RURAL PRIMARY STATE HIGHWAYS
TWO-LANE HIGHWAYS FOUR-LANE HIGHWAYS FUTURE AVERAGE DAILY TRAFFIC VOLUME GROUPS
FOUR-LANE HIGHWAYS
LESS THAN 500 500 TO 1800 I800TO 3000 OVER 3000 INTERSTATE SYSTEM
FOUR-LANE HIGHWAYS
TERRAIN V A L L E Y ROLLING MOUN
TAINOUS VALLEY ROLLING MOUN
TAINOUS VALLEY ROLLING MOUN
TAINOUS VALLEY ROLLING MOUN
TAINOUS W L L E Y ROLLING MOUN
TAINOUS V A L L E Y ROLLING MOUN
TAINOUS
DESIGN SPEED (M PH) 50 40 35 60 SO 40 70 60 50 70 60 50 70 60 60 - 70 60 60
OPERATING SPEED(MPH) 40-45 35-40 30-35 45-50 40-45 35-40 45-50 45-50 40-45 50-55 45-50 40-45 50-55 45-50 45-50 50-55 45 -50 45-50 MAXIMUM CURVATURE
(Dearees) 9 14 20 6 9 14 4 6 8 3 5 7 3 5 5 3 5 5 STOPPING SIGHT DISTANCE
(Feet) 350 275 225 475 350 275 700 525 400 700 525 400 700 525 525 700 525 525 LANE WIDTH
(Feet) 10 11^ 12 12 12 . 2 ^
SHOULDER WIDTH (Feet)
IN CUT 5 3 3 6 4 4 8 6 4 8 8 4 8 8 4 8 8 4 SHOULDER WIDTH (Feet) ON FILL 7 5 5 8 8 7 10 8 8 10 10 8 10 10 8 10 to 8
PASSING SIGHT DISTANCE l%A«oiloble)
ISOOFt. PERCENT FEASIBLE 10 5 — 10 5 — 10 5 - 10 5 —
NOT APPLICABLE PASSING SIGHT DISTANCE l%A«oiloble) lOOOFt. PERCENT FEASIBLE - - 5 — - 5
OR AS REOU RED FOR 5
CAPACIT Y - 5 NOT APPLICABLE
GRADE (Percent)
5 1 7 1 9 ADD S % r o R eKADES UNDEk 7 S 0 F T LONS
4 ADD UNDI
5 % FOR e R 7 B 0 F T .
7 ADES
LONG
7% MAXIMUM UNLESS PERCENT AND LENGTH OF GRADE I S DETERMINED BY CAPACITY CALCULATION
7
RIGHT OF WAY WIDTHS (Feat) 60 80 100 120 120 2 0 0
SURFACE TYPE SURFACE TREATMENT MEDIUM HIGH HIGH HIGH HIGH
BRIDGES
LOADINS H I S - S I 2 OR ONE MEG TRUCK. WHICHEVER PRODUCES THE GREATER S T R E S S
H 2 0 - S I S FOR INTERSTATE ROUTES AND OTHER PRIMARY ROUTES CARRYING HEAVY TRUCK TRAFFIC COMPARABLE TO INTERSTATE ROUTES
BRIDGES WIDTH UNDER SO FT. L 0 N 6 - FULL ROADWAY WIDTH OVER S O F T LONS-APPROACH PAVEMENT PLUS 4 FT
UNDER BDFT.LONO-FULL ROADWAY WIDTH OVER SOFT LONG-APPROACH MVEMENT PLUS 4 FT AND MEDIAN ON FOUR- LANE HIGHWAYS BRIDGES
VERTICAL CLEARANCE ^ NOT L E S S THAN 14 S F E E T
\J ON NEW CONSTRUCTION OR RECONSTRUCTION I2FT. LANES SHOULD BE USED WITH VOLUMES ABOVE 1200 PER DAY WHEN TRUCK TRAFFIC IS MORE THAN 5 PERCENT.
SJ ALL FOUR-LANE HIGHWAYS SHALL BE DIVIDED WHENEVER POSSIBLE THE MEDIAN SHALL BE AT LEAST 20 FT. WIDE. AND IN NO CASE L E S S THAN THE 4-FOOT BARRIER T Y P E .
^ CONTROL OF ACCESS SHALL BE PROVIDED ON ALL NEW LOCATIONS ON THE INTERSTATE HIGHWAY SYSTEM AND ON OTHER PRIMARY HIGHWAYS CARRYING LARGE VOLUMES OF TRAFFIC
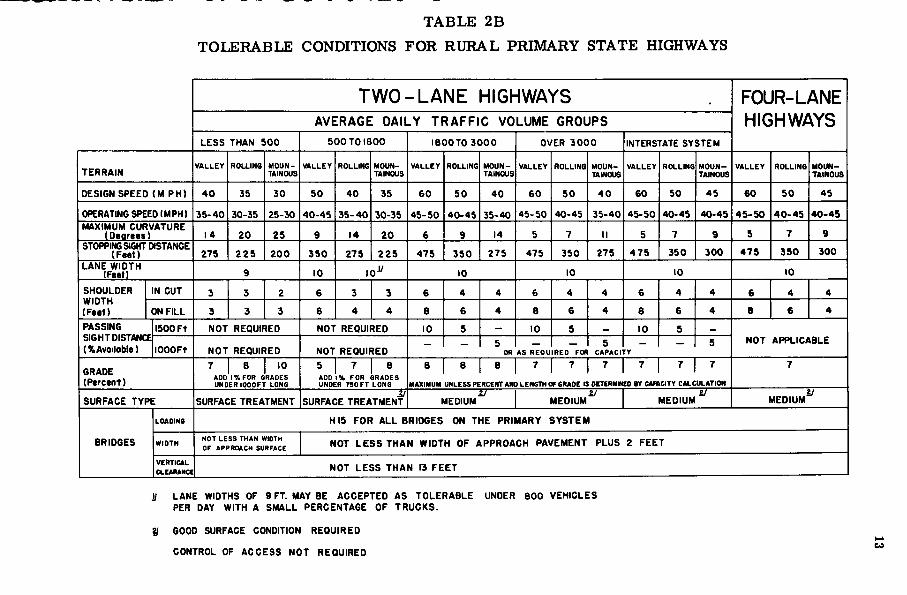
T A B L E 2B T O L E R A B L E CONDITIONS FOR RURAL PRIMARY STATE HIGHWAYS
T W O - L A N E HIGHWAYS FOUR-LANE HIGHWAYS AVERAGE DAILY TRAFFIC VOLUME GROUPS
FOUR-LANE HIGHWAYS
LESS THAN SOO 500 TO 1800 1800TO 3000 OVER 3000 INTERSTATE SYSTEM
FOUR-LANE HIGHWAYS
TERRAIN V A L L E Y ROLLINS MOUN
TAINOUS V A L L E Y ROLLING MOUN
TAINOUS V A L L E Y ROLLING MOUN
TAINOUS VALLEY ROLLING MOUN
TAINOUS V A L L E Y ROLLING MOUN
TAINOUS V A L L E Y ROLLING MOUN
TAINOUS
DESIGN SPEED (M PH) 40 35 30 50 40 35 60 50 40 60 50 40 60 50 45 60 50 45
OPERATING SPEED IMPH) 35-40 30-35 25-30 40-45 35-40 30-35 45-50 40-45 35-40 45-50 40-45 35-40 45-50 40-45 40-45 45-50 40-45 40-45 MAXIMUM CURVATURE
(Degrees) 14 20 25 9 14 20 6 9 14 5 7 II 5 7 9 5 7 9 STOPPING SIGHT DISTANCE
(Feet) 275 225 200 350 275 225 475 350 275 475 350 275 475 350 300 475 350 300 LANE WIDTH
(Feet) 9 10 10^ 10 10 10 10
SHOULDER WIDTH (Feet)
IN CUT 3 3 2 6 3 3 6 4 4 6 4 4 6 4 4 6 4 4 SHOULDER WIDTH (Feet) ON FILL 3 3 3 6 4 4 8 6 4 8 6 4 8 6 4 8 6 4
PASSING 1500 Ft NOT REQUIRED NOT REQUIRED 10 5 - 10 5 — 10 5 _ NOT APPLICABLE SIGHTDISTANLk
(%Available) lOOOFt NOT REQUIRED NOT REQUIRED - - 5 OR AS REOU RED FOR
5 CAPACI Y - 5 NOT APPLICABLE
GRADE (Percent)
7 1 8 I 10 ADD 1 % FOR GRADES UNDERlOOOFT LONG
5 { 7 I 8 ADD 1% FOR GRADES UNDER 790 FT LONG
8 | 8 | 8 | 7 | 7 | 7 | 7 | 7 | 7
MAXIMUM UNLESS PERCENT AND LENGTH OF GRADE IS DETERMINED «1 CAPACITY CALCULATION
7
SURFACE TYPE SURFACE TREATMENT U
SURFACE TREATMENT U
MEDIUM MEDIUM 2/
MEDIUM MEDIUM^
BRIDGES
LOADING HIS FOR ALL BRIDGES ON THE PRIMARY SYSTEM
BRIDGES WIDTH NOT L E S S THAN WIDTH OF APPROACH SURFACE NOT L E S S THAN WIDTH OF APPROACH PAVEMENT PLUS 2 F E E T BRIDGES
VERTICAL CLEARANCE NOT L E S S THAN 13 F E E T
J/ LANE WIDTHS OF 9 FT. MAY BE ACCEPTED AS TOLERABLE UNDER 800 VEHICLES PER DAY WITH A SMALL PERCENTAGE OF TRUCKS.
2/ GOOD SURFACE CONDITION REQUIRED
CONTROL OF ACCESS NOT REQUIRED

14
speeds are identical. Average speeds, for example, will be much higher on a highway with few 5-degree curves and considerable tangent alignment than on a highway with many 5-degree curves and little tangent alignment. This is because above-minimum design values are utilized where feasible and drivers do vary their speeds to a considerable extent with the immediate geometric conditions rather than adopting one uniform speed for the entire length of a highway.
Conversely, for a given operating speed a highway with few curves and mostly tangent alignment will accommodate higher volumes of traffic than a similar highway with many curves of the same degree and less tangent alignment. In relating the operating speed of a highway to its capacity, therefore it is necessary to determine the "average highway speed," especially for existing highways.
Introduction of the term "average highway speed," which is in effect the average maximum safe speed, or the operating speed for a passenger car over a section of high-
TABLE 3 CONSTRUCTION STANDARDS FOR CAPACITIES OF 2-LANE HIGHWAYS,
12-FOOT LANES (Based on 5 percent trucks during 30th highest hour factor of 12 percent ADT)
Percentage of Highway with Passing Sight
Average Daily Traffic Volume Percentage of Highway with Passing Sight Mountainous Distance^ Valley or Flat Rolling Interstate Other 1,500
ft 1,000
ft Oper.Speed 50-55 Design Speed 70
Oper.Speed 45-50 Design Speed 60
Oper.Speed 45-50 Design Speed 60
Oper.Speed 40-45 Design Speed 60
100 100 4,850 6,500 5,500 6,550 80 90 4,450 5,850 5,000 6,000 60 80 3,950 5,050 4,300 5,300 40 70 3,350 4,200 3,600 4,600 20 60 2,400 3,450 2,900 3,850
0 50 1,300 2,600 2,200 3,050
Percentage of 1,500-ft passing sight distance is used for all operating speeds except those below 45 mph. The 1,000-ft values are applicable to all operating speeds.
way during extremely low traffic densities, is an approach which has not previously been employed in relating alignment and profile to capacities. It is an approach, however, which must be employed to obtain reasonable accuracy in capacity determinations, especially for existing highways.
The average highway speed of an existing highway may be determined by weighting the possible speeds of traffic on the individual sections during low traffic flows by the length of the sections. The possible speeds for various horizontal curves and stopping sight distance conditions may be determined by use of the AASHO tables relating these features to the design speed.
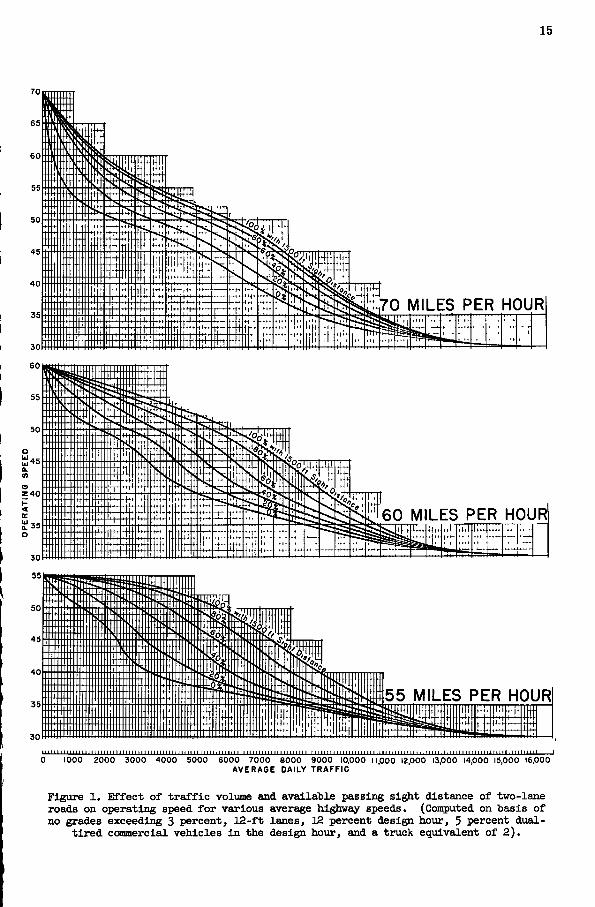
When preparing plans for a highway, the designer should base the geometric features on an assumed design speed over a substantial length of highway to obtain a balanced design. The lower the design ^eed, the greater is the likelihood of the occurrence of such sections. Invariably there are sections where the designer utilizes values that are adequate for higher speeds than the design speed assumed. As a result, the high-speed driver can travel over the section during low traffic densities at an average speed which exceeds the assumed design speed. This speed is the average highway speed and is equivalent to the low volume operating speed.
Figures 1 and 2 show how the operating speed on a 2-lane highway varies with the
15
70 MILES PER HOUR
L E S PER HOUR 60 M
iiiKi'liiliiiriiiiiii:
55 MILES PER HOUR
0 l o o o ' zooo ' sooo''' AVERAGE DAILY TRAFFIC
Figure 1. Effect of t r a f f i c volume and available passing sight distance of two-lane roads on operating speed for various average highway speeds. (Computed on basis of no grades exceeding 3 percent, 12-ft lanes, 12 percent design hour, 5 percent dual-
t i r e d commercial vehicles i n the design hour, and a truck equivalent of 2) .
5 0 MILES PER HOUR
m m
45 Ml HOUR
40 MILES PER
35 MILES ER HO
1000 2000 3000 4000 5000 6000 7000 8000 9000 10,000 11,000 12,000 13,000 14,000 15,000 16,000 AVERAGE DAILY TRAFFIC
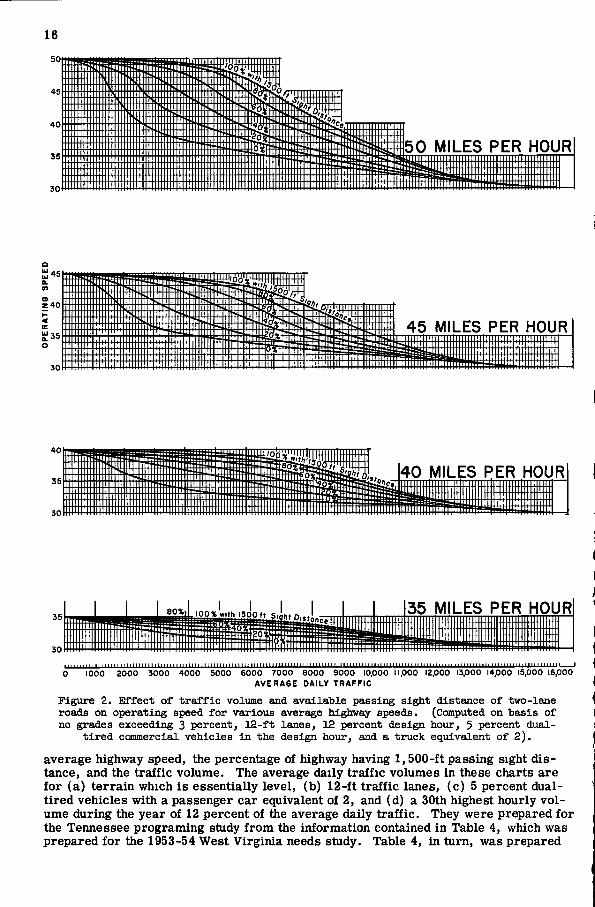
Figure 2. Effect of t r a f f i c volume and available passing sight distance of two-lane roads on operating speed for varioxis average highway speeds. (Computed on basis of no grades exceeding 3 percent, 12-ft lanes, 12 percent design hour, 5 percent dual-
t i r e d commercial vehicles in the design hour, and a truck equivalent of 2) .
average highway speed, the percentage of highway having 1,500-ft passing sight distance, and the traffic volume. The average daily traffic volumes in these charts are for (a) terrain which is essentially level, (b) 12-ft traffic lanes, (c) 5 percent dual-tired vehicles with a passenger car equivalent of 2, and (d) a 30th highest hourly volume during the year of 12 percent of the average daily traffic. They were prepared for the Tennessee programing study from the information contained in Table 4, which was prepared for the 1953-54 West Virginia needs study. Table 4, in turn, was prepared

17
TABLE 4 AVERAGE DAILY CAPACITIES OF 2-LANE HIGHWAYS
(Level terrain, 5 percent dual-tired vehicles, truck factor 2.0^ 30th highest hour factor of 12 percent ADT)
Operating Speed,
mph
Percentage of Highway with Passing Sight
Distance of
Average Daily Traffic at Average Highway Speed of
Operating Speed,
mph
Percentage of Highway with Passing Sight
Distance of 70 mph 60 mph 55 mph 50 mph 45 mph 40 mph
Operating Speed,
mph 1,500 ft 800 to
1,000 ft 70 mph 60 mph 55 mph 50 mph 45 mph 40 mph
50 - 55 100 100 4,850 4,750 4,300 50 - 55 80 92 4,450 4,150 3,750 50 - 55 60 84 3,950 3,450 3,000 50 - 55 40 76 3,350 2,700 2,250 50 - 55 20 68 2,400 1,800 1,350 50 - 55 0 60 1,300 900 550 45 - 50 100 100 7,100 7,100 6,600 5,650 45 - 50 80 90 6,800 6,400 5,750 5,050 45 - 50 60 80 6,400 5,550 4,800 4,000 45 - 50 40 70 5,750 4,600 3,900 2,800 45 - 50 20 60 4,900 3,750 2,800 2,000 45 - 50 0 50 3,800 2,800 2,000 1,250 40 - 45 100 100 8,450 8,450 8,050 7,450 6,550 40 - 45 80 87 8,250 7,700 7,300 6, 700 5,800 40 - 45 60 76 7,900 6,800 6,450 5,700 4,850 40 - 45 40 64 7,350 5,900 5,300 4, 600 3,700 40 - 45 20 52 6,650 4,950 4,100 3,200 2,200 40 - 45 0 40 5,850 3,950 2,700 1,950 1,250 35 - 40 100 100 9,900 9,900 9,900 9, 600 9,100 7,900 35 - 40 80 85 9,750 9,350 9,000 8,750 8,200 7,150 35 - 40 60 72 9,400 8,650 8,100 7,950 7,250 6,000 35 - 40 40 58 8,950 8,000 7,150 6, 950 6,150 4,700 35 - 40 20 44 8,400 7,350 6,300 5,850 4,500 3,100 35 - 40 0 30 7, 650 6,600 5,350 3,850 2,450 1,500
For West Virginia; normally 2.5.
from the results of extensive highway capacity studies conducted by the Bureau of Public Roads in cooperation with the various state highway departments and include the results reported in the "Highway Capacity Manual," supplemented by more recent investigations.
Figures 1 and 2 contain curves representing roadways with sight distances that are continuously in excess of 1,500 ft to those that have no 1,500-ft sight distances. The relation between operating speed and traffic volume as shown by the curves is applicable, however, only when the percentage of the highway not having a 1,500-ft sight distance is fairly evenly distributed between the limits of 1,500 ft and the stopping sight distance for the design speed. This is the more usual condition.
It must be pointed out that most of the data on which Figures 1 and 2 are based were obtained by studies conducted during traffic volumes within the lower three-quarters of the range (below 12,000 ADT). Studies conducted on 2-lane highways during capacity volumes represent principally level tangent sections well removed from sharp horizontal or vertical curves. For this reason, all curves except the ones for 100 percent of 1,500-ft sight distance are shown as light lines above 11,000 vehicles per day. There is still considerable question as to whether all the curves for the same average highway speed meet at a common point on the right, or whether the possible capacity and the speed at this capacity are slightly lower for the highways with the poorer alignment
18
than for those with a continuous sight distance in excess of 1,500 ft. This, however, is not too important a consideration because the practical capacities of 2-lane highways a| well within the range for which reliable data are available.
The charts may be used either to determine the operating speed for a given traffic volume or the traffic volume which the highway will accommodate at a given operating speed. When it is desired to determine the capacity at a given (derating speed for lan< widths other than 12 ft, for 30th highest hourly factors other than 12 percent, for truci percentages other than 5 percent, or for truck equivalents other than 2, the following factors must be applied to adjust the capacity volumes to the prevailing or estimated future conditions:
1. For 11 -ft lanes multiply the volumes by 0.86; for 10-ft lanes, by 0.77. 2. When the 30th highest hour factor is other than 12 percent, multiply the volumes
12 by actual percentage
I S
3. When there is other than 5 percent trucks during the peak hour or the truck equr alent is greater than 2, as it will be on grades and in rolling or mountainous terrain,
105 multiply the volumes by IOQ - p + pT ' '"̂ '̂ '̂̂ ^ P is the percentage of trucks and T the truck equivalent in terms of passenger cars.
The operating speed for a given traffic volume when conditions other than those usee for these charts are applicable may be determined by employing the reciprocal of these correction factors to the given traffic volume before entering the chart.
The Appendix contains eight tables for the conditions most prevalent on 2-lane roads in West Virginia. The number of charts or tables that can be prepared for other combi nations of the many variable conditions is almost unlimited. A similar set of tables m; be prepared for the conditions prevailing within any state or area.
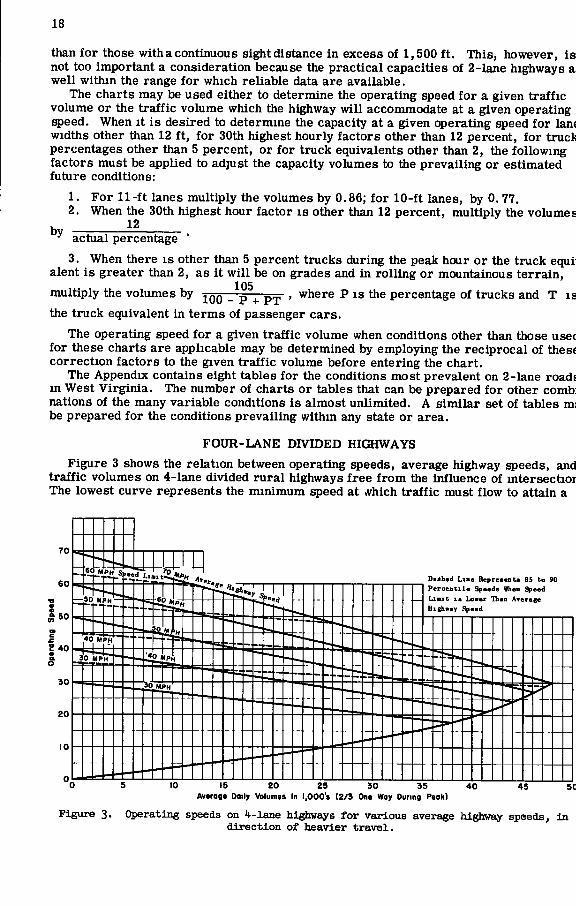
FOUR-LANE DIVIDED HIGHWAYS Figure 3 shows the relation between operating speeds, average highway speeds, and
traffic volumes on 4-lane divided rural highways free from the influence of intersectior The lowest curve represents the minimum speed at >vhich traffic must flow to attain a
Dashed L i n e RepreasntB 85 to 90 P e r c e n t i l e Speeds Vhen Speed
]—I LiHt l a Lower Ulan Ayerage Highway Speed
15 20 25 30 35 Avaraga Ooily Vblumes In 1,000's (2/3 On* Way During Peok)
Figure 3. Operating speeds on it-lane highways for various average highway speeds, in direction of heavier travel.

19
Dashed L i n e Represents Average Speeds When Speed L i m i t i s Lower Than Average Highway Speed
12M P H
3 0 M P H
8 12 16 ZO 24 28 32 36 40 44 48 52 Total Hourly Volume Both Diractions (Hundreds at Passenger C o r s - 2 / 3 One Way)
Figure k. Average speed on U-lane highways for various average highws^ speeds, in direction of heavier travel.
given traffic volume. For example, traffic must be traveling at least 10 mph for a 4-lane highway to accommodate the 30th highest hourly volume when the average daily traffic is 25,000 vehicles.
The Other solid lines of Figure 3 represent the normal operating speeds during various traffic volumes for different average highway speeds. Any point representing the speed-volume relationship must faU between the lower curve and the line representing the average highway speed.
The dashed lines show the effect of an enforced speed limit on the speed-volume relationship. A speed limit has an effect on the operating speed only when it is lower than the highway speed. Also, it has an effect only when the traffic volume is below that at which the dashed speed limit line intersects the solid line corresponding to the highway speed. At higher volumes, the solid lines show the normal speed-volume relationship, because at these volumes the speeds are governed by the traffic density rather than by the speed limits.
Figure 4 is similar to Figure 3 except that the average speed, rather than the operating speed, is related to the traffic volume. Figure 3 also shows the daily volumes based on a 30th highest hour factor of 12 percent and includes 5 percent trucks with a passenger car equivalent of two, whereas Figure 4 shows hourly volumes and includes no trucks.
These charts represent average conditions found on modem highways throughoutthe United States. In some areas, such as the central states where the terrain is level and speeds are higher than for the country as a whole, the speeds as shown by these charts will be somewhat low, especially for the low traffic volumes. For certain other areas they may be high, but in general any difference will not be great and the relative speeds for the different conditions will be accurate.
The traffic volumes or capacities at a given operating ^eed or at a given average speed are shown in terms of passenger cars in two 12-ft lanes for the one direction of travel. Daily and hourly volumes, or capacities for various percentages of trucks and a range of truck factors, may be determined by standard procedures.
The results for multilane highways, as shown by Figures 3 and 4, explain to a large extent the many variations in the speed volume relationship found by other investigators. Sometimes they have found that an increase in the traffic volume or density results in only a very slight or no drop in speeds. This would be the case, as shown by the dashed lines of Figures 3 and 4, when a speed limit or factors other than the traffic density are exerting a controlling influence on vehicle speeds.
20
The results of still other Investigators show a curvilinear relationship, with the speeds dropping at an increasing rate as the traffic density increases. This would occur as the traffic volumes exceeded the range within which the speed limits were effective and especially when the volumes approached possible capacities. At volumes approaching possible capacities on multilane facilities (above 1,500 vehicles per lane), the safety factor for capacity, as indicated by the distance between the upper and lower curves of Figures 3 and 4, decreases rapidly, with the result that a slow driver or some other minor condition interrupting the normal flow of traffic can cause a sudden slowdown of all vehicles, with speeds decreasing from a point on one of the higher curves of Figures 3 and 4 to a point on the bottom curve, or to any intermediate point. The closer the possible capacity is approached, the greater is the possibility of such an occurrence.
The most baffling results obtained from speed-volume investigations are those which show an increase in speed with an increase in volume. Generally this occurs when a study is started during off-peak hours with light traffic and is continued through the peak or msh-hour volumes in the afternoon. As the traffic volume increases, the percentage of repeat drivers in a hurry to get home increases, with the result that speeds show little or no decline and oftentimes increase temporarily with the traffic volume. When capacity volumes are reached or closely approached, there is an abnormal decrease in speeds, producing the curvilmear relation between speed and traffic volume. Studies of this type do not show the true effect of increased volume or speeds, because there is a marked change in the character of traffic from off-peak to peak periods. The true effect of volume on speeds, as shown by Figures 3 and 4, can be obtained by simultaneous studies at different points where the geometric features of the highway are identical but the traffic volumes are different.
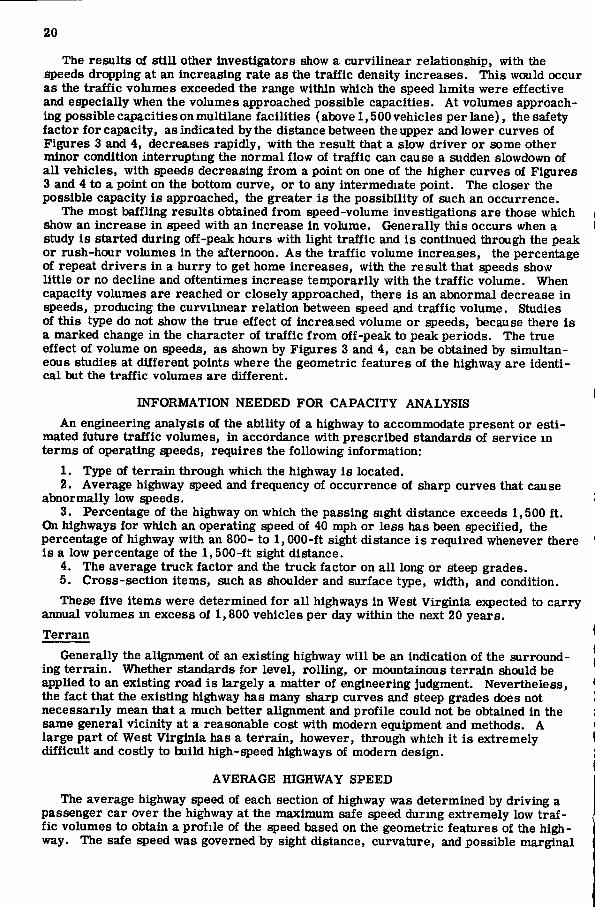
INFORMATION NEEDED FOR CAPACITY ANALYSIS An engineering analysis of the ability of a highway to accommodate present or esti
mated future traffic volumes, in accordance with prescribed standards of service in terms of operating speeds, requires the following information:
1. Type of terrain through which the highway is located. 2. Average highway speed and frequency of occurrence of sharp curves that cause
abnormally low speeds. 3. Percentage of the highway on which the passing sight distance exceeds 1,500 ft.
On highways for which an operating speed of 40 mph or less has been specified, the percentage of highway with an 800- to 1,000-ft sight distance is required whenever there is a low percentage ot the 1,500-ft sight distance.
4. The average truck factor and the truck factor on all long or steep grades. 5. Cross-section items, such as shoulder and surface type, width, and condition. These five items were determined for all highways in West Virginia e:!q)ected to carry
annual volumes m excess of 1,800 vehicles per day within the next 20 years. Terrain
Generally the alignment of an existing highway will be an indication of the surrounding terrain. Whether standards for level, rolling, or mountainous terrain should be applied to an existing road is largely a matter of engineering judgment. Nevertheless, the fact that the existing highway has many sharp curves and steep grades does not necessarily mean that a much better alignment and profile could not be obtained in the same general vicinity at a reasonable cost with modern equipment and methods. A large part of West Virginia has a terrain, however, through which it is extremely difficult and costly to build high-speed highways of modern design.
AVERAGE HIGHWAY SPEED The average highway speed of each section of highway was determined by driving a
passenger car over the highway at the maximum safe speed during extremely low traffic volumes to obtain a profile of the speed based on the geometric features of the highway. The safe speed was governed by sight distance, curvature, and possible marginal

21
interferences. All speed zones and speed limits were observed. Long tangent sections of highway were recorded as having a 60-mph highway speed, even though the test car was not necessarily operated at this speed. Such sections are, however, comparatively rare in West Virginia.
This method of determining the average highway speed and of obtaining a log of the sharp curves and other speed restrictions was employed because sufficiently detailed information was not available from any other source. Furtherjnore, this method as it was employed was sufficiently accurate and probably resulted in a more realistic appraisal than could have been obtained from detailed plans had they been available.
PASSING SIGHT DISTANCE A second car with an accurate odometer was driven over each highway at a slow
speed (about 30 mph) to determine the length and location of all sections with sight
I 7 0
i / * 5
0 AV : R A G E SI > E E D
z u O 10
3 0 3 5 4 0 4 5 S P C C O - M I L C S P E R H O U R
S O 5 5 6 0 6 5 7 0 7 5
Figure 5. Distribution of normal passenger car speeds used for truck factors.
distances in excess of 1,000 ft and 1,500 ft, in lieu of more accurate and detailed sight distance information. The driver informed the passenger, who acted as the recorder, each time that there was a change in the sight distance from some value below 1,000 ft or 1,500 ft to a value above 1,000 or 1,500 ft. He also informed the recorder each time that the sight distance again became less than either of these values.
The recorder noted the odometer readings at these locations and at control points, such as crossroads, city limits, and major structures. It was possible to check the accuracy of the driver's estimate by this procedure as each reading was recorded, so that a sufficiently accurate estimate was obtained of the percentage of the highway with a sight distance in excess of 1,000 ft and the percentage in excess of 1,500 ft.
AVERAGE TRUCK FACTOR Commercial vehicles with dual tires reduce the capacity of a hi^way in terms of
vehicles per hour. In level terrain where commercial vehicles can maintain speeds that equal or approach the speeds of passenger cars, it has been found that the average

22
TABLE 5 TRUCK FACTOR FOR VARIOUS TRUCK SPEEDS AS RELATED TO
NORMAL PASSENGER CAR SPEEDS Truck Factor, pass, car equiv.
For Average For Average Adopted for Truck Passenger Car Speed Passenger Car i^eed Use in
Speed, mph of 47.5 mpha of 42.5 mph» West Virginia Study
40 1.8 1.5 2 35 3.0 2.7 3 30 5.0 4.9 5 25 8.6 7.6 8 20 13.9 11.7 13 15 22.9 18.7 20 10 40.5 32.5 35
5 94.5 75.0 80
^Distribution as shown by curve A of Figure 3. ^Distribution as shown by curve B of Figure 3.
dual-tired vehicle is equivalent, in a capacity sense, to 2 passenger cars on multilane highways and to 2.5 passenger cars on 2-lane highways. The number of passenger cars that each dual-tired vehicle represents is termed the "truck equivalent" or the "truck factor."
The results of highway capacity studies have shown that the truck equivalent on long or steep grades increases with an increase in the difference between the normal speeds of passenger cars and the speeds of trucks. They have also shown that the truck equivalent changes very little, if at all, with a change in the percentage of trucks in the total traffic stream. (Studies have not been conducted at locations with more than 20 percent dual-tired trucks and have been confined principally to locations with less than 10 percent of these vehicles during the periods of peak flow. Further studies may indicate that for certain conditions the truck factor does change with a change in the percentage of trucks, but as yet there is no evidence to indicate whether it increases or decreases with an increase in the number or percentage of trucks.)
Tjruck equivalents are normally determined by obtainii^ detailed information on the speeds and headways of vehicles during various traffic volumes on highways with different alignments and profiles. An average truck factor is obtained for the dual-tired vehicles under each condition. If the study is of sufficient magnitude, it is possible to obtain a truck factor for each type of dual-tired vehicle, classified by speed groups.
The results of these studies have shown that the truck factors can also be calculated with a high degree of accuracy from the separate speed distributions of passenger cars and trucks recorded during light volumes when vehicles can travel at their normal speeds. The criterion used is the relative number of passings that would be performed per mile of highway if each vehicle continued at its normal speed for the conditions under consideration. That the results from such an analysis agree with those obtained by the more painstaking methods is not surprising. It is the difference between truck speeds and passenger car speeds on grades that causes trucks to reduce the capacity of a highway. The greater the speed difference, the greater is the reduction in capacity with a corresponding increase in the truck factor.
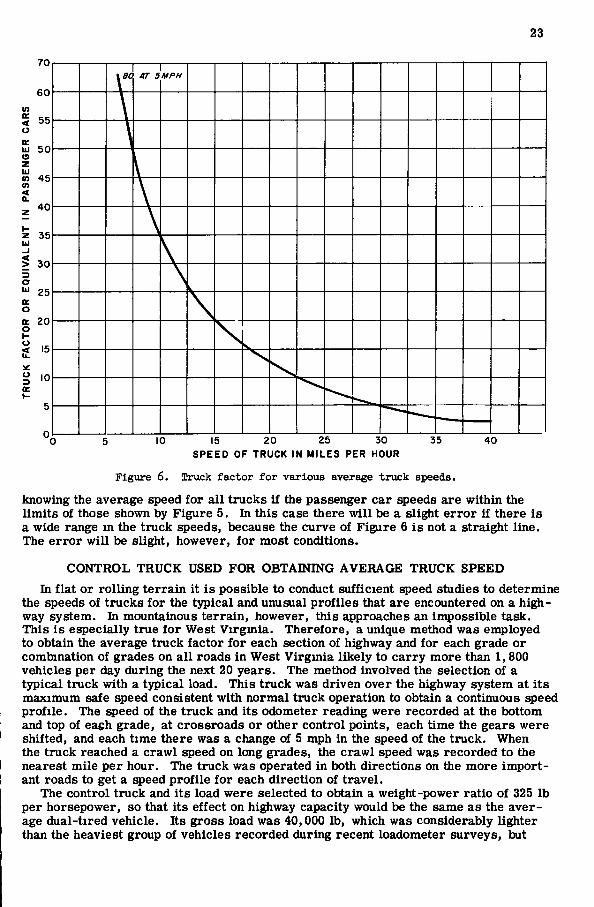
Table 5 shows how the truck factor varies with the truck speed for two different passenger car speed distributions, as shown by Figure 5. The higher the passenger car speeds, the higher are the truck equivalents. The factors in the right-hand column are the rounded values used for the West Virginia study and from which Figure 6 was plotted. The truck equivalent can be determined for any dual-tired vehicle by knowing its average speed under any highway condition such as a steep or long grade. The average truck factor can also be determined for any location or section of highway by
23
70
6 0
55
111 50
in ce. < o tc 111 e z ill CO 45 CO
2 , 4 0
35
o Ul
o K O H O
£
30
25
20
15
10
AT 5 MPH
10 15 20 25 30 S P E E D OF TRUCK IN MILES PER HOUR
35 40
Figure 6. Truck factor for various average truck speeds.
knowing the average speed for all trucks if the passenger car speeds are within the limits of those shown by Figure 5. In this case there will be a slight error if there is a wide range in the truck speeds, because the curve of Figure 6 is not a straight line. The error will be slight, however, for most conditions.
CONTROL TRUCK USED FOR OBTAINING AVERAGE TRUCK SPEED In flat or rolling terrain it is possible to conduct sufficient speed studies to determine
the speeds of trucks for the typical and unusual profiles that are encountered on a highway system. In mountainous terrain, however, this approaches an impossible task. This is especially true for West Virgmia. Therefore, a unique method was employed to obtain the average truck factor for each section of highway and for each grade or combination of grades on all roads in West Virginia likely to carry more than 1,800 vehicles per day during the next 20 years. The method involved the selection of a typical truck with a typical load. This truck was driven over the highway system at its maximum safe speed consistent with normal truck operation to obtain a continuous speed profile. The speed of the truck and its odometer reading were recorded at the bottom and top of each grade, at crossroads or other control points, each time the gears were shifted, and each time there was a change of 5 mph in the speed of the truck. When the truck reached a crawl speed on long grades, the crawl speed was recorded to the nearest mile per hour. The truck was operated in both directions on the more important roads to get a speed profile for each direction of travel.
The control truck and its load were selected to obtain a weight-power ratio of 325 lb per horsepower, so that its effect on highway capacity would be the same as the average dual-tired vehicle. Its gross load was 40,000 lb, which was considerably lighter than the heaviest group of vehicles recorded during recent loadometer surveys, but

24
also heavier than the average dual-tired vehicle, includii^ those with and without pay-loads. Because Figure 6 is not a straight line, the possible speed of the control truck on an upgrade was purposely somewhat lower than the average for all dual-tired trucks on the same grade. This was necessary so that the truck factor obtained for the speed of the control truck from Figure 6 would equal the average factor for all trucks.
As an example, the average truck factor for speeds of 35 and 15 mph is 11.5, or (̂ 2 • ^ truck factor of 11.5 is represented by a speed of 21 mph rather than 25 mph (the average of 35 and 15).
Soon after placing the control truck in operation, its speeds on hills with known gradients were checked with the performance curves for vehicles under controlled test conditions and found to be in agreement. Trial runs on the same grade were also remarkably consistent.
Speed studies of trucks on grades obtained at spot locations and also over the entire length of long grades by stopwatch studies showed that the average truck factor obtained by this procedure was somewhat lower than the truck factor obtained by usii^ the speed of the control truck. The difference varied from 10 to 20 percent. Inasmuch as this was on the conservative side and would make a difference of less than 5 percent when used for estimating the capacities of existing roads, no adjustment or correction was made. Had it been desired to more accurately duplicate the average performance of presentday commercial vehicles as found in West Virginia, the load on the control truck should have been reduced about 5,000 lb.
The average speeds of the control truck on 3 to 7 percent uniform grades up to 6 miles long are shown by Figure 7 and Table 6. Figure 8 shows the speed of the truck at any point on these grades. The speeds as shown by the solid lines are based on the assumption that the truck enters the grade at 41 mph.
4 0
3 5
O X K 111 a. (O
u
3 0
2 5
lij a i 2 0
o 111 iij a. in
IS
< bJ
I 5
I 0
i \ \ * \ V ^ \ V-V
St
ai 02 0 4 0 6 0 8 1.0 15 2 0 3 0 4 0 5 0 6 0 LENGTH OF GRADE-MILES
Figure 7- Average speed of control truck on grades.

25
These curves may also be used to determine the speed reduction due to any length and steepness of grade for other approach speeds. For example, if the approach is 40 mph (initial distance 85), the ^eed at the top of a 4 percent grade 1,000 ft long will be 26 mph (final distance 1,085). Similarly, if this same grade is approached at a speed of 30 mph, the speed at the top will be 17 mph.
The dashed curves emanating from 9 mph show the maximum performance of vehicles when the approach speed is so low that the vehicle must accelerate to eventually
4 5
40
K 35 Ul
(0 30 Ul - I i 25
I
Ul Q 20 < e O IS
a 10 UJ Ul 0- 5 v>
r
« ^
^ »
V
4 «
r r
1 1 1 1 1 1 1 1 1 1 1 1 6R
1 1 1 1 3SS
1 1 1 1
WEK , . . ,
iHT , r . ,
40,0 1 1 1 1
30 F 1 1 1 1
>OUN 1 1 1 1
OS 1 1 1 1 1 1 1 1 1 1 1 1 1 1 i 1,
500 3000 3500 1000 1500 2000 2500
DISTANCE U P G R A D E - F E E T
Figure 8. Effect of length of grade on the speed of medium motor vehicles. TABLE 6
AVERAGE SPEED OF TYPICAL TRUCK ON GRADES, ENTERING SPEED 40 MPH
Length of Grade,
mi
Average Speed, mph Length of Grade,
mi Z% Grade 4? Grade 5? Grade %% Grade 1% Grade
0.1 37.3 36.1 35. 2 34.0 32.6 0.2 34.6 31.7 29. 3 25.8 21.4 0.4 28.4 23.4 18. 2 14.5 11.8 0.6 24.6 18.5 14. 9 12.4 10.2 0.8 21.9 16.6 13. 7 11.5 9.5 1.0 20.4 15.7 13. 1 11.0 9.2 1.5 18.7 14.6 12. 3 10.5 8.8 2.0 17.9 14.1 11. 9 10.2 8.5 3.0 17.3 13.6 11. 6 10.0 8.4 4.0 16.9 13.4 11. 5 9.8 8.3 5.0 16.7 13.3 11. 4 9.8 8.2 6.0 16.6 13.2 11. 3 9.7 8.2
Sustained Speed 16.0 12.8 11. 0 9.5 8.0 Distance to reach sustainec speed, mi
0.78 0.60 0. 37 0.28 0.24

26
reach the sustained speed. These curves show that it takes exceedingly long distances to accelerate on grades when the approach speed is below that of the sustained speed. To change the speed on a 2 percent grade from 20 mph to the sustained speed of 21.5 mph, an increase of only 1.5 mph, the vehicle would have to travel 1,050 ft.
If needed, similar curves can be prepared for trucks with other weight-power ratios, or for other entering speeds, from the results of motor vehicle performance studies conducted by the Bureau of Public Roads and others (1̂ , 2, 3, 4, 5, 6). This was not necessary for the West Virginia needs study because the truck was operated over all routes under consideration.
K the grades had been uniform and their lengths and gradients known, it would have been possible to determine the average truck factor by applying the data from Figure 7 to Figure 6. Driving the truck over the routes would have been unnecessary. This
l.= \ 4 2 8 4 ' PLAN
0--'*°-°° L = 8 9 6 0 4 5 E - - 0 . 0 8
1000
O 20 8 0 0 -
SPEED PROFILE OF CONTROL TRUCK
T O O
0.6 0 .8 1.0
DISTANCE IN MILES Figure 9. Speed profile of control truck.
method was employed in Kentucky and Tennessee. In West Virginia, however, the needed information for the grades was not available. Furthermore, in this state there are few uniform grades. Practically all have multiple gradients, for which it is possible but rather difficult and time-consuming to calculate truck speeds accurately. One such example is shown by Figure 9, which also gives the speed profile recorded for the control truck.
TRUCK CUMBING LANES Truck climbing lanes on the uphill side of long steep grades provide a means for
improving the capacity of 2-lane roads through rough or mountainous terrain. It is on a long steep grade that the greatest difference occurs between the normal speed of passenger cars and the normal speed of trucks. The need for adequate passing opportunities is therefore greatest on the long steep grades, whereas the passing opportunities are generally less than on the level sections of a 2-lane hi^way. This results in higher truck factors and lower capacities for uphill sections of a 2-lane highway than

27
TABLE 7 SPEED CHARACTERISTICS OF CONTROL TRUCK ON UPGRADES^
Gradient, Percent
Crawl Speedb Distance Upgrade, ft Gradient, Percent Velocity,
mph Distance Upgrade,
ft
34 mph (T.F.=3.0)
27 mph (T.F.=6.5)
19 mph (T.F.=13.8)
3 4 5 6 7
16.0 12.8 11.0 9.5 8.0
4,000 2,600 1,800 1,500 1,300
1,100 800 600 500 400
2,000 1,500 1,200 1,000
800
6,600 3,000 2,000 1,500 1,200
^hen entering grade from level section at 40 mph. ^Speed which truck can maintain indefinitely.
for the level sections. Where truck climbing lanes are provided, the truck factor becomes zero and the
capacity of the normal section of the 2-lane highway is the same as though there were no trucks. Under certain conditions, therefore, truck climbing lanes will increase the practical capacity of an entire 2-lane highway to a value higher than that for the same alignment with no grades. This is because the provision of a climbii^ lane reduces the average truck factor and increases the percentage of the highway on which passing maneuvers may be performed.
Climbing lanes will also increase the capacity of multilane highways. In fact, an added lane for each direction of travel over the entire length of a multilane highway may often be avoided by providing an added lane on the uphill side of the long or steep grades. The quantitative effect that trucks have on the capacity of multilane highways with long steep grades is not as well known, however, as for 2-laiie highways. For example, it is entirely possible that a few heavy trucks on a long steep grade of a multilane highway might have nearly as great an effect as a much larger number. The factors used at present are average values determined for less than 20 percent dual-tired vehicles (usually 5 to 10 percent).
APPLICATION OF UPHILL TRUCK LANES The benefit to traffic by providing an uphill truck lane at a specific location depends
on the following factors: 1. Traffic volume. 2. Percentage of trucks. 3. Length and steepness of grade. 4. Availability of passing sight distance. Table 7 offers some guidance for the application of climbing lanes. Column 4, for
example, shows the lengths of grade for an average truck speed of 34 mph or a truck factor of 3.0. At this average speed, even thou^ about one-half of the trucks will be traveling at somewhat lower speeds, the speeds of passenger cars will not be affected sufficiently to greatly inconvenience the drivers. At traffic volumes approaching practical capacities for level sections of 2-lane highway, few passenger cars will overtake a truck on grades that are shorter than those shown in Colunm 4. For those that do, the necessary reduction in speed and the lost time in reaching the top of the grade when the passing sight distance is restricted, will not be appreciably greater than commonly necessary due to oncoming traffic on straight level sections. Truck climbing lanes cannot be justified, therefore, on grades shorter than those shown in Column 4, Table 7.
Columns 5 and 6, Table 7, show lengths of grade on which there is the same relative
T A B L E 8
C A P A C I T I E S O F 2 - L A N E HIGHWAYS ON G R A D E S
(Based on a 30th highest hour of 12 percent of the average annual volume) 5 Percent T r u c k s
IS3 00
Average Annual T r a f f i c Volume, vehic les per da^ f Avg. Hwy. Speed 70 Avg . Hwy. Speed 60-70 Avg, Hwy. Speed 60-70 ^ Avg . Hwy. Speed 50-70 Oper. Speed 50-55 Oper. Speed 50 Oper. Speed 45-50 Oper. Speed 40-45
Length of Without With Without With Without With Without With Grade, Grade , T r u c k T r u c k T r u c k T r u c k T r u c k T r u c k T r u c k T r u c k Percent ft Lane Lane l a n e Lane Lane Lane Lane Lane
3 1,100-2,000 4,300 4,700 4,850 5,500 5,150 6,000 6,500 7,000 2 ,000-4,000 3,850 4,700 4,300 5,500 4,550 6,000 6,250 7,000 Over 4,000 3,500 4,700 3,800 5,500 4,050 6,000 5,550 7,000
4 800-1,500 4,300 4,700 4,850 5,500 5,150 6,000 6,500 7,000 1,500-3,000 3,850 4,700 4,200 5,500 4,400 6,000 5,800 7,000 3 ,000-4 ,000 3,400 4,700 3,750 5,500 4,000 6,000 5,450 7, 000 Over 4,000 3,200 4,700 3,400 5,500 3,800 6,000 5,100 7,000
5 600-1,200 4,300 4,700 4,850 5,500 5,150 6,000 6,500 7,000 1,200-2,000 3,500 4,700 3,800 5,500 4,050 6,000 6,150 7, 000 2 ,000-4 ,000 3,200 4,700 3,700 5,500 3,950 6,000 5,700 7,000 Over 4,000 2,800 4,700 3,250 5,500 3,500 6,000 4,800 7,000
6 500-1,000 4,300 4,700 4,850 5,500 5,150 6,000 6,500 7,000 1,000-1,500 3,500 4,700 3,800 5,500 4,050 6,000 6,150 7,000 1,500-4,000 3,050 4,200 3,550 5,200 3,800 6,000 5,350 7,000 Over 4,000 2,550 3,600 2,950 4,000 3,200 4,200 4,500 5,800
7 400-800 4,300 4,700 4,850 5,500 5,150 6,000 6,500 7,000 800-1,200 3,500 4,700 3,800 5,500 4,050 6,000 5,550 7,000
1,200-2,500 2,900 4,200 3,400 5,000 3,650 6,000 5,100 7,000 2 ,500-4 ,000 2,600 3,600 3,000 4,000 3,300 4,200 4,600 5,800 Over 4,000 2,000 3,000 2,400 3,400 2,650 3,600 3,700 4,600
29
need for a truck climbing lane. With a given traff ic volume, for example, there i s the same need for a cl imbing lane on a 3 percent grade 2,000 ft long a s on a 7 percent grade 800 ft long.
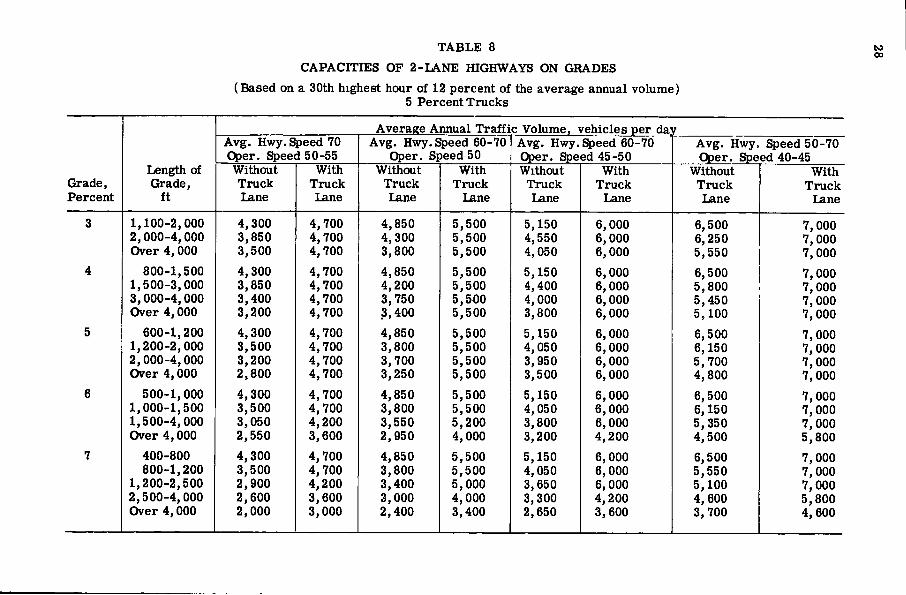
The capacit ies of 2-lane highways on grades with and without truck climbing lanes a r e shown by Table 8 for the conditions £q?plicable to West V i r g i n i a . The var ious groups shown for the length of grade ( C o l . 2) a r e purely arbi tary , with the exception of the shortest length shown for each gradient. The grades could have been divided into a larger or smal l er number of length groups with corresponding changes in the a v erage annual traf f ic volumes. The number of groups used i s believed to be consistent with the accuracy justif ied by the analyzed data.
Table 8 i s based on the assumption that each climbing lane wi l l be continuous f rom a point near the bottom of the grade to a point beyond the top of the grade where the sight distance becomes unrestr icted and truck speeds again approach those of passenger c a r s . A l l steep grades of equal gradient longer than 4,000 ft have the same c a paci t ies . P r i o r to traveling 4,000 ft upgrade, most trucks wi l l have reached their c r a w l speeds (Table 7 ) .
F o r certain traff ic and t erra in conditions on exceedingly long grades, the use of pass ing bays may be an adequate and a more feasible solution than a continuous c l i m b ing lane (3 , 4 ) . With pass ing bays the capacity of a 2-lane road would be greater than without the pass ing bays and for certain conditions might equal the capacit ies shown in Table 8 for the 2-lane roads with a truck lane. The maximum capacit ies with continuous truck lanes a r e actually higher than most of the values in Table 8. F o r Table 8 it was assumed that the capacity on a grade with a truck lane could not exceed the capacity of a 2-lane level section. The capacity with a truck lane fa l l s below the c a pacity of a level section only on the long grades greater than 5 percent where downhill speeds of t r u c k s travel ing in the lower gears affect capacit ies .
A P P L I C A T I O N T O C A P A C I T Y D E T E R M I N A T I O N S
The tables and charts presented are the basic information needed for capacity determinations in connection with the West Virg in ia needs studies. F r o m this in formation an almost unlimited number of specia l tables and charts can be prepared for spec i f i c conditions in either West V irg in ia or other states. The data can also be applied in many different ways, as w i l l be explained by the applications made for the West V irg in ia , Kentucky, and Tennessee studies.
To determine the highway needs in West Virg in ia , it was necessary to have a vast amount of information concerning the roads and the traff ic using them. F o r the capacity determination with which this report i s concerned, only the factors that have been p r e viously discussed were needed. T h e i r effect on the capacit ies of 2-lane roads can be determined from Tables 1, 4, and 8, and Figure 6. F igure 7 was also needed for the Kentucky and Tennessee studies, because a control truck was not used to determine the truck fac tors in these states.
It i s important that the conditions be s i m i l a r over a length of highway for which a capacity determination i s made. Section l imits , for this reason, were usually defined by urban l imits; or by a change in the traf f ic volume, surface width, average highway speed, or type oi t erra in; or by a marked change in the percentage of highway with a 1,500-ft passing sight distance. In addition, a county line was the end of one section and the beginning of another.
E X A M P L E S O F A P P L I C A T I O N T p W E S T V I R G I N I A HIGHWAYS
F i v e typical sections analyzed during the West V irg in ia studies wi l l i l lustrate the procedures used to apply the capacity information. T h e bas ic information and the r e sulting calculations for each of these sections a r e given in Table 9.
Section 1 i s located on U . S. 60 about 20 m i west of Charleston in Putnam County. It i s 6.4 mi long with a 26-ft pavement in rol l ing t e r r a i n . It has an excellent pass ing distance a s compared with most West V i r g i n i a roads, 59 percent of i ts length having a sight distance in excess of 1,500 f t . The average h i ^ w a y ^ e e d i s 65 mph and the generally f lat profi le resu l t s in a truck equivalent of only 2. The average daily traff ic

30
volume was 5,500 in 1955 with a design hour of 15 percent of the A D T having 7 percent t r u c k s .
The capacity of this section i s 5,800 vehic les dally at an operating speed of 45 to 50 mph, or i s 7,150 vehic les daily at a tolerable operating speed of 40 to 45 mph. Because U . S. 60 i s one of the most important highways m the state, i t i s desirable to provide conditions conducive to a high operating speed.
F o r an operating speed of 45 to 50 mph the existing traff ic volume i s pract ica l ly equal to the capacity of the section. A s it would be impract ica l to attempt to increase the c a pacity of the existing road by improving passing sight distances, the only recourse to accommodate expected future traf f ic volumes i s to add additional lanes by constructing another one-way roadway and using the existing lanes for the other direction of t rave l .
Section 2, on U . S. 21 in Jackson County, i s also on one of the more important roads in the state although the traff ic volume i s not high. The 6 . 2 - m i section i s located in rol l ing t e r r a i n about 20 m i north of Charles ton. Both the alignment and profi le are poor, result ing in a low design sfpeed and almost no places frhere the sight distance i s adequate
T A B L E 9
C A P A C I T Y A N A L Y S I S O F T Y P I C A L S E C T I O N S IN W E S T V I R G I N I A
Item Sect.
1 Sect.
2 Sect.
3 Sect. 4
Sect. 5
(a ) Known Conditions
Location U . S . 60 U . S . 21 U . S . 60 U . S . 50 U . S . 50 Length, mi 6.37 6.21 7.00 4.13 11.46 T e r r a i n Roll ing Roll ing Roll ing Roll ing Roll ing Avg . highway speed, mph 65 40 53 57 53 1 . 5 0 0 - f t S . D . , ^ 59 2 10 9 15 Surface width, ft 26 18 22 22 20 30th-hr factor, % 12 12 12 13 14 T r u c k speed, mph 40 32 29 25 24 C o m m e r c i a l veh, % 7 5 5 5 5 1955 A D T 5,500 2,300 2,400 2,400 2,600 Long grades None None 0.40 m i , 8^ 0.50 mi , 7 .5^ 0.5 mi , 6 . 5 ^ Long grades
0.35 m i . i% 1.2 mi,5.0% 0.60 m i , 2.5% 2.5 m i , 2 . 5 ^
Sharp curves 1 at 30 mph None 1 at 40 mph Sharp curves 1 at 35 mph 1 at 45 mph 1 at 45 mph 3 at 50 mph 2 at 5(5 moh
3 at 50 mph
(b) Determined Values
Tolerable operating 40-45 40-45 40-45 40-45 40-45 speed, Table 1, mph
Tolerable design speed. 50 50 50 50 50 Table 1, mph
Tolerable capacity, 7, 300 None 3,070 3,800 3,405 Table 4, A D T
Width factor 1.00 0.70 0.86 0.86 0.77 30th-hr factor 1.00 1.00 1.00 0.92 0.86 T r u c k equivalent T r u c k factor*
2 .0 4.0 5 .0 8 .0 9.0 T r u c k equivalent T r u c k factor* 0.98 0.91 0.88 0.78 0.75 Correc ted tolerable 7,150 None 2,300 2,350 1,700
capacity, A D T
* 105 (100-% t r ) + {% trx t r equiv)
31
for pass ing. Pavement width i s 18 ft and the truck equivalent i s 4. The traf f ic volume during 1955 was 2,300 vehic les per day with the design hour bemg 12 percent of the A D T with 5 percent t r u c k s .
The road as i t exists today does not meet the tolerable standards for this c l a s s of highway. Inasmuch as i t s average highway speed i s only 40 mph, it cannot c a r r y t r a f f i c at the tolerable speed of 50 mph during low volumes nor at 40 to 45 mph during the 30th highest hourly volume of the year . It therefore has no capacity for these speeds.
Some improvement in alignment could be made to increase the average highway speed and the amount of passing sight distance. By providing a 1,500-ft sight distance over 10 percent of the length and ra is ing the average highway speed to 45 mph, the capacity would be increased to 2,200 vehicles per day at an operating speed of 35 to 40 mph, or to 1,050 vehicles per day at 40 to 45 mph.
Widening the entire section to 24 ft would mcrease the capacities at the 35 to 40 and 40 to 45 mph operating speeds to 3,100 and 1,600 vehicles per day, respect ively.
The tolerable operating speed for this highway i s 40 to 45 mph, therefore the 35-to 40-mph operating speed would be inadequate and undesirable. The capacity at a minimum desirable operating speed with the alignment and sight distances improved to the extent possible on the existing location i s s t i l l considerably l e s s than the existing traff ic volume. The conclusion i s , therefore, that the only lasting solution i s a complete redesign of the highway.
Section 3 i s located on U . S. 60 in Greenbrier County about 100 mi east of Charles ton. The t erra in i s rol l ing over this 7 . 0 - m i section, the average highway speed i s 53 mph, about 10 percent of the highway has a 1,500-ft sight distance, and the truck equivalent i s 5.
Tolerable operating speed for this highway i s 40 to 45 mph. At this speed the c a pacity of the section i s 2,300 vehic les per day.
Several poss ibi l i t ies are available for increasing the capacity of the section, inc luding removal of some or a l l of the f ive substandard curves , the addition of truck lanes on grades, and minor improvements in the sight distance by removal of t rees , day-lighting curves , etc.
Reducing curvatures would increase the average highway speed to about 55 mph, r e -s u l t i i ^ in a tolerable capacity of about 2,600 vehicles per day.
Pass ing sight distance might be increased an additional 5 percent by miscel laneous measures , such a s brush removal , curve dayUghting, etc. T h i s would further increase capacity to about 2,800 vehic les per day.
The next alternative i s the provision of truck lanes . The existing grades would r e quire about 1 m i of truck lanes to be added, resulting in a decrease in the o v e r - a l l truck equivalent f rom 5 to 3. Minor improvement in the alignment would also provide additional passing sight distance so that a 1,500-ft sight distance would be available over approximately 20 percent of the highway. A l l these improvements would increase the capacity of the highway to about 3,380 vehicles per day at an operating speed of 40 to 45 mph. At the normal rate of traff ic growth this volume would not be exceeded for a period of 6 to 7 y e a r s . Thereafter it would be neces sary to undertake major changes in the alignment or to provide a 4-lane highway in order to maintain the des ired operating speed.
Section 4 has 11-ft traff ic lanes and i s located on U . S . 50 in Wood County. It i s 4.1 mi long through roll ing t e r r a i n . The alignment i s f a i r ly good, as the average highway speed i s 57 mph and 9 percent of the highway has a 1,500-ft sight distance. The traf f ic volume in 1955 was 2,400 vehicles per day with a design-hour factor of 13 percent of the A D T including 5 percent t rucks .
F o r the tolerable speed of 40 to 45 mph, the capacity i s 2,350 vehicles per day. T h i s i s slightly lower than the present volume.
Building a truck lane 1 m i long on a c r i t i c a l grade would reduce the truck equivalent to 3 and would increase the 1,500-ft passing sight distance f r o m 9 percent to about 18 percent of the length. A s a resul t the capacity would be increased to 3,250 vehic les per day at an operating speed of 40 to 45 mph.
Some additional 1,500-ft sight distance could be obtained by increasing the sight on the inside of severa l curves by simply removing such obstructions a s brush and low

32
banks on the right-of-way. When the obstruction i s off the right-of-way, additional right-of-way must be purchased or an agreement reached with the property owner to keep it c l eared . An additional 5 percent of 1,500-ft sight distance can be obtained in tfa^ manner. T h i s would increase the capacity at the des ired operating speed to 3,450 vehic les per day, which represents an increase of nearly 60 percent over the present traf •] f ic volume, or to approximately the volume expected in 1970.
Section 5 i s located on U . S . 50 in Hampshire County in the northeastern part of the state. The section i s 11.5 m i long with uniform design character i s t i c s in the rol l ing t e r r a i n . The average highway speed i s 53 mph, the surface width i s 20 ft , and 15 p e r cent of the highway has a 1,500-ft sight distance. The truck equivalent i s 9. The prese A D T i s 2,600 per day with a design factor of 14 percent including 5 percent t rucks . Under these conditions, the capacity at an operating speed of 40 to 45 mph i s 1,700 v e hic les per day.
Several possibi l i t ies exist for improving the capacity. These mclude reducing the sharpness of f ive substandard curves , widening the surface , the addition of truck lanes on grades, and minor improvement m the sight distance.
Widening f rom 20 ft to 24 ft would increase the capacity to 2,200 vehicles per day. Removal of the substandard curves wi l l increase the average highway speed to about 55 mph and would increase the passing sight distance 1 to 2 percent . These improvements] including the widening, would resul t in increas ing the capacity to 2,550 vehicles per day.
The addition of 2 .5 m i of truck lanes would increase the sections on which passings could be performed to about 25 percent of the highway and reduce the truck equivalent to 3. The total result ing capacity would be 3,600 vehicles per day, or 38 percent above th( present volume.
These f ive examples a r e rather typical of the way the capacity information was applied in West Virg in ia to determine highway sufficiency. Its use was found especial ly helpful in pointing out the changes that could be made to improve capacity. Alter ing some highway features wi l l have little effect on the capacity at a des ired operating speed others, such as the provision of truck lanes and substantially improving the pass ing sight distances, w i l l have a major effect.
A P P L I C A T I O N S T O CONDITIONS IN K E N T U C K Y AND T E N N E S S E E
The principles employed for capacity determmations in West Virg in ia have general ^ p l i c a t i o n wherever curvatures and grades create spec ia l highway capacity problems. T h i s was the case throughout most of Kentucky and Tennessee , where highway needs studies were started during the period that the West V irg in ia study was being completed.
The two special features needed in the refinement of the capacity analys i s , which were the average highway speed and the truck equivalent, could have been obtained in the same manner a s described for West V i r g i n i a . Uti l iz ing the esqperience gained in the West V irg in ia study, however, i t was found desirable and more feasible to derive these data f r o m existing records , rather than f r o m test vehicle operation.
Kentucky and Tennessee lacked data on actual truck operations which would be consistent with probable future conditions. Following many y e a r s of severe res tr ic t ions on truck s ize and weight, Tennessee had just rev i sed i ts law so as to be in substantial agreement with AASHO recommendations. T r u c k operations, however, had not a s yet changed to conform with the higher l imi t s . Kentucky s t i l l retained its low l imi t s , but i t was anticipated that a more rea l i s t i c position would be adopted, as it was in 1956, bringing that state in l ine with Tennessee and the other states. Without actual data on vehicle weights for the revised weight l imi t s , it was assumed that future conditions in Kentucky and Tennessee would be s i m i l a r to those on which the West V irg in ia study was based.
Tn both Kentucky and Tennessee , geometric design data were available, mile by mi le , in the Highway Planning Divis ion records , or were easi ly obtainable f rom plans . Thus , actual curvature was known, and curve lengths could be obtained or sampled f r o m the plans . In both states, the gradient and the length of the grades on each section of highway were available f rom the p lans . T h i s was not the case for most roads in West Virgin

33
Determining Average Highway Speed
Operation of a test c a r , as in West V i r g m i a , accounted for severa l factors that would affect the average highway speed, but horizontal curvature was by far the most s ignif i cant. F r o m available data, therefore, it was possible to approximate the average highway speed of control sections in the other states by concentrating the analys i s on the combined effect of horizontal curves and tangents.
Vehicle speeds are affected ahead and beyond a curve for a distance which v a r i e s with the degree of curvature . That i s , a vehicle on a tangent approaching a sharp curve must begin to slow down before r e a c h i i ^ the curve in order to reduce i ts speed to the allowable speed on the curve . After traveling around the curve , an additional time and distance i s required to accelerate back to the normal tangent speed. It was necessary , therefore, to determine the following information for each section of highway requiring a separate capacity analys is :
1. The possible safe speed, or design speed, of each curve . 2 . The length of each curve . 3. The distance before and after each curve that the speed was affected, together
.with the average speed while decelerating and accelerat ing. 4. The average speed weighted by the length of the tangents, the curves , and by the de
celeration and acceleration distances. T h i s speed was usedas the average highway speed.
The safe speeds for curves of various degrees (or radi i ) were determined from the tables in the AASHO policy on "Geometric Design of R u r a l Highways." The length of each curve was obtained f r o m the highway plans o r f r o m planning survey information. Comfortable rates of acceleration and deceleration as shown in the AASHO pol ic ies were used to determine the length of speed transitions between the curves and tangents.
A spec ia l study conducted by sampling the curves on level sections f rom Kentucky highway plans showed that, regardless of curvature, the average total effect of a curve on the speed of a vehicle was equivalent to a trave l distance of about 800 ft at the safe speed for the curve . F o r example, the 9-deg curves good for a design speed of 45 mph had an average length of 667 ft . Decelerating and accelerating f r o m the 65-mph tangent speed required a total of 485 ft . On an average, a vehicle would be affected for a total distance of 1,152 ft , but the time lost was the same as if the speed was 45 mph for 915 ft and the tangent speed of 65 mph on the r e s t of the section. L ikewise , for the 40-deg curves the equivalent distance at 20 mph was 691 ft . The equivalent distances var ied from curve to curve , but the average was 780 ft with values much greater or l e s s than the average being comparatively r a r e . An equivalent length of 800 ft, or 0.15 m i , for a l l curves was therefore used to determine the average highway speeds for the highway sections in Kentucky and Tennessee .
Tangent sections and curves as sharp as 3 deg were assumed to have a highway speed of 70 mph if there were no curves as sharp as 4 deg on the h i ^ w a y . If any curves on the highway were a s sharp as 4 deg, the tangent sections and the curves of 4 deg or f latter were assumed to have a highway speed of 65 mph. These assumptions a r e in accordance with the AASHO definition of design speed as related to the t rave l speeds found on main r u r a l highways during low traff ic densit ies .
The following example i l lustrates the method used in estimating the aver j^e highway speed of a 2-lane section of highway 10 m i long:
Curvature, deg Safe Speed, mph Number of C u r v e s Total Length, m i C o l . 2 X C o l . 4
6 55 1 0.15 8.25 10 43 2 0.30 12.90 12 40 8 1.20 48.00 20 35 4 0.60 21.00 30 25 1 0.15 3.75
0 65 - 7.60 494.00 Total 16 10.00 587.90
10
34
If weighted by t rave l t ime, the average highway speed would be 56 mph. Within the l imits of reasonable accuracy , however, either method should be satisfactory. F o r the] needs studies conducted in Ontario, Canada, weighting to obtain the average highway speed was done on the bas i s of time involved rather than length.
D E T E R M I N I N G T R U C K E Q U I V A L E N T
Attention was cal led ear l i e r to the fact that driving a test truck to establish a speed profi le would be unnecessary if gradient and length were known, because available test data are adequate to establish truck speeds on known grades ( F i g . 8 ) .
With grade data available in Kentucky and Tennessee , determining the truck equivalent in t erms of passenger c a r s , for capacity computations, made use of F igures 7 and 6, in that order .
It was f i r s t assumed that the entering speed of trucks approaching a grade was 40 mph. It i s recognized that momentum from downgrades, and actual level speeds, may frequently be greater, but in the mountainous t erra in where this analys is was especial ly pertinent, horizontal curvature i s such that higher speeds are seldom encountered. F o r example, the speed profi le of the test truck on U . S . 50 in West Virg in ia shows a m a x i mum of only 45 mph for short distances at only three locations in a 50-mi section.
It was also assumed for the purposes of this study, that average truck speed was 40 mph on level t erra in , on a l l grades of l e s s than 3 percent, and on grades of 3 percent l e s s than 500 ft long.
F o r a l l other grades, the average truck speed was determined from Figure 7 for each grade or average compound grade, in one direction only.
F o r the control section, or a long subsection, the average truck speed was determine by weighting by distance the speeds on level t erra in and the s e v e r a l grades.
F ina l l y , the weighted average truck speed was entered on Figure 6 to determme from the curve the truck equivalent in t e r m s of passenger c a r s . Capacity analys i s then was completed as previously described.
Descriptions of ivorking procedures and the application of these data in estimatmg the requirements for truck lanes or other design modifications are discussed also in the "Manual of Engineering Procedure for Determining Needs of the R u r a l State Highway System, " published by the state highway departments of Kentucky and Tennessee in 1954
R E F E R E N C E S
1. Saal , C . C . , "Hi l l -Cl imbing Ability of Motor T r u c k s , " Public Roads, 23: No. 3 (May 1942) ,
2. Tarag in , A . , "Effect of Length of Grade on Speed of Motor Vehic le s , " H R B P r o c , 25: 342 (1945) .
3. WiUey , W . E . , "Survey of Uphi l l Speeds of T r u c k s on Mountain G r a d e s , " H R B P r o c , 29: 304 (1950) .
4. Wi l ley , W . E . , "Truck Congestion on Uphill Grades , " H R B B u l l . 104, p . 21 (195E 5. Huff, T . S . , a n d S c r i v n e r , F . H . , "Simplified C l i m b i n g — L a n e Design Theory and
R o a d - T e s t Resul ts , " H R B B u l l . 104, p . l (1955) . 6. WiUey, W. E . , "Survey of Downhill Speeds of T r u c k s on Mountain G r a d e s , " H R B
P r o c , 30:322 (1950) .

35
Appendix TABLE A
TOLERABLE CAPACITIES OF EXISTING TWO-IANE ROADS, FIAT TERRAIN, OPERATING SPEED 45 TO 50 MPH, 5 PERCENT TRUCKS
Percent of |ilighway with Passing Sight
12-ft Lanes Average Annual Volume, Vehicles per Day
II 10-ft Lanes 9-ft lanes passenger car speed (average highway speed) at low volume
of 70 mph
60 mph
55 mph
50 mph
70 mph
60 mph
55 mph
50 mph
70 mph
60 mph
55 mph
50 mph
70 mph
60 mph
55 mph
50 mph 1,500
ft 1,000
ft
70 mph
60 mph
55 mph
50 mph
70 mph
60 mph
55 mph
50 mph
70 mph
60 mph
55 mph
50 mph
70 mph
60 mph
55 mph
50 mph
100 100 7,100 7,100 6,600 5,650 6,100 6,100 5,700 4,850 5,450 5,450 5,100 4,350 4,950 4,950 4,600 3,950 80 90 6,800 6,400 5,750 5,050 5,850 5,500 4,950 4,350 5,250 4,950 4,450 3,900 4,750 4,500 4,000 3,550 60 80 6,400 5,550 4,800 4,000 5,500 4,750 4,1^0 3,450 4,950 4,250 3,700 3,100 4,500 3,900 3,350 2,800 40 70 5,750 4,600 3,900 2,800 4,950 3,950 3,350 2,400 4,450 3,550 3,000 2,150 4,000 3,200 2,750 1,950 20 60 4,900 3,750 2,800 2,000 4,200 3,200 2,400 1,700 3,750 2,900 2,150 1,550 3,450 2,600 1,950 1,400 0 50 3,800 2,800 2,000 1,250 3,250 2,400 1,750 1,050 2,900 2,150 1,550 950 2,650 1,950 1,400 850
TABLE B TOLERABLE CAPACITIES OF EXISTING TWO-LANE ROADS, FLAT TERRAIN
OPERATING SPEED 40 TO 45 MPH, 5 PERCENT TRUCKS
Percent of Highway with 12-ft lanes
Average Annual Volume, Vehicles per Day 11-ft lanes jj 10-ft lines [T 9-ft lanes
passenger car speed (average highway speed) at low volume of 60
mph 55 mph
50 mph
45 mph
60 mph
55 mph
50 mph
45 mph Is
55 mph
50 mph
45 mph
60 mph
55 mph
50 mph
45 mph 1,500
ft 1,000
ft
60 mph
55 mph
50 mph
45 mph
60 mph
55 mph
50 mph
45 mph Is
55 mph
50 mph
45 mph
60 mph
55 mph
50 mph
45 mph
100 100 8,450 8,050 7,450 6,550 7,250 6,900 6,400 5,650 6,500 6,200 5,750 5,050 5,900 5,650 5,200 4,600 80 87 7,700 7,300 6,700 5,800 6,600 6,300 5,750 5,000 5,950 5,600 5,150 4,450 5,400 5,100 4,700 4,050 60 76 6,800 6,450 5,700 4,850 5,850 5,550 4,900 4,150 5,250 4,950 4,400 3,750 4,750 4,500 4,000 3,400 40 64 5,900 5,300 4,600 3,700 5,050 4,550 3,950 3,200 |4,550 4,100 3,550 2,850 4,150 3,700 3,200 2,600 20 52 4,950 4,100 3,200 2,200 4,250 3,550 2,750 1,900 3,800 3,150 2,450 1,700 3,450 2,850 2,250 1,550 0 40 3,950 2,700 1,950 1,250 3,400 2,300 1,700 1,100
13,050 2,100 1,500 950 2,750 1,900 1,350 900
TABLE C TOLERABLE CAPACITIES OF EXISTING TWO-LANE ROADS, ROLLING TERRAIN
OPERATING SPEED 45 TO 50 MPH, 5 PERCENT TRUCKS
Percent of Average Annual Volume, Vehicles per Day Highway with 12-ft lanes 11-ft lanes 10-ft Lanes 9-ft lanes Passing Sight passenger car speed (average highway Bpe ed) at low volume of 70 60 55 50 70 60 55 50 70 60 55 SO 70 60 55 50 1,500
ft 1,000 ft
mph mph mph mph mph n^h mph mph mph mph mph mph mph mph mph mph
100 100 6,500 6,500 6,050 5,150 5,600 5,600 5,200 4,450 5,000 5,000 4,650 3,950 4,550 4,550 4,250 3,600 80 87 6,200 5,850 5,250 4,600 5,350 5,050 4,500 3,950 4,750 4,500 4,050 3,550 4,350 4,100 3,700 3,200 60 76 5,850 5,050 4,400 3,650 5,050 4,350 3,800 3,150 4,500 3,900 3,400 2,800 4,100 3,550 3,100 2,550 40 64 5,250 4,200 3,550 2,550 4,500 3,600 3,050 2,200 4,050 3,250 2,750 1,950 3,700 2,950 2,500 1,800 20 52 4,500 3,400 2,550 1,800 3,850 2,950 2,200 1,550 3,450 2,600 1,950 1,400 3,150 2,400 1,800 1,250 0 40 3,450 2,550 1,850 1,150 3,000 2,200 1,600 1,000 2,650 1,950 1,400 900 2,400 1,800 1,300 800

36
TABLE D TOLERABLE CAPACITIES OF EXISTING TWO-LANE ROADS, BOLUNG TERRAIN
OPERATING SPEED 40 TO 45 MPH, 5 PERCENT TRUCKS Percent of Highway with 12-ft Lanes
Average Annual Vohime. Vehicles per Day 11-ft Lanes I 10-ft Lanes
passenger car speed (average highway epeed) at low volumes 9-tt Lane
of 60 mph
55 mph
50 mph
45 mph
60 mph
55 mph
50 mph
45 mph
60 mph
55 mph
50 mph
45 nQ)h
60 mph
55 mph
50 mph
45 mph 1,500
ft 1,000
ft
60 mph
55 mph
50 mph
45 mph
60 mph
55 mph
50 mph
45 mph
60 mph
55 mph
50 mph
45 nQ)h
60 mph
55 mph
50 mph
45 mph
100 100 7,700 7,350 6,800 6,000 6,600 6,300 5,850 5,150 5,950 5,650 5,250 4,600 5,400 5,150 4,750 4,200 80 85 7,050 6,650 6,100 5,300 6,050 5,700 5,250 4,550 5,450 5,100 4,700 4,100 4,950 4,650 4,250 3,700 60 72 6,200 5,900 5,200 4,400 5,350 5,050 4,450 3,800 4,750 4,550 4,000 3,400 4,350 4,150 3,650 3,100 40 58 5,400 4,850 4,200 3,400 4,650 4,150 3,600 2,900 4,150 3,750 3,250 2,600 3,800 3,400 2,950 2,400 20 44 4,500 3,750 2,900 2,000 3,850 3,200 2,500 1,700 3,450 2,900 2,250 1,550 3,150 2,600 2,050 1,400 0 30 3,600 2,450 1,800 1,150 3,100 2,100 1,550 1,000 2,750 1,900 1,400 900 2,500 1,700 1,250 800
TABLE E TOLERABLE CAPACITIES OF EXISTING TWO-LANE ROADS, ROLLING TERRAIN
OPERATING SPEED 35 TO 40 MPH, 5 PERCENT TRUCKS
Percent of Highway with 12-ft lAnes
Average Annual Volume. Vehicles per Day 11-ft lanes 10-ft I^es 9-ft lanes
Passing Sight of
passenger car speed (average highway so eed) at low volumes Passing Sight of 55
mph 50
mph 45
mph 40
mph 55
mph 50 mph
45 mph
40 mph
55 mph
50 mph
45 mph
40 mph
55 mph
50 mph
45 mph
40 mph 1,500
ft 1,000
ft
55 mph
50 mph
45 mph
40 mph
55 mph
50 mph
45 mph
40 mph
55 mph
50 mph
45 mph
40 mph
55 mph
50 mph
45 mph
40 mph
100 100 9,050 8,750 8,300 7,200 7,800 7,500 7,150 6,200 7,000 6,750 6,400 5,550 6,350 6,100 5,800 S,050 80 83 8,200 8,000 7,500 6,500 7,050 6,900 6,450 5,600 6,300 6,150 5,800 5,000 5,750 5,600 5,250 4,550 60 67 7,400 7,250 6,600 5,500 6,350 6,250 5,700 4,750 5,700 5,600 5,100 4,250 5,200 5,100 4,620 3,850 40 51 6,500 6,350 5,600 4,300 5,600 5,450 4,800 3,700 5,000 4,900 4,300 3,300 4,550 4,450 3,920 3,000 20 36 5,750 5,350 4,100 2,850 4,950 4,600 3,500 2,450 4,400 4,100 3,150 2,200 4,000 3,750 2,900 2,000 0 20 4,900 3,500 2,250 1,400 4,200 3,000 1,950 1,200 3,800 2,700 1,750 1,100 3,450 2,450 1,600 1,000
TABLE F TOLERABLE CAPACITIES OF EXISTING TWO-LANE ROADS, MOUNTAINOUS TERRAIN
OPERATING SPEED 45 TO 50 MPH, 5 PERCENT TRUCKS
Percent of Average Annual Volume. Vehicles per Day Highway with 12-ft lanes 11-ft lanes II 10-ft lanes 9-ft lanes Passing Sight oasKcniFer r.a r sDeed (aver afe higl] wav sDf ied) at Low volumps oi 70 60 55 50
mph 70
mph 60 55
mph 50 mph
70 mph
60 mph
55 mph
50 mph
70 mph
60 55 mph
50 mph 1,500
ft 1,000
ft mph mph mph
50 mph
70 mph mph
55 mph
50 mph
70 mph
60 mph
55 mph
50 mph
70 mph mph
55 mph
50 mph
100 100 5,500 5,500 5,150 4,400 4,750 4,750 4,450 3,800 4,250 4,250 3,950 3,400 3,850 3,850 3,600 3,100 80 87 5,300 5,000 4,450 3,900 4,550 4,300 3,850 3,350 4,100 3,850 3,450 3,000 3,700 3,500 3,100 2,750 60 76 5,000 4,300 3,750 3,100 4,300 3,700 3,200 2,650 3,850 3,300 2,900 2,400 3,500 3,000 2,600 2,150 40 64 4,450 3,550 3,050 2,200 3,850 3,050 2,600 1,900 3,450 2,750 2,350 1,700 3,100 2,500 2,150 1,550 20 52 3,800 2,900 2,200 1,550 3,250 2,500 1,900 1,350 2,950 2,250 1,700 1,200 2,650 2,050 1,550 1,100 0 40 2,950 2,200 1,550 950 2,550 1,900 1,350 800 2,250 1,700 1,200 750 2,050 1,550 1,100 650

37
TABLE G TOLERABLE CAPACITIES OF EXISTING TWO-LANE ROADS, MOUNTAINOUS TERRAIN
OPERATING SPEED 40 TO 45 MPH, 5 PERCENT TRUCKS
Average Annual Volume, Vehicles per Day 12-ft Lanes 11-ft lanes 10-ft Lanes 9-ft Lanes
Passing Sight of
passenger car speed (average highway speed) at low volumes Passing Sight of 60
mph 55 mph
50 mph
45 mph
60 mph
55 mph
50 mph
45 mph
60 mph
55 mph
50 mph
45 mph
60 mph
55 mph
50 mph
45 mph 1,500
ft 1,000 ft
60 mph
55 mph
50 mph
45 mph
60 mph
55 mph
50 mph
45 mph
60 mph
55 mph
50 mph
45 mph
60 mph
55 mph
50 mph
45 mph
100 100 6,550 6,250 5,800 5,100 5,350 5,000 4,400 5,050 4,800 4,450 3,950 4,600 4,350 4,050 3,550 80 85 6,000 5,700 5,200 4,500 5,150 4,900 4,450 3,850 4,600 4,400 4,000 3,450 4,200 4,000 3,650 3,150
60 72 5,300 5,000 4,450 3, WO 4,550 4,300 3,850 3,200 4,100 3,850 3,450 2,900 3,700 3,500 3,100 2,600
40 58 4,600 4,100 3,600 2, COO 3,950 3,550 3,100 2,500 3,550 3,150 2,750 2,250 3,200 2.850 2,500 2,050
20 44 3,850 3,200 2,500 1,700 3,300 2,750 2,150 1,450 2,950 2,450 1,900 1,300 2,700 2,250 1.750 1,200
0 30 3,050 2,100 1,500 950 2,600 1,800 1,300 800 2,350 1,600 1,150 750 2,150 1,450 1,050 650
TABLE H TOLERABLE CAPACITIES OF EXISTING TWO-LANE ROADS, MOUNTAINOUS TERRAIN
OPERATING SPEED 35 TO 40 MPH, 5 PERCENT TRUCKS
Percent of Average Annual Volume, Vehicles per Day Highway with 12-ft lanes 1 11-ft lanes 1 10-ft lanes f 9 ft Laiies_ Passing Sight passenger car speed (avera ge highway spe id) at low volumes 01 55 50 45 40 55 50 45 40 55 50 45 40 55 SO "45 40 1,500
ft 1,000 ft
mph mph mph mph mph mph mph mph mph mph mph mph mph mph mph mph
100 100 7,700 7,450 7,050 6,150 6,600 6,400 6,050 5,300 5,950 5,750 5,450 4,750 5,400 5,200 4,950 4,300
80 83 7,000 6,800 6,350 5,550 6,000 5,850 5,450 4,750 5,400 5,250 4,900 4,250 4,900 4,750 4,450 3,900
60 67 6,300 6,200 5,650 4,650 5,400 5,350 4,850 4,000 4,850 4,750 4,350 3,600 4,400 4,350 3,950 3,250
40 51 5,550 5,400 4,800 3,650 4,750 4,650 4,150 3,150 4,250 4,150 3,700 2,800 3,900 3,800 3,350 2,550
20 36 4,900 4,550 3,500 2,400 4,200 3,900 3,000 2,050 3,750 3,500 2,700 1,850 3,450 3,200 2,450 1,700
0 20 4,150 3,000 1,900 1,150 3,550 2,600 1,650 1,000 3,200 2,300 1,450 900 2,900 2,100 1,350 800