New Methods for the Calculation of the Load Capacity of ... · to increase the load capacity of the...
11
Printed with permission of the copyright holder, the American Gear Manufacturers Association, 1001 N. Fairfax Street, Fifth Floor, Alexandria, VA 22314-1587. Statements presented in this paper are those of the author(s) and may not represent the position or opinion of the American Gear Manufacturers Association. New Methods for the Calculation of the Load Capacity of Bevel and Hypoid Gears Christian Wirth, Bernd-Robert Höhn and Christo Braykoff Flank breakage is common in a number of cylindrical and bevel gear applications. This paper introduces a relevant, physically based calculation method to evaluate flank breakage risk vs. pitting risk. Verification of this new method through testing is demonstrably shown. Introduction Flank breakage in cylindrical and bevel gear applications typi- cally initiates in the active flank, approximately in the middle of the active tooth height, and subsequently propagating to the tooth root of the unloaded flank side. Crack initiation can be localized below the surface in the region between the case and core of surface-hardened gears. This failure mode cannot be explained by known causes such as tooth root breakage or pitting. Even bevel gears in truck and bus applications are at risk of damage from sub-surface fatigue if an optimum utilization of material is not achieved. In such cases a balance between the flank breakage and pitting risk must be struck. This paper describes a new “material-physical- based calculation” method to evaluate risk of flank breakage vs. pitting damage. This method was used to improve the design of a gear set that failed in several cases due to flank break- age on the wheel in test vehicles of MAN Truck & Bus (MTB). Figure 1 shows a typically damaged tooth on the wheel. In some cases pitting occurred on the coast flanks of the wheel (Fig. 1 — right). The following demonstrates how it is possible to increase the load capacity of the wheel regarding pitting and flank breakage by means of this new method, as proven in successful test runs. Flank Breakage in Bevel Gears Flank breakage often appears without any of the other commonly seen surface fail- ures such as scuffing, pitting or micro- pitting. In some cases only one tooth is affected, but usually more than one tooth fails (Fig. 2). Inadequate material prop- erties and heat treatment are expected to increase the risk of flank breakage, especially insufficient core strength and toughness, or insufficient—or too high— case depths (Refs. 4–5). In many U.S. pub- lications flank breakage is also called “sub- surface fatigue” or “sub-case fatigue.” In these papers the flank pressure is also regarded as the decisive parameter (Refs. 2, 6, 13, 15, 16). By virtue of systematic tests, Annast (Ref. 1) investigated the influence parameters of flank breakage in bevel gears. He iden- tifies — beyond the known influence of load conditions — case depth and core hardness as important parameters. Analysis of damage patterns of test and practical gears showed that the ini- tiating crack always started below the surface; i.e., in the region of the transition from case to core. For unidirectional load- ing, the crack propagates to the active flank on one side and to the tooth root on the other. Annast analyzed the subsurface stresses with ROSLCOR (Rolling and SLinding Contact accord- ing to OsteR) (Refs. 9 and 17) by using the shear stress intensity hypothesis according to Tobie (Ref. 18). Oster (Ref. 17) defined, on the basis of (Ref. 21), the potential for considering compres- sive stresses in the case for the evaluation of the material expo- Figure 1 Flank breakage and pitting on wheel. Figure 2 Flank breakage — two different wheels. 44 GEAR TECHNOLOGY | June/July 2013 [www.geartechnology.com] technical
Transcript of New Methods for the Calculation of the Load Capacity of ... · to increase the load capacity of the...

Printed with permission of the copyright holder, the American Gear Manufacturers Association, 1001 N. Fairfax Street, Fifth Floor, Alexandria, VA 22314-1587. Statements presented in this paper are those of the author(s) and may not represent the position or opinion of the American Gear Manufacturers Association.
New Methods for the Calculation of the Load Capacity of Bevel and Hypoid GearsChristian Wirth, Bernd-Robert Höhn and Christo BraykoffFlank breakage is common in a number of cylindrical and bevel gear applications. This paper introduces a relevant, physically based calculation method to evaluate flank breakage risk vs. pitting risk. Verification of this new method through testing is demonstrably shown.
IntroductionFlank breakage in cylindrical and bevel gear applications typi-cally initiates in the active flank, approximately in the middle of the active tooth height, and subsequently propagating to the tooth root of the unloaded flank side.
Crack initiation can be localized below the surface in the region between the case and core of surface-hardened gears. This failure mode cannot be explained by known causes such as tooth root breakage or pitting. Even bevel gears in truck and bus applications are at risk of damage from sub-surface fatigue if an optimum utilization of material is not achieved. In such cases a balance between the flank breakage and pitting risk must be struck. This paper describes a new “material-physical-based calculation” method to evaluate risk of flank breakage vs. pitting damage. This method was used to improve the design of a gear set that failed in several cases due to flank break-age on the wheel in test vehicles of MAN Truck & Bus (MTB). Figure 1 shows a typically damaged tooth on the wheel. In some cases pitting occurred on the coast flanks of the wheel (Fig. 1 — right). The following demonstrates how it is possible to increase the load capacity of the wheel regarding pitting and flank breakage by means of this new method, as proven in successful test runs.
Flank Breakage in Bevel GearsFlank breakage often appears without any of the other commonly seen surface fail-ures such as scuffing, pitting or micro-pitting. In some cases only one tooth is affected, but usually more than one tooth fails (Fig. 2). Inadequate material prop-erties and heat treatment are expected to increase the risk of flank breakage, especially insufficient core strength and toughness, or insufficient—or too high—case depths (Refs. 4–5). In many U.S. pub-lications flank breakage is also called “sub-surface fatigue” or “sub-case fatigue.” In
these papers the flank pressure is also regarded as the decisive parameter (Refs. 2, 6, 13, 15, 16).
By virtue of systematic tests, Annast (Ref. 1) investigated the influence parameters of flank breakage in bevel gears. He iden-tifies — beyond the known influence of load conditions — case depth and core hardness as important parameters. Analysis of damage patterns of test and practical gears showed that the ini-tiating crack always started below the surface; i.e., in the region of the transition from case to core. For unidirectional load-ing, the crack propagates to the active flank on one side and to the tooth root on the other. Annast analyzed the subsurface stresses with ROSLCOR (Rolling and SLinding Contact accord-ing to OsteR) (Refs. 9 and 17) by using the shear stress intensity hypothesis according to Tobie (Ref. 18). Oster (Ref. 17) defined, on the basis of (Ref. 21), the potential for considering compres-sive stresses in the case for the evaluation of the material expo-
Figure 1 Flank breakage and pitting on wheel.
Figure 2 Flank breakage — two different wheels.
44 GEAR TECHNOLOGY | June/July 2013[www.geartechnology.com]
technical

sure. Tobie expanded this method with the possibility of including tensile, resid-ual stresses (in the core) as well. However, the overriding influence of tensile-resid-ual stresses simulated by the Tobie model could not be validated in any other inves-tigation (e.g., ANSI/AGMA 2003–B97). Annast argued that it is sufficient to ana-lyze only the section between the flank surface and the transient region of case and core. Indeed, tensile residual stresses were therefore not examined by Annast. In his proposed standard-capable method, only the region-of-transition is regarded. A critical ratio between the acting maxi-mum shear stress and the core hardness was derived from the test gears and prac-tical applications; if the ratio exceeds the limit, the risk of flank breakage is consid-ered high.
Because of the uncertainties in the meth-ods described above, a new calculation method was proposed by Wirth (Ref. 20) for the rating of bevel and hypoid gears. The method is based on Oster’s and Hertter’s work (Ref. 8). Hertter proposed for cylindrical gears an enhanced shear stress intensity hypothesis to evaluate the subsurface stresses — even under consideration of compressive and tensile residual stresses; a separate examination of dynamic and static exposure allows for consideration of fatigue failures, as well as failures from yielding. Because the local allowable strength values in the considered material element are derived from the hardness by means of material-physical relations, the new meth-od is termed the “material-physical-based calculation method.” Wirth adapted Hertter’s method to bevel and hypoid gears, con-sidering their specifics as, for example, sliding conditions.
Material-Physically Based Calculation Method for Bevel and Hypoid GearsThe material-physical-based calculation method allows the consideration of complex stress conditions beneath the flank surface that are caused by the load and heat treatment process. The permissible stresses are derived from the hardness values and material-physical parameters. The occurring stresses are compared with the permissible stresses in discrete sections in the material. On the basis of a shear stress intensity hypothesis (SIH), the material exposure is determined.
General stress conditions in the tooth. Inside the tooth, beneath an ideal smooth flank surface, the total stress condi-tions are composed of:• Stresses due to normal contact load (Hertzian theory)• Shear stresses on the surface caused by friction• Thermal stresses caused by the thermal gradient• Stresses caused by bending mechanism• Residual stresses
Figure 3 illustrates the stress components that influence the material exposure in a considered (infinitely small) element.
In Figure 3a the stress components that result from the normal load on the flank are shown; the stresses according to Hertzian theory originate at the normal force. Due to the sliding com-ponents, the friction force that is tangential to the flank sur-face induces shear stresses. Figure 3b demonstrates the effect of bending by a normal force that acts above (in profile direction) the considered element. The components of the normal force cause normal stresses, with an approximately linear distribution over the tooth thickness and shear stresses, and with an approxi-mately parabolic distribution and a maximum (distribution) in the middle of the tooth. Residual stresses result from the hard-ening and finishing process; as an example, Reference 20 shows that compressive stresses are occurring in the case and are bal-anced by tensile stresses in the core. Unlike the stresses in Figure 3a and Figure 3b, the residual stresses in Figure 3c are load-independent.
Oster and Hertter developed the STRORHR program for the calculation of all mentioned stress components on cylindrical gears. With this program it is possible to examine the mate-rial exposure in the sub-surface, below any contact point on the flank surface. Thus the examination direction is perpendicular to the flank surface.
Stress Conditions in the Rolling ContactIn any contact point on the flank, the rolling direction x can also be seen as the time axis. Figure 4 shows in principle the stress components under the surface. All volume elements in the same depth are exposed to equal stresses — but at different times. To evaluate the material exposure in a certain depth beneath the
Figure 3 Stress conditions inside the tooth.
Figure 4 Time–dependent stress components in a rolling contact.
45June/July 2013 | GEAR TECHNOLOGY

flank surface, the corresponding stresses have to be considered over the entire time axis (x axis).
However, in rolling contacts a turning principal coordinate system complicates the evaluation of the material utilization. A possible alternative is analyzing the dynamic stresses in rolling contacts; i.e., the shear stress courses in a sectional plane that are defined on the surface of the base sphere (Fig. 5).
Figure 6 shows for a rolling contact an example of shear stress courses in a certain sectional plane γα and a material depth of y/b0 = 0.3; τγα (ti) is the time-dependent graph for the projection of shear stresses in the directions n2 and n3 (Fig. 5). In Figure 6a no residual stresses are considered; as a consequence the point (0/0) is part of the course. At a certain time ti — when the con-tact is still unloaded (e.g., the contact point of the flank surfaces is still far away from the regarded volume element) — τ2 = τ3 = 0 in the examined sectional plane. During the movement of the contact over the flank surface, the stress components τ2 and τ3 can be marked in the diagram. Of course if the influence of the moving contact point on the stresses at the examined plane is diminishing, the course will again reach point 0/0. As Figure 6a shows, the instantaneous stress vector (τ2/τ3) is completely turn-ing during one load cycle, which means that it acts as an alter-nating load. Its maximum length is defined as the “maximum shear stress” τmax,a. The diameter of the circumscribed circle is Δτmax,a.
Figure 6b shows for the same examined sectional plane an equal load cycle, but in consideration of the residual stresses. Unlike before, the shear stresses τ2 and τ3 have discrete val-
ues — even if the contact is unloaded. However, the course of the pair of values τ2/τ3 is similar, meaning that Δτmax,a = Δτmax,b. An important fact is that the maximum shear stress τmax,b is decreasing under the influence of (compressive) residual stress-es (τmax,b < τmax,a). In other words, the maximum shear stress with high compressive residual stresses is smaller than the maximum shear stress without residual stresses. This is also valid for other sectional planes of the base sphere and corresponds with the accepted fact that compressive residual stresses reduce the maxi-mum material exposure (e.g., Ref. 22).
The aim of a strength hypothesis is the evaluation of stress-es occurring in the examined base sphere (or base element) to determine a number for the material exposure that correlates well with the failure mechanism. Many common criteria are not applicable for alternating stresses, as described before; various important hypotheses are discussed regarding their applicabil-ity for the rating of the material exposure in rolling contact. As a result of the investigation, a modified SIH was established (Ref. 8). This hypothesis can principally be used for:• Rating the maximum exposure of the material (analysis
regarding yielding)• Rating the dynamic exposure of the material (analysis regard-
ing fatigue)
Modified Shear Stress Hypothesis by Hertter (Ref. 8)The bases for calculation of the decisive exposure in the exam-ined base sphere are the stress courses in all of its sectional planes. According to (Ref. 12), in every sectional plane the normal stresses (orthogonal to sectional plane) can be calcu-lated according to Equations 3 and 4. The shear stresses τγαa
and τγαm are defined (Fig. 7) for the considered sectional plane. The radius of the smallest circumcircle of the stress course is the decisive amplitude of the shear stress. (Ed.’s Note: The cir-cumscribed circle—or circumcircle—of a polygon is a circle which passes through all the vertices of the polygon.) The vector of its center point represents the mean shear stress.
Amplitude of shear stress (Fig. 7):(1)
τγαa = τa (γ,α)
Amplitude of shear stress (Fig. 7):(2)
τγαm = τm (γ,α)
Amplitude of normal stress: σγαa = σa (γ,α) (3)
σa (γ,α) = σmax (γ,α) - σmin (γ,α)2
Mean value of normal stress: σγαm
σm (γ,α) (4)
σm (γ,α) = σmax (γ,α) - σmin (γ,α)2
Dynamic exposure in sectional plane: A (γ,α)
(5)
A (γ,α) = µ√α τa
µ (1 + m τmµ) + b σa
µ
σAµ
Total dynamic exposure, Aint a
Figure 5 Base sphere with sectional plane (Ref. 8).
Figure 6 Example of shear stress courses in a sectional plane αγ in the depth y/b0 = 0.3 for rolling conditions (Ref. 8).
46 GEAR TECHNOLOGY | June/July 2013[www.geartechnology.com]
technical

(6)
Aint a = µ 15
π 2π
([A (γ,α)]2 sin α) dαdγ∫ ∫8 πγ = 0 α = 0
Maximum exposure in sectional plane, Amax (γ,α)(7)
Amax (γ,α) = µ√ α τµ
max + b σµmax
Rµp0,2
Total maximum exposure, Aint a (8)
Aint a = µ 15
π 2π
([Amax (γ,α)]2 sin α) dαdγ∫ ∫8 πγ = 0 α = 0
Constant a(9)
a = 1 [3 ( σW )2– 4]5 τW
Constant b(10)
b = 1 [6 – 2 ( σW )2]5 τW
Constant m(11)
m = 1 [σW2 –( σW )2(τSch)2 ]τW 2
α 12 (τSch)4
7 2
where: τa (γ,α) is amplitude of shear stress in sectional plane, N/mm2
γ is angle for sectional plane (Fig. 5), degrees α is angle for sectional plane (Fig. 5), degrees τm (γ,α) is mean value of shear stress in sectional plane, N/
mm2
σa (γ,α) is amplitude of normal stress in sectional plane, N/mm2
σmax (γ,α) is maximum of normal stress in sectional plane, N/mm2
σmin (γ,α) is minimum of normal stress in sectional plane
σm (γ,α) is mean value of normal stress in sectional plane, N/mm2
A (γ,α) is dynamic exposure in sectional plane µ is constant exponent µ = 2 b is constant (material-dependent) σA is material amplitude strength according to normal
stress, N/mm2 (Ref. 8) Aint a is total dynamic exposure of base sphere Amax (γ, α) is maximum exposure in sectional plane Rp0,2 is yield strength, N/mm2
Aint is total maximum exposure of base sphere a is constant (material-dependent) σW is material alternate strength according to normal
stress, N/mm2 (Ref. 8) τW is material alternate strength according to shear stress,
N/mm2 (Ref. 8) m is constant (material-dependent) τSch is material pulsating fatigue strength, N/mm2 (Ref. 8)
With the stress values according to Equations 1–4, the mate-rial exposure A (γ, α) in the considered sectional plane can be calculated (Ref. 8). The local amplitude strength σA is dependent on the mean value of normal stress σm (γ, α). The constants a, b and m are a function of the strength ratio σW/τW and the local torsional pulsating fatigue strength τSch (Ref. 12).
The total dynamic exposure Aint a is defined as the integral value of the exposure values A (γ, α) in all sectional planes and determined by Equation 6. The endurance limit of the con-sidered element regarding fatigue is, per definition, reached when the total dynamic exposure becomes Aint a = 1. Values below stand for infinite life. In an analogous way, the maximum exposure regarding yielding is calculated (Eq. 7). For all sec-tional planes in the base sphere, the total maximum exposure for yielding is considered according to Equation 8. Again, for an infinite life the total maximum exposure has to fall below Aint < 1.
It is remarkable that all local strength values can be deter-mined out of the Vickers hardness values by means of material-physical-based relations (Ref. 8).
Calculation Process for Bevel and Hypoid Gears: OverviewAs described above, Hertter (Ref. 8) developed for cylindrical gears the material-physical-based method to evaluate the mate-rial exposure in the sub-surface of the tooth. The strength val-ues are, accordingly, derived from the Vickers hardness test rela-tive to volume element (base sphere).
The comparison of the local stress values with the local strength values provides a 3-D evaluation of the material expo-sure — not only close to the flank surface but also in an area close to the core. Whereas the allowable stress numbers accord-ing to ISO, DIN or AGMA are only valid for an optimally designed case depth, the material-physical-based method allows investigation of the influence of different hardness profiles on load capacity. Moreover, due to the local consideration of the material exposure, the failure mode becomes apparent.
Hertter expanded the computer program ROSLCOR (Rolling and SLinding Contact according to OsteR (Refs. 9 and 17)) that was developed at the FZG (Gear Research Center of the Technical University of Munich) with his material-physical-
Figure 7 Definition of amplitude and mean value of any shear stress curve plotted over time in a discrete sectional plane (Ref. 8).
47June/July 2013 | GEAR TECHNOLOGY

based method; Wirth (Ref. 20) adapted Hertter’s method to bevel and hypoid gears. Wirth developed the computer tool LokAna (Local Analysis) that handles not only the sub-programs BECAL (Bevel Gear Calculation) (Ref. 10) and ROSLCOR, but also further calculations for bevel gears.
Calculation of Material ExposureThe Hertzian stresses on the flank surface of bevel and hypoid gears are determined with the FVA program BECAL (Bevel Gear Calculation) (Ref. 10). With the machine settings for the gear set, BECAL is able to generate the geometry of flank surface and tooth root. Based on this information a loaded tooth contact analysis (TCA) leads to the tooth root stresses and to the local-occurring Hertzian stresses; deflections of housing, bearings and shafts can be also considered.
For any calculated point on the flank — the partial line of con-tact, its relative curvature, the acting normal force, and Hertzian stress — are determined. For ROSLCOR, the considered contact point can be simplified to a contact of an infinite long cylinder with a half-plane (Fig. 8).
In the stress calculation with ROSLCORHR (Ref. 8) — an enhancement of ROSLCOR — the normal stresses and shear stresses resulting from bending (Fig. 3b) are addressed. The act-ing normal force that moves over the flank surface causes — at any later stage — normal stresses and shear stresses in the con-sidered volume element (base sphere). For the material expo-sure, the maximum values over one load cycle have to be con-sidered.
The stresses caused by the normal load in the sub-surface are calculated with the model shown (Fig. 8 — right). The basis for the stress mechanics is the plain strain state, meaning that deformations are only allowed in a plane vertical to the contact line. ROSLCOR considers the normal pressure on the surface as well as the influence of a loss-of-friction contact. The influences of thermal stresses and shear stresses on the material exposure are also addressed.
The material-physical-based calculation model evaluates for a certain volume element the risk for an initial crack. Whether the crack will result in damage of the flank or not is dependent on its potential for crack growth; especially near the flank surface, this potential is affected by the slip conditions in the contact point. As is known (Refs. 14 and 19), pitting occurs mainly in the flank area with negative slip, which is below the pitch point for pinion and wheel at bevel gears without offset. Deeper below
the flank surface the influence of slip in the contact point seems, as is known thus far, negligible.
Wirth (Ref. 20) introduced a so-called “slip factor” that accounts for the difference in strength between negative and positive slip conditions. The influence of this factor is restrict-ed to the material close to the surface. Because the material strength values are derived from the material hardness, it is allowable to (virtually) increase the hardness values appropri-ately. Consequently, for the same load conditions the mate-rial exposure in flank areas with positive slip is lower than in areas with negative slip. The hardness values are modified by Equations 12–14. Wirth demonstrated that reasonable results are calculated if a/b0 = 0.5 and b/b0 = 1.0 are chosen (b0: half of the Hertzian contact width, Fig. 8).
Depth range 0 < y < a:(12)
HV(y) = HV0(y) ZS1,2
Depth range y > b:(13)
HV(y) = HV0(y)
Depth range a ≤ y ≤ b.(14)
Linear interpolation of ZS
where: y is material depth below the contact point, mm a is certain material depth, mm HV(y) is modified local hardness in consideration of the slip
influence, HV HV0(y) is local hardness, HV b is certain material depth, mm ZS is factor according to (Ref. 20)
Residual stresses in the tooth. Hertter demonstrated that the influence of residual stresses has to be considered in the mate-rial exposure (Fig. 6) for the evaluation of tooth failures. In par-ticular, the maximum material exposure Aint is influenced by the residual stresses. Whereas compressive stresses typically have a positive effect on the material exposure, tensile stresses increase the material stresses (Ref. 8). The total dynamic exposure Aint a is only influenced by means of the mean stress sensitivity. As Hertter proved, the material exposure in the range of the transi-tion zone from case to core accounts for failure modes like flank breakage that are usually characterized by an initial crack in this region.
Wirth (Ref. 20) proposes adoption of the (compressive) resid-ual stresses according to Lang (Ref. 11) for the case. Due to the balance of forces in the core, tensile residual stresses have to exist. For the estimation of the resid-ual stress distribution in the core, Wirth made investigations based upon finite ele-ment (FE) methods. Using a parabola of the fourth degree, the tensile stresses can be closely approximated by the balance of forces. Figure 9 shows qualitatively in a normal section of the tooth the residual stress distribution. It is a sufficient cor-relation that the residual stresses in tooth height direction are equal to the residual
Figure 8 Simplification of complex contact conditions — cylinder model.
48 GEAR TECHNOLOGY | June/July 2013[www.geartechnology.com]
technical

stresses in lengthwise direction. Residual stresses in the orthog-onal direction to the flank surface may be ignored.
Improvement of a Gear Set with Flank BreakageWheel flank breakage. A decisive number of hypoid gear sets used in axle gear drives in test vehicles failed due to flank break-age; only the wheels were affected by this failure mode. Figure 1 (left side) shows a flank breakage on one tooth of a wheel; in Figure 1 (right side) pitting on the coast-side could be detected. Figure 2 shows on another wheel a characteristic flank break-age; as can be seen, the failure plane runs on both flank sides through the active tooth height.
To learn more about the conditions where and when flank breakages occur, a new type of test for the stationary test rig has been developed and comprehensive test runs conducted. The gear sets have been tested for a defined load spectrum where the highest load stage was the torque that has been considered in the following calculations. The gear sets failed—either by pitting or flank breakage. Pitting occurred on the pinion as well as on the wheel; flank breakage was only observed on the wheel.
Figure 10 shows for a damaged wheel the investigation of the fracture surface in the scanning electron micrograph (SEM). In this case a small inclusion was detected from where the crack propagates to the flank surfaces. Inclusions can be regarded as a catalyst for the crack initiation because of the notching effect of different elasticity moduli. Investigations by Annast (Ref. 1) showed that an Al2O3 inclusion causes a stress increase (von Mises criterion) of approximately 30%–40%; the size and the depth beyond the surface have a relatively small influ-ence. Therefore, the lower the material exposure in the core, the smaller the risk of flank breakage with initial cracks in this region will be (Fig. 10).
Design of an improved gear set. The aim of the re-design was to develop a new gear design with a smaller material exposure to avoid flank breakage on one hand and pitting as far as possi-ble on the other. In a first step the old design was analyzed with the newly introduced material-physical calculation method. In the second step a new gear design with same ratio and diam-eters but lower material exposure was searched by an iterative process. Table 1 contains the main geometry data of the old and new gear design.
For the calculation, discrete con-tact points on the flank are chosen for the evaluation. Figure 11 shows that the selected contact points are positioned in a section with consid-erably high load and the suspected crack origin. To evaluate not only the risk of an initial crack at one single point, but also the potential of crack growth, four different posi-tions were examined.
Figure 9 Residual stress distribution in the tooth.
Figure 10 Flank breakage — two different wheels.
Table 1 Geometry of the examined gear sets
Nomenclature Symbol UnitOld design New design
Pinion Wheel Pinion Wheel
Number of teeth z 8 45 8 45
Pinion offset a mm 34 34
Normal module mmn mm 6.134 6.122
Mean pitch diameter dm mm 69.6 331.2 69.9 332.3
Face width b mm 60.7 58.3 62.2 59.0
Spiral angle β ° 45.5 34 45.5 34
Material 25MoCr4E 25MoCr4E
Roughness Rz flank/tooth root Rz mm 3/16 (after run in)
Total overlap ratio (under load) drive/coast 3.0/2.7 2.92/2.7
Lubricant Shell Spirax ASX 75W 90
Temperature of lubricant θ °C 90
NOTE: Because only the wheel was affected by flank breakage, all calculations have been made for the wheel only!
breakage
For Related Articles Search
at www.geartechnology.com
49June/July 2013 | GEAR TECHNOLOGY

Table 2 contains the Hertzian stresses that were determined by means of the loaded tooth contact analysis with BECAL (Ref. 10). Deformation and deflections of housing, shafts and bear-ings have been considered. Under the same load conditions it was possible to reduce the stresses on both flank sides in the critical area of the flank by approximately 15%. This was pos-sible with an optimized crowning (“ease-off ”) in combination with a different gear design (duplex instead of semi-completing) and changed pressure angles.
Of course the reduction of contact stresses leads in most cases to an increase in load capacity — especially when the failure mode pitting is addressed. But in the case of flank breakage the failure mechanism is influenced by not only the contact stresses, but also by the material exposure deep inside the tooth. Because of the requirement to keep the amount of transferred torque
by retaining the gear dimensions (and module), the total flank load cannot be significantly reduced. To avoid flank breakage, the goal must be to reduce material exposure — mainly in the core — where, in this case, the crack initiation could be detected in several cases (Fig. 10).
As mentioned earlier in the evaluation of the material expo-sure in the sub-surface section, especially in the middle of the tooth thickness, the following stress components must not be ignored:• Shear stresses due to shearing forces (flank normal forces)• Tensile residual stresses
The shear stress distribution reaches its maximum in the mid-dle of the tooth thickness (Fig. 3b). Also, the maximum values of the tensile residual stresses are supposed to be in this region. Whereas the determination of the shear stresses is strictly a
mechanical problem, the residual stresses are caused mainly by the heat treatment process. Only in the area directly beneath the surface are residual stresses influenced by the finishing pro-cess of the gear. As such, the residual stresses are derived by the hardness profile described earlier.
Figure 12 shows that, for the following cal-culations results, the assumed hardness pro-files are based on detailed measurements, yet smoothed for calculation. Because of the slight-ly different cooling conditions during the hard-ening process in profile direction of the tooth, the hardness gradients and core hardness are slightly different. The derived residual stress distributions are shown as well (Fig. 12). It can be seen that the compressive stresses in the case are up to σres ≈ 400 N/mm2 and are decreas-ing up to the transient region of case and core. Because the case thickness in profile direc-tion is more or less constant, the compressive residual stress profiles are similar. In contrast to that, the tensile residual stresses in the mid-dle of the tooth thickness are increasing from P4 to P1. The reason is the mechanical bal-ance of forces; i.e., the separating forces that are caused by the compressive stresses in the case are approximately constant for P1 through P4. The attracting force is represented by the tensile compressive stresses and requires hav-ing an equal amount. Because the core section becomes smaller — P4 through P1 — the corre-sponding tensile stresses must increase.
Figure 13 reveals the calculated material exposure for P1 through P4; the black lines represent the total dynamic exposure Aint a; the grey lines represent the total maximum expo-sure Aint.
Aint a can be seen as a value to describe the material fatigue; it is based on an endurance strength (derived from the Vickers hardness) for a failure probability of 50%. Pitting is a typical fatigue failure that correlates with the total dynamic exposure Aint a. (Ref. 8); (Refs. 18
Table 2 Hertzian stress under the considered load calculation
Calculation point
Old design New design
Drive side Coast side Drive side Coast side
P1 1,865 1,951 1,629 (-13%) 1,692 (-13%)
P2 1,891 1,979 1,571 (-17%) 1,698 (-14%)
P3 1,841 1,961 1,593 (-13%) 1,651 (-16%)
P4 1,612 1,901 1,553 (-4%) 1,585 (-17%)
Figure 11 Contact pattern and calculated contact points on the wheel flanks.
Figure 12 Profiles for hardness and residual stress.
50 GEAR TECHNOLOGY | June/July 2013[www.geartechnology.com]
technical

and 20) show that if material exposure values exceed a certain limit in the subsurface — up to a depth of y/b0 ≈ 1 (b0: half of Hertzian con-tact width) — pitting failure occurs with a high probability. For the examined gear this deci-sive range is up to approximately y ≈ 1 mm. As Figure 13 shows, Aint a exceeds the limit of 1. Due to the load spectrum of the test vehicles, which had only a few time slices with this con-sidered load, pitting failures on the drive-side where not detected. The fatigue strength may be the reason for that.
Aint represents the material exposure con-cerning yielding. According to the theory of the calculation method — Aint > 1 — local re-distribution of stress or initial cracks occurs. This situation is exacerbated if the notching effect of inclusions or incongruities increases the material exposure. At this time there is no possibility provided by the material-physical-based method to address this fact in the calcu-lation process. Therefore the practical limit for Aint values that are determined for a homog-enous material should be reduced to values smaller than 1 in order to be on the safe side. Because of the specifics of the hardening pro-cess, incongruities occur more typically in the core than in the case; this is why the total max-imum exposure Aint should be limited — espe-cially in the core.
Hertter (Ref. 8) and Wirth (Ref. 20) found good correlation between the total maximum material exposure Aint and the failure mode flank breakage. Especially high values in the material depth between the transition of case and core — as well as in the core — seem to cause flank breakage. It must be pointed out that crack initiations caused by yielding have no endurance limit or fatigue strength for finite life. According to theory, only a very few single-load cycles are enough for stress redistribution or crack initiation. These cracks may also have the ability to grow at lower loads. Unlike for the calculation against fatigue where there is a high strength for finite life, it is already critical if an initial crack occurs during a momentary high load. In other words, it is more important to reduce high Aint- values (concerning yielding) than the Aint a values (concern-ing fatigue) if the gear set is stressed by a load spectrum with only momentary high loads.
Figure 13 shows that Aint of P1 exceeds the limit 1 in the depth between y = 2.5–3.7 mm. P2 causes values Aint > 0.9 in a range between y = 2.2–4 mm and P3 for y = 1.5–3.2 mm. Only the Aint
graph for P4 is constantly under 0.9. These high values of Aint
over a very large section of the tooth correlate well with the wit-nessed flank breakages.
The first evidence of flank breakage does not necessarily appear in a single volume element. Local peaks of material exposure may be reduced after a yielding process and no grow-ing crack is initiated, meaning that the failure mode of flank
breakage will not occur. Therefore it is not only decisive for flank breakage if in one contact point the limit for yielding is reached; in fact, high values of Aint in adjacent contact points support crack growth. In order to evaluate this potential a mean value of the total maximum exposure is defined (Eq. 15). For the four considered contact points the average value of each Aint graph is determined in a certain depth. Of course, based on this consideration, determination of the Aint a mean value is also use-ful in determining an idea of the pitting danger over the consid-ered flank area.
(15)
A(y) = 1i
Ai(y)∑i1
where: A is mean value of total dynamic exposure Aint a or mean
value of the total maximum exposure Aint
y is material depth, mm i is amount of considered calculation points
Figure 13 Material exposure for calculated points: old design — drive-side of wheel.
Figure 14 Mean values of material exposure (crack growth potential): old design — drive-side of wheel.
51June/July 2013 | GEAR TECHNOLOGY

A is total dynamic exposure Aint a or total maximum exposure Aint.
In Figure 14 the graphs of the mean val-ues Aint a and Aint are shown for the drive-side of the wheel flank. It is obvious that in the depth y < 1 mm, Aint a has considerably high values. As mentioned, this is an expla-nation for the observed pitting in the field. But more important for flank breakage is, as described before, the profile of Aint. It can be seen (Fig. 14) that in the depth y = 2.3–3.7 mm, the exposure is Aint ≥ 0.9. Together with the mentioned influence of inclusions like those detected (Fig. 10), it is obvious that there is a high risk of flank breakage under these load conditions. The profiles for hardness and residual stress shown (Fig. 14) are also principally derived by Equation 15 and so can be interpreted as the mean values.
Figure 15 shows for the new design the corresponding calculations for points P1–P4. Compared to Figure 13 it is obvi-ous that in the close region to the surface (y < 1 mm) the total dynamic exposure Aint a can be reduced. But more critical to the failure mode flank breakage is the reduc-tion of the total maximum exposure Aint in the sub-surface of the tooth; the expo-sure profiles of all considered points do not exceed the theoretical limit of 1. Further, the maxima of Aint for the points P1 and P2 are significantly lower.
In Figure 16 the mean values according to Equation 15 are shown for the drive-side of the new design; as mentioned, their values represent the potential for crack growth. It can be seen that in the relevant depth for pitting (y < 1.0 mm), there is a significant reduction of the total dynamic exposure Aint a. For better illustration, the profile of the old design is shown by a dot-ted line; improvement for pitting can be estimated at approximately 15%. Again, the mean values show also the reduced crack growth potential in the inner tooth. In the transition from case to core the values for the total maximum exposure Aint are low-ered by approximately 14%.
Finally, it can be said that, for the drive-side flanks of the new design, the exposure profiles Aint a and Aint representing the risk of crack initiation are significantly lower, as are the mean values Aint a and Aint that can be regarded as the potential for crack growth.
Indeed, it is not sufficient to optimize only the drive-side flanks. The specific
Figure 15 Material exposure for calculated contact points: new design — drive-side of wheel.
Figure 16 Mean values of material exposure (crack growth potential): new design — drive-side of wheel.
Figure 17 Material exposure for calculated contact points: old design — coast-side of wheel.
52 GEAR TECHNOLOGY | June/July 2013[www.geartechnology.com]
technical
load spectra in the practical field show that the coast-side flanks are considerably high-loaded; thus the coast-side is analyzed using the same load as the drive-side.
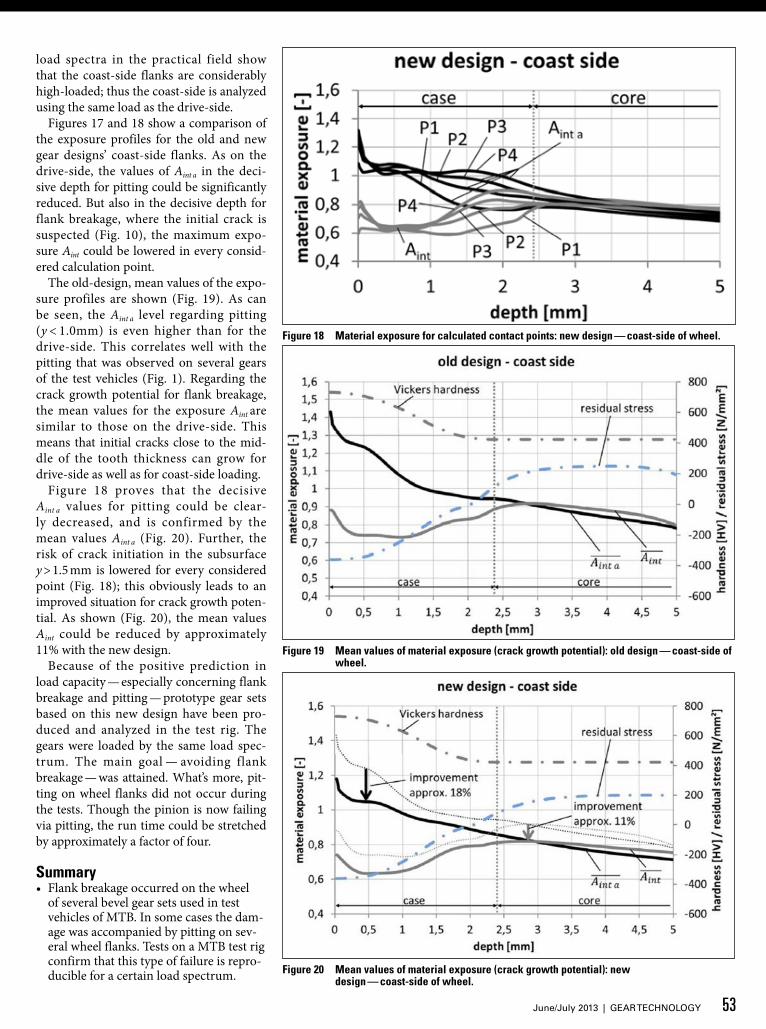
Figures 17 and 18 show a comparison of the exposure profiles for the old and new gear designs’ coast-side flanks. As on the drive-side, the values of Aint a in the deci-sive depth for pitting could be significantly reduced. But also in the decisive depth for flank breakage, where the initial crack is suspected (Fig. 10), the maximum expo-sure Aint could be lowered in every consid-ered calculation point.
The old-design, mean values of the expo-sure profiles are shown (Fig. 19). As can be seen, the Aint a level regarding pitting (y < 1.0mm) is even higher than for the drive-side. This correlates well with the pitting that was observed on several gears of the test vehicles (Fig. 1). Regarding the crack growth potential for flank breakage, the mean values for the exposure Aint are similar to those on the drive-side. This means that initial cracks close to the mid-dle of the tooth thickness can grow for drive-side as well as for coast-side loading.
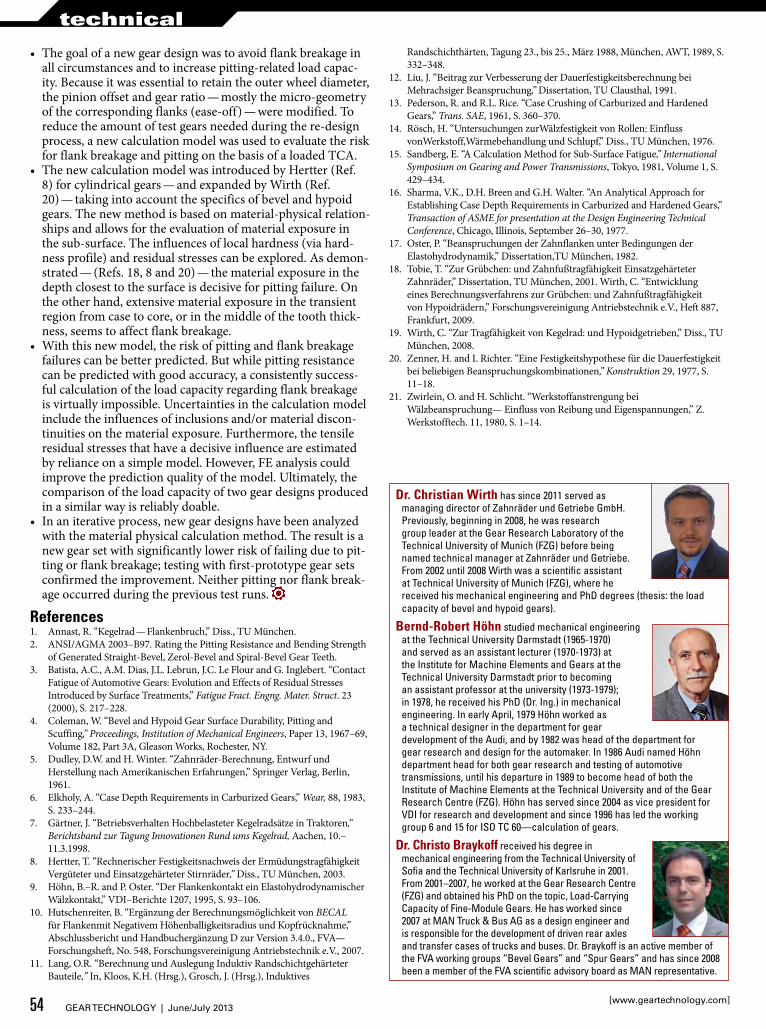
Figure 18 proves that the decisive Aint a values for pitting could be clear-ly decreased, and is confirmed by the mean values Aint a (Fig. 20). Further, the risk of crack initiation in the subsurface y > 1.5 mm is lowered for every considered point (Fig. 18); this obviously leads to an improved situation for crack growth poten-tial. As shown (Fig. 20), the mean values Aint could be reduced by approximately 11% with the new design.
Because of the positive prediction in load capacity — especially concerning flank breakage and pitting — prototype gear sets based on this new design have been pro-duced and analyzed in the test rig. The gears were loaded by the same load spec-trum. The main goal — avoiding flank breakage — was attained. What’s more, pit-ting on wheel flanks did not occur during the tests. Though the pinion is now failing via pitting, the run time could be stretched by approximately a factor of four.
Summary• Flank breakage occurred on the wheel
of several bevel gear sets used in test vehicles of MTB. In some cases the dam-age was accompanied by pitting on sev-eral wheel flanks. Tests on a MTB test rig confirm that this type of failure is repro-ducible for a certain load spectrum. Figure 20 Mean values of material exposure (crack growth potential): new
design — coast-side of wheel.
Figure 18 Material exposure for calculated contact points: new design — coast-side of wheel.
Figure 19 Mean values of material exposure (crack growth potential): old design — coast-side of wheel.
53June/July 2013 | GEAR TECHNOLOGY
• The goal of a new gear design was to avoid flank breakage in all circumstances and to increase pitting-related load capac-ity. Because it was essential to retain the outer wheel diameter, the pinion offset and gear ratio — mostly the micro-geometry of the corresponding flanks (ease-off) — were modified. To reduce the amount of test gears needed during the re-design process, a new calculation model was used to evaluate the risk for flank breakage and pitting on the basis of a loaded TCA.
• The new calculation model was introduced by Hertter (Ref. 8) for cylindrical gears — and expanded by Wirth (Ref. 20) — taking into account the specifics of bevel and hypoid gears. The new method is based on material-physical relation-ships and allows for the evaluation of material exposure in the sub-surface. The influences of local hardness (via hard-ness profile) and residual stresses can be explored. As demon-strated — (Refs. 18, 8 and 20) — the material exposure in the depth closest to the surface is decisive for pitting failure. On the other hand, extensive material exposure in the transient region from case to core, or in the middle of the tooth thick-ness, seems to affect flank breakage.
• With this new model, the risk of pitting and flank breakage failures can be better predicted. But while pitting resistance can be predicted with good accuracy, a consistently success-ful calculation of the load capacity regarding flank breakage is virtually impossible. Uncertainties in the calculation model include the influences of inclusions and/or material discon-tinuities on the material exposure. Furthermore, the tensile residual stresses that have a decisive influence are estimated by reliance on a simple model. However, FE analysis could improve the prediction quality of the model. Ultimately, the comparison of the load capacity of two gear designs produced in a similar way is reliably doable.
• In an iterative process, new gear designs have been analyzed with the material physical calculation method. The result is a new gear set with significantly lower risk of failing due to pit-ting or flank breakage; testing with first-prototype gear sets confirmed the improvement. Neither pitting nor flank break-age occurred during the previous test runs.
References1. Annast, R. “Kegelrad — Flankenbruch,” Diss., TU München.2. ANSI/AGMA 2003–B97. Rating the Pitting Resistance and Bending Strength
of Generated Straight-Bevel, Zerol-Bevel and Spiral-Bevel Gear Teeth.3. Batista, A.C., A.M. Dias, J.L. Lebrun, J.C. Le Flour and G. Inglebert. “Contact
Fatigue of Automotive Gears: Evolution and Effects of Residual Stresses Introduced by Surface Treatments,” Fatigue Fract. Engng. Mater. Struct. 23 (2000), S. 217–228.
4. Coleman, W. “Bevel and Hypoid Gear Surface Durability, Pitting and Scuffing,” Proceedings, Institution of Mechanical Engineers, Paper 13, 1967–69, Volume 182, Part 3A, Gleason Works, Rochester, NY.
5. Dudley, D.W. and H. Winter. “Zahnräder-Berechnung, Entwurf und Herstellung nach Amerikanischen Erfahrungen,” Springer Verlag, Berlin, 1961.
6. Elkholy, A. “Case Depth Requirements in Carburized Gears,” Wear, 88, 1983, S. 233–244.
7. Gärtner, J. “Betriebsverhalten Hochbelasteter Kegelradsätze in Traktoren,” Berichtsband zur Tagung Innovationen Rund ums Kegelrad, Aachen, 10.–11.3.1998.
8. Hertter, T. “Rechnerischer Festigkeitsnachweis der Ermüdungstragfähigkeit Vergüteter und Einsatzgehärteter Stirnräder,” Diss., TU München, 2003.
9. Höhn, B.–R. and P. Oster. “Der Flankenkontakt ein Elastohydrodynamischer Wälzkontakt,” VDI–Berichte 1207, 1995, S. 93–106.
10. Hutschenreiter, B. “Ergänzung der Berechnungsmöglichkeit von BECAL für Flankenmit Negativem Höhenballigkeitsradius und Kopfrücknahme,” Abschlussbericht und Handbuchergänzung D zur Version 3.4.0., FVA—Forschungsheft, No. 548, Forschungsvereinigung Antriebstechnik e.V., 2007.
11. Lang, O.R. “Berechnung und Auslegung Induktiv Randschichtgehärteter Bauteile,” In, Kloos, K.H. (Hrsg.), Grosch, J. (Hrsg.), Induktives
Randschichthärten, Tagung 23., bis 25., März 1988, München, AWT, 1989, S. 332–348.
12. Liu, J. “Beitrag zur Verbesserung der Dauerfestigkeitsberechnung bei Mehrachsiger Beanspruchung,” Dissertation, TU Clausthal, 1991.
13. Pederson, R. and R.L. Rice. “Case Crushing of Carburized and Hardened Gears,” Trans. SAE, 1961, S. 360–370.
14. Rösch, H. “Untersuchungen zurWälzfestigkeit von Rollen: Einfluss vonWerkstoff,Wärmebehandlung und Schlupf,” Diss., TU München, 1976.
15. Sandberg, E. “A Calculation Method for Sub-Surface Fatigue,” International Symposium on Gearing and Power Transmissions, Tokyo, 1981, Volume 1, S. 429–434.
16. Sharma, V.K., D.H. Breen and G.H. Walter. “An Analytical Approach for Establishing Case Depth Requirements in Carburized and Hardened Gears,” Transaction of ASME for presentation at the Design Engineering Technical Conference, Chicago, Illinois, September 26–30, 1977.
17. Oster, P. “Beanspruchungen der Zahnflanken unter Bedingungen der Elastohydrodynamik,” Dissertation,TU München, 1982.
18. Tobie, T. “Zur Grübchen: und Zahnfußtragfähigkeit Einsatzgehärteter Zahnräder,” Dissertation, TU München, 2001. Wirth, C. “Entwicklung eines Berechnungsverfahrens zur Grübchen: und Zahnfußtragfähigkeit von Hypoidrädern,” Forschungsvereinigung Antriebstechnik e.V., Heft 887, Frankfurt, 2009.
19. Wirth, C. “Zur Tragfähigkeit von Kegelrad: und Hypoidgetrieben,” Diss., TU München, 2008.
20. Zenner, H. and I. Richter. “Eine Festigkeitshypothese für die Dauerfestigkeit bei beliebigen Beanspruchungskombinationen,” Konstruktion 29, 1977, S. 11–18.
21. Zwirlein, O. and H. Schlicht. “Werkstoffanstrengung bei Wälzbeanspruchung— Einfluss von Reibung und Eigenspannungen,” Z. Werkstofftech. 11, 1980, S. 1–14.
Dr. Christian Wirth has since 2011 served as managing director of Zahnräder und Getriebe GmbH. Previously, beginning in 2008, he was research group leader at the Gear Research Laboratory of the Technical University of Munich (FZG) before being named technical manager at Zahnräder und Getriebe. From 2002 until 2008 Wirth was a scientific assistant at Technical University of Munich (FZG), where he received his mechanical engineering and PhD degrees (thesis: the load capacity of bevel and hypoid gears).
Bernd-Robert Höhn studied mechanical engineering at the Technical University Darmstadt (1965-1970) and served as an assistant lecturer (1970-1973) at the Institute for Machine Elements and Gears at the Technical University Darmstadt prior to becoming an assistant professor at the university (1973-1979); in 1978, he received his PhD (Dr. Ing.) in mechanical engineering. In early April, 1979 Höhn worked as a technical designer in the department for gear development of the Audi, and by 1982 was head of the department for gear research and design for the automaker. In 1986 Audi named Höhn department head for both gear research and testing of automotive transmissions, until his departure in 1989 to become head of both the Institute of Machine Elements at the Technical University and of the Gear Research Centre (FZG). Höhn has served since 2004 as vice president for VDI for research and development and since 1996 has led the working group 6 and 15 for ISO TC 60—calculation of gears.
Dr. Christo Braykoff received his degree in mechanical engineering from the Technical University of Sofia and the Technical University of Karlsruhe in 2001. From 2001–2007, he worked at the Gear Research Centre (FZG) and obtained his PhD on the topic, Load-Carrying Capacity of Fine-Module Gears. He has worked since 2007 at MAN Truck & Bus AG as a design engineer and is responsible for the development of driven rear axles and transfer cases of trucks and buses. Dr. Braykoff is an active member of the FVA working groups “Bevel Gears” and “Spur Gears” and has since 2008 been a member of the FVA scientific advisory board as MAN representative.
54 GEAR TECHNOLOGY | June/July 2013[www.geartechnology.com]
technical