New Housing for a New Japan - Daiwa House
85
New Housing for a New Japan
Transcript of New Housing for a New Japan - Daiwa House

Daiwa House, the Daiwa House group logo, are either registered trademarks ortrademarks of Daiwa House Industry Co., Ltd. in Japan and/or other countries.Copyright 2003 Daiwa House Industry Co., Ltd. All rights reserved.
New Housing for a New Japan
Printed in Japan

http://www.daiwahouse.co.jp/English/annual/index.html
77
Contents
About this report :Years shown in graphs are fiscal years ending March 31 unless otherwise indicated.
Forward-looking statements :Statements contained in this report regarding the Company’s plans, strategies,and expectations for future performance fall into the category of “forward-looking statements,” which are based on information available to the Company’s management at the time of writing. They are therefore subject to a number of uncertainties and unknowable factors, and actual results may thus differ substantially from those projected.
Sales statements on a segmental basis :Segment sales figures shown in this annual report are totals of sales to external customers and inter-segment sales and transfers. Segment sales ratios, however, are calculated solely on the basis of sales to external customers.
Introduction — economic and housing developments in Japan in fiscal 2002
Consolidated financial highlights
Group performance highlights
Investor information
Dear shareholders
In memory of our founder
Message from the president
Report by Executive Managing Director (financial affairs)
Corporate management
Corporate governance
Our business domain
Business outline
Housing
Commercial construction
Resort hotels
Home center business
Other businesses
Daiwa House group at a glance
Environmental measures
Research and development
Group network
The history of the Daiwa House group
Financial section
1
2
3
4
6
8
10
18
20
22
23
24
26
32
34
36
38
39
40
41
42
44
45


In JAPANIntroduction — economic and housing developments in Japan in fiscal 2002
0
5
10
15
20
25
30
87 88 89 90 91 92 93 94 95 96 97 98 99 00 01 02 03
(Trillions of yen) (%)Housing investment and percentage of GDP
Housing investment (left scale)Percentage of GDP (right scale)
3
4
5
6
7
8
9
Japan’s nominal GDP fell by 0.7% in fiscal 2002 for the second year-on-year decline in a row. The deflationary process continued to take its toll, with stock prices dropping to 20% of their peak level at the end of the 1980s bubble, and land prices slipping to 57% of their all-time high. Corporate bankruptcies during the term were the fourth-highest since World War II, while unemployment reached 5.4% in calendar 2002, the highest level since 1948, when compilation of statistics began.Performances differed from one industry to another. Export-oriented sectors such as manufacturing, particularly the automotive industry, were supported by strong overseas demand. In contrast, industries with little or no export presence were severely affected by the economy’s sluggishness. Among these was the construction industry, including housing, in which the Daiwa House group operates, where the market shrank yet again during the reporting period. Overall construction investment was down 7.1% from the previous term, while new housing construction starts stood at 1,145,553 units, the lowest level since fiscal 1983. Construction of owner-occupied housing posted a third consecutive year of decline (down 3.1% at 365,507 houses), and construction of condominiums — was previously held up the housing market as a whole — slumped 11.0% to 198,432. In contrast to this evident further decline in housing acquisition by individual consumers, construction of housing units for rent continues to grow — by 2.8% year-on-year to 454,505 in the term under review — against the backdrop of low interest rates, declining land prices, and a weak stock market.The near-future outlook for our group’s business environment is generally gloomy, but thanks to the improvements we have achieved over the past two years, we have good hopes of pursuing rewarding business operations even amid a stagnant economic situation. We now have the sort of efficient corporate structure in place that will allow us to make major strides in business performance once Japan’s economy gets properly back on the road to recovery.Please see our annual report for further details of performance in this and other operational segments.
1

Net sales
Operating income
Other income (expenses)
Net income (loss)
Per share of common stock (in yen and dollars):
Basic net income (loss)
Shareholders’ equity
Cash dividends applicable to the year
Total assets
Shareholders’ equity
Return on equity (%)
Equity ratio (%)
2003
¥1,184,544
45,272
(200,429)
(91,388)
(167.06)
884.55
10
1,094,441
483,684
(18.89)
44.19
2002
¥1,197,925
46,031
(36,493)
5,217
9.55
1,066.63
10
1,187,127
582,438
0.85
49.06
2001
¥1,016,237
44,290
(31,494)
6,256
12.05
1,182.01
17
1,066,457
613,867
1.02
57.56
2003
$9,871,200
377,267
(1,670,242)
(761,567)
(1.39)
7.37
0.08
9,120,342
4,030,700
Note: The U.S. dollar amounts represent translations of Japanese yen for convenience only at the approximate exchange rate on March 31, 2003 of ¥120 = U.S.$1.
0
300
600
900
1,200
99 00 01 02 03
Net sales
(Billions of yen)
Net income (loss)
(Billions of yen)
99 00 01 02 03
0
-100
5
10
15
20
0
200
400
600
800
99 00 01 02 03
Shareholders’ equity
(Billions of yen)
0
10
20
30
40
50
99 00 01 02 03
Operating income
(Billions of yen)
Thousands ofU.S. dollarsMillions of yen
Consolidated financial highlightsDaiwa House Industry Co., Ltd. and SubsidiariesYears ended March 31, 2003, 2002 and 2001
2

50.1 44.2%40Interest coverage ratio* Equity ratioCash flow from operating activities
billion yenor more
* Cash flow from operating activities divided by interest payable
•
•
•
•
About ¥90 billion in unrecognized retirement benefit obligations were amortized in lump-sum
Extraordinary depreciation of land and other property was implemented in the amount of about ¥75 billion
The equity ratio declined by only 4.9% to 44.2%
Net cash provided by marketing activities exceeded ¥40 billion in spite of more than ¥150 billion in losses before income taxes
Negative factors affecting fiscal 2002 performance
Overall housing industry
Official land prices fell for the 12th year in a row, and the year-on-year margin of decline widened New housing construction starts dropped below 1.15 million for the first time in 19 years
The Daiwa House group
Profitability on sales of landholdings deteriorated still further as the gap between fair value prices and book values widened even more Sales of housing to first-time home buyers was favorable, in line with projections, but the ratio of rebuilding of existing houses declined owing to generally bearish attitude of home owners toward major investments
Positive factors affecting fiscal 2002 performance
Overall housing industry
The tax-exemption limit on gifts was raised to ¥35 million, and the maximum rate of inheritance tax was lowered. A new grading system for existing housing was inaugurated with the aim of promoting the sale of existing housing units
The Daiwa House group
Reorganization of affiliates, including amalgamation and liquidation, was carried out to raise management efficiency and strengthen the group’s financial and marketing base The ratio of debt (including bonds) to total assets on a consolidated basis declined to a mere 0.6% from 4.8% for the previous term
Group performance highlightsAs of March 31, 2003
(on a consolidated basis)
3

Common stock ¥110,120 million (US$917,667 thousand)
Authorized
Issued and outstanding
Number of shareholders
1,900,000,000
550,664,416
32,828
99 00 01 02 030.6
0.9
1.2
1.5
600
800
1,000
1,200
BPS and PBR
(Times)(¥)
BPS (book value per share; left scale)PBR (price to book value ratio; right scale)
1 million or more 423,974 76.99
100 thousand or more 70,946 12.88
10 thousand or more 19,383 3.52
5 thousand or more 7,919 1.44
2 thousand or more 14,590 2.65
1 thousand or more 11,226 2.04
Less than 1 thousand 2,622 0.48
(Thousands of shares) (%) (Thousands of shares) (%)
Ratio of shareholding by scale
Principal shareholders
Japan Trustee Services Bank, Limited (trust account) 26,070
The Master Trust Bank of Japan, Ltd. (trust account) 26,047
Sumitomo Mitsui Banking Corporation 23,532
UFJ Bank, Limited 23,032
Mizuho Corporate Bank, Ltd. 22,209
Nippon Life Insurance Company 15,839
The Chuo Mitsui Trust and Banking Company, Limited 15,817
The Dai-ichi Mutual Life Insurance Company 15,807
UFJ Trust Bank Limited (trust account A) 10,237
The Daiwa House Employee Shareholder’s Association 9,849
(Thousands of shares)
Source: National Conference of Stock Exchanges
Foreign shareholding ratio
Domestic individuals and others 12.21%
Domestic corporations 64.28%
Overseas individuals and corporations 23.51%
USA & Canada40.0%
Asia(excluding
Japan)5.9%
Europe53.4%
Oceania & others
0.7%
Average for foreign shareholding ratio among all domestic listed companies : 17.7%
Shares
Investor informationAs of March 31, 2003
4

Daiwa House Industry Co., Ltd.
Head office 3-3-5 Umeda, Kita-ku, Osaka 530-8241 Phone: +81-6-6346-2111 Fax: +81-6-6342-1399
Contact
Should you have any inquiries or need further information, please contact us at the numbers below. Daiwa House Financial Affairs Department Phone: +81-6-6342-1400 Fax: +81-6-6342-1419 e-mail: [email protected]
Daiwa House Homepage
Daiwa House offers information on its latest corporate performance, annual report etc. on our homepage. Japanese site: http://www.daiwahouse.co.jp English site: http://www.daiwahouse.co.jp/tops/top0_english.html
Term-end
March 31 every year
Ordinary general meeting of shareholders
Held in Osaka at the end of June, which is within 3 months of the date of settlement of accounts for each year
Transfer agent
The Chuo Mitsui Trust and Banking Co., Ltd. 3-33-1 Shiba, Minato-ku, Tokyo
Securities traded
Osaka and Tokyo stock exchanges
Daiwa House’s share prices and trading volumes on the Tokyo Stock Exchange
020,00040,00060,000
01 02 03
0
600
300
900
1,200
1,500
(Thousands of shares)
(¥)(Points)
Daiwa House trading volumes (left scale)
Daiwa House share prices (right scale)
Tokyo stock price indexes and average (TOPIX) (left scale)
0
500
1,000
1,500
2,000
5

Dear shareholders
6

Takeo HiguchiPresident
In spite of a continued difficult business environment as a result of the ongoing legacy of the bursting of Japan’s economic bubble in the early 1990s, the Daiwa House group managed to secure sales and operating income levels not far removed from the initial targets. Sales came to ¥1,184,544 million (US$9,871.2 million) on a consolidated basis, up 3% over the initial target, and operating income came to ¥45,272 million (US$377.2 million), down 6.7% from the target. The management of the Daiwa House group, however, gives priority to laying the foundations of future growth. We see it as particularly important to use this period of business recession to strengthen our financial position. In line with this, we are forced to report that net income fell short of the initial target as a result of the posting of one-off expenses including losses on the extraordinary amortization of property in the amount of ¥212,734 million, leading to a net loss for the term of ¥91,388 million. These one-off expenses break down into ¥90,400 million in expenses provisions for retirement benefits, ¥75,183 million in extraordinary depreciation on property such as hotels and golf courses, valuation losses of ¥22,900 million on real estate held for sale, with the aim of housing developments, ¥9,773 million in valuation loss on investment securities, ¥7,421 million in provisions for possible loan losses on large-scale development projects, and ¥2,145 million in losses stemming from the liquidation of subsidiaries. During the term under review, we took various measures for future expansion. We carried out a reorganization of the parent company and the group with the goal of realizing higher efficiency in group management. At the parent company, with the primary goal of strengthening grass-roots marketing operations for the housing business, we introduced a new area-based management organization focused on the individual branches. Company-wide environmental preservation initiatives were pursued, thanks to which our 13 factories in Japan all reached the zero-emission target for specified pollutants. On the finance side, in a continuation from the previous term of our policy of reducing interest-bearing debt, we succeeded in repaying all remaining debts (amounting to ¥52,000 million) at the non-consolidated level, thus realizing our goal of a debt-free parent company. Against this background, we once again declared payment of an annual dividend of ¥10 per share for the reporting term.With the starting line marked out by the management’s definitive decision in the term under review, we have now embarked on a program of expansion of the group’s operations via the pursuit of a number of group management themes, i.e., improved profitability, legal and ethical compliance, struggling for the leadership in our industry, and establishing a sound relationship with our stakeholders characterized by strong ties of trust. We hope that our shareholders will continue to show us the same level of support and encouragement.
Ready for growth
7

Senior Advisor Nobuo Ishibashi, the founder of Daiwa House Industry, passed away on February 21, 2003 at the age of 81.Mr. Ishibashi was born in 1921, the son of a forester in the village of Kawakami in Nara Prefecture. He set up the Company in 1955, and in addition to pioneering the use of steel pipes in place of wood for the structural framework of houses, he developed a prefabricated housing system with shorter completion times and an improved cost performance compared with existing systems. In this way, by helping to supply Japanese society with a sufficient supply of affordable housing, the Company played an important supporting role in Japan’s achievement of high economic growth during the sixties and seventies. Mr. Ishibashi was also the pivotal figure in the expansion of the sphere of operations of our group — under the concept of the “industrialization of construction” — from specialization in residential construction to construction of commercial facilities and the operation of resort hotels and a chain of home centers, as well as other businesses on the periphery of the central housing business. He was also instrumental in contributing to the development of the housing industry, helping to grow prefabricated housing into a major industry and serving successively as chairman of the Japan Prefabricated Construction Suppliers & Manufacturers Association and the Japan Federation of Housing Organizations.In his capacity as a representative director, Mr. Ishibashi remained the leader of our group right up to the end. Even on his sickbed, he expressed his fervent hope for the further development of the Japanese economy and the Company’s business. He revealed his inextinguishable pioneer spirit by urging us to continue working for the further growth of our group.In recognition of his sterling work on behalf of the Japanese housing industry, Mr. Ishibashi was posthumously awarded the Second Grade of the Third Rank of Honor and the Grand Cordon of the Order of the Sacred Treasure on March 28, 2003.
In memory of our founder
8


Neopolis
Central Research Laboratory
The Daiwa House badge
Midget houseMidget house
Daiwa Royal Hotels
9

The management of the Daiwa House group has worked boldly to create a strong financial base, thus enabling the group to play a major part in laying the foundations for the creation of a prosperous future for the Japanese housing industry. Social and economic conditions are changing rapidly in Japan. The values that underpinned consumption patterns in the age of mass production and mass consumption are being transformed, with greater emphasis on quality of life rather than simply the acquisition of more and better material goods. Our business is the creation of homes and lifestyle services, which are truly the keystone of the quality of life being sought by the consumer. We must closely examine the values of today’s society, and on this basis confidently draw up a clear vision of the living environment of the future. Our corporate mission, or role within society, will never change, no matter what future prospects we face. We always try to put ourselves in the place of the customer. We will continue our sincere quest to help people realize their dreams and aspirations, and will further improve the quality of our products and services with the aims of contributing universally to the good of society and enhancing customer satisfaction.We aim to become the No. 1 comprehensive supplier of housing products and housing-related services to the Japanese market. With this goal in mind, we have formulated three key words to encapsulate the principles that should guide our group activities. They are: “trust,” “challenge,” and “creation.” In keeping with the spirit behind these principles, we have set ourselves the twin challenges of achieving net sales on a consolidated basis of ¥1.5 trillion by fiscal 2005 and ¥2 trillion by fiscal 2010.
Confidently working torealize our future vision
Message from the president
10

11

To play its proper role as a responsible corporate citizen in this newly unfolding age, the Daiwa House group takes its corporate mission very seriously. We believe that our mission is threefold: to earn the trust of the public through sincerity and truthfulness; to provide a long-term and reliable supply of products and services with high added value; and to secure the growth of our corporate group through close cooperation with our customers. By pursuing these goals, we are confident of achieving continued long-term growth.To this end, we have openly declared our intention to pursue the strengthening of our financial position and the improvement of corporate transparency through improved management disclosure, with the goal of building stronger bonds of trust with our stakeholders. Thus, the repayment of interest-bearing debt and reduction of expenses, as well as the lump-sum amortization of liabilities on retirement benefits and elimination of unrealized losses during the term, were all means to strengthen our financial position. As a result, despite the repayment of interest-bearing debt and elimination of unrealized losses, we still managed to keep our equity ratio at the high level of 44.2%, and have built a firm management base from which we can face the future with confidence.
Fulfilling our corporatemission to forge strongerbonds of trust
T r u s t
12

In addition to a strong financial position, we continue to place emphasis on cash flow and on realizing a constantly high shareholders’ value through investment from the long-term perspective. To this end, amid the current continuing downward trend in land prices, we are making efforts to improve our turnover of land assets still further from the viewpoint both of lightening landholding risk and reducing inventories. Our policy is to maintain the annual inventory turnover rate for land for the construction of single-family houses to 2, and the rate for condominiums to 1. We are also registering valuation losses on land held for sale, which frees us to engage in more aggressive land selling operations.Compared with the majority of companies in the construction industry, which is heavily dependent on bank loans, the Daiwa House group has succeeded in building a relatively strong financial base. With this as the cornerstone of our future growth strategy, we are working to improve our earning power and realize a stable level of corporate value on a long-term basis.
99 00 01 03020
20
40
60(%)
Daiwa House (non-consolidated)Construction industry averageAll-industry average
Ratio of interest-bearing debt to total assets
99 00 01 02 03
Equity ratio
0
20
40
60
80(%) Daiwa House group
Construction industry averageAll-industry average
00 01 02 030
1
2
3
4
5
6
7
8(%)
Ratio of cash flow from operating activities to net sales
Daiwa House groupConstruction industry averageAll-industry average
13

The Daiwa House group occupies a significant position within the Japanese housing industry, with a 3.6% share of the total market for new housing construction starts — the number two position in both single-family houses and apartment buildings. Each year, the group supplies approximately 40,000 housing units to the market, including single-family houses, rental apartments, and condominiums. Since the Company’s establishment, it has built an aggregate of 1,070,000 housing units. Housing operations account for approximately 66.6% of the group’s total net sales.As is well-known, Japan now has enough houses and condominiums to meet demand. In comparison with other advanced industrialized countries, however, the situation is still unsatisfactory in terms of housing floorspace per person and the average useful life of single-family houses. Looking at prospects for the near future, although the number of children as a percentage of the total population is decreasing, while the ratio of elderly people is rising, the children of the baby boomers are now starting to buy their own homes. There is thus an urgent need for home construction that precisely meets the requirements of both the new housing market and the demand for renovation and rebuilding of existing homes, and we are responding proactively to this situation. In response to demand for new housing, we are offering high-quality, long-lasting housing that can be passed on to the next generation, featuring the fruits of our proprietary technologies such as earthquake dampening systems and efficient insulation for outer walls. To further strengthen the Company’s marketing system, which is designed to cater to the differing needs of local regions, we are planning to increase the number of offices from 86 at present to 100 by the end of fiscal 2005. In addition, we will make efforts to more effectively support the growth of our seven sales subsidiaries. With regard to the rental apartment business, where demand
Injecting new value into the housing industry
C h a l l e n g e
0
25
50
75
100
125
150
175
200
1970 1980 1990 2000 2010
(Ten thousand of units)
Estimates of future trends in new housing starts(Research Institute of Construction and Economy)
Aggregate housing sales by Daiwa House: 1,073,985
New housing starts in Japan on a calendar basis
New housing starts by Daiwa House
Rental apartment buildingsCondominiumsSingle-family houses
Net new housing startsin Japan : past & future
14

is on the rise, the Company is introducing new types of apartment building that offer even higher asset value to landowners. At the same time, we are collaborating with our affiliate Daiwaliving, which manages apartment buildings. We are aggressively marketing innovative land utilization plans for landowners under such systems as fixed-term land-lease contracts and land-lease contracts with building purchase riders, as these methods reduce investment risk. In these ways, we are broadening our field of business operation.With respect to the stock of existing housing, we are in the process of setting up home renovation centers at all the Company’s branches nationwide to tap the large potential market represented by the one million customers on our books, and thereby cultivate a fruitful new market. Over the long haul, we have good hopes of growing this business into a major earnings source.In the field of commercial building construction, we are more actively marketing services focused on individually tailored customer solutions. In particular, our LOC (Land Owner Company) system, an asset management system that ties together the needs of landowners and companies wishing to open wholesale or retail outlets, has already proven its strong competitiveness with a track record to date of over 21,000 contracts. The system addresses equally the need by landowners for earnings from land assets and the need for profit expansion by retailing industry companies through the opening of new stores. Thanks to the high-level expertise of our staff and our extensive network of contacts, this service has gained an excellent reputation, and business is projected to continue improving for the foreseeable future.Through the measures described above, the Daiwa House group is injecting new, added value into the Japanese housing industry and other related industrial sectors. Our short-term goals are to gain a 10% share of the new housing market and become the leading corporate group in the supply of comprehensive housing-related services.
989796959493929190898887868584838281800
3
6
9
12
15Units per 1,000 population
Japan USA UK France Germany
Number of housing units constructed per 1,000 population
0
50
100
150
200
0
500
1,000
1,500
2,000(m2) (Thousands of U.S. dollars)
USA UK France GermanyJapan
Floorspace per housing unit (left scale)Private-sector housing investment per 1,000 population (right scale)
Average housing space and investment
0 20 40 60 80 100
Up to 1944 1945-1970 From 1971
Japan (93)
USA (93)
UK (93)
France (92)
Germany (93)
(%)
Breakdown of existing housing by period of construction
Figures in the parentheses show survey years
15

Making new dreams come true
C r e a t i o n
The most outstanding intangible quality of the Daiwa House group is its pioneering spirit. We were the pioneers in the introduction of prefabricated housing to the Japanese market, and since then we have constantly pursued new products and new ways of doing business, including marketing incorporating mortgage loans, resort hotels, and the home center business, among others. As our history clearly shows, while seeking innovation, we have always centered our business on housing and closely related operations, and we will never deviate from this policy in the slightest. This is because we recognize that the home is where the heart is — all dreams start here.To help home buyers realize their dreams, we have positioned four focal themes for the 21st century: welfare, the environment, health, and telecommunications.Regarding welfare, back in 1986 we foresaw today’s rapidly aging society and opened a nursing care home for senior citizens, and in 1989 we set up the Silver Age Research Center for the investigation of issues related to housing and care for the elderly. Based on the center’s findings, we have set up more than 700 nursing care facilities and Day service centers for the elderly. Nursing care facilities, including communal dwellings (protected accommodation), constitute a promising market in which we can effectively utilize the know-how possessed by the Center in both equipment and services, and good growth is expected in the future. With regard to environmental concerns, we are cooperating closely with universities and companies in other industrial sectors to pursue research into electricity generation through renewable energy such as solar power and wind power, facilities for the disposal of industrial waste or the recycling of waste materials, and so on, with a view to turning them into commercially viable projects. Health and telecommunications are the most important themes intertwined with lifestyles. The rapidly growing popularity of broadband Internet access means that the interconnection between housing and IT, particularly telecommunications, will become stronger than ever. Moreover, increasing demand is projected for at-home health monitoring and easy communication with hospitals or clinics, as well as the provision of medical care at home. From here onward, home buyers will become increasingly demanding, and there will be a growing focus on quality and various value-added aspects. We must therefore respond by creating a stimulating and liberal working environment that facilitates the optimization of our employees’ creativity. This will include a new pay and promotion system, which we are now designing. By these means, we will be able to pool the expertise and research of all our staff. The intelligence and creativity of our group staff are a valuable intangible intellectual asset that does not appear in our balance sheet but which lies behind the group’s brand image, technological capabilities, and superiority
16

in design. We will protect and foster this intangible asset with the same care that we devote to more conventional, tangible assets.Setting new goals, dreaming new dreams. We are creating a new corporate culture focused on intelligence and creativity. Our corporate mission is to make our customers’ dreams come true.In the foregoing pages, I have described my vision of the Daiwa House group’s future, and I hope you share my aspirations and enthusiasm. Now, in fiscal 2003, we once again take on new challenges on the road to carving out a bright future for Japan’s housing industry.We are now committed to making progress in our initiatives in the areas of corporate governance and risk management. We also plan to issue quarterly reports. Through these means, and by realizing an ever-growing corporate value, we are determined to properly fulfill our duties as a responsible corporate citizen to all our stakeholders. We look forward to your continued support, and hope that you will help us to make new dreams come true.
FY2001 FY2002
Management
Traditional scale of
corporate values
The new Daiwa House
group
Financial position
Operations
Main Improvements Effected in FY2001–2002
•Directors’ term of office cut from 2 years to 1 year•Middle management staff cut by 50%•Risk management bolstered
•Interest-bearing debt reduced by ¥80.1 billion•¥59.9 billion unrealized loss recorded on land revaluation•SG&A expenses reduced
•Aggregate housing sales pass one-million unit mark•First prefabricated house featuring earthquake- dampening system launched•Insulation method for outer walls adopted•Launch of wooden house series•ISO 14001 certification acquired by factories and purchasing divisions•Seven local sales companies established
•Changes in accounting policies for retirement benefits•Total elimination of unrealized loss on land •Debt-free management achieved on non-consolidated basis•Termination of agency service for state-run employee pension fund•Loss recognized on liquidation of affiliates•Extraordinary depreciation of property in the amount of about ¥75 billion etc.
•Marketing, design, product development functions reorganized on regional lines•Renovation & rebuilding services expanded•Voluntary Environmental Action Plan drawn up•All 13 factories reached zero-emission targets
•Change from division-based to branch-based organization•Introduction of performance-linked pay system for branch managers•Reduced number of group companies for more customer-focused management•Introduction of points system into calculation for lump-sum payment at employees’ retirement
Takeo Higuchi President
17

For the past three years I have been heading a drive to reform the financial structure of the Daiwa House group, principally through a focus on improving cash flows, with the ultimate goal of maximizing shareholder value. The Japanese economy has stagnated to the point where many companies exhibit chronic indebtedness, and the total interest-bearing debt burden of the private sector has been reduced by a mere 13% over the last six years. In this situation, it is all the more vital for us to strengthen our operating cash flow to build the sort of firm financial base that allows for further development of our group. Only by so doing can we achieve our top-priority goal of raising our earning power. Over the last few years, we have pushed through a wide range of measures to realize improved financial health, including the recognition of more than ¥80 billion in extraordinary losses, mainly from the write-down of inventories and securities holdings, the revaluation of landholdings at fair market prices, the repayment of short- and long-term bank borrowings, and drastic cost-cutting. In the reporting period, we set further milestones on the road to financial health with two bold management decisions.Firstly, in the face of the present severe business conditions against the backdrop of a decline in profitability on landholdings, we took vigorous steps to dispose of land and buildings held for sale, thanks to which we succeeded in achieving our target of debt-free management at the non-consolidated accounts level.Secondly, we applied stricter standards to the valuation of real estate, equities, and accounts receivable. In doing this, we have completely eliminated a major negative factor that would have affected our business performance in the future. As a result, we posted ¥210 billion under extraordinary loss account including loss on retirement benefits. We carried out lump-sum amortization of unrecognized actuarial shortfall and changed other accounting policies on discount rates of plan assets. The Japanese economy is likely to remain sluggish for the foreseeable future. However, we intend to put this difficult period to good use by harnessing the excellent management and staff morale that result from target achievement, and by leveraging our sound balance sheet — with its low risk of price fluctuation on assets — to expand our sphere of corporate activity with more sincerity and further enhance our business performance.
Tetsuji Ogawa Executive Managing Director (financial affairs)
Report by Executive Managing Director (financial affairs)
18

Consolidated balance sheets 2003
(Millions of yen)
Current assets:
Inventories
Total current assets
Property, plant and equipment:
Land
Buildings and structures
Accumulated depreciation
Machinery and equipment
Accumulated depreciation
Furniture and fixtures
Accumulated depreciation
Construction in progress
Net property, plant and equipment
Investments and other assets:
Investment securities
Investments in and advances to associated companies
Total investments and other assets
Total
Current liabilities:
Total current liabilities
Long-term liabilities:
Liability for employees’ retirement benefits
Total long-term liabilities
Minority interests
Shareholders’ equity:
Retained earnings
Total shareholders’ equity
Total
¥ 267,199
468,296
212,312
380,978
(259,286)
51,264
(42,205)
36,695
(31,116)
1,004
349,646
25,988
25,900
276,499
1,094,441
268,811
136,480
319,189
22,757
289,840
483,684
¥1,094,441
Consolidated statements ofoperations 2003
(Millions of yen)
Net sales
Cost of sales
Gross profit
Selling, general andadministrative expenses
Operating income
Other income (expenses):
Write-down of marketable and investment securities
Write-down of inventories
Amortization of transitional obligation for employees’ retirement benefits
Actuarial loss on retirement benefits
Actuarial loss due to a change of discount rate
Extraordinary depreciation for property, plant and equipment
Other – net
Other income (expenses) – net
Income (loss) before income taxesand minority interests
Net income (loss)
¥1,184,544
936,861
247,683
202,411
45,272
(9,773)
(22,900)
(8,780)
(49,888)
(31,733)
(75,183)
(318)
(200,429)
(155,157)
¥ (91,388)
Consolidated statements ofcash flows 2003
(Millions of yen)
Operating activities:
Income (loss) before income taxes and minority interests
Write-down of marketable and investment securities
Extraordinary depreciation for property, plant and equipment
Provision for employees’ retirement benefits, net of payments
Decrease (increase) in inventories
Other – net
Net cash provided by operatingactivities
Net cash used in investingactivities
Net cash used in financingactivities
Cash and cash equivalents, endof year
¥(155,157)
9,773
75,183
85,002
32,872
(7,214)
40,459
(27,316)
(57,713)
¥ 103,950
Our consolidated financial statements at a glance
19

Board of directors and corporate auditors
Presidents of principal subsidiaries and affiliates
*Representative Director
Takeo Higuchi*President
Masanori NishioExecutive Managing Director
Mutsuo KajimotoDAIWA KOSHO LEASECO., LTD.
Kenji ItoDAIWA RAKUDAINDUSTRY CO., LTD.
Katsuyoshi TatenoDAIWA LOGISTICSCO., LTD.
Isao KusunokiDAIWALIVINGCO., LTD.
Norihisa OdaDAIWA SERVICECO., LTD.
Masayasu EnomotoDAIWA INFORMATIONSERVICES CO., LTD.
Sadao Yoshii*Executive Vice President
Yuzo KawaharaManaging Director
Tamio Ishibashi*Executive Vice President
Kimitaka KomatsuManaging Director
Mitsuo Funatsu*Executive Vice President
Naotake OhnoManaging Director
Corporate managementAs of June 27, 2003
20

Mikio SasaiNIHON JYUTAKU RYUTU CO., LTD.
Isamu ShakudoDAIWAROYAL CO., LTD.
Shigekazu MatsuoLOC DEVELOPMENT CO., LTD.
Jun-aki MatsuokaROYAL HOME CENTER CO., LTD.
Keiichi HondaDAIWARESORT CO., LTD.
Tetsuji OgawaExecutive Managing Director
Takashi UzuiManaging Director
Kenji MurakamiExecutive Managing Director
Takeshi KajimotoManaging Director
Takuya IshibashiExecutive Managing Director
Hiroshi AzumaManaging Director
Directors
Munemitsu Kimura
Tsuyoshi Natsume
Tadashi Murakaku
Shigeo Ohtsuka
Osami Nishikawa
Tatsushi Nishimura
Corporate Auditors (standing)
Kohei Nakabo
Hiromasa Kobayashi
Toshihiko Emi
Eiichi Takeda
Corporate Auditor
Hiromi Doi
21

Our stance on corporate governanceThe management of Daiwa House positions corporate governance as an issue of the utmost importance. From the viewpoint of earning the confidence of all our stakeholders — notably our shareholders, customers, and employees — it is vital that we put in place a system ensuring swift and accurate decision-making so as to produce a management system characterized by a high degree of efficiency and transparency.
Measures to realize effective corporate governance(1) In June 1999, the Company adopted an executive officer system as part of an overall program aimed at
strengthening the whole corporation through increased management efficiency. This was followed in June 2002 by the shortening of the term of office of members of the Board of Directors to one year. These two measures both facilitate faster management decision-making and clarify individual responsibilities.
(2) To ensure transparent and fair conduct of management, with effect from June 2003 we have increased the number of outside auditors from 2 to 3, giving us a board of corporate auditors of 5 members in all. This measure both strengthens the management’s auditing functions and facilitates the provision of objective advice to our top management.
(3) To secure greater public trust through enhanced transparency via the prompt and appropriate disclosure of management information, we will continue to reexamine and refine our disclosure methods.
(4) As an important part of our compliance efforts, we recognize it as our duty to take preemptive steps to minimize the risks inherent in our business operations, and in the event of the materialization of risks, to take prompt and effective remedial action. To facilitate these objectives, in April 2002 we set up the Risk Management Committee. By ensuring that all management and staff are thoroughly acquainted with the risks attendant on the Company’s business operations and the means of avoiding and minimizing the said risks, we aim to ensure the smooth operation of our business as a prerequisite to the vigorous and financially sound development of our group.
Corporate Governance
Board of Directors
Executive Officer
Board of Corporate Auditors
Outside Auditors
Executive Officer CommitteePresidentRisk Management Committee
Single-family houses Home renovation Rental apartment buildings Retail and wholesale facilities Steel-pipe and general construction Condominiums
•Office in charge of marketing, corporate business and sales promotion•Office in charge of production technology and product development•Office in charge of production and purchasing •Office in charge of administration
Members attend meetings of the Board of Directors and provide advice and proposals relating to corporate governance.
•Urban and residential area development business•Overseas joint ventures in rental housing management•Home center business•Resort hotel business
Branches
Four divisions
Organizational Chart of Daiwa HouseCorporate Governance System
ExecutiveVice President
ManagingDirectorExecutive
ManagingDirector Director
22


Business outline
Housing
Commercial construction
Resort hotels
Home center business
Other businesses
C o n t e n t s
24
26
32
34
36
38
BusinessDomainOur
23

Business Overview
Housing
Commercial construction
Homecenter
business
Resorthotels
Otherbusinesses
Commercial construction
Resorthotels
Home center business
Housing
Group domain
Other businesses
Sales by segment
Housing 66.6%
Commercial construction 20.8%
Resort hotels 4.4%
Home center business 4.3%
Other businesses 3.9%
The Daiwa House group comprises 41 companies in Japan and overseas engaging in a comprehensive range of businesses re-lating to the living environment: from homes to lifestyles. Its business domain is divided into fi ve segments, and the parent company accounts for 88.0% of total Group sales.
Business outline
24

0
200
400
600
800
1,000
01 02 03
Net sales Sales breakdown (non-consolidated, buildings only)
Single-family houses 54%Rental apartment buildings 34%Condominiums 12%
(Billions of yen)
0
100
200
300
01 02 03
Retail and wholesale facilities 60%Steel-pipe and general construction 40%
(Billions of yen)
Net sales Sales breakdown (non-consolidated)
0
20
40
60
80
100
01 02 03
Net sales(Billions of yen)
Breakdown by business category(number of companies)
Mainly provision of services 80%Mainly sale of goods 20%
0
10
20
30
40
50
60
01 02 03
Net sales(Billions of yen)
0
10
20
30
40
50
60
01 02 03
Net sales(Billions of yen)
Housing operations constitute the Group’s core business, accounting for 66.6% of sales. They encompass a wide array of businesses relating to the homes people live in, ranging from the contract construction of housing and the sale of houses and residential lots, to the building of apartments for rental use, the development and sale of condominiums and so on.
Commercial construction to meet business demand is another pillar of the Group’s construction activities, con-tributing 20.8% of total sales. This segment is divided into two categories: the construction of commercial facilities located in suburban areas for retailers, and steel-pipe and general construction, principally offi ce buildings, factories, and nursing and welfare facilities.
In this segment we operate 38 home centers nationwide. These offer an average of 50,000 items, primarily DIY products for interior and exterior use, and including out-door and leisure goods and pet supplies. We also devote considerable effort to the fi eld of renovation. On a con-solidated basis, the segment accounts for 4.3% of sales.
This segment involves the operation of 29 Daiwa Royal Hotels and 10 golf courses around Japan. It accounts for 4.4% of sales a consolidated basis, and within this total the ratio of sales generated by hotels and golf courses is 9:1. In the Japanese hotel industry, these hotels are clas-sifi ed as resort hotels.
These businesses are primarily the responsibility of Group subsidiaries and affi liates. There are 15 catego-ries, ranging from corporate-oriented business such as the manufacture and sale of construction materials and goods distribution, to services for end-users, including removals and the operation of Super sento bathhouses. Together, these contribute 3.9% of sales.
29 10
3838 stores
29 hotels and 10 golf courses
25

Maintained unit sales at over 40,000 units on anon-consolidated basis (up by 1.7% year-on-year)
Housing
Aiming to winthe largest share of the newly built housing market
Fiscal 2002 was another sluggish year for the housing market, demonstrated by the 2.4% year-on-year de-cline in overall housing starts. Notwithstanding this situation, in our non-consolidated housing operations we achieved a 1.7% rise in unit sales, topping 40,000 units for the second successive year and maintaining our No. 2 share in the market for newly constructed houses and apartment buildings. Nevertheless, fac-tors such as falls in land prices and deflation had an adverse impact, causing net sales to slip by 1.7%, to ¥791,981 million and operating income to decline by 8.8%, to ¥39,135 million, both on a consolidated basis.
0
5,000
10,000
15,000
00 01 02 03
(Millions of yen)
Number of employees (left scale)Operating income per employee (right scale)
0
2
4
6
8
10
Number of employees / Operating income per employee
0
250
500
750
1,000
99 00 01 02 03
Net sales (left scale)Operating income (right scale)
Net sales / Operating income
30
40
50
60
(Billions of yen)
26

The field of single-family houses is a piv-otal one for our group. Ever since our es-tablishment we have pioneered prefabri-cated housing, constantly pursuing improvement of single-family houses in terms of both space and functionality. Unit sales fell by 5.9%, to 12,909 units by the parent company, generating sales revenue of ¥329.6 billion, down by 5.4%.
The market for newly built apartments in fiscal 2002 expanded by 2.8% from the previous year, but we outpaced that, boosting unit sales on a non-consolidated basis by 8.8% to 24,392 units, and posting sales revenues of ¥208.0 billion, up by 7.5%. We have built a cumulative total of more than 570,000 units.
In fiscal 2002, construction starts declined for the first time in four years. Sales fell 7.0% to 4,253 units on a consolidated basis and 11.4% to 3,669 units on a non-consolidated basis. We predict that changes in lifestyles and sizes of families, and greater diversity in the ways people work, will lead to the expansion of new segments of demand, and so we are taking steps to supply residences of a kind that go beyond the conventional standard.
27

Housing
Single-family housesEvery year around half a million single-family houses are newly built in Japan, a large pro-portion being traditional wooden houses. Major wellsprings of our business strength are our 460,000 residences, similar in number to the annual number of nationwide starts, and the know-how in the preparation and development of residential sites we have accumula-ted from large-scale residential developments (new towns). With respect to Japan, with its frequent earthquakes and high temperatures and humidity, earthquake resistance and durability are of particular importance. In the previous fiscal year Daiwa House launched the first prefabricated earthquake-proof house, and we intend to reduce its cost further and to ensure market diffusion. In addition, we launched a prod-uct using an exterior insulation method designed to enhance durability, and others limited to use in specific regions, taking local climatic conditions and lifestyles into consideration.The sphere of health and safety is another key consideration. Since burglary is becoming a so-cial problem, the need for crime-prevention measures for housing is increasing, so we have enhanced the defenses that dwellings have against crime, through the use of such materials as multilayer glass to prevent entry by burglars. Also, to make houses healthier places, we as a matter of policy do our best to exclude harmful substances from our building materials.Steps taken to achieve that include the introduction of a system of long-term 40-year* war-ranties, the conduct of regular inspections by our customer advice centers, and the making of suggestions for renovation by our designated centers for house enlargement and reconstruction. We will continue vigorously to foster good customer relations and to enhance the value of this business. * As of May 2003, the warranties are applied to wooden structure houses built using traditional methods as well as to steel-frame houses.
0
150
300
450
600
99 00 01 02 030
25
50
75
100
Aggregate housing sales by Daiwa House (left scale)Annual housing sales by Daiwa House (right scale)Annual housing starts (nationwide) (right scale)
(Thousands of units) (1999=100)
Housing sales & construction starts
Daiwa House 2.7%Top 5 companies 15.1%Other companies 84.9%
Share of single-family house market (FY2001)
483,677 units
Notes: 1. The share of houses for Daiwa House and the top 5 companies were taken from the “White Paper on the Housing Industry,” by the Yano Research Institute Ltd.
2. The total number was quoted from “Statistics on Building Construction Started,” by the Ministry of Land, Infrastructure and Transport.
Orders & sales 2003 2002 2001 2000 1999House orders received (Units) 12,895 13,332 12,577 14,345 14,213Houses sold (Units) 12,909 13,725 13,705 14,234 14,362Sales (Billions of yen) ¥329 ¥348 ¥343 ¥350 ¥330
28

Rental apartment buildingsBacked by its solid base in the field of sales of rental apartment buildings, Daiwa House has continued to improve its performance in this segment. In the term under review it achieved an 8.8% year-on-year increase in unit sales, which rose to 24,392 units, and 7.5% growth in sales revenue, which reached ¥208.0 billion on a non-consolidated basis.With respect to products, we have catered to the increasingly diverse tastes of residents by launching new models designed with the distinctive characteristics of individual localities in mind. On the marketing side we not only ensure very close contacts with local communities, but also engage vigorously in proactive marketing of our apartment management service, which utilizes leasehold rights incorporating a special agreement for the transfer of buildings. The cumulative number of these properties has reached 1,100.Great importance is also attached to the sphere of after-sales service, such as the solicitation of tenants and management, maintenance, and repairs. In conjunction with our subsidiary Daiwaliving we provide long-term, comprehensive owner support covering up to a maximum of 40 years of long-term building diagnoses and guarantees, 24-hour tenant handling, and asset-management consulting. As a result, the number of buildings under its management rose by 16.8% during the term under review, to 66,934.
0
150
300
450
600
99 00 01 02 030
25
50
75
100
Aggregate rental apartment sales by Daiwa House (left scale)Annual rental apartment sales by Daiwa House (right scale)Annual rental apartment starts (nationwide) (right scale)
(Thousands of units) (1999=100)
Rental apartment sales & construction starts Share of rental apartment market (FY2001)
464,044 units
Daiwa House 3.3%Top 5 companies 19.6%Other companies 80.4%
Notes: 1. The share of houses for Daiwa House and the top 5 companies were taken from the “White Paper on the Housing Industry,” by the Yano Research Institute Ltd.
2. The total number was quoted from “Statistics on Building Construction Started,,” by the Ministry of Land, Infrastructure and Transport.
2003 2002 2001 2000 1999Apartment orders received (Units) 25,140 23,222 19,835 21,366 23,584Apartments sold (Units) 24,392 22,416 20,490 22,031 22,754Sales (Billions of yen) ¥208 ¥193 ¥176 ¥186 ¥186
Orders & sales
29

As urban land prices fall in Japan, the development and sale of new condominiums is be-ing concentrated increasingly in the central parts of urban areas. The market for newly built condominiums declined for the fi rst time in four years, as in spite of the greater popularity of large ultra-high-rise properties in urban areas, there was slack demand for condominiums in regional and suburban areas. Non-consolidated sales of condominiums fell by 11.4% to 3,669 units.The majority of condominiums in Japan are concentrated on Tokyo and the surround-ing area, whereas Daiwa House’s condominium sales are nationwide. In the Tokyo area, during the term under review Daiwa House focused its efforts on urban-type compact condominiums with a fl oor space of 30–50 square meters, for which new demand is aris-ing, particularly among people living alone, senior citizens, SOHO workers, and people wanting them for investment purposes. In regional cities we developed and sold high-quality condominiums designed to meet local requirements. With respect to products, we strengthened our uniform D’ Series brand, and standardized and enhanced aspects such as performance criteria by classifying products in four groups according to location and size. Of particular note was our active nationwide adoption of the skeleton infi ll (SI) de-sign, in which structure and interiors are designed separately.Daiwa Service continued its steps to enhance its 24-hour unit-specifi c management system and its long-term 40-year repair plan. As a result, it increased the number of units under management by 6.0% to 36,207.
0
10
20
30
40
50
99 00 01 02 030
100
200
300
400
500
600
700
800
Aggregate condominium sales by Daiwa House (left scale)Annual condominium sales by Daiwa House (right scale)Annual condominium starts (nationwide) (right scale)
(Thousands of units) (1999=100)
Condominium sales & construction starts Features of Daiwa House’s condominium business
(Number sold in fiscal 2002)
(National statistics for 1998)
0 20 40 60 80 100 (%)
Tokyo area Kobe-Osaka-Kyoto areaNagoya area Other regions
Daiwa House Industry (non-consolidated)
breakdown of number of condominiums by region
Regional breakdown for whole of Japanese
condominium industry
Orders 2003 2002 2001 2000 1999Condominium orders received (Units) 3,333 3,864 1,409 620 560Condominiums sold (Units) 3,669 4,143 1,009 429 522
Condominiums
Housing
30

Also moving into newly expandinggrowth fi elds
The market for newly built houses is maturing, while the closely allied renovation and intermediary service markets are expanding.
Renovation business A 1.07 million-unit base for ongoing expansion
The renovation market totaled ¥7,368.4 billion in 2002, and is projected to expand to
¥8,080 billion by 2005 and to ¥9,350 billion by 2010. In Japan the stock of 50.25 million
housing units exceeds the number of households, and the effective use of these has be-
come increasingly important. We have sold more than one million housing units, which
we classify as customer assets, and so in October 2000 we established an operating divi-
sion dedicated to the renovation business. The number of bases and staff are being in-
creased, and business is expanding. The number of personnel has been almost doubled
since April 2001 and we have built a network of 69 bases, giving almost complete nation-
wide coverage, and positioning us to make the optimum proposals to each individual
customer. Revenue of the division dedicated to the renovation business in the term un-
der review on a non-consolidated basis grew 70% year-on-year, to ¥16.9 billion.
Real estate intermediary servicesTaking advantage of the Group network
The nature of the market for used housing is becoming more diverse, as the lifespan of
newly built houses lengthens, and a certifi cation system for high-quality used condo-
miniums has been established. Intermediary services constitute an attractive fi eld for
the Daiwa House group, which with its comprehensive range of housing and lifestyle
businesses can take advantage of its sound reputation, the strength of our nationwide
network, and its capacity to act quickly. In the term under review there was a reorganiza-
tion of Group companies with the aim of enhancing operating effi ciency and establishing
a stronger base for the expansion of this business. It involved the integration of Daiwa
Jutaku Ryutsu and Daiwa Nichiju Hanbai into a single subsidiary, Nihon Jyutaku Ryutsu.
31

The number of buildings constructed under the LOC(Land Owner Company) system topped 21,000 and ordersincreased 4.5% to ¥225.0 billion, on a non-consolidated basis.
Construction investment in Japan fell below ¥60 trillion in fiscal 2002, to 67.3% of its peak level. However, in the term under review our orders grew by 4.5% on a non-consolidated basis, to ¥225.0 billion, and the number of buildings constructed under the LOC system topped 21,000, principally large-scale commercial facility complexes and retail outlets located in suburban areas, and commercial buildings in urban locations. Regrettably, on a consolidated basis our net sales fell by 4.9% to ¥248,014 million, and operating income was down by 3.9% at ¥17,631 million.
exceed 20,000Landowner customers
Commercial constructionCommercial construction
0
50
100
150
200
250
300
99 00 01 02 030
10
20
30
Net sales (left scale)Operating income (right scale)
Net sales / Operating income(Billions of yen)
0
1,000
2,000
3,000
4,000
00 01 02 03
(Millions of yen)
Number of employees (left scale)Operating income per employee (right scale)
Number of employees / Operating income per employee
0
2
4
6
8
10
32

Retail and wholesale facilities
Steel-pipe and general construction
Based on the conditions for property location and our market research and analysis, we undertake the coordination for an extensive range of facilities, including large-scale commercial facilities, roadside stores, showrooms, and amusement facilities. The number of our landowner customers now exceeds 20,000 nationwide, and companies that have opened facilities under this scheme number 3,140. We have 4,300 members of our landowners club, and 36,000 companies are on our waiting list to open facilities. In the term under review, large-scale commercial facilities we developed include Shonan Mall Fill, close to Tokyo, and the Ashibinaa outlet mall in Okinawa.
In the sphere of factories and office buildings, goods-distribution centers, and a wide range of other business facilities, we have achieved a strong track record in buildings that require special designs considerations, for example HACCP (Hazard Analysis and Critical Control Point)-certified food processing centers and hospitals and other medical-care facilities. In the field of nursing and health-care facilities, which are increasing sharply with the aging of society, we have become market leaders, having constructed more than 700 of these facilities under the auspices of the Daiwa House Silver Age Research Center.
0
20
40
60
80
99 00 01 02 03
Value of private and public investment in construction, and floorspace of commercial premises
Government construction investment (left scale)Private construction investment (left scale)Floorspace of commercial construction starts (right scale)
(10,000 m2)(Trillions of yen)
4,000
5,000
6,000
7,000
Note: floorspace of buildings on which construction was commenced 0
20
40
60
80
100
00 01 0302
Ratio of interest-bearing debt to net sales
Daiwa House groupMajor construction companiesAll-industry average
(%)
Group homes & day service facilities: 39%Health facilities for senior citizens; special nursing homes and Care houses for the aged: 12%Private nursing homes for the aged: 14% Hospitals and clinics: 35%
Facilities planned by Silver Age Research Center
(as of end of March 2003)
716 cases
33
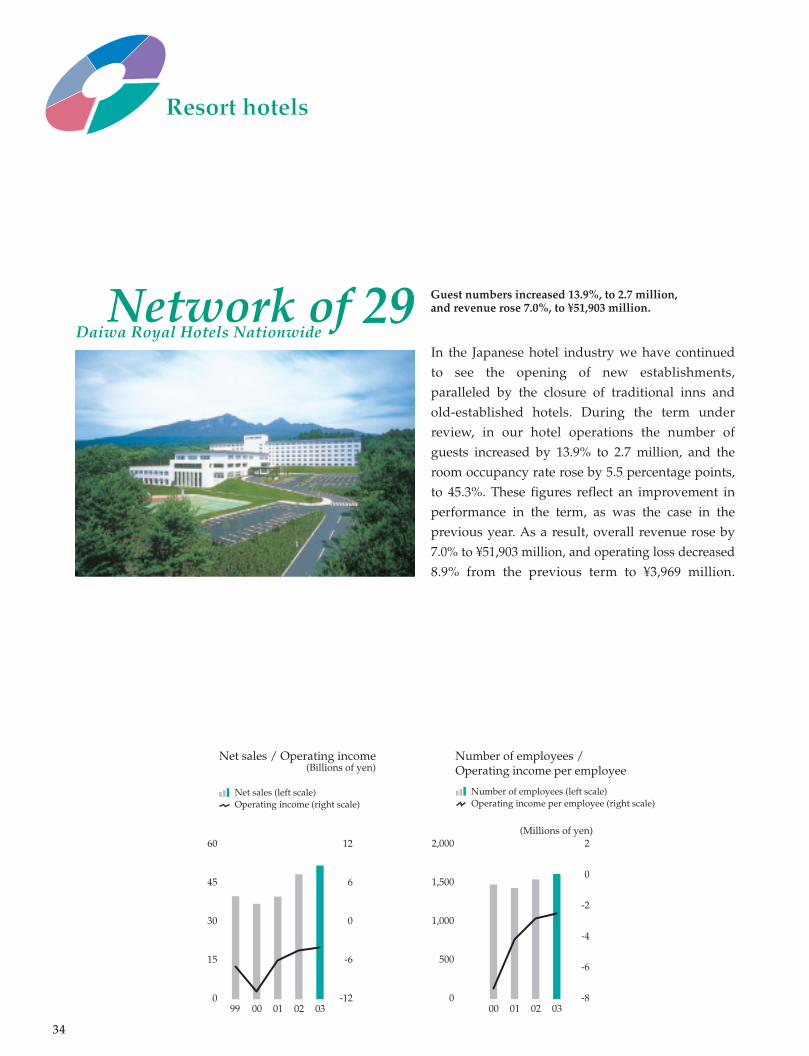
Guest numbers increased 13.9%, to 2.7 million, and revenue rose 7.0%, to ¥51,903 million.
In the Japanese hotel industry we have continued to see the opening of new establishments, paralleled by the closure of traditional inns and old-established hotels. During the term under review, in our hotel operations the number of guests increased by 13.9% to 2.7 million, and the room occupancy rate rose by 5.5 percentage points, to 45.3%. These figures reflect an improvement in performance in the term, as was the case in the previous year. As a result, overall revenue rose by 7.0% to ¥51,903 million, and operating loss decreased 8.9% from the previous term to ¥3,969 million.
Network of 29Daiwa Royal Hotels Nationwide
Resort hotelsResort hotels
0
15
30
45
60
99 00 01 02 03
Net sales (left scale)Operating income (right scale)
Net sales / Operating income(Billions of yen)
-12
-6
0
6
12
0
500
1,000
1,500
2,000
00 01 02 03
(Millions of yen)
Number of employees (left scale)Operating income per employee (right scale)
Number of employees / Operating income per employee
-8
-6
-4
-2
0
2
34

In our hotel operations we placed emphasis on individuality, devising plans unique to each hotel to cover accommodations, meals, and banquets and other functions. With re-spect to accommodations we refined our Internet reservation system and took active steps to attract more guests from overseas, with the result that the number of foreign guests rose to around 180,000, accounting for 6.5% of the total. Meanwhile the resort wedding business was buoyant, and we continued with the building of wedding chapels to cater to this mar-ket. The number of users of our wedding services rose by a substantial 16.1%, to 207,222. In regard to sales of goods, deliveries of traditional Japanese Osechi ryori New Year dishes to people’s homes were brisk, our hotels selling an aggregate number of about 18,000 meals containing large proportions of local delicacies, up by 40% from the previous year.In the golf course business, customized planning for each course was enhanced, including by improving the Internet reservation system and introducing a new system of green fees that vary according to the day of the week and time of day. In consequence, the number of course users increased by 2.9% to 367,237, though as the average fee per user was lowered by 8.4% to ¥12,387, total revenue from this business fell by 5.4% to ¥4,727 million.
0
1,000
2,000
3,000
99 00 01 02 03
Number of guests and room occupancy rates
Japanese guests (left scale)Foreign guests (left scale)Room occupancy rate (right scale)
(%)(Thousand)
0
10
20
30
40
50
0
150
300
99 00 01 02 03
Number of wedding facility users and number of chapels
(Thousand)
Wedding facility users (left scale)Chapels (right scale)
0
15
30
35

Number of store visits up 21.1% at 20,430 thousandand sales up 14.7% at ¥52,159 million.
The home center business is a growth field within the retailing sector in Japan. During the term we opened four new stores and closed two existing ones that were insufficiently profitable, in order to enhance the efficiency of store operations. Aggregate floor space was expanded by 13.7% to 166,239 square meters, and the number of store visits during the term grew by 21.1%, topping 20 million for the first time. As a result, annual sales rose by a substantial 14.7% year-on-year, to ¥52,159 million, and operating income grew by 1.4% to ¥305 million.
Home center businessHome center business
38 Royal Home Centersthroughout Japan
0
15
30
45
60
01 02 03
(Billions of yen)
Net sales (left scale)Operating income (right scale)
Net sales / Operating income
Note: As a result of a reorganization of business segments in the previous term, figures for the Home center business, which had been included in “Other businesses” up to fiscal 2000, are shown separately from fiscal 2002.-2
-1
0
1
0
100
200
300
400
500
600
0201 03
(Millions of yen)
Number of employees (left scale)Operating income per employee (right scale)
Number of employees / Operating income per employee
-4
-3
-2
-1
0
1
2
3
36

Our home centers stock an average of 50,000 products, well above the industry average in Japan of approximately 31,000 items. These range from interior and exterior goods to gar-dening and outdoor products, pet supplies, leisure goods, and daily necessities, and in-clude many environmentally friendly items with Ecomark certification and private-brand products. DIY is given strong emphasis, with an extensive range of items both for the gen-eral user as well as materials and tools for professionals. A characteristic of our stores is the large number of carpenters and other building professionals who use them.We also took steps to cater to the burgeoning renovation market. We stepped up the dis-play and sale of household fixtures and fittings, and advisory services in which customers receive advice from experts in fields such as building, interiors, and garden design.We intend to continue to expand this business into a 50-store network by fiscal 2005. This will be distinguished from rival stores by offering a product range that takes advantage of the economies of scale of a nationwide chain, but at the same time being managed in a way that ensures that each center is attuned to the needs of the locality it serves.
0
50,000
100,000
150,000
200,000
01 02 03
Number of home centers and floorspace
(m2)
0
20
40
60
Floorspace (left scale)Number of home centers (right scale)
0
10,000
20,000
30,000
01 02 03
Number of customers and average sales per customer
Customers (left scale)Sales per customer at RHC (right scale)Industry average sales per customer (right scale)
(Thousand) (¥)
0
1,000
2,000
3,000
4,000
Furnishings, furniture, appliances, daily goods: 37%
DIY goods: 22%
Gardening goods: 16%
Pet supplies, sports goods, leisure goods: 15%
Others: 10%
Breakdown of sales at Royal Home Centers
Sale of goods: 96.7%
Home renovation services: 3.3%
(FY2002)
37

Temporary staffing services
Advertising agency
Software development
Operation of city-centerhotels
Parking lot services
Moving services
Operation of Super sento bathhouses
Travel agency
Insurance agency
Facilities for the elderly
Bookstore chainProduction of construction
materials
Logistics services
Operation of convention
centers
EnergyService
Company
15 business categoriesOperating income rose 2.1% to ¥2,573 million, on sales of ¥97,117 million, up 8.8%.
In 2002, among household fi nances the rate of increase in spending on services reached 5.3 times the level of spending
on goods, and a large proportion of spending on goods was in the spheres of education, entertainment, and communi-
cations, to individualize and enhance lifestyles. This had a strong bearing on this business segment.
Among these totals, Daiwa Rakuda Industry, which engages in the manufacture of construction materials and sale
of furniture, devoted particular efforts to sales of interior goods such as original curtains and folding room dividers,
and exterior goods such as balconies. This resulted in 3.9% growth in net sales, to ¥38,232 million, and a 1.6% increase
in operating income, which reached ¥880 million. Meanwhile Daiwa Logistics, which engages in goods distribution,
implemented measures such as the amalgamation or closure of temporary warehouses and the relocation of distribution
centers. As a result, it was able to improve its performance in contrast to the general sluggishness in the transportation
industry, posting net sales of ¥23,078 million, up by 6.7% year-on-year, and operating income of ¥1,089 million, up by 2.6%.
In addition Yamatonoyu, which operates Super sento bathhouses, opened four new outlets during the term, bringing its
network to a total of 13 directly-managed outlets, the largest in its industry. The average number of visitors to each of these
complexes reached some 37,000 per month, marking another year of consistent growth since the company’s establishment.
0
30
60
90
120
01 02 030
1
2
3
(Billions of yen)
Net sales (left scale)Operating income (right scale)
Net sales / Operating income
0
1,000
2,000
3,000
00 01 02 03
(Millions of yen)
Number of employees (left scale)Operating income per employee (right scale)
Number of employees / Operating income per employee
0
0.5
1.0
1.5
2.0
2.5
Other businesses
38


DAIWA HOUSE INDUSTRY CO., LTD.3-3-5 Umeda, Kita-ku, Osaka 530-8241Phone: +81-6-6346-2111URL: www.daiwahouse.co.jp
DAIWA LOGISTICS CO., LTD.Transportation of goods; warehousing; logistics services1-5-16 Awaza, Nishi-ku, Osaka 550-0011Phone: +81-6-4968-6355URL: www.daiwabutsuryu.co.jp
DAIWA INFORMATION SERVICES CO., LTD.Land development; management of commercial facilities7-14-4 Ueno, Taito-ku, Tokyo 110-0005Phone: +81-3-5828-8891URL: www.dis-net.jp
LOC DEVELOPMENT CO., LTD.Development and management of shopping centers7-14-4 Ueno, Taito-ku, Tokyo 110-0005Phone: +81-3-5828-5501URL: www.loc-kaihatsu.co.jp
DAIWA KOSHO LEASE CO., LTD. Leasing of buildings and vehicles5-20 Honmachibashi, Chuo-ku,Osaka 540-0029Phone: +81-6-6942-8011URL: www.daiwakosho.co.jp
DAIWALIVING CO., LTD.Management of rental housing3-13-1 Iidabashi, Chiyoda-ku,Tokyo 102-0072Phone: +81-3-5214-2330URL: www.daiwaliving.co.jp
NIHON JYUTAKU RYUTU CO., LTD.Real estate agency (including property management, asset appraisal, housing renovation, etc.)1-1-3-800 Umeda, Kita-ku, Osaka 530-0001Phone: +81-6-6344-6356URL: www.jyutaku.co.jp
ROYAL HOME CENTER CO., LTD.Sale of DIY, gardening, and interior goods3-3-5 Umeda, Kita-ku, Osaka 530-0001Phone: +81-6-6342-1676URL: www.royal-hc.co.jp
DAIWA RAKUDA INDUSTRY CO., LTD.Sale of household equipment and furniture; insurance agency 1-5-16 Awaza, Nishi-ku, Osaka 550-0011Phone: +81-6-6536-6111URL: www.daiwarakuda.co.jp
DAIWA SERVICE CO., LTD. Management of office & condominium buildings; staff dispatch; house-moving service1-5-16 Awaza, Nishi-ku, Osaka 550-0011Phone: +81-6-6536-6270URL: www.daiwaservice.co.jp
DAIWAROYAL CO., LTD. Rental of commercial facilities; hotel operations 7-14-4 Ueno, Taito-ku, Tokyo 110-0005Phone: +81-3-3844-8357URL: www.daiwaroyal.com
DAIWARESORT CO., LTD. Management of hotels and golf courses3-3-5 Umeda, Kita-ku, Osaka 530-0001Phone: +81-6-6342-1731URL: www.daiwaresort.co.jp
O t h e r sSHINWA AGENCY CO., LTD. (Advertising and travel agency), DAIWA TECHNICA CO., LTD. (Manufacture and sale of household equipment), NIC CO., LTD. (Manufacture of interior doors), DAIWA ENERGY CO., LTD. (Energy conservation support), MEDIA TECH INC. (Information systems), JUKEIKAI Co., Ltd. (Operation of homes for the aged), NARA ACE CO., LTD. (Management of golf courses), TECH •R&DS CO., LTD. (Market research), SYNCHROLLER CO., LTD. (Manufacture of housing materials), DAIWA ESTATE CO., LTD. (Real estate agents), GREENFARM KAIHATSU CO., LTD. (Sale of tomatoes)
O v e r s e a s a f f i l i a t e d c o m p a n i e sSHANGHAI HAPPY HOUSE DECORATION CO., LTD. (Design and installation of housing interiors), DH (DALIAN) ADMINISTRATIVE MANAGEMENT CONSULTING CENTER CO., LTD. (Clerical work outsourcing provider), SHANGHAI INTERNATIONAL REALTY CO., LTD. (Management of rental housing), BEIJING EAST PALACE APARTMENT CO., LTD. (Management of rental housing), DALIAN ACACIA TOWN VILLA CO., LTD. (Management of rental housing), DALIAN FUJIAZHUANG INTERNATIONAL VILLA CO., LTD. (Management of rental housing), TIANJIN JIUHE INTERNATIONAL VILLA CO., LTD. (Management of rental housing), DALIAN CIVIL AVIATION HOTEL CO., LTD. (Management of Royal Hotel at Dalian), BENCHMARK-TECH CORPORATION (Management of conference center)
P r i n c i p a l g r o u p c o m p a n i e s
H o u s i n g s a l e s c o m p a n i e sDAIWAHOUSE KANSAI CORPORATION6 other companies
39

New targets drafted for stricter environmental managementDaiwa House Industry had previously been pursuing targets for the reduction of the environmental burden of its corporate activities under a plan covering the 5-year period from the term ended March 31, 2001 to the term ending March 31, 2005 (term ending March 31, 2006 for the fi nal waste materials dis-posal target only). As a result of the merger with Daiwa Danchi Co., Ltd. in April 2001, we have drawn up a new, three-year plan with targets based on the fi scal 2001 fi gures as the new benchmarks, to further strengthen our environmental burden reduction initiatives.
0
100
200
300
400
FY 00 01 02 04Target
CO2 emissions (kg-CO2)*1
0.00
0.04
0.08
0.12
0.16
FY 00 01 02 04Target
Energy used (kl)*2
0.0
1.5
3.0
4.5
6.0
FY 00 01 02 04Target
Water used (m3)*3
Final waste disposal rate (%)
0
15
30
45
60
FY 00 01 02 05Target
Notes: 1. Figures for FY 2000 are for Daiwa House alone, prior to the merger with Daiwa Danchi. 2. The quantities in the graphs marked *1, *2 and *3 are numerical values per non-consolidated sales of ¥1 million.
2002 Performance 0.139kl
2004 Target0.112kl
23%down
2002 Performance
322.61kg-CO2
2004 Target
248.26kg-CO2
2002 Performance
21.9%
2005 Target
0.0%
2002 Performance
4.41m3
2004 Target
3.96m3
19%down
10.2%down
21.9%down
point
Environmental measures
40

Focusing on housing in Japan today and tomorrowSurrounded by four tectonic plates, the Japanese archipelago is an earthquake-prone zone crisscrossed by as many as 2,000
active faults in an area of only 377,800 square kilometers. In recent years it has experienced serious earthquakes of mag-
nitude 7 or above. Earthquake resistance and earthquake proofi ng in homes and other buildings are thus vital objects of
research for the purpose of saving lives and preventing property damage.
Japan also lies in the path of heavy rain and high winds caused by typhoons. In consequence, another important focus is
that of giving buildings resistance to wind, and making them airtight and watertight.
Primarily through our Central Research Laboratory, we are working to enhance the structures and capabilities of hous-
ing so that it can resist direct assaults by the forces of nature. Our focus is that of improving products and technologies by
means of experiments to confi rm the performance of our products with the use of facilities such as full-size experimenta-
tion chambers able to reproduce a variety of climatic conditions; equipment for testing environmental factors such as the
ground, the strength of materials, light, heat, and sound; and trial structures for which actual dwellings are used.
Research is also conducted into the space within dwellings, and into next-generation housing adapted for compatibility
with the immediate environment, and incorporating energy conservation and information technology features. In ways
such as these we undertake comprehensive research into the house and home as it is today and it will become tomorrow.
0
200
400
600
01Jan.-Mar. Apr.-Jun. Jul.-Sep. Oct.-Dec. Jan.-Mar. Apr.-Jun. Jul.-Sep. Oct.-Dec.
02
Number of perceptible earthquakes
(Times)
Paths of typhoons(Solid lines—most common; dotted lines—less common)
Research and development
41

0
10
20
30
40
01 02 03
HotelsHome centers
Daiwa Royal Hotels / Royal Home Centers
0
5,000
10,000
15,000
20,000
01 02 03
Number of employees of Daiwa House group / Number of branch offices of Daiwa House
Daiwa House (left scale)Daiwa House group (left scale)Daiwa House branch offices (right scale)
0
20
40
60
80
100
* Daiwa Resort Co., Ltd. also manages the Royton Sapporo, and the Lake Yamanaka Fujisan Royal Cottages. It also operates a branch office in Seoul (marked with ).
Head office
Tokyo office
Branches: 84
Factories: 13
* The above places of business are directly operated by Daiwa House.
Daiwa Royal Hotels: 29
Royal Home Centers: 39
Overseas affiliates: 9
Group networkAs of June 1, 2003
Group network
42

43

Daiwa House Industry Co., Ltd. established; first house model, the “Pipe House,” launched on market
Steel pipe structure used for warehouse at sake brewery — receives certification from Japan Lightweight Iron Construction Association as first such structure in Japan
Daiwa Kosho (current Daiwa Kosho Lease Co., Ltd.) and Daiwa Konpo (current Daiwa Logistics Co., Ltd.) established; “Midget House” pilot prefabricated house model launched on market
Daiwa Danchi established (merged with Daiwa House in April 2001); stock listed on Osaka, Tokyo and Nagoya stock exchanges
Nara Factory constructed, Japan’s first specialist plant for production of prefabricated houses
Daiwa Jutakukiki (current Daiwa Rakuda Industry Co., Ltd.) established
Resort hotels business started with opening of Noto Royal Hotel
Tentakubin (current Daiwa Service Co., Ltd.) established
First Royal Home Center opened in Nara City
Full-scale start of construction business in China at Shanghai, Dalian, and elsewhere
Daiwa Information Services Co., Ltd. established
Daiwaliving Co., Ltd. established
Daiwa House Central Research Laboratory opened in Kansai Science City
Daiwa House Industry Co., Ltd. merged with Daiwa Danchi Co., Ltd.
1955
1957
1959
1961
1965
1971
1978
1979
1980
1983
1986
1989
1994
2001
Founding:
Paid-in capital:
Employees:
Head office:
Tokyo office:
Branches:
Factories:
Research center:
Training centers:
April 5, 1955 (Establishment: March 4, 1947)
¥110,120,483,981
11,750
3-3-5 Umeda, Kita-ku, Osaka 530-8241
Phone: +81-6-6346-2111
3-13-1 Iidabashi, Chiyoda-ku, Tokyo 102-8112
Phone: +81-3-5214-2111
84
13
Central Research Laboratory (Nara city)
Osaka, Tokyo and Nara
(As of April 1, 2003)
Daiwa House corporate data
The history of the Daiwa House group
44

45
Note: In the financial statements, the names given to our business segments are abbreviated as follows:Housing: Residential Commercial construction: Commercial Resort hotels: Resort Home center business: Home Center Other businesses: Other
Consolidated seven-year summary
Management’s discussion and analysis
Consolidated balance sheets
Consolidated statements of operations
Consolidated statements of shareholders’ equity
Consolidated statements of cash flows
Notes to consolidated financial statements
Independent auditors’ report
C o n t e n t s
46
47
52
54
55
56
58
75

Consolidated seven-year summaryDaiwa House Industry Co., Ltd. and SubsidiariesYears ended March 31, 1997 to 2003
46
Millions of yen
2003 2002 2001 2000 1999 1998 1997
Net sales ¥1,184,544 ¥1,197,925 ¥1,016,237 ¥ 951,073 ¥ 896,006 ¥1,069,789 ¥1,188,295
Cost of sales 936,861 945,474 794,170 736,310 691,318 834,407 922,387
Selling, general and administrative expenses 202,411 206,420 177,777 167,266 164,473 186,932 182,019
Operating income 45,272 46,031 44,290 47,497 40,215 48,450 83,889
Income (loss) before income taxes and minority interests (155,157) 9,538 12,796 32,123 21,414 48,685 75,601
Net income (loss) (91,388) 5,217 6,256 17,450 16,699 20,373 42,452
Per share of common stock (in yen):
Basic net income (loss) (167.06) 9.55 12.05 33.52 31.88 38.89 82.76
Diluted net income 33.50 37.91 79.89
Shareholders’ equity 884.55 1,066.63 1,182.01 1,188.63 1,151.12 1,136.55 1,115.04
Property, plant and equipment,less accumulated depreciation 349,646 426,630 383,853 376,489 365,502 346,543 338,166
Total assets 1,094,441 1,187,127 1,066,457 981,893 950,701 1,013,072 1,145,944
Shareholders’ equity 483,684 582,438 613,867 617,421 603,060 595,429 584,157
Return on equity (%) (18.89) 0.85 1.02 2.86 2.79 3.42 7.27

47
Management’s discussion and analysis (on a consolidated basis)
Operating environment and financial strategyThe business environment remained diffi cult in Japan in the
term under review. The economy became increasingly in the
grip of defl ation, with no sign of any improvement in the em-
ployment situation and both consumer spending and corporate
capital investment remaining sluggish.
In the housing industry, the number of new construction starts
remained below the 1.2 million level for the second straight
year, and, more crucially, hit a 19-year low. In addition, owner-
occupied housing starts fell particularly steeply, by 3.1% year-
on-year to below the 370,000 mark. General construction, too,
was generally weak against the backdrop of stagnant private-
sector capital investment and continued curtailment of public
works spending.
In the face of this business environment, the Daiwa House
group has put priority on further strengthening its fi nancial
position. Particular emphasis was put on ensuring a return to
fi nancial health in the term under review, to which end we
implemented an extraordinary depreciation of tangible assets
as well as the lump-sum amortization of the transitional ob-
ligations and actuarial losses on retirement benefi ts. A major
reduction was also effected in the interest-bearing liability bur-
den, with Daiwa House Industry paying off all interest-bearing
debt on a non-consolidated basis.
.
Results of operationsNet salesNet sales for the term ended March 31, 2003 decreased 1.1%
from the previous term to ¥1,184.5 billion (US$9,871.2 million);
this was mainly attributable to a decline in new housing starts
of 1,146 thousand, the lowest for 19 years, against the backdrop
of prolonged stagnation in Japan. By segment, Housing opera-
tions (including inter-segment transactions), declined 1.7% to
¥791.9 billion (US$6,599.8 million), and Commercial construc-
tion operations declined 4.9% to ¥248.0 billion (US$2,066.7
million). While Resort hotels operations rose 7.0% to ¥51.9
billion (US$432.5 million), Home center operations rose 14.7%
to ¥52.1 billion (US$434.6 million), and Other businesses rose
8.8% to ¥97.1 billion (US$809.3 million). Declines in our main-
stay businesses, Housing and Commercial construction opera-
tions, had a signifi cant effect on the total sales.
Cost of sales, and selling, general and administrative expensesCost of sales decreased ¥8.6 billion (US$71.7 million) from the
previous term to ¥936.8 billion (US$7,807.1 million), while its
ratio to sales rose 0.2 percentage points to 79.1% due to an in-
crease in direct expenses.
Selling, general and administrative expenses decreased ¥4.0 bil-
lion from the previous term to ¥202.4 billion (US$1,686.7 mil-
lion), and their ratio to sales fell 0.2 percentage points to 17.1%,
thanks to a reduction in expenses for advertising and sales com-
missions, despite a slight increase in personnel expenses.
0
300
600
900
1,200
99 00 01 02 03
Net sales(Billions of yen)
0
15
30
45
60
99 00 01 02 03
Operating income(Billions of yen)
-100
0
5
10
15
20
99 00 01 02 03
Net income (loss)(Billions of yen)

48
Operating incomeAlthough operating income declined 1.7% from the previous
term to ¥45.2 billion (US$377.2 million) in line with a decline
in sales, its ratio to sales came to 3.8%, virtually the same as
the previous term.
Analysis of operations by segment is as follows.
(Segment sales amounts prior to elimination of inter-segment
transactions were used in the following analysis.)
Sales of Housing operations fell ¥14.0 billion, or 1.7%, from
the previous term. However, we were rather satisfi ed with the
results, taking into account the decline in new housing starts
nationwide by 2.3% from 1,173 thousand for the previous term
to 1,146 thousand. We attributed this relatively favorable result
to organizational reform including an expansion in the num-
ber of sales offi ces and of the marketing system to meet local
needs more precisely, as well as a change in product strategy to
more accurately meet customer needs. Under this, for example,
we offered solar power systems and high-insulation houses for
residents in districts with particularly cold winters. Regarding
condominiums, we focused on small condominiums in urban
districts to take advantage of the trend in which the central
areas of the nation’s metropolises are once again becoming
popular places to live.
The number of rental apartment units sold by us increased
8.8% on a non-consolidated basis over the previous term,
against the backdrop of a rising need by landowners to more
effectively use their landholdings. This trend results from the
lack of favorable investment targets for fi nancial assets due to
the continued low level of interest rates and the termination of
unlimited government guarantees on time deposits.
As a result, sales of Housing operations amounted to ¥791.9
billion. Operating income decreased ¥3.7 billion to ¥39.1 bil-
lion, and its ratio to sales fell 0.4 percentage points to 4.9%.
Sales of Commercial construction operations fell ¥12.7 billion,
or 4.9%, from the previous term. During the term, we focused
on communal dwellings for senior citizens incorporating our
extensive know-how in medical and care facilities, as well as
large-scale logistics facilities and shopping malls utilizing a
nation-wide network of landowners and tenants. Floor space
for rental use and the number of tenants were beginning to
decline amidst weak consumer spending and sluggish capital
investment. As a result, sales of Commercial construction op-
erations came to ¥248.0 billion and operating income declined
¥0.7 billion to ¥17.6 billion. The ratio of operating income to
sales, however, improved 0.1 percentage points over the previ-
ous term to 7.1%, the highest fi gure among the segments.
Resort hotels operations sales rose ¥3.4 billion, or 7.0%, over
the previous term. The increase was mainly attributable to rises
both in the number of guests and in room occupancy rates
thanks to an improvement in Internet reservation systems for
resort hotels and enhancement of marketing channels, which
resulted in a rise in the number of foreign guests. We attracted
more customers for our wedding facilities compared with the
previous term thanks to an increase in the number of chapels
within the resort hotels.
Revenues from golf club operations fell from the previous term,
due to a decline in revenue per customer refl ecting a general
price decline.
As a result, Resort hotels operations sales came to ¥51.9 billion.
We posted an operating loss of ¥3.9 billion, lower than the pre-
vious term.
0
2
4
6
8
10
99 00 01 02 03
Operating profit margin(%)
-170
0
10
20
30
40
99 00 01 02 03
Basic net income (loss) per share(Yen)

49
Home center operations sales far exceeded the previous term’s
result by ¥6.6 billion, up 14.7%, thanks mainly to an increase in
the number of outlets by two. It is undeniable that an increase
in revenue for this business segment depends largely on the
opening of new outlets. However, we expect to differentiate
ourselves from our competitors by taking advantage of our
expertise in housing construction. The Home center opera-
tions, therefore, is useful for achieving synergy with the Hous-
ing operations. As a result, the Home center operations sales
amounted to ¥52.1 billion and operating income to ¥0.3 billion,
almost same as the previous term. Its ratio to sales fell 0.1 per-
centage points to 0.6%.
The Other businesses segment consists of a wide variety of
businesses including construction materials manufacturing,
logistics, hotel operations in urban areas. Sales for the seg-
ment rose ¥7.8 billion, or 8.8%, over the previous term. We are
making efforts to improve the management effi ciency of our
logistics operations through transfer, merger and consolidation
of branches. The number of urban-type hotels came to eight
as of the term end, and is expected to increase still further. We
are focusing on the development of price-competitive, value-
added construction material products. As a result of the above,
sales of the segment came to ¥97.1 billion and its ratio of oper-
ating income to sales fell 0.2 percentage points to 2.6%.
Other income and expensesDue to our bold management decisions to implement a large-
scale lump-sum amortization of liabilities on retirement ben-
efi ts and total elimination of unrealized losses on land and
securities holdings, we posted net other expenses of ¥200.4 bil-
lion. Other income came to ¥21.2 billion, up ¥12.5 billion, and
other expenses to ¥221.6 billion, up ¥176.4 billion. The increase
in other income was mainly attributable to gains on amortiza-
tion of prior service obligations resulting from revisions on
regulations for retirement benefi ts, and the termination of
agency service for the state-run employee pension fund. These
measures were taken in line with fundamental reform of our
retirement benefi t system, and were necessary for improving
our fi nancial position regarding pensions.
On the other hand, the increase in other expenses was at-
tributable to lump-sum amortization of retirement benefi t
obligations and total elimination of unrealized loss on land for
resale and other property, and securities. We chose lump-sum
amortization and total elimination as we judged that they were
crucial for rebuilding a sound fi nancial position preparatory to
future expansion. Alongside pension obligations, unrealized
losses were recognized on 1) real estate for operations and real
estate for sale, and 2) securities and investments in affi liated
companies. Regarding retirement benefi ts, we amortized in
lump-sum ¥90.3 billion, consisting of unrecognized actuarial
loss of ¥49.8 billion, actuarial loss resulting from changes in
discount rates used for calculation of present value of pension
assets of ¥31.7 billion and transitional obligations of ¥8.7 bil-
lion. For real estate for operations and real estate for sale, we
carried out extraordinary depreciation of ¥75.1 billion on real
estate for hotel, golf-club and rental use with large reduction
in asset value, and posted valuation losses of ¥22.9 billion on
land and buildings. We also posted losses of ¥9.8 billion on sale
and valuation on securities and of ¥2.9 billion on liquidation of
subsidiaries and affi liates.
0
20
40
60
80
99 00 01 02 03
Fixed ratio(%)
0
1
2
3
4
99 00 01 02 03
Fixed asset turnover ratio(%)

50
Net income As mentioned previous sections, we posted ¥200.4 billion un-
der net other expenses for the term. As a result, we registered a
loss before income taxes of ¥155.1 billion and net loss of ¥91.3
billion under tax effect accounting.
Liquidity and Capital Resources Financial positionTotal assets decreased ¥92.6 billion, or 7.8%, during the term to
stand at ¥1,094.4 billion (US$9,120.3 million) at the term end.
Current assets and property, plant and equipment decreased
¥74.5 billion and ¥76.9 billion from the previous term end, re-
spectively. Among current assets, a signifi cant decline was seen
in cash and cash equivalents, and in land held for resale under
inventories. Reduced amounts in cash and cash equivalents
were used for repayment interest-bearing liabilities to secure a
sound fi nancial position. The decline in land held for resale was
largely attributable to the posting of valuation losses. Invento-
ries, which consisted of construction projects in progress, land
and buildings held for resale, and other inventories, declined
¥31.2 billion to ¥267.1 billion.
Among property, plant and equipment, the decline in buildings
and structures was notable, due to extraordinary depreciation
on properties with signifi cant decline in asset values belong-
ing to hotels and golf clubs, and other properties. As a result,
buildings and structures declined ¥76.5 billion to ¥121.6 billion.
Regarding land for business use, we carried out a one-time
revaluation of own-use land in accordance with the revisions
to the “Law on Land Revaluation,” in the previous term. While
investment securities declined due to the posting of valuation
losses, investments and other securities as a whole increased,
mainly due to an increase in deferred tax assets.
With regard to liabilities and shareholders’ equity, current as-
sets decreased ¥75.9 billion as a result of the repayment of
short-term bank loans to secure a sound fi nancial position.
Interest-bearing liabilities (including bonds and long-term loans
posted under long-term liabilities) stood at only ¥6.0 billion at
the term end, which was equivalent to 0.6% of total assets. On
a non-consolidated basis, the Company held no interest-bearing
liabilities. Trade notes and accounts payable increased due to the
balance sheet date falling on a bank holiday. The current ratio
rose to 174.2% from 157.5% at the previous term end, which, in
our opinion, represented a suffi cient level of liquidity.
Long-term liabilities increased ¥83.1 billion, which was attrib-
utable to provisions for employees’ retirement benefi ts in line
with a thorough reform of the retirement benefi ts system at the
parent company in accordance with introduction of a new pen-
sion accounting system.
Shareholders’ equity decreased ¥98.7 billion to ¥483.6 billion
(US$4,030.7 million) due to a deduction in retained earnings
resulting from the posting of a huge net loss. The equity ratio,
however, declined 4.9 percentage points to 44.2%, which, in
our opinion, was suffi cient for a sound fi nancial position.
Cash flows Cash and cash equivalents decreased ¥44.5 billion, or 30.0%,
during the term, and stood at ¥103.9 billion (US$866.2 mil-
lion) at the term end. Net cash provided by operating activi-
ties amounted to ¥40.4 billion (US$337,1 million, down ¥46.5
billion, or 53.5%, from the previous term. Net cash used in
investing activities came to ¥27.3 billion (US$227.6 million),
down ¥8.9 billion, or 24.6%. Net cash used in fi nancing activi-
ties amounted to ¥57.7 billion (US$480.9 million), a decrease of
¥31.8 billion, or 35.5%, from the previous term.
0
100
200
300
400
99 00 01 02 03
Current ratio(%)
0
20
40
60
80
99 00 01 02 03
Shareholders’ equity/total assets(%)
0
300
600
900
1,200
99 00 01 02 03
Shareholders’ equityper share(Yen)

51
The decline in net cash infl ows from operating activities was
mainly attributable to the posting of a large loss before income
taxes. Losses on retirement benefi ts and extraordinary amorti-
zation expenses, however, did not contribute to the decline, as
these items had no effect on cash fl ows. Another contributing
factor in the decrease in the cash infl ow was the large decline
in trade notes and accounts payable. This, however, was attrib-
utable to the balance sheet date falling on a bank holiday. The
de facto decline, therefore, was much smaller. The decline in
cash outfl ows from investing activities was attributable to a de-
cline in the acquisition of property and equipment for new fa-
cilities. The net cash outfl ow from fi nancing activities declined
despite a reduction in interest-bearing liabilities as part of an
ongoing program to improve the Group’s fi nancial soundness
(the parent company itself has already achieved zero interest-
bearing liabilities).
As a result, free cash fl ow (combined cash fl ows of operating
and investing activities) amounted to ¥13.1 billion, down ¥37.6
billion from the previous term.
OutlookFor the current business term, the fi scal year ending March 31,
2004, although some bright economic indicators have been
seen, unemployment is expected to remain high and pay levels
are likely to weaken. The overall outlook for the Japanese econ-
omy is thus projected to remain gloomy, taking into account
the various unstable factors in the world economy.
For the current term, the construction industry will enjoy the
plus factor of an expansion in the framework for application of
tax-exempt status for donations of property. However, taking
into account the disposable income situation, which refl ects the
lack of any improvement in employment conditions, housing
investment is likely to remain weak, leading to even fi ercer
competition among construction companies.
To cope with this diffi cult business environment, the manage-
ment of Daiwa House will continue to pursue the Company’s
basic “customer fi rst” policy by working to produce a stronger,
leaner company through steps to cut expenses while improv-
ing our marketing, service provision and product development
capabilities-centered on a branch-based marketing system tai-
lored to the requirements of each individual region.
In our Housing operations, we plan to launch new single-
family house models on the market offering stronger anti-
burglary features. We will also step up our activities in the home
renovation market. In Commercial construction operations,
we will focus on medical and nursing care facilities to meet the
needs of the aging population. In our Resort hotels operations,
we will put even further efforts into providing unique services
that take full advantage of the particular features of each local-
ity. Finally, in our Home center operations, we plan to continue
opening new stores while expanding our lineup of product and
services in line with our aim of becoming a comprehensive life-
style enterprise.
As a result of the steps toward a return to fi nancial health taken
in the reporting period, including an extraordinary depreciation
of tangible assets as well as the lump-sum amortization of the
transitional obligations and actuarial loss on retirement ben-
efi ts, we expect to see a decline in depreciation expenses and in
costs related to retirement benefi ts in the current term, putting
us well on the way to realizing our goal of a tough and resilient
fi nancial position.
As a result of the foregoing, we anticipate net sales on a con-
solidated basis for fi scal 2003 of ¥1,220.0 billion, operating in-
come of ¥56.0 billion, and net income of ¥30.0 billion.
0
15
30
45
60
99 00 01 02 03-20
-15
-10
-5
0
5
99 00 01 02 03
Return on equity(%)
Free cash flows*(Billions of yen)
Free cash fl ows*=Cash fl ow from operating activities+Cash fl ow from investing activities

Consolidated balance sheetsDaiwa House Industry Co., Ltd. and SubsidiariesMarch 31, 2003 and 2002
52
Assets Thousands of Millions of yen U.S. dollars (Note 1)
2003 2002 2003
Current assets:
Cash and cash equivalents ¥ 103,950 ¥ 148,520 $ 866,250
Marketable securities (Note 4) 202 180 1,683
Short-term investments (Note 2-d) 133 1,599 1,108
Receivables:
Trade notes 7,238 9,071 60,317
Trade accounts 55,685 56,804 464,042
Allowance for doubtful receivables (1,972) (1,766) (16,433)
Inventories (Note 5) 267,199 298,424 2,226,658
Deferred tax assets (Note 12) 22,106 10,884 184,217
Prepaid expenses and other current assets 13,755 19,099 114,625
Total current assets 468,296 542,815 3,902,467
Property, plant and equipment:
Land (Notes 6 and 7) 212,312 208,811 1,769,267
Buildings and structures (Note 7) 380,978 371,018 3,174,817
Accumulated depreciation (259,286) (172,816) (2,160,717)
Machinery and equipment 51,264 52,531 427,200
Accumulated depreciation (42,205) (41,363) (351,708)
Furniture and fixtures 36,695 37,041 305,792
Accumulated depreciation (31,116) (29,875) (259,300)
Construction in progress 1,004 1,283 8,366
Net property, plant and equipment 349,646 426,630 2,913,717
Investments and other assets:
Investment securities (Note 4) 25,988 35,402 216,567
Investments in and advances to associated companies 25,900 28,817 215,833
Long-term loans 5,024 9,445 41,867
Deferred tax assets (Note 12) 100,123 28,444 834,358
Deferred tax assets on land revaluation (Note 6) 41,211 43,135 343,425
Lease deposits and other assets 87,589 77,422 729,908
Allowance for doubtful accounts (9,336) (4,983) (77,800)
Total investments and other assets 276,499 217,682 2,304,158
Total ¥1,094,441 ¥1,187,127 $9,120,342
See notes to consolidated financial statements.

53
Liabilities and shareholders’ equity Thousands of Millions of yen U.S. dollars (Note 1)
2003 2002 2003
Current liabilities:
Short-term bank loans (Note 7) ¥ 2,800 ¥ 54,000 $ 23,333 Current portion of long-term debt (Note 7) 1,000
Payables:
Trade notes 26,012 27,927 216,767 Trade accounts 90,890 146,846 757,417 Other accounts 58,639 35,482 488,658 Deposits received from customers 38,444 33,906 320,367 Income taxes payable 8,419 2,379 70,158 Accrued bonuses 9,769 10,099 81,408 Provision for product warranties 4,181 3,465 34,842 Accrued expenses and other current liabilities 29,657 29,622 247,142 Total current liabilities 268,811 344,726 2,240,092
Long-term liabilities: Long-term debt (Note 7) 3,237 2,000 26,975 Liability for employees’ retirement benefits (Note 3 and 8) 136,480 51,224 1,137,333 Long-term deposits received from the Company’s club members 64,243 67,721 535,358 Lease deposits and other long-term liabilities 115,229 115,103 960,242 Total long-term liabilities 319,189 236,048 2,659,908
Minority interests 22,757 23,915 189,642
Commitments and contingent liabilities (Notes 14, 15 and 16)
Shareholders’ equity (Notes 2-c, 2-m, 2-p, 6, 9 and 18): Common stock, authorized, 1,900,000,000 shares; issued,
550,664,416 shares in both 2003 and 2002 110,120 110,120 917,667 Capital surplus 147,755 147,755 1,231,292 Retained earnings 289,840 387,591 2,415,333 Land revaluation difference (60,409) (59,910) (503,408) Net unrealized gain on available-for-sale securities 777 1,358 6,475 Foreign currency translation adjustments (881) (809) (7,342) Treasury stock — at cost, 3,848,065 shares in 2003 and
4,610,098 shares in 2002 (3,518) (3,667) (29,317) Total shareholders’ equity 483,684 582,438 4,030,700 Total ¥1,094,441 ¥1,187,127 $9,120,342

54
Consolidated statements of operationsDaiwa House Industry Co., Ltd. and SubsidiariesYears ended March 31, 2003, 2002 and 2001
Thousands of Millions of yen U.S. dollars (Note 1)
2003 2002 2001 2003
Net sales ¥1,184,544 ¥1,197,925 ¥1,016,237 $9,871,200
Cost of sales 936,861 945,474 794,170 7,807,175Gross profit 247,683 252,451 222,067 2,064,025Selling, general and administrative expenses (Note 13) 202,411 206,420 177,777 1,686,758Operating income 45,272 46,031 44,290 377,267Other income (expenses): Interest income and dividends 546 569 796 4,550 Interest expense (723) (1,348) (299) (6,025) Write-down of marketable and investment securities (9,773) (16,956) (1,385) (81,442) Write-down of inventories (22,900) (5,994) (5,291) (190,833) Loss on sales and disposal of property, plant and equipment (3,488) (1,594) (543) (29,067) Prior service benefit from changes to employees’ retirement benefit plan (Note 8) 6,736 1,583 56,133 Amortization of transitional obligation for employees’ retirement benefits (Notes 2-h and 8) (8,780) (9,473) (9,198) (73,167) Contribution to employees’ retirement benefit trust (Notes 2-h and 8) (14,732) Amortization of actuarial loss for employees’ retirement benefi ts (Note 8) (4,925) (3,361) (41,042) Actuarial loss on retirement benefi ts (Notes 3 and 8) (49,888) (415,733) Actuarial loss due to a change of discount rate (Notes 3 and 8) (31,733) (264,441) Extraordinary depreciation for property, plant and equipment (Note 2-f) (75,183) (626,525) Other — net (Note 11) (318) 81 (842) (2,650) Other income (expenses) — net (200,429) (36,493) (31,494) (1,670,242)Income (loss) before income taxes and minority interests (155,157) 9,538 12,796 (1,292,975)Income taxes (Note 12): Current 17,792 8,633 22,268 148,267 Deferred (81,370) (4,913) (16,537) (678,083) Total (63,578) 3,720 5,731 (529,816)Minority interests in net (income) loss of subsidiaries 191 (601) (809) 1,592Net income (loss) ¥ (91,388) ¥ 5,217 ¥ 6,256 $ (761,567)
Yen U.S. dollars
Per share of common stock (Note 2-o):
Basic net income (loss) ¥ (167.06) ¥ 9.55 ¥ 12.05 $(1.39) Cash dividends applicable to the year 10.00 10.00 17.00 0.08
See notes to consolidated financial statements.

55
Daiwa House Industry Co., Ltd. and SubsidiariesYears ended March 31, 2003, 2002 and 2001
Consolidated statements of shareholders’ equity
Thousands Millions of yen
Issued Net unrealized Foreign number of Land gain on currency shares of Common Capital Retained revaluation available-for-sale translation Treasury common stock stock surplus earnings difference securities adjustments stock
Balance, April 1, 2000 523,893 ¥108,781 ¥122,041 ¥390,206 ¥(3,607) Net income 6,256 Cash dividends, ¥17.0 per share (8,831) Bonuses to directors and corporate auditors (37) Foreign currency translation adjustments (Note 2-m) ¥(927) Net increase in treasury stock (15) Balance, March 31, 2001 523,893 108,781 122,041 387,594 (927) (3,622) Issuance for merger with Daiwa Danchi Co., Ltd. (Note 17) 26,771 1,339 25,714 Retained earnings of Daiwa Danchi Co., Ltd. at April 1, 2001 3,663 Net income 5,217 Cash dividends, ¥17.0 per share (8,829) Bonuses to directors and corporate auditors (54) Land revaluation difference ¥(59,910) Net increase in unrealized gain on available-for-sale securities (Note 2-c) ¥1,358 Foreign currency translation 118 adjustments (Note 2-m) Net increase in treasury stock (45) Balance, March 31, 2002 550,664 110,120 147,755 387,591 (59,910) 1,358 (809) (3,667) Net loss (91,388) Cash dividends, ¥10.0 per share (5,461) Bonuses to directors and corporate auditors (19) Effect of change in statutory tax rate and other (1,382) Transfer due to sales of land (883) 883 Net decrease in unrealized gain on available-for-sale securities (Note 2-c) (581) Foreign currency translation adjustments (Note 2-m) (72) Net decrease in treasury stock 149Balance, March 31, 2003 550,664 ¥110,120 ¥147,755 ¥289,840 ¥(60,409) ¥ 777 ¥(881) ¥(3,518)
Thousands of U.S. dollars (Note 1)
Net unrealized Foreign Land gain on currency Common Capital Retained revaluation available-for-sale translation Treasury stock surplus earnings difference securities adjustments stock
Balance, March 31, 2002 $917,667 $1,231,292 $3,229,925 $(499,250) $11,317 $(6,742) $(30,558) Net loss (761,567) Cash dividends, $0.08 per share (45,508) Bonuses to directors and corporate auditors (159) Effect of change in statutory tax rate and other (11,516) Transfer due to sales of land (7,358) 7,358 Net decrease in unrealized gain on available-for-sale securities (Note 2-c) (4,842) Foreign currency translation adjustments (Note 2-m) (600) Net decrease in treasury stock 1,241Balance, March 31, 2003 $917,667 $1,231,292 $2,415,333 $(503,408) $ 6,475 $(7,342) $(29,317) See notes to consolidated financial statements.

Consolidated statements of cash fl owsDaiwa House Industry Co., Ltd. and SubsidiariesYears ended March 31, 2003, 2002 and 2001
56
Thousands of Millions of yen U.S. dollars (Note 1)
2003 2002 2001 2003Operating activities: Income (loss) before income taxes and minority interests ¥(155,157) ¥ 9,538 ¥ 12,796 $(1,292,975) Adjustments to reconcile income (loss) before income taxes and minority interests to net cash provided by operating activities: Income taxes — paid (6,230) (24,236) (22,418) (51,917) Depreciation 21,386 20,883 19,731 178,217 Write-down of golf club membership 147 411 820 1,225 Write-down of marketable and investment securities 9,773 16,956 1,385 81,442 Loss on sales and disposal of property, plant and equipment 3,488 1,594 543 29,067 Extraordinary depreciation for property, plant and equipment 75,183 626,525 Equity in earnings of associated companies (278) (1,052) (933) (2,317) Contribution to employees’ retirement benefi t trust 14,732 Provision for employees’ retirement benefi ts, net of payments 85,002 17,053 14,319 708,350 Changes in certain assets and liabilities, net of consolidation: Decrease (increase) in receivables 3,571 3,942 (6,626) 29,758 Decrease (increase) in inventories 32,872 48,909 (39,652) 273,933 Increase (decrease) in payables — trade (31,453) (3,797) 63,256 (262,108) Increase (decrease) in deposits received from customers 4,260 (508) 3,630 35,500 Other — net (2,105) (2,672) 2,491 (17,542) Total adjustments 195,616 77,483 51,278 1,630,133 Net cash provided by operating activities 40,459 87,021 64,074 337,158Investing activities: Purchases of property, plant and equipment (26,464) (30,405) (19,235) (220,533) Purchases of marketable and investment securities (4,269) (3,873) (502) (35,575) Increase in investments in and advances to associated companies (1,275) (1,881) (1,247) (10,625) Proceeds from sales of marketable and investment securities 2,814 422 110 23,450 Proceeds from sales of property, plant and equipment 1,244 379 138 10,367 Net proceeds from purchases of shares of the newly consolidated subsidiary 1,489 12,408 Increase in lease deposits (5,415) (2,768) (3,342) (45,125) Net decrease (increase) in other assets 4,560 1,897 (1,195) 38,000 Net cash used in investing activities (27,316) (36,229) (25,273) (227,633)Financing activities: Net increase (decrease) in short-term bank loans (52,005) (80,060) 2,000 (433,375) Proceeds from long-term debt 1,237 1,000 10,308 Repayments of long-term debt (1,000) (58) (85) (8,333) Proceeds from issurance of bonds 2,000 Repayments of convertible bonds (2,005) Net of purchases and proceeds from sales of treasury stock (200) (43) (15) (1,667) Dividends paid (5,745) (9,101) (9,117) (47,875) Cash paid related to merger with Daiwa Danchi Co., Ltd. (268) Net cash used in financing activities (57,713) (89,535) (6,217) (480,942)Cash and cash equivalents increased by merger 14,062 Net increase (decrease) in cash and cash equivalents (44,570) (24,681) 32,584 (371,417)Cash and cash equivalents, beginning of year 148,520 173,201 140,617 1,237,667Cash and cash equivalents, end of year ¥ 103,950 ¥148,520 ¥173,201 $ 866,250
See notes to consolidated financial statements.

57
Nihon Jyutaku Ryutu Co., Ltd., formerly an associated company, has been included in consolidation in the fi scal year of 2003 as a result of the additional acquisition of its shares.The assets and liabilities upon acquisition and the net proceeds from purchases of shares consisted of the following:
Thousands of Millions of yen U.S. dollars
Current assets ¥3,621 $30,175Long-term assets 5,642 47,017Consolidation difference 98 817Current liabilities (2,418) (20,150)Long-term liabilities (4,844) (40,367)Minority interests (973) (8,108)Company’s interest prior to acquisition (1,094) (9,117)Acquisition cost 32 267Cash and cash equivalents of the consolidated subsidiary (1,521) (12,675) Net proceeds from purchases of shares ¥1,489 $12,408
Millions of Yen
2002 2001Non-cash investing and fi nancing activities: Fair value of securities contributed to employees’ retirement benefi t trust (Note 2-h) ¥14,732 Assets acquired and liabilities assumed in merger (Note 18): Current assets ¥143,756 Long-term assets 132,201 Total ¥275,957
Current liabilities ¥176,694 Long-term liabilities 54,595 Total ¥231,289
See notes to consolidated fi nancial statements.

Notes to consolidated fi nancial statementsDaiwa House Industry Co., Ltd. and Subsidiaries
58
1. Basis of presenting consolidated fi nancial statements
The accompanying consolidated fi nancial statements have been prepared from the consolidated fi nancial statements issued for domestic reporting purposes in accordance with the provisions set forth in the Japanese Securities and Exchange Law. Daiwa House Industry Co., Ltd. (the “Company”) and its domestic subsidiaries maintain their accounts and records in accordance with the provisions set forth in the Japanese Commercial Code (the “Code”) and in conformity with accounting principles and practices generally accepted in Japan, which are different in certain respects as to application and disclosure requirements of International Financial Reporting Standards, and its foreign subsidiary in conformity with those of its country of domicile. The consolidated fi nancial statements are not intended to present the fi nancial position, results of operations and cash fl ows in accordance with accounting principles and practices generally accepted in countries and jurisdictions other than Japan.In preparing these consolidated fi nancial statements, certain reclassifi cations and rearrangements have been made to the consolidated fi nancial statements issued domestically in order to present them in a form which is more familiar to readers outside Japan.The consolidated fi nancial statements are stated in Japanese yen, the currency of the country in which the Company is incorporated and operates. The translations of Japanese yen amounts into U.S. dollar amounts are included solely for the convenience of readers outside Japan and have been made at the rate of ¥120 to $1, the approximate rate of exchange at March 31, 2003. Such translations should not be construed as representations that the Japanese yen amounts could be converted into U.S. dollars at that or any other rate.
2. Summary of signifi cant accounting policiesa. ConsolidationThe consolidated fi nancial statements include the accounts of the Company and all subsidiaries (together the “Group”) based on the control or infl uence concept. Under the control or infl uence concept, those companies over whose operations the Parent, directly or indirectly, is able to exercise control are fully consolidated, and those companies over which the Group has the ability to exercise signifi cant infl uence are accounted for by the equity method.The differences between the cost and underlying net equity of investments in subsidiaries and associated companies at acquisition, are amortized over fi ve years.All signifi cant intercompany balances and transactions have been eliminated in consolidation. All material unrealized profi t included in assets resulting from transactions within the Companies is eliminated.
b. Cash and cash equivalentsCash equivalents are short-term investments that are readily convertible into cash and that are exposed to insignifi cant risk of changes in value. Cash equivalents include time deposits and certifi cate of deposits, all of which mature or become due within three months of the date of acquisition.
c. Marketable and investment securitiesMarketable and investment securities are classifi ed and accounted for, depending on management’s intent, as follows: i) held-to-maturity debt securities, which are expected to be held to maturity with the positive intent and ability to hold to maturity are reported at amortized cost and ii) available-for-sale securities, which are not classifi ed as held-to-maturity. In accordance with the new accounting standard for fi nancial instruments, available-for-sale securities were reported at fair value, with unrealized gains and losses, net of applicable taxes, reported in a separate component of shareholders’ equity, effective April 1, 2001, and were reported at cost, prior to April 1, 2001.Non-marketable available-for-sale securities are stated at cost, determined by the moving-average method. For other than temporary declines in fair value, investment securities are reduced to net realizable value by a charge to income.

59
d. Short-term investmentsShort-term investments are time deposits and certifi cates of deposit, all of which mature or become due later than three months after the date of acquisition. Time deposits pledged as collateral as substitutes of deposits for certain construction and advertisement contracts were ¥29 million ($242 thousand) and ¥677 million as of March 31, 2003 and 2002.
e. InventoriesInventories are stated at cost. Inventories of land, residential homes and condominiums, and construction projects in progress include all costs of land, land development and construction. The cost of construction materials and supplies is determined by the average method. However, appropriate write-downs are recorded for inventories with values considered to have been permanently or substantially impaired.
f. Property, plant and equipmentProperty, plant and equipment are stated at cost. Depreciation is computed substantially by the declining-balance method while the straight-line method is applied to buildings acquired after April 1, 1998. The range of useful lives is principally from 15 to 39 years for buildings and structures, from 10 to 13 years for machinery and equipment and from 5 to 15 years for furniture and fi xtures. Extraordinary depreciation for property, plant and equipment is charged to income for the year ended March 31, 2003, for depreciable assets in which utilization declined signifi cantly, these assets consist of resort hotels, club-houses on golf courses and commercial buildings for rent. The extraordinary depreciation recorded was ¥73,369 million ($611,409 thousand), ¥856 million ($7,133 thousand), and ¥958 million ($7,983 thousand), for buildings and structures, machinery and equipment, and furniture and fi xtures, respectively.
g. LeasesAll leases are accounted for as operating leases. Under Japanese accounting standards for leases, fi nance leases that are deemed to transfer ownership of the leased property to the lessee are to be capitalized, while other fi nance leases are permitted to be accounted for as operating lease transactions if certain “as if capitalized” information is disclosed in the notes to the lessee’s fi nancial statements.
h. Retirement and pension plansThe Company and its domestic subsidiaries have unfunded retirement benefi t plans and a contributory funded pension plan.The Company and its domestic consolidated subsidiaries account for the liability for employees’ retirement benefi ts based on the projected benefi t obligations and plan assets at the balance sheet date. In August 2000, the Company contributed certain available-for-sale securities with a fair value of ¥14,732 million to the employees’ retirement benefi t trust for the parent company’s non-contributory pension plans, and recognized a non-cash loss of ¥266 million.The transitional obligation of ¥43,221 million, determined as of April 1, 2000, was reduced by an immediate charge to income in the amount of the fair value of the above contribution. The remaining transitional obligation of ¥28,489 million (including ¥896 million assumed in a merger with Daiwa Danchi Co., Ltd.) is principally being amortized over three years.
i. Revenue and profi t recognitionSales and related profi ts are generally recorded when sales contracts are completed and customers have satisfi ed the down payment and other requirements stipulated by the contracts. Land and land development costs are allocated to units sold based upon relative area.

60
j. Income taxesThe provision for income taxes is computed based on the pretax income included in the consolidated statements of operations. The asset and liability approach is used to recognize deferred tax assets and liabilities for the expected future tax consequences of temporary differences between the carrying amounts and the tax bases of assets and liabilities. Deferred taxes are measured by applying currently enacted tax laws to the temporary differences.
k. Appropriations of retained earningsAppropriations of retained earnings at each year end are refl ected in the fi nancial statements of the following year after shareholders’ approval has been obtained.
l. Foreign currency transactionsAll short-term and long-term monetary receivables and payables denominated in foreign currencies are translated into Japanese yen at the current exchange rates at the balance sheet date. The foreign exchange gains and losses from translation are recognized in the statements of operations.
m. Foreign currency fi nancial statements The balance sheet accounts of the consolidated foreign subsidiary and associated companies are translated into Japanese yen at the current exchange rate as of the balance sheet date except for shareholders’ equity, which is translated at historical exchange rates. Revenue and expense accounts of the consolidated foreign subsidiary and associated companies are translated into yen at the current exchange rate. Differences arising from such translation are shown as “Foreign currency translation adjustments” in a separate component of shareholders’ equity.
n. Reclassifi cationsCertain reclassifi cations and rearrangements have been made in the 2002 and 2001 fi nancial statements to conform to the classifi cations used in 2003.
o. Per share informationBasic net income per share is computed by dividing net income available to common shareholders, by the weighted-average number of common shares outstanding for the year.The weighted-average number of common shares outstanding for the years ended March 31, 2003, 2002 and 2001 were 547,045 thousand, 546,079 thousand and 519,391 thousand, respectively.Diluted net income per share of common stock for the years ended March 31, 2002 and 2001 are not disclosed because it is anti-dilutive. Diluted net income per share of common stock for the year ended March 31, 2003 is not disclosed because the Company incurred a net loss.Cash dividends per share presented in the accompanying consolidated statements of operations are dividends applicable to the respective years including dividends to be paid after the end of the year.
p. Treasury stockEffective April 1, 2002, the Company adopted a new accounting standard for treasury stock issued by the Accounting Standards Board of Japan. Under the new standard, the stock of the Company, which is held by its subsidiaries and associated companies, is stated as treasury stock according to the percentage of ownership.

61
3. Accounting changeDue to the deterioration of the stock market and the revision of the discount rate from 3.5% to 2.5%, the amount of unrecognized actuarial losses accumulated to 40% of the projected benefi t obligation during 2003. With the government’s approval of the Group’s application for the exemption from future obligations related to the substitutional portion of the pension program (Note 8), the revision of the retirement benefi t plan, and the reexamination of investment policy, the actuarial loss, which would be amortized evenly over principally 10 years under the Group’s previous method, was changed to be recognized when incurred in order to disclose information about retirement and pension plans more timely. As a result, the loss before income taxes and minority interests increased by ¥81,621 million ($680,175 thousand), compared with what would have been recorded under the previously method.
4. Marketable and investment securitiesMarketable and investment securities as of March 31, 2003 and 2002 consisted of the following:
Thousands of Millions of yen U.S. dollars 2003 2002 2003Current: Government and corporate bonds ¥ 202 ¥ 180 $ 1,683
Non-current:
Marketable equity securities 25,926 35,318 216,050
Government and corporate bonds 62 84 517
Total ¥25,988 ¥35,402 $216,567
The carrying amounts and aggregate fair values of marketable and investment securities at March 31, 2003 and 2002 were as follows:

62
Millions of yen 2003 Cost Unrealized gains Unrealized losses Fair valueSecurities classified as: Available-for-sale: Equity securities ¥18,096 ¥2,895 ¥1,119 ¥19,872 Held-to-maturity 264 1 265
Millions of yen 2002 Cost Unrealized gains Unrealized losses Fair valueSecurities classified as: Available-for-sale: Equity securities ¥26,268 ¥5,250 ¥2,656 ¥28,862 Held-to-maturity 264 1 265
Thousands of U.S. dollars 2003 Cost Unrealized gains Unrealized losses Fair valueSecurities classified as: Available-for-sale: Equity securities $150,800 $24,125 $9,325 $165,600 Held-to-maturity 2,200 8 2,208
Available-for-sale securities whose fair value is not readily determinable as of March 31, 2003 and 2002 were as follows:
Carrying amount Thousands of Millions of yen U.S. dollars 2003 2002 2003Available-for-sale: Equity securities ¥5,854 ¥4,456 $48,783 Debt securities 200 2,000 1,667 Total ¥6,054 ¥6,456 $50,450 The carrying values of debt securities by contractual maturities for securities classifi ed as available-for-sale and held-to-maturity at March 31, 2003 are as follows:
Millions of yen Thousands of U.S. dollars Available for sale Held to maturity Available for sale Held to maturityDue in one year or less ¥202 $1,683Due after one year through five years 62 517Due after five years through ten years ¥200 $1,667 Total ¥200 ¥264 $1,667 $2,200

63
5. InventoriesInventories at March 31, 2003 and 2002 consisted of the following:
Thousands of Millions of yen U.S. dollars 2003 2002 2003
Finished residential homes and condominiums ¥ 27,771 ¥ 34,176 $ 231,425Construction projects in progress 28,745 21,428 239,542
Residential homes and condominiums in process 20,383 18,159 169,858
Land held:
For resale 134,130 163,573 1,117,750
Under development 33,110 36,921 275,917
Undeveloped 11,687 12,561 97,391
Construction materials and supplies 11,373 11,606 94,775
Total ¥267,199 ¥298,424 $2,226,658
The Group engages in two principal business activities. They manufacture and construct prefabricated houses and structures and also engage in various contracted construction projects, primarily for the construction of large-scale commercial and residential buildings. To further such business, the Group purchases land for development and resale.
6. Land revaluationUnder the “Law of Land Revaluation,” the Company and certain subsidiaries elected a one-time revaluation of their own-use land to a value based on real estate appraisal information as of March 31, 2002.The resulting land revaluation difference represents unrealized depreciation of land and is stated, net of income taxes, as a component of shareholders’ equity. There was no effect on the statement of income. Continuous readjustment is not permitted unless the land value subsequently declines signifi cantly such that the amount of the decline in value should be removed from the land revaluation difference account and related deferred tax liabilities. The details of the one-time revaluation as of March 31, 2002 were as follows:
Millions of yen Land before revaluation ¥311,703
Land after revaluation 208,811
Land revaluation difference 102,892
Deferred tax assets on land revaluation 43,135
Minority interests, net (153)
Net land revaluation difference ¥ 59,910

64
Annual maturities of long-term debt at March 31, 2003, were as follows:
Thousands of Year ending March 31: Millions of yen U.S. dollars2005 ¥2,047 $17,0582006 321 2,6752007 869 7,242 Total ¥3,237 $26,975
At March 31, 2003, assets pledged as collateral for secured long-term debt of ¥1,000 million ($8,333 thousand) were as follows:
Thousands of Millions of yen U.S. dollarsLand ¥ 502 $ 4,183Buildings and structures 1,470 12,250 Total ¥1,972 $16,433
As is customary in Japan, the Company maintains deposit balances with banks with which it has bank loans. Such deposit balances are not legally or contractually restricted as to withdrawal. In addition, collateral must be provided if requested by the lending banks and certain banks have the right to offset cash deposited with them against any bank loan or obligation that becomes due and, in case of default and certain other specifi ed events, against all other debt payable to the bank concerned. The Company has never received any such request.
7. Short-term bank loans and long-term debtShort-term bank loans at March 31, 2003 and 2002 consisted of bank loans. The annual interest rates for the short-term bank loans ranged from 0.6% to 1.4% and from 0.5% to 1.4% at March 31, 2003 and 2002, respectively. Long-term debt at March 31, 2003 and 2002 consisted of the following:
Thousands of Millions of yen U.S. dollars 2003 2002 2003Unsecured bank loans, 1.18%, due serially to 2002 September ¥1,000Unsecured bank loans, 1.50%, due serially to 2005 July ¥ 237 $ 1,975Unsecured 0.5% bonds due 2004 December 2,000 2,000 16,667Loans from bank, 1.26%, due serially to 2007 March; Collateralized 1,000 8,333 Total 3,237 3,000 26,975Less current portion 1,000Long-term debt, net of current portion ¥3,237 ¥2,000 $26,975

65
8. Retirement and pension plansUnder the unfunded employees’ retirement benefi t plan, employees of the Company and certain subsidiaries terminating their employment are entitled, in most circumstances, to lump-sum severance payments determined by reference to wage rates at the time of termination and years of service. In addition, the Company, together with certain subsidiaries and associated companies, has adopted a contributory funded defi ned benefi t pension plan covering most of their employees.The liability for employees’ retirement benefi ts at March 31, 2003 and 2002 consisted of the following:
Thousands of Millions of yen U.S. dollars 2003 2002 2003Projected benefi t obligation ¥199,597 ¥228,306 $1,663,308Fair value of plan assets (63,185) (115,811) (526,542)Unrecognized actuarial loss (51,864)Unrecognized transitional obligation (9,474)Net liability 136,412 51,157 1,136,766Prepaid benefi t costs 68 67 567Liability for employees’ retirement benefi ts ¥136,480 ¥ 51,224 $1,137,333
The components of net periodic benefit costs are as follows: Thousands of Millions of yen U.S. dollars 2003 2002 2003Service cost ¥ 10,845 ¥11,967 $ 90,375Interest cost 7,182 7,535 59,850Expected return on plan assets (3,181) (4,219) (26,508)Prior service benefi t (6,736) (1,583) (56,133)Recognized actuarial loss 86,546 3,361 721,216Amortization of transitional obligation 8,780 9,473 73,167Net periodic benefi t costs ¥103,436 ¥26,534 $861,967
Prior service benefi t for the year ended March 31, 2002 represents the net effect of (1) a decrease in the benefi t obligation of ¥5,964 million from raising the eligibility age for payments regarding the basic part of the welfare pension plan for employees of the Company and certain subsidiaries, which is similar to the national pension plan, in accordance with a revision in the Welfare Pension Insurance Law in March, 2000 and (2) an increase in the benefi t obligation of ¥4,381 million from changing the Daiwa Danchi pension plan from a qualifi ed pension plan to a welfare pension plan and unfunded retirement benefi t plan. These changes were effective March 2002 and November 2001, respectively, and the full effect on the benefi t obligation as of those dates was charged to income in the year ended March 31, 2002. Prior service benefi t for the year ended March 31, 2003 represents the effect of a decrease in the benefi t obligation from the adoption of the revised retirement benefi t plan concerning the lump-sum severance payments.

66
Assumptions used for the years ended March 31, 2003 and 2002 are set forth as follows:
2003 2002
Discount rate 2.5% 3.5%Expected rate of return on plan assets 3.5% 3.5% Recognition period of actuarial gain (loss) 1 year Principally 10 years Amortization period of transitional obligation Principally 3 years Principally 3 years (completed)
The contributory funded defi ned benefi t pension plan, which is established under the Japanese Welfare Pension Insurance Law, covers a substitutional portion of the governmental pension program managed by the Company on behalf of the government and a corporate portion established at the discretion of the company. According to the enactment of the Defi ned Benefi t Pension Plan Law in April 2002, the Company applied for an exemption from obligation to pay benefi ts for future employee services related to the substitutional portion which would result in the transfer of the pension obligations and related assets to the government by another subsequent application. The Company obtained an approval of exemption from future obligation by the Ministry of Health, Labor and Welfare on October 28, 2002. As a result of this exemption, the Company and certain subsidiaries recognized a gain on exemption from future pension obligation of the governmental program in the amount of ¥8,575 million ($71,458 thousand) in accordance with a transitional measurement of the accounting standard for employees’ retirement benefi ts for the year ended March 31, 2003.The substitutional portion of the plan assets which will be transferred to the government in the subsequent year is measured to be approximately ¥38,040 million ($317,000 thousand) as of March 31, 2003.
9. Shareholders’ equityJapanese companies are subject to the Japanese Commercial Code (the “Code”) to which certain amendments became effective from October 1, 2001.The Code was revised whereby common stock par value was eliminated resulting in all shares being recorded with no par value and at least 50% of the issue price of new shares is required to be recorded as common stock and the remaining net proceeds as additional paid-in capital, which is included in capital surplus. The Code permits Japanese companies, upon approval of the Board of Directors, to issue shares to existing shareholders without consideration as a stock split. Such issuance of shares generally does not give rise to changes within the shareholders’ accounts.The revised Code also provides that an amount at least equal to 10% of the aggregate amount of cash dividends and certain other appropriations of retained earnings associated with cash outlays applicable to each period shall be appropriated as a legal reserve (a component of retained earnings) until such reserve and additional paid-in capital equals 25% of common stock. The amount of total additional paid-in capital and legal reserve that exceeds 25% of the common stock may be available for dividends by resolution of the shareholders. In addition, the Code permits the transfer of a portion of additional paid-in capital and legal reserve to the common stock by resolution of the Board of Directors.
The revised Code eliminated restrictions on the repurchase and use of treasury stock allowing Japanese companies to repurchase treasury stock by a resolution of the shareholders at the general shareholders meeting and dispose of such treasury stock by resolution of the Board of Directors beginning April 1, 2002. The repurchased amount of treasury stock cannot exceed the amount available for future dividend plus amount of common stock, additional paid-in capital or legal reserve to be reduced in the case where such reduction was resolved at the general shareholders meeting.The amount of retained earnings available for dividends under the Code was ¥188,031 million ($1,566,925 thousand) as of March 31, 2003, based on the amount recorded in the parent company’s general books of account. In addition to the provision that requires an appropriation for a legal reserve in connection with the cash payment, the Code imposes certain limitations on the amount of retained earnings available for dividends.Dividends are approved by the shareholders at a meeting held subsequent to the fi scal year in which the dividends are applicable. Semiannual interim dividends may also be paid upon resolution of the Board of Directors, subject to certain limitations imposed by the Code.

67
10. Segment informationInformation about operations in different industry segments of the Group for the years ended March 31, 2003, 2002 and 2001 is as follows:
Sales and operating income (loss) Millions of yen 2003 Distribution Eliminations/ Residential Commercial Resort “Home Center” Other Corporate ConsolidatedSales to customers ¥789,325 ¥245,999 ¥51,903 ¥51,219 ¥46,098 ¥1,184,544Intersegment sales 2,656 2,015 940 51,019 ¥(56,630) Total sales 791,981 248,014 51,903 52,159 97,117 (56,630) 1,184,544Operating expenses 752,846 230,383 55,872 51,854 94,544 (46,227) 1,139,272Operating income (loss) ¥ 39,135 ¥ 17,631 ¥ (3,969) ¥ 305 ¥ 2,573 ¥(10,403) ¥ 45,272
Thousands of U.S. dollars 2003 Distribution Eliminations/ Residential Commercial Resort “Home Center” Other Corporate ConsolidatedSales to customers $6,577,708 $2,049,992 $432,525 $426,825 $384,150 $9,871,200Intersegment sales 22,134 16,791 7,833 425,158 $(471,916) Total sales 6,599,842 2,066,783 432,525 434,658 809,308 (471,916) 9,871,200Operating expenses 6,273,717 1,919,858 465,600 432,116 787,866 (385,224) 9,493,933Operating income (loss) $ 326,125 $ 146,925 $ (33,075) $ 2,542 $ 21,442 $ (86,692) $ 377,267
Millions of yen 2002 Distribution Eliminations/ Residential Commercial Resort “Home Center” Other Corporate ConsolidatedSales to customers ¥805,022 ¥257,733 ¥48,499 ¥44,349 ¥42,322 ¥1,197,925Intersegment sales 981 3,052 1,114 46,906 ¥(52,053) Total sales 806,003 260,785 48,499 45,463 89,228 (52,053) 1,197,925Operating expenses 763,070 242,434 52,854 45,162 86,708 (38,334) 1,151,894Operating income (loss) ¥ 42,933 ¥ 18,351 ¥ (4,355) ¥ 301 ¥ 2,520 ¥(13,719) ¥ 46,031
Millions of yen 2001 Distribution Eliminations/ Residential Commercial Resort “Home Center” Other Corporate ConsolidatedSales to customers ¥648,804 ¥246,113 ¥39,823 ¥40,777 ¥40,720 ¥1,016,237Intersegment sales 2,882 685 1,266 45,114 ¥(49,947) Total sales 651,686 246,798 39,823 42,043 85,834 (49,947) 1,016,237Operating expenses 604,660 230,655 45,772 43,703 83,367 (36,210) 971,947Operating income (loss) ¥ 47,026 ¥ 16,143 ¥ (5,949) ¥ (1,660) ¥ 2,467 ¥(13,737) ¥ 44,290

68
Total assets, depreciation and capital investments Millions of yen 2003 Distribution Eliminations/ Residential Commercial Resort “Home Center” Other Corporate ConsolidatedTotal assets ¥394,119 ¥211,168 ¥98,803 ¥35,196 ¥78,976 ¥276,179 ¥1,094,441Depreciation 5,288 2,604 6,334 592 4,774 1,794 21,386Capital investments 6,984 8,114 2,164 2,317 3,778 1,354 24,711
Thousands of U.S. dollars 2003 Distribution Eliminations/ Residential Commercial Resort “Home Center” Other Corporate ConsolidatedTotal assets $3,284,325 $1,759,733 $823,358 $293,300 $658,133 $2,301,493 $9,120,342Depreciation 44,067 21,700 52,783 4,933 39,783 14,951 178,217Capital investments 58,200 67,617 18,033 19,308 31,483 11,284 205,925
Millions of yen 2002 Distribution Eliminations/ Residential Commercial Resort “Home Center” Other Corporate ConsolidatedTotal assets ¥436,521 ¥192,101 ¥152,280 ¥30,728 ¥85,251 ¥290,246 ¥1,187,127Depreciation 5,378 2,122 6,610 538 4,444 1,791 20,883Capital investments 20,753 11,935 2,514 1,841 3,996 23,393 64,432
Millions of yen 2001 Distribution Eliminations/ Residential Commercial Resort “Home Center” Other Corporate ConsolidatedAssets ¥357,052 ¥156,911 ¥123,792 ¥32,167 ¥92,258 ¥304,277 ¥1,066,457Depreciation 4,527 2,124 6,128 568 4,740 1,644 19,731Capital investments 16,706 3,315 2,215 1,495 5,131 1,697 30,559
The industry segments consisted of the following:
Industry segmentComponents of net sales in the consolidated Distribution statements of operations Residential Commercial Resort “Home Center” OtherConstruction Construction of single/ Construction of multi-family houses commercial buildings and condominiums Real estate Sales of real estate Sales and rental of for residential use real estate for commercial use Real estate commissions Rental of residential complexesOther Care of Care of Operation of resort Operation of Manufacture and sales of condominiums commercial type hotels and “do-it-yourself” building materials buildings golf courses hardware centers Physical distribution Operation of city type hotels

69
Eliminations/Corporate include unallocated operating expenses, principally consisting of general corporate expenses incurred by the administration headquarters of the Company. Corporate assets are principally cash and cash equivalents, marketable securities and investment securities.
11. Other income (expenses): Other — net“Other income (expenses): Other — net” for the years ended March 31, 2003, 2002 and 2001 consisted of the following:
Thousands of Millions of yen U.S. dollars 2003 2002 2001 2003Exchange gains (losses) ¥ (7) ¥ (2) ¥ 92 $ (58)Real estate acquisition tax and other taxes (277) (257) (420) (2,308)Retirement benefits for directors (120) (643) (566) (1,000)Expenses for large-scale repairs to property, plant and equipment (1,062) Gain (loss) on sales of marketable and investment securities 123 (544) (120) 1,025Allowance for doubtful accounts (4,157) (873) (342) (34,642)Gain on exemption from future pension obligation 8,575 71,458Loss on securities contributed to employees’ retirement benefit trust (266)Equity in earnings of associated companies 278 1,052 933 2,317Write-down of golf club membership (147) (411) (820) (1,225)Loss on sales of membership (79) (170) (658)Loss on liquidation of associated company (2,145) (17,875)Bad debt expenses for long-term loans (4,082) (34,017)Other — net 1,720 1,929 1,729 14,333 Total ¥ (318) ¥ 81 ¥ (842) $ (2,650)

70
12. Income taxesThe Company and its domestic subsidiaries are subject to Japanese national and local income taxes which, in the aggregate, resulted in a normal effective statutory tax rate of approximately 42.0% for the years ended March 31, 2003, 2002 and 2001.The tax effects of signifi cant temporary differences and loss carryforwards which resulted in deferred tax assets and liabilities at March 31, 2003 and 2002 are as follows: Thousands of Millions of yen U.S. dollars 2003 2002 2003Current: Deferred tax assets: Write-down of land held for resale ¥ 15,257 ¥ 6,472 $127,142 Accrued bonuses 3,404 2,642 28,367 Accrued enterprise tax 769 240 6,408 Other 2,676 1,530 22,300 Deferred tax assets ¥ 22,106 ¥10,884 $184,217
Non-current: Deferred tax assets: Employees’ retirement benefits ¥ 55,498 ¥20,878 $462,483 Unrealized gains on sales of property, plant and equipment 7,503 7,225 62,525 Extraordinary depreciation for property, plant and equipment 30,299 252,492 Other 9,703 3,605 80,858 Deferred tax assets 103,003 31,708 858,358
Deferred tax liabilities: Retained earnings appropriated for tax allowable reserves ¥ (2,038) ¥ (2,059) $ (16,983) Net unrealized gain on available-for-sale securities (723) (1,118) (6,025) Other (119) (87) (992) Deferred tax liabilities (2,880) (3,264) (24,000) Net deferred tax assets ¥100,123 ¥28,444 $834,358

71
A reconciliation between the normal effective statutory tax rates and the actual effective tax rates refl ected in the accompanying consolidated statements of income for the years ended March 31, 2003, 2002 and 2001 is as follows:
2003 2002 2001Normal effective statutory tax rates 42.0% 42.0% 42.0%
Increase (decrease) in tax rates due to: Permanently non-deductible expenses (0.6) 9.2 6.5 Non-taxable dividend income 0.0 (0.2) (0.7) Equity in earnings of associated companies 0.1 (4.6) (3.0) Write-down of investments in and advances to associated companies 0.4 (0.7) (1.2) Per capita levy (0.3) 5.4 4.2 Decrease in valuation allowance for deferred tax assets 1.2 (11.8) Decrease in deferred tax assets by change of tax rate (2.0) Other — net 0.2 (0.3) (3.0)Actual effective tax rates 41.0% 39.0% 44.8%
On March 31, 2003, Cabinet Order No. 9 entitled “Reform of a Portion of Local Tax Law” was issued and this reform will apply to fi scal years beginning after April 1, 2004. As a result of this reform, the statutory income tax rate to be used for the calculation of deferred income taxes concerning temporary differences which are expected to be realized or settled after April 1, 2004 will be changed from 42.0% to 40.6%.The effect of this change was to decrease deferred tax assets and deferred tax assets on land revaluation by ¥3,145 million ($26,208 thousand) and ¥1,417 million ($11,808 thousand), respectively, and to increase income taxes-deferred, net unrealized gain on available-for-sale securities and land revaluation difference by ¥3,170 million ($26,417 thousand), ¥18 million ($150 thousand) and ¥1,417 million ($11,808 thousand), respectively, for the year ended March 31, 2003.
13. Research and development costsResearch and development costs charged to income were ¥5,609 million ($46,742 thousand), ¥5,474 million and ¥5,535 million for the years ended March 31, 2003, 2002 and 2001, respectively.

72
14. LeasesTotal lease payments under fi nance leases that are not deemed to transfer ownership of the leased property to the lessee were ¥4,815 million ($40,125 thousand), ¥4,510 million, and ¥3,949 million for the years ended March 31, 2003, 2002 and 2001, respectively.Pro forma information of leased property under fi nance leases that do not transfer ownership of the leased property to the lessee on an “as if capitalized” basis for the years ended March 31, 2003 and 2002 were as follows:
(Lessee) Millions of yen 2003 Buildings and Machinery and Furniture and structures equipment fixtures TotalAcquisition cost ¥10,006 ¥1,307 ¥9,311 ¥20,624 Accumulated depreciation 4,193 480 4,874 9,547 Net leased property ¥ 5,813 ¥ 827 ¥4,437 ¥11,077
Millions of yen 2002 Buildings and Machinery and Furniture and structures equipment fixtures TotalAcquisition cost ¥8,740 ¥896 ¥10,110 ¥19,746 Accumulated depreciation 2,395 445 5,639 8,479 Net leased property ¥6,345 ¥451 ¥ 4,471 ¥11,267
Thousands of U.S. dollars 2003 Buildings and Machinery and Furniture and structures equipment fixtures TotalAcquisition cost $83,383 $10,892 $77,592 $171,867 Accumulated depreciation 34,941 4,000 40,617 79,558 Net leased property $48,442 $ 6,892 $36,975 $ 92,309

73
Obligations under such fi nance leases as of March 31, 2003 and 2002 were as follows:
Thousands of Millions of yen U.S. dollars 2003 2002 2003Due within one year ¥ 4,561 ¥ 4,255 $38,009Due after one year 6,516 7,012 54,300 Total ¥11,077 ¥11,267 $92,309
The amount of acquisition cost and obligations under fi nance leases includes the imputed interest expense portion. Depreciation expenses, which are not refl ected in the accompanying statements of income, computed by the straight-line method, respectively. Obligations and future rental income under non-cancellable operating leases as of March 31, 2003 and 2002 were as follows:
(Lessee) Thousands of Millions of yen U.S. dollars 2003 2002 2003Due within one year ¥ 25,456 ¥ 21,835 $ 212,133 Due after one year 313,820 252,757 2,615,167 Total ¥339,276 ¥274,592 $2,827,300
(Lessor) Thousands of Millions of yen U.S. dollars 2003 2002 2003Due within one year ¥ 19,290 ¥ 15,099 $ 160,750Due after one year 269,724 204,420 2,247,700 Total ¥289,014 ¥219,519 $2,408,450

74
15. DerivativesThe Group enters into foreign exchange forward contracts and interest rate swaps to hedge foreign exchange or interest rate risks.It is the Group’s policy to use derivatives only for the purpose of reducing market risks associated with liabilities.Derivatives are subject to market risk and credit risk. Because the counterparties to those derivatives are limited to major international fi nancial institutions, the Company does not anticipate any losses arising from such credit risk. The Company implemented a risk control system for derivatives primarily to control the purpose, limitation and selection of the counterparties. The system’s primary function is to avoid excess risks associated with derivatives. Each derivative transaction, which is based on these internal policies, is reported to the Director of the Financing Department, and the execution and control of derivatives are managed by the Finance Section of the Company.As of March 31, 2003, the Group did not have any derivative contracts outstanding.
16. ContingenciesAt March 31, 2003, contingent liabilities for notes endorsed with recourse and loans guaranteed in the ordinary course of business amounted to ¥1,483 million ($12,358 thousand) and ¥80,033 million ($666,942 thousand), respectively. Included in loans guaranteed were customers’ housing loans from banks in the amount of ¥77,870 million ($648,917 thousand).
17. Merger with Daiwa Danchi Co., Ltd.Effective April 1, 2001, the Company merged with Daiwa Danchi, which was an associated company. Under the terms of the merger, the Company issued 0.3 shares of its common stock for each Daiwa Danchi common share, which resulted in the issuance of 26,771,371 shares and increases in common stock of ¥1,339 million and capital surplus of ¥25,714 million.
18. Subsequent eventThe following appropriations of retained earnings at March 31, 2003 were approved at the Company’s shareholders’ meeting held on June 27, 2003:
Millions Thousands of of yen U.S. dollarsYear-end cash dividends, ¥10.0 ($0.08) per share ¥5,503 $45,858

75
Independent auditors’ reportDaiwa House Industry Co., Ltd. and Subsidiaries
To the Board of Directors of Daiwa House Industry Co., Ltd.:
We have audited the accompanying consolidated balance sheets of Daiwa House Industry Co., Ltd. and subsidiaries
as of March 31, 2003 and 2002, and the related consolidated statements of operations, shareholders’ equity, and cash
fl ows for each of the three years in the period ended March 31, 2003, all expressed in Japanese yen. These consolidated
fi nancial statements are the responsibility of the Company’s management. Our responsibility is to express an opinion
on these consolidated fi nancial statements based on our audits.
We conducted our audits in accordance with auditing standards, procedures and practices generally accepted and
applied in Japan. Those standards require that we plan and perform the audit to obtain reasonable assurance about
whether the fi nancial statements are free of material misstatement. An audit includes examining, on a test basis,
evidence supporting the amounts and disclosures in the fi nancial statements. An audit also includes assessing the
accounting principles used and signifi cant estimates made by management, as well as evaluating the overall fi nancial
statement presentation. We believe that our audits provide a reasonable basis for our opinion.
In our opinion, the consolidated fi nancial statements referred to above present fairly, in all material respects, the
consolidated fi nancial position of Daiwa House Industry Co., Ltd. and subsidiaries as of March 31, 2003 and 2002, and
the consolidated results of their operations and their cash fl ows for each of the three years in the period ended March
31, 2003, in conformity with accounting principles and practices generally accepted in Japan.
As discussed in Note 2, effective April 1, 2001, in accordance with the new accounting standard for fi nancial
instruments, available-for-sale securities are reported at fair value. As discussed in Note 3, the Company and certain
subsidiaries changed its method of accounting for liability for employees’ retirement benefi ts as of March 31, 2003, and
the actuarial loss, which previously would be amortized evenly over principally 10 years, was changed to be amortized
when incurred.
Our audits also comprehended the translation of Japanese yen amounts into U.S. dollar amounts and, in our opinion,
such translation has been made in conformity with the basis stated in Note 1. Such U.S. dollar amounts are presented
solely for the convenience of readers outside Japan.
June 27, 2003
Tohmatsu & Co.
Osaka Kokusai Building3-13, Azuchimachi 2-chome,Chuo-ku, Osaka 541-0052, Japan
Tel :+81-6-6261-1381Fax :+81-6-6261-1238www.tohmatsu.co.jp

76
Source and photo caption
Source P1 Economic and Social Research Institute, Cabinet Office, Government of Japan/Annual Report of National AccountsP13 Ministry of Finance/Annual report on corporate statistics Development Bank of Japan/Handbook of Industrial Financial Data 2002P14 Ministry of Land, Infrastructure and Transport/Statistics on Building Construction StartedP15 Housing Policy Division, Housing Bureau, Ministry of Land, Infrastructure and Transport/Housing Industry Data; FY2002 Yearbook Notes: 1. Floor space per housing unit (owner-occupied and rental housing) is uniformly calculated based on the inside measurement of each room plus half the thickness of each wall. 2. Japan (1998 figures); U.S.A. (1999 figures); Great Britain (1996 figures); France (1996 figures); Germany (1998 figures) P28-30 Ministry of Land, Infrastructure and Transport/Statistics on Building Construction StartedP30 Statistics Bureau, Ministry of Public Management, Home Affairs, Posts and Telecommunications/Statistics on Housing and LandP33 Ministry of Land, Infrastructure and Transport/Statistics on Building Construction Started; Construction Investment Forecast Ministry of Finance/Annual report on corporate statisticsP37 Home Center Institute/Home Center DirectoryP41 Japan Meteorological Agency/Annual report by Japan Meteorological Agency
Explanations of photographs (in cases of multiple number of photos on one page, explanations apply from the left or the top)
P24 I-wish Treview ’03/LOC shopping town Kamiita/Minamiawaji Royal Hotel/Royal Home Center Suita/Truck loading at DAIWA LOGISTICS CO., LTD.P26 D001 ERP27 Yutorie avance/Séjour Willmore/D’ Restia Korigaoka/I-wish Treview ’01/I-wish Treview ’03/D001 ER/Séjour WillcourtP28 Wood Collection “gen fu kei”/I-wish Treview ’03P29 Séjour monarie/Paseo Placido EXP30 D’ Granse Josui/Entrance hallP31 I-wish (Minoo No.1 housing exhibition space)P32 Shonan Mall FillP33 YKK AP Co., Ltd. showroom/Casual clothes shop/East Japan Logistics Center (Happinet Corporation)/Swangarden Azumino/Welfare Kitazono Watanabe
hospital/Osaka College of MusicP34 Oizumikogen-Yatsugatake Royal HotelP35 Kirishima Royal Hotel (Western-Style Wedding Chapel “FLORESTA”)/Yamanakaonsen-Kajikaso Royal Hotel/Takachiho Country Club/Kushimoto Royal Hotel
(Special Japanese-Style Banquet Hall “HASHIGUI”)/Ise-Shima Country Club/Beppuwan Royal Hotel (Seaview Chapel)P36 Royal Home Center ChibakitaP37 Royal Home Center Chibakita (left and 2nd from left)/Royal Home Center Tsukaguchi/Royal Home Center Fujisawa/Exterior display space and Home
renovation advice corner/Royal Home Center ChibakitaP38 The Okayama Distribution Center (DAIWA LOGISTICS CO., LTD.)/Original curtains (DAIWA RAKUDA INDUSTRY CO., LTD.)/Yamatonoyu Warabi-ten
(YAMATONOYU CO., LTD.)P40 Wind-powered electricity generation facility (Okinawa Zanpamisaki Royal Hotel)P41 Central Research Laboratory/Earthquake test table/Environmental simulation lab./Structural testing lab.P44 D001/The Okayama Neopolis

http://www.daiwahouse.co.jp/English/annual/index.html
77
Contents
About this report :Years shown in graphs are fiscal years ending March 31 unless otherwise indicated.
Forward-looking statements :Statements contained in this report regarding the Company’s plans, strategies,and expectations for future performance fall into the category of “forward-looking statements,” which are based on information available to the Company’s management at the time of writing. They are therefore subject to a number of uncertainties and unknowable factors, and actual results may thus differ substantially from those projected.
Sales statements on a segmental basis :Segment sales figures shown in this annual report are totals of sales to external customers and inter-segment sales and transfers. Segment sales ratios, however, are calculated solely on the basis of sales to external customers.
Introduction — economic and housing developments in Japan in fiscal 2002
Consolidated financial highlights
Group performance highlights
Investor information
Dear shareholders
In memory of our founder
Message from the president
Report by Executive Managing Director (financial affairs)
Corporate management
Corporate governance
Our business domain
Business outline
Housing
Commercial construction
Resort hotels
Home center business
Other businesses
Daiwa House group at a glance
Environmental measures
Research and development
Group network
The history of the Daiwa House group
Financial section
1
2
3
4
6
8
10
18
20
22
23
24
26
32
34
36
38
39
40
41
42
44
45

Daiwa House, the Daiwa House group logo, are either registered trademarks ortrademarks of Daiwa House Industry Co., Ltd. in Japan and/or other countries.Copyright 2003 Daiwa House Industry Co., Ltd. All rights reserved.
New Housing for a New Japan
Printed in Japan

2003 Annual Report Feedback form
1. What was your overall impression of the Daiwa House group 2003 Annual Report?
Thank you for your cooperation. We would appreciate it if you would send us your completed form
to the fax number shown below.
Consolidated financial highlights
Group performance highlights
Investor information
Dear shareholders
Message from the president
Report by Executive Managing Director (financial affairs)
Corporate governance
Our business domain
Environmental measures
Research and Development
Group network
3. Please indicate here any particular requests you may have regarding future annual reports.
2. Please rate the individual sections of the report by ticking one of each set of three boxes.
4. Please indicate your nationality.
Nationality:
Very clear
+81-6-6342-1591FA X
Average
ComprehensibilityUnclear Very useful Average
Investor usefulness Not very useful
very good good average poor
Please give us your views on the English-language version of the 2003 annual report for the Daiwa House group by answering the questions below.
The Daiwa House group publishes an English-language version of its annual report each year for the convenience of overseas investors. The 2002 edition (for the fiscal 2001 business term) placed 12th in the rankings of the Hong Kong magazine CFO Asia in the category of “Best Asian Annual Report,” while the Belgian company Enterprise.com ranked it 25 out of 50 in its interim list of annual reports.
We would be grateful if you could give us your views, below, on various aspects of our 2003 Annual Report. The information will be used, in the strictest confidence, to help us produce even better investor information in the future.
Consolidated Management Supervision DepartmentDaiwa House Industry Co., Ltd.3-3-5 Umeda, Kita-ku Osaka 530-8241, Japan