New Hampshire Volunteer River Assessment Program 2009 ......2009 Oyster River Watershed Water...
61
______________________________________________________________________________________ 2009 Oyster River Watershed Water Quality Report 1 New Hampshire Volunteer River Assessment Program 2009 Oyster River Watershed Water Quality Report January 2010
Transcript of New Hampshire Volunteer River Assessment Program 2009 ......2009 Oyster River Watershed Water...

______________________________________________________________________________________ 2009 Oyster River Watershed Water Quality Report 1
New Hampshire Volunteer River Assessment Program 2009 Oyster River Watershed Water Quality Report
January 2010

______________________________________________________________________________________ 2009 Oyster River Watershed Water Quality Report 2
NHDES R-WD-10-1T
New Hampshire Volunteer River Assessment Program 2009 Oyster River Watershed Water Quality Report
State of New Hampshire Department of Environmental Services
Water Division Watershed Management Bureau
P.O. Box 95 29 Hazen Drive
Concord, New Hampshire 03302-0095 www.des.nh.gov
Thomas S. Burack Commissioner
Harry T. Stewart Water Division Director
Prepared By:
Ted Walsh, VRAP Program Manager
Jen Drociak, VRAP Coordinator
Sabrina Kliman, VRAP Assistant
Cover Photo: 02-LHB, Littlehale Brook, Durham
January 2010

______________________________________________________________________________________ 2009 Oyster River Watershed Water Quality Report 3
TABLE OF CONTENTS
1. INTRODUCTION………………...……………………………………………6 1.1 Purpose of Report 6 1.2 Report Format 6 2. PROGRAM OVERVIEW……………………………………………………..8 2.1 What is VRAP? 8 2.2 Why is VRAP Important? 8 2.3 How Does VRAP Work? 8 2.4 What is VBAP? 9 2.5 Equipment & Sampling Schedule 9 2.6 Training & Technical Support 9 2.7 Data Usage 10 2.8 Quality Assurance & Quality Control 11 3. METHODS…………………………………………………….……………..13 4. RESULTS & RECOMMENDATIONS ………………………………….17 4.1 Dissolved Oxygen 17 4.2 pH 20 4.3 Turbidity 22 4.4 Specific Conductance 25 4.5 Water Temperature 29 4.6 Escherichia coli/Bacteria 32 4.7 Total Phosphorus 37 4.8 Chloride 39

______________________________________________________________________________________ 2009 Oyster River Watershed Water Quality Report 4
List of Figures and Tables
Figure 1: Dissolved Oxygen Concentration Statistics 18 Figure 2: pH Statistics 21 Figure 3: Turbidity Statistics 23 Figure 4: Specific Conductance Statistics 27 Figure 5: Water Temperature Statistics 31 Figure 6: Escherichia coli/Bacteria Statistics 34 Figure 7: Total Phosphorus Statistics 38 Figure 8: Chloride Statistics 40 Table 1: Field Analytical Quality Controls 12 Table 2: Sampling and Analysis Methods 14 Table 3: Sampling Stations for the Oyster River, 2009 15 Table 4: Dissolved Oxygen Concentration Data Summary 17 Table 5: pH Data Summary 20 Table 6: Turbidity Data Summary 22 Table 7: Specific Conductance Data Summary 26 Table 8: Water Temperature Data Summary 30 Table 9: Escherichia coli/Bacteria Data Summary 33 Table 10: Escherichia coli/Bacteria Geometric Mean Summary 35 Table 11: Total Phosphorus Data Summary 37 Table 12: Chloride Data Summary 39
List of Appendices Appendix A: 2009 Oyster River Watershed Water Quality Data Appendix B: Interpreting VRAP Water Quality Parameters Appendix C: VRAP Volunteer Monitor Field Sampling Procedures Assessment (Field Audit) Appendix D: 2009 Oyster River Watershed Biological Data Appendix E: 2009 Oyster River Watershed Habitat Data

______________________________________________________________________________________ 2009 Oyster River Watershed Water Quality Report 5
ACKNOWLEDGEMENTS The New Hampshire Department of Environmental Services Volunteer River Assessment Program extends sincere thanks to the volunteers of the Oyster River Watershed Association for their efforts during 2009. This report was created solely from the data collected by the volunteers listed below. Their time and dedication is an expression of their genuine concern for local water resources and has significantly contributed to our knowledge of river and stream water quality in New Hampshire.
2009 Oyster River Volunteers
Bill Burtis
Betsy Chadwick
Barbara Flynn
Brian Gallagher
Ben Getchell
Liam Grenier
Jim Hornbeck
Tom Lee
Andrew Middleton
Paul Peppler
Lorie Potter
Emily Poworoznek
Elan Prohl
Gloria Quigley
Carl Starr

______________________________________________________________________________________ 2009 Oyster River Watershed Water Quality Report 6
1.0 INTRODUCTION 1.1. Purpose of Report
Each year the New Hampshire Volunteer River Assessment Program prepares and distributes a water quality report for each volunteer river monitoring group that is based solely on the water quality data collected by that group during a specific year. The reports summarize and interpret the data, particularly as they relate to New Hampshire’s surface water quality standards, and serve as a teaching tool and guidance document for future monitoring activities by the individual volunteer groups.
1.2. Report Format
Each report includes the following:
Volunteer River Assessment Program Overview
This section includes a description of the history of VRAP, the technical support, training and guidance provided by NHDES, and how data is transmitted to the volunteers and used in surface water quality assessments.
Monitoring Program Description
This section provides a description of the volunteer group’s monitoring program including monitoring objectives as well as a table and map showing sample station locations.
Results and Recommendations
Water quality data collected during the year are summarized on a parameter-by-parameter basis using (1) a data summary table that includes the number of samples collected, data ranges, the number of samples meeting New Hampshire water quality standards, and the number of samples adequate for water quality assessments at each station, (2) a discussion of the data, (3) a river graph showing the range of measured values at each station and (4) a list of applicable recommendations.
Sample results reported as less than the detection limit were assumed equal to one-half the detection limit on the river graphs. This approach simplifies the understanding of the parameter of interest, and specifically helps one to visualize how the river or watershed is functioning from upstream to downstream. In addition, this format allows the reader to better understand potential pollution areas and target those areas for additional sampling or environmental enhancements. Where applicable, the river graph also shows New Hampshire surface water quality standards or levels of concern for comparison purposes.
______________________________________________________________________________________ 2009 Oyster River Watershed Water Quality Report 7
Appendix A – Water Quality Data
This appendix includes a spreadsheet detailing the data results and additional information such as data results which do not meet New Hampshire surface water quality standards, and data that are unusable for assessment purposes due to quality control requirements.
Appendix B – Interpreting VRAP Water Quality Parameters
This appendix provides a brief description of water quality parameters typically sampled by VRAP volunteers and their importance, as well as applicable state water quality criteria or levels of concern.
Appendix C – VRAP Volunteer Monitor Field Sampling Procedures Assessment (Field Audits)
This appendix provides an overview of the VRAP Volunteer Monitor Field Sampling Procedures Assessment (field audit) process with respect to programmatic quality assurance/quality control (QA/QC) guidelines.
Appendix D – Biological Data
This appendix includes a spreadsheet detailing biological data results including Order, common name, number of individuals found, group tolerance value, group biotic score, station biotic score, and narrative category.
Appendix E – Habitat Data
This appendix includes a spreadsheet detailing habitat data results such as surrounding land use, riparian habitat, in-stream characteristics, and erosion and other streamside impacts.

______________________________________________________________________________________ 2009 Oyster River Watershed Water Quality Report 8
2.0 PROGRAM OVERVIEW 2.1 What is VRAP? In 1998, the New Hampshire Volunteer River Assessment Program was established to promote awareness and education of the importance of maintaining water quality in New Hampshire’s rivers and streams. VRAP aims to educate people about river and stream water quality and ecology and to improve water quality monitoring coverage for the protection of water resources. Today, VRAP loans water quality monitoring equipment, provides technical support, and facilitates educational programs to volunteer groups on numerous rivers and watersheds throughout the state. VRAP volunteers conduct water quality monitoring on an ongoing basis and increase the amount of river water quality information available to local, state and federal governments, which allows for better watershed planning.
2.2 Why is VRAP Important?
VRAP establishes a regular volunteer-driven water sampling program to assist NHDES in evaluating water quality throughout the state. VRAP empowers volunteers with information about the health of New Hampshire’s rivers and streams. Regular collection of water quality data allows for early detection of water quality changes allowing NHDES to trace potential problems to their source. Data collected by VRAP volunteers are directly contributing to New Hampshire’s obligations under the Clean Water Act. Measurements taken by volunteers are used in assessing the water quality of New Hampshire’s river and streams, and are included in reporting to the US Environmental Protection Agency.
2.3 How Does VRAP Work?
VRAP is a cooperative program between NHDES, river groups, local advisory committees, watershed associations, and individuals working to protect New Hampshire’s rivers and streams. Volunteers are trained by VRAP staff in the use of water quality monitoring equipment at an annual training workshop. VRAP works with each group to establish monitoring stations and develop a sampling plan.
During the summer months, VRAP receives water quality data from trained volunteers. The data are reviewed for quality assurance, and are entered into the environmental monitoring database at NHDES. During the off-season, VRAP interprets the data and compiles the results into an annual report for each river. VRAP volunteers can use the data as a means of understanding the details of water quality, as well as guide future sampling efforts. NHDES can use the data for making surface water quality assessments, provided that the data met certain quality assurance/quality control guidelines.

______________________________________________________________________________________ 2009 Oyster River Watershed Water Quality Report 9
2.4 What is VBAP? The Volunteer Biological Assessment Program (VBAP) was established in 2005 to supplement biological data collected by the New Hampshire Department of Environmental Services Biomonitoring Unit. The Biomonitoring program regularly collects detailed biological data in order to complete water quality assessments of wadeable streams. VBAP serves to educate the public about water quality issues as interpreted through biological data, build a constituency of volunteers to practice sound water quality management at a local level, and build public support for water quality protection.
Since the program’s establishment in 2005, VBAP has continued to work closely with watershed volunteers throughout New Hampshire providing technical assistance, field supervision, training in biological monitoring protocols, educational outreach, and annual biological data collection reports. In 2007, VBAP collaborated with the Volunteer River Assessment Program building greater strength and capability for the future. 2.5 Equipment and Sampling Schedule
VRAP frequently lends and maintains water quality monitoring equipment kits to VRAP groups throughout the state. The kits contain meters and supplies for routine water quality parameter measurements of turbidity, pH, dissolved oxygen, water temperature and specific conductance (conductivity). Other parameters such as nutrients, metals, and E. coli can also be studied, although VRAP does not always provide funds to cover laboratory analysis costs. Thus, VRAP encourages groups to pursue other fundraising activities such as association membership fees, special events, in-kind services (non-monetary contributions from individuals and organizations), and grant writing.
Each year, volunteers design and arrange a sampling schedule in cooperation with VRAP staff. Project designs are created through a review and discussion of existing water quality information, such as known and perceived problem areas or locations of exceptional water quality. The interests, priorities, and resources of the partnership determine monitoring locations, parameters, and frequency. VRAP typically recommends sampling every other week from May through September, and VRAP groups are encouraged to organize a long-term sampling program in order to begin to determine trends in river conditions.
2.6 Training and Technical Support
Each VRAP volunteer attends an annual training workshop to receive a demonstration of monitoring protocols and sampling techniques and the calibration and use of water quality monitoring equipment. During the training, volunteers have an opportunity for hands-on use of the equipment and receive instruction in the collection of samples for laboratory analysis. NHDES also provides equipment, supplies and staff support for VRAP groups participating in biological assessment activities.
VRAP groups conduct sampling according to a prearranged monitoring schedule and VRAP protocols. For groups participating in biological assessment, each

______________________________________________________________________________________ 2009 Oyster River Watershed Water Quality Report 10
station is sampled once annually during the month of September. VRAP staff aim to visit each group annually during a scheduled sampling event to verify that volunteers successfully follow the VRAP protocols. If necessary, volunteers are re-trained during the visit, and the group’s monitoring coordinator is notified of the result of the verification visit. VRAP groups forward water quality results to NHDES for incorporation into an annual report and state water quality assessment activities. Groups participating in biological assessment activities attend two training sessions prior to sampling. The first training session provides information on the biological monitoring protocol and aquatic invertebrate identification. The second session provides instruction in field methods. An NHDES staff person assists volunteers with all biological assessment activities during the sampling period.
2.7 Data Usage Annual Water Quality Reports
Water quality measurements repeated over time create a picture of the fluctuating conditions in rivers and streams and help to determine where improvements, restoration or preservation may benefit the river and the communities it supports. All data collected by volunteers are summarized in water quality reports that are prepared and distributed after the conclusion of the sampling period. VRAP groups can use the reports and data as a means of understanding the details of water quality, guiding future sampling efforts, or determining restoration activities.
New Hampshire Surface Water Quality Assessments
Along with data collected from other water quality programs, specifically the State Ambient River Monitoring Program, applicable volunteer data are used to support periodic NHDES surface water quality assessments. VRAP data are entered into NHDES’s environmental monitoring database and are ultimately uploaded to the EPA database. Assessment results and the methodology used to assess surface waters are published by NHDES every two years (i.e., Section 305(b) Water Quality Reports) as required by the federal Clean Water Act. The reader is encouraged to log on to the NHDES web page to review the assessment methodology and list of impaired waters http://des.nh.gov/organization/divisions/water/wmb/swqa/index.htm/.

______________________________________________________________________________________ 2009 Oyster River Watershed Water Quality Report 11
2.8 Quality Assurance/Quality Control
In order for VRAP data to be used in the assessment of New Hampshire’s surface waters, the data must meet quality control guidelines as outlined in the VRAP Quality Assurance Project Plan (QAPP). The VRAP QAPP was approved by NHDES and reviewed by EPA in the summer of 2003. The QAPP is reviewed annually and is officially updated and approved every five years. The VRAP quality assurance/quality control measures include a six-step approach to ensuring the accuracy of the equipment and consistency in sampling efforts.
Calibration: Prior to each measurement, the pH and DO meters must be calibrated. Conductivity and turbidity meters are checked against a known standard before the first measurement and after the last one.
Replicate Analysis: A second measurement by each meter is taken from the original sample at one of the stations during the sampling day. If the same sampling schedule is used throughout the monitoring season, the replicate analysis should be conducted at different stations. Replicates should be measured within 15 minutes of the original measurements.
6.0 pH Standard: A reading of the pH 6.0 buffer is recorded at one of the stations during the sampling day. If the same sampling schedule is used throughout the monitoring season, the 6.0 pH standard check should be conducted at different stations.
Zero Oxygen Solution: A reading of a zero oxygen solution is recorded at one of the stations during the sampling day. If the same sampling schedule is used throughout the monitoring season, the zero oxygen standard check should be conducted at different stations.
DI (De-Ionized) Turbidity Blank: A reading of the DI blank is recorded at one of the stations during the sampling day. If the same sampling schedule is used throughout the monitoring season, the blank check should be conducted at different stations.
End of the Day Conductivity and Turbidity Meter Check: At the conclusion of each sampling day, the conductivity and turbidity meters are re-checked against a known standard.

______________________________________________________________________________________ 2009 Oyster River Watershed Water Quality Report 12
2.8.1 Measurement Performance Criteria
Precision is calculated for field and laboratory measurements through measurement replicates (instrumental variability) and is calculated for each sampling day. The use of VRAP data for assessment purposes is contingent on compliance with a parameter-specific relative percent difference (RPD) as derived from equation 1, below. Any data exceeding the limits of the individual measures are disqualified from surface water quality assessments. All data that exceeds the limits defined by the VRAP QAPP are acknowledged in the data tables with an explanation of why the data was unusable. Table 1 shows typical parameters studied under VRAP and the associated quality control procedures.
(Equation 1. Relative Percent Difference)
where x1 is the original sample and x2 is the replicate sample
Table 1. Field Analytical Quality Controls
Water Quality Parameter
QC Check QC Acceptance
Limit Corrective Action
Person Responsible for Corrective
Action
Data Quality Indicator
Temperature
Measurement Replicate
RPD < 10% or Absolute Difference
<0.8 C.
Repeat Measurement
Volunteer Monitors
Precision
Measurement Replicate
RPD < 10% Recalibrate
Instrument, Repeat Measurement
Volunteer Monitors
Precision Dissolved Oxygen
Known Buffer (Zero O2 Sol.)
RPD < 10% or Absolute Difference
<0.4 mg/L
Recalibrate Instrument, Repeat Measurement
Volunteer Monitors
Relative Accuracy
Measurement Replicate
Absolute Difference <0.3 pH units
Recalibrate Instrument, Repeat Measurement
Volunteer Monitors
Precision
pH
Known Buffer (pH = 6.0)
± 0.1 std units
Recalibrate Instrument, Repeat Measurement
Volunteer Monitors
Accuracy
Measurement Replicate
RPD < 10% or Absolute Difference
<5µS/cm
Recalibrate Instrument, Repeat Measurement
Volunteer Monitors
Precision Specific
Conductance Method Blank (Zero Air Reading)
± 5.0 µS/cm
Recalibrate Instrument, Repeat Measurement
Volunteer Monitors
Accuracy
Measurement Replicate
RPD < 10% or Absolute Difference
<1.0 NTU
Recalibrate Instrument, Repeat Measurement
Volunteer Monitors
Precision
Turbidity
Method Blank (DI Water)
± 0.1 NTU
Recalibrate Instrument, Repeat Measurement
Volunteer Monitors
Accuracy
Laboratory Parameters
Measurement Replicate
RPD < 20% or Absolute Difference less than ½ the mean
value of the parameter in NHDES’s
Environmental Monitoring Database
Repeat Measurement
Volunteer Monitors
Precision
%100
2
21
21×
+
−=
xx
xxRPD

______________________________________________________________________________________ 2009 Oyster River Watershed Water Quality Report 13
3.0 METHODS
In 2001, volunteers from the Oyster River Watershed Association began monitoring water quality in the Oyster River watershed. The goal of this effort was to provide water quality data from the Oyster River watershed relative to surface water quality standards and to allow for the assessment of the river for support of aquatic life and primary contact recreation (swimming). The establishment of a long-term monitoring program allows for an understanding of the river’s dynamics, or variations on a station-by-station and year-to-year basis. The data can also serve as a baseline from which to determine any water pollution problems in the river and/or watershed. The Volunteer River Assessment Program has provided field training, equipment, and technical assistance.
During 2009, trained volunteers from the Oyster River Watershed Association monitored water quality at 30 stations in the Oyster River Watershed (Table 3). Station IDs are designated using a three-letter code to identify the waterbody name plus a number indicating the relative position of the station. The higher the station number the more upstream the station is in the watershed. The Oyster River and all its tributaries in the towns of Barrington, Durham, Lee, and Madbury from their sources to the crest of the Durham Reservoir water supply dam are designated as Class A waters. All other portions of the Oyster River downstream of the water supply dam are designated as Class B waters. These classifications are used to apply the appropriate water quality standards.
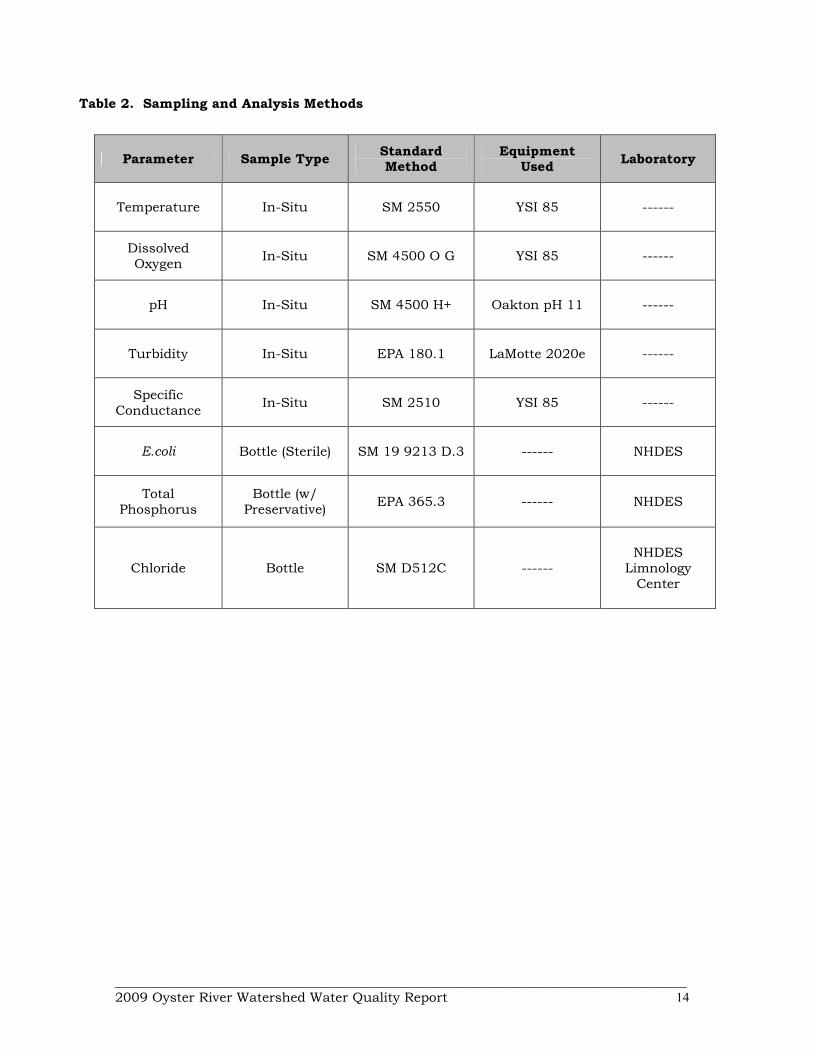
Water quality monitoring was conducted from March to November. In-situ measurements of water temperature, dissolved oxygen, pH, turbidity and specific conductance were taken using handheld meters provided by NHDES. Samples for E.coli, total phosphorus, and chloride were taken using bottles supplied by the NHDES were stored on ice during transport from the field to the lab. Table 2 summarizes the parameters measured, laboratory standard methods, and equipment used.
In 2009, volunteers also conducted biological assessments in the Oyster River watershed. The goal of this effort is to complete “screening” level investigations of aquatic macroinvertebrate communities inhabiting the Oyster River and surrounding tributaries. Annual biological sampling at designated stations throughout the watershed can provide an indication of biological community condition, general water quality and overall watershed health as well as highlight changes that occur over time. The program serves to provide supplementary biological data to the NHDES Biomonitoring Program, enhancing state wide monitoring efforts and tracking potential problem areas needing further investigation. NHDES provides field training, equipment, financial assistance, and technical assistance.
______________________________________________________________________________________ 2009 Oyster River Watershed Water Quality Report 14
Table 2. Sampling and Analysis Methods
Parameter Sample Type Standard Method
Equipment Used
Laboratory
Temperature In-Situ SM 2550 YSI 85 ------
Dissolved Oxygen
In-Situ SM 4500 O G YSI 85 ------
pH In-Situ SM 4500 H+ Oakton pH 11 ------
Turbidity In-Situ EPA 180.1 LaMotte 2020e ------
Specific Conductance
In-Situ SM 2510 YSI 85 ------
E.coli Bottle (Sterile) SM 19 9213 D.3 ------ NHDES
Total Phosphorus
Bottle (w/ Preservative)
EPA 365.3 ------ NHDES
Chloride Bottle SM D512C ------ NHDES Limnology Center

______________________________________________________________________________________ 2009 Oyster River Watershed Water Quality Report 15
Table 3. 2009 Sampling Stations for Oyster River Watershed, NHDES VRAP
Station ID & AUID Class Waterbody Name
Location Town Elevation (Rounded to the Nearest 100 Feet)
15-OYS NHRIV600030902-02
A Oyster River
Sugar Shack Barrington 100
01-XBB NHRIV600030902-03
A
Unnamed Tributary to Oyster River
Wheelright Pond Outlet, Stepping Stone Road
Bridge Lee 100
13-OYS NHRIV600030902-03
A Oyster River
Route 4 Bridge, East of Lee Traffic Circle
Lee 100
07-WDY NHRIV600030902-16
A Wendy's Brook
Route 125 Upstream of Lockit Driveway
Lee 150
06X-WDY NHRIV600030902-16
A Wendy's Brook
100’ Upstream of Pinecrest Estates
Lee 150
06T-WDY NHRIV600030902-16
A Wendy's Brook
100’ Downstream of Pinecrest Estates
Lee 150
06-WDY NHRIV600030902-16
A Wendy's Brook
Upstream Side of Wentworth Douglas
Entrance Lee 150
05-WDY-R-PIPE No AUID
NA NA Pipe River Right Just Upstream of 05-WDY
Lee 150
05-WDY-L-PIPE No AUID
NA NA Pipe River Left Just Upstream of 05-WDY
Lee 150
05-WDY-CEN-PIPE No AUID
NA NA Center Pipe Just
Upstream of 05-WDY Lee 150
05-WDY NHRIV600030902-16
A Wendy's Brook
Downstream of Route 125 Culvert, Market Basket Driveway
Lee 150
04P-WDY NHRIV600030902-16
A Wendy's Brook
250’ Downstream of 05-WDY
Lee 150
04K-WDY NHRIV600030902-16
A Wendy's Brook
250’ Upstream of 04-WDY
Lee 150
04-WDY NHRIV600030902-16
A Wendy's Brook
Between Market Basket Lot and Rte. 125
Lee 150
03-WDY NHRIV600030902-16
A Wendy's Brook
Upstream of Confluence w/Market Basket Brook
Lee 150
02-MBB No AUID
NA Market Basket Brook
Outlet of Market Basket Plaza Stormwater Pond
Lee 150
02-WDY NHRIV600030902-16
A Wendy's Brook
Outlet of Culvert Behind Wendy’s
Lee 150

______________________________________________________________________________________ 2009 Oyster River Watershed Water Quality Report 16
01-WDY NHRIV600030902-16
A Wendy's Brook
Footbridge 500’ Upstream of Confluence with Oyster River
Lee 100
01-DBE NHRIV600030902-03
A Dube Brook
Cherry Lane Bridge Madbury 100
09-OYS NHRIV600030902-04
A Oyster River
Rt. 155A Bridge, USGS Gaging Station
Lee 100
08-OYS NHRIV600030902-04
A Oyster River
Mast Road Bridge Durham 100
01-CSB NHRIV600030902-04
A Chelsey Brook
Packers Falls Road Bridge
Lee 100
07-OYS NHRIV600030902-04
A Oyster River
Footbridge College Woods
Durham 100
01-HML NHRIV600030902-08
B Hamel Brook
Route 108 Bridge Durham 0
00E-CGB NHRIV600030902-09
B College Brook
Mill Pond Road Bridge Durham 0
05-OYS NHIMP600030902-04
B Oyster River
Route 108/Newmarket Rd. Bridge
Durham 0
00J-PRB NHRIV600030902-10
B Pettee Brook
End of Summer Terrace Durham 0
02G-BRD NHRIV600030902-11
B Beards Creek
Stoleworthy Wildlife Sanctuary
Durham 0
02-BRD NHIMP600030902-06
B Beards Creek
Coe Drive Bridge Durham 0
03-JNC NHRIV600030902-13
B Johnson Creek
Freshet Road Bridge Durham 0

______________________________________________________________________________________ 2009 Oyster River Watershed Water Quality Report 17
4.0 RESULTS AND RECOMMENDATIONS
Results and recommendations for each monitored parameter are presented in the following sections. For a description of the importance of each parameter and pertinent water quality criteria for these and other parameters, please see Appendix B, “Interpreting VRAP Water Quality Parameters.”
4.1 Dissolved Oxygen
Either eight or nine measurements were taken in the field for dissolved oxygen concentration at 14 stations in the Oyster River watershed (Table 4). Of the 113 measurements taken, all met quality assurance/quality control requirements and are usable for New Hampshire’s 2010 surface water quality report to the US Environmental Protection Agency.
The Class A New Hampshire surface water quality standard for dissolved oxygen is a minimum concentration of 6.0 mg/L and a minimum daily average saturation of 75 %. The Class B New Hampshire surface water quality standard for dissolved oxygen includes a minimum concentration of 5.0 mg/L and a minimum daily average of 75 % of saturation. In other words, there are criteria for both concentration and saturation that must be met before the river can be assessed as meeting dissolved oxygen standards. Table 4 reports only dissolved oxygen concentration as more detailed analysis is required to determine if instantaneous dissolved oxygen saturation measurements are above or below water quality standards.
Table 4. Dissolved Oxygen (mg/L) Concentration Summary – Oyster River Watershed, 2009
Station ID
Class Samples Collected
Data Range (mg/l)
Acceptable Samples Not Meeting NH Class A/B Standards
Number of Usable Samples for 2010 NH Surface Water
Quality Assessment
15-OYS A 9 8.30 - 12.67 0 9
01-XBB A 8 3.96 - 10.30 3 8
13-OYS A 8 4.44 - 9.92 3 8
01-WDY A 8 8.16 - 11.46 0 8
01-DBE A 8 7.03 - 11.69 0 8
09-OYS A 8 7.36 - 11.28 0 8
08-OYS A 8 7.60 - 12.00 0 8
01-CSB A 8 6.69 - 10.36 0 8
07-OYS A 8 7.30 - 10.66 0 8
01-HML B 8 3.38 - 9.98 4 8
00E-CGB B 8 7.49 - 10.26 0 8
00J-PRB B 8 7.86 - 11.21 0 8
02G-BRD B 8 8.16 - 11.67 0 8
03-JNC B 8 8.20 - 13.10 0 8
Total 113 10 113

______________________________________________________________________________________ 2009 Oyster River Watershed Water Quality Report 18
Dissolved oxygen concentration levels were above the relevant New Hampshire surface water quality standard at most stations on all occasions. Three stations (01-XBB, 13-OYS, 01-HML) had one or more measurements that fell below the New Hampshire Class A or Class B surface water quality standard. The average dissolved oxygen concentration ranged from 6.64 mg/L to 10.34 mg/L (Figure 1). Levels of dissolved oxygen sustained above the standards are considered adequate for the support of aquatic life and other desirable water quality conditions. Stations where the instantaneous dissolved oxygen standard was not met could potentially have a dissolved oxygen problem and further investigation is warranted. Low dissolved oxygen levels can be the result of natural conditions (e.g., the presence of wetlands or stagnant water caused by a beaver dam)
Figure 1. Dissolved Oxygen Statistics for the Oyster River Watershed
April 17 - November 21, 2009, NHDES VRAP
0
1
2
3
4
5
6
7
8
9
10
11
12
13
14
15
16
15-OYS
01-XBB
13-OYS
01-WDY
01-DBE
09-OYS
08-OYS
01-CSB
07-OYS
01-HML
00E-CGB
00J-PRB
02G-BRD
03-JNC
Station ID
Dissolved Oxygen (mg/L)
Individual Dissolved Oxygen Measurements
Average
Class A Single Sample NH SWQS
Class B Single Sample NH SWQS

______________________________________________________________________________________ 2009 Oyster River Watershed Water Quality Report 19
Recommendations
Continue sampling at all stations in order to develop a long-term data set to better understand trends as time goes on.
If possible, take measurements between 5 a.m. and 10 a.m., which is when dissolved oxygen is usually the lowest, and between 2 p.m. and 7 p.m. when dissolved oxygen is usually the highest. In general, dissolved oxygen levels are lowest in the early morning when there is low photosynthetic activity and a peak in respiration from organisms throughout the water column. This is the time of least oxygen production and greatest carbon dioxide emission. Peak dissolved oxygen levels occur when photosynthetic activity is at its peak. The greater the amount of photosynthetic activity the greater the production of oxygen as a byproduct of photosynthesis.
Continue incorporating the use of in-situ dataloggers to automatically record dissolved oxygen saturation levels during a period of several days. Stations with potential dissolved oxygen problems should be the priority for datalogger deployments.

______________________________________________________________________________________ 2009 Oyster River Watershed Water Quality Report 20
4.2 pH Eight measurements were taken in the field for pH at 14 stations in the Oyster River watershed (Table 5). Of the 112 measurements taken, all met quality assurance/quality control requirements and are usable for New Hampshire’s 2010 surface water quality report to the US Environmental Protection Agency.
The Class A and B New Hampshire surface water quality standard is 6.5 - 8.0, unless naturally occurring.
Table 5. pH Data Summary - Oyster River Watershed, 2009
Station ID
Class Samples Collected
Data Range (standard units)
Acceptable Samples Not Meeting NH Class A/B Standards
Number of Usable Samples for 2010 NH Surface Water
Quality Assessment
15-OYS A 8 5.87 - 6.77 6 8
01-XBB A 8 6.58 - 7.08 0 8
13-OYS A 8 6.10 - 6.70 6 8
01-WDY A 8 6.44 - 7.02 1 8
01-DBE A 8 6.76 - 7.08 0 8
09-OYS A 8 6.65 - 7.10 0 8
08-OYS A 8 6.56 - 7.15 0 8
01-CSB A 8 6.48 - 7.07 1 8
07-OYS A 8 6.46 - 7.17 1 8
01-HML B 8 6.30 - 6.93 1 8
00E-CGB B 8 6.86 - 7.57 0 8
00J-PRB B 8 6.67 - 7.35 0 8
02G-BRD B 8 6.96 - 7.58 0 8
03-JNC B 8 6.67 - 7.37 0 8
Total _____ 112 _____ 16 112
Many of the stations had at least one pH measurement below the Class A or Class B minimum standard (Figure 2). In general, stations in the upper portion of the watershed had lower pH measurements, in comparison with stations in the middle to lower portion of the watershed. Lower pH measurements are likely the result of natural conditions such as the soils, geology, or the presence of wetlands in the area. Rain and snow falling in New Hampshire is relatively acidic, which can also affect pH levels; after the spring melt or significant rain events, surface waters will generally have a lower pH.

______________________________________________________________________________________ 2009 Oyster River Watershed Water Quality Report 21
Figure 2. pH Statistics for the Oyster River Watershed
April 17 - November 21, 2009, NHDES VRAP
4.0
4.5
5.0
5.5
6.0
6.5
7.0
7.5
8.0
15-OYS
01-XBB
13-OYS
01-WDY
01-DBE
09-OYS
08-OYS
01-CSB
07-OYS
01-HML
00E-CGB
00J-PRB
02G-BRD
03-JNC
Station ID
pH (standard units)
Individual pH Measurements
MEDIAN
NH Class A/B SWQS Minimum
Recommendations
Continue sampling at all stations in order to develop a long-term data set to better understand trends as time goes on.

______________________________________________________________________________________ 2009 Oyster River Watershed Water Quality Report 22
4.3 Turbidity Either eight or nine measurements were taken in the field for turbidity at 14 stations in the Oyster River watershed [Table 6]. Of the 113 measurements taken, all met quality assurance/quality control requirements and are usable for New Hampshire’s 2010 surface water quality report to the US Environmental Protection Agency. New Hampshire Surface Water Quality Standards state that turbidity of Class A waters shall be as naturally occurring. The Class B New Hampshire surface water quality standard for turbidity is less than 10 NTU above background. Samples that exceeded the 2009 average for a given station by more than 10 NTU are designated as “potentially not meeting standards”. Higher turbidity measurements may be naturally occurring as they are influenced by precipitation, soil type, the composition of the streambed and the geology of the streambed. Table 6. Turbidity Data Summary - Oyster River Watershed, 2009
Station ID
Class Samples Collected
Data Range (NTU)
Acceptable Samples
Potentially Not Meeting NH Class A/B Standards
Number of Usable Samples for 2010 NH
SWQA
15-OYS A 9 0.26 - 2.01 0 9
01-XBB A 8 0.07 - 1.94 0 8
13-OYS A 8 0.59 - 7.72 0 8
01-WDY A 8 2.94 - 24.1 1 8
01-DBE A 8 3.60 - 11.5 0 8
09-OYS A 8 2.43 - 12.3 0 8
08-OYS A 8 2.91 - 16.9 1 8
01-CSB A 8 1.23 - 5.77 0 8
07-OYS A 8 3.80 - 11.50 0 8
01-HML B 8 2.29 - 14.8 1 8
00E-CGB B 8 2.09 - 15.8 1 8
00J-PRB B 8 2.24 - 25.3 2 8
02G-BRD B 8 1.85 - 25.1 1 8
03-JNC B 8 2.88 - 21.7 1 8
Total _____ 113 _____ 8 113

______________________________________________________________________________________ 2009 Oyster River Watershed Water Quality Report 23
Turbidity levels were very variable with the average ranging from 0.9 NTU to 7.7 NTU (Figure 3). Seven stations had one or more elevated measurements potentially not meeting New Hampshire surface water quality standards. A majority of these elevated turbdity measurements occurred on 6/19/09 when it was recorded on the field data sheets the river flows were high and the UNH weather station recorded approximately an inch of rain in the prior 24 hours. Although clean waters are associated with low turbidity there is a high degree of natural variability involved. Precipitation often contributes to increased turbidity by flushing sediment, organic matter and other materials from the surrounding landscape into surface waters. However, human activities such as removal of vegetation near surface waters and disruption of nearby soils can lead to dramatic increases in turbidity levels. In general it is typical to see a rise in turbidity in more developed areas due to increased runoff.
Figure 3. Turbidity Statistics for the Oyster River Watershed
April 17 - November 21, 2009, NHDES VRAP
0
5
10
15
20
25
30
35
15-OYS
01-XBB
13-OYS
01-WDY
01-DBE
09-OYS
08-OYS
01-CSB
07-OYS
01-HML
00E-CGB
00J-PRB
02G-BRD
03-JNC
Station ID
Turbidity (NTU)
Individual Turbidity Measurements
Average

______________________________________________________________________________________ 2009 Oyster River Watershed Water Quality Report 24
Recommendations
Continue sampling at all stations in order to develop a long-term data set to better understand trends as time goes on.
Collect samples during wet weather. This will help us to understand how the river responds to runoff and sedimentation.
If a higher than normal turbidity measurement occurs, volunteers can investigate further by moving upstream and taking additional measurements. This will facilitate isolating the location of the cause of the elevated turbidity levels. In addition, take good field notes and photographs. If human activity is suspected or verified as the source of elevated turbidity levels, volunteers should contact NHDES.

______________________________________________________________________________________ 2009 Oyster River Watershed Water Quality Report 25
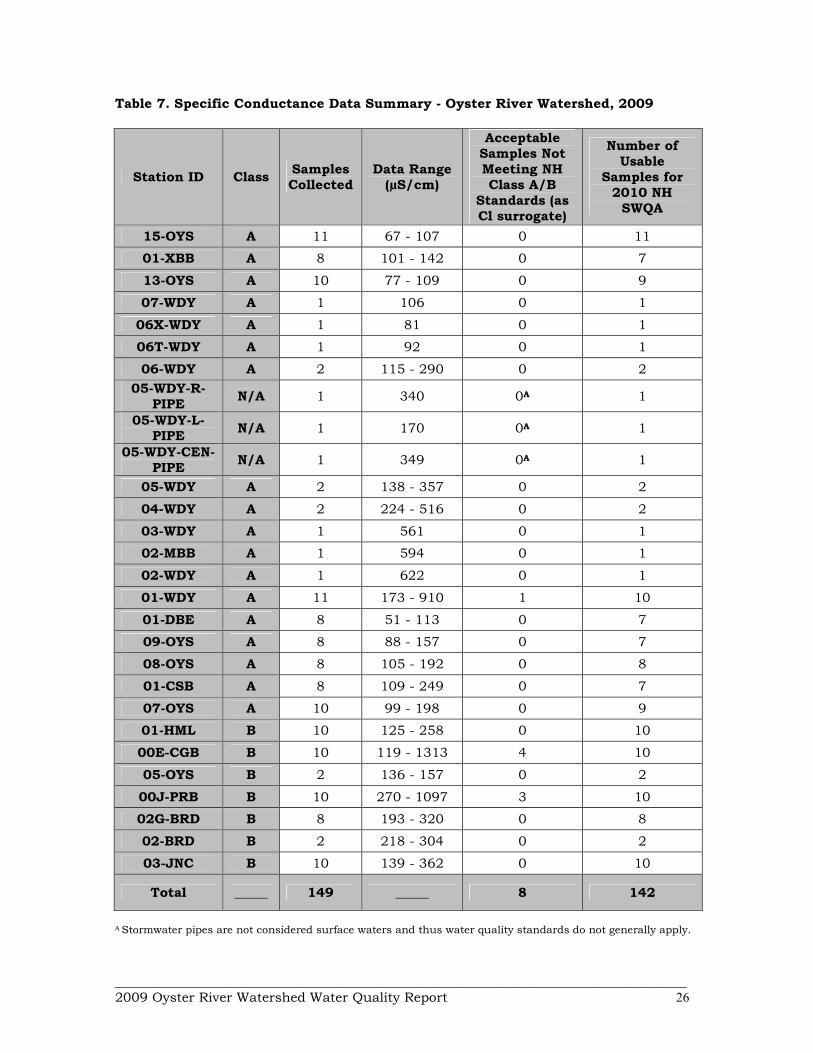
4.4 Specific Conductance Between two and 11 measurements were taken in the field for specific conductance at 28 stations in the Oyster River watershed (Table 7). Of the 149 measurements taken, 142 met quality assurance/quality control requirements and are usable for New Hampshire’s 2010 surface water quality report to the US Environmental Protection Agency. New Hampshire surface water quality standards do not contain numeric criteria for specific conductance although in many fresh surface waters, specific conductance can be used as a surrogate to predict compliance with numeric water quality criteria for chloride. Specific conductance levels were highly variable with the average ranging from 78 µS/cm to 785 µS/cm (Figure 4). Stations in the Wendys Brook, College Brook, and Pettee Brook watersheds had significantly higher specific conductance levels than other stations throughout the watershed. Higher specific conductance levels can be indicative of pollution from sources such as urban/agricultural runoff, road salt, failed septic systems, or groundwater pollution. Thus, the variable specific conductance levels indicate low pollutant levels at some stations and high pollutant levels at others.
______________________________________________________________________________________ 2009 Oyster River Watershed Water Quality Report 26
Table 7. Specific Conductance Data Summary - Oyster River Watershed, 2009
Station ID Class Samples Collected
Data Range (µS/cm)
Acceptable Samples Not Meeting NH Class A/B
Standards (as Cl surrogate)
Number of Usable
Samples for 2010 NH SWQA
15-OYS A 11 67 - 107 0 11
01-XBB A 8 101 - 142 0 7
13-OYS A 10 77 - 109 0 9
07-WDY A 1 106 0 1
06X-WDY A 1 81 0 1
06T-WDY A 1 92 0 1
06-WDY A 2 115 - 290 0 2
05-WDY-R-PIPE
N/A 1 340 0A 1
05-WDY-L-PIPE
N/A 1 170 0A 1
05-WDY-CEN-PIPE
N/A 1 349 0A 1
05-WDY A 2 138 - 357 0 2
04-WDY A 2 224 - 516 0 2
03-WDY A 1 561 0 1
02-MBB A 1 594 0 1
02-WDY A 1 622 0 1
01-WDY A 11 173 - 910 1 10
01-DBE A 8 51 - 113 0 7
09-OYS A 8 88 - 157 0 7
08-OYS A 8 105 - 192 0 8
01-CSB A 8 109 - 249 0 7
07-OYS A 10 99 - 198 0 9
01-HML B 10 125 - 258 0 10
00E-CGB B 10 119 - 1313 4 10
05-OYS B 2 136 - 157 0 2
00J-PRB B 10 270 - 1097 3 10
02G-BRD B 8 193 - 320 0 8
02-BRD B 2 218 - 304 0 2
03-JNC B 10 139 - 362 0 10
Total _____ 149 _____ 8 142
A Stormwater pipes are not considered surface waters and thus water quality standards do not generally apply.

______________________________________________________________________________________ 2009 Oyster River Watershed Water Quality Report 27
Figure 4. Specific Conductance Statistics for the Oyster River Watershed
March 13 - November 21, 2009, NHDES VRAP
0
100
200
300
400
500
600
700
800
900
1000
1100
1200
1300
1400
15-OYS
01-XBB
13-OYS
07-WDY
06X-WDY
06T-WDY
06-WDY
05-WDY-R-PIPE
05-WDY-L-PIPE
05-WDY-CEN-PIPE
05-WDY
04-WDY
03-WDY
02-MBB
02-WDY
01-WDY
01-DBE
09-OYS
08-OYS
01-CSB
07-OYS
01-HML
00E-CGB
05-OYS
00J-PRB
02G-BRD
02-BRD
03-JNC
Station ID
Specific Conductance (µS/cm)
Individual Specific Conductance Measurements (March - April)
Individual Specific Conductance Measurements (May - October)
Average
Chronic SWQS SpCond Surrogate

______________________________________________________________________________________ 2009 Oyster River Watershed Water Quality Report 28
During 2009 the Oyster River VRAP Group also monitored specific conductance during the winter and early spring months to more fully assess the watershed for both specific conductance and chloride. Chloride and specific conductance are very closely related to one another and the protocols NHDES uses to assess waterbodies allows specific conductance to be used as a formal surrogate for chloride. Monitoring for specific conductance and chloride in the winter and early spring months will help determine what the impact of road salt application is in the watershed and indicated what time of year chloride levels tend to be highest. Specific conductance measurements taken during the winter and snowmelt months are indicted with a separate color in Figure 4.
Recommendations
Continue sampling at all stations in order to develop a long-term data set to better understand trends as time goes on.
Continue collecting chloride samples at the same time that specific conductance is measured. This should be conducted during both snowmelt condition and summer low flow conditions.

______________________________________________________________________________________ 2009 Oyster River Watershed Water Quality Report 29
4.5 Water Temperature
Between one and 11 measurements were taken in the field for water temperature at 25 stations in the Oyster River watershed (Table 8). Of the 141 measurements taken, all met quality assurance/quality control requirements and are usable for New Hampshire’s 2010 surface water quality report to the US Environmental Protection Agency. Although there is currently no numerical water quality criteria for water temperature, NHDES is in the process of collecting biological and water temperature data that will contribute to the development of a procedure for assessing rivers and stream based on water temperature and its corresponding impact to the biological integrity of the waterbody. Figure 5 shows the results of instantaneous water temperature measurements taken at 16 stations in the Oyster River watershed. The average water temperature varied from 1.3 °C. to 15.3 °C. Water temperature is a critical parameter for aquatic life and has an impact on other water quality parameters such as dissolved oxygen concentrations, and the activity of bacteria in the water. Water temperature controls the metabolic and reproductive processes of aquatic species and can determine which fish and macroinvertabrate species can survive in a given river or stream. A number of factors can have an impact on water temperature including the quantity and maturity of riparian vegetation along the shoreline, the rate of flow, the percent of impervious surfaces contributing stormwater, thermal discharges, impoundments and the influence of groundwater.
Recommendations
Continue collecting water temperature data via both instantaneous reading and long-term deployment of datalogger

______________________________________________________________________________________ 2009 Oyster River Watershed Water Quality Report 30
Table 8. Water Temperature Data Summary – Oyster River Watershed, 2009
Station ID Class Samples Collected
Data Range (°C)
Acceptable Samples Not Meeting NH Class A/B Standards
Number of Usable Samples for 2010 NH
SWQA
15-OYS A 11 0.1 - 19.6 Not Applicable 11
01-XBB A 8 4.4 - 25.6 N/A 8
13-OYS A 10 0.2 - 21.8 N/A 10
06X-WDY A 1 20.3 N/A 1
06T-WDY A 1 20.2 N/A 1
06-WDY A 1 19.8 N/A 1
05-WDY-R-PIPE
N/A 1 15.6 N/A 1
05-WDY-L-PIPE
N/A 1 18.6 N/A 1
05-WDY-CEN-PIPE
N/A 1 16.5 N/A 1
05-WDY A 1 19.5 N/A 1
04-WDY A 1 19.5 - 19.5 N/A 1
01-WDY A 10 0.8 - 20.5 N/A 10
01-DBE A 8 3.5 - 19.2 N/A 8
09-OYS A 8 5.1 - 20.5 N/A 8
08-OYS A 8 5.8 - 20.7 N/A 8
01-CSB A 8 5.8 - 16.7 N/A 8
07-OYS A 10 0.1 - 19.7 N/A 10
01-HML B 10 0.3 - 20.4 N/A 10
00E-CGB B 10 1.1 - 19.5 N/A 10
05-OYS B 2 0.3 - 2.3 N/A 2
00J-PRB B 10 1.4 - 20.5 N/A 10
02G-BRD B 8 5.9 - 19.8 N/A 8
02-BRD B 2 0.5 - 2 N/A 2
03-JNC B 10 0 - 18.9 N/A 10
Total _____ 141 _____ N/A 141

______________________________________________________________________________________ 2009 Oyster River Watershed Water Quality Report 31
Figure 5. Water Temperature Statistics for the Oyster River Watershed
March 13 - November 21, 2009, NHDES VRAP
0
2
4
6
8
10
12
14
16
18
20
22
24
26
28
30
15-OYS
01-XBB
13-OYS
06X-WDY
06T-WDY
06-WDY
05-WDY-R-PIPE
05-WDY-L-PIPE
05-WDY-CEN-PIPE
05-WDY
04-WDY
01-WDY
01-DBE
09-OYS
08-OYS
01-CSB
07-OYS
01-HML
00E-CGB
05-OYS
00J-PRB
02G-BRD
02-BRD
03-JNC
Station ID
Temperature (C)
Individual Temperature Measurements
Average

______________________________________________________________________________________ 2009 Oyster River Watershed Water Quality Report 32
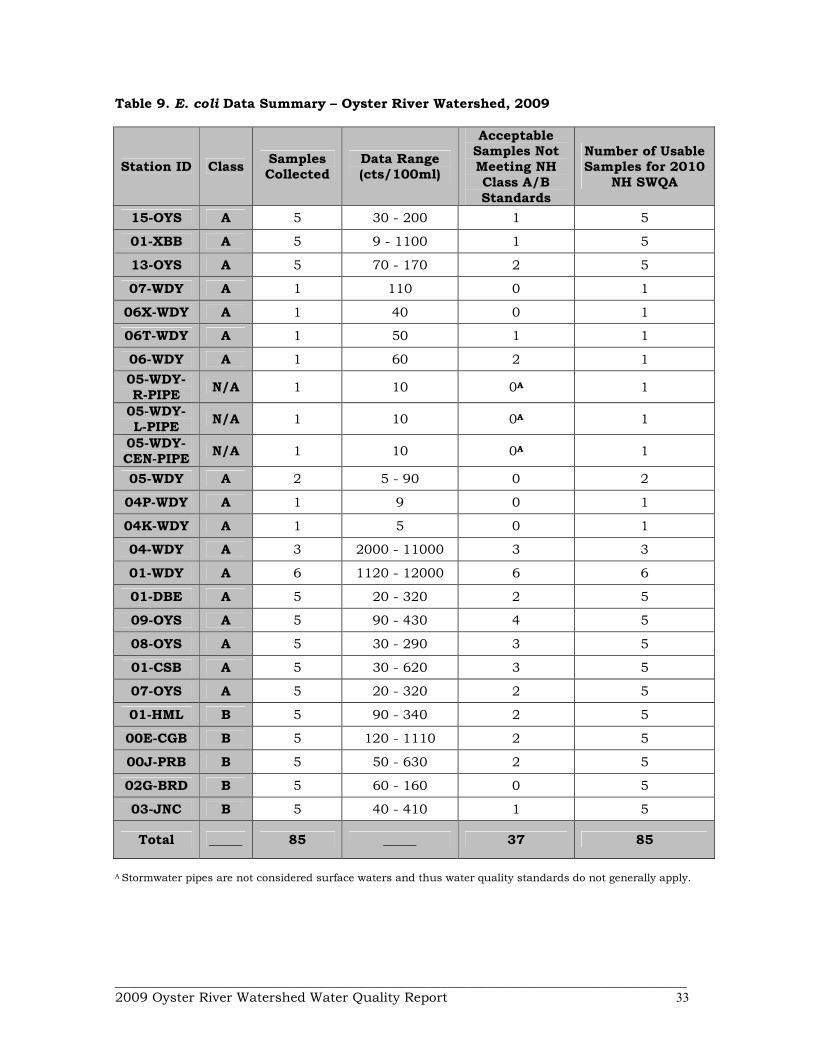
4.6 Escherichia coli/Bacteria Between one and five samples were taken for Escherichia coli (E. coli) at 25 stations in the Oyster River watershed (Table 9). Of the 85 samples taken, all met quality assurance/quality control requirements and are usable for New Hampshire’s 2010 surface water quality report to the US Environmental Protection Agency. Class A New Hampshire surface water quality standards for E.coli are as follows:
<153 cts/100 ml, based on any single sample, or <47 cts/100 ml, based on a geometric mean calculated from three samples collected within a 60-day period.
Class B New Hampshire surface water quality standards for E.coli are as follows:
<406 cts/100 ml, based on any single sample, or <126 cts/100 ml, based on a geometric mean calculated from three samples collected within a 60-day period.
The majority of stations had one or more measurement that exceeded the relevant single sample water quality standard for E. coli (Figure 6). During 2009 more intensive E. coli sampling was conducted in the Wendys Brook watershed due to historically high levels of E. coli previously documented at 01-WDY. Stations in the Wendys Brook watershed upstream of 04-WDY had no exceedences of the Class A water quality standard for E. coli. Station 04-WDY and the downstream station 01-WDY had extremely high E.coli levels indicative of an acute problem. The two stations on the mainstem of the Oyster River (15-OYS and 13-OYS) upstream of the confluence of Wendy’s Brook had lower occurrences of E. coli exceedences than the stations on the mainstem downstream of the confluence. NHDES will continue working with the Oyster River Watershed Association to determine the source of these high E. coli levels and to work to remediate any identified sources. Several factors can contribute to elevated E. coli levels, including, but not limited to rain storms, low river flows, the presence of wildlife (e.g., birds), and the presence of septic systems along the river.
______________________________________________________________________________________ 2009 Oyster River Watershed Water Quality Report 33
Table 9. E. coli Data Summary – Oyster River Watershed, 2009
Station ID Class Samples Collected
Data Range (cts/100ml)
Acceptable Samples Not Meeting NH Class A/B Standards
Number of Usable Samples for 2010
NH SWQA
15-OYS A 5 30 - 200 1 5
01-XBB A 5 9 - 1100 1 5
13-OYS A 5 70 - 170 2 5
07-WDY A 1 110 0 1
06X-WDY A 1 40 0 1
06T-WDY A 1 50 1 1
06-WDY A 1 60 2 1
05-WDY-R-PIPE
N/A 1 10 0A 1
05-WDY-L-PIPE
N/A 1 10 0A 1
05-WDY-CEN-PIPE
N/A 1 10 0A 1
05-WDY A 2 5 - 90 0 2
04P-WDY A 1 9 0 1
04K-WDY A 1 5 0 1
04-WDY A 3 2000 - 11000 3 3
01-WDY A 6 1120 - 12000 6 6
01-DBE A 5 20 - 320 2 5
09-OYS A 5 90 - 430 4 5
08-OYS A 5 30 - 290 3 5
01-CSB A 5 30 - 620 3 5
07-OYS A 5 20 - 320 2 5
01-HML B 5 90 - 340 2 5
00E-CGB B 5 120 - 1110 2 5
00J-PRB B 5 50 - 630 2 5
02G-BRD B 5 60 - 160 0 5
03-JNC B 5 40 - 410 1 5
Total _____ 85 _____ 37 85
A Stormwater pipes are not considered surface waters and thus water quality standards do not generally apply.
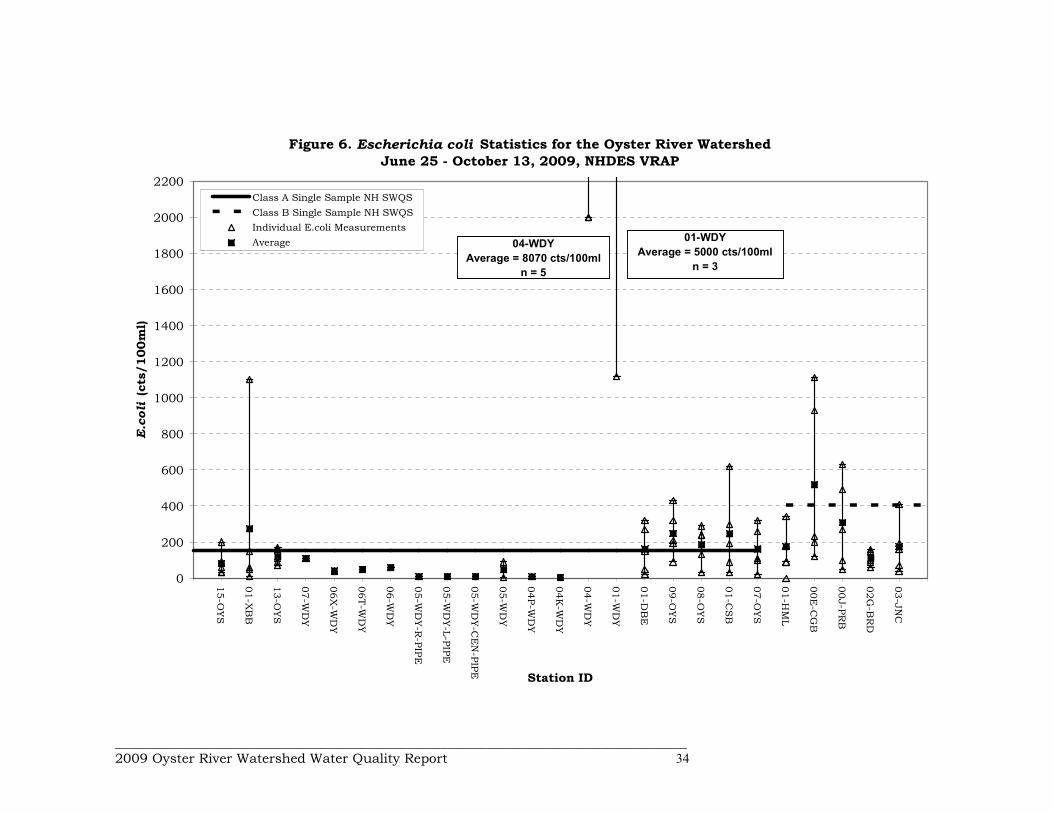
______________________________________________________________________________________ 2009 Oyster River Watershed Water Quality Report 34
Figure 6. Escherichia coli Statistics for the Oyster River Watershed
June 25 - October 13, 2009, NHDES VRAP
0
200
400
600
800
1000
1200
1400
1600
1800
2000
2200
15-OYS
01-XBB
13-OYS
07-WDY
06X-WDY
06T-WDY
06-WDY
05-WDY-R-PIPE
05-WDY-L-PIPE
05-WDY-CEN-PIPE
05-WDY
04P-WDY
04K-WDY
04-WDY
01-WDY
01-DBE
09-OYS
08-OYS
01-CSB
07-OYS
01-HML
00E-CGB
00J-PRB
02G-BRD
03-JNC
Station ID
E.coli (cts/100ml)
Class A Single Sample NH SWQS
Class B Single Sample NH SWQS
Individual E.coli Measurements
Average 01-WDY
Average = 5000 cts/100ml
n = 3
04-WDY
Average = 8070 cts/100ml
n = 5

______________________________________________________________________________________ 2009 Oyster River Watershed Water Quality Report 35
In order to fully determine whether a waterbody is meeting surface water standards for E. coli a geometric mean must be calculated. A geometric mean is calculated using three samples collected within a 60-day period. At 15 stations at least one geometric means was calculated All stations where geometric means were calculated had one or more geometric means that exceeded the relevant surface water quality standard for E. coli (Table 10). Table 10: E.coli Geometric Mean Data Summary – Oyster River Watershed, 2009
Station ID Class Geometic Means
Calculated
Geometric Means Not Meeting NH
Class A/B Standards
Number of Usable Samples for 2010 NH Surface Water Quality Assessment
15-OYS A 3 2 3
01-XBB A 3 2 3
13-OYS A 3 3 3
04-WDY A 1 1 1
01-WDY A 4 4 4
01-DBE A 3 3 3
09-OYS A 3 3 3
08-OYS A 3 3 3
01-CSB A 3 3 3
07-OYS A 3 3 3
01-HML B 3 1 3
00E-CGB B 3 3 3
00J-PRB B 3 3 3
02G-BRD B 3 1 3
03-JNC B 3 3 3
Total _____ 44 38 44

______________________________________________________________________________________ 2009 Oyster River Watershed Water Quality Report 36
Recommendations
Continue to collect three samples within any 60-day period during the summer to allow for determination of geometric means. Samples need only be collected during the critical period of May 24 to September 15 for assessment purposes. This coincides with the peak contact recreation season.
Continue to document river conditions and station characteristics (including the presence of wildlife in the area during sampling).At stations with particularly high bacteria levels volunteers can investigate further by moving upstream and taking additional measurements. This will facilitate isolating the location of the cause of the elevated bacteria levels. Those sampling should also look for any potential sources of bacteria such as emission pipes, failed septic systems, farm animals, pet waste, wildlife and waterfowl.
Continue investigation into the acutely high E. coli levels in the Wendys Brook watershed.

______________________________________________________________________________________ 2009 Oyster River Watershed Water Quality Report 37
4.7 Total Phosphorus
One sample was taken for total phosphorus at three stations in the Wendys Brook watershed (Table 11). Of the three samples taken, all met quality assurance/quality control requirements and are usable for New Hampshire’s 2010 surface water quality report to the US Environmental Protection Agency. There is no numeric standard for total phosphorus for Class A waters. The narrative standard states that “unless naturally occurring, shall contain no phosphorus in such concentrations that would impair any existing or designated uses.” The NHDES “level of concern” for total phosphorous is 0.05 mg/L. Table 11. Total Phosphorus Data Summary – Wendys Brook Watershed, 2009
Station ID
Samples Collected
Data Range (mg/L)
Acceptable Samples
Exceeding NHDES Level of Concern
Number of Usable Samples for 2010 NH Surface Water Quality
Assessment
07-WDY 1 0.042 0 1
04-WDY 1 0.018 0 1
01-WDY 1 0.022 0 1
Total 3 _____ 0 3
All three stations sampled were below the NHDES “level of concern” (Figure 7). Under undisturbed natural conditions phosphorus is at very low levels in aquatic ecosystems. Of the three nutrients critical for aquatic plant growth; potassium, nitrogen, and phosphorus, it is usually phosphorous that is the limiting factor to plant growth. When the supply of phosphorus is increased due to human activity, algae respond with significant growth. A major source of excessive phosphorus concentrations in aquatic ecosystems can be wastewater treatment facilities, as sewage typically contains relatively high levels of phosphorus detergents. However, fertilizers used on lawns and agricultural areas can also contribute significant amounts of phosphorus.

______________________________________________________________________________________ 2009 Oyster River Watershed Water Quality Report 38
Figure 7. Total Phosphorous Statistics for the Wendys Brook Watershed
June 04, 2009, NHDES VRAP
0.00
0.01
0.02
0.03
0.04
0.05
0.06
07-WDY 04-WDY 04-WDY
Station ID
Total Phosphorous (mg/L)
Individual Total Phosphorous Measurements
NHDES Level of Concern
Recommendations
Continue sampling at all stations in order to develop a long-term data set to better understand trends as time goes on.

______________________________________________________________________________________ 2009 Oyster River Watershed Water Quality Report 39
4.8 Chloride Two samples were taken for chloride at 10 stations in the Oyster River watershed (Table 12). Of the 20 samples taken, all met quality assurance/quality control requirements and are usable for New Hampshire’s 2010 surface water quality report to the US Environmental Protection Agency. The Class A/B New Hampshire surface water quality standard for chloride is as follows:
Freshwater chronic criterion 230 mg/l Freshwater acute criterion 860 mg/l
Table 12. Chloride Data Summary – Oyster River Watershed, 2009
Station ID
Class Samples Collected
Data Range (mg/L)
Acceptable Samples Not
Meeting NH Class A/B Standards
Number of Usable Samples for 2010 NH Surface Water
Quality Assessment
15-OYS A 2 19 - 25 0 2
13-OYS A 2 19 - 19 0 2
01-WDY A 2 54 - 100 0 2
07-OYS A 2 19 - 29 0 2
01-HML A 2 25 - 27 0 2
00E-CGB A 2 220 - 330 1 2
05-OYS A 2 28 - 38 0 2
00J-PRB A 2 150 - 200 0 2
02-BRD A 2 47 - 80 0 2
03-JNC B 2 56 - 75 0 2
Total _____ 20 _____ 1 20
Only one measurement (station 00E-CGB) was above the state of New Hampshire Class A/B chronic surface water quality standard of 230 mg/L (Figure 8). In general, stations 00E-CGB, and 00J-PRB had the highest measurements within the watershed. Although chloride can originate from natural sources, most of the chloride that enters the environment is associated with the storage and application of road salt. Road salt readily dissolves and enters aquatic environments in ionic forms. As such, chloride-containing compounds commonly enter surface water, soil, and groundwater during late-spring snowmelt (since the ground is frozen during much of the late winter and early spring). Chloride ions are conservative, which

______________________________________________________________________________________ 2009 Oyster River Watershed Water Quality Report 40
means they are not degraded in the environment and tend to remain in solution, once dissolved. Chloride ions that enter ground water can ultimately be expected to reach surface water and, therefore, influence aquatic environments and humans. Additional human sources of chloride can come from fertilizers, septic systems, and underground water softening systems.
Figure 8. Chloride Statistics for the Oyster River Watershed
March 13 - March 20, 2009, NHDES VRAP
0
20
40
60
80
100
120
140
160
180
200
220
240
260
280
300
320
340
15-OYS
13-OYS
01-WDY
07-OYS
01-HML
00E-CGB
05-OYS
00J-PRB
02-BRD
03-JNC
Station ID
Chloride (mg/L)
Invividual Chloride Measurements
Class A/B Chronic WQ Standard
Average
Recommendations
Continue collecting chloride samples during both low-flow summer months and during snowmelt period in winter and early spring. It is critical that specific conductance be recorded when chloride samples are collected.

APPENDIX A: 2009 OYSTER RIVER WATERSHED VRAP DATA
Measurements not meeting New Hampshire surface water quality standards
Total Phosphorous measurements exceeding NHDES level of concern
Turbidity measurements potentially not meeting surface water quality standards
Measurements not meeting NHDES quality assurance/quality control standards
A Water quality data collected in association with VBAP sampling
B Chronic water quality standard
C First sample analyzed at NHDES Limnology Lab - Second sample analyezed at UNH Water Quality Analysis Laboratory
15-OYS, Oyster River, Sugar Shack, Barrington - Class A
Date DO (mg/L) DO (% sat.) pHTurbidity
(NTUs)
Specific
Conductance
(uS/cm)
Water
Temp. (°C)
E. coli
(CTS/100mL)
E.coli
Geometric
Mean
Chloride
Standard >6.0>75% Daily
Average6.5 - 8.0
As
naturally
occuring
>836 uS/cm (as
a surrogate for
Cl)
NA <153 <47230
mg/LB
03/13/2009 08:40 72 0.1 25
03/20/2009 08:32 107 0.3 19
04/17/2009 10:30 11.82 97.3 5.94 0.5 78 7.1
05/15/2009 10:40 10.16 99.5 6.05 0.3 77 14.5
06/19/2009 10:40 8.96 88.5 6.21 1.2 79 14.8
06/25/2009 07:48 60
07/17/2009 10:10 8.98 97.8 0.6 75 19.6
07/22/2009 08:41 90
08/12/2009 09:55 8.30 90.0 6.66 1.8 68 19.3
08/17/2009 09:54 30 55
09/15/2009 08:43 30 43
09/19/2009 10:55 8.82 83.0 6.77 0.4 74 12.6
10/13/2009 07:58 200 56
10/15/2009 08:48 11.20 88.3 6.02 0.4 78 5.1
10/16/2009 10:10 11.48 91.0 6.17 2.0 79 5.5
11/20/2009 10:25 12.67 104.4 5.87 1.7 67 7.1
Time of
Sample

01-XBB - Wheelright Pond Outlet, Stepping Stone Road Bridge, Lee - Class A
Date DO (mg/L) DO (% sat.) pHTurbidity
(NTUs)
Specific
Conductance
(uS/cm)
Water
Temp. (°C)
E. coli
(CTS/100mL)
E.coli
Geometric
Mean
Standard >6.0>75% Daily
Average6.5 - 8.0
As
naturally
occuring
>836 uS/cm (as
a surrogate for
Cl)NA <153 <47
04/18/2009 11:05 10.30 93.2 6.77 0.9 108 10.6
05/16/2009 11:35 8.70 94.7 7.08 0.7 110 19.4
06/20/2009 10:55 6.83 75.1 6.82 0.1 108 20.4
06/25/2009 07:56 9
07/18/2009 10:30 3.96 45.6 6.61 0.7 113 22.2
07/22/2009 08:46 50
08/15/2009 10:35 6.50 79.8 6.88 0.8 101 25.6
08/17/2009 10:05 60 30
09/15/2009 08:47 150 77
09/18/2009 09:20 5.82 54.2 6.58 1.3 112 12.3
10/13/2009 08:05 1100 215
10/17/2009 10:40 4.38 33.8 6.50 0.7 142 4.4
11/21/2009 10:14 8.83 73.4 7.06 1.9 108 7.6
13-OYS, Oyster River, Route 4 Bridge, East of Lee Traffic Circle, Lee, NH - Class A
Date DO (mg/L) DO (% sat.) pHTurbidity
(NTUs)
Specific
Conductance
(uS/cm)
Water
Temp. (°C)
E. coli
(CTS/100mL)
E.coli
Geometric
Mean
Chloride
Standard >6.0>75% Daily
Average6.5 - 8.0
As
naturally
occuring
>836 uS/cm (as
a surrogate for
Cl)NA <153 <47
230
mg/LB
03/13/2009 08:50 109 0.2 19
03/20/2009 08:44 88 0.4 19
04/18/2009 10:25 8.97 78.1 6.43 1.7 99 9.3
05/16/2009 10:10 7.11 72.4 6.67 1.5 100 16.0
06/20/2009 10:20 6.78 69.6 6.15 0.7 77 16.8
06/25/2009 07:40 110
07/18/2009 09:50 5.12 55.8 6.28 2.0 104 20.1
07/22/2009 08:29 160
08/15/2009 09:57 4.67 56.3 6.41 1.8 98 21.8
08/17/2009 09:36 170 144
09/15/2009 08:29 90 135
09/18/2009 09:54 4.44 42.9 6.10 2.4 97 13.8
10/13/2009 07:45 70 102
10/17/2009 10:05 7.34 57.4 5.99 7.7 102 4.8
11/21/2009 09:44 9.92 80.3 6.70 0.6 86 6.5
Time of
Sample
Time of
Sample

07-WDY, Wendy's Brook, Route 125 Upstream of Lockit Driveway, Lee - Class A
Date
Specific
Conductance
(uS/cm)
E. coli
(CTS/100mL)
Total
Phosphorus
(mg/L)
Standard
>836 uS/cm (as
a surrogate for
Cl)<153 NA
06/04/2009 10:35 106 110 0.042
06X-WDY, Wendy's Brook,100' Upstream of Pincecrest Estates, Lee - Class A
DateWater Temp.
(°C)
Specific
Conductance
(uS/cm)
E. coli
(CTS/100mL)
Standard NA
>836 uS/cm (as
a surrogate for
Cl)<153
07/29/2009 11:40 20.3 81 40
06T-WDY, Wendy's Brook, 100' Downstream of Pinecrest Estates, Lee - Class A
DateWater Temp.
(°C)
Specific
Conductance
(uS/cm)
E. coli
(CTS/100mL)
Standard NA
>836 uS/cm (as
a surrogate for
Cl)<153
07/29/2009 11:00 20.2 92 50
06-WDY, Wendy's Brook, Upstream Side of Wentworth Douglas Entrance, Lee - Class A
DateWater Temp.
(°C)
Specific
Conductance
(uS/cm)
E. coli
(CTS/100mL)
Standard NA
>836 uS/cm (as
a surrogate for
Cl)<153
06/04/2009 10:20 290
07/29/2009 10:45 19.8 115 60
05-WDY-R-PIPE, Pipe River Right Just Upstream of 05-WDY, Lee - Class A(Stormwater pipes are not considered surface waters and thus water quality standards do not generally apply.)
DateWater Temp.
(°C)
Specific
Conductance
(uS/cm)
E. coli
(CTS/100mL)
Standard NA NA NA
07/29/2009 10:27 15.6 340 10
Time of
Sample
Time of
Sample
Time of
Sample
Time of
Sample
Time of
Sample

05-WDY-L-PIPE, Pipe River Left Just Upstream of 05-WDY, Lee - Class A(Stormwater pipes are not considered surface waters and thus water quality standards do not generally apply.)
DateWater Temp.
(°C)
Specific
Conductance
(uS/cm)
E. coli
(CTS/100mL)
Standard NA NA NA
07/29/2009 10:28 18.6 172 10
05-WDY-CEN-PIPE, Center Pipe Just Upstream of 05-WDY, Lee - Class A(Stormwater pipes are not considered surface waters and thus water quality standards do not generally apply.)
DateWater Temp.
(°C)
Specific
Conductance
(uS/cm)
E. coli
(CTS/100mL)
Standard NA NA NA
07/29/2009 10:25 16.5 349 10
05-WDY, Wendy's Brook, Downstream of Route 125 Culvert, Market Basket Driveway, Lee - Class A
DateWater Temp.
(°C)
Specific
Conductance
(uS/cm)
E. coli
(CTS/100mL)
Standard NA
>836 uS/cm (as
a surrogate for
Cl)<153
06/04/2009 10:05 357
07/29/2009 10:25 19.5 138 90
09/22/2009 09:45 <10
04P-WDY, Wendy's Brook, 250 ft Downstream of 05-WDY, Lee - Class A
DateE. coli
(CTS/100mL)
Standard <153
09/22/2009 09:35 9
04K-WDY, Wendy's Brook, 250 ft Upstream of 04-WDY, Lee - Class A
DateE. coli
(CTS/100mL)
Standard <153
09/22/2009 09:30 <10
Time of
Sample
Time of
Sample
Time of
Sample
Time of
Sample
Time of
Sample
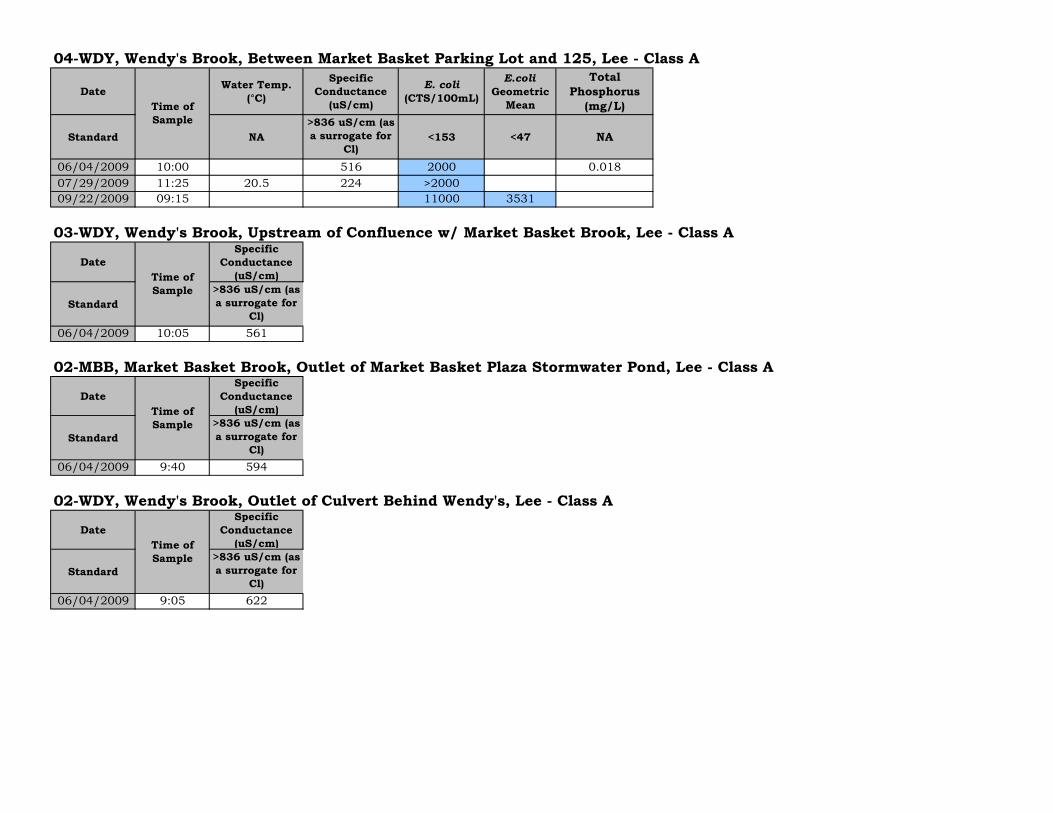
04-WDY, Wendy's Brook, Between Market Basket Parking Lot and 125, Lee - Class A
DateWater Temp.
(°C)
Specific
Conductance
(uS/cm)
E. coli
(CTS/100mL)
E.coli
Geometric
Mean
Total
Phosphorus
(mg/L)
Standard NA
>836 uS/cm (as
a surrogate for
Cl)<153 <47 NA
06/04/2009 10:00 516 2000 0.018
07/29/2009 11:25 20.5 224 >2000
09/22/2009 09:15 11000 3531
03-WDY, Wendy's Brook, Upstream of Confluence w/ Market Basket Brook, Lee - Class A
Date
Specific
Conductance
(uS/cm)
Standard
>836 uS/cm (as
a surrogate for
Cl)
06/04/2009 10:05 561
02-MBB, Market Basket Brook, Outlet of Market Basket Plaza Stormwater Pond, Lee - Class A
Date
Specific
Conductance
(uS/cm)
Standard
>836 uS/cm (as
a surrogate for
Cl)
06/04/2009 9:40 594
02-WDY, Wendy's Brook, Outlet of Culvert Behind Wendy's, Lee - Class A
Date
Specific
Conductance
(uS/cm)
Standard
>836 uS/cm (as
a surrogate for
Cl)
06/04/2009 9:05 622
Time of
Sample
Time of
Sample
Time of
Sample
Time of
Sample

01-WDY, Wendy's Brook, Footbridge 500’ Upstream of Confluence with Oyster River, Lee - Class A
Date DO (mg/L) DO (% sat.) pHTurbidity
(NTUs)
Specific
Conductance
(uS/cm)
Water
Temp. (°C)
E. coli
(CTS/100mL)
E.coli
Geometric
Mean
Chloride
Total
Phosphorus
(mg/L)
Standard >6.0>75% Daily
Average6.5 - 8.0
As
naturally
occuring
>836 uS/cm (as
a surrogate for
Cl)NA <153 <47
230
mg/LB NA
03/13/2009 08:25 346 0.0 100
03/20/2009 08:23 195 0.8 54
04/18/2009 10:50 10.75 91.5 6.44 2.9 435 8.3
05/16/2009 10:25 8.87 88.6 6.85 4.1 434 15.4
06/20/2009 10:35 8.84 88.5 6.63 4.1 173 15.6
06/04/2009 681 1120 0.022
06/25/2009 07:43 9300
07/18/2009 10:15 8.16 91.2 6.66 8.5 346 19.2
07/22/2009 08:32 11500 4929
08/15/2009 10:15 8.64 93.0 6.89 12.4 553 19.0
08/17/2009 09:48 12000 10867
09/15/2009 08:36 11000 11493
09/18/2009 09:40 9.92 93.1 6.93 24.1 910 12.4
10/13/2009 07:52 3500 7731
10/17/2009 10:20 10.72 84.8 6.65 2.6 767 5.4
11/21/2009 09:58 11.46 95.2 7.02 5.1 228 7.2
01-DBE, Dube Brook, Cherry Lane Bridge, Madbury - Class A
Date DO (mg/L) DO (% sat.) pHTurbidity
(NTUs)
Specific
Conductance
(uS/cm)
Water
Temp. (°C)
E. coli
(CTS/100mL)
E.coli
Geometric
Mean
Standard >6.0>75% Daily
Average6.5 - 8.0
As
naturally
occuring
>836 uS/cm (as
a surrogate for
Cl)NA <153 <47
04/18/2009 09:50 10.36 88.6 6.81 3.8 86 8.6
05/16/2009 09:50 8.69 86.0 6.97 4.2 78 15.1
06/20/2009 09:53 8.37 85.5 6.85 4.7 70 16.3
06/25/2009 07:28 50
07/18/2009 09:30 7.03 77.4 6.82 11.5 113 19.2
07/22/2009 08:16 270
08/15/2009 09:30 7.77 85.4 7.04 10.0 51 19.2
08/17/2009 09:23 320 163
09/15/2009 08:17 150 235
09/18/2009 09:00 9.09 81.8 6.76 5.9 107 10.8
10/13/2009 07:38 20 99
10/17/2009 9:40 11.02 82.6 6.61 2.3 102 3.5
11/21/2009 09:15 11.69 92.7 7.08 3.6 78 5.7
Time of
Sample
Time of
Sample

09-OYS, Oyster River, Route 155 Bridge (USGS Gaging Station), Lee - Class A
Date DO (mg/L) DO (% sat.) pHTurbidity
(NTUs)
Specific
Conductance
(uS/cm)
Water
Temp. (°C)
E. coli
(CTS/100mL)
E.coli
Geometric
Mean
Standard >6.0>75% Daily
Average6.5 - 8.0
As
naturally
occuring
>836 uS/cm (as
a surrogate for
Cl)NA <153 <47
04/18/2009 09:25 10.47 92.3 6.73 2.8 126 10.1
05/16/2009 09:25 7.93 80.0 7.03 3.8 129 15.9
06/20/2009 09:14 9.21 91.8 6.77 4.2 88 15.6
06/25/2009 07:20 210
07/18/2009 09:10 7.36 83.0 6.87 12.3 157 20.5
07/22/2009 08:07 430
08/15/2009 09:13 7.83 87.0 6.94 4.8 123 20.5
08/17/2009 09:11 190 258
09/15/2009 08:06 320 297
09/18/2009 08:45 7.98 75.6 6.65 5.4 156 13.0
10/13/2009 07:27 90 176
10/17/2009 9:10 10.07 79.0 6.67 3.0 157 5.1
11/21/2009 08:58 11.28 91.6 7.10 2.4 102 6.5
08-OYS, Oyster River, Mast Road Bridge, Durham - Class A
Date DO (mg/L) DO (% sat.) pHTurbidity
(NTUs)
Specific
Conductance
(uS/cm)
Water
Temp. (°C)
E. coli
(CTS/100mL)
E.coli
Geometric
Mean
Standard >6.0>75% Daily
Average6.5 - 8.0
As
naturally
occuring
>836 uS/cm (as
a surrogate for
Cl)NA <153 <47
04/17/2009 10:10 10.50 89.4 6.97 2.9 141 8.4
05/15/2009 10:20 10.19 100.5 7.01 5.2 144 14.8
06/19/2009 09:55 8.70 87.8 6.73 16.9 105 15.7
06/25/2009 07:13 240
07/17/2009 09:50 7.78 84.7 6.90 6.7 161 19.4
07/22/2009 08:00 290
08/12/2009 09:30 7.60 84.5 6.56 7.1 132 20.7
08/17/2009 09:03 130 208
09/15/2009 07:59 240 208
09/19/2009 10:39 8.71 83.7 7.15 3.1 192 13.5
10/13/2009 07:20 30 98
10/16/2009 9:50 10.09 81.3 6.96 2.9 176 5.8
11/20/2009 10:10 12.00 96.9 6.69 9.1 113 6.3
Time of
Sample
Time of
Sample
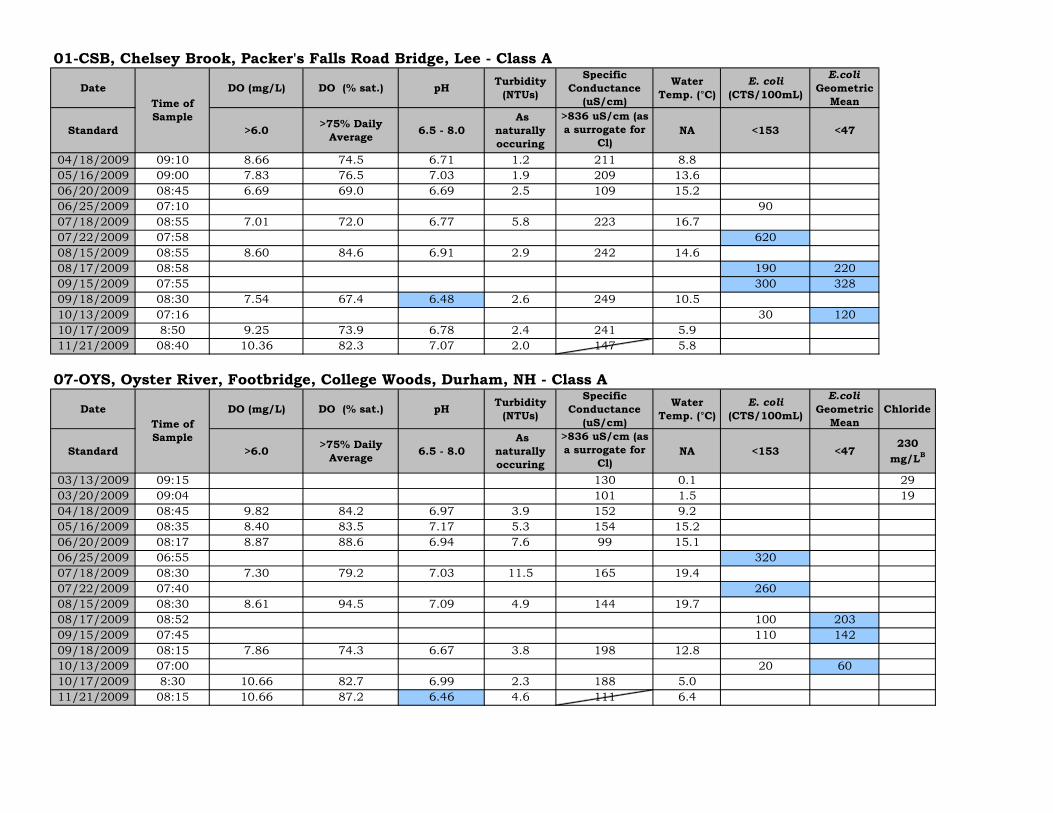
01-CSB, Chelsey Brook, Packer's Falls Road Bridge, Lee - Class A
Date DO (mg/L) DO (% sat.) pHTurbidity
(NTUs)
Specific
Conductance
(uS/cm)
Water
Temp. (°C)
E. coli
(CTS/100mL)
E.coli
Geometric
Mean
Standard >6.0>75% Daily
Average6.5 - 8.0
As
naturally
occuring
>836 uS/cm (as
a surrogate for
Cl)NA <153 <47
04/18/2009 09:10 8.66 74.5 6.71 1.2 211 8.8
05/16/2009 09:00 7.83 76.5 7.03 1.9 209 13.6
06/20/2009 08:45 6.69 69.0 6.69 2.5 109 15.2
06/25/2009 07:10 90
07/18/2009 08:55 7.01 72.0 6.77 5.8 223 16.7
07/22/2009 07:58 620
08/15/2009 08:55 8.60 84.6 6.91 2.9 242 14.6
08/17/2009 08:58 190 220
09/15/2009 07:55 300 328
09/18/2009 08:30 7.54 67.4 6.48 2.6 249 10.5
10/13/2009 07:16 30 120
10/17/2009 8:50 9.25 73.9 6.78 2.4 241 5.9
11/21/2009 08:40 10.36 82.3 7.07 2.0 147 5.8
07-OYS, Oyster River, Footbridge, College Woods, Durham, NH - Class A
Date DO (mg/L) DO (% sat.) pHTurbidity
(NTUs)
Specific
Conductance
(uS/cm)
Water
Temp. (°C)
E. coli
(CTS/100mL)
E.coli
Geometric
Mean
Chloride
Standard >6.0>75% Daily
Average6.5 - 8.0
As
naturally
occuring
>836 uS/cm (as
a surrogate for
Cl)NA <153 <47
230
mg/LB
03/13/2009 09:15 130 0.1 29
03/20/2009 09:04 101 1.5 19
04/18/2009 08:45 9.82 84.2 6.97 3.9 152 9.2
05/16/2009 08:35 8.40 83.5 7.17 5.3 154 15.2
06/20/2009 08:17 8.87 88.6 6.94 7.6 99 15.1
06/25/2009 06:55 320
07/18/2009 08:30 7.30 79.2 7.03 11.5 165 19.4
07/22/2009 07:40 260
08/15/2009 08:30 8.61 94.5 7.09 4.9 144 19.7
08/17/2009 08:52 100 203
09/15/2009 07:45 110 142
09/18/2009 08:15 7.86 74.3 6.67 3.8 198 12.8
10/13/2009 07:00 20 60
10/17/2009 8:30 10.66 82.7 6.99 2.3 188 5.0
11/21/2009 08:15 10.66 87.2 6.46 4.6 111 6.4
Time of
Sample
Time of
Sample
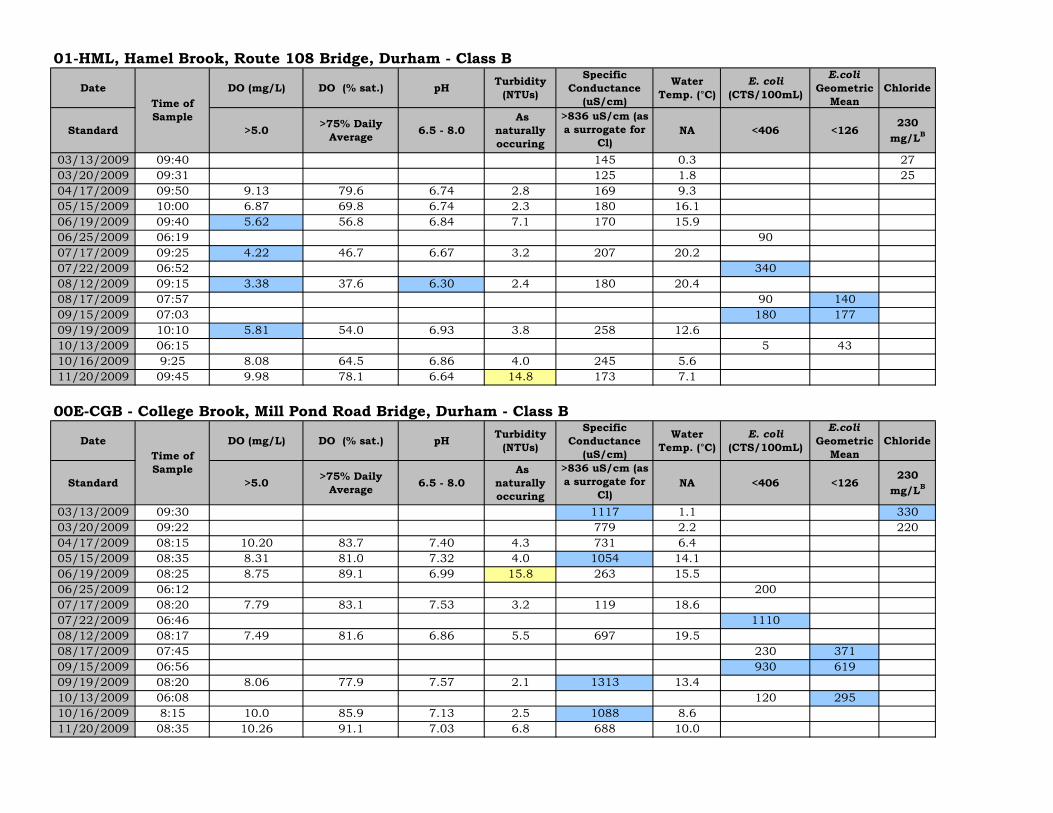
01-HML, Hamel Brook, Route 108 Bridge, Durham - Class B
Date DO (mg/L) DO (% sat.) pHTurbidity
(NTUs)
Specific
Conductance
(uS/cm)
Water
Temp. (°C)
E. coli
(CTS/100mL)
E.coli
Geometric
Mean
Chloride
Standard >5.0>75% Daily
Average6.5 - 8.0
As
naturally
occuring
>836 uS/cm (as
a surrogate for
Cl)NA <406 <126
230
mg/LB
03/13/2009 09:40 145 0.3 27
03/20/2009 09:31 125 1.8 25
04/17/2009 09:50 9.13 79.6 6.74 2.8 169 9.3
05/15/2009 10:00 6.87 69.8 6.74 2.3 180 16.1
06/19/2009 09:40 5.62 56.8 6.84 7.1 170 15.9
06/25/2009 06:19 90
07/17/2009 09:25 4.22 46.7 6.67 3.2 207 20.2
07/22/2009 06:52 340
08/12/2009 09:15 3.38 37.6 6.30 2.4 180 20.4
08/17/2009 07:57 90 140
09/15/2009 07:03 180 177
09/19/2009 10:10 5.81 54.0 6.93 3.8 258 12.6
10/13/2009 06:15 5 43
10/16/2009 9:25 8.08 64.5 6.86 4.0 245 5.6
11/20/2009 09:45 9.98 78.1 6.64 14.8 173 7.1
00E-CGB - College Brook, Mill Pond Road Bridge, Durham - Class B
Date DO (mg/L) DO (% sat.) pHTurbidity
(NTUs)
Specific
Conductance
(uS/cm)
Water
Temp. (°C)
E. coli
(CTS/100mL)
E.coli
Geometric
Mean
Chloride
Standard >5.0>75% Daily
Average6.5 - 8.0
As
naturally
occuring
>836 uS/cm (as
a surrogate for
Cl)NA <406 <126
230
mg/LB
03/13/2009 09:30 1117 1.1 330
03/20/2009 09:22 779 2.2 220
04/17/2009 08:15 10.20 83.7 7.40 4.3 731 6.4
05/15/2009 08:35 8.31 81.0 7.32 4.0 1054 14.1
06/19/2009 08:25 8.75 89.1 6.99 15.8 263 15.5
06/25/2009 06:12 200
07/17/2009 08:20 7.79 83.1 7.53 3.2 119 18.6
07/22/2009 06:46 1110
08/12/2009 08:17 7.49 81.6 6.86 5.5 697 19.5
08/17/2009 07:45 230 371
09/15/2009 06:56 930 619
09/19/2009 08:20 8.06 77.9 7.57 2.1 1313 13.4
10/13/2009 06:08 120 295
10/16/2009 8:15 10.0 85.9 7.13 2.5 1088 8.6
11/20/2009 08:35 10.26 91.1 7.03 6.8 688 10.0
Time of
Sample
Time of
Sample

05-OYS, Oyster River, Route 108/Newmarket Road Bridge, Durham - Class B
Date
Specific
Conductance
(uS/cm)
Water Temp.
(°C)Chloride
Standard
>836 uS/cm (as
a surrogate for
Cl)
NA 230 mg/LB
03/13/2009 09:55 157 0.3 38.0
03/20/2009 09:42 136 2.3 28.0
00J-PRB, Pettee Brook, Sauer Terrace, Durham - Class B
Date DO (mg/L) DO (% sat.) pHTurbidity
(NTUs)
Specific
Conductance
(uS/cm)
Water
Temp. (°C)
E. coli
(CTS/100mL)
E.coli
Geometric
Mean
Chloride
Standard >5.0>75% Daily
Average6.5 - 8.0
As
naturally
occuring
>836 uS/cm (as
a surrogate for
Cl)NA <406 <126
230
mg/LB
03/13/2009 10:30 698 1.4 200
03/20/2009 10:20 538 2.1 150
04/17/2009 08:25 11.21 95.8 7.32 2.2 439 8.4
05/15/2009 08:55 9.46 96.7 7.35 4.1 891 13.9
06/19/2009 08:40 9.10 92.6 6.67 14.9 342 16.1
06/25/2009 06:25 100
07/17/2009 08:35 8.53 92.0 7.31 3.7 853 18.9
07/22/2009 07:00 630
08/12/2009 08:27 7.86 87.2 6.94 2.5 514 20.5
08/17/2009 08:05 270 257
09/15/2009 07:10 490 437
09/19/2009 08:55 8.95 84.2 7.29 2.5 1097 12.5
10/13/2009 06:42 50 188
10/16/2009 8:25 10.19 84.5 7.06 2.8 627 7.2
11/20/2009 08:53 10.77 95.8 6.68 25.3 270 10.1
Time of
Sample
Time of
Sample
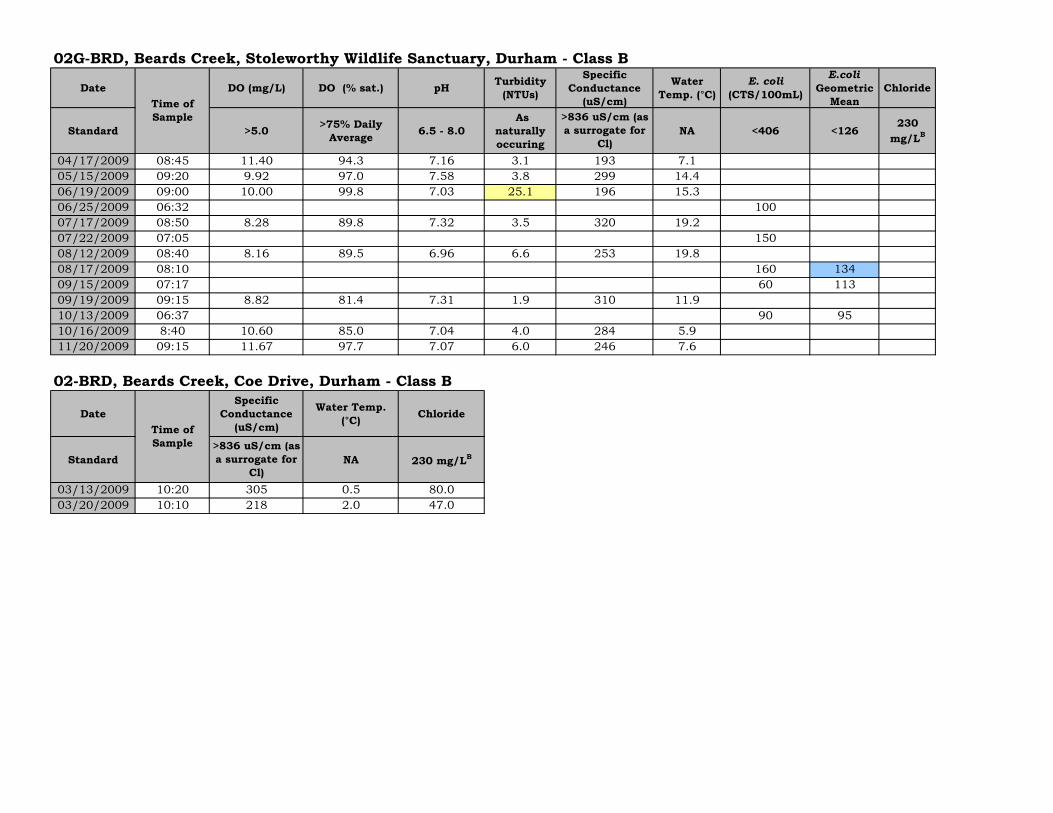
02G-BRD, Beards Creek, Stoleworthy Wildlife Sanctuary, Durham - Class B
Date DO (mg/L) DO (% sat.) pHTurbidity
(NTUs)
Specific
Conductance
(uS/cm)
Water
Temp. (°C)
E. coli
(CTS/100mL)
E.coli
Geometric
Mean
Chloride
Standard >5.0>75% Daily
Average6.5 - 8.0
As
naturally
occuring
>836 uS/cm (as
a surrogate for
Cl)
NA <406 <126230
mg/LB
04/17/2009 08:45 11.40 94.3 7.16 3.1 193 7.1
05/15/2009 09:20 9.92 97.0 7.58 3.8 299 14.4
06/19/2009 09:00 10.00 99.8 7.03 25.1 196 15.3
06/25/2009 06:32 100
07/17/2009 08:50 8.28 89.8 7.32 3.5 320 19.2
07/22/2009 07:05 150
08/12/2009 08:40 8.16 89.5 6.96 6.6 253 19.8
08/17/2009 08:10 160 134
09/15/2009 07:17 60 113
09/19/2009 09:15 8.82 81.4 7.31 1.9 310 11.9
10/13/2009 06:37 90 95
10/16/2009 8:40 10.60 85.0 7.04 4.0 284 5.9
11/20/2009 09:15 11.67 97.7 7.07 6.0 246 7.6
02-BRD, Beards Creek, Coe Drive, Durham - Class B
Date
Specific
Conductance
(uS/cm)
Water Temp.
(°C)Chloride
Standard
>836 uS/cm (as
a surrogate for
Cl)
NA 230 mg/LB
03/13/2009 10:20 305 0.5 80.0
03/20/2009 10:10 218 2.0 47.0
Time of
Sample
Time of
Sample

03-JNC, Johnson Creek, Freshet Road Bridge, Durham - Class B
Date DO (mg/L) DO (% sat.) pHTurbidity
(NTUs)
Specific
Conductance
(uS/cm)
Water
Temp. (°C)
E. coli
(CTS/100mL)
E.coli
Geometric
Mean
Chloride
Standard >5.0>75% Daily
Average6.5 - 8.0
As
naturally
occuring
>836 uS/cm (as
a surrogate for
Cl)
NA <406 <126230
mg/LB
03/13/2009 10:10 278 0.0 75
03/20/2009 09:56 221 0.7 56
04/17/2009 09:05 13.10 106.1 7.14 2.9 344 6.6
05/15/2009 09:40 10.60 102.1 7.37 3.2 314 13.7
06/19/2009 09:20 9.13 90.5 6.67 21.7 139 14.7
06/25/2009 06:41 70
07/17/2009 09:10 8.71 92.0 7.19 6.7 360 17.9
07/22/2009 07:19 410
08/12/2009 09:00 8.20 88.2 6.74 10.6 255 18.9
08/17/2009 08:25 190 176
09/15/2009 07:29 160 232
09/19/2009 09:43 10.04 91.7 7.21 5.3 362 11.3
10/13/2009 06:26 40 107
10/16/2009 9:05 11.35 89.0 7.02 3.1 338 4.9
11/20/2009 09:32 11.62 97.5 6.81 8.0 233 7.7
Time of
Sample

Appendix B: Interpreting VRAP Water Quality Monitoring Parameters 1
APPENDIX B: Interpreting VRAP Water Quality Monitoring Parameters
Chemical Parameters
Dissolved Oxygen (DO)
Unit of Measurement: concentration in milligrams per liter (mg/L) and percent saturation (%).
Description: A measure of the amount of oxygen in the water: Concentration is a measure of the amount of oxygen in a volume of water; saturation is a measurement of the amount of oxygen in the water compared to the amount of oxygen the water can actually hold at full saturation. Both of these measurements are necessary to accurately determine whether New Hampshire surface water quality standards are met.
Importance: Oxygen is dissolved into the water from the atmosphere, aided by wind and wave action, or by rocky, steep, or uneven stream beds. The presence of dissolved oxygen is vital to bottom-dwelling organisms as well as fish and amphibians. Aquatic plants and algae produce oxygen in the water during the day, and consume oxygen during the night. Bacteria utilize oxygen both day and night when they process organic matter into smaller and smaller particles.
pH
Unit of Measurement: units (no abbreviation).
Description: A measure of hydrogen ion activity in water, or, in general terms, the acidity of water. pH is measured on a logarithmic scale of 0 to 14, with 7 being neutral. A high pH indicates alkaline (or basic) conditions and a low pH indicates acidic conditions. pH is influenced by geology and soils, organic acids (decaying leaves and other matter), and human-induced acids from acid rain (which typically has a pH of 3.5 to 5.5).
Importance: pH affects many chemical and biological processes in the water and this is important to the survival and reproduction of fish and other aquatic life. Different organisms flourish within different ranges of pH. Measurements outside of an organism’s preferred range can limit growth and reproduction and lead to physiological stress. Low pH can also affect the toxicity of aquatic compounds such as ammonia and certain metals by making them more “available” for uptake by aquatic plants and animals. This can produce conditions that are toxic to aquatic life.
Class A NH Surface Water Quality Standard: 6 mg/L at any place or time, or 75% minimum daily average – (unless naturally occurring). Class B NH Surface Water Quality Standard: 5 mg/L at any place or time or 75% minimum daily average – (unless naturally occurring).
Several measurements of oxygen saturation taken in a 24-hour period must be averaged to compare to the 75 percent daily average saturation standard. The concentration of dissolved oxygen is dependent on many factors including temperature and sunlight, and tends to fluctuate throughout the day. Saturation values are averaged because a reading taken in the morning may be low due to respiration, while a measurement that afternoon may show that the saturation has recovered to acceptable levels. Water can become saturated with more than 100 percent dissolved oxygen.
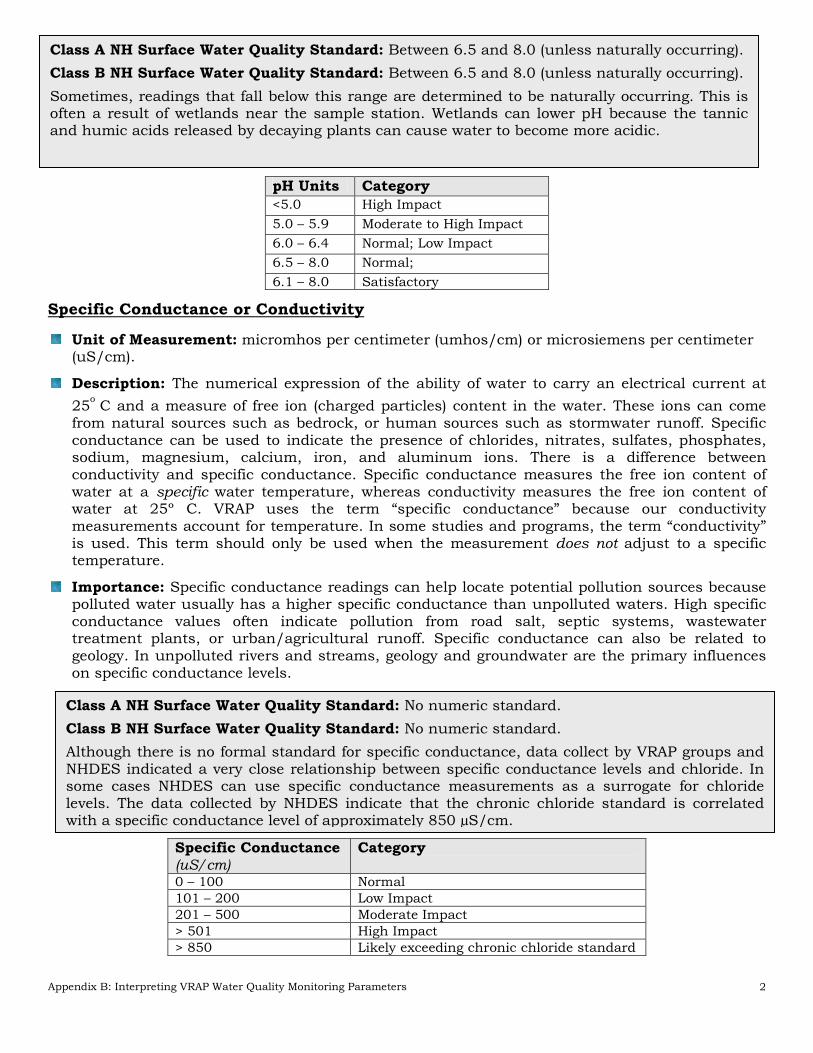
Appendix B: Interpreting VRAP Water Quality Monitoring Parameters
2
pH Units Category
<5.0 High Impact
5.0 – 5.9 Moderate to High Impact
6.0 – 6.4 Normal; Low Impact
6.5 – 8.0 Normal;
6.1 – 8.0 Satisfactory
Specific Conductance or Conductivity
Unit of Measurement: micromhos per centimeter (umhos/cm) or microsiemens per centimeter (uS/cm).
Description: The numerical expression of the ability of water to carry an electrical current at
25o C and a measure of free ion (charged particles) content in the water. These ions can come
from natural sources such as bedrock, or human sources such as stormwater runoff. Specific conductance can be used to indicate the presence of chlorides, nitrates, sulfates, phosphates, sodium, magnesium, calcium, iron, and aluminum ions. There is a difference between conductivity and specific conductance. Specific conductance measures the free ion content of water at a specific water temperature, whereas conductivity measures the free ion content of water at 25º C. VRAP uses the term “specific conductance” because our conductivity measurements account for temperature. In some studies and programs, the term “conductivity” is used. This term should only be used when the measurement does not adjust to a specific temperature.
Importance: Specific conductance readings can help locate potential pollution sources because polluted water usually has a higher specific conductance than unpolluted waters. High specific conductance values often indicate pollution from road salt, septic systems, wastewater treatment plants, or urban/agricultural runoff. Specific conductance can also be related to geology. In unpolluted rivers and streams, geology and groundwater are the primary influences on specific conductance levels.
Specific Conductance (uS/cm)
Category
0 – 100 Normal
101 – 200 Low Impact
201 – 500 Moderate Impact
> 501 High Impact
> 850 Likely exceeding chronic chloride standard
Class A NH Surface Water Quality Standard: Between 6.5 and 8.0 (unless naturally occurring).
Class B NH Surface Water Quality Standard: Between 6.5 and 8.0 (unless naturally occurring).
Sometimes, readings that fall below this range are determined to be naturally occurring. This is often a result of wetlands near the sample station. Wetlands can lower pH because the tannic and humic acids released by decaying plants can cause water to become more acidic.
Class A NH Surface Water Quality Standard: No numeric standard.
Class B NH Surface Water Quality Standard: No numeric standard.
Although there is no formal standard for specific conductance, data collect by VRAP groups and NHDES indicated a very close relationship between specific conductance levels and chloride. In some cases NHDES can use specific conductance measurements as a surrogate for chloride levels. The data collected by NHDES indicate that the chronic chloride standard is correlated with a specific conductance level of approximately 850 µS/cm.

Appendix B: Interpreting VRAP Water Quality Monitoring Parameters
3
Turbidity
Unit of Measurement: Nephelometric Turbidity Units (abbreviated at NTU).
Description: A measurement of the amount of suspended material in the water. This material, which is comprised of particles such as clay, silt, algae, suspended sediment, and decaying plant material, causes light to be scattered and absorbed, rather than transmitted in straight lines through the water.
Importance: Higher turbidity increases water temperatures because suspended particles absorb more heat. This, in turn, reduces dissolved oxygen (DO) concentrations because warm water holds less DO than cold water. Higher turbidity also reduces the amount of light that can penetrate the water, which reduces photosynthesis and DO production. Suspended materials can clog fish gills, reducing disease resistance, lowering growth rates, and affecting egg and larval development. As the particles settle, they can blanket the stream bottom, especially in slower waters, and smother fish eggs and benthic macroinvertebrates. Clean waters are generally associated with low turbidity, but there is a high degree of natural variability involved. Rain events can increase turbidity in surface waters by flushing sediment, organic matter and other materials into the water. Human activities such as vegetation removal and soil disruption can also lead to dramatic increases in turbidity levels.
Physical Parameters Temperature
Unit of Measurement: Degrees Celsius ( º C)
Importance: Water temperature is a critical parameter for aquatic life and has an impact on other water quality parameters such as dissolved oxygen concentrations, and bacteria activity in water. Water temperature controls the metabolic and reproductive processes of aquatic species and can determine which fish and macroinvertabrate species can survive in a given river or stream.
A number of factors can have an impact on water temperature including the quantity and maturity of riparian vegetation, the rate of flow, the percent of impervious surfaces contributing stormwater, thermal discharges, impoundments and groundwater.
Nutrient Parameters
Class A NH Surface Water Quality Standard: As naturally occurs.
Class B NH Surface Water Quality Standard: Shall not exceed naturally occurring conditions by more than 10 NTU.
Class A NH Surface Water Quality Standard: No numeric standard; as naturally occurs.
Class B NH Surface Water Quality Standard: No numeric standard Although there is currently no numerical water quality criteria for water temperature, NHDES is in the process of collecting biological and water temperature data that will contribute to the development of a procedure for assessing rivers and stream based on water temperature and its corresponding impact to the biological integrity of the waterbody.

Appendix B: Interpreting VRAP Water Quality Monitoring Parameters
4
Chlorophyll-a (Chlor a)
Unit of Measurement: Milligrams per liter (mg/L).
Description: An indicator of the biomass, or abundance, of planktonic algae in the river. The technical term “biomass” is used to represent “amount by weight.” Chlorophyll-a can be strongly influenced by phosphorus, which is derived by natural and human activities.
Importance: Because algae is a plant and contains the green pigment chlorophyll-a, the concentration of chlorophyll-a found in the water gives an estimation of the concentration of algae. If the chlorophyll-a concentration increases, this indicates an increase in the algal population.
Chlorophyll-a (mg/L) Category < 3 Excellent
3 – 7 Good
7 – 15 Less than desirable
> 15 Nuisance
Total Phosphorus (TP)
Unit of Measurement: Milligrams per liter (mg/L).
Description: A measure of all forms of phosphorus in the water, including inorganic and organic forms. There are many sources of phosphorus, both natural and human. These include soil and rocks, sewage, animal manure, fertilizer, erosion, and other types of contamination.
Importance: Phosphorus is a nutrient that is essential to plants and animals. However, excess amounts can cause rapid increases in the biological activity in water. Phosphorus is usually the “limiting nutrient” in freshwater streams, which means relatively small amounts can increase algae and chlorophyll-a levels. Algal blooms and/or excessive aquatic plant growth can decrease oxygen levels and make water unattractive. Phosphorus can indicate the presence of septic systems, sewage, animal waste, lawn fertilizer, road and construction erosion, other types of pollution, or natural wetlands and atmospheric deposition.
Total Phosphorus (mg/L) Category < 0.010 Ideal
0.011 – 0.025 Average
0.026 – 0.050 More than desirable
> 0.051 Excessive (potential nuisance concentration)
Class A NH Surface Water Quality Standard: No numeric standard.
Class B NH Surface Water Quality Standard: No numeric standard.
Class A NH Surface Water Quality Standard: No numeric standard; as naturally occurs.
Class B NH Surface Water Quality Standard: No numeric standard; as naturally occurring, shall contain no phosphorus in such concentrations that would impair any existing or designated uses.

Appendix B: Interpreting VRAP Water Quality Monitoring Parameters
5
Total Kjeldahl Nitrogen (TKN)
Unit of Measurement: Milligrams per liter (mg/L).
Description: A measure of the amount of ammonia and organic nitrogen in the water.
Importance: High nitrogen levels can increase algae and chlorophyll-a levels in the river, but is generally less of a concern in fresh water than phosphorus. Nitrogen can indicate the presence of sewage, animal waste, fertilizer, erosion, or other types of pollution.
Other Parameters
Chloride
Unit of Measurement: Milligrams per liter (mg/L).
Description: The chloride ion (Cl-) is found naturally in some surface waters and groundwater. It is also found in high concentrations in seawater. Higher-than-normal chloride concentrations in freshwater is detrimental to water quality. In New Hampshire, applying road salt for winter accident prevention is a large source of chloride to the environment. Unfortunately, this has increased over time due to road expansion and increased vehicle traffic. Road salt (most often sodium chloride) readily dissolves and enters aquatic environments in ionic forms. Although chloride can originate from natural sources, most of the chloride that enters the environment is associated with the storage and application of road salt. As such, chloride-containing compounds commonly enter surface water, soil, and groundwater during late-spring snowmelt (since the ground is frozen during much of the late winter and early spring). Sodium chloride is also used on foods as table salt, and consequently is present in human waste. Thus, sometimes chloride in water can indicate sewage pollution. Saltwater intrusion can also elevate groundwater chlorides in drinking water wells near coastlines. Chloride ions are conservative, which means they are not degraded in the environment and tend to remain in solution, once dissolved. Chloride ions that enter ground water can ultimately be expected to reach surface water and, therefore, influence aquatic environments and humans.
Importance: Research shows elevated chloride levels can be toxic to freshwater aquatic life. Among the species tested, freshwater aquatic plants and invertebrates tend to be the most sensitive to chloride. In order to protect freshwater aquatic life in New Hampshire, the state has adopted acute and chronic chloride criteria.
TKN (mg/L) Category < 0.25 Ideal
0.26 – 0.40 Average
0.41 – 0.50 More than desirable
> 0.51 Excessive (potential nuisance concentration)
Class A NH Surface Water Quality Standard: No numeric standard; as naturally occurs.
Class B NH Surface Water Quality Standard: No numeric standard; as naturally occurring, shall contain no nitrogen in such concentrations that would impair any existing or designated uses.
Acute Standard: 860 mg/L.
Chronic Standard: 230 mg/L.

Appendix B: Interpreting VRAP Water Quality Monitoring Parameters
6
Escherichia Coliform Bacteria (E. coli)
Unit of Measurement: Counts per 100 milliliter (cts/100 mL).
Description: An indicator of the potential presence of pathogens in fresh water. E. coli bacteria is a normal component in the large intestines of humans and other warm-blooded animals, and can be excreted in their fecal material. Organisms causing infections or disease (pathogens) are often excreted in the fecal material of humans and other warm-blooded animals.
Importance: E.coli bacteria is a good indicator of fecal pollution and the possible presence of pathogenic organisms. In freshwater, E. coli concentrations help determine if the water is safe for recreational uses such as swimming.
Several factors can contribute to elevated E. coli levels, including, but not limited to rain storms, low river flows, the presence of wildlife, and the presence of septic systems along the river.
Metals
Depending on the metal concentration, its form (dissolved or particulate), and the hardness of the water, trace metals can be toxic to aquatic life. Metals in dissolved form are generally more toxic than metals in the particulate form. The dissolved metal concentration is dependent on pH, as well as the presence of solids and organic matter that can bind with the metal to render it less toxic.
Hardness is primarily a measure of the calcium and magnesium ion concentrations in water, expressed as calcium carbonate. The hardness concentration affects the toxicity of certain metals. New Hampshire water quality regulations include numeric criteria for a variety of metals. Since dissolved metals are typically found in extremely low concentrations, the potential contamination of samples collected for trace metals analyses has become a primary concern of water quality managers. To prevent such contamination and to ensure reliable results, the use of “clean techniques” is becoming more and more frequent when sampling for dissolved metals. Because of this, sampling for metals may be more costly and require additional effort than in the past.
Class A NH Surface Water Quality Standard: Unless naturally occurring, shall contain not more than either a geometric mean of 47 E.coli cts/100 mL based on at least three samples obtained over a sixty-day period, or greater than 153 E.coli cts/100 mL in any one sample.
Class B NH Surface Water Quality Standard: Unless naturally occurring, shall contain not more than either a geometric mean of 126 E.coli cts/100 mL based on at least three samples obtained over a sixty-day period, or greater than 406 E.coli cts/100 mL in any one sample.
New Hampshire Volunteer River Assessment Program
29 Hazen Drive – PO Box 95 Concord, NH 03302-0095
p (603) 271-0699 – f (603) 271-7894 www.des.nh.gov
2008

Appendix C: VRAP Field Audit 1
APPENDIX C:
2009 VRAP Field Audit
VRAP staff aim to visit each group annually during a scheduled sampling event to verify that volunteers successfully follow the VRAP protocols. If necessary, volunteers are re-trained during the visit, and the group is notified of the result of the verification visit. During the visit, volunteers were assessed in the following five categories: 1) Overall Sampling Procedures
Appropriate storage of meters, sample collection, laboratory sample collection and transportation, beginning and end of day meter checks, collecting a field replicate, performing QA/QC Meter Checks, and ensuring that all calibration and sampling data are properly documented on the VRAP Field Data Sheet and the Laboratory Services Login & Custody Sheet.
2) Turbidity
Inspecting and cleaning of glass turbidity vials prior to measurement of standards and samples, performing the Initial Turbidity Meter Check, calibrating the meter to a known standard at the beginning of the sampling day, recording the value of the DI turbidity blank (QA/QC Meter Check) once during the sampling day, and performing the “End of the Day Meter Check” at the conclusion of the sampling day.
3) pH
Inspecting the pH electrode prior to sampling, calibrating to both pH 7.0 and 4.0 buffers prior to each measurement, rinsing and wiping the pH electrode probe prior to and after the measurement of standards and samples, allowing the pH measurement to stabilize prior to recording the measurement, and recording the value of the 6.0 buffer (QA/QC Meter Check) once during the sampling day.
4) Water Temperature/Dissolved Oxygen
Ensuring that the meter is allowed an adequate time to stabilize prior to the first calibration, the meter is calibrated prior to each measurement, the calibration value is properly recorded, the chamber reading is properly recorded, that sufficient time is allowed for readings to stabilize, and that a zero oxygen check (QA/QC Meter Check) is completed during the sampling day.
5) Specific Conductance
Performing the Initial Conductivity Meter Check using a known standard, allowing for the meter to properly stabilize before recording measurements, properly cleaning the probe between stations, and performing the End of the Day Meter Check at the conclusion of the sampling day.
During the field audit, VRAP staff offer important reminders and suggestions to ensure proper sampling techniques and re-trained volunteers in the areas needing improvement. It is important to ensure that all volunteers attend an annual VRAP training workshop prior to the sampling season to familiarize themselves with proper sampling techniques. Please remember to schedule an annual field audit in 2010.

Appendix D: 2009 Oyster River Watershed Biological Data
Order Common Name Tolerance Value
15-OYS
Ephemeroptera Mayfly Nymph 3 162
Plecoptera Stonefly Nymph 1 0
Trichoptera Caddisfly Larvae 4 47
Dragonfly Nymph 7 0 Odonata
Damselfly Nymph 3 0
Black Fly Larvae 7 0
Midge Larvae 6 0 Diptera
Most True Flies 4 14
Alderfly 4 0 Megaloptera
Fishfly Larvae or Hellgrammite 0 7
Beetle & Beetle-like 7 0
Riffle Beetle 4 1 Coleoptera
Water Penny 4 0
Aquatic Worms 8 16
Clams & Mussels 7 0
Crayfish 7 0
Scuds 8 2
Snails 7 0
Other
Sowbug 7 0
Total Macroinvertebrates 249
Final Biotic Score 3.53
VBAP Narrative Category Good
Percent EPT 83.94%
Abundance 443

Appendix E: 2009 Oyster River Watershed Habitat Data
RIPARIAN HABITAT IN-STREAM CHARACTERISTICS
Station ID
Surrounding Land Use Dominant Vegetative
Type
Width of Riparian Zone (ft)
% Canopy Cover/ % tree type
Most Prevalent Habitat Type
Water Color/ Stream Flow
Substrate/ % Embededness
Aquatic Vegetation
Erosion & Other Streamside Impacts
15-OYS
Forest (70%) Residential (30%)
Trees
R ~ 100-500
L ~ 20-100
>75% 50% D 50% C
Glides & Runs
Reddish/Orange Moderate
Cobble >75%
None Slight erosion on both banks
Note: Data is derived from a standardized Field Volunteer Biomonitoring Habitat Data Sheet included in the Volunteer Biological Assessment Program 2008 Draft Protocol instructions. R = Right bank, L = Left bank, D = Deciduous, C = Coniferous