New gold presentation november 2017v final
52
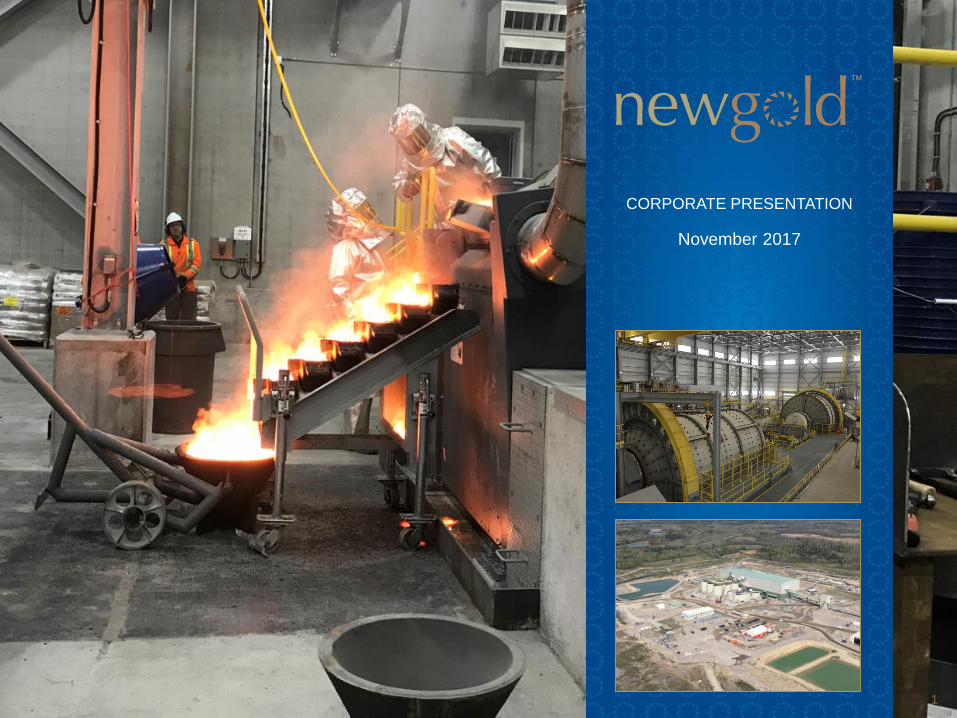
1 CORPORATE PRESENTATION November 2017
-
Upload
newgold2011 -
Category
Investor Relations
-
view
1.882 -
download
0
Transcript of New gold presentation november 2017v final
1
CORPORATE PRESENTATION
November 2017
Cautionary statements
2
ALL AMOUNTS IN U.S. DOLLARS UNLESS OTHERWISE STATED
CAUTIONARY NOTE REGARDING FORWARD-LOOKING STATEMENTS
Certain information contained in this presentation, including any information relating to New Gold’s future financial or operating performance are “forward looking”. All statements in this presentation, other than
statements of historical fact, which address events, results, outcomes or developments that New Gold expects to occur are “forward-looking statements”. Forward-looking statements are statements that are
not historical facts and are generally, but not always, identified by the use of forward-looking terminology such as “plans”, “expects”, “is expected”, “budget”, “scheduled”, “targeted”, “estimates”, “forecasts”,
“intends”, “anticipates”, “projects”, “potential”, “believes” or variations of such words and phrases or statements that certain actions, events or results “may”, “could”, “would”, “should”, “might” or “will be taken”,
“occur” or “be achieved” or the negative connotation of such terms. Forward-looking statements in this presentation include the statements made under “Projects Update”, as well as other statements elsewhere
in this presentation, including, among others, statements with respect to: guidance for production, operating expense and all-in sustaining costs, and the factors contributing to those expected results, as well as
expected capital and other expenditures; planned development activities for 2017 at the Rainy River Mine; the expected production, costs, economics, grade and other operating parameters of the Rainy River
Mine; the capacity of the starter dam; and targeting timing for development and other activities related to the Rainy River Mine.
All forward-looking statements in this presentation are based on the opinions and estimates of management as of the date such statements are made and are subject to important risk factors and uncertainties,
many of which are beyond New Gold’s ability to control or predict. Certain material assumptions regarding such forward-looking statements are discussed in this presentation, New Gold’s latest annual
management’s discussion and analysis (“MD&A”), Annual Information Form and Technical Reports filed at www.sedar.com and on EDGAR at www.sec.gov. In addition to, and subject to, such assumptions
discussed in more detail elsewhere, the forward-looking statements in this presentation are also subject to the following assumptions: (1) there being no significant disruptions affecting New Gold’s operations;
(2) political and legal developments in jurisdictions where New Gold operates, or may in the future operate, being consistent with New Gold’s current expectations; (3) the accuracy of New Gold’s current
mineral reserve and mineral resource estimates; (4) the exchange rate between the Canadian dollar, Australian dollar, Mexican peso and U.S. dollar being approximately consistent with current levels; (5)
prices for diesel, natural gas, fuel oil, electricity and other key supplies being approximately consistent with current levels; (6) equipment, labour and materials costs increasing on a basis consistent with New
Gold’s current expectations; (7) arrangements with First Nations and other Aboriginal groups in respect of the Rainy River Mine being consistent with New Gold’s current expectations; (8) all required permits,
licenses and authorizations being obtained from the relevant governments and other relevant stakeholders within the expected timelines and the absence of material negative comments during the applicable
regulatory processes; (9) the results of the feasibility study for the Rainy River Mine being realized; and (10) in the case of production, cost and expenditure outlooks at the operating mines for 2017,
commodity prices and exchange rates being consistent with those estimated for the purposes for 2017.
Forward-looking statements are necessarily based on estimates and assumptions that are inherently subject to known and unknown risks, uncertainties and other factors that may cause actual results, level of
activity, performance or achievements to be materially different from those expressed or implied by such forward-looking statements. Such factors include, without limitation: significant capital requirements and
the availability and management of capital resources; additional funding requirements; price volatility in the spot and forward markets for metals and other commodities; fluctuations in the international currency
markets and in the rates of exchange of the currencies of Canada, the United States, Australia and Mexico; discrepancies between actual and estimated production, between actual and estimated mineral
reserves and mineral resources and between actual and estimated metallurgical recoveries; fluctuation in treatment and refining charges; changes in national and local government legislation in Canada, the
United States, Australia and Mexico or any other country in which New Gold currently or may in the future carry on business; taxation; controls, regulations and political or economic developments in the
countries in which New Gold does or may carry on business; the speculative nature of mineral exploration and development, including the risks of obtaining and maintaining the validity and enforceability of the
necessary licenses and permits and complying with the permitting requirements of each jurisdiction in which New Gold operates; the lack of certainty with respect to foreign legal systems, which may not be
immune from the influence of political pressure, corruption or other factors that are inconsistent with the rule of law; the uncertainties inherent to current and future legal challenges New Gold is or may become
a party to; diminishing quantities or grades of mineral reserves and mineral resources; competition; inherent uncertainties with cost estimates at Rainy River as contemplated; loss of key employees; rising costs
of labour, supplies, fuel and equipment; actual results of current exploration or reclamation activities; uncertainties inherent to mining economic studies including the feasibility studies for the Rainy River Mine;
changes in project parameters as plans continue to be refined; accidents; labour disputes; defective title to mineral claims or property or contests over claims to mineral properties; unexpected delays and costs
inherent to consulting and accommodating rights of Indigenous groups; risks, uncertainties and unanticipated delays associated with obtaining and maintaining necessary licenses, permits and authorizations
and complying with permitting requirements. In addition, there are risks and hazards associated with the business of mineral exploration, development and mining, including environmental events and hazards,
industrial accidents, unusual or unexpected formations, pressures, cave-ins, flooding and gold bullion losses and risks associated with the start of production of a mine, such as Rainy River, (and the risk of
inadequate insurance or inability to obtain insurance to cover these risks) as well as “Risk Factors” included in New Gold’s Annual Information Form, MD&A and other disclosure documents filed on and
available at www.sedar.com and on EDGAR at www.sec.gov. Forward-looking statements are not guarantees of future performance, and actual results and future events could materially differ from those
anticipated in such statements. All of the forward-looking statements contained in this presentation are qualified by these cautionary statements. New Gold expressly disclaims any intention or obligation to
update or revise any forward-looking statements whether as a result of new information, events or otherwise, except in accordance with applicable securities laws.
The footnotes, endnotes and appendix to this presentation contain important information. The endnotes and appendix are found at the end of the presentation. All amounts in US dollars unless otherwise
indicated.
3
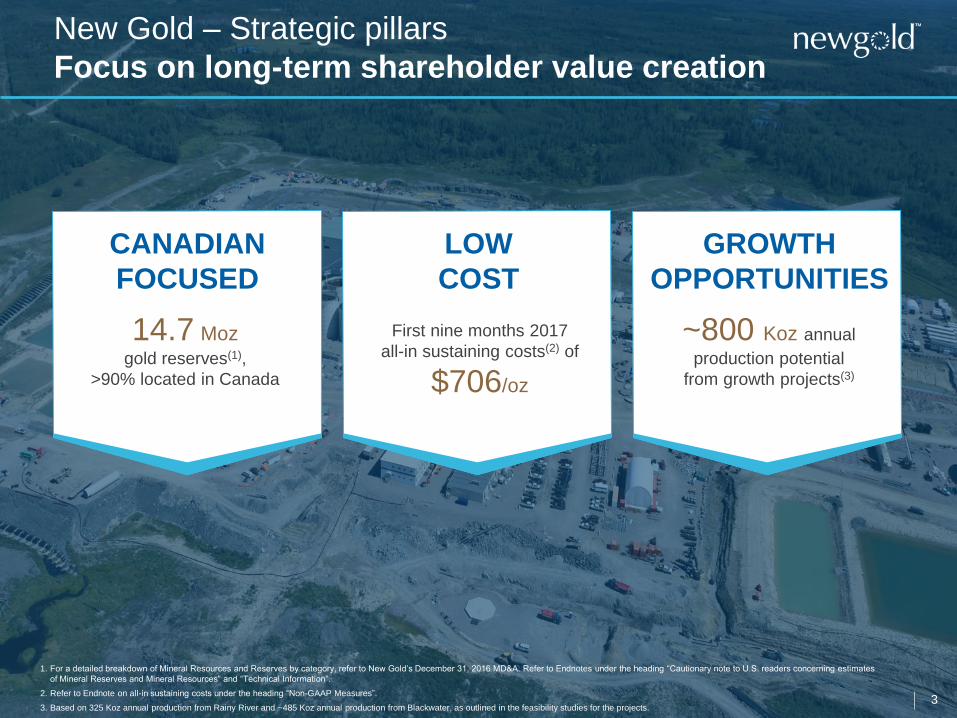
New Gold – Strategic pillars
Focus on long-term shareholder value creation
1. For a detailed breakdown of Mineral Resources and Reserves by category, refer to New Gold’s December 31, 2016 MD&A. Refer to Endnotes under the heading “Cautionary note to U.S. readers concerning estimates
of Mineral Reserves and Mineral Resources” and “Technical Information”.
2. Refer to Endnote on all-in sustaining costs under the heading “Non-GAAP Measures”.
3. Based on 325 Koz annual production from Rainy River and ~485 Koz annual production from Blackwater, as outlined in the feasibility studies for the projects.
CANADIAN
FOCUSED
14.7 Moz
gold reserves(1),
>90% located in Canada
First nine months 2017
all-in sustaining costs(2) of
$706/oz
~800 Koz annual
production potential
from growth projects(3)
LOW
COST
GROWTH
OPPORTUNITIES
4
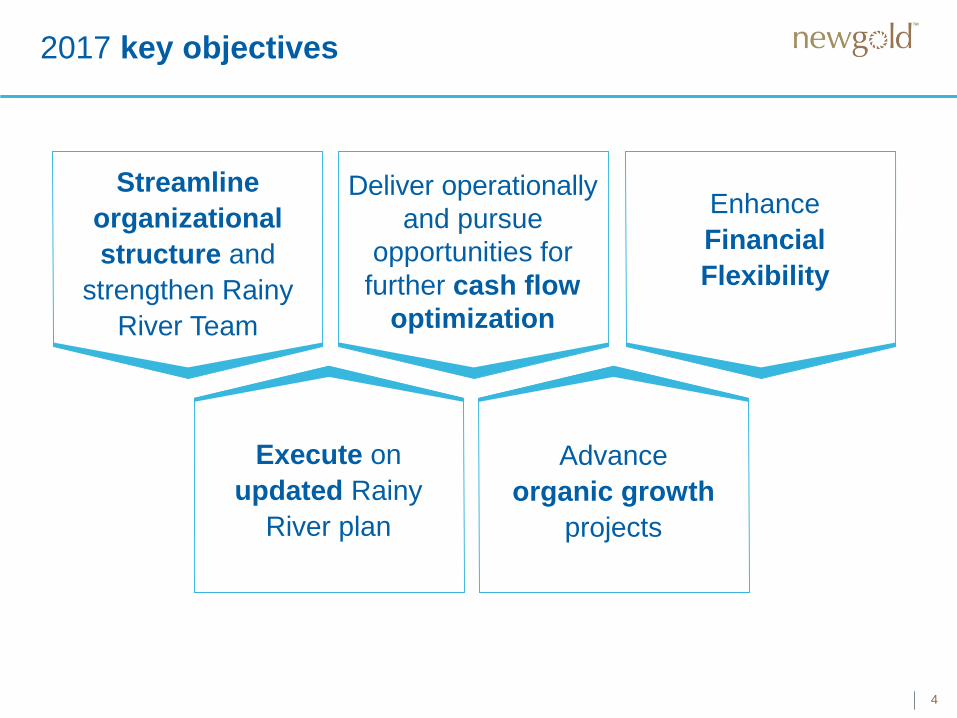
2017 key objectives
Streamline
organizational
structure and
strengthen Rainy
River Team
Advance
organic growth
projects
Enhance
Financial
Flexibility
Deliver operationally
and pursue
opportunities for
further cash flow
optimization
Execute on
updated Rainy
River plan
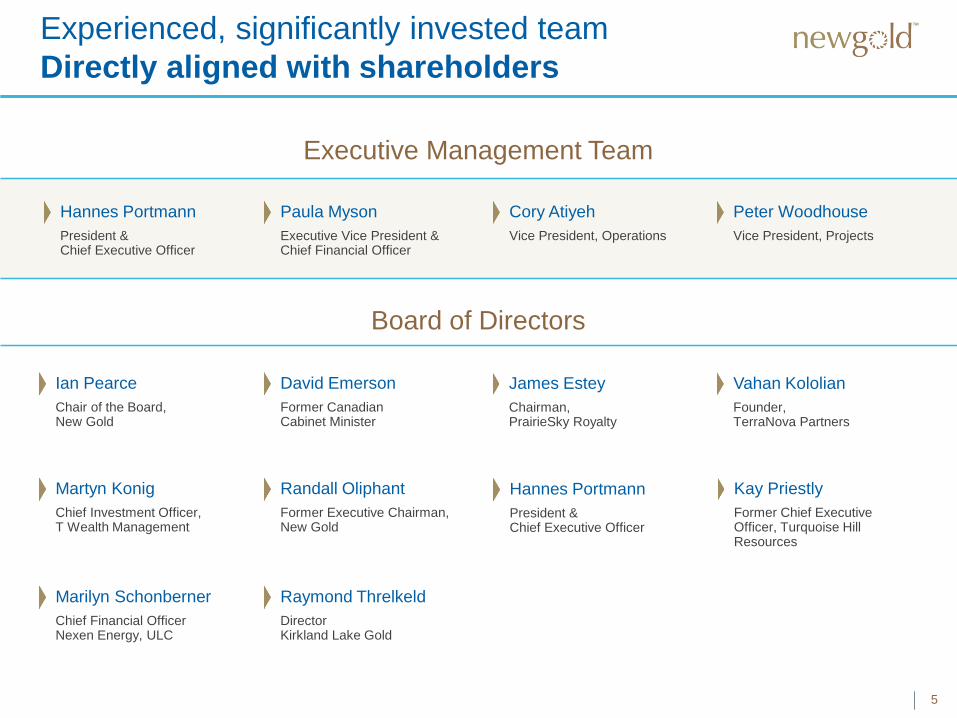
Experienced, significantly invested team
Directly aligned with shareholders
5
Executive Management Team
Ian Pearce
Chair of the Board, New Gold
Board of Directors
David Emerson
Former Canadian Cabinet Minister
James Estey
Chairman, PrairieSky Royalty
Martyn Konig
Chief Investment Officer,T Wealth Management
Kay Priestly
Former Chief Executive Officer, Turquoise Hill Resources
Randall Oliphant
Former Executive Chairman,New Gold
Raymond Threlkeld
DirectorKirkland Lake Gold
Marilyn Schonberner
Chief Financial OfficerNexen Energy, ULC
Hannes Portmann
President & Chief Executive Officer
Paula Myson
Executive Vice President &Chief Financial Officer
Cory Atiyeh
Vice President, Operations
Peter Woodhouse
Vice President, Projects
Vahan Kololian
Founder,TerraNova Partners
Hannes Portmann
President &Chief Executive Officer
BLACKWATER
NEW AFTON
RAINY RIVER
CANADA
New Gold assets
On track to meet full-year guidance
6
Development Projects1. Based on 2013 Feasibility Study.
2. Six years of current B-zone reserves plus five years of C-zone.
3. Gold operating expense excludes Peak Mines as Peak Mines has been classified as a discontinued operation.
4. Refer to Endnote on all-in sustaining costs under the heading “Non-GAAP Measures”.
1
MESQUITEMine Life 5 years
plus residual leach3
USA
CERRO SAN
PEDROResidual leach5
MEXICO
PEAK MINES Mine Life 5 years2
AUSTRALIA
Mine Life 17 years(1)
Mine Life 11 years(2)
Mine Life 14 years
2017 GuidanceFirst Nine
Months 2017
Gold Production
380-430Koz
Copper Production
100-110Mlbs
Gold Operating
Expense(3)
Gold Production
276Koz
Copper Production
76Mlbs
$603$/oz
$590-$630$/oz
Gold Operating
Expense(3)
All-in Sustaining
Costs(4)
$706$/oz
$760-$800$/oz
All-in Sustaining
Costs(3)
Operating Mines
7
Production
82,027 oz Gold
26.0 mlbsCopper
Costs
Rainy River
$601 per ozGold operating expense(1)
$792 per ozAll-in sustaining costs(2)
1. Gold operating expense from continuing operations.
2. Refer to Endnote on all-in sustaining costs under the heading “Non-GAAP Measures”.
Financial
$66 millionCash generated from operations
$0.11Cash flow per share
Balance Sheet
$207 millionCash balance at Sept 30, 2017
Further increased company’s 2018 cash flow certainty with
copper option contracts covering approximately 60 million pounds
of 2018 production
Rainy River
Commercial production
achieved ahead of schedule
From October 1-24, 2017,
processing rate averaged
18,500 tonnes per day, or 88%
of nameplate capacity
Schedule 2 amendment
received ahead of schedule
$130 million in capital
expenditures during the
third quarter
2017 third quarter highlights
On-track to meet full-year gold production guidance
8
Disciplined management of
Capital resources and liquidity position – Sept 30th
1. Cash and cash equivalents as at September 30, 2017.
2. Undrawn credit facility as at September 30, 2017. $127 million of $400 million facility used for Letters of Credit and $200 million drawn at September 30, 2017.
Liquidity
Position
$280million
Cash and cash
equivalents(1)
$207 million
$73 million
Undrawn credit
facility(2)
+Ongoing sustaining
free cash flow and
increased cash flow
certainty with gold/copper
contracts in 2017
Short-term and long-term
Financial flexibility
• 120,000 ounces of New Gold’s second half 2017
gold production
• Option contracts cover 20,000 ounces of gold per
month from July to December 2017
• 43.7 million pounds (7.3 million pounds per month
from July to December 2017) at $2.73 per pound
9
$1,400 /ozUpside at
Short-Term Cash Flow Certainty
$1,250 /ozFloor
20,000ounces per month
7.3million pounds
per month$2.73 /lbatGold
Option
Contracts
Copper
Swaps
Long-Term Balance Sheet Flexibility
• No debt due until 2022
• Recent debt restructuring extended maturity
and provides further flexibility
• Summary of new terms:
APRIL 2012 NOTES MAY 2017 NOTES
Face Value $300 million $300 million
Maturity April 15, 2020 May 15, 2025
Interest Rate 7.00% 6.375%
• Face value $1 billion in long-term debt at
September 30, 2017
• Face value $500 million, 6.25% notes due in 2022
• Callable at 103.1% after November 2017
• Face value $300 million, 6.375% notes due in 2025
• Face value $200 million drawn on credit facility(1)Extended maturityLowered interest rate
1. $73 million undrawn credit facility as at September 30, 2017. $127 million of $400 million facility used for Letters of Credit and $200 million drawn at September 30, 2017.
at ~5million pounds
per month
$3.00/lb
Floor
Copper
option
contracts
$3.37/lb
Upside
• ~60 million pounds of 2018 production
10
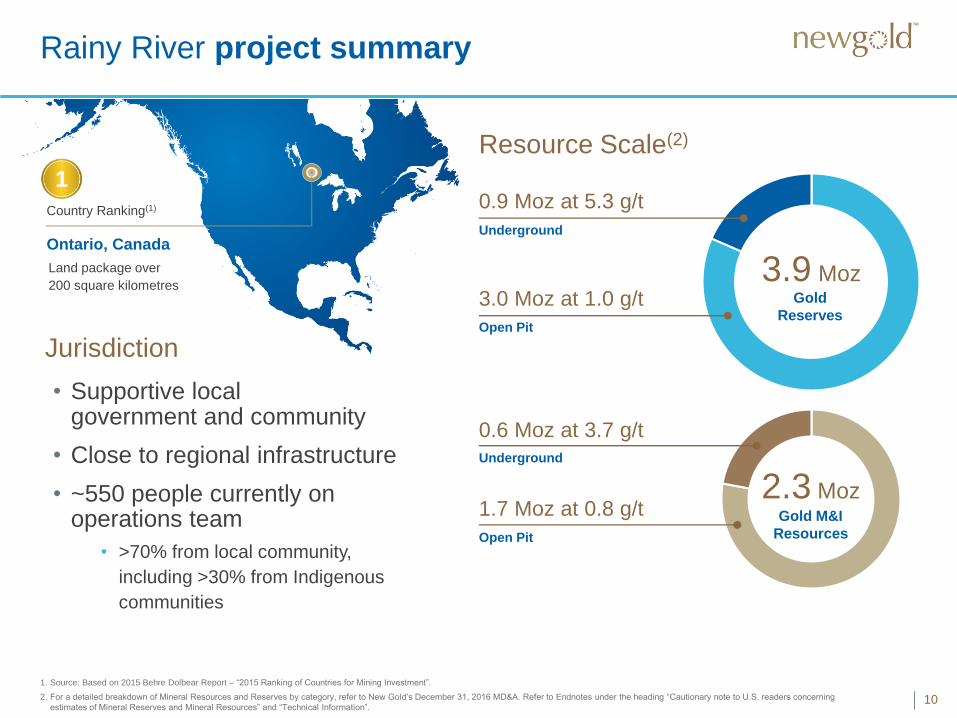
Rainy River project summary
3.0 Moz at 1.0 g/t
Open Pit
Underground
0.9 Moz at 5.3 g/t
3.9 Moz
1.7 Moz at 0.8 g/t
Open Pit
Underground
0.6 Moz at 3.7 g/t
2.3 Moz
Resource Scale(2)
1. Source: Based on 2015 Behre Dolbear Report – “2015 Ranking of Countries for Mining Investment”.
2. For a detailed breakdown of Mineral Resources and Reserves by category, refer to New Gold’s December 31, 2016 MD&A. Refer to Endnotes under the heading “Cautionary note to U.S. readers concerning
estimates of Mineral Reserves and Mineral Resources” and “Technical Information”.
• Supportive local government and community
• Close to regional infrastructure
• ~550 people currently on operations team
• >70% from local community,
including >30% from Indigenous
communities
Country Ranking(1)
Land package over
200 square kilometres
Ontario, Canada
1
Jurisdiction
Gold
Reserves
Gold M&I
Resources
11
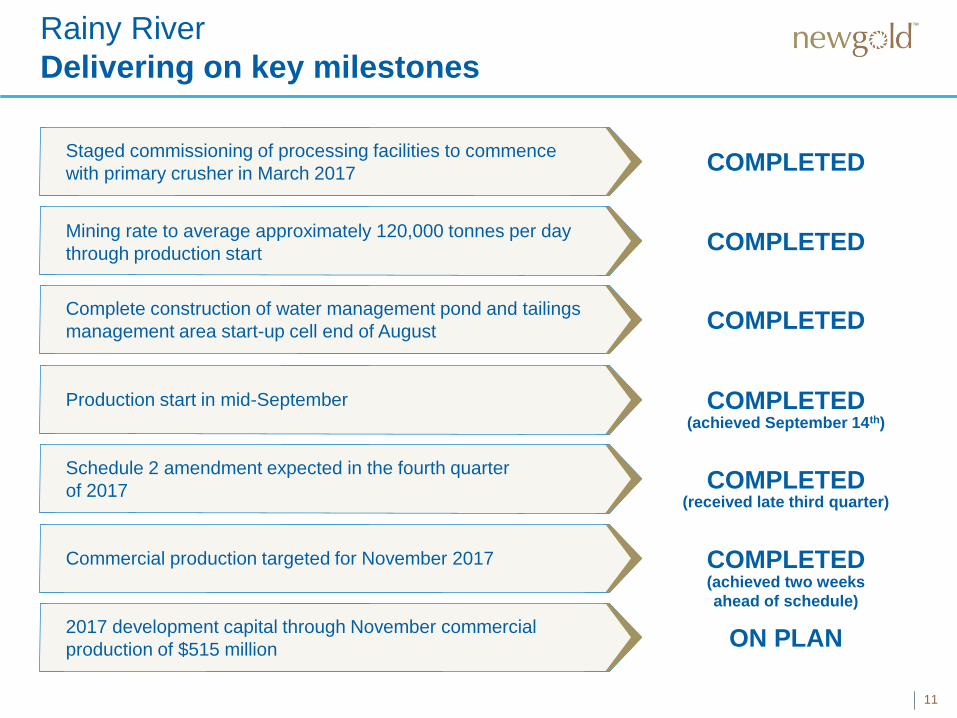
Rainy River
Delivering on key milestones
Staged commissioning of processing facilities to commence
with primary crusher in March 2017 COMPLETED
Mining rate to average approximately 120,000 tonnes per day
through production start COMPLETED
Complete construction of water management pond and tailings
management area start-up cell end of August COMPLETED
Production start in mid-September COMPLETED
Schedule 2 amendment expected in the fourth quarter
of 2017 COMPLETED
Commercial production targeted for November 2017 COMPLETED
2017 development capital through November commercial
production of $515 million ON PLAN
(achieved September 14th)
(received late third quarter)
(achieved two weeks
ahead of schedule)
12
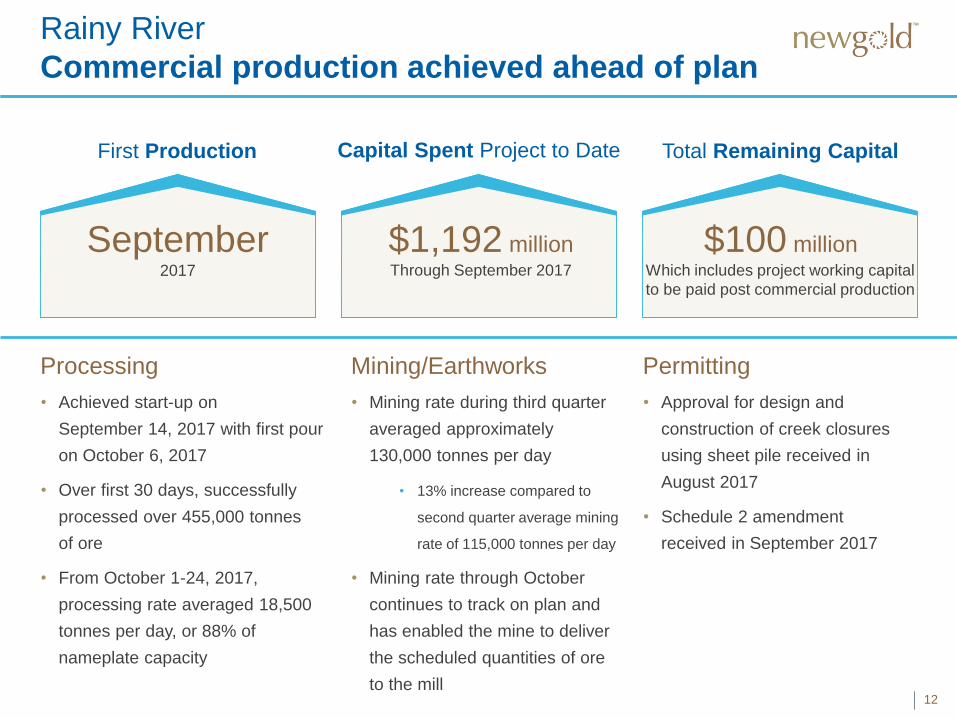
Rainy River
Commercial production achieved ahead of plan
First Production Capital Spent Project to Date Total Remaining Capital
September 2017 Through September 2017
$1,192 million $100 million
Permitting
• Approval for design and
construction of creek closures
using sheet pile received in
August 2017
• Schedule 2 amendment
received in September 2017
Processing
• Achieved start-up on
September 14, 2017 with first pour
on October 6, 2017
• Over first 30 days, successfully
processed over 455,000 tonnes
of ore
• From October 1-24, 2017,
processing rate averaged 18,500
tonnes per day, or 88% of
nameplate capacity
Mining/Earthworks
• Mining rate during third quarter
averaged approximately
130,000 tonnes per day
• 13% increase compared to
second quarter average mining
rate of 115,000 tonnes per day
• Mining rate through October
continues to track on plan and
has enabled the mine to deliver
the scheduled quantities of ore
to the mill
Which includes project working capital
to be paid post commercial production
13
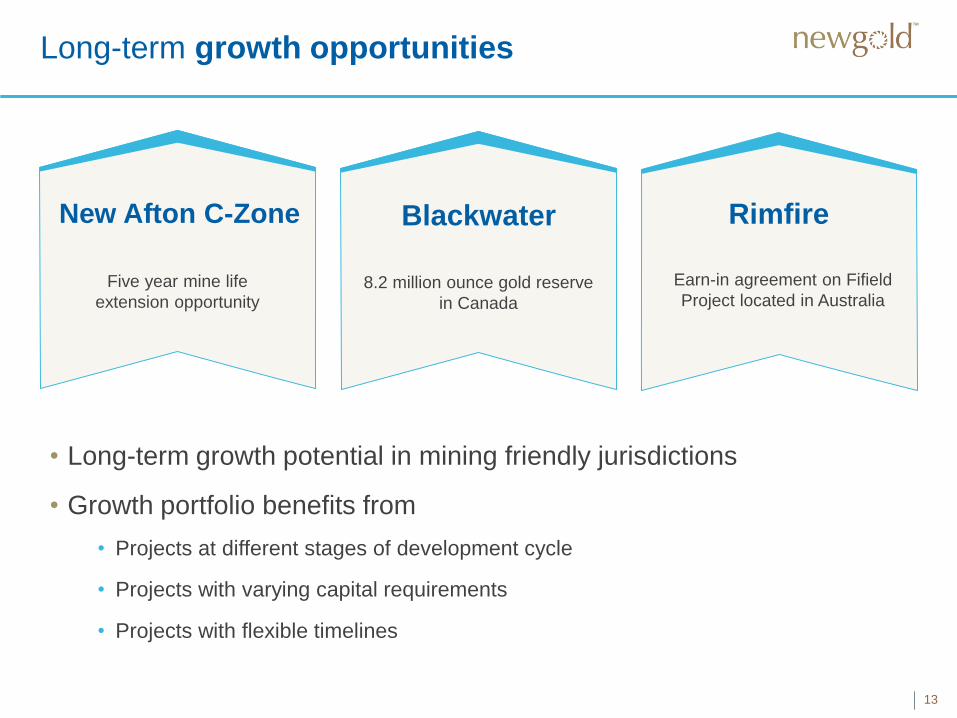
Long-term growth opportunities
New Afton C-Zone
Five year mine life
extension opportunity
Blackwater
8.2 million ounce gold reserve
in Canada
Rimfire
Earn-in agreement on Fifield
Project located in Australia
• Long-term growth potential in mining friendly jurisdictions
• Growth portfolio benefits from
• Projects at different stages of development cycle
• Projects with varying capital requirements
• Projects with flexible timelines
Operating Mines
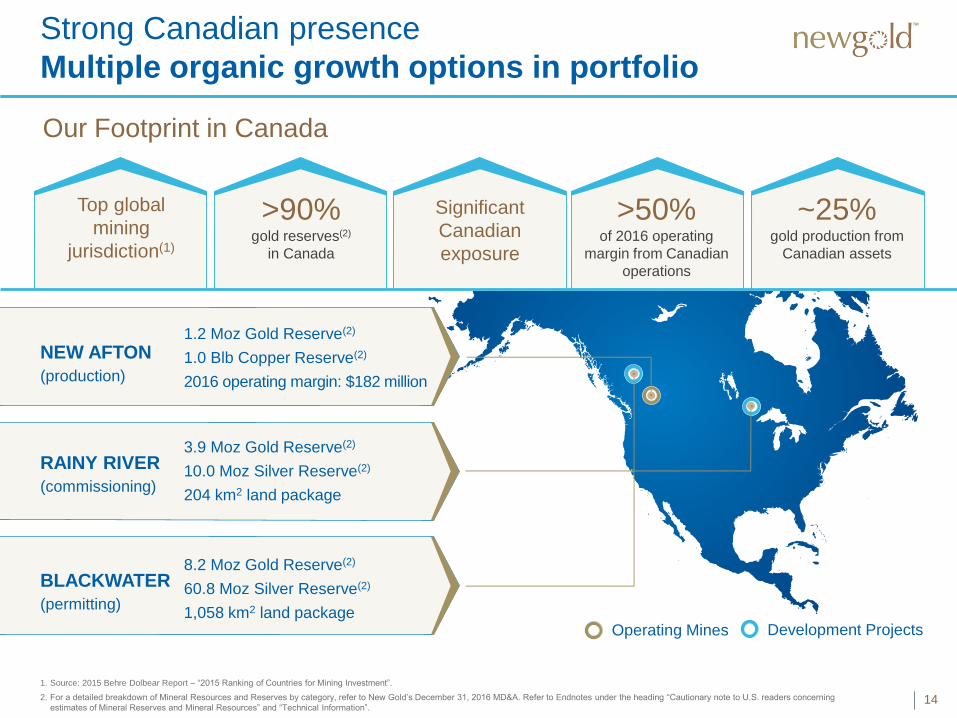
Strong Canadian presence
Multiple organic growth options in portfolio
14
1. Source: 2015 Behre Dolbear Report – “2015 Ranking of Countries for Mining Investment”.
2. For a detailed breakdown of Mineral Resources and Reserves by category, refer to New Gold’s December 31, 2016 MD&A. Refer to Endnotes under the heading “Cautionary note to U.S. readers concerning
estimates of Mineral Reserves and Mineral Resources” and “Technical Information”.
Our Footprint in Canada
Top global
mining
jurisdiction(1)
>90%gold reserves(2)
in Canada
Significant
Canadian
exposure
>50% of 2016 operating
margin from Canadian
operations
~25% gold production from
Canadian assets
Development Projects
NEW AFTON
(production)
1.2 Moz Gold Reserve(2)
1.0 Blb Copper Reserve(2)
2016 operating margin: $182 million
RAINY RIVER
(commissioning)
3.9 Moz Gold Reserve(2)
10.0 Moz Silver Reserve(2)
204 km2 land package
BLACKWATER
(permitting)
8.2 Moz Gold Reserve(2)
60.8 Moz Silver Reserve(2)
1,058 km2 land package
15
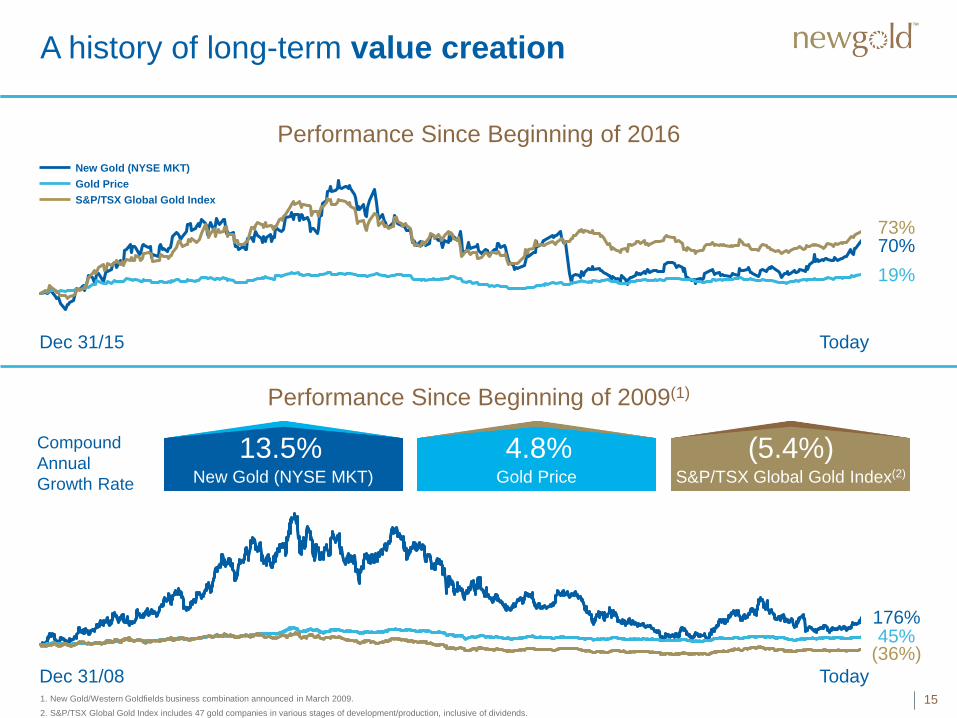
A history of long-term value creation
1. New Gold/Western Goldfields business combination announced in March 2009.
2. S&P/TSX Global Gold Index includes 47 gold companies in various stages of development/production, inclusive of dividends.
Performance Since Beginning of 2016
70%
Dec 31/15
19%
Today
73%
Performance Since Beginning of 2009(1)
Compound
Annual
Growth Rate New Gold (NYSE MKT) Gold Price S&P/TSX Global Gold Index(2)
176%
Dec 31/08
45%
13.5% 4.8% (5.4%)
Today
(36%)
New Gold (NYSE MKT)
Gold Price
S&P/TSX Global Gold Index
16
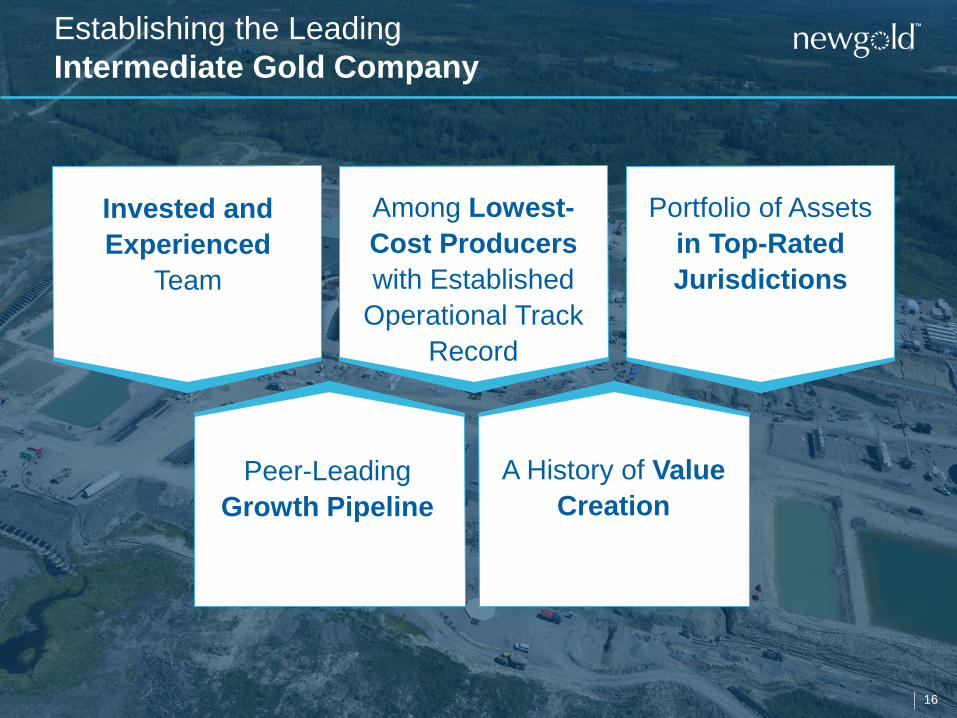
Establishing the Leading
Intermediate Gold Company
Invested and
Experienced
Team
Among Lowest-
Cost Producers
with Established
Operational Track
Record
Portfolio of Assets
in Top-Rated
Jurisdictions
Peer-Leading
Growth Pipeline
A History of Value
Creation
Appendices
Corporate 18
New Afton 26
Rainy River 29
Blackwater, Exploration, Reserves and Resources 37
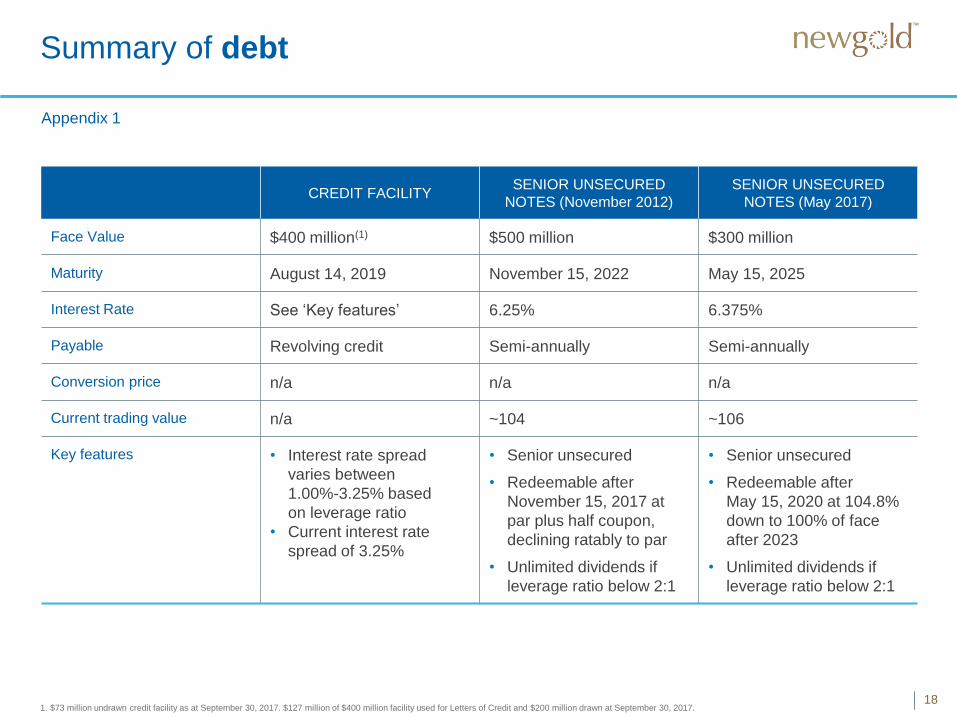
Summary of debt
181. $73 million undrawn credit facility as at September 30, 2017. $127 million of $400 million facility used for Letters of Credit and $200 million drawn at September 30, 2017.
Appendix 1
CREDIT FACILITYSENIOR UNSECURED
NOTES (November 2012)
SENIOR UNSECURED
NOTES (May 2017)
Face Value $400 million(1) $500 million $300 million
Maturity August 14, 2019 November 15, 2022 May 15, 2025
Interest Rate See ‘Key features’ 6.25% 6.375%
Payable Revolving credit Semi-annually Semi-annually
Conversion price n/a n/a n/a
Current trading value n/a ~104 ~106
Key features • Interest rate spread
varies between
1.00%-3.25% based
on leverage ratio
• Current interest rate
spread of 3.25%
• Senior unsecured
• Redeemable after
November 15, 2017 at
par plus half coupon,
declining ratably to par
• Unlimited dividends if
leverage ratio below 2:1
• Senior unsecured
• Redeemable after
May 15, 2020 at 104.8%
down to 100% of face
after 2023
• Unlimited dividends if
leverage ratio below 2:1
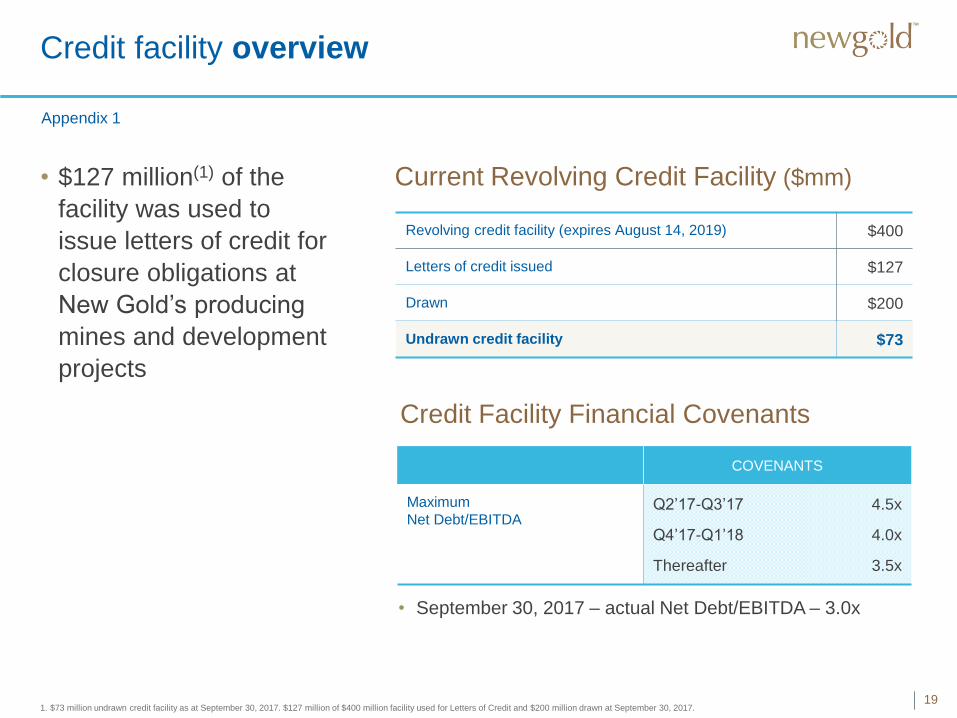
Credit facility overview
• $127 million(1) of the
facility was used to
issue letters of credit for
closure obligations at
New Gold’s producing
mines and development
projects
19
Current Revolving Credit Facility ($mm)
Credit Facility Financial Covenants
Revolving credit facility (expires August 14, 2019) $400
Letters of credit issued $127
Drawn $200
Undrawn credit facility $73
COVENANTS
Maximum
Net Debt/EBITDAQ2’17-Q3’17
Q4’17-Q1’18
Thereafter
4.5x
4.0x
3.5x
Appendix 1
1. $73 million undrawn credit facility as at September 30, 2017. $127 million of $400 million facility used for Letters of Credit and $200 million drawn at September 30, 2017.
• September 30, 2017 – actual Net Debt/EBITDA – 3.0x
20
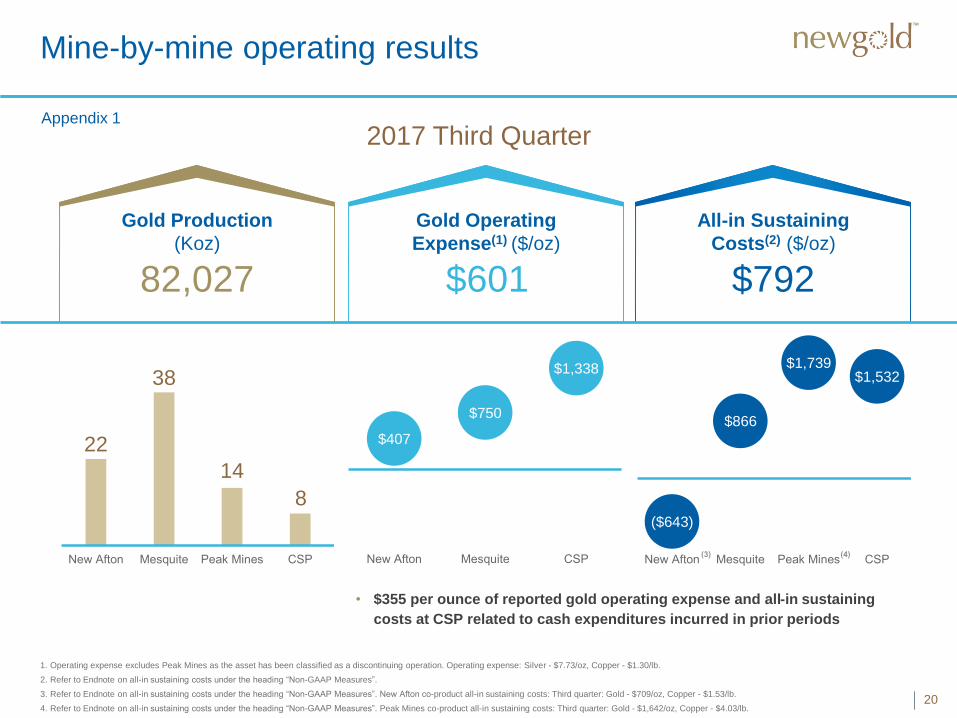
Mine-by-mine operating results
Appendix 1
2017 Third Quarter
Gold Production
(Koz)
82,027
Gold Operating
Expense(1) ($/oz)
$601
All-in Sustaining
Costs(2) ($/oz)
$792
22
38
14
8
$407
$750
$1,338
($643)
$866
$1,739 $1,532
1. Operating expense excludes Peak Mines as the asset has been classified as a discontinuing operation. Operating expense: Silver - $7.73/oz, Copper - $1.30/lb.
2. Refer to Endnote on all-in sustaining costs under the heading “Non-GAAP Measures”.
3. Refer to Endnote on all-in sustaining costs under the heading “Non-GAAP Measures”. New Afton co-product all-in sustaining costs: Third quarter: Gold - $709/oz, Copper - $1.53/lb.
4. Refer to Endnote on all-in sustaining costs under the heading “Non-GAAP Measures”. Peak Mines co-product all-in sustaining costs: Third quarter: Gold - $1,642/oz, Copper - $4.03/lb.
• $355 per ounce of reported gold operating expense and all-in sustaining
costs at CSP related to cash expenditures incurred in prior periods
21
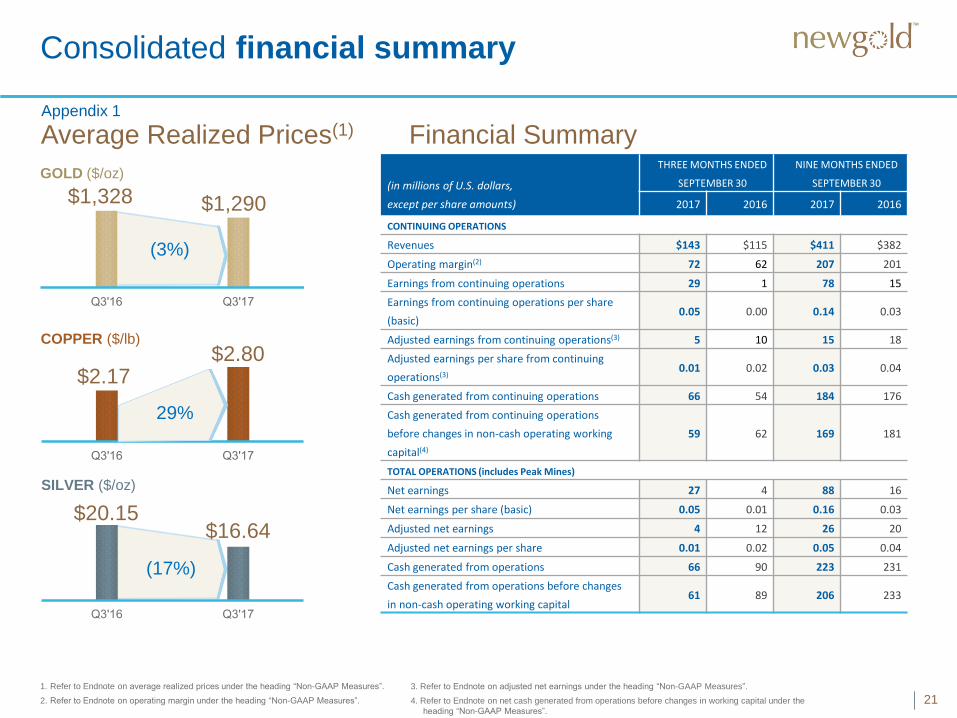
Consolidated financial summary
Appendix 1
1. Refer to Endnote on average realized prices under the heading “Non-GAAP Measures”.
2. Refer to Endnote on operating margin under the heading “Non-GAAP Measures”.
3. Refer to Endnote on adjusted net earnings under the heading “Non-GAAP Measures”.
4. Refer to Endnote on net cash generated from operations before changes in working capital under the
heading “Non-GAAP Measures”.
Financial Summary
GOLD ($/oz)
(3%)
COPPER ($/lb)
29%
SILVER ($/oz)
(17%)
Average Realized Prices(1)
$1,328 $1,290
$2.17$2.80
$$20.15$16.64
(in millions of U.S. dollars,
except per share amounts)
THREE MONTHS ENDED
SEPTEMBER 30
NINE MONTHS ENDED
SEPTEMBER 30
2017 2016 2017 2016
CONTINUING OPERATIONS
Revenues $143 $115 $411 $382
Operating margin(2) 72 62 207 201
Earnings from continuing operations 29 1 78 15
Earnings from continuing operations per share
(basic)0.05 0.00 0.14 0.03
Adjusted earnings from continuing operations(3) 5 10 15 18
Adjusted earnings per share from continuing
operations(3)0.01 0.02 0.03 0.04
Cash generated from continuing operations 66 54 184 176
Cash generated from continuing operations
before changes in non-cash operating working
capital(4)
59 62 169 181
TOTAL OPERATIONS (includes Peak Mines)
Net earnings 27 4 88 16
Net earnings per share (basic) 0.05 0.01 0.16 0.03
Adjusted net earnings 4 12 26 20
Adjusted net earnings per share 0.01 0.02 0.05 0.04
Cash generated from operations 66 90 223 231
Cash generated from operations before changes
in non-cash operating working capital61 89 206 233
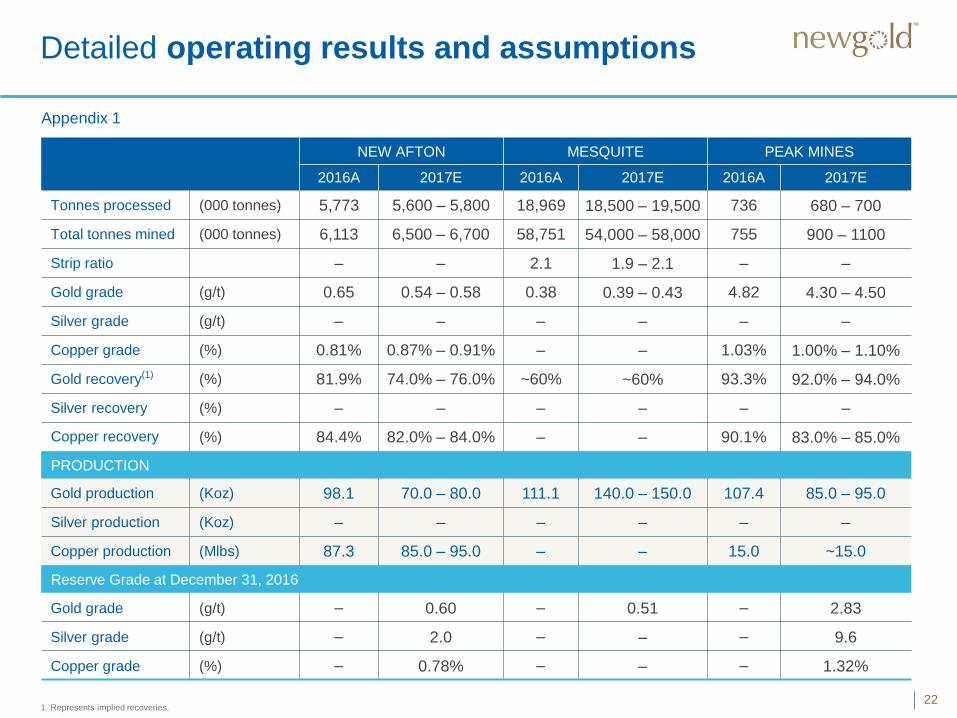
Detailed operating results and assumptions
22
NEW AFTON MESQUITE PEAK MINES
2016A 2017E 2016A 2017E 2016A 2017E
Tonnes processed (000 tonnes) 5,773 5,600 – 5,800 18,969 18,500 – 19,500 736 680 – 700
Total tonnes mined (000 tonnes) 6,113 6,500 – 6,700 58,751 54,000 – 58,000 755 900 – 1100
Strip ratio – – 2.1 1.9 – 2.1 – –
Gold grade (g/t) 0.65 0.54 – 0.58 0.38 0.39 – 0.43 4.82 4.30 – 4.50
Silver grade (g/t) – – – – – –
Copper grade (%) 0.81% 0.87% – 0.91% – – 1.03% 1.00% – 1.10%
Gold recovery(1) (%) 81.9% 74.0% – 76.0% ~60% ~60% 93.3% 92.0% – 94.0%
Silver recovery (%) – – – – – –
Copper recovery (%) 84.4% 82.0% – 84.0% – – 90.1% 83.0% – 85.0%
PRODUCTION
Gold production (Koz) 98.1 70.0 – 80.0 111.1 140.0 – 150.0 107.4 85.0 – 95.0
Silver production (Koz) – – – – – –
Copper production (Mlbs) 87.3 85.0 – 95.0 – – 15.0 ~15.0
Reserve Grade at December 31, 2016
Gold grade (g/t) – 0.60 – 0.51 – 2.83
Silver grade (g/t) – 2.0 – – – 9.6
Copper grade (%) – 0.78% – – – 1.32%
1. Represents implied recoveries.
Appendix 1
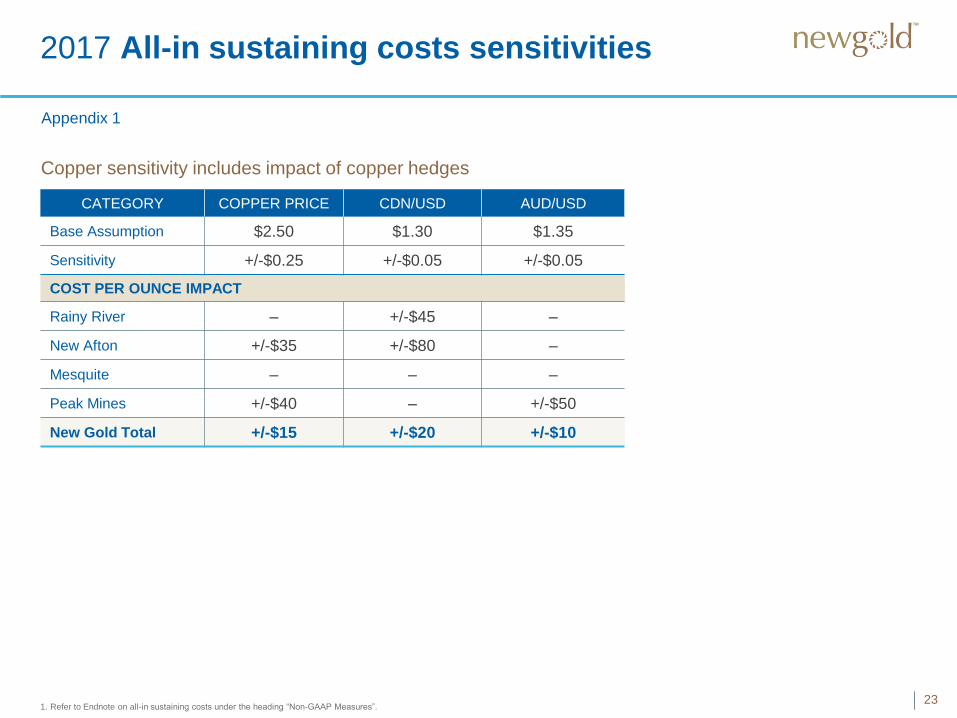
2017 All-in sustaining costs sensitivities
23
CATEGORY COPPER PRICE CDN/USD AUD/USD
Base Assumption $2.50 $1.30 $1.35
Sensitivity +/-$0.25 +/-$0.05 +/-$0.05
COST PER OUNCE IMPACT
Rainy River – +/-$45 –
New Afton +/-$35 +/-$80 –
Mesquite – – –
Peak Mines +/-$40 – +/-$50
New Gold Total +/-$15 +/-$20 +/-$10
1. Refer to Endnote on all-in sustaining costs under the heading “Non-GAAP Measures”.
Appendix 1
Copper sensitivity includes impact of copper hedges
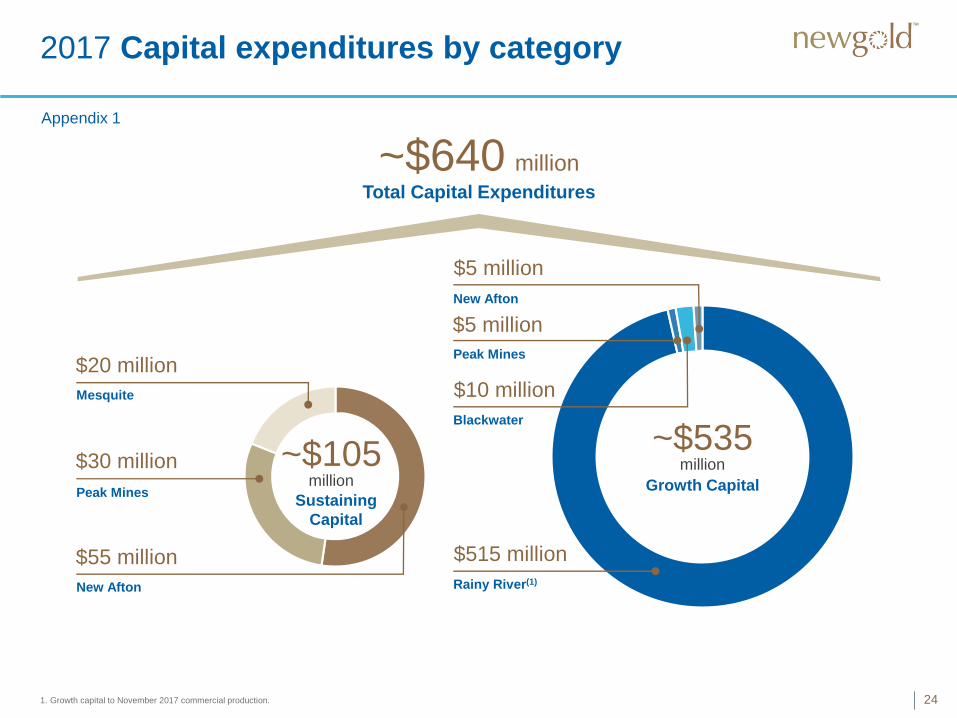
2017 Capital expenditures by category
24
New Afton
Peak Mines
Mesquite
Rainy River(1)
Blackwater
New Afton
Total Capital Expenditures
~$640 million
Growth Capital
~$535million
Sustaining
Capital
~$105million
$20 million
$30 million
$55 million
$5 million
$10 million
$515 million
Appendix 1
Peak Mines
$5 million
1. Growth capital to November 2017 commercial production.
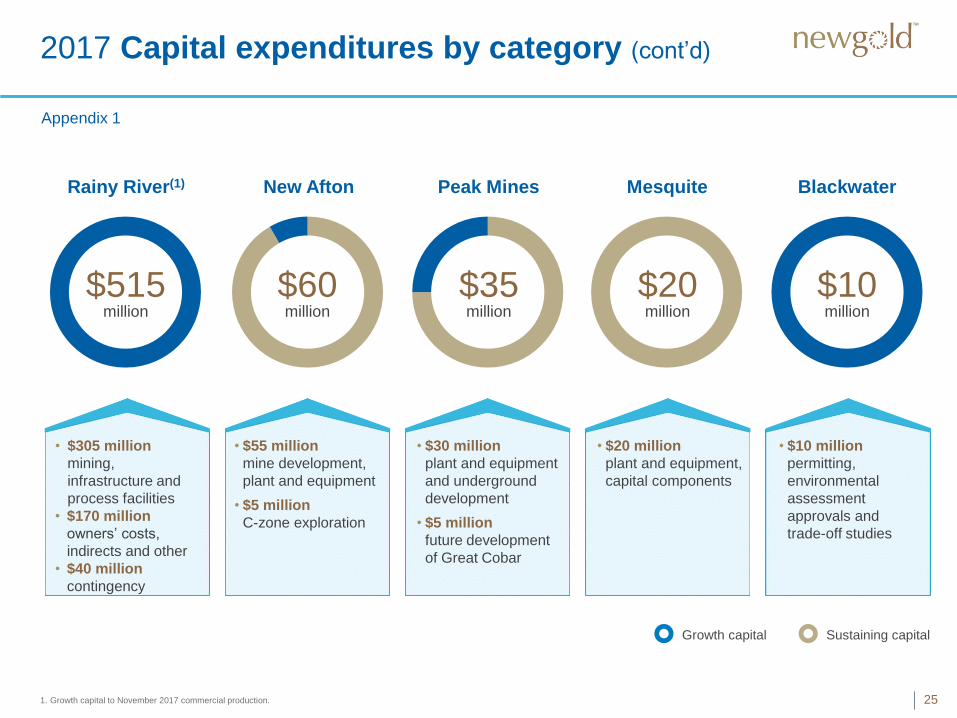
2017 Capital expenditures by category (cont’d)
25
Rainy River(1) New Afton Peak Mines
• $305 million
mining,
infrastructure and
process facilities
• $170 million
owners’ costs,
indirects and other
• $40 million
contingency
• $55 million
mine development,
plant and equipment
• $5 million
C-zone exploration
• $30 million
plant and equipment
and underground
development
• $5 million
future development
of Great Cobar
Growth capital Sustaining capital
Mesquite Blackwater
• $20 million
plant and equipment,
capital components
• $10 million
permitting,
environmental
assessment
approvals and
trade-off studies
$515 million
$60 million
$35 million
$20 million
$10 million
Appendix 1
1. Growth capital to November 2017 commercial production.
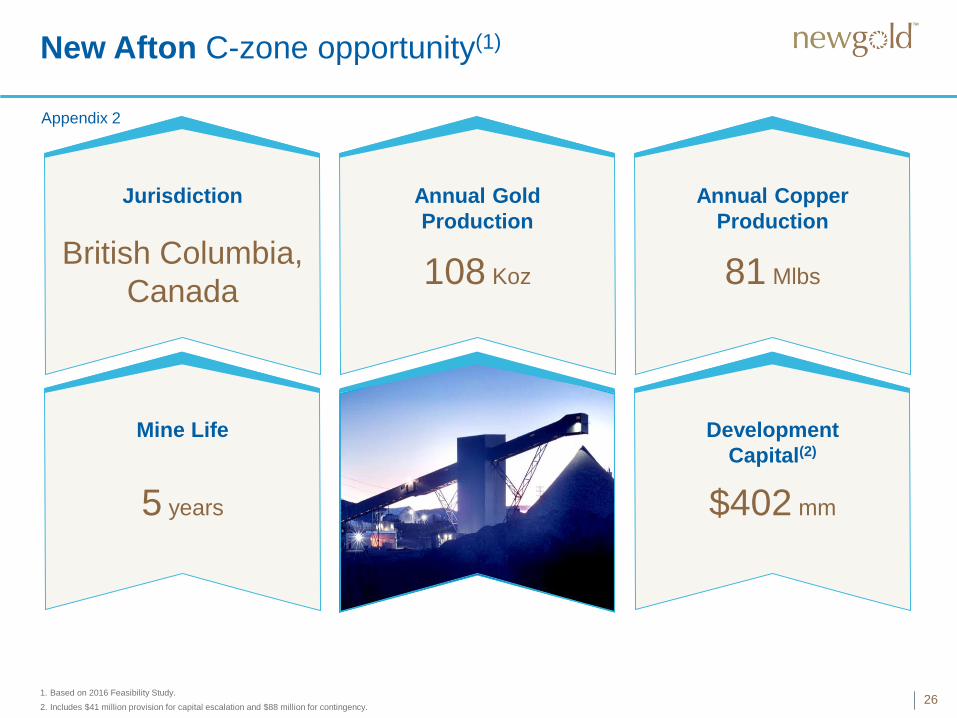
New Afton C-zone opportunity(1)
26
Jurisdiction Annual Gold
Production
108 Koz
Annual Copper
Production
81 Mlbs
Mine Life
5 years
Development
Capital(2)
British Columbia,
Canada
1. Based on 2016 Feasibility Study.
2. Includes $41 million provision for capital escalation and $88 million for contingency.
$402 mm
Appendix 2
New Afton C-zone
27
Measured
Indicated
Inferred
Appendix 2
1,180m
C-zone Block Cave
Volume
Open at depth
Main Zone Extraction
Level
C-zone
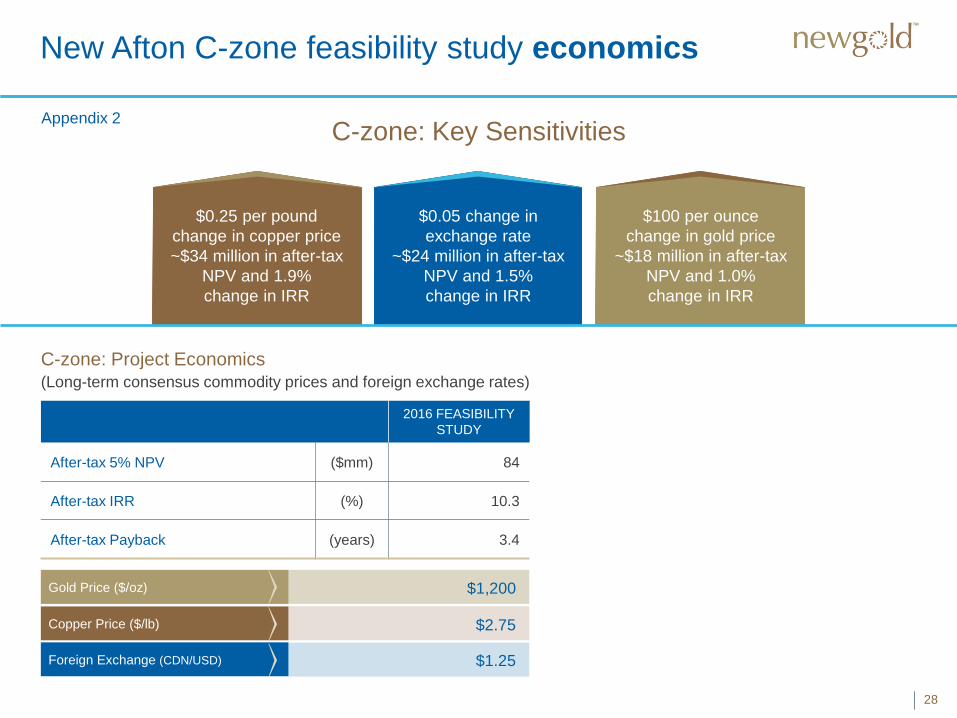
$0.25 per pound
change in copper price
~$34 million in after-tax
NPV and 1.9%
change in IRR
New Afton C-zone feasibility study economics
28
C-zone: Key Sensitivities
C-zone: Project Economics (Long-term consensus commodity prices and foreign exchange rates)
Appendix 2
$100 per ounce
change in gold price
~$18 million in after-tax
NPV and 1.0%
change in IRR
$0.05 change in
exchange rate
~$24 million in after-tax
NPV and 1.5%
change in IRR
Foreign Exchange (CDN/USD)
$1,200
$2.75
$1.25
Gold Price ($/oz)
Copper Price ($/lb)
2016 FEASIBILITY
STUDY
After-tax 5% NPV ($mm) 84
After-tax IRR (%) 10.3
After-tax Payback (years) 3.4
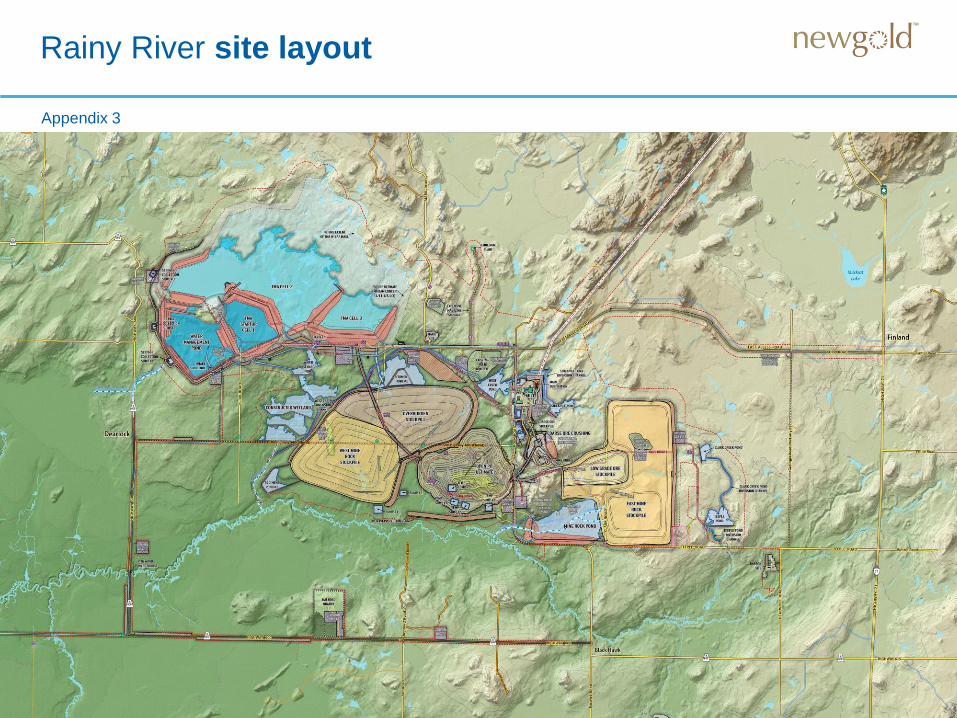
Rainy River site layout
Appendix 3
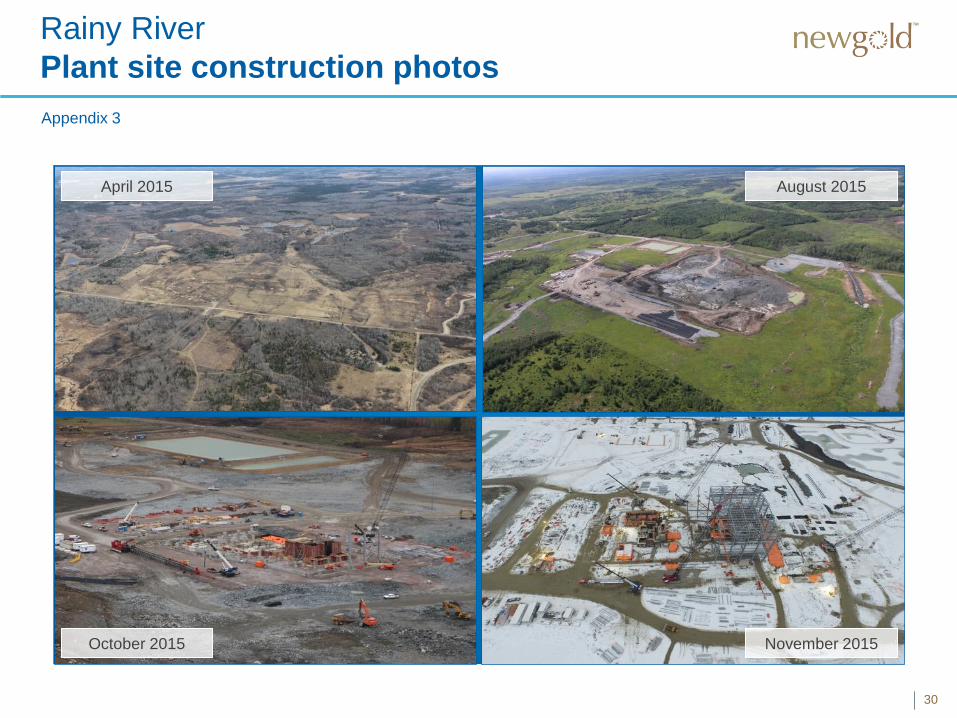
Rainy River
Plant site construction photos
30
August 2015
November 2015October 2015
Appendix 3
April 2015
Rainy River
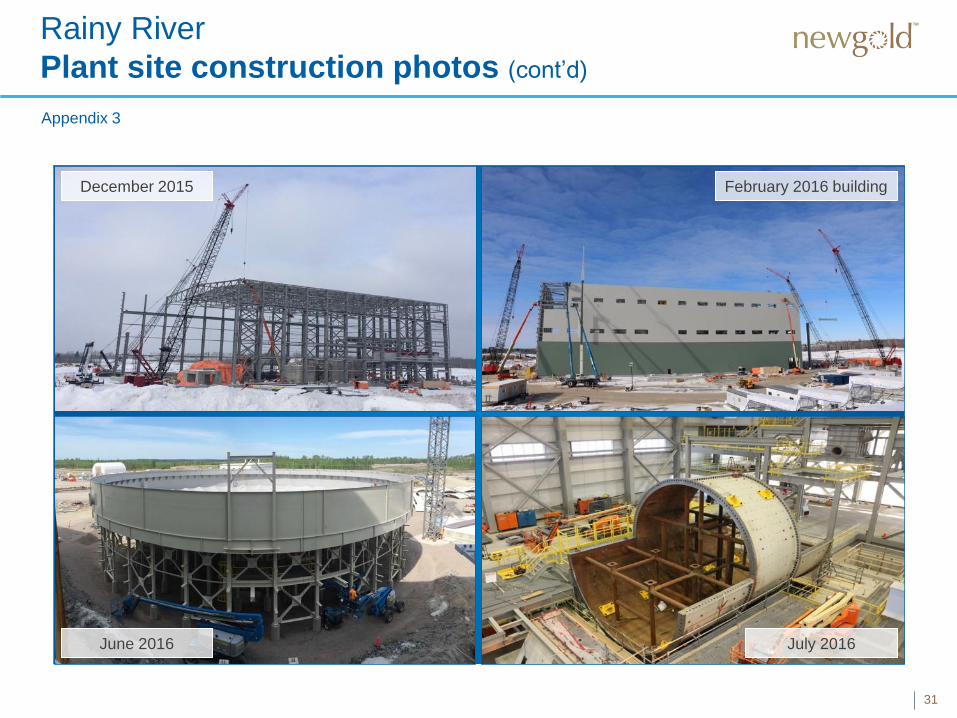
Plant site construction photos (cont’d)
31
December 2015 February 2016 building
July 2016June 2016
Appendix 3
Rainy River
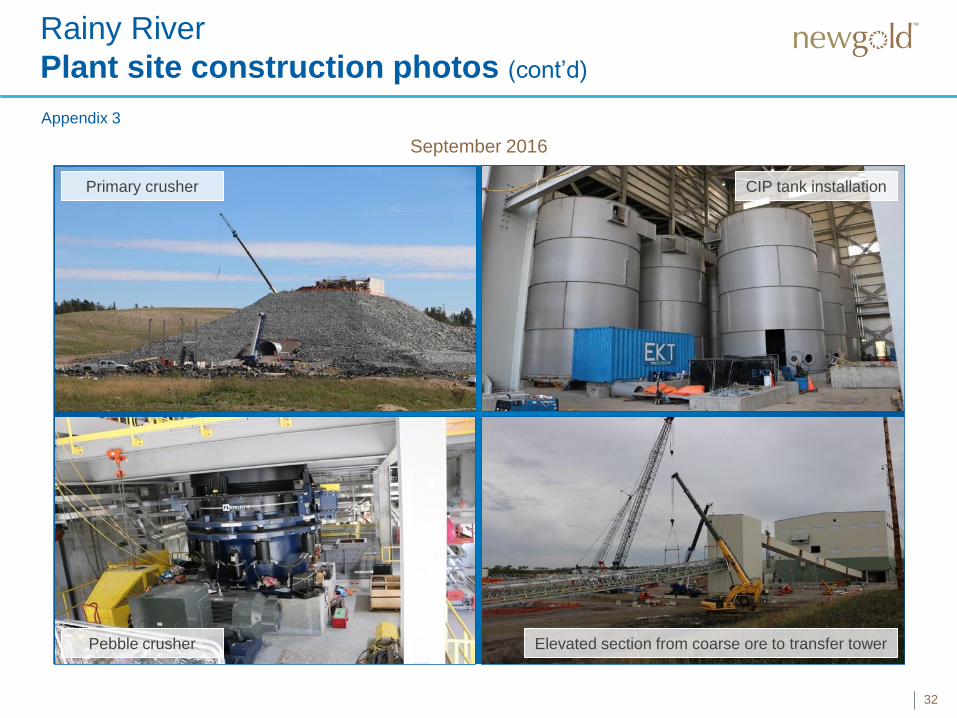
Plant site construction photos (cont’d)
32
Primary crusher Coarse ore reclaim
Elevated section from coarse ore to transfer towerPebble crusher
Appendix 3
September 2016
CIP tank installation
Rainy River
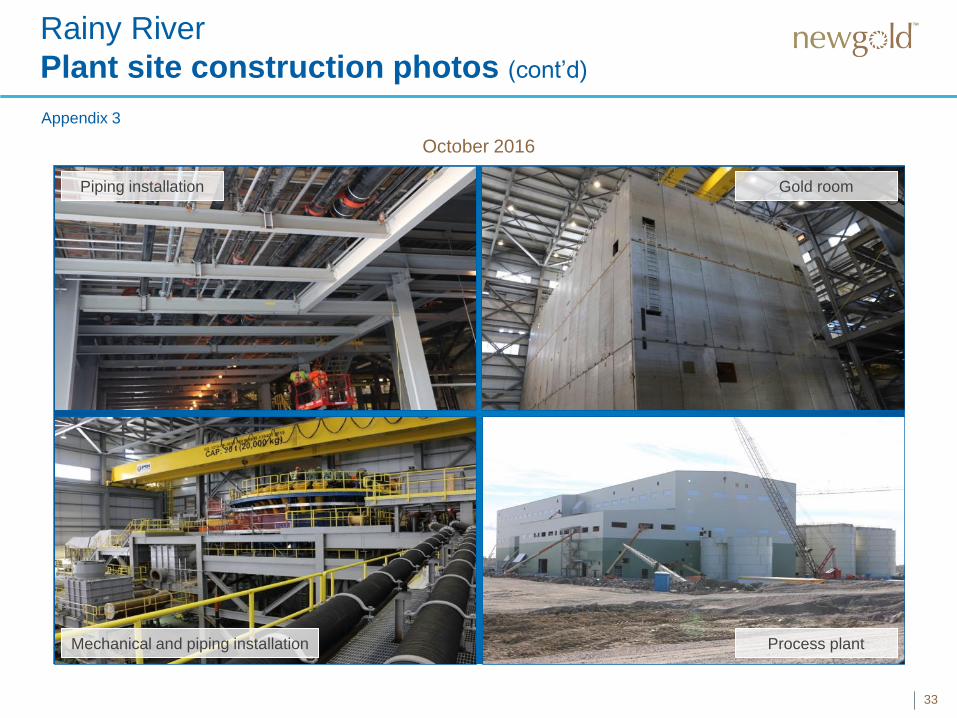
Plant site construction photos (cont’d)
33
Piping installation Gold room
Process plantMechanical and piping installation
Appendix 3
October 2016
34
Mechanical and piping installation
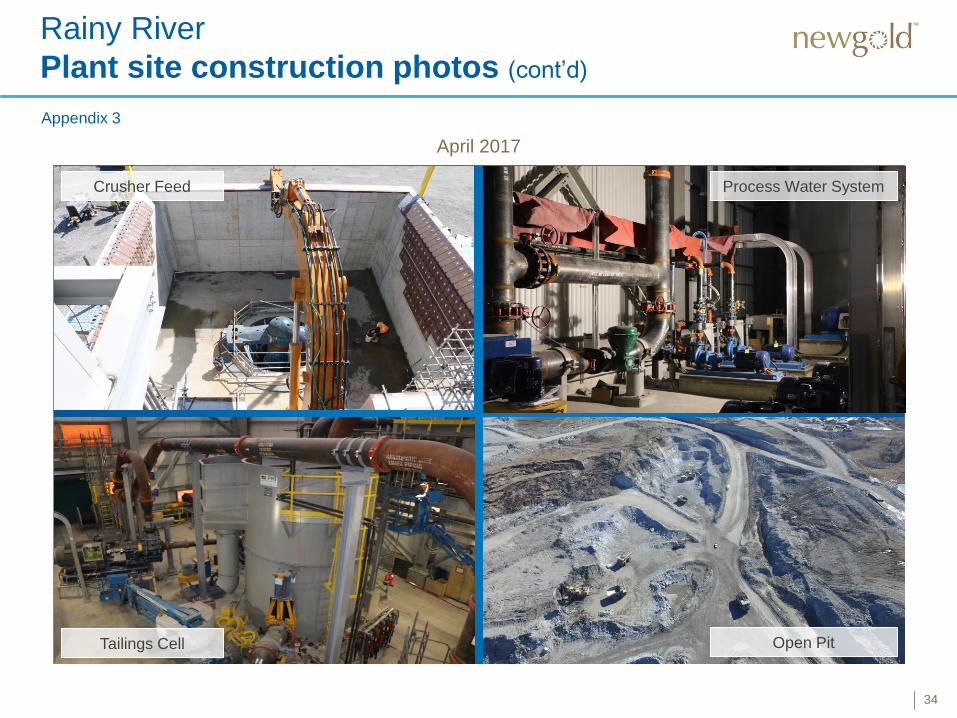
April 2017
Rainy River
Plant site construction photos (cont’d)
Crusher Feed Process Water System
Tailings Cell Open Pit
Appendix 3
35
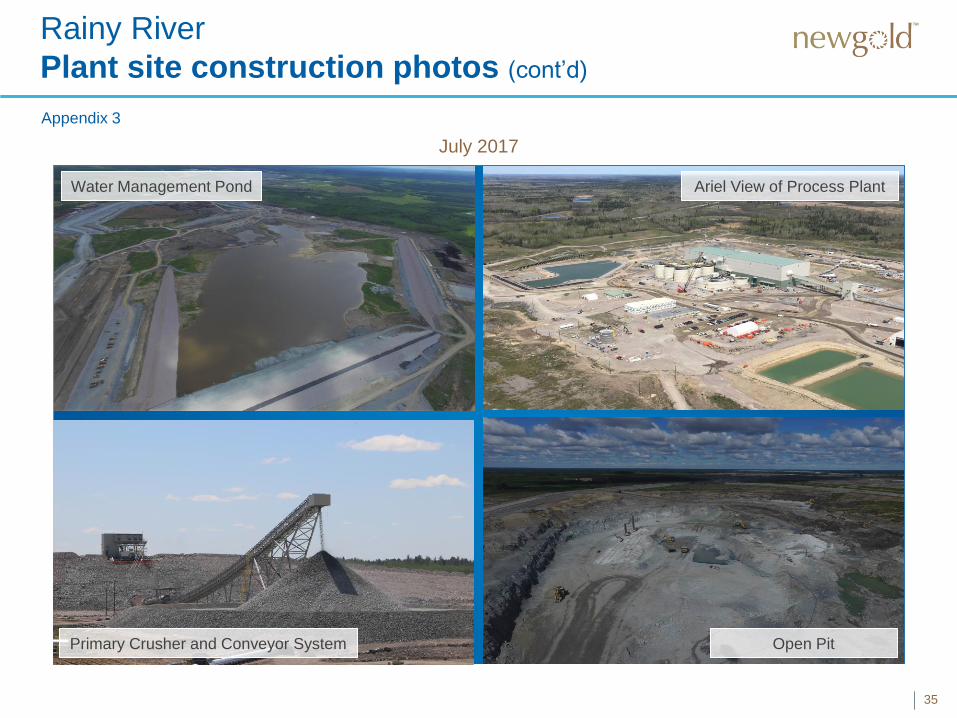
July 2017
Rainy River
Plant site construction photos (cont’d)
Appendix 3
Open Pit
Water Management Pond
Primary Crusher and Conveyor System
Ariel View of Process Plant
36
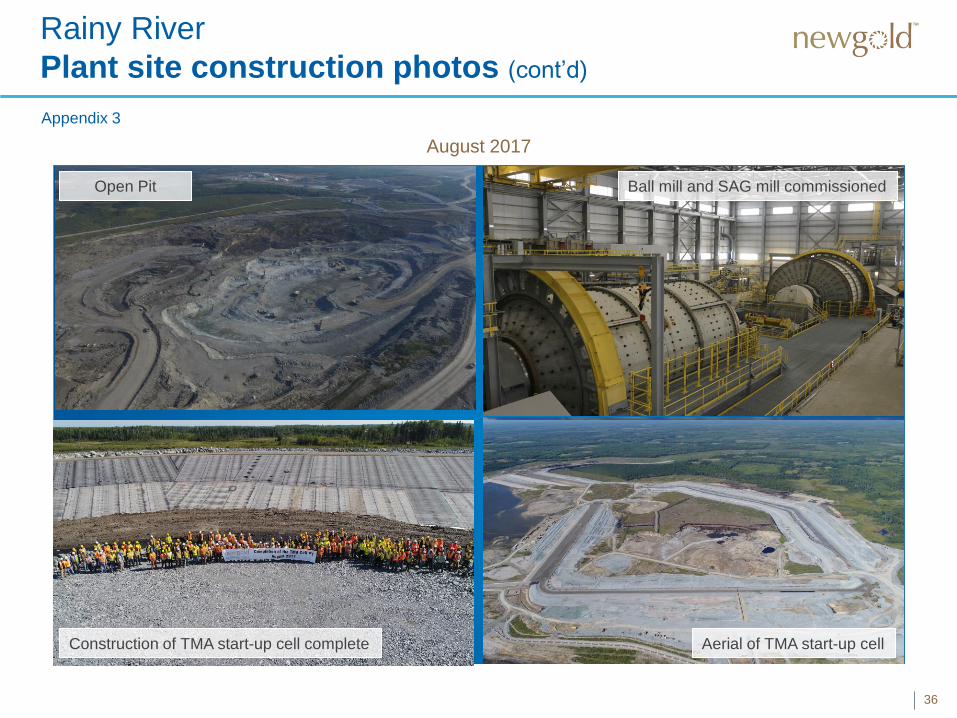
August 2017
Rainy River
Plant site construction photos (cont’d)
Appendix 3
Open Pit Ball mill and SAG mill commissioned
Construction of TMA start-up cell complete Aerial of TMA start-up cell
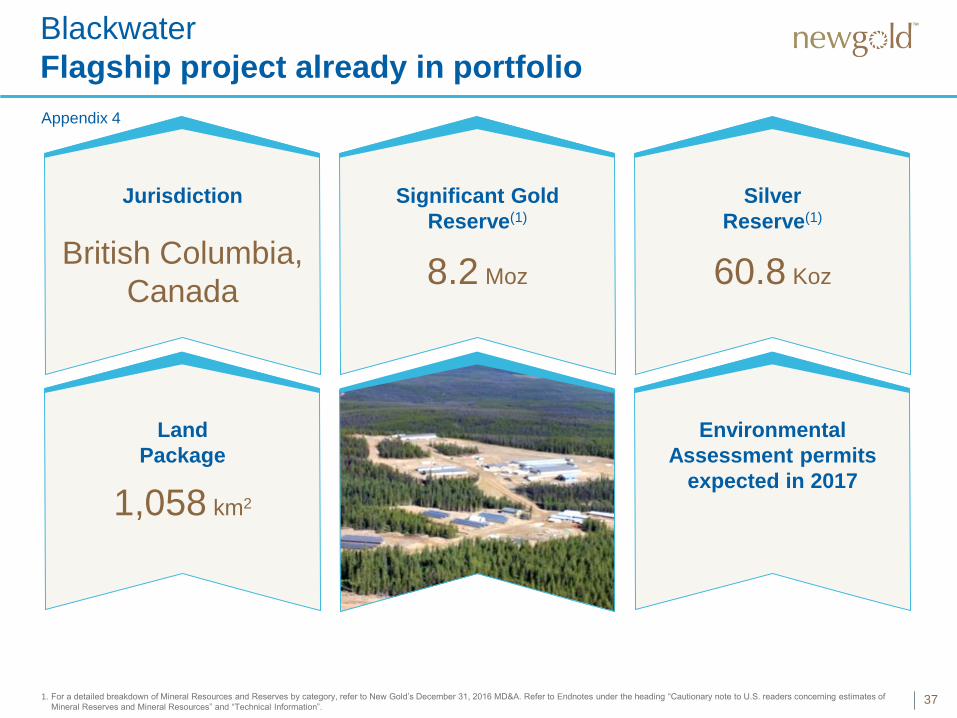
Blackwater
Flagship project already in portfolio
37
Jurisdiction Significant Gold
Reserve(1)
8.2 Moz
Silver
Reserve(1)
60.8 Koz
Land
Package
1,058 km2
Environmental
Assessment permits
expected in 2017
1. For a detailed breakdown of Mineral Resources and Reserves by category, refer to New Gold’s December 31, 2016 MD&A. Refer to Endnotes under the heading “Cautionary note to U.S. readers concerning estimates of
Mineral Reserves and Mineral Resources” and “Technical Information”.
British Columbia,
Canada
Appendix 4
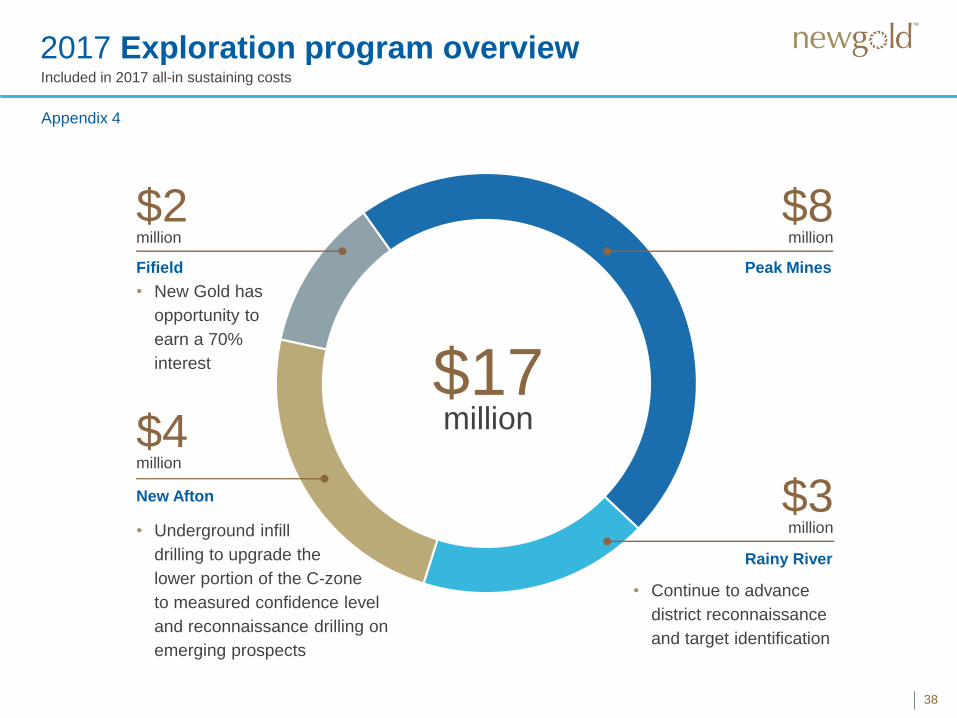
38
$17million
Peak Mines
New Afton
Rainy River
Fifield
$2million
$4million
$8million
$3million
Appendix 4
• Underground infill
drilling to upgrade the
lower portion of the C-zone
to measured confidence level
and reconnaissance drilling on
emerging prospects
• Continue to advance
district reconnaissance
and target identification
• New Gold has
opportunity to
earn a 70%
interest
Included in 2017 all-in sustaining costs
2017 Exploration program overview
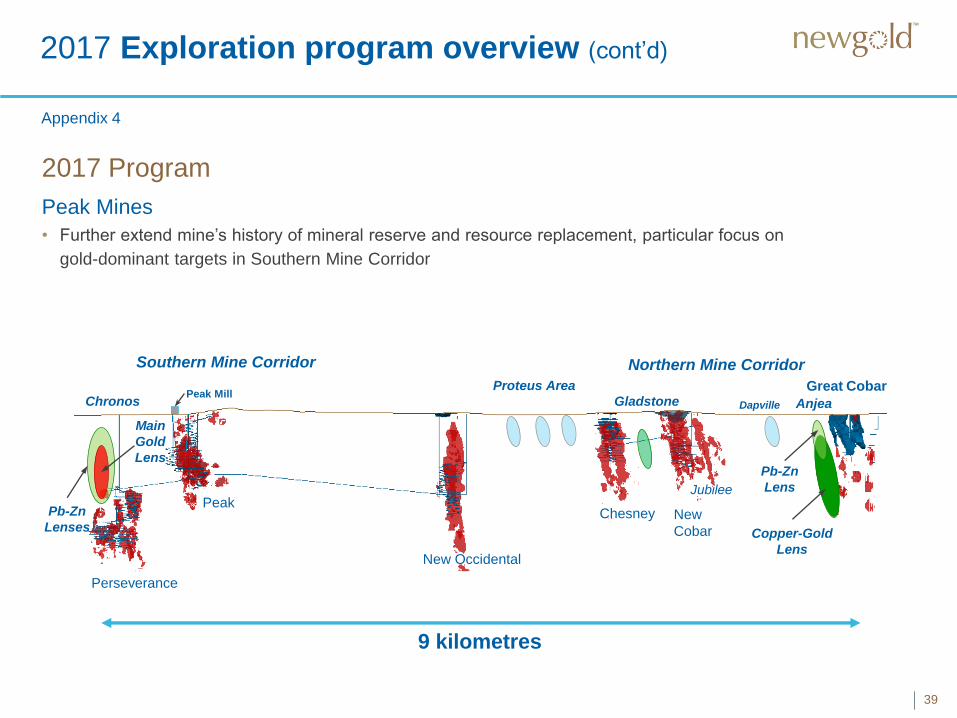
2017 Exploration program overview (cont’d)
39
2017 Program
Peak Mines
• Further extend mine’s history of mineral reserve and resource replacement, particular focus on
gold-dominant targets in Southern Mine Corridor
Perseverance
New Occidental
New
Cobar
Chesney
JubileePeak
Great Cobar
DapvilleGladstoneChronosPeak Mill
9 kilometres
Anjea
Southern Mine Corridor Northern Mine Corridor
Pb-Zn
Lenses
Main
Gold
LensPb-Zn
Lens
Copper-Gold
Lens
Proteus Area
Appendix 4
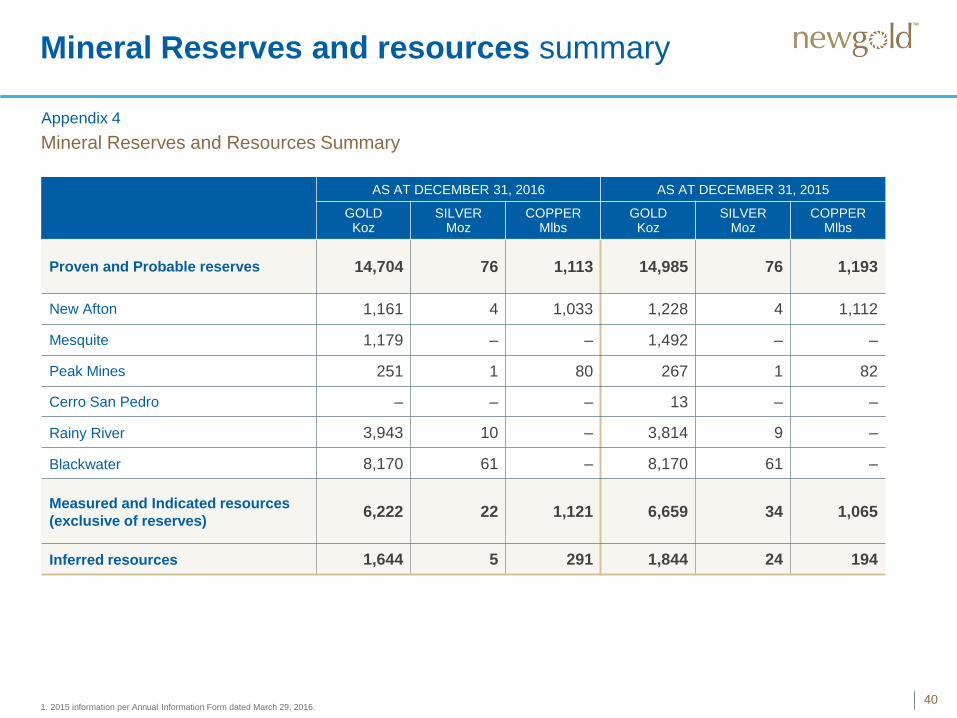
Mineral Reserves and resources summary
401. 2015 information per Annual Information Form dated March 29, 2016.
AS AT DECEMBER 31, 2016 AS AT DECEMBER 31, 2015
GOLD Koz
SILVER Moz
COPPER Mlbs
GOLD Koz
SILVER Moz
COPPER Mlbs
Proven and Probable reserves 14,704 76 1,113 14,985 76 1,193
New Afton 1,161 4 1,033 1,228 4 1,112
Mesquite 1,179 – – 1,492 – –
Peak Mines 251 1 80 267 1 82
Cerro San Pedro – – – 13 – –
Rainy River 3,943 10 – 3,814 9 –
Blackwater 8,170 61 – 8,170 61 –
Measured and Indicated resources
(exclusive of reserves)6,222 22 1,121 6,659 34 1,065
Inferred resources 1,644 5 291 1,844 24 194
Mineral Reserves and Resources Summary
Appendix 4
41
METAL GRADE CONTAINED METAL
TONNES
000s
GOLD
g/t
SILVER
g/t
COPPER
%
GOLD
Koz
SILVER
Koz
COPPER
Mlbs
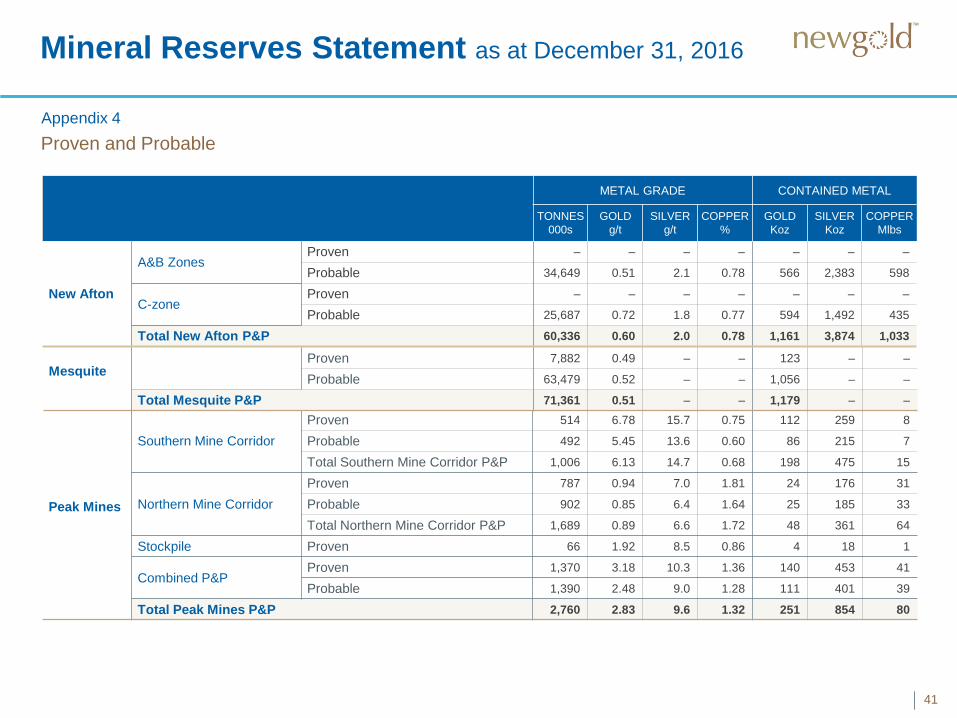
New Afton
A&B ZonesProven – – – – – – –
Probable 34,649 0.51 2.1 0.78 566 2,383 598
C-zoneProven – – – – – – –
Probable 25,687 0.72 1.8 0.77 594 1,492 435
Total New Afton P&P 60,336 0.60 2.0 0.78 1,161 3,874 1,033
Peak Mines
Southern Mine Corridor
Proven 514 6.78 15.7 0.75 112 259 8
Probable 492 5.45 13.6 0.60 86 215 7
Total Southern Mine Corridor P&P 1,006 6.13 14.7 0.68 198 475 15
Northern Mine Corridor
Proven 787 0.94 7.0 1.81 24 176 31
Probable 902 0.85 6.4 1.64 25 185 33
Total Northern Mine Corridor P&P 1,689 0.89 6.6 1.72 48 361 64
Stockpile Proven 66 1.92 8.5 0.86 4 18 1
Combined P&PProven 1,370 3.18 10.3 1.36 140 453 41
Probable 1,390 2.48 9.0 1.28 111 401 39
Total Peak Mines P&P 2,760 2.83 9.6 1.32 251 854 80
MesquiteProven 7,882 0.49 – – 123 – –
Probable 63,479 0.52 – – 1,056 – –
Total Mesquite P&P 71,361 0.51 – – 1,179 – –
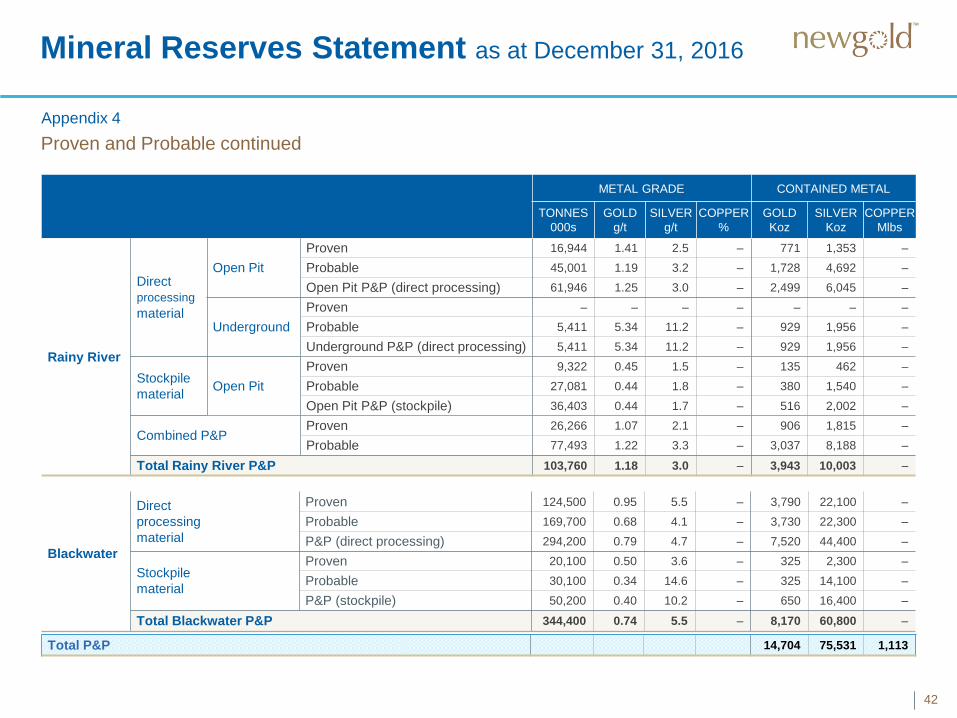
Mineral Reserves Statement as at December 31, 2016
Proven and Probable
Appendix 4
42
METAL GRADE CONTAINED METAL
TONNES
000s
GOLD
g/t
SILVER
g/t
COPPER
%
GOLD
Koz
SILVER
Koz
COPPER
Mlbs
Rainy River
Direct
processing
material
Open Pit
Proven 16,944 1.41 2.5 – 771 1,353 –
Probable 45,001 1.19 3.2 – 1,728 4,692 –
Open Pit P&P (direct processing) 61,946 1.25 3.0 – 2,499 6,045 –
Underground
Proven – – – – – – –
Probable 5,411 5.34 11.2 – 929 1,956 –
Underground P&P (direct processing) 5,411 5.34 11.2 – 929 1,956 –
Stockpile
materialOpen Pit
Proven 9,322 0.45 1.5 – 135 462 –
Probable 27,081 0.44 1.8 – 380 1,540 –
Open Pit P&P (stockpile) 36,403 0.44 1.7 – 516 2,002 –
Combined P&PProven 26,266 1.07 2.1 – 906 1,815 –
Probable 77,493 1.22 3.3 – 3,037 8,188 –
Total Rainy River P&P 103,760 1.18 3.0 – 3,943 10,003 –
Blackwater
Direct
processing
material
Proven 124,500 0.95 5.5 – 3,790 22,100 –
Probable 169,700 0.68 4.1 – 3,730 22,300 –
P&P (direct processing) 294,200 0.79 4.7 – 7,520 44,400 –
Stockpile
material
Proven 20,100 0.50 3.6 – 325 2,300 –
Probable 30,100 0.34 14.6 – 325 14,100 –
P&P (stockpile) 50,200 0.40 10.2 – 650 16,400 –
Total Blackwater P&P 344,400 0.74 5.5 – 8,170 60,800 –
Total P&P 14,704 75,531 1,113
Mineral Reserves Statement as at December 31, 2016
Proven and Probable continued
Appendix 4
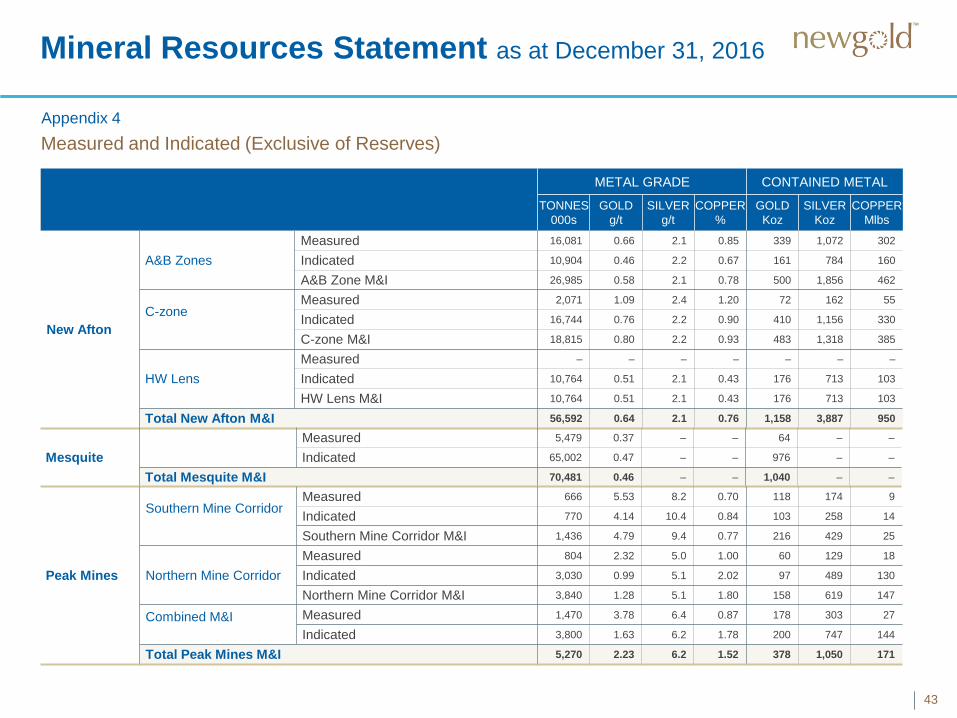
Mineral Resources Statement as at December 31, 2016
43
METAL GRADE CONTAINED METAL
TONNES
000s
GOLD
g/t
SILVER
g/t
COPPER
%
GOLD
Koz
SILVER
Koz
COPPER
Mlbs
New Afton
A&B Zones
Measured 16,081 0.66 2.1 0.85 339 1,072 302
Indicated 10,904 0.46 2.2 0.67 161 784 160
A&B Zone M&I 26,985 0.58 2.1 0.78 500 1,856 462
C-zoneMeasured 2,071 1.09 2.4 1.20 72 162 55
Indicated 16,744 0.76 2.2 0.90 410 1,156 330
C-zone M&I 18,815 0.80 2.2 0.93 483 1,318 385
HW Lens
Measured – – – – – – –
Indicated 10,764 0.51 2.1 0.43 176 713 103
HW Lens M&I 10,764 0.51 2.1 0.43 176 713 103
Total New Afton M&I 56,592 0.64 2.1 0.76 1,158 3,887 950
Mesquite
Measured 5,479 0.37 – – 64 – –
Indicated 65,002 0.47 – – 976 – –
Total Mesquite M&I 70,481 0.46 – – 1,040 – –
Peak Mines
Southern Mine CorridorMeasured 666 5.53 8.2 0.70 118 174 9
Indicated 770 4.14 10.4 0.84 103 258 14
Southern Mine Corridor M&I 1,436 4.79 9.4 0.77 216 429 25
Northern Mine Corridor
Measured 804 2.32 5.0 1.00 60 129 18
Indicated 3,030 0.99 5.1 2.02 97 489 130
Northern Mine Corridor M&I 3,840 1.28 5.1 1.80 158 619 147
Combined M&I Measured 1,470 3.78 6.4 0.87 178 303 27
Indicated 3,800 1.63 6.2 1.78 200 747 144
Total Peak Mines M&I 5,270 2.23 6.2 1.52 378 1,050 171
Measured and Indicated (Exclusive of Reserves)
Appendix 4
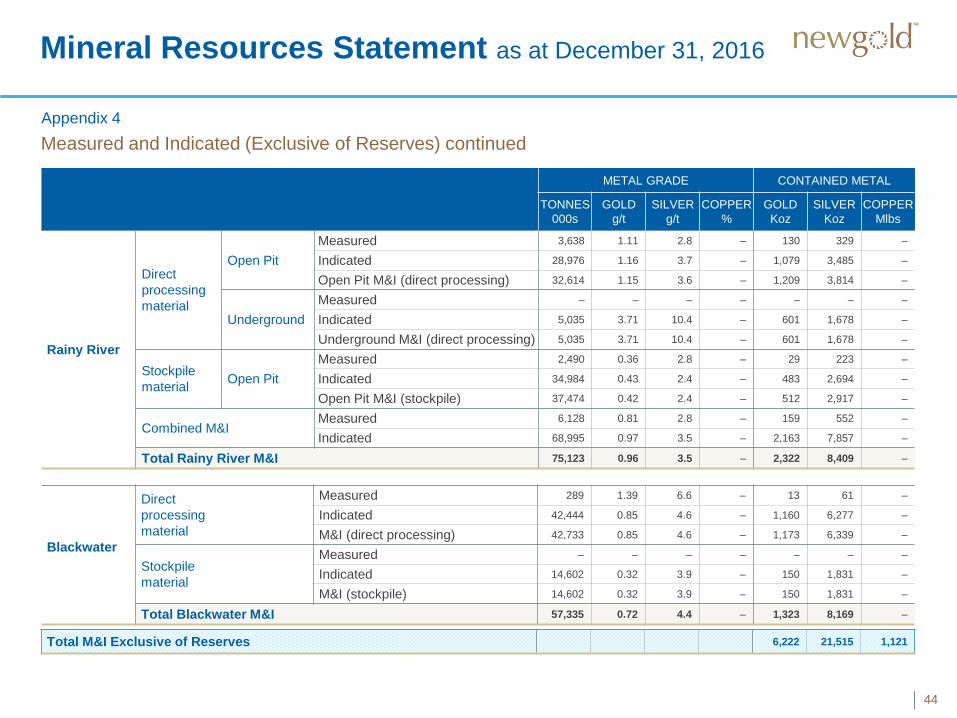
Mineral Resources Statement as at December 31, 2016
44
METAL GRADE CONTAINED METAL
TONNES
000s
GOLD
g/t
SILVER
g/t
COPPER
%
GOLD
Koz
SILVER
Koz
COPPER
Mlbs
Rainy River
Direct
processing
material
Open Pit
Measured 3,638 1.11 2.8 – 130 329 –
Indicated 28,976 1.16 3.7 – 1,079 3,485 –
Open Pit M&I (direct processing) 32,614 1.15 3.6 – 1,209 3,814 –
Underground
Measured – – – – – – –
Indicated 5,035 3.71 10.4 – 601 1,678 –
Underground M&I (direct processing) 5,035 3.71 10.4 – 601 1,678 –
Stockpile
materialOpen Pit
Measured 2,490 0.36 2.8 – 29 223 –
Indicated 34,984 0.43 2.4 – 483 2,694 –
Open Pit M&I (stockpile) 37,474 0.42 2.4 – 512 2,917 –
Combined M&IMeasured 6,128 0.81 2.8 – 159 552 –
Indicated 68,995 0.97 3.5 – 2,163 7,857 –
Total Rainy River M&I 75,123 0.96 3.5 – 2,322 8,409 –
Blackwater
Direct
processing
material
Measured 289 1.39 6.6 – 13 61 –
Indicated 42,444 0.85 4.6 – 1,160 6,277 –
M&I (direct processing) 42,733 0.85 4.6 – 1,173 6,339 –
Stockpile
material
Measured – – – – – – –
Indicated 14,602 0.32 3.9 – 150 1,831 –
M&I (stockpile) 14,602 0.32 3.9 – 150 1,831 –
Total Blackwater M&I 57,335 0.72 4.4 – 1,323 8,169 –
Total M&I Exclusive of Reserves 6,222 21,515 1,121
Measured and Indicated (Exclusive of Reserves) continued
Appendix 4
Mineral Resources Statement as at December 31, 2016
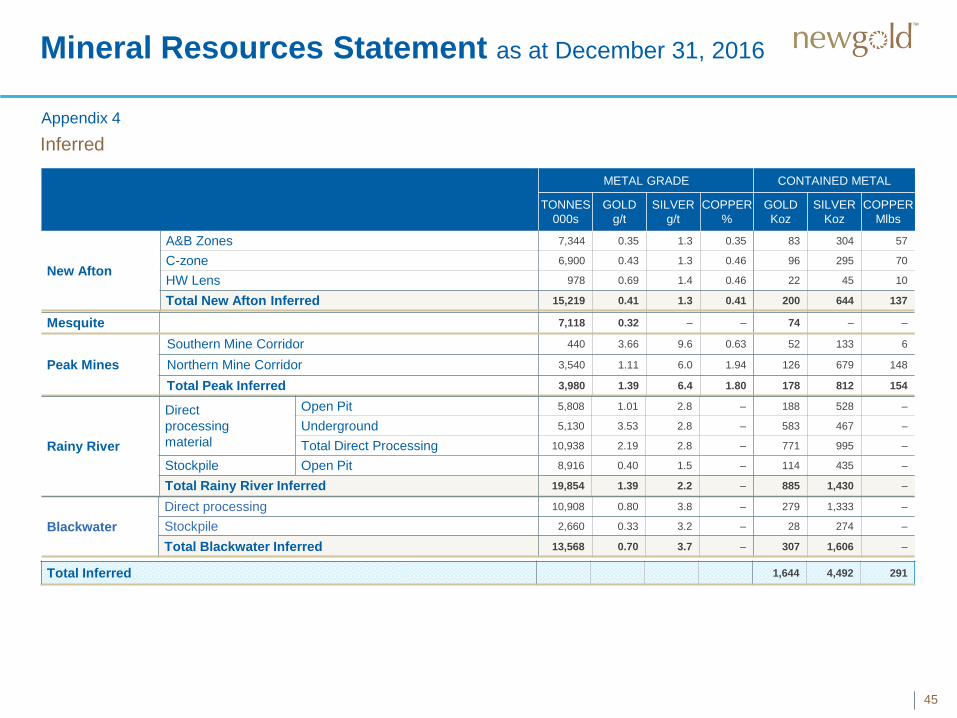
45
METAL GRADE CONTAINED METAL
TONNES
000s
GOLD
g/t
SILVER
g/t
COPPER
%
GOLD
Koz
SILVER
Koz
COPPER
Mlbs
New Afton
A&B Zones 7,344 0.35 1.3 0.35 83 304 57
C-zone 6,900 0.43 1.3 0.46 96 295 70
HW Lens 978 0.69 1.4 0.46 22 45 10
Total New Afton Inferred 15,219 0.41 1.3 0.41 200 644 137
Peak Mines
Southern Mine Corridor 440 3.66 9.6 0.63 52 133 6
Northern Mine Corridor 3,540 1.11 6.0 1.94 126 679 148
Total Peak Inferred 3,980 1.39 6.4 1.80 178 812 154
Mesquite 7,118 0.32 – – 74 – –
Rainy River
Direct
processing
material
Open Pit 5,808 1.01 2.8 – 188 528 –
Underground 5,130 3.53 2.8 – 583 467 –
Total Direct Processing 10,938 2.19 2.8 – 771 995 –
Stockpile Open Pit 8,916 0.40 1.5 – 114 435 –
Total Rainy River Inferred 19,854 1.39 2.2 – 885 1,430 –
Blackwater
Direct processing 10,908 0.80 3.8 – 279 1,333 –
Stockpile 2,660 0.33 3.2 – 28 274 –
Total Blackwater Inferred 13,568 0.70 3.7 – 307 1,606 –
Inferred
Total Inferred 1,644 4,492 291
Appendix 4
Mineral Resources Statement as at December 31, 2016
46
Inferred
METAL GRADE CONTAINED METAL
TONNES
000s
GOLD
g/t
SILVER
g/t
COPPER
%LEAD
%
ZINC
%
GOLD
Koz
SILVER
Koz
COPPER
MlbsLEAD
Mlbs
ZINC
Mlbs
Peak Mines
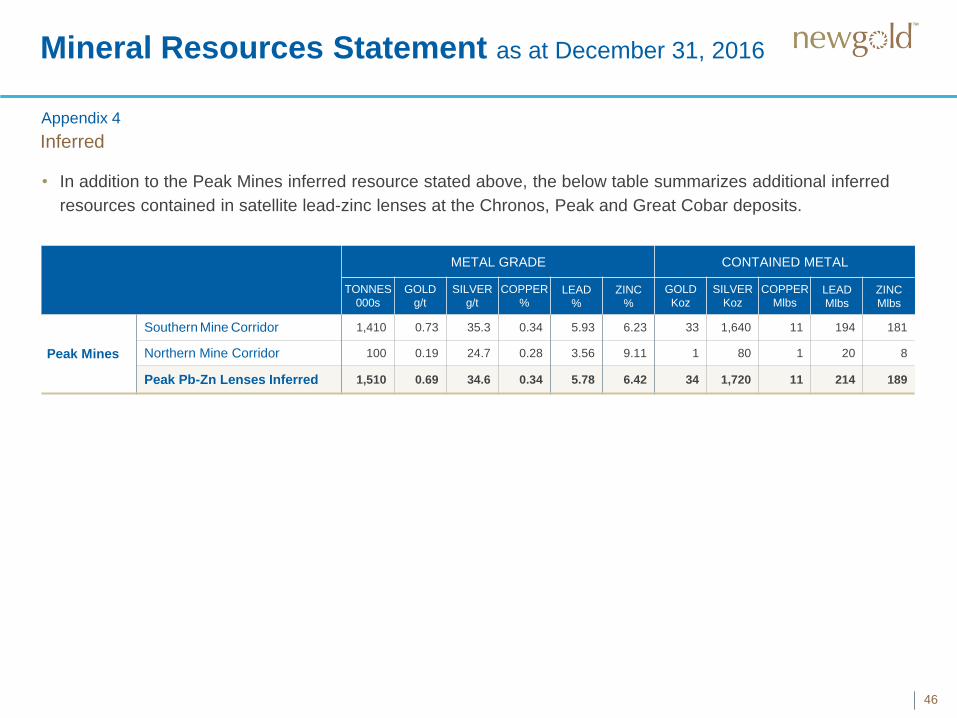
Southern Mine Corridor 1,410 0.73 35.3 0.34 5.93 6.23 33 1,640 11 194 181
Northern Mine Corridor 100 0.19 24.7 0.28 3.56 9.11 1 80 1 20 8
Peak Pb-Zn Lenses Inferred 1,510 0.69 34.6 0.34 5.78 6.42 34 1,720 11 214 189
• In addition to the Peak Mines inferred resource stated above, the below table summarizes additional inferred
resources contained in satellite lead-zinc lenses at the Chronos, Peak and Great Cobar deposits.
Appendix 4
Reserves and resources notes
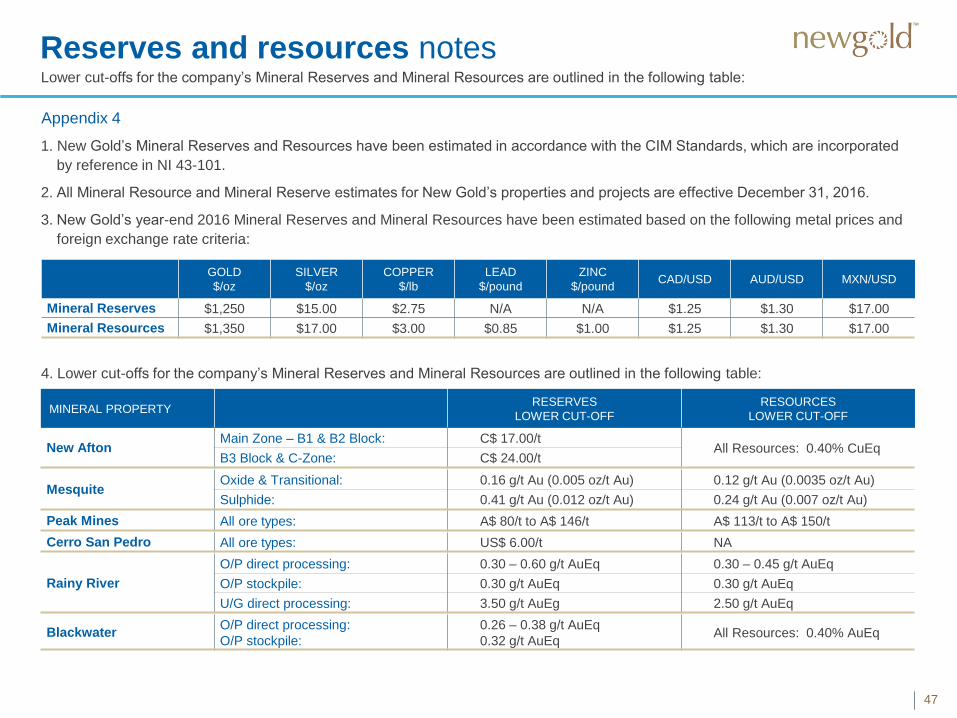
47
MINERAL PROPERTYRESERVES
LOWER CUT-OFF
RESOURCES
LOWER CUT-OFF
New AftonMain Zone – B1 & B2 Block: C$ 17.00/t
All Resources: 0.40% CuEqB3 Block & C-Zone: C$ 24.00/t
GOLD
$/oz
SILVER
$/oz
COPPER
$/lb
LEAD
$/pound
ZINC
$/poundCAD/USD AUD/USD MXN/USD
Mineral Reserves $1,250 $15.00 $2.75 N/A N/A $1.25 $1.30 $17.00
Mineral Resources $1,350 $17.00 $3.00 $0.85 $1.00 $1.25 $1.30 $17.00
1. New Gold’s Mineral Reserves and Resources have been estimated in accordance with the CIM Standards, which are incorporated
by reference in NI 43-101.
2. All Mineral Resource and Mineral Reserve estimates for New Gold’s properties and projects are effective December 31, 2016.
3. New Gold’s year-end 2016 Mineral Reserves and Mineral Resources have been estimated based on the following metal prices and
foreign exchange rate criteria:
Lower cut-offs for the company’s Mineral Reserves and Mineral Resources are outlined in the following table:
BlackwaterO/P direct processing:
O/P stockpile:
0.26 – 0.38 g/t AuEq
0.32 g/t AuEqAll Resources: 0.40% AuEq
MesquiteOxide & Transitional: 0.16 g/t Au (0.005 oz/t Au) 0.12 g/t Au (0.0035 oz/t Au)
Sulphide: 0.41 g/t Au (0.012 oz/t Au) 0.24 g/t Au (0.007 oz/t Au)
Peak Mines All ore types: A$ 80/t to A$ 146/t A$ 113/t to A$ 150/t
Cerro San Pedro All ore types: US$ 6.00/t NA
Rainy River
O/P direct processing: 0.30 – 0.60 g/t AuEq 0.30 – 0.45 g/t AuEq
O/P stockpile: 0.30 g/t AuEq 0.30 g/t AuEq
U/G direct processing: 3.50 g/t AuEg 2.50 g/t AuEq
4. Lower cut-offs for the company’s Mineral Reserves and Mineral Resources are outlined in the following table:
Appendix 4
Reserves and resources notes (cont’d)
48
5. New Gold reports its Measured and Indicated Mineral Resources exclusive of Mineral Reserves. Measured and Indicated Mineral
Resources that are not Mineral Reserves do not have demonstrated economic viability. Inferred Mineral Resources have a greater
amount of uncertainty as to their existence, economic and legal feasibility, do not have demonstrated economic viability, and are
likewise exclusive of Mineral Reserves. Numbers may not add due to rounding.
6. Mineral Resources are classified as Measured, Indicated and Inferred based on relative levels of confidence in their estimation and on
technical and economic parameters consistent with the methods most suitable to their potential commercial exploitation. Where
different mining and/or processing methods might be applied to different portions of a Mineral Resource, the designators ‘open pit’
and ‘underground’ are used to indicate the envisioned mining method. The designators ‘oxide’, ‘non-oxide’ and ‘sulphide’ have
likewise been applied to indicate the type of mineralization as it relates to the appropriate mineral processing method and expected
payable metal recoveries, and the designators ‘direct processing’ and ‘stockpile’ have been applied to differentiate material
envisioned to be mined and processed directly from material to be mined and stored in a stockpile for future processing. Mineral
Reserves and Mineral Resources may be materially affected by environmental, permitting, legal, title, taxation, sociopolitical,
marketing and other risks and relevant issues. Additional details regarding Mineral Reserve and Mineral Resource estimation,
classification, reporting parameters, key assumptions and associated risks for each of New Gold’s material properties are provided in
the respective NI 43-101 Technical Reports, which are available at www.sedar.com.
7. Rainy River Project: In addition to the criteria described above, Mineral Reserves and Mineral Resources for the Rainy River project
are reported according to the following additional criteria: Underground Mineral Reserves are reported peripheral to and/or below the
open pit Mineral Reserve pit shell, which has been designed and optimized based on an $800/oz gold price. Underground Mineral
Resources are reported below a larger Mineral Resource pit shell, which has been defined based on a $1,350/oz gold price.
Approximately forty percent (40%) of the gold metal content defined as underground Mineral Reserves is derived from material
located between the Mineral Reserve pit shell and the Mineral Resource pit shell; the remaining sixty percent (60%) of the metal
content defined as underground Mineral Reserves is derived from material located below the Mineral Resource pit shell. Open pit
Mineral Resources exclude material reported as underground Mineral Reserves.
8. Qualified Person: The preparation of New Gold's Mineral Reserve and Mineral Resource estimates has been done by Qualified
Persons as defined under NI 43-101, under the oversight and review of Mr. Mark A. Petersen, a Qualified Person under NI 43-101.
Appendix 4
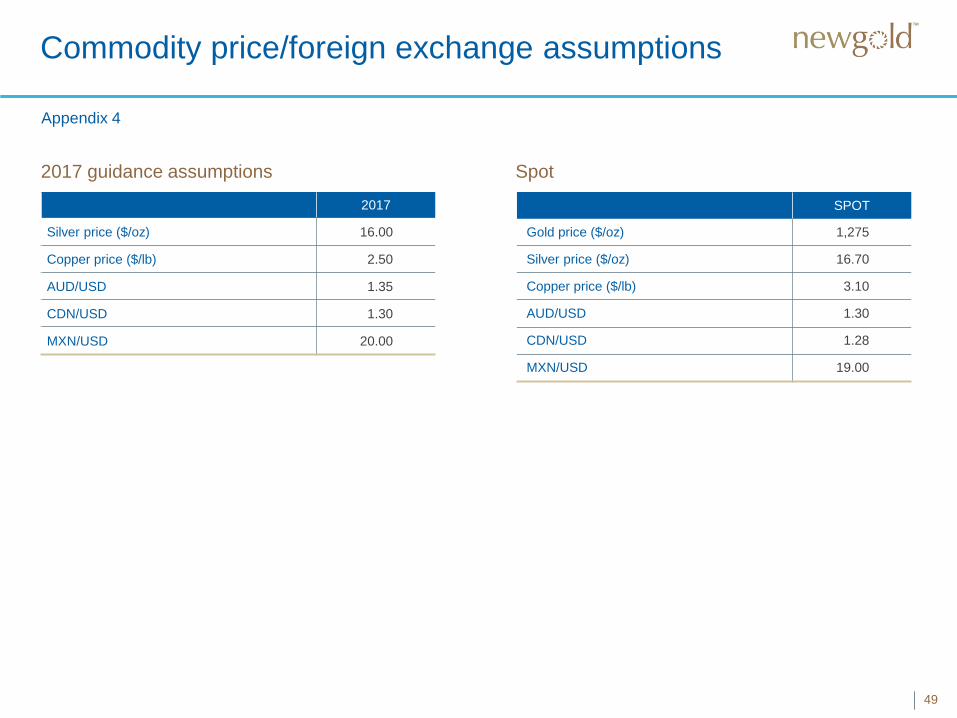
2017 guidance assumptions
Commodity price/foreign exchange assumptions
49
Spot
SPOT
Gold price ($/oz) 1,275
Silver price ($/oz) 16.70
Copper price ($/lb) 3.10
AUD/USD 1.30
CDN/USD 1.28
MXN/USD 19.00
2017
Silver price ($/oz) 16.00
Copper price ($/lb) 2.50
AUD/USD 1.35
CDN/USD 1.30
MXN/USD 20.00
Appendix 4
Endnotes
50
CAUTIONARY NOTE TO U.S. READERS CONCERNING ESTIMATES OF MINERAL RESERVES AND MINERAL RESOURCES
Information concerning the properties and operations of New Gold has been prepared in accordance with Canadian standards under applicable Canadian securities laws, and may not be
comparable to similar information for United States companies. The terms “Mineral Resource”, “Measured Mineral Resource”, “Indicated Mineral Resource” and “Inferred Mineral Resource”
used in this presentation are Canadian mining terms as defined in the Canadian Institute of Mining, Metallurgy and Petroleum (“CIM”) Definition Standards for Mineral Resources and
Mineral Reserves adopted by CIM Council on May 10, 2014 and incorporated by reference in National Instrument 43-101. While the terms “Mineral Resource”, “Measured Mineral
Resource”, “Indicated Mineral Resource” and “Inferred Mineral Resource” are recognized and required by Canadian securities regulations, they are not defined terms under standards of the
United States Securities and Exchange Commission. As such, certain information contained in this presentation concerning descriptions of mineralization and mineral resources under
Canadian standards is not comparable to similar information made public by United States companies subject to the reporting and disclosure requirements of the United States Securities
and Exchange Commission.
An “Inferred Mineral Resource” has a great amount of uncertainty as to its existence and as to its economic and legal feasibility. Under Canadian rules, estimates of inferred mineral
resources may not form the basis of feasibility or pre-feasibility studies. It cannot be assumed that all or any part of an “Inferred Mineral Resource” will ever be upgraded to a higher
confidence category. Readers are cautioned not to assume that all or any part of an “Inferred Mineral Resource” exists or is economically or legally mineable.
Under United States standards, mineralization may not be classified as a “Reserve” unless the determination has been made that the mineralization could be economically and legally
produced or extracted at the time the reserve estimation is made. Readers are cautioned not to assume that all or any part of the measured or indicated mineral resources will ever be
converted into mineral reserves. In addition, the definitions of “Proven Mineral Reserves” and “Probable Mineral Reserves” under CIM standards differ in certain respects from the standards
of the United States Securities and Exchange Commission.
TECHNICAL INFORMATION
The scientific and technical information relating to the construction of and expected operations at New Gold’s Rainy River project contained herein has been reviewed and approved by
Binsar Sirait, Director, Mine Engineering of New Gold. All other scientific and technical information contained herein has been reviewed and approved by Mark A. Petersen, Vice President,
Exploration of New Gold, except for the scientific and technical information relating to the construction of and expected operations at New Gold’s Rainy River project, which has been
reviewed and approved by Binsar Sirait, Director, Mine Engineering of New Gold. Mr. Sirait is an engineer and a SME Registered Member. Mr. Petersen is a SME Registered Member,
AIPG Certified Professional Geologist. Mr. Petersen and Mr. Sirait are "Qualified Persons" for the purposes of NI 43-101.
For additional technical information on New Gold’s material properties, including a detailed breakdown of Mineral Reserves and Mineral Resources by category, as well as key assumptions,
parameters and risks, refer to New Gold’s Annual Information Form for the year ended December 31, 2015 filed on www.sedar.com.
NON-GAAP MEASURES
(1) ALL-IN SUSTAINING COSTS
“All-in sustaining costs” per ounce is a non-GAAP financial measure. Consistent with guidance announced in 2013 by the World Gold Council, an association of various gold mining
companies from around the world of which New Gold is a member, New Gold defines “all-in sustaining costs” per ounce as the sum of total cash costs, capital expenditures that are
sustaining in nature, corporate general and administrative costs, capitalized and expensed exploration that is sustaining in nature and environmental reclamation costs, all divided by the
ounces of gold sold to arrive at a per ounce figure. New Gold believes this non-GAAP financial measure provides further transparency into costs associated with producing gold and assists
analysts, investors and other stakeholders of the company in assessing the company’s operating performance, its ability to generate free cash flow from current operations and its overall
value. This data is furnished to provide additional information and is a non-GAAP financial measure. All-in sustaining costs presented do not have a standardized meaning under IFRS and
may not be comparable to similar measures presented by other mining companies. It should not be considered in isolation or as a substitute for measures of performance prepared in
accordance with IFRS and is not necessarily indicative of cash flow from operations under IFRS or operating costs presented under IFRS. Further details regarding historical all-in
sustaining costs and a reconciliation to the nearest IFRS measures are provided in the MD&A accompanying New Gold’s financial statements filed from time to time on www.sedar.com.
“Sustaining costs” is a non-GAAP financial measure. New Gold defines sustaining costs as the difference between all-in sustaining costs and total cash costs, being the sum of net capital
expenditures that are sustaining in nature, corporate general and administrative costs, capitalized and expensed exploration that is sustaining in nature, and environmental reclamation
costs. Management uses sustaining costs to understand the aggregate net result of the drivers of all-in sustaining costs other than total cash costs. The line items between cash costs and
all in sustaining costs in the tables below break down the components of sustaining costs. Sustaining costs is intended to provide additional information only and does not have any
standardized meaning under IFRS and may not be comparable to similar measures presented by other mining companies. It should not be considered in isolation or as a substitute for
measures of performance prepared in accordance with IFRS.
Endnotes
51
(2) TOTAL CASH COSTS
“Total cash costs” per ounce is a non-GAAP financial measure which is calculated in accordance with a standard developed by The Gold Institute, a worldwide association of suppliers
of gold and gold products that ceased operations in 2002. Adoption of the standard is voluntary and the cost measures presented may not be comparable to other similarly titled
measures of other companies. New Gold reports total cash costs on a sales basis. The company believes that certain investors use this information to evaluate the company’s
performance and ability to generate liquidity through operating cash flow to fund future capital expenditures and working capital needs. This measure, along with sales, is considered
to be a key indicator of the company’s ability to generate operating earnings and cash flow from its mining operations. Total cash costs include mine site operating costs such as
mining, processing and administration costs, royalties, production taxes, and realized gains and losses on fuel contracts, but are exclusive of amortization, reclamation, capital and
exploration costs and net of by-product sales. Total cash costs are then divided by ounces of gold sold to arrive at a per ounce figure. Co-product cash costs remove the impact of
other metal sales that are produced as a by-product of gold production and apportion the cash costs to each metal produced on a percentage of revenue basis, and subsequently
divides the amount by the total ounces of gold or silver or pounds of copper sold, as the case may be, to arrive at per ounce or per pound figures. Unless otherwise indicated, all total
cash cost information in this presentation is net of by-product sales. This data is furnished to provide additional information and is a non-GAAP financial measure. Total cash costs and
co-product cash costs presented do not have a standardized meaning under IFRS and may not be comparable to similar measures presented by other mining companies. It should
not be considered in isolation or as a substitute for measures of performance prepared in accordance with IFRS and is not necessarily indicative of cash flow from operations under
IFRS or operating costs presented under GAAP. Further details regarding historical total cash costs and a reconciliation to the nearest IFRS measures are provided in the MD&A
accompanying New Gold’s financial statements filed from time to time on www.sedar.com.
(3) AVERAGE REALIZED PRICE
“Average realized price per ounce or pound sold” is a non-GAAP financial measure with no standard meaning under IFRS. Management uses this measure to better understand the
price realized in each reporting period for gold, silver, and copper sales. Average realized price is intended to provide additional information only and does not have any standardized
definition under IFRS; it should not be considered in isolation or as a substitute for measures of performance prepared in accordance with IFRS. Other companies may calculate this
measure differently and this measure is unlikely to be comparable to similar measures presented by other companies. Further details regarding average realized price and a
reconciliation to the nearest IFRS measure is provided in the MD&A accompanying New Gold’s financial statements filed from time to time on www.sedar.com.
(4) CASH GENERATED FROM OPERATIONS BEFORE CHANGES IN WORKING CAPITAL
“Cash generated from operations before changes in working capital” is a non-GAAP financial measures with no standard meaning under IFRS, excludes changes in non-cash
operating working capital. Management uses this measure to evaluate the Company’s ability to generate cash from its operations before temporary working capital changes. Further
details regarding cash generated from operations before changes in working capital and a reconciliation to the nearest IFRS measure is provided in the MD&A accompanying New
Gold’s financial statements filed from time to time on www.sedar.com.
(5) ADJUSTED NET (LOSS)/EARNINGS
“Adjusted net (loss)/earnings” and “adjusted net (loss)/earnings per share” are non-GAAP financial measures. Net (loss)/earnings have been adjusted and tax affected for the group of
costs in “Other gains and losses” on the condensed consolidated income statement. The adjusted entries are also impacted for tax to the extent that the underlying entries are
impacted for tax in the unadjusted net (loss)/earnings from continuing operations. The company uses this measure for its own internal purposes. Management’s internal budgets and
forecasts and public guidance do not reflect fair value changes on senior notes and non-hedged derivatives, foreign currency translation and fair value through profit or loss and
financial asset gains/losses.
Consequently, the presentation of adjusted net earnings and adjusted net earnings per share enables investors and analysts to better understand the underlying operating
performance of our core mining business through the eyes of management. Management periodically evaluates the components of adjusted net earnings and adjusted net earnings
per share based on an internal assessment of performance measures that are useful for evaluating the operating performance of our business and a review of the non-GAAP
measures used by mining industry analysts and other mining companies. Adjusted net (loss)/earnings and adjusted net (loss)/earnings per share are intended to provide additional
information only and do not have any standardized meaning under IFRS and may not be comparable to similar measures presented by other companies. They should not be
considered in isolation or as a substitute for measures of performance prepared in accordance with IFRS. The measures are not necessarily indicative of operating profit or cash flows
from operations as determined under IFRS.
(6) OPERATING MARGIN
“Operating margin” is a non-GAAP financial measure with no standard meaning under IFRS, which management uses to evaluate the Company’s aggregated and mine-by-mine
contribution to net earnings before non-cash depreciation and depletion charges.
JULIE TAYLOR
Director, Corporate Communications and Investor Relations
Investor Relations