NEW ENGLAND WHOLESALE POWER MARKET CHANGES …
53
NEW ENGLAND WHOLESALE POWER MARKET CHANGES 1999 – PRESENT Prepared for: CPV Towantic, LLC October 2014 WWW.CEADVISORS.COM
Transcript of NEW ENGLAND WHOLESALE POWER MARKET CHANGES …

NEW ENGLAND WHOLESALE POWER MARKET CHANGES 1999 – PRESENT Prepared for:
CPV Towantic, LLC
October 2014
WWW.CEADVISORS.COM

CPV Towantic Energy Center
TABLE OF CONTENTS Section 1: Introduction 1
Section 2: Executive Summary 2
Section 3: Wholesale Market Fundamentals 4
Section 4: Implementation of Wholesale Markets 18
Section 5: Implementation of State Programs 28
Section 6: Economic Analysis 38
Glossary 50
TABLE OF FIGURES Figure 1: Percent of Total System Capacity by Fuel Type (2000 vs. 2013) 5
Figure 2: Percent of Electric Energy Production by Fuel type (2000 vs. 2013) 6
Figure 3: Average Day-Ahead ISO-NE Hub Prices (2003 vs. 2012) 6
Figure 4: Significant Generation Facility Retirements 7
Figure 5: Bethel-Norwalk Transmission Reinforcements 10
Figure 6: Middleton-Norwalk Transmission Reinforcements 11
Figure 7: New England East-West Solution 12
Figure 8: New England Gas Infrastructure 14
Figure 9: Capacities of Existing Pipelines into New England 15
Figure 10: Capacity Secured Through the Forward Capacity Auctions 19
Figure 11: Forward Capacity Auction Results 21
Figure 12: ISO-NE Vertical Demand Curve and Price Impact 23
Figure 13: Sloped Demand Curve 24
Figure 14: Summary Description of Connecticut’s RPS Requirements 29
Figure 15: New England RPS Class I Compliance by Generator Type 2003-2012 30
Figure 16: Projection of Incremental Renewable Energy Needed 2015-2025 30
Figure 17: Growth of Energy Efficiency in New England’s Forward Capacity Market 32
Figure 18: Capacity Resources in New England At-Risk of Retirement 34
Figure 19: Projected Load Growth (GWH) 41
Figure 20: Projected Peak Demand Growth (MW) 41
Figure 21: Forecasted Fuel Prices 42
Figure 22: Forecasted Emission Prices 43
Concentric Energy Advisors, Inc. | i

CPV Towantic Energy Center
Figure 23: Towantic Operations 44
Figure 24: Impact of Additional Generating Capacity on the New England Supply Stack 45
Figure 25: Reduction in Wholesale Costs of Energy to Consumers 45
Figure 26: Reduction in Regional Air Emissions 46
Figure 27: ISO-NE Projected Reserve Margin 47
Figure 28: Comparison of Study Assumptions 48
Concentric Energy Advisors, Inc. | ii

CPV Towantic Energy Center
SECTION 1: INTRODUCTION
he CPV Towantic Energy Center (“Towantic” or “Facility”) is a proposed dual-fuel natural gas (with ultra-low sulfur distillate (“ULSD”) back-up) combined cycle electric generating facility owned by CPV Towantic, LLC (“CPV”) to be located in Oxford, Connecticut. Towantic
received its original Certificate of Environmental Compatibility and Public Need (“Certificate”) from the Connecticut Siting Council (“Council”) on June 23, 1999 in Docket No. 192 based on a nameplate capacity of 512 MW using a GE Frame 7FA.03 combustion turbine. CPV is submitting a Petition (“Petition”) to the Council to modify the Decision issuing the Certificate in Docket No. 192 due to changed conditions to increase the size of the Facility to a net nameplate capacity of 785 MW and to change the technology to a GE Frame 7HA.01 combustion turbine.
In support of the Petition, CPV retained Concentric Energy Advisors, Inc. (“Concentric”) to describe changes in the New England and Connecticut wholesale electric markets since 1999, when Towantic received its original Certificate, and to demonstrate how these changes justify the improved technology and requested size increase at the Facility.
In 1999, the wholesale markets were in their infancy in New England. Ownership of generation resources by vertically integrated utilities with guaranteed cost recovery was in the process of being transferred to competitive entities that were dependent on the competitive wholesale markets to compensate them for the cost of operating their generation facilities and to allow them the opportunity to recover their investment. Over the past decade, these markets have evolved as numerous and complicated issues associated with the formation of competitive markets have required continual changes to market design and market products. The evolution of the wholesale electric markets, with overlaying reliability and public policy needs, justify Towantic’s requested changes to its Council-approved Facility.
Given conditions of supply and demand today, as well as future projections, New England and Connecticut need Towantic more than ever before. Towantic provides a clean, efficient baseload facility that will contribute to regional power needs to meet customer and public policy requirements in a reliable, efficient, economic and clean manner.
T
Concentric Energy Advisors, Inc. | 1

CPV Towantic Energy Center
SECTION 2: EXECUTIVE SUMMARY
PV is requesting Council approval to modify the Certificate based on changed conditions to increase the nameplate capacity of the facility from 512 MW to approximately 785 MW and to change the technology from a GE Frame 7FA.03 turbine to a GE Frame 7HA.01 turbine. In
addition, CPV is requesting an extension of the commercial operation deadline until June 1, 2019 with an expected commercial operation date of June 1, 2018.
The proposed Facility:
• is located at an intersection of Algonquin’s interstate gas pipeline system and Connecticut Light and Power Company-owned 115kV transmission lines; therefore, the required interconnection work and associated need for rights-of-way are minimized;
• will be electrically connected in southwest Connecticut and will provide local reliability benefits that new baseload generation will bring to Connecticut and the ISO New England (“ISO-NE”) system as a whole;
• is designed with a heat rate of 6,402 BTU/kWh at International Organization for Standardization conditions (59 degrees Fahrenheit, no duct firing) and is designed to operate as a baseload or cycling facility with low start costs and low emission rates;
• is expected to be dispatched over 70% of the total hours in the year. Based on its configuration and location, the Facility will be available to provide power to the system around the clock. It is also designed to provide reliable power for the grid's increased load in the morning and evening without damage to the equipment. As the region adds intermittent resources, such as wind and solar, Towantic has operational flexibility and is capable of being dispatched to meet system reliability requirements; and
• has state-of-the-art emission control equipment. The plant is designed to be air-cooled, dramatically reducing water usage and will be dual-fueled to address possible natural gas curtailment issues.
The addition of the Towantic, proposed to begin commercial operation in June of 2018, will provide substantial economic and environmental benefits to Connecticut and the region. The addition of this Facility will displace older, less efficient generation, particularly in times of high demand and power system stress. The analysis in Section 6 shows an annual reduction of approximately $450 million in regional wholesale power costs to consumers and a reduction of 270,454 tons of carbon dioxide (“CO2”), 416 tons of sulfur dioxide (“SO2”), and 466 tons of nitrogen oxides (“NOx”) in 2018.
In addition to demonstrated economic and environmental benefits, the Facility will also provide important reliability benefits. Based on the most recent ISO-NE forecast in the 2014 Draft Regional
C
Concentric Energy Advisors, Inc. | 2

CPV Towantic Energy Center
System Plan, the region is expected to fall short of its reserve margin requirement in 2019.1 The addition of almost 800 MW of installed capacity will help ISO-NE meet its required reserve margin. Additionally, the Facility will enhance reliability by providing reliable and flexible generation to support the addition of increasing amounts of intermittent generation on the bulk power system to ensure system reliability during times of high system demand.
1 The reserve margin is a measure of the ability of the bulk power system to meet its loss of load requirements according to NERC standards.
Concentric Energy Advisors, Inc. | 3

CPV Towantic Energy Center
SECTION 3: WHOLESALE MARKET FUNDAMENTALS
he New England energy landscape has changed dramatically over the last fifteen years, including: (1) significant changes in the make-up of the New England electric generation portfolio; (2) the investment of billions of dollars in the electric transmission system to
improve reliability; and (3) the substantial and expected improvements in gas infrastructure. These changes collectively allow the New England region to accommodate new generation to ensure the ability of the electrical system to reliably and cost-effectively meet customer needs.
REGIONAL GENERATION MIX
At the time the Council issued the Certificate in 1999, the introduction of a competitive wholesale electricity market and increasing customer demand were placing unprecedented stresses on the bulk power system. In the Council’s Review of the Connecticut Electric Utilities’ Twenty-Year Forecasts of Loads and Resources dated September 1999 and September 2000, the Council stated that while the forecast showed improved ability to meet demand over the 20-year planning period, the Council acknowledged the difficulties facing ISO-NE in meeting customer demand during periods of high demand and low generator availability. By 2001, the year that ISO-NE first issued its Regional Transmission Expansion Plan (“RTEP”), the system peak demand for summer 2001 exceeded the all-time system peak by 2,500 MW.2 An analysis conducted by ISO-NE in 2000 in support of the 2001 RTEP showed that while the system was projected to have enough generation to meet customer demand, severe reliability problems were evident in specific load pockets throughout the region.3
Investor-owned utilities in New England have invested in significant transmission infrastructure to address these reliability problems. In addition, market participants and the New England states have responded to the need for electric energy and capacity resources. From November 1997 through April 2014, 14,995 megawatts (MW) of new generating projects have interconnected to the New England power system, and 4,114 MW of primarily older, less efficient resources have retired from the system. In addition, the amount of demand response resources has increased from approximately 100 MW in 1999 to over 3,300 MW in 2014.4 Over this same period, summer peak demand has grown from approximately 23,000 MW to 29,000 MW. Even though electric energy use is expected to grow by only 1.0% per year and expansion in energy efficiency resources are projected to grow at approximately 200 MW per year, ISO-NE is projecting that the region will require new resources to meet system reliability needs by 2019. In ISO-NE’s 2014 Report of
2 2001Regional Transmission Expansion Plan (RTEP01), pg. 6. 3 Ibid., pg. 9. 4 ISO New England’s Energy Efficiency Forecast, The New England Restructuring Roundtable April 13, 2012.
T
Concentric Energy Advisors, Inc. | 4

CPV Towantic Energy Center
Capacity, Energy, Loads and Transmission (“CELT Report”), ISO-NE is projecting to fall below the region’s target reserve margin by 2018. In addition, according to the 2014 ISO-NE Draft Regional System Plan, the region is projected to require 424 MW in 2019/2020 to meet the region’s installed capacity requirement. This is expected to increase to a shortage of 1,155 MW by 2023/2024, accounting for load and energy-efficiency forecasts and only known retirements totaling approximately 3,200 MW. Since the release of this document, the 146 MW Mount Tom generating facility announced that it would cease operation by October of 2014. The probability of resource retirements in the future will likely accelerate the need for new resources. Additionally, generation owners could choose not to invest in environmental measures called for in pending or required regulations, which could force these units to shut down.
In the last fifteen years, New England has seen a dramatic transformation in its generation mix, moving from a mix of oil, coal, nuclear, and natural gas-fired generators to a system with almost half of its installed generation capacity coming from natural gas generation. In 2000, 64% of the generating capacity in the region was comprised of oil, coal, and nuclear generation, with 18% of the region’s capacity represented by natural gas. By 2013, the region’s generation mix had shifted dramatically as a result of economic and environmental factors, with 43% of the system’s capacity provided by natural gas-fired generation and 44% made up by oil, coal and nuclear generation, a decrease of 20%. The shift in the generation mix is shown in Figure 1 below:
Figure 1: Percent of Total System Capacity by Fuel Type (2000 vs. 2013)5
Consistent with the shift in the regional capacity mix, in terms of production, the system has evolved from a heavy reliance on oil, coal and nuclear resources to a significant dependence on natural gas- fired resources as shown in Figure 2.
5 ISO-NE Overview Vermont Senate Natural Resources and Energy Committee, March 24, 2014.
Concentric Energy Advisors, Inc. | 5

CPV Towantic Energy Center
Figure 2: Percent of Electric Energy Production by Fuel type (2000 vs. 2013)6
The rapid transformation of New England’s generating fleet to natural gas plants and renewable energy resources, coupled with a decrease in natural gas prices despite price spikes in the winter, has hastened the retirement of older, economically challenged coal, oil and nuclear units. Since gas-fired generators are the marginal resource in a majority of hours in New England, meaning these resources set the energy clearing price, the cost of natural gas directly impacts the price that generators are paid for the energy they produce. As shown in Figure 3, the price of natural gas has decreased significantly since 2008, and as a result, average day-ahead energy prices in New England decreased by over 50% between 2008 and 2012.
Figure 3: Average Day-Ahead ISO-NE Hub Prices (2003 vs. 2012)7
6 ISO-NE Overview Vermont Senate Natural Resources and Energy Committee, March 24, 2014. 7 ISO-NE Press Release “2012 Wholesale Electricity Prices in New England Fell to Lowest Level Since 2003”, January 23, 2013.
Concentric Energy Advisors, Inc. | 6

CPV Towantic Energy Center
The confluence of low wholesale energy market prices (primarily caused by low natural gas prices), increasing environmental compliance costs, and the removal of the capacity market price floor (as discussed on page 20) have negatively impacted the viability of older fossil-fired and nuclear-generating resources. Many of these generators have announced their retirement since the downturn in energy prices began in 2008. Figure 4 below shows over 3,200 MW of significant generating facilities which have announced their retirement in the past five years. In total, over 4,100 MW of generation, including generation facilities and demand response resources, have retired or provided notification of retirement for the time period from June 1, 2013 through May 31, 2017.8
Figure 4: Significant Generation Facility Retirements
Uncertainty remains over the future direction of energy prices and the capital investments required to ensure that existing generation complies with existing and future environmental regulations. Consequently, the shutdown of older plants in the future will increase the need for new reliable generation to meet customer demand and system reliability requirements. In fact, according to the 2014 CELT Report and the 2014 Draft Regional System Plan, the region will require additional reliable capacity in the 2018/2019 through 2023 time frame based only on the currently announced retirements. This capacity need is expected to increase as more older, inefficient units retire in the future.
The transformation of the generation fleet in New England has set the region on a path toward lower emissions but has also presented significant reliability challenges. Inadequate gas
8 ISO-NE Status of Non-Price Retirement Requests, December 20, 2013.
Concentric Energy Advisors, Inc. | 7

CPV Towantic Energy Center
transportation infrastructure is one of these challenges. While gas pipeline capacity is sufficient in most hours of the year, insufficient natural gas pipeline capacity has restricted the availability of natural gas supply to generators in a relatively small number of winter high demand hours and has resulted in dramatic increases in wholesale electricity prices. This was evident during the winter of 2013/2014 when New England faced severe natural gas pipeline constraints during three “cold snaps” that drove gas and electricity prices to record levels. Prior to the winter of 2013/2014, ISO-NE procured commitments from oil-fired and dual-fuel generators under its 2013/2014 Winter Reliability Program to provide increased levels of fuel inventory. Commitments capable of producing about 1.9 million megawatt hours (“MWh”) of power and demand reductions were procured at a projected cost of about $75 million. The program focused on oil- and dual-fuel generators because they can buy and store the fuel they need in advance and the amount of oil in their tanks can be tracked. During times when the gas pipelines were constrained due to extremely cold conditions, gas prices and energy market clearing prices spiked and the region was heavily dependent on resources capable of burning oil to ensure system reliability. As a result, the cost of serving customer load totaled almost $5.1 billion for December 2013 to February 2014 compared to $5.2 billion in wholesale energy costs for the entire year of 2012.
The region remains challenged for the upcoming winter. ISO-NE recently received approval from the Federal Energy Regulatory Commission (“FERC”) for its 2014/2015 Winter Reliability Program. The 2014-15 Winter Reliability Program is similar to last year’s program, but will include compensation to generators who contract for liquefied natural gas (“LNG”) deliveries during the winter, in addition to generators who purchase fuel oil. This program is expected to cost in excess of $100 million for the winter period. Importantly, the FERC approved this program but ordered ISO-NE to commence stakeholder discussions by January 2015 in order to develop a longer-term market-based solution to winter reliability problems in the region.
The extreme shortages in supply that New England faced in the winter of 2014, and are expected to continue to face in the future, have motivated the region to seek solutions to the gas supply shortage. The New England states, through the New England States Committee on Electricity (“NESCOE”), have agreed to pursue the construction of additional pipeline capacity to increase the amount of firm pipeline capacity into New England by 1,000 MMcf/day above 2013 levels. Whether or not this coordinated effort to get gas pipeline built in the region is successful is highly uncertain. Even if it is successful, it will take several years to be built. In the meantime, greater emphasis will be placed on generating resources with dual fuel capability, like Towantic, to provide critical energy and reliability services to the power grid during times of system stress.
The second reliability challenge comes with the introduction of a more diverse set of renewable resources, stimulated by state-sponsored programs and mandates. While these resources provide clear environmental benefits, the intermittent nature of their output poses operational and planning challenges due to issues with voltage and stability performance and differences between
Concentric Energy Advisors, Inc. | 8

CPV Towantic Energy Center
expected and actual system operation. A study performed by ISO-NE in 2009 showed that in addition to a significant amount of transmission expansion, the need for flexible resources to provide operating reserves, as well as other ancillary services such as regulation and ramping, will increase as a result of the addition of intermittent resources needed to meet state-mandated renewable portfolio standard goals. Flexible and reliable generation, such as Towantic, will be needed to support the increasing role of renewable generation in the region while maintaining system reliability.9
TRANSMISSION INFRASTRUCTURE
In the timeframe of the issuance of the Certificate by the Council in 1999, the introduction of the minimum interconnection standard10 and competitive wholesale electricity markets, as well as growing demand, were increasingly stressing the transmission system. For example, the New England peak demand for summer 2001 exceeded the all-time peak by 2,500 MW.11 Southwest Connecticut (“SWCT”) was facing severe transmission reliability problems due to localized constraints in the subregion. An ISO-NE analysis of the bulk power system at that time indicated severe reliability problems whenever the largest single generation source in the Southwest Connecticut subregion was unavailable.12 The summer peak case with the simultaneous outage of two large generating units in Connecticut (Bridgeport Harbor 3 and Bridgeport Energy Center) showed that the system could not be re-dispatched in a manner that would allow the subregion to meet Northeast Power Coordinating Council (“NPCC”) reliability criteria due to constraints on the 115kV transmission system in Southwest Connecticut.
Although the region as a whole had adequate resources to meet projected customer demand in 1999, the Southwest Connecticut subregion was not able to meet its monthly peak load requirements at that time with the loss of an approximately 500 MW generating unit due to the inability of the transmission system to import sufficient generation into Southwest Connecticut from the rest of Connecticut.13 A 2001 Council 10 year forecast showed that while the state was anticipated to have adequate generation to meet projected demand during the forecast period, the forecast indicated that some subregions in Connecticut, particularly Southwest Connecticut, may begin to experience supply deficiencies and voltage instability problems as soon as 2002 due to insufficient transmission and inadequate resources within the region. By 2005, the Council was forecasting that while the state’s power supply resources would be adequate to meet demand in the
9 New England Wind Integration Study Summary, November 2010. 10 In 1998, the FERC ordered the adoption of a “Minimum Interconnection Standard” in New England that did not
require new generation resources to expand the grid beyond minimum reliability requirements. The minimum interconnection standard did not prevent generators from siting at points on the grid that already suffer from congestion.
11 2001Regional Transmission Expansion Plan (RTEP01), pg. 6. 12 Ibid. pg. 9. 13 Ibid. pg. 53.
Concentric Energy Advisors, Inc. | 9

CPV Towantic Energy Center
near term, a more conservative load forecast (ISO-NE’s 90/10 estimate) showed that Connecticut faced a significant generation capacity shortage over the forecast period.14 In addition, some sub-regions such as SWCT and eastern Connecticut, to a lesser extent, were threatened with supply deficiencies and operating problems due to insufficient transmission and inadequate generation resources within the region. Similarly, in July of 2000, an investigation by the Connecticut Department of Public Utility Control (“DPUC”) identified Southwest Connecticut as having operational difficulties and a near-term need to reinforce the bulk transmission system.15
As a result, in 2005, the Council and ISO-NE approved a massive $1.5 billion 345-kV loop to lower system congestion costs and enhance reliability. United Illuminating (“UI”) and Northeast Utilities (“NU”) jointly developed this project to fully integrate Southwest Connecticut and the Norwalk-Stamford Subarea into the New England 345 kV network. The first section of the 345 kV loop was known as the Bethel-Norwalk (“B-N”) segment, and is shown in Figure 5.
Figure 5: Bethel-Norwalk Transmission Reinforcements
The UI and NU joint application for Transmission Cost Allocation with ISO-NE in January of 2005 highlighted the following justification for the project:
• the need for additional power transmission transfer capacity across the SWCT and Norwalk-Stamford interfaces is acute;
• the project’s relatively short length of 20.4 miles and predetermined terminal point locations based on existing substations (Plumtree Substation and Norwalk Substation) were advantages for siting and construction; and
14 Connecticut Siting Council Forecast of Loads and Resources, 2001 and 2005. 15 Connecticut Siting Council Findings of Fact, Docket No. 217, July 14, 2003.
Concentric Energy Advisors, Inc. | 10

CPV Towantic Energy Center
• the construction of a new 345-kV line to Norwalk will provide a platform for completing the 345-kV loop because it will provide a stronger source into the SWCT and Norwalk-Stamford Sub-areas. The completed 345-kV loop would allow electricity to flow more freely into and out of SWCT from other areas of the New England and New York electric grids.
The second section of the project was known as the Middletown to Norwalk (“M-N”) project, which completed a 345-kV loop in southwestern Connecticut, and is shown in Figure 6 below.
Figure 6: Middleton-Norwalk Transmission Reinforcements
The UI and NU joint Council filing for the M-N project outlined some of the factors contributing to the need for the transmission system improvements, which included:
• Limited transmission capability to reliably serve increased loads;
• Transmission constraints impeding implementation of a competitive generation marketplace, resulting in exposure to congestion costs; and
• Uncertainty surrounding the long-term viability of generation currently operating in SWCT. Interestingly, this problem persists today. A transmission solution, as was proposed to address this issue back in 2003, took five years to implement. Towantic can address this same issue today in a much shorter timeframe.
The B-N project was completed in October of 2006 and M-N project was completed in December 2008. Completion of these major transmission projects greatly improved electricity reliability in SWCT by allowing some 1,300 MW of generation located in the north and central part of the state to
Concentric Energy Advisors, Inc. | 11

CPV Towantic Energy Center
be imported into the SWCT region. Evidence of the improved reliability brought about by the completion of these projects is the reduced transmission congestion charges and the elimination of the need for reliability must run agreements16 with generators located in the area.
In addition to these projects, the New England East-West Solution (“NEEWS”), as shown in Figure 7, is a group of the following related transmission projects developed by ISO-NE, NU and National Grid (the utility serving eastern Massachusetts and Rhode Island).
• The Greater Springfield Reliability Project;
• The Interstate Reliability Project ;
• The Central Connecticut Reliability Project; and
• The Rhode Island Reliability Project.
Figure 7: New England East-West Solution
Together, these projects are designed to solve existing reliability problems with the transmission system. The problems identified by ISO-NE in its regional planning process that formed the basis for the NEEWS project were:
• Limitations to east-west/west-east movement of electricity on the New England power grid;
• Limitations to the flow of power within Connecticut;
16 An agreement made between ISO-NE and a generation owner whereby an approved generator continues to operate even when it is not economical to do so to ensure system reliability, and whereby the generation owner recovers its costs of operation.
Concentric Energy Advisors, Inc. | 12

CPV Towantic Energy Center
• Weaknesses in the transmission system in and around Springfield, MA, a major interstate transmission hub;
• Limitations to moving electricity across Connecticut, Rhode Island and Massachusetts; and
• Rhode Island’s dependence on single transmission lines or autotransformers for reliability.
These projects are at various stages of development. As they reach completion, these projects will provide stronger interconnections across Connecticut, Rhode Island and Massachusetts, and allow more power to move across the region. However, these projects will not solve all of SWCT’s reliability issues.
In June of 2014, ISO-NE released its Southwest Connecticut Needs Assessment, which evaluated the reliability performance and identified reliability-based transmission needs in the SWCT study area. The study showed that even with the transmission projects described above, certain areas of the power system in SWCT fail to meet North American Electric Reliability Corporation (“NERC”), NPCC, ISO-NE, and Transmission Owner standards and criteria. Specifically, the subarea of Frost Bridge–Naugatuck Valley, which includes the Town of Oxford, shows several reliability violations. Regardless of which transmission solutions are developed to address the identified reliability issues, they are long lead-time solutions that will take several years to implement. The addition of local generation in the Oxford area is expected to help to address these reliability issues and can do so in a much shorter timeframe than a transmission solution. A transmission solution can take five years or more to implement and exposes the region to reliability violations and potential system outages over the entire five year window.
GAS INFRASTRUCTURE
New England is located at the terminus of several interstate pipelines. With no indigenous production or underground storage, the region receives natural gas supplies from outside the region via interstate pipelines and LNG import terminals. An overview of the interstate pipelines and LNG import terminals serving New England is included in Figure 8.
Concentric Energy Advisors, Inc. | 13

CPV Towantic Energy Center
Figure 8: New England Gas Infrastructure17
Gas infrastructure in the northeast has undergone several expansions over the last decade. Currently, New England is served by five interstate natural gas pipelines - two of the pipelines bring natural gas into New England from the south (Tennessee Gas Pipeline (“TGP”) and Algonquin Gas Transmission (“AGT”)); one brings natural gas into New England from western Canada (Iroquois Gas Transmission (“IGT”)); and two bring natural gas into New England from Canada, one from the Maritime Provinces (Maritimes and Northeast Pipeline (“M&NP”)) and the other from the Montreal region (Portland Natural Gas Transmission (“PNGTS”)). Figure 9 shows the capacity of each pipeline.
17 Natural Gas Infrastructure and Electric Generation: A Review of Issues Facing New England, December 14, 2012, pg. 12.
Concentric Energy Advisors, Inc. | 14

CPV Towantic Energy Center
Figure 9: Capacities of Existing Pipelines into New England18
CAPACITY INTERCONNECT GAS PIPELINE MMCF/D PIPELINES SOURCES
Algonquin Gas Transmission AGT 1,087 Texas Eastern
Pipeline Gulf of Mexico
Iroquois Gas Transmission IGT 220 TransCanada
Pipeline Western Canada
Tennessee Gas Pipeline TGP 1,261 Gulf of Mexico,
Texas Gulf of Mexico Portland Natural Gas Transmission PNGTS 168
TQM Pipeline System Montreal Region
Maritimes and Northeast Pipeline M&NP 833 None
Sable Island, Deep Panuke fields
In addition, New England is served by three LNG import facilities located within the region – the Northeast Gateway, Neptune and Everett facilities. In addition, there is an LNG facility outside the region – the Canaport facility in Saint John, New Brunswick.
Since 1999, substantial improvements have been made in the availability of natural gas storage as well as pipeline capacity upstream from Connecticut. The combination of natural gas pipelines and LNG supply has served New England well for decades, as it has provided secure supply from pipelines to meet base level demands plus flexible supply from imported LNG to meet peak demand. However, three factors have changed the landscape of the natural gas delivery system into New England:
• Increased and still growing demand for natural gas from the power generation sector;
• Reduced send-out capacities and shorter projected useful lives of the Sable Island and Deep Panuke natural gas fields off Nova Scotia; and
• The widening gap between the price of domestic natural gas and the world price of LNG.
While gas is still abundant on most days, the first two of these factors have placed a strain on the region’s ability to secure deliveries of enough natural gas supply on the coldest days of the winter when heating demands are peaking and electricity demands are relatively high. This has led ISO-NE to implement its recent Winter Reliability Program to incentivize electricity generators with oil burning capability in the region to maintain enough on-site fuel inventories to be able to displace natural gas used for generation when natural gas supplies are inadequate to meet all natural gas demands in the region.
Some recent improvements to the interregional natural gas infrastructure have helped to improve Northeast access to natural gas supply from the Marcellus Shale production areas. Additional
18 Competitive Energy Services, Assessing Natural Gas Supply Options for New England and their Impacts on Natural Gas and Electricity Prices, February 7, 2014, pg. 9.
Concentric Energy Advisors, Inc. | 15

CPV Towantic Energy Center
enhancements to the regional pipeline network that would allow New England to access these larger quantities of natural gas for the region’s power generators are being discussed. To date, three pipeline expansions that would increase capacity into New England have executed contracts and have indicated FERC filing timelines. On February 28, 2014, Algonquin Gas Transmission, LLC (“Algonquin”) submitted an application to the FERC for the Algonquin Incremental Market (“AIM”) expansion project, which would provide approximately 342 million cubic feet per day (“MMcf/d”) of additional capacity on the existing Algonquin system between Ramapo, New York and Mendon, Massachusetts starting in November 2016. Tennessee Gas Pipeline Company, LLC expects to file at FERC before the end of 2014 for the fully subscribed Connecticut Expansion project, which would provide approximately 72 MMcf/d of additional capacity to serve Connecticut LDC growth starting in November 2016. Finally, NU and Spectra Energy Corporation have announced plans to expand natural gas access to New England by approximately 1,000 MMcf/d by expanding the Algonquin Gas Transmission pipeline and the Maritimes & Northeast pipeline. The project is expected to be formally proposed to the FERC in early 2015.
In addition, the New England governors recently expressed their collective perspective about the diversification of energy infrastructure in a statement entitled the “New England Governors’ Commitment to Regional Cooperation on Energy Infrastructure Issues,” dated December 2013. As part of an initiative to increase the availability of gas supply to the Northeast and to achieve broader policy objectives, the states are proposing to increase the amount of firm pipeline capacity into New England by 1,000 MMcf/day above 2013 levels. The ultimate success of this effort is highly uncertain and will require an unprecedented level of cooperation among the New England states, as well as FERC approval for cost recovery. Even if this effort is successful, it will be several years before the gas infrastructure is actually built and in operation. This reality, along with the scheduled retirement of over 1,000 MW of generation by the winter of 2015, has prompted ISO-NE to extend its Winter Reliability Program for 2014/2015, which received FERC approval on September 15, 2014. The goal of the program, consistent with the previous year’s program, is to mitigate winter system operational challenges associated with the region’s heavy reliance on natural gas and concerns about resource availability during the winter. As previously mentioned, the region incurred almost $5.1 billion in wholesale energy costs for December 2013 – February of 2014 compared to $5.2 billion for the entire calendar year of 2012. Clearly, ISO-NE recognizes the need to ensure system reliability through out-of-market mechanisms that pay for dual-fuel capability.
The resource mix, electric transmission infrastructure and gas infrastructure in the region is vastly different today than it was in 1999, the year Towantic was granted its Certificate. Since that time, gas-fired generation has become the technology of choice and has stressed the existing gas infrastructure at times of high peak demand and extreme weather. In addition, older fossil-fueled and nuclear units are retiring, and renewable resources are challenging system reliability and increasing the need for more flexible resources to ensure system reliability. As the amount of
Concentric Energy Advisors, Inc. | 16

CPV Towantic Energy Center
renewable resources continues to increase to meet state policy objectives and more coal and nuclear generation is at risk of retirement, flexible and efficient generation like Towantic will be needed to support the increasing amount of legacy generating facility retirements and renewable generation being interconnected to the bulk power system.
Furthermore, recent experience has highlighted the value of fuel diversity and fuel security, and the contribution that dual fuel generators can make to system reliability. In fact, these resources were critical to “keeping the lights on” during the winter of 2014. It is expected that oil inventory will continue to be instrumental in helping maintain system reliability in the future and will allow system operators to manage the power grid through periods of extreme cold because of the reliability of fuel supply inherent with oil-fired and dual-fuel generators. The addition of more dual fuel capability through resources like Towantic can make an immediate and positive impact on system reliability locally and regionally.
Concentric Energy Advisors, Inc. | 17

Towantic Energy Center
SECTION 4: EVOLUTION AND IMPLEMENTATION OF WHOLESALE MARKETS
he New England wholesale markets have changed dramatically over the last 15 years and continue to evolve. The current design of the wholesale markets is structured to incent investment in new, clean, and reliable generation. These incentives are changing the
regional generation mix, and resulting in the increased retirement of old and inefficient generating resources. The competitive markets as they exist today provide a unique opportunity for new generation to play an increasingly important role in meeting New England’s energy needs.
EVOLUTION OF WHOLESALE MARKETS IN NEW ENGLAND
Between the time Towantic was initially permitted to the present day, the New England wholesale market has gone through a dramatic transformation. Bid-based wholesale markets were at the beginning stages of implementation in May of 1999. By 2003, a multi-settlement and congestion management system (known as standard market design, or “SMD”) was implemented. Its key features included a day-ahead financially binding energy market for supply offers and load bids, a real-time spot energy market to account for any variations from the day-ahead commitment, a locational marginal price-based energy market system that featured eight separate load zones with distinct zonal energy rates, and a congestion hedging mechanism that utilized tradable financial transmission rights.
By 2005, even though competitive markets had been in operation in New England for several years, over 4,500 MW of capacity in New England were operating under Reliability Must Run (“RMR”) agreements.19 These generators, which ISO-NE had identified as critical to system reliability, operated under agreements that provided cost of service compensation to allow generators to recover their full cost of service as a means of guaranteeing their continued operation until the reliability issue could be resolved. In response to the increasing number of RMR agreements, the FERC directed ISO-NE to file a market-based mechanism for setting unique prices for separate sub-regions within New England depending on capacity need.20
On June 16, 2006, the FERC approved a Settlement Agreement among New England stakeholders which established a new Forward Capacity Market (“FCM”) in New England. The FCM was designed to acquire sufficient capacity to meet New England’s energy requirements by sending locational price signals to attract new resources and retain existing resources when capacity was needed. The
19 2010 ISO/RTO Metrics Report pg. 95. 20 New England Power Pool and ISO New England Inc., 100 FERC ¶61,287 (2002); Devon Power LLC, 103 FERC 61,082
(2003).
T
Concentric Energy Advisors, Inc. | 18

Towantic Energy Center
FCM was an alternative to a locational installed capacity market, which had been proposed by ISO-NE under direction from the FERC, but which had been strongly opposed by a variety of stakeholders in New England. The FCM established an annual auction-based market for capacity resources in New England. The Forward Capacity Auctions (“FCA”) procure capacity three-plus years ahead of the commitment period, which is intended to provide for a planning period for new entry to allow potential new capacity to compete in the auctions. The commitment period is a year-long period that corresponds to the ISO-NE power year. Thus, sellers will commit to provide capacity for one year—for example, June 1, 2019 to May 31, 2020—three-plus years in advance of the commitment period. However, new capacity has the option to lock-in capacity prices for up to five years in one-year increments. This design element is intended to provide predictable revenues and facilitate financing for new capacity. Capacity resources, regardless of the type, receive the same auction clearing price. Load serving entities pay for their share of the local and regional capacity requirement based on their share of the system peak load.
The complete redesign of the wholesale markets in New England since 1999 has resulted in significant new entry into the New England market. As shown in Figure 10 below, almost 4,000 MW of new generating capacity and over 3,300 MW of new demand response have entered the market since the inception of the FCA.
Figure 10: Capacity Secured Through the Forward Capacity Auctions21
While new entry has historically been robust, concerns have arisen over the compensation that resources receive to provide needed services to the system and the performance of these resources during times of system stress when these services are critical to system reliability. ISO-NE has stated that under the current capacity market design, average resource performance has been declining while the poorest performing resources continue to be paid. ISO-NE further stated that the weak linkage between capacity payments and performance provides little incentive for owners to invest in their resources to ensure that they are capable of providing energy and reserves when
21 ISO-NE Capacity Market Auction Results, http://www.iso-ne.com/markets-operations/markets/forward-capacity-market.
Capacity Resource FCA #1 FCA #2 FCA #3 FCA #4 FCA #5 FCA #6 FCA #7 FCA #8 TotalAuction Date Feb-08 Dec-08 Oct-09 Aug-10 Jun-11 Apr-12 Feb-13 Feb-14
Commitment Period 2010/2011 2011/2012 2012/2013 2013/2014 2014/2015 2015/2016 2016/2017 2017/2018
New Generating Resources 40 1,157 1,670 144 42 79 800 27 3,959 New Demand Reponse Resources 860 447 309 515 263 313 245 355 3,307
Active demand resources 576 185 98 257 42 66 <1 14 1,238 Passive demand resources 284 262 211 258 221 247 245 341 2,069
Existing Generating Resources 30,825 31,050 30,558 32,103 31,397 30,678 30,841 29,397
Concentric Energy Advisors, Inc. | 19

Towantic Energy Center
needed. As a result, the region is seeing lagging investment in existing resources, a pronounced decline in resource performance, and some near misses when it comes to reliability.22 ISO-NE has observed and documented pervasive and worsening performance problems among the existing generation fleet in New England.23
Among other things, in response to the decline in performance and the compensation for such performance, ISO-NE has recently implemented, with FERC approval, many important changes in the capacity market, as described below.
RECENTLY ADOPTED CHANGES
• Removal of Floor Price
As part of the original FCM design, the Settlement Agreement contained a price collar to protect against extremely high or extremely low clearing prices.24 This collar consisted of a price ceiling and a price floor tied to the cost of new entry for a peaking gas-fired resource. Because the system had a surplus of capacity for the first seven capacity auctions, all seven auctions cleared at the price floor, as shown in Figure 11 below.
22 ISO-NE Newswire January 22, 2014. 23 ISO New England Inc. and New England Power Pool, Filings of Performance Incentives Market Rule Changes, ER14-
1050-000, January 17, 2014. 24 The price collar was originally supposed to be removed for the fourth capacity auction but was ultimately extended
through the seventh capacity auction.
Concentric Energy Advisors, Inc. | 20

Towantic Energy Center
Figure 11: Forward Capacity Auction Results25
* Prorated price in Maine is $2.47/kW-month and $2.34/kW-month for FCAs 3 and 4, respectively.
However, with the removal of the price floor for the eighth auction, conducted on February 3, 2014, a shift in future available capacity drove a large swing in capacity prices with the auction yielding a clearing price of $15.00/kilowatt-month (“kW-month”) for new resources. Further, because of a lack of competition, administrative pricing rules were triggered, setting the capacity prices for most existing resources at $7.025/kW-month. Going forward, the removal of the floor price will prevent the capacity market price from being administratively set in the future and will allow the capacity market price to reflect, and for resources to be compensated for, capacity when and where it is needed.
• Offer Review Trigger Prices
In an April 2011 order, the FERC required ISO-NE to implement buyer-side mitigation rules similar to the PJM Interconnection to prevent new capacity resources with “out of market” revenues from distorting capacity market price signals. In May of 2014, the FERC approved ISO-NE’s new buyer side mitigation mechanism known as Offer Review Trigger Prices (“ORTP”). These ORTPs act as a "screen" for potentially new uncompetitive resource offers in an FCA to protect against the exercise
25 ISO-NE Electricity Restructuring Oversight Committee, October 2, 2013.
Auction Commitment
Period
Total Capacity Acquired
(MW)
Capacity Required
(MW)
Excess Capacity
(MW)
New Demand Resources
(MW)
NewSupply(MW)
Clearing Price ($/kW-month)
Prorated Price
($/kW-month)
FCA-12010/2011
34,077 32,305 1,772 1,188 626 $4.50Floor price $4.25
FCA-22011/2012
37,283 32,528 4,755 448 1,157 $3.60Floor price $3.12
FCA-32012/2013
36,996 31,965 5,031 309 1,670 $2.95Floor price $2.54*
FCA-42013/2014
37,501 32,127 5,374 515 144 $2.95Floor price $2.52*
FCA-52014/2015
36,918 33,200 3,718 263 42 $3.21Floor price 2.86
FCA-62015/2016
36,309 33,456 2,853 313 79 $3.42Floor price $3.13
FCA-72016/2017
36,220 32,968 3,252 245 800
$3.150Floor price
$14.999NEMA/Boston
ROP: $2.744Maine: $2.744
CT: $2.883NEMA/Boston:
$14.999
FCA-82017/2018
33,702 33,855 (153) 355 27 New: $15.00
Existing$7.025
N/A
Concentric Energy Advisors, Inc. | 21

Towantic Energy Center
of buyer-side market power that could inappropriately suppress capacity prices. The ORTP does not itself define the lowest price, or “offer floor,” at which a new capacity resource of a particular type can participate in an FCA. Rather, it is a benchmark price down to which a new capacity supply resource can offer freely without justification to the ISO-NE’s Internal Market Monitor (“IMM”).
This mechanism, by design, allows more efficient resources to compete in the auction as compared to the benchmark resource and affect an efficient capacity market clearing price. The less efficient the resource, the less successful it will be in justifying a bid below the ORTP and the less competitive it will be in the capacity market. State of the art technology like that being proposed at Towantic will allow the unit to be competitive and drive efficient market prices.
There is a limited exemption from the buyer-side mitigation rules for renewable technology resources that are built specifically to advance state policy objectives. These rules are in place to help mitigate potential price suppression that can occur when a particular class of resources receives compensation not available to others. Importantly, there is no exemption for resources with state mandated contracts built pursuant to a state directive. In the past, these resources were exempt from mitigation in other regions with capacity market constructs and were allowed to bid in at a zero price, which resulted in suppression of market prices. Under the ISO-NE capacity market design, these resources are subject to the same mitigation rules as other like resources, so that the impact on market clearing prices of revenues received outside of the capacity market is eliminated.
• Demand Curve
ISO-NE is replacing the existing vertical demand curve with a sloped demand curve to reduce price volatility in the FCM to benefit ratepayers and investors. Each of the eight FCAs to date has sought to procure a fixed amount of capacity, regardless of the auction clearing price. Through the first seven auctions, the New England region had surplus capacity that exceeded the capacity requirement (with the exception of one zone in FCA #7), and therefore, the auctions cleared at the administratively set floor price. However, the eighth auction, conducted on February 3, 2014, concluded with a slight shortfall in capacity and relatively high prices. The requested retirement of several thousand megawatts of generation drove a large swing in capacity prices. Through the first seven FCAs, prices ranged from $2.52 per kilowatt-month (kW-month) to $3.43/kW-month, while FCA #8 yielded a clearing price of $15.00/kW-month for new resources and $7.025/kW-month for existing facilities. The impact of the vertical demand curve on prices in the New England FCM is shown in Figure 12.
Concentric Energy Advisors, Inc. | 22

Towantic Energy Center
Figure 12: ISO-NE Vertical Demand Curve and Price Impact
Under the new design, the sloped demand curve will be based on the cost of new entry (“CONE”) for a new resource and system planning design criteria that are based on the probability of disconnecting load due to a resource deficiency (also referred to as Loss of Load Expectation or LOLE). The curve’s prices are indexed to an estimated Net CONE value (the estimated CONE net of inframarginal energy and ancillary service revenues). The Net CONE value for FCA-9 is $11.08/kW-month, with prices rising above that if reserve margins become low and prices declining below Net CONE at higher actual reserve margins. Net CONE values are based on 2x1 combined-cycle gas turbine technology—a widely used technology across the country and the type of technology used by the most recent merchant generation plant that has cleared in the capacity market. The sloped demand curve is shown in Figure 13 below.
Recent ISO-NE Results
• When resources fall short of requirements in a market with a vertical Demand curve, prices spike to Cost of New Entry (“CONE”).
• Plant retirements drove resources below the vertical demand curve resulting in the capacity price spiking to the administrative cap.
$7.03
Concentric Energy Advisors, Inc. | 23

Towantic Energy Center
Figure 13: Sloped Demand Curve
• 7 year Lock-in
The demand curve design also includes an increase in the number of years new resources can choose to “lock-in” their capacity price. The extension of the lock-in period from five years to seven years is intended to ensure that the overall market design provides sufficient certainty to attract new investment when needed.
• Pay for Performance
ISO-NE has identified significant performance issues with its existing generation fleet. In an October 2012 whitepaper, ISO-NE described these operational concerns:
Concentric Energy Advisors, Inc. | 24

Towantic Energy Center
“In New England, concerns with resource performance and flexibility arise from several sources. One risk is the operational performance of existing resources during stressed system conditions — times when resources’ performance is essential to reliability. ISO analyses indicate that older units that are relied upon for peaking service, ramping, or reserves are not performing within their offered parameters. These shortcomings became manifest in operational events on June 24, 2010, September 2, 2010, and January 24, 2011 (including a NERC violation related to inadequate generation contingency response on September 2). More generally, an examination of dispatch response performance following the 36 largest system contingency events over the last three years indicates that, on average, New England’s non-hydro generating fleet delivered less than 60% of the additional power requested of these resources by the ISO. In sum, at times of greatest need, many resources are delivering far below the performance ability represented in their supply offers.”26
In an effort to address these issues, ISO-NE is implementing a “pay for performance” (“PFP”) mechanism to encourage resource performance consistent with its assumed capacity obligation by creating a stronger financial incentive for capacity suppliers to i) perform when called on during periods of system stress; and ii) make investments to ensure performance.
Under PFP, a resource that underperforms will forfeit some or all capacity payments awarded in a FCA. Resources that perform in its place will receive these capacity payments. This means that the financial risk of nonperformance is placed on resource owners who have accepted capacity obligations. The capacity market price will not be affected by these performance payments, thus protecting consumers.
Exposing resource owners to the risk of forfeiting capacity payments for underperformance, as well as providing them the opportunity to receive more compensation for over performance, is designed to incent resource owners to make investments that ensure their resource can perform. They have a variety of options, such as upgrading to dual-fuel capability, entering into short-notice or non-interruptible gas supply agreements, investing in new fast-start assets, or simply ensuring robust maintenance practices and adequate staffing. FCM rules will not dictate the technology or other means by which suppliers elect to do this, but will merely create the incentive for resource owners to make cost-effective investments that meet the needs of operating a reliable system.
POTENTIAL FUTURE CHANGES
• Additional Capacity Zone
Pursuant to a FERC directive, ISO-NE filed for approval of the identification of a potential new capacity zone. In its analysis of the need for a new capacity zone, ISO-NE used the eight existing energy load zones as the starting point for the assessment of transmission transfer capabilities. The
26 ISO New England Whitepaper, FCM Performance Incentives, October 2012.
Concentric Energy Advisors, Inc. | 25

Towantic Energy Center
eight existing Load Zones are: Connecticut, Maine, Northeastern Massachusetts/Boston (“NEMA/Boston”), New Hampshire, Rhode Island (“RI”), Southeastern Massachusetts (“SEMA”), West-Central Massachusetts (“WCMASS”) and Vermont. A transmission transfer capability assessment showed persistent and meaningful transmission interface constraints on or near the interface of the boundary formed by the existing combined SEMA and RI Load Zones.
FERC approved ISO-NE’s proposed boundary on May 29, 2014. ISO-NE will perform an additional resource adequacy assessment to determine whether the potential zone will actually be modeled as a separate import-constrained capacity zone in FCA 9. ISO-NE will inform the FERC of the results of its analysis in early November 2014.
The implementation of an additional capacity zone will improve the efficiency of the capacity market by sending market signals to ensure that resources are compensated when and where they are needed. The addition of Towantic will help to ensure that Connecticut has enough capacity to meet its local reliability requirements and will minimize the risk of higher clearing prices in Connecticut compared to other capacity zones. The benefits offered by Towantic in this regard may even increase prospectively since ISO-NE is expected to examine the need for additional capacity zones annually in the future.
• Role of Demand Response
The FERC issued Order 745 in 2011 establishing a new approach for compensating demand response resources that participate in the nation's organized wholesale energy markets. Under Order 745, demand response resources were allowed to receive the market price for energy when dispatched. In addition, demand response resources were allowed to participate in capacity markets and receive capacity payments in exchange for providing capacity to the system.
On May 23, 2014, the U.S. Court of Appeals for the D.C. Circuit vacated and remanded Order No. 745. The decision holds that the FERC did not have jurisdiction under the Federal Power Act (“FPA”) to issue Order No. 745 because demand response is part of the retail market, which is exclusively within the states’ jurisdiction to regulate. Furthermore, the court held that even if FERC did have jurisdiction under the FPA to issue Order No. 745, the Order would still be arbitrary and capricious because FERC failed to properly consider that Order No. 745 would result in unjust and unreasonable rates because it would overcompensate demand response resources.
There are over 3,000 MW of demand response resources that currently participate in the ISO-NE energy and capacity markets. The future role of these resources is highly uncertain. Clearly, the elimination of this block of resources from the wholesale markets would have a significant impact on system operation and market prices. However, it will likely take several months if not years to ultimately resolve the role of demand response in organized wholesale markets.
All of the changes in the wholesale market since 1999, as described above, have increased the need for plants like Towantic. In the Connecticut Siting Council Findings of Fact in Docket No. 192A dated January 4, 2007, the Siting Council noted that that the 2005 and 2006 ten-year forecasts of
Concentric Energy Advisors, Inc. | 26

Towantic Energy Center
load and resources of Connecticut electric utilities showed that supplies were expected to meet demand under normal weather conditions in the near term, although a more conservative load forecast showed a shortage of supply. In the ISO-NE Draft 2014 Regional System Plan, ISO-NE is projecting a region-wide capacity shortage of 424 MW in 2019 increasing to 1,155 MW by 2023. In addition, the ISO-NE 2014 CELT Report projects the region to fall below the target reserve margin by 2018. Towantic will provide critical generation to meet the region’s reliability needs identified by ISO-NE.
In addition to the contribution that Towantic will make to meeting the regional capacity need, the current and potential market design changes discussed above are designed to incent more efficiency, flexible and low-cost resources like Towantic. In fact, the new demand curve in the FCM is based on a combined cycle unit similar to Towantic. In the review of likely technologies to be built, ISO-NE determined that combined-cycle gas turbines are the predominant technology being built by merchant investors across the country, and that combined cycle plants “are clearly an economic choice and are part of the mix of technologies that merchant investors will build.”27 The implementation of new buyer-side mitigation measures will prevent anti-competitive behavior that seeks to suppress capacity-clearing prices. This will strengthen the ability of the capacity market to clear at prices that encourage new entry and support existing resources when and where they are needed. In addition, the new PFP mechanism will measure resource performance during hours of system stress. This mechanism is likely to increase the risk of resource retirements and result in higher capacity payments for new and existing efficient resources like Towantic since it will reward flexible resources and penalize slower-responding, inefficient resources. In addition, the introduction of the sloped demand curve into New England’s capacity market will reduce price volatility over time, yielding smaller swings in capacity prices when the market moves from conditions of excess supply to periods when new capacity resources are needed, which may occur as aging power plants retire.
The cumulative impact of these market design changes support the change in technology for Towantic. While the originally proposed design of the facility was the appropriate choice at that time, the new design of the facility better meets the needs of the current market as reflected by the changes being implemented by ISO-NE. Collectively, these changes are designed to support and encourage units with the technology being utilized by Towantic to respond to the needs of the market.
27 Testimony of Dr. Samuel A. Newell and Mr. Christopher D. Ungate on Behalf of ISO New England Inc. Regarding the Net Cost of New Entry for the Forward Capacity Market Demand Curve, Docket ER14-1639-000, pg. 6.
Concentric Energy Advisors, Inc. | 27

Towantic Energy Center
SECTION 5: IMPLEMENTATION OF STATE ENERGY AND ENVIRONMENTAL PROGRAMS SINCE 1999
ince the Council issued the Certificate to Towantic in 1999, state policy makers in New England, and Connecticut in particular, have taken the lead in providing incentives for new capacity resources to be built in the state and mandating the reduced environmental impact of existing facilities. Since 1999, over 3,000 GWH28 of renewable resources have achieved commercial operation in New England, long-term power purchase agreements
have incentivized nearly 1,200 MW of new generation in Connecticut, and regional emissions from existing generating facilities have been reduced. While these programs have provided cost and environmental benefits, the availability of renewable generation is still limited, and retirement of existing generation has stressed the reliability of the existing system. Accordingly, Connecticut will need new flexible and clean generation to ensure reliable electric service to consumers.
RENEWABLE PROCUREMENTS
In 1998, Connecticut established a Renewables Portfolio Standard (“RPS”). The RPS was designed to achieve several objectives:
• Reduce dependence on fossil fuels;
• Create a hedge against volatile oil and natural gas prices;
• Lower air emissions;
• Promote clean energy jobs; and
• Drive economic development.
The RPS requires each electric supplier and electric distribution company to meet at least 23% of its retail load through the use of renewable energy by January 1, 2020. The RPS also requires each electric supplier to meet at least 4% of its retail load by using combined heat and power (“CHP”) systems and energy efficiency by 2020. Separate portfolio standards are required for energy resources classified as "Class I," "Class II," or "Class III" as shown in Figure 14 below.
28 ISO-NE 2010 Regional System Plan.
S
Concentric Energy Advisors, Inc. | 28

Towantic Energy Center
Figure 14: Summary Description of Connecticut’s RPS Requirements29
RESOURCE CLASS
DESCRIPTION TECHNOLOGY
MINIMUM
Class I
Solar power, wind power, fuel cells (using renewable or non-renewable fuels), geothermal, landfill methane gas, biogas, ocean thermal power, wave or tidal power, low-emission advanced renewable energy conversion technologies, run-of-the-river hydropower facilities not exceeding 30 MW, and certain biomass facilities that use sustainable biomass fuel and meet emissions requirements.
20% by 2020
Class II Trash-to-energy facilities, certain biomass facilities not included in Class I, and certain older run-of-the-river hydropower facilities
3% by 201030
Class III
(1) Customer-sited CHP systems, with a minimum operating efficiency of 50%, installed at commercial or industrial facilities in Connecticut on or after January 1, 2006; (2) electricity savings from conservation and load management programs that started on or after January 1, 200631; and (3) systems that recover waste heat or pressure from commercial and industrial processes installed on or after April 1, 2007.
4% by 2020
Since the inception of the RPS in Connecticut and similar programs in other New England States, the amount of renewable capacity in New England has increased dramatically and is expected to further increase in order to meet state and regional renewable goals. The total amount of renewable energy generation in New England has increased from approximately 300 GWH in 2003 to over 3,000 GWH by 2012, and is expected to continue to grow in the future, as shown in Figure 15 and Figure 16 below.
29 http://www.ct.gov/pura/cwp/view.asp?a=3354&q=415186. 30 For Class I or Class II. 31 On or after January 1, 2014, no such programs supported by ratepayers shall be eligible.
Concentric Energy Advisors, Inc. | 29

Towantic Energy Center
Figure 15: New England RPS Class I Compliance by Generator Type 2003-201232
Figure 16: Projection of Incremental Renewable Energy Needed 2015-202533
32 Commonwealth of Massachusetts Department of Energy Resources, RPS & APS Annual Compliance Report for 2012 (April 22, 2012), pg. 15.
33 ISO-NE 2012 RPS Spreadsheet.
-
2,000
4,000
6,000
8,000
10,000
12,000
14,000
16,000
2015 2016 2017 2018 2019 2020 2021 2022 2023 2024 2025
GWH
Concentric Energy Advisors, Inc. | 30

Towantic Energy Center
In 2013, Connecticut’s Governor Malloy signed Senate Bill 1138 into law, restructuring the state’s RPS framework in response to a Connecticut Department of Energy and Environmental Protection (“DEEP”) study finding that ratepayers’ investments in clean energy were largely going to older, out-of-state, less environmentally friendly biomass and landfill gas facilities. Based on the DEEP’s recommendations, the legislation provides for the following: (1) allows large-scale hydro to count toward the RPS target but only in the event of a verified shortfall in Class I supply (up to 1% of electric energy provided in 2016 and no more than 5% by 2020); (2) gives DEEP the authority to solicit proposals and direct electricity distribution companies to enter into long-term power purchase agreements with various renewable energy sources; (3) expands support for small hydropower by increasing Class I hydro eligibility from 5 MW to 30 MW; and (4) calls for a gradual reduction in the value of renewable energy certificates (“RECs”) received by biomass and landfill gas projects34. By 2020, it is estimated that in-state renewables will supply 5% of the state’s total electricity demand.
The increased penetration of renewable resources into the New England wholesale market has had a dramatic effect on the operation of the bulk power system and on wholesale electric prices. The intermittency of wind and solar generating facilities, which makes up the greatest proportion of new renewable resources, has increased the need for “backstop” resources to be available when these resources are not able to operate due to lack of wind or sun at times when demand rapidly increases, normally during early morning and afternoon hours.35 In addition, these resources are typically “price takers” in the market, meaning that they bid their energy into the market at a zero cost, which dampens price signals in the wholesale market. This has strained profit margins for fossil-fueled and nuclear plants, and resulted in increased retirements and announced intentions to retire, as more fully discussed below. The increased penetration of renewable generation makes the need for additional flexible generation such as Towantic critical to system reliability and resource adequacy.
DEMAND RESPONSE AND ENERGY EFFICIENCY PROGRAMS
As part of Connecticut's electric-industry restructuring legislation (Public Act 98-28), the State of Connecticut created the Energy Efficiency Fund (“EEF”) and the Connecticut Clean Energy Fund (“CCEF”) to support the state’s energy efficiency and renewable energy objectives. The mission of EEF is to advance the efficient use of energy, to reduce air pollution and negative environmental impacts, and to promote economic development and energy security.36 Connecticut’s electric distribution companies are responsible for providing various energy
34 ISO-NE 2013 Regional System Plan. 35 Comments Mr. Peter Brandien, Vice President, System Operations for ISO-NE to U.S House Committee on Energy &
Commerce April 18, 2014. 36 http://www.dsireusa.org/incentives/incentive.cfm?Incentive_Code=CT12R.
Concentric Energy Advisors, Inc. | 31

Towantic Energy Center
efficiency programs to their customers. The Connecticut legislature reinforced its commitment to demand response and energy efficiency in 2011 when it enacted Public Act 11-80 (“The Act”). The Act established a Clean Energy Finance and Investment Authority to fund programs to finance and support clean energy investment, manufacturing, research and development, and the financing of zero-and-low emissions power sources. The Act also created a residential photovoltaic solar program that was projected to result in 30 MW of new solar generating capacity with financial incentives for the purchase or lease of qualifying residential photovoltaic systems.
Because of these programs and similar programs throughout New England, the amount of energy efficiency and demand response in New England has grown dramatically since the beginning of the competitive markets, from less than 100 MW to a peak of over 3,500 MW by 2014 and declining to 3,000 MW by 2018. Energy efficiency measures in New England are projected to remain robust in the future, as shown in Figure 17.
Figure 17: Growth of Energy Efficiency in New England’s Forward Capacity Market37
In addition to energy efficiency programs, Connecticut has established a regional demand response program managed by the Office of Policy and Management (“OPM”) on behalf of eleven state agencies. The objective of the program is to reduce peak electrical load during periods of high demand through individual electricity account action to remove load from the electrical grid. This is accomplished by activation of on-site emergency power generation or through turning off non-critical electrical loads. Overall, the demand response program eliminates the need for additional
37 ISO-NE Energy Efficiency Forecast Report for 2018 – 2023, (June 3, 2014), pg. 7.
Concentric Energy Advisors, Inc. | 32

Towantic Energy Center
power generation and distribution infrastructure to meet unusual high demand periods, such as on the hottest days of summer.
As discussed earlier, the FERC issued Order 745 in 2011, which established a new approach for compensating demand response resources that participate in the nation's organized wholesale energy markets, including ISO-NE. Under Order 745, the wholesale energy market operators were required to pay demand response resources the market price for energy, known as the locational marginal price or "LMP," when dispatched. In addition, demand response resources were allowed to participate in capacity markets and receive capacity payments in exchange for providing installed capacity to the system. In the energy market, resources bid in at a price whereby there are generally only called upon when the system is short of capacity and reserves. In the capacity market, these resources bid in at a minimal or zero price, signaling their willingness to accept the price at which the market clears.
The addition of demand response and energy efficiency resources in New England has had a dramatic effect on the operation of the wholesale market. First, the proliferation of demand response and energy efficiency resources has led to some saturation and fatigue in the state and the region. An analysis of demand response performance in the summer of 2010 conducted by ISO-NE showed that Connecticut demand response resources delivered 84% of the capacity they committed to supply to the system through the capacity market. In cases such as these where resources do not perform consistent with their obligations, ISO-NE must be able to call on additional resources capable of responding quickly to meet system needs, which are generally resources like Towantic.38 The performance of demand response and energy efficiency resources during times of high peak demand or capacity shortages have highlighted the need for reliable “conventional” resources that can respond to immediate system needs and ensure the reliable operation of the bulk power system.
In addition, the amount of demand response and energy efficiency that bids into the capacity market at a low or zero price have depressed capacity prices and contributed to placing several units at risk of retirement. In fact, the ISO has identified nearly 8,300 MW of capacity at risk of retirement by 2020 as shown in Figure 18 below.
38 ISO New England Summer 2010 Demand Resource Performance – Additional Data Request (December 6, 2010), at 4.
Concentric Energy Advisors, Inc. | 33

Towantic Energy Center
Figure 18: Capacity Resources in New England At-Risk of Retirement39
Note: Norwalk Harbor, Bridgeport Harbor 2, Mount Tom Station and Brayton Point Station have already announced their retirements.
Vermont Yankee (620 MW) had already announced when this study was conducted.
As previously discussed, on May 23, 2014, the U.S. Court of Appeals for the D.C. Circuit Court issued a decision in Electric Power Supply Association v. FERC vacating and remanding FERC’s Order No. 745. The decision holds that the FERC did not have jurisdiction under the FPA to issue Order No. 745 because demand response is part of the retail market, which is exclusively within the states’ jurisdiction to regulate. With the uncertainty of the viability of over 3,000 MW of demand response in the energy and capacity markets, reliable large-scale generation will play an increasingly important role in the reliable operation of the bulk power system.
STATE SPONSORED RFPS FOR LONG TERM CONTRACTS
Connecticut policy makers have taken the lead in providing incentives for new capacity resources to be built in the state with the primary objective of reducing energy costs for Connecticut consumers through long-term contracts. Connecticut’s Project 150 program, launched in 2003 and later amended, required local electric distribution companies to enter into long-term contracts to purchase at least 150 MW of Class I renewables. Fourteen projects totaling approximately 160 MWs were approved for participation in the program. As of 2011, only four projects totaling approximately 47 MW appear to have been financed or are otherwise moving forward towards completion.40 In addition to Project 150, Connecticut established a ratepayer funded grant and
39 ISO New England’s Strategic Transmission Analysis, (June 14, 2013), pg. 4. 40 Restructuring Connecticut’s Renewable Portfolio Standard, April 26, 2013.
Concentric Energy Advisors, Inc. | 34

Towantic Energy Center
incentive program to promote the development of CHP projects, which qualify as Class III resources. This program resulted in the development of approximately 100 MW of CHP between 2006 and 2009.
In addition, in June 2005, Connecticut policy makers enacted Public Act 05-01, An Act Concerning Energy Independence, which authorized the DPUC to launch a competitive procurement process geared toward motivating new supply-side and demand-side resources in order to reduce the impact of Federally Mandated Congestion Charges (“FMCCs”) on Connecticut ratepayers. The DPUC’s primary objective with this procurement process was to reduce the impact of FMCCs and other costs on Connecticut ratepayers by facilitating the development of new or incremental capacity.
The DPUC selected four projects, totaling an aggregate 787 MW, as winning bidders in its RFP process for new capacity. According to the DPUC, this portfolio of projects was expected to reduce costs to Connecticut ratepayers, improve system reliability and provide important environmental benefits. The selected portfolio consisted of: a 620 MW gas-fired dual-fuel combined cycle baseload plant; a 66 MW oil-fired peaking facility; a 96 MW gas-fired dual-fuel peaking facility; and a 5 MW state-wide energy efficiency project.
In addition, in 2007, the State of Connecticut’s General Assembly passed Public Act 07-242, Section 50, which sought a long-term solution to Connecticut’s need for more peaking power generation, or power that is required during times of highest demand, such as periods of extreme weather conditions or unexpected transmission or generation outages. A joint venture between United Illuminating and NRG, known as GenConn, was awarded long term-contracts which resulted in 196 MW of new dual-fuel peaking capacity at NRG’s existing Devon plant in Milford, and 215 MW at NRG’s Middletown location. In addition, PSEG Power Connecticut was awarded a long contract for approximately 130 MW of dual-fuel peaking generation at its New Haven station.
The passage of Public Act 11-80 in 2011 launched a series of new programs designed to dramatically increase the amount of in-state Class I renewable resources at increasingly lower costs through competitive procurement and leveraging ratepayer contributions. Specifically, Public Act 11-80 required that utilities enter into long-term contracts of at least 15 years for renewable energy credits from zero emission Class I renewable energy facilities (including solar, wind, and hydro generators) up to 1.0 MW. As of March 2013 (one year after the program launch), this program has already resulted in 8.2 MW of solar installations in development.
Finally, in 2013, Connecticut passed Public Act 13-303 which modified Connecticut’s RPS by: i) expanding the types of resources that potentially qualify as Class I resources; and ii) reducing the value of renewable energy credits associated with certain biomass facilities. This legislation also authorized the state to solicit energy proposals for renewable projects. Public Act 13-303 allows certain Class I requirements to be satisfied by long-term contracts, primarily expected to be filled
Concentric Energy Advisors, Inc. | 35

Towantic Energy Center
by larger Canadian hydroelectric projects that are not generally eligible for Class I status and allows up to five percent of the state’s Class I RPS to be satisfied by this large-scale hydropower by 2020. As a result, Connecticut’s electric distribution companies recently procured renewable energy from a 250 MW wind farm to be constructed in Maine and a 20 MW solar park to be constructed in Connecticut. Connecticut also recently procured long-term contracts for RECs from two biomass facilities, further ensuring cost-effective compliance with the RPS and providing opportunities to sell RECs into the market to reduce ratepayer costs.
The addition of these new, state-sponsored projects, supported by long term contracts, has improved both system reliability and resource adequacy. Two recent judicial decisions, both having to do with the PJM market, struck down Maryland and New Jersey procurements that were supported by contracts for differences, on preemption grounds. But both courts took pains to limit the scope of their orders, and to underscore that most traditional state support mechanisms were not preempted – with the sole exception of the specific contracts for differences that were before the courts. Long-term contracts in accord with the courts’ guidance thus remain a valuable tool for states to ensure the development of needed power generation resources, and to lower the significant capital costs associated with those investments. Nonetheless, the validity of contracts for differences, like those used in the Connecticut procurements, are in doubt.
The addition of a merchant generator like Towantic reduces the need for these state-sponsored contracts and shifts financial risks from the consumer to the generator consistent with the intent of competitive markets.
HYDRO PROCUREMENT
In order to encourage the construction of renewable generation in the state, the 2013 Connecticut legislation expanded the eligibility of large-scale hydropower for RPS compliance from 5 MW to 30 MW. In order to classify as a Class I renewable resource under the former RPS framework, a hydropower project needed to be built after 2003, be run-of-river, and have a generating capacity of less than 5 MW. These changes better align RPS rules with other states in New England, such as Massachusetts, while at the same time ensuring that an eligible small hydropower facility meets all state and federal requirements. The DEEP also proposed to explore opportunities for large-scale hydropower to provide either peak-shaving or base-load electricity as part of the state’s Comprehensive Energy Strategy.
While Towantic would not eliminate the need for additional resources to meet renewable mandates, it would reduce the amount of capacity Connecticut would need to seek from out-of-state to meet its reliability needs. In addition, having more in-state merchant generation rather than long-term contracted generation shifts the risk from ratepayers to the developers of generation. This in-state generation also provides local and regional economic benefits.
Concentric Energy Advisors, Inc. | 36
Towantic Energy Center
ENVIRONMENTAL REGULATIONS
Environmental programs have continued to evolve since 1999, with a particular market effect on older generating assets. As discussed more fully in Tetra Tech’s Environmental Overview in Support of Petition for Changed Conditions, major regulatory programs are causing older coal-fired generating facilities to consider extensive capital upgrades and/or shutdown. As previously noted, over 3,200 MW of older generating capacity have announced plans to retire. Even those generating facilities that will continue to operate will take on financial burdens that may have a direct bearing on their competitiveness in the energy marketplace. Key areas of regulatory pressure on older units include:
• Air quality – A range of air quality related initiatives continue to evolve, including more stringent National Ambient Air Quality Standards and short-term air quality standards; more stringent scrutiny on mercury emissions and control technology requirements; and focus on greenhouse gas emission reduction measures.
• Once-through cooling – Final Clean Water Act 316(b) rules have determined that closed-cycle cooling is the best technology available, and is likely to require capital improvements or cooling modifications for larger facilities (both coal and nuclear) with once-through cooling systems.
• Coal Combustion Residuals and Effluent Limitation Guidelines – Coal facilities in particular face increasing requirements to manage coal combustion residuals, increased treatment requirements for coal ash, flue gas desulfurization, and metal cleaning wastewater streams, as well as broader considerations for the safety and environmental implications of coal ash storage and disposal.
As environmental pressures increase, the addition of efficient facilities that are able to meet current standards, such as Towantic, becomes increasingly important to system reliability and managing consumer costs.
Concentric Energy Advisors, Inc. | 37

Towantic Energy Center
SECTION 6: ECONOMIC ANALYSIS
oncentric asked Energyzt Advisors, LLC (“Energyzt”) to estimate the potential economic and environmental benefits to the New England region for the first ten years of operation of Towantic beginning in 2018, the anticipated online year for the facility. In order to quantify these benefits, Energyzt developed an analysis that quantifies the benefits of Towantic in terms of wholesale energy prices and reduced emissions in the
New England region. The analysis compares the operation of the ISO-NE system with and without the addition of Towantic over a ten-year period from 2018 to 2028.
ANALYTICAL APPROACH
In New England, generators are dispatched by ISO-NE on a region-wide basis in order to minimize the cost of the generation needed to meet customer demand. Wholesale energy prices generally cover the marginal costs of production (i.e., fuel, variable operation and maintenance, startup costs and the cost of CO2, NOX and SO2 allowances). Prices are set by the last unit dispatched to meet demand, generating profit margin to those units who bid in at lower prices and were dispatched. Adding a less expensive resource into the capacity mix allows lower cost units to set the market clearing price. The difference between the price with and without the more efficient unit reflects the energy price benefit of the new unit.
Furthermore, generating units with higher marginal costs of production also tend to be higher emitters of air pollutants. By pushing the more expensive units to a position where they operate less frequently and a more efficient (i.e., lower emitting) unit operates more frequently, air emissions are reduced. The difference between air emissions with and without the more efficient unit reflects the environmental benefits of the new unit.
The proposed Facility would be a large, efficient plant that would displace older, more expensive, less efficient, and higher emitting coal, oil and gas-fired generation units. In doing so, Towantic would lower wholesale market prices and regional emissions. Quantifying these benefits requires a regional production cost model that can dispatch the system and measure price and emissions with and without Towantic.
To perform this analysis, Energyzt used GE’s Multi-Area Production Simulation production cost model, usually referred to as GE MAPS. GE MAPS is a detailed chronological model that simulates the commitment and dispatch of electricity generation on an hourly basis. GE MAPS was first developed 40 years ago and is widely used as an analytical tool in the electricity industry.
For this analysis, Energyzt represented ISO-NE as a single pool. Imports and exports from or to other pools in the Eastern Interconnect were modeled as hourly flows, based on historical data
C
Concentric Energy Advisors, Inc. | 38

Towantic Energy Center
from 2011 – 2013. This simplification of the Eastern Interconnect is appropriate for this analysis because of the relatively simple interconnections between ISO-NE and surrounding regions.
GE MAPS performs a security constrained least-cost dispatch of the generation system and simulates the hourly operation of individual generating units and power flows across the transmission system. The key assumptions are:
• Supply: Existing generation is modeled at the unit level, based on historical operating characteristics, including capacity, variable operation and maintenance (“O&M”) costs, heat rates, emissions rates and other operating parameters such as minimum up and down times. New generation is based on announced projects that are under construction or, in some cases, permitted. The characteristics of new generation are based on existing units, or expected technologies, as appropriate.
• Fuel Costs: Forecasted fuel prices are represented on a monthly or annual basis and are incorporated into the calculation of the marginal cost of production for each generating unit.
• Emissions Costs: The cost of emissions is incorporated into the marginal cost of production. Forecasted prices for CO2, SO2 and NOx allowances are incorporated into the model as an input which, when combined with assumed emissions rates for each unit, generate a cost per MWh of energy output added to the marginal cost of production.
• Demand: Peak and energy demand forecasts are input into the model on a monthly basis and converted into hourly demand to dispatch supply against load on an hourly basis.
• Delivery: GE MAPS contains a representation of the expected transmission system in the form of a load flow, which incorporates known and expected transmission constraints.
GE MAPS dispatches the system on an hourly basis to optimize supply, taking into account unit constraints and transmission system constraints. From the detailed hourly simulation, emissions, generation and costs can be estimated across the ISO-NE system on a locational marginal pricing basis, consistent with the price setting methodology deployed by ISO-NE. Running the model with and without Towantic provides a measure of the incremental benefits associated with the power plant from both an energy price and emissions perspective, and provides additional insight into system reliability and other benefits generated by the plant.
Concentric Energy Advisors, Inc. | 39

Towantic Energy Center
ASSUMPTIONS
In conducting this analysis, Energyzt relied upon (1) publicly-available energy market data, including the following:
1) Reports issued by ISO-NE and the U.S. Energy Information Administration (“EIA”);
2) Individual power plant information from Ventyx’ Velocity Suite and the ISO-NE report on the results of FCA-8;
3) Fuel price forecasts, primarily from Ventyx based on publicly-available forecasts;
4) Environmental commodity prices and supplemental environmental attribute data from power plant repowering studies and other prior studies; and
5) Confidential operational data for the proposed Towantic unit as provided by CPV.
A more detailed description of key variables are provided below.
Load Growth and Peak Demand Forecasts Energy and peak demand forecasts are based on a combination of NERC data from 2012/2013 and the 2014 ISO-NE CELT Report dated June 4, 2014.
The base case analysis assumed 1,900 MW of passive demand response in 2018, growing to 2,200 MW in 2028, and active demand response of 994 MW in 2018, the latter kept constant through 2028. These assumptions are consistent with the 2014 CELT Report and represent a reasonable projection of the contribution of these resources to the required reserve margin in ISO-NE given historic trends in demand response bidding in the capacity market and the actual availability of active demand response when called upon by the system operator. The projected load growth and peak demand forecasts are shown in Figure 19 and Figure 20 below.
Concentric Energy Advisors, Inc. | 40
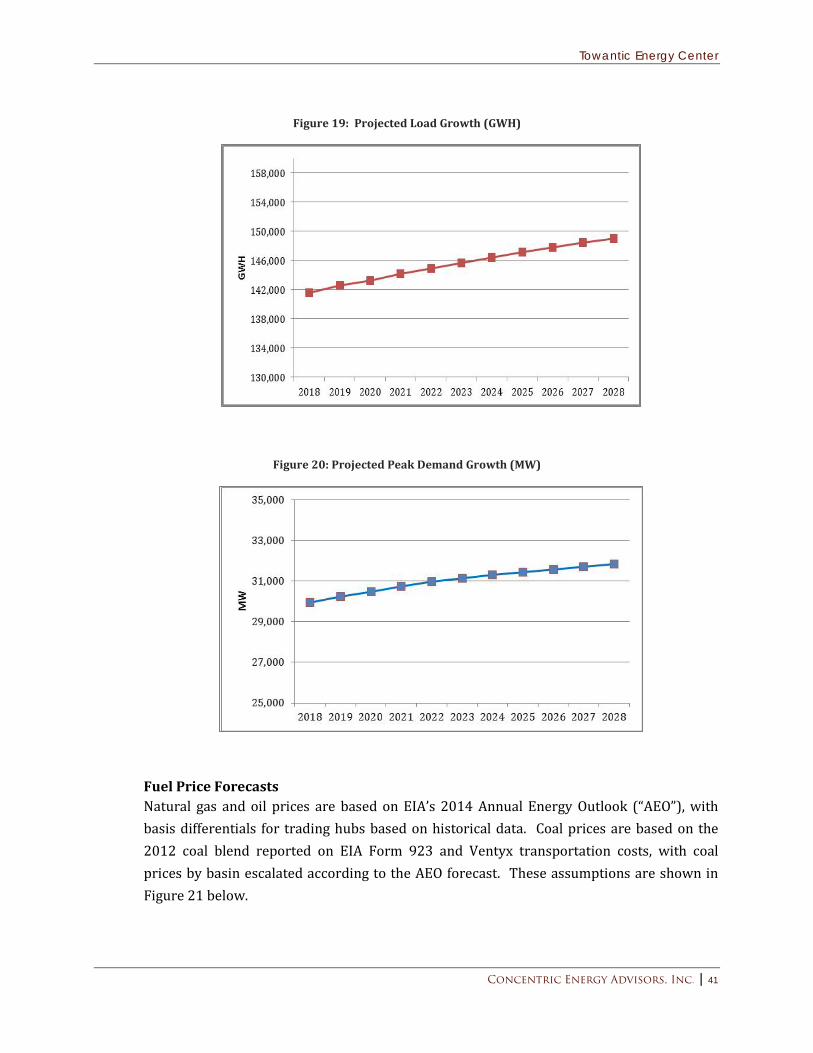
Towantic Energy Center
Figure 19: Projected Load Growth (GWH)
Figure 20: Projected Peak Demand Growth (MW)
Fuel Price Forecasts Natural gas and oil prices are based on EIA’s 2014 Annual Energy Outlook (“AEO”), with basis differentials for trading hubs based on historical data. Coal prices are based on the 2012 coal blend reported on EIA Form 923 and Ventyx transportation costs, with coal prices by basin escalated according to the AEO forecast. These assumptions are shown in Figure 21 below.
Concentric Energy Advisors, Inc. | 41

Towantic Energy Center
Figure 21: Forecasted Fuel Prices
Capacity Additions and Retirements The base case assumes the addition of approximately 1,800 MW of proposed new generation other than Towantic before 2018. The 1,800 MW of generation added prior to 2018 is primarily solar, wind, hydro, and one additional thermal plant, based on units under construction and industry announcements.
In addition, approximately 3,000 MW of new wind units are assumed to be built from 2018 through 2028, based on RPS requirements for New England states. In the same period, new solar, biomass and hydroelectric generating capacity is expected to add an additional 1,800 MW by 2028.
Approximately 4,200 MW of unit retirements are incorporated in the model through the end of 2017, based on retirements that have been announced by ISO-NE and expected retirements listed in Ventyx Velocity Suite forecasts.
This significant level of retirements, combined with load growth over the 2018 to 2028 period, means that additional new thermal generation will be required to maintain adequate generating capacity given the load projections incorporated into the model. To reflect this increase in required resources over time, the base case includes the addition of generic thermal capacity throughout ISO-NE to maintain a 15% reserve margin. This generic generation is primarily required in Massachusetts and Connecticut, reflecting areas of load growth and retirements. An assumed 3,000 MW of thermal capacity is built into the system between 2018 and 2028 to maintain reserve margins as load increases and retirements occur. These generic additions are required to balance the system over time
0.00
5.00
10.00
15.00
20.00
25.00
30.00
35.00
2018 2019 2020 2021 2022 2023 2024 2025 2026 2027 2028
$/m
mBT
U
Gas at HenryHubCoal
FO2OD
Concentric Energy Advisors, Inc. | 42

Towantic Energy Center
consistent with the need for an adequate long-run marginal cost of production to encourage new entry.
The system is balanced to meet reserve margins in the Towantic case, resulting in a tighter market dynamic in the non-Towantic case, in the sense that in the absence of Towantic going ahead, additional capacity would be needed in Connecticut to meet the ISO-NE reserve margin. In a tighter market, supply shortages are likely to occur, leading to increased prices and more frequent calls on demand response.
Imports New England historically has relied on imports from neighboring markets. The model assumes that this reliance will continue. Average historic hourly imports and exports for 2011-2013 by interconnection for peak and off-peak hours are incorporated into the model on a monthly basis.
Emissions Costs Emissions allowance costs for NOx, SO2 and CO2 were based on the Ventyx Northeast Spring 2013 Reference Case. These assumptions are shown in Figure 22 below.
Figure 22: Forecasted Emission Prices
0.0
2.0
4.0
6.0
8.0
10.0
12.0
14.0
16.0
2018 2019 2020 2021 2022 2023 2024 2025 2026 2027 2028
$/to
n
NOX - Ozone
CO2
SO2
Concentric Energy Advisors, Inc. | 43

Towantic Energy Center
Towantic Characteristics Towantic was represented in GE MAPS as a two-unit natural gas combined cycle plant utilizing GE’s 7HA.01 gas turbine technology.41 From information provided by CPV, the base unit capacity was modeled as 781 MW winter, 695 MW summer, with average heat rates of 6,520 BTU/Kwh and 6,620 BTU/Kwh respectively. In addition, Towantic was assumed to have duct-firing capability, adding 53 MW in summer and 32 MW in winter, with an incremental heat rate of 8,224 BTU/Kwh.
RESULTS
As shown in Figure 23 below, Towantic has a high utilization factor throughout the forecast period. This reflects the fact that it is a highly efficient unit capable of starting and shutting down quickly. This stands in contrast to many New England generation facilities that are relatively less efficient and inflexible. The results show that Towantic will operate with a capacity factor of approximately 72% over the forecast period.
Figure 23: Towantic Operations
Note: Towantic begins commercial operation on 76/1/2018, so data for 2018 does not represent a full year.
The addition of Towantic to the supply curve in ISO-NE means that there is approximately 800 MW of additional, relatively low cost generation available throughout the year. As illustrated in Figure 24 below, at a given quantity of consumption, the impact of the addition of a more efficient generating facility such as Towantic into the supply stack will reduce energy prices in two ways: i) the supply stack will increase the relatively flat portion of the supply curve that reflects the marginal cost of the efficient natural gas combined cycle units which will lower the overall marginal cost of production and clearing price during most hours; and ii) during high demand periods, prices will experience more significant decline as the supply curve shifts outwards, displacing the most expensive units.
41 The Towantic plant can operate on ULSD. With the forecast fuel prices in this analysis, this would be unlikely to occur except under extreme conditions which are not modeled in the base case set of assumptions.
2018 2019 2020 2021 2022 2023 2024 2025 2026 2027 2028Generation (GWh) 3,227 5,071 5,087 5,039 4,966 4,976 4,929 4,929 4,896 4,919 4,877Capacity Factor 47.39% 73.65% 73.63% 73.36% 72.15% 72.31% 71.54% 71.54% 71.12% 71.49% 70.71%
Concentric Energy Advisors, Inc. | 44

Towantic Energy Center
Figure 24: Impact of Additional Generating Capacity on the New England Supply Stack
As a result, Towantic has an overall beneficial impact on wholesale energy costs to consumers while increasing reliability. Figure 25 shows the total reduction in energy costs to consumers in ISO-NE in 2018 and over the forecast period due to the addition of Towantic.
Figure 25: Reduction in Wholesale Costs of Energy to Consumers
Without Towantic
($M)
With Towantic
($M)Benefit
($M)2018 10,358$ 9,901$ 458$ 2019 10,105$ 9,824$ 281$ 2020 10,042$ 9,470$ 572$ 2021 10,581$ 10,073$ 507$ 2022 10,662$ 10,284$ 378$ 2023 10,936$ 10,514$ 422$ 2024 11,251$ 10,851$ 400$ 2025 11,638$ 11,266$ 372$ 2026 11,955$ 11,711$ 244$ 2027 12,457$ 12,126$ 331$ 2028 12,547$ 12,222$ 325$
Wholesale Energy Market Costs
Supply curve with new unit Supply curve without new unit
Concentric Energy Advisors, Inc. | 45

Towantic Energy Center
ENVIRONMENTAL BENEFITS
The analysis also quantified environmental benefits to the region from the addition of Towantic due to the avoided regional air pollutant emissions from older generators displaced by generation from Towantic.
The environmental benefits of Towantic were estimated by comparing air emissions generated by dispatch of generating units in the system with and without Towantic. As part of the simulations, the CO2, NOX and SO2 emissions from each unit were estimated based on historical emissions data, taking into account any pollution control technology fitted to the units. These emissions were summed for each year across the region in each case.
RESULTS
The addition of Towantic to the New England resource base displaces generation from other electric generation facilities that have higher emissions per MWh. Consequently, Towantic has an overall beneficial impact on regional air quality. Figure 26 shows the regional effect for the relevant air pollutants.
Figure 26: Reduction in Regional Air Emissions
COMPARISON OF RESULTS TO OTHER STUDIES
Other studies have been performed in New England that assess the impact of additional capacity in the region. Specifically, studies were conducted in 2010 and 2012 to assess the impact of the import of 1,200 MW of large-scale hydroelectric capacity from Quebec into New England and the addition of generating capacity from Footprint Power in Massachusetts. When reviewing the results of these studies in comparison to the Towantic estimates, it is important to understand differences between the underlying assumptions contained in those studies compared to where the regional wholesale market is today and is anticipated to be in the future. In 2010, the wholesale market was projected to have adequate reserve margins to meet forecasted load throughout the entire forecast period. In 2012, projected reserves had fallen, indicating a
CO2 SO2 NOXTons/yr Tons/yr Tons/yr
Without Towantic2018 34,081,270 16,812 7,047 2020 33,837,885 14,432 6,495
With Towantic2018 33,810,816 16,396 6,581 2020 33,369,264 11,965 5,693
Difference2018 (270,454) (416) (466) 2020 (468,621) (2,466) (802)
Concentric Energy Advisors, Inc. | 46

Towantic Energy Center
shortfall by 2018. The most recent projections in 2014 indicate even lower reserve margins than what was projected in 2012. The difference in these projections is shown in Figure 27 below.
Figure 27: ISO-NE Projected Reserve Margin
Changing views of the wholesale market in 2010, 2012, and 2014 is reflected in the assumptions used in each of these studies and rationalizes the disparity between the results of those studies and the results achieved in this analysis.
In addition, it is important to note that in the Towantic analysis, the resources replacing retired generating units include a significant amount of renewable resource capacity. Renewable resources contribute a fraction of the energy to the system compared to the energy contributed by the retired units, which are traditionally baseload units that operate at high capacity factors. In a system with higher renewable resource integration, Towantic realizes greater benefits because it adds flexible, baseload capacity to the system that needs such flexibility to operate in conjunction with less flexible resources.
A comparison of the study assumptions is summarized in Figure 28 below.
Target Reserve Margin
Concentric Energy Advisors, Inc. | 47

Towantic Energy Center
Figure 28: Comparison of Study Assumptions
TOWANTIC (AUG/2014)
FOOTPRINT (NOV/2012)
NORTHERN PASS (DEC/2010)
Gas Price Henry Hub ($/mmbtu) $5.27 (2018$) $4.00 (2011$) $6.46 (2009$)
Resource Additions (2018 MW) 3,546 1,700 4,963
Resource Retirements (2018 MW) 4,171 1,800 271
2018 Peak Demand Summer (MW) 29,937 27,973 29,271
2018 Energy Load (GWh) 141,559 141,953 134,032
Starting Resource Base (2018 MW)
29,404 Gen 2,594 demand
response 1,942 Imports
29,100 Gen1 4,301 demand
reponse1 95 Imports1
32,208 Gen2
2,898 demand reponse2 6 Imports2
1 - Assumed source = 2012 CELT report since not specified in report. Imports represent long-term contracts only. 2 - Assumed source = 2010 CELT report since not specified in report. Imports represent long-term contracts only.
In the context of these differing study assumptions, the Towantic results are reasonable and consistent with prior studies. The benefits of adding Towantic using current assumptions are higher than the 2012 Footprint study because gas prices are higher, peak demand is higher and net resource additions are higher. Although gas prices are lower than in the 2010 Northern Pass study, the supply/demand balance is much tighter in the Towantic analysis than the projections of continuing excess supply that served as the underlying assumptions in 2010 when environmental regulations had not passed, gas prices had not fallen, and the significant number of plant retirements that have been announced were not anticipated. In sum, the New England market projects very tight reserve margins and a desperate need for new generation. Towantic meets that need with a lower cost, state-of-the-art, and cleaner generating resource.
Concentric Energy Advisors, Inc. | 48

Towantic Energy Center
SECTION 7: CONCLUSION
he addition of Towantic will have a pronounced and lasting effect on the New England Power market. The addition of almost 800 MW of needed capacity creates several important benefits. Towantic will reduce wholesale power costs to consumers and produce
over $450 million in customer benefits in 2018. Customers will continue to benefit from lower wholesale power costs over the ten year forecast period.
Furthermore, the addition of almost 800 MW of clean burning generating capacity will reduce air emissions in the New England region by displacing generation from other power plants with lower efficiency and higher emissions rates, which are primarily fueled by oil, coal and less efficient gas-fired units.
In addition, over 3,200 MW of generating capacity has announced its retirement and several thousand more megawatts of capacity are at risk of retirement. The removal of this amount of capacity will shift the dispatch of resources in the region such that at times of peak demand and system stress, less efficient, higher emitting generation will need to run in order to meet system demands. The addition of almost 800 MW of clean, efficient generating capacity like Towantic will displace a portion of this oil-fired generation and will lower emissions across the region in addition to providing much needed capacity that is critical to meeting ISO-NE projected reserve margin shortages and ensuring the reliability of supply to consumers.
At a time when the wholesale markets in New England are undergoing important transformations, Towantic will contribute to meeting the existing and future needs of the markets and consumers. Changes to the capacity market are designed to incent more reliable generation. Changes to the region’s supply portfolio driven largely by environmental and public policy mandates are resulting in increased amounts of intermittent resources and the need for more flexible generation. Towantic will enhance reliability by providing efficient, reliable and flexible generation to support the evolving needs of the bulk power system while lowering regional emissions and customer costs.
T
Concentric Energy Advisors, Inc. | 49
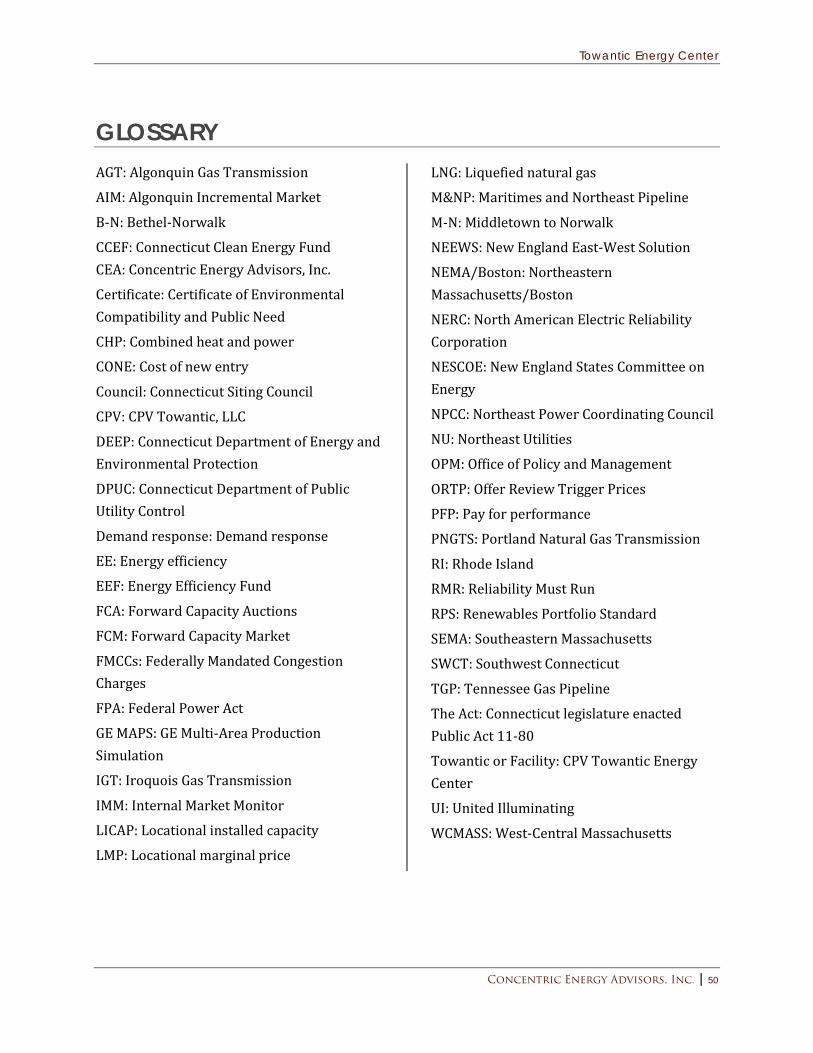
Towantic Energy Center
GLOSSARY AGT: Algonquin Gas Transmission
AIM: Algonquin Incremental Market
B-N: Bethel-Norwalk
CCEF: Connecticut Clean Energy Fund CEA: Concentric Energy Advisors, Inc.
Certificate: Certificate of Environmental Compatibility and Public Need
CHP: Combined heat and power
CONE: Cost of new entry
Council: Connecticut Siting Council
CPV: CPV Towantic, LLC
DEEP: Connecticut Department of Energy and Environmental Protection
DPUC: Connecticut Department of Public Utility Control
Demand response: Demand response
EE: Energy efficiency
EEF: Energy Efficiency Fund
FCA: Forward Capacity Auctions
FCM: Forward Capacity Market
FMCCs: Federally Mandated Congestion Charges
FPA: Federal Power Act
GE MAPS: GE Multi-Area Production Simulation
IGT: Iroquois Gas Transmission
IMM: Internal Market Monitor
LICAP: Locational installed capacity
LMP: Locational marginal price
LNG: Liquefied natural gas
M&NP: Maritimes and Northeast Pipeline
M-N: Middletown to Norwalk
NEEWS: New England East-West Solution
NEMA/Boston: Northeastern Massachusetts/Boston
NERC: North American Electric Reliability Corporation
NESCOE: New England States Committee on Energy
NPCC: Northeast Power Coordinating Council
NU: Northeast Utilities
OPM: Office of Policy and Management
ORTP: Offer Review Trigger Prices
PFP: Pay for performance
PNGTS: Portland Natural Gas Transmission
RI: Rhode Island
RMR: Reliability Must Run
RPS: Renewables Portfolio Standard
SEMA: Southeastern Massachusetts
SWCT: Southwest Connecticut
TGP: Tennessee Gas Pipeline
The Act: Connecticut legislature enacted Public Act 11-80
Towantic or Facility: CPV Towantic Energy Center
UI: United Illuminating
WCMASS: West-Central Massachusetts
Concentric Energy Advisors, Inc. | 50