
New Developments in Single-Family Finance 2014 · PDF fileNew Developments in Single-Family...
12
Mike Awadis Senior Vice President 1620 26th Street, Suite 230 South Santa Monica, CA 90404 Phone: 310.401.8060 Email: [email protected] New Developments in Single-Family Finance 2014 NALHFA Annual Education Conference Atlanta, Georgia
-
Upload
nguyendien -
Category
Documents
-
view
215 -
download
0
Transcript of New Developments in Single-Family Finance 2014 · PDF fileNew Developments in Single-Family...

Mike Awadis Senior Vice President 1620 26th Street, Suite 230 South Santa Monica, CA 90404 Phone: 310.401.8060 Email: [email protected]
New Developments in Single-Family Finance
2014 NALHFA Annual Education Conference
Atlanta, Georgia

Disclaimer
2
This presentation is intended for educational and informational purposes only and does not constitute legal or investment advice, nor is it an offer or a solicitation of an offer to buy or sell any investment or other specific product. Information provided in this presentation was obtained from sources that are believed to be reliable; however, it is not guaranteed to be correct, complete, or current, and is not intended to imply or establish standards of care applicable to any attorney or advisor in any particular circumstances. The statements within constitute FirstSouthwest’s views as of the date of the report and are subject to change without notice. This presentation represents historical information only and is not an indication of future performance.

3
TBA Program Benefits When Compared to MRB • Provides a forward commitment mortgage program with no costs of issuance,
negative arbitrage and legal expenses • Produces a significantly lower mortgage rate when compared with Pass-Thru and
traditional MRB structures – including using zeros • Fund down payment and closing cost assistance without using HFA funds • Flexibility to adjust rates as the market moves -- no yield implications • Affords HFAs the option to pay higher lender compensation • Can be used to provide financing for non-first time homebuyers • Program is more lender friendly -- less paperwork for the lender • Can be combined with MCCs thus creating a lower effective mortgage rate • Gives HFAs the option of offering refinances • Significantly more profitable for HFAs than tradition MRBs and Pass-Thru structures
both on present value and ongoing basis • It can be used as a tool to accumulate MBS for future bond transactions
• Either “Pass-thru” or “Traditional MRB” structures • HFA has the option to repurchase its MBS at prevailing TBA levels
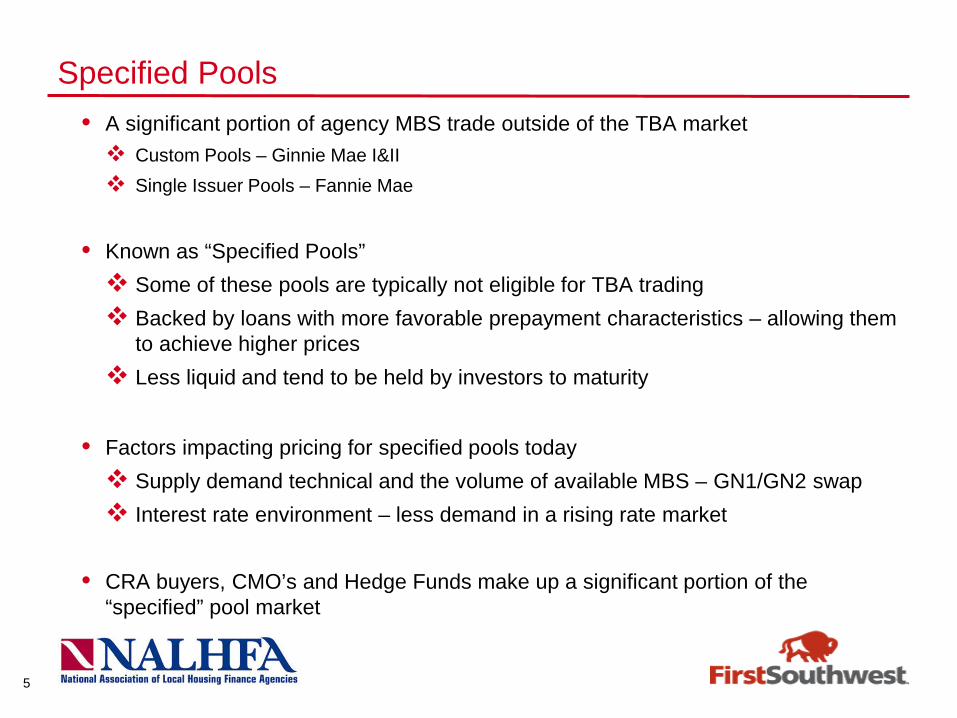
Specified Pools • A significant portion of agency MBS trade outside of the TBA market Custom Pools – Ginnie Mae I&II Single Issuer Pools – Fannie Mae
• Known as “Specified Pools” Some of these pools are typically not eligible for TBA trading Backed by loans with more favorable prepayment characteristics – allowing them
to achieve higher prices Less liquid and tend to be held by investors to maturity
• Factors impacting pricing for specified pools today Supply demand technical and the volume of available MBS – GN1/GN2 swap Interest rate environment – less demand in a rising rate market
• CRA buyers, CMO’s and Hedge Funds make up a significant portion of the “specified” pool market
5
7
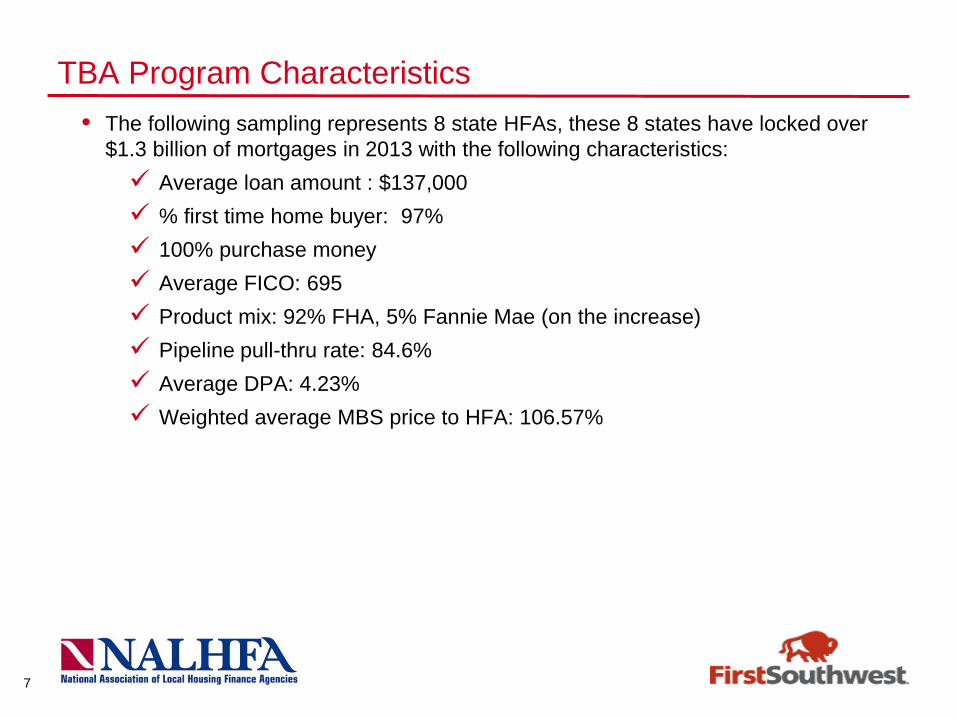
TBA Program Characteristics • The following sampling represents 8 state HFAs, these 8 states have locked over
$1.3 billion of mortgages in 2013 with the following characteristics: Average loan amount : $137,000 % first time home buyer: 97% 100% purchase money Average FICO: 695 Product mix: 92% FHA, 5% Fannie Mae (on the increase) Pipeline pull-thru rate: 84.6% Average DPA: 4.23% Weighted average MBS price to HFA: 106.57%
8
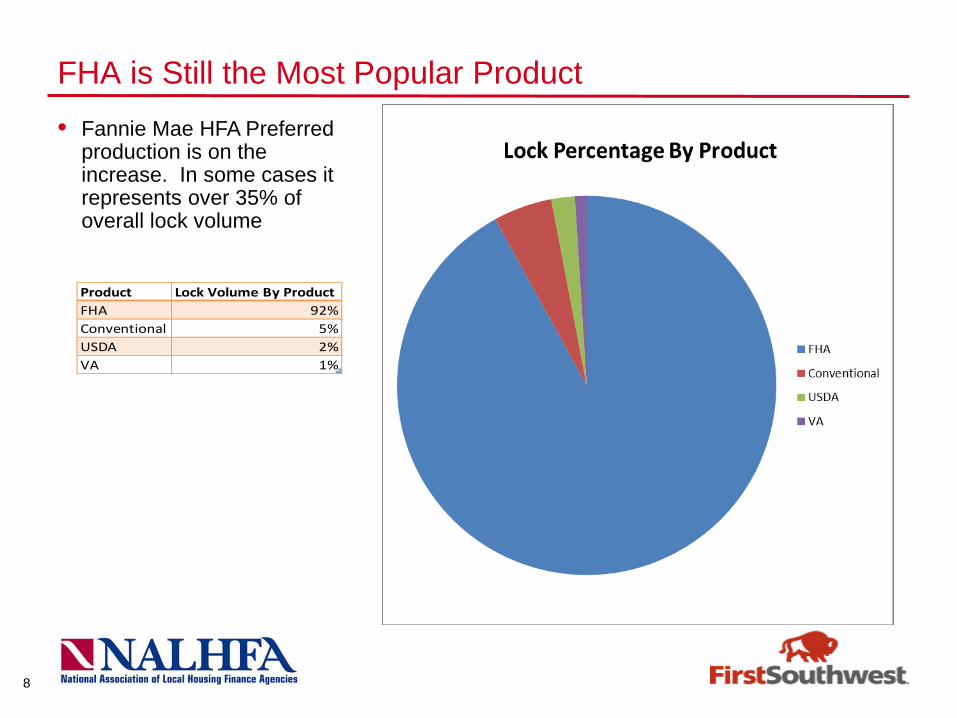
FHA is Still the Most Popular Product
Product Lock Volume By ProductFHA 92%Conventional 5%USDA 2%VA 1%
• Fannie Mae HFA Preferred production is on the increase. In some cases it represents over 35% of overall lock volume
9
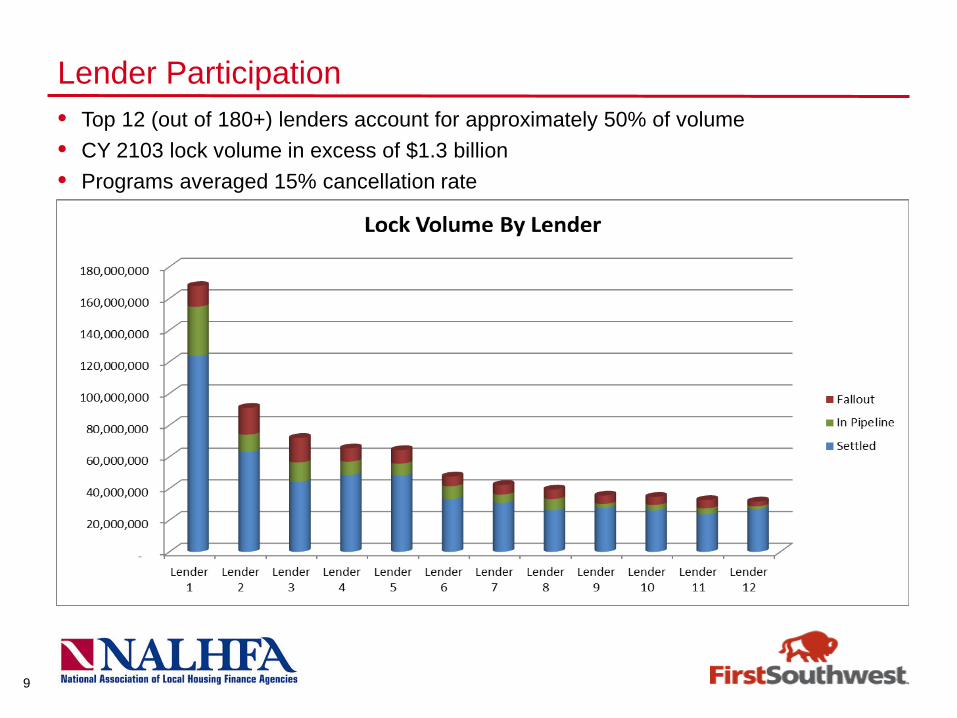
Lender Participation • Top 12 (out of 180+) lenders account for approximately 50% of volume • CY 2103 lock volume in excess of $1.3 billion • Programs averaged 15% cancellation rate
10
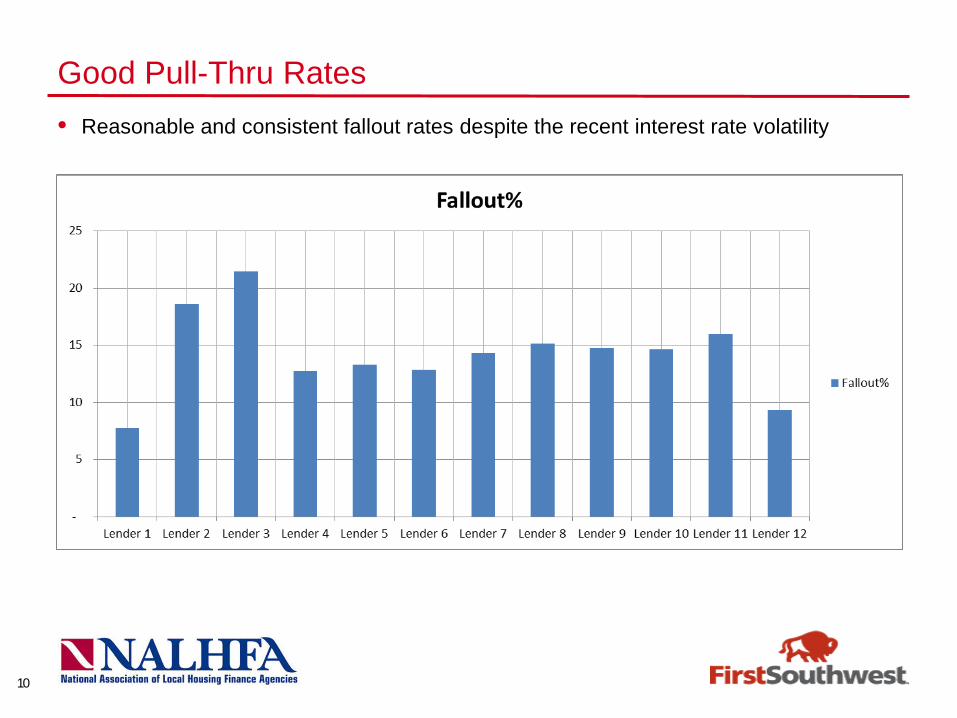
Good Pull-Thru Rates • Reasonable and consistent fallout rates despite the recent interest rate volatility
11
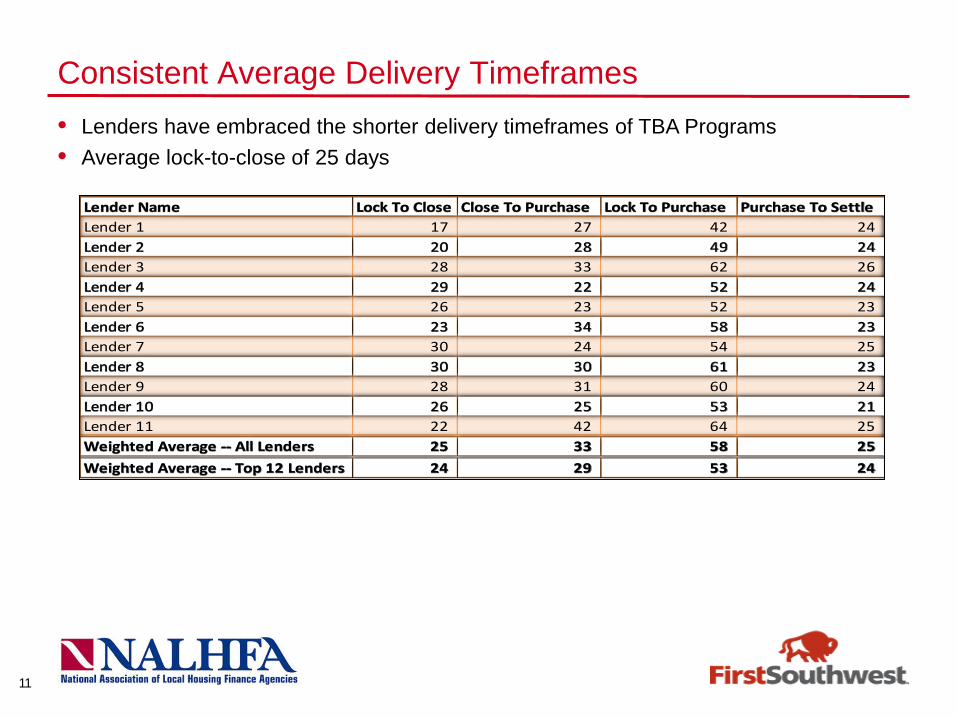
Consistent Average Delivery Timeframes
Lender Name Lock To Close Close To Purchase Lock To Purchase Purchase To Settle Lender 1 17 27 42 24 Lender 2 20 28 49 24 Lender 3 28 33 62 26 Lender 4 29 22 52 24 Lender 5 26 23 52 23 Lender 6 23 34 58 23 Lender 7 30 24 54 25 Lender 8 30 30 61 23 Lender 9 28 31 60 24 Lender 10 26 25 53 21 Lender 11 22 42 64 25 Weighted Average -- All Lenders 25 33 58 25 Weighted Average -- Top 12 Lenders 24 29 53 24
• Lenders have embraced the shorter delivery timeframes of TBA Programs • Average lock-to-close of 25 days

12
Best Practices – What Have We Learned • Keeping it simple is very effective – it’s ok to have fewer rate options • The primary driver of TBA volume is still the need for DPA • Statistics show the DPA does not have to be a grant to have a successful program
• Jr lien DPA can be a significant source of residual income for HFA • Manage your pull-thru rate by optimizing lock terms
• Don’t give lenders more time than they need to close and sell the loans • Managing delivery timeframes will keep your rate more competitive vs market
• Make your program as lender friendly as possible – eliminate all unnecessary forms • You can always add your bond forms when you start doing bonds again
• Marketing, marketing, marketing – online, newsletters (realtors and lenders) • Develop a robust email marketing campaign
• If and when Fannie Mae execution becomes available, include it in your product offering – HFA Advantage is the only viable 97% LTV product on the street
• Rate does matter – keep interest spreads tight with market • Maintain flexibility in your gain-on-sale margins