New Developments from NDNQI®
54
New Developments New Developments f NDNQI® f NDNQI® from NDNQI® from NDNQI® Nancy Dunton PhD Nancy Dunton, PhD & Jennifer Duncan PhD RN Jennifer Duncan, PhD, RN 4 th Annual NDNQI Conference 4 Annual NDNQI Conference New Orleans, LA January 22, 2010 January 22, 2010
Transcript of New Developments from NDNQI®

New DevelopmentsNew Developmentsf NDNQI®f NDNQI®from NDNQI®from NDNQI®Nancy Dunton PhDNancy Dunton, PhD
&Jennifer Duncan PhD RNJennifer Duncan, PhD, RN
4th Annual NDNQI Conference4 Annual NDNQI ConferenceNew Orleans, LA
January 22, 2010January 22, 2010
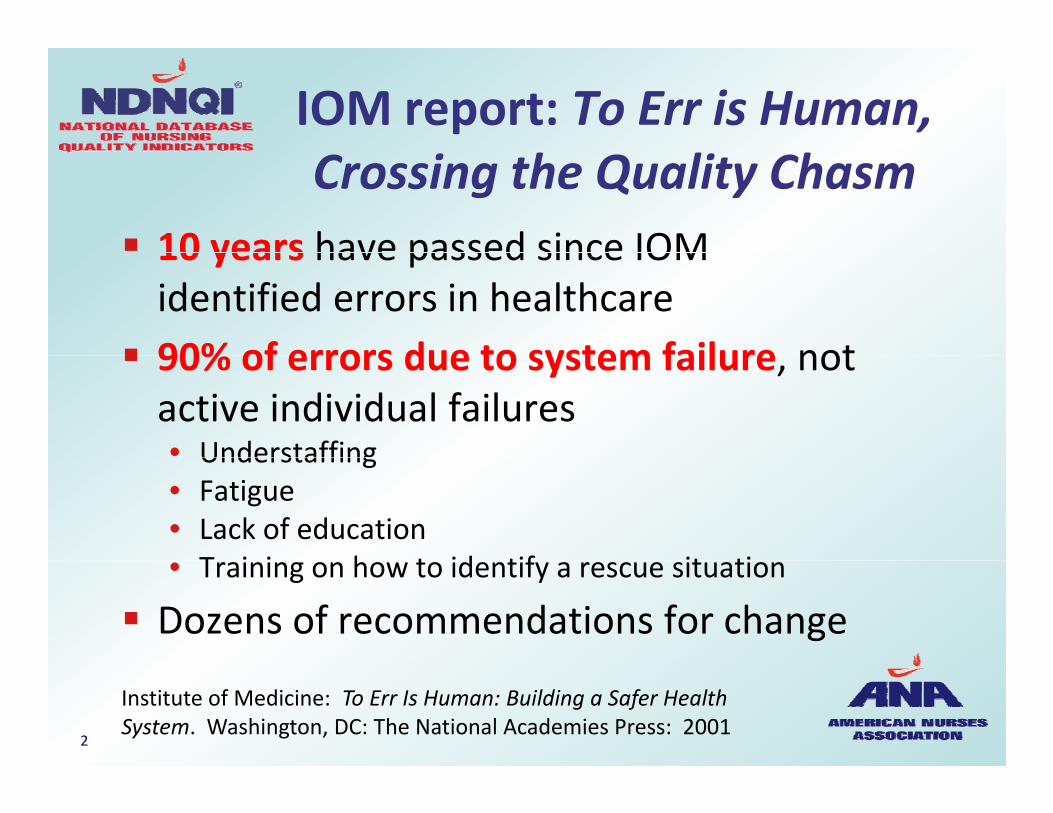
IOM report: To Err is Human,Crossing the Quality Chasm
10 years have passed since IOM10 years have passed since IOM identified errors in healthcare 90% of errors due to system failure not 90% of errors due to system failure, not active individual failures• UnderstaffingUnderstaffing• Fatigue• Lack of educationT i i h t id tif it ti• Training on how to identify a rescue situation
Dozens of recommendations for change
Institute of Medicine: To Err Is Human: Building a Safer Health System. Washington, DC: The National Academies Press: 2001
2
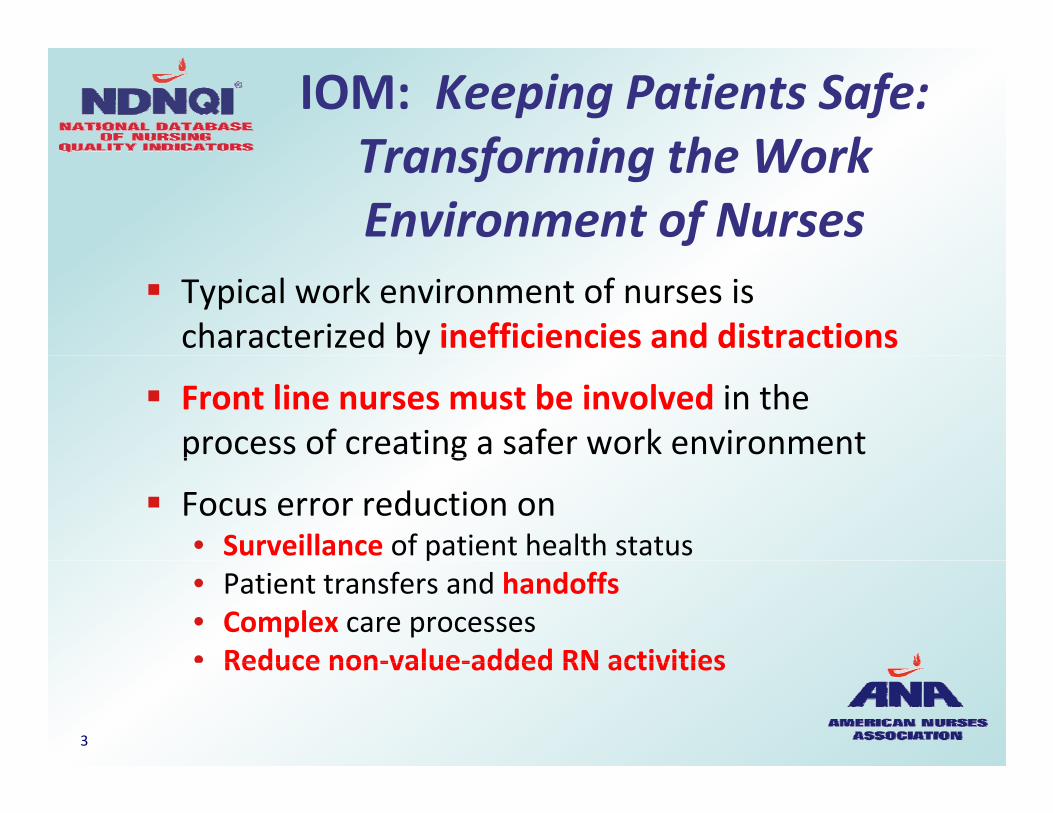
IOM: Keeping Patients Safe: Transforming the WorkTransforming the Work Environment of Nurses
Typical work environment of nurses is characterized by inefficiencies and distractions
Front line nurses must be involved in the process of creating a safer work environmentp g
Focus error reduction on• Surveillance of patient health statusp• Patient transfers and handoffs• Complex care processes• Reduce non‐value‐added RN activitiesReduce non‐value‐added RN activities
3

Policy Responsesto IOM Reportsto IOM Reports
Define and Collect Quality Indicators
Public Reporting Financial IncentivesFinancial Incentives
• Pay for performance, e.g., Leapfrog• Nonpayment for poor performance, e.g.,Nonpayment for poor performance, e.g., CMS
CMS 2010 IPPS Rule• Participating in nursing quality registry
4

Nursing Quality InitiativesNursing Quality Initiatives
ANA’s Quality & Safety Initiative ‐ NDNQI®
ANCC’s Magnet® program
b d h ’ di i li Robert Wood Johnson’s Interdisciplinary Nursing Quality Research Initiative (INQRI)
National Quality Forum (NQF) nursing‐sensitive measuressensitive measures
National Priority Partners (NPP)
5

Has Quality Improved?Has Quality Improved?
To Err is Human (1999): It would be irresponsible to have less than a 50% reduction in error rates within 5 years
After 10 years patient safety is declining!• AHRQ National Healthcare Quality Report found• AHRQ National Healthcare Quality Report found
o ‐0.9% annual decline in patient safety measures
http://www.ahrq.gov/qual/nhqr08/Key.htm
6

Consumer Reports (2009)p ( )To Err is Human—To Delay is Deadly
P b bl till 100 000 li l t Probably still 100,000 lives lost every year due to medical errors
Recommendations• Mandatory, validated public reporting to create external pressure for change
• MDs and RNs should be required to demonstrate continuing competency and knowledge of patient safety practices
7

Has Nursing Quality Improved in NDNQI Hospitals?
C ti l i d t f Cross‐sectional comparison data from quarterly reports.
13 quarters: 2Q06 through 2Q09o 13 quarters: 2Q06 through 2Q09
o Selected unit types, where adverse outcome were common
Results validated using longitudinalanalysis following units in hospitals thatanalysis, following units in hospitals that were participating in 1Q06
o Adjusting for drop outs in longitudinal analysis j g p g ydidn’t affect results
8

Results Overview Some NDNQI outcome rates have improved over past three years, such asimproved over past three years, such as • Hospital Acquired Pressure Ulcer Rates for critical care and medical unitsI j F ll R t f h b d di l it• Injury Fall Rates for rehab and medical units
• Injury assault rates for adult psych units
No meaningful improvement or worse No meaningful improvement or worse rates for other outcomes, such as• Fall Rates for rehab and medical units• Fall Rates for rehab and medical units• Mean # of pain assessments/patient for peds units
o Perhaps in compliance with unit, hospital, or national d dstandards
9

Median Hospital Acquired lPressure Ulcer Rates
9 00
10.00
7.00
8.00
9.00
4.00
5.00
6.00
CC Units
Medical Units
1 00
2.00
3.00Medical Units
0.00
1.00
10

Median Fall RatesMedian Fall Rates
8.00
6.00
7.00
4.00
5.00
Rehab Units
2.00
3.00 Medical Units
0.00
1.00
11

Median Injury Fall RatesMedian Injury Fall Rates1.40
1.00
1.20
0.60
0.80
Rehab Units
0.40Medical Units
0.00
0.20
12

Trends in Mean* Nosocomial Infection Rates, Critical Care Units
4 50
3.50
4.00
4.50
2.00
2.50
3.00
VAP
CAUTI
0 50
1.00
1.50CAUTI
CLABSI
0.00
0.50
Q407Q108Q208Q308Q408Q109Q209Q407Q108Q208Q308Q408Q109Q209
*Medians all 0.0013

Trends in Median Rates# f P di t i P i A t# of Pediatric Pain Assessments
9.00
6 00
7.00
8.00
4.00
5.00
6.00
Ped‐Med
Ped‐Surg
1 00
2.00
3.00Ped Surg
Ped‐Med‐Surg
0.00
1.00
14

Trends in Mean*Injury Assault RatesInjury Assault Rates
3.00
2.00
2.50
1.50
2.00
C/A Psych
GeriPsych
0.50
1.00GeriPsych
Adult Psych
0.00
0.50
15*Medians all 0.00

Length of Time in NDNQIRelated to Some Outcomes
Lower Unit Acquired Pressure Ulcers• All adult unit types
• Low correlations range from ‐0.06 to ‐0.19
Lower Injury Fall Rates Lower Injury Fall Rates• All unit types, but significant only for Rehab
l• Low correlation = ‐0.17
16

You Can Celebrate Progressin Some Areas,
But more can be done!be done!
17

Moving ForwardMoving Forward
How do we make use of NDNQI quality How do we make use of NDNQI quality indicators?
How do we involve staff?
d ll i ? How do we actually improve?
18

Use your data…we’ll helpUse your data…we ll help
Your organization invests resources in measuring nursing quality
NDNQI invests resources in publishing comparative reports
New online education to help youNew online education to help you make the most of your investment!
19

New Online Education

Module 1: Managing Reports
Download and distribute NDNQI reports to build organization‐wide support for QI
21
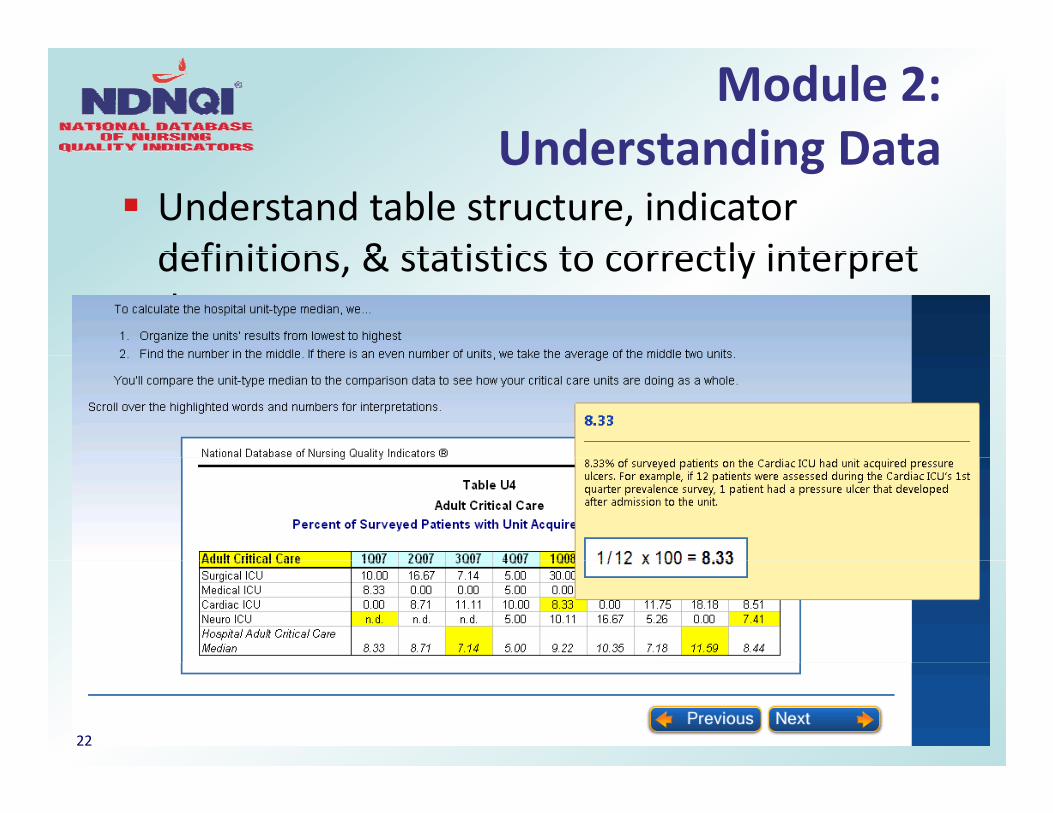
Module 2: Understanding DataUnderstanding Data
Understand table structure, indicator definitions & statistics to correctly interpretdefinitions, & statistics to correctly interpret data
22

Module 3:A i Q lit Q tiAnswering Quality Questions
23
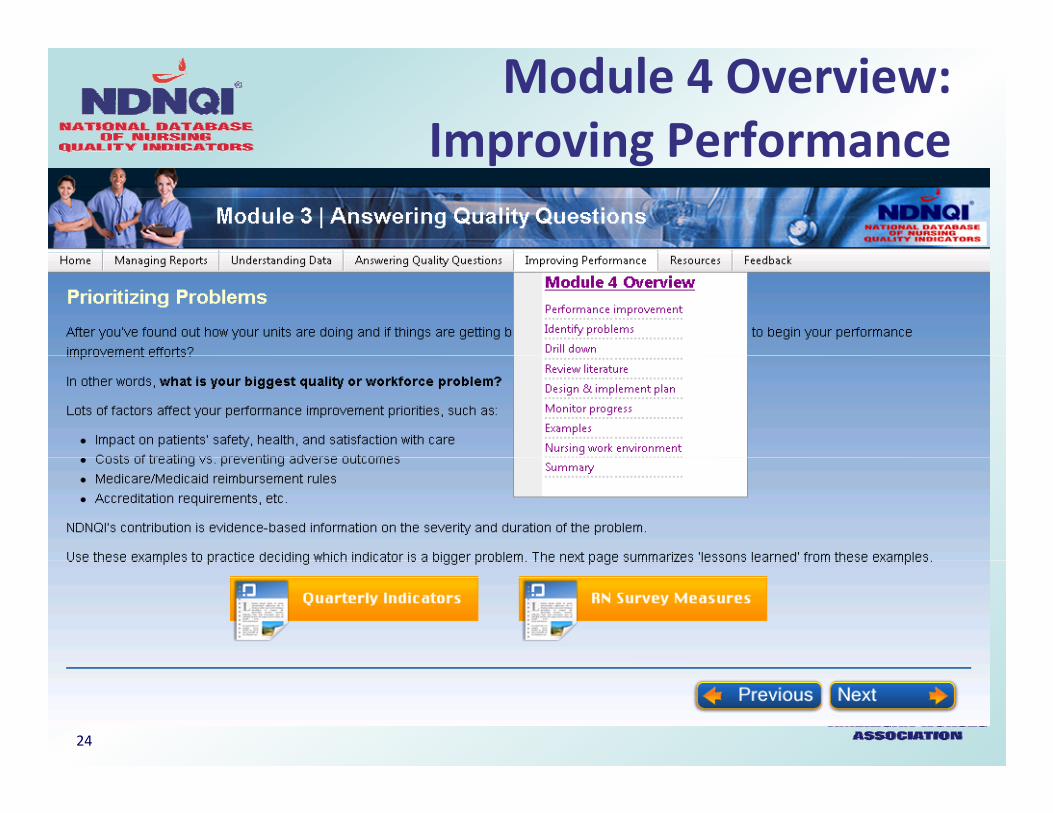
Module 4 Overview:Improving PerformanceImproving Performance
24

Using NDNQI Reports EducationAvailable Today!Available Today!
Must be an authorized NDNQI “ ”NDNQI “user”
Sign in to NDNQI b itwebsite
Click on a new button: “Learning Center”Learning Center
Then click on “Interpreting andInterpreting and Using Your NDNQI Reports”p
25

Noteworthy FeaturesNoteworthy Features Not required, like NDNQI tutorials
f May need to add to your list of authorized NDNQI users
S ifi ll f NDNQI t C ti i Specifically for NDNQI reports, so Continuing Education credits not available
Interactive rollovers links exercises with Interactive: rollovers, links, exercises with feedback• No testsNo tests
4 modules: total time to complete is ~ 4 hours
26

NDNQI Data AreTh St ti P i tThe Starting Point
Identify problem areas Identify problem areas
Explore possible causesp p
Monitor the effects of your improvement plan
27
Identify ProblemsIdentify Problems
How does our unit’s data compare to the ppercentiles?
Wh d h b i ’ i What does that say about our unit’s nursing quality?
Is our unit in the bottom 25% of peers?
Sh ld h b l f h Should there be zero tolerance for the outcome?
28

Drill DownDrill Down How can we gain a better understanding of the problem and its causes?the problem and its causes?
What additional data do we need to collect?
Look at multiple sources of information:Look at multiple sources of information:• Other NDNQI data(e.g., staffing & RN Survey)
• Patient satisfaction surveysPatient satisfaction surveys
• Patients’ medical records
• Staff nurses’ input• Staff nurses input
29
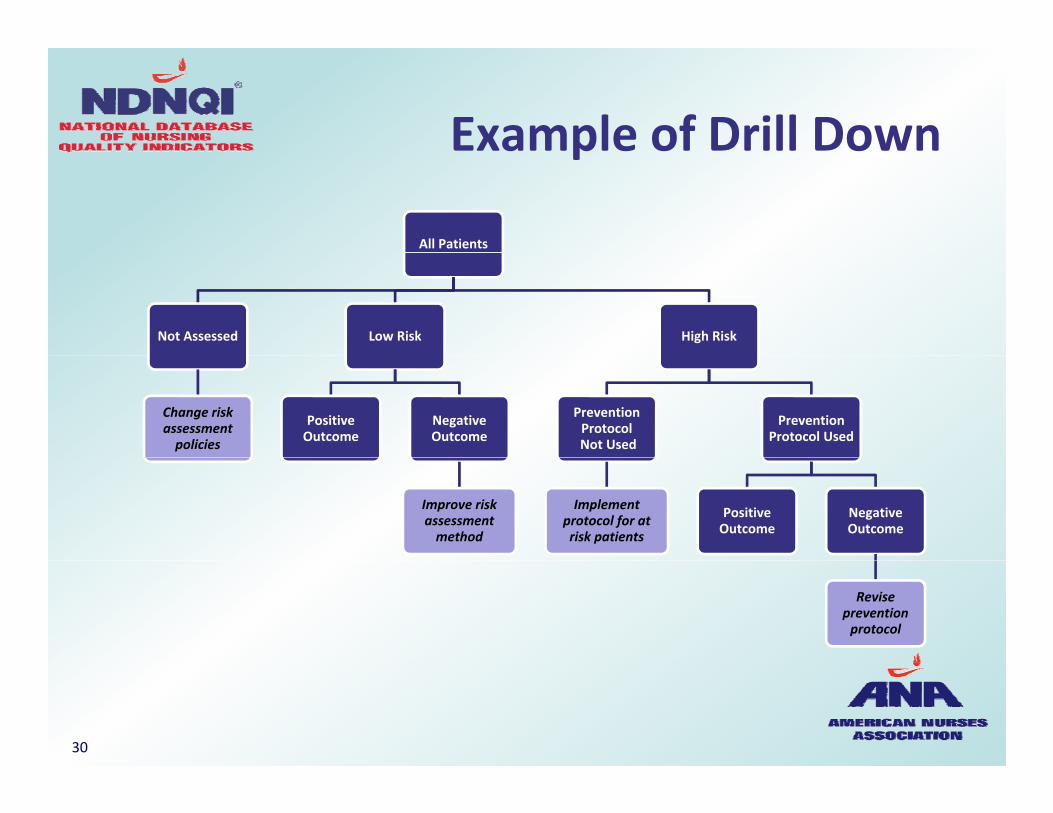
Example of Drill DownExample of Drill Down
All Patients
High RiskLow RiskNot Assessed
Prevention Protocol Used
Prevention Protocol Not Used
Negative Outcome
Positive Outcome
Change risk assessment policies
Negative Outcome
Positive Outcome
Implement protocol for at risk patients
Improve risk assessment method
Revise prevention protocol
30

Could the Fall PreventionProcess Be Improved?Process Be Improved?
Total FallsTotal Falls
i i k i i kPrior Risk Assessment
83.9%
No Prior Risk Assessment
16.1%
At Risk
79.1%
Not at Risk
20.9%9 %
Protocol in Place
No Protocol i Pl
0 9%
Place
91.7%in Place
8.3%
31

Could Pressure UlcerPrevention Be Improved?Prevention Be Improved?Patients with
UAPU
Admission Risk Assessment
83.8%
No Admission Risk
Assessment
16 2%
At Risk
90 9%
Not at Risk
9 1%
16.2%
90.9%
Prevention Protocol
9.1%
in Place
95.9%32

Follow‐up Questions From Drill Down
1 What is preventing risk assessments?1. What is preventing risk assessments?
2. Is risk assessment tool effective?
3. Does prevention program work?
33

Next Step:R i Lit tReview Literature
What is known that What is known that can help you improve your outcome?your outcome?
• Staffing situations• Nursing processes• Nursing work environmentg
34

Nursing Structure
Staffing Situationsg Nursing Hours per
Patient Day O t
Skill Mix % Agency Staff
Outcome Falls - medical unit
RN Education RN Certification Years of Experience
35

Nursing Processesg
Risk assessmentRisk assessment• Frequency• Recentness
Evidence‐based Evidence‐based prevention protocols
36

Improving the NursingW k E i tWork Environment
37

Useful Resources
Research on nursingResearch on nursing workforce and patient outcomespatient outcomes
Evidence‐based tipractice
Implementing organizational change
38

NDNQI MonographsNDNQI Monographs
Chapters written byChapters written by hospitals with sustainedsustained improvement
• Case studies of the• Case studies of the QI process
39

Monograph LessonsMonograph Lessons
NDNQI reports triggered inquiryNDNQI reports triggered inquiry
Drilled down, sometimes with special data collection, to define problem and develop solutions
Used literature and EBP to design intervention
Organizational change requires leadership, budget, & persistence
40

To Obtain MonographsTo Obtain Monographs Available through http://nursingworld org/books/http://nursingworld.org/books/
• Transforming Nursing Data Into Quality Care: P fil f Q lit I t i U S H lthProfiles of Quality Improvement in U.S. Healthcare Facilities
• Sustained Improvement in Nursing Quality: Hospital p g Q y pPerformance on NDNQI Indicators, 2007‐2008
41

Design & Implement Plang p
What evidence‐based strategies will we adopt?
How can we foster the commitment and persistence needed to create positive change?• Administratorsmake safety a top priority
• Identify and obtain resources
• Assign accountability
• Identify change CHAMPIONS for each unit
• Roll out intervention• Persistent COMMUNICATION & EDUCATION
42

Monitor ProgressMonitor Progress
Have we reached ourHave we reached our goals?
What do we need to What do we need to continue or change to see sustainedsee sustained improvement?
43

Spiral of ImprovementSpiral of Improvement Persistence & time
Adjustments to original improvement plan
Continual evaluation of actual vs. desired fperformance
Upward Spiral of ImprovementImprovement
44

Keys to Successy
45

Research on Safety Sensitive IndustriesSafety‐Sensitive Industries
Multiple , independent strategies have to be p p gbrought to bear in order to ensure consistently positive outcomes
Transformational leadership needed
Implement a lt re of safet Implement a culture of safety• Every point of care staff person becomes a change agentagent
Hinshaw AS. Keeping patients safe: A collaboration among nurses administrators and researchers. Nurse Admin Q, 2006. 30(4):309‐320
46

Critical Drivers ofS t i d S t ChSustained System Change
1. Pressure to transform is sustained, often from1. Pressure to transform is sustained, often from outside the organization
2. Leadership for change begins at the top, but p g g p,involves all levels of the organization
3. Actively engage staff in meaningful problem y g g g psolving
4. Goals and resources aligned top to bottom of organization to support change (Accountability)
5. Integration across organizational units
Lukas C, et al. Transformational change in health care systems: An organizational model. Health Care Management Rev, 2007, 32(4) 309‐320.
47
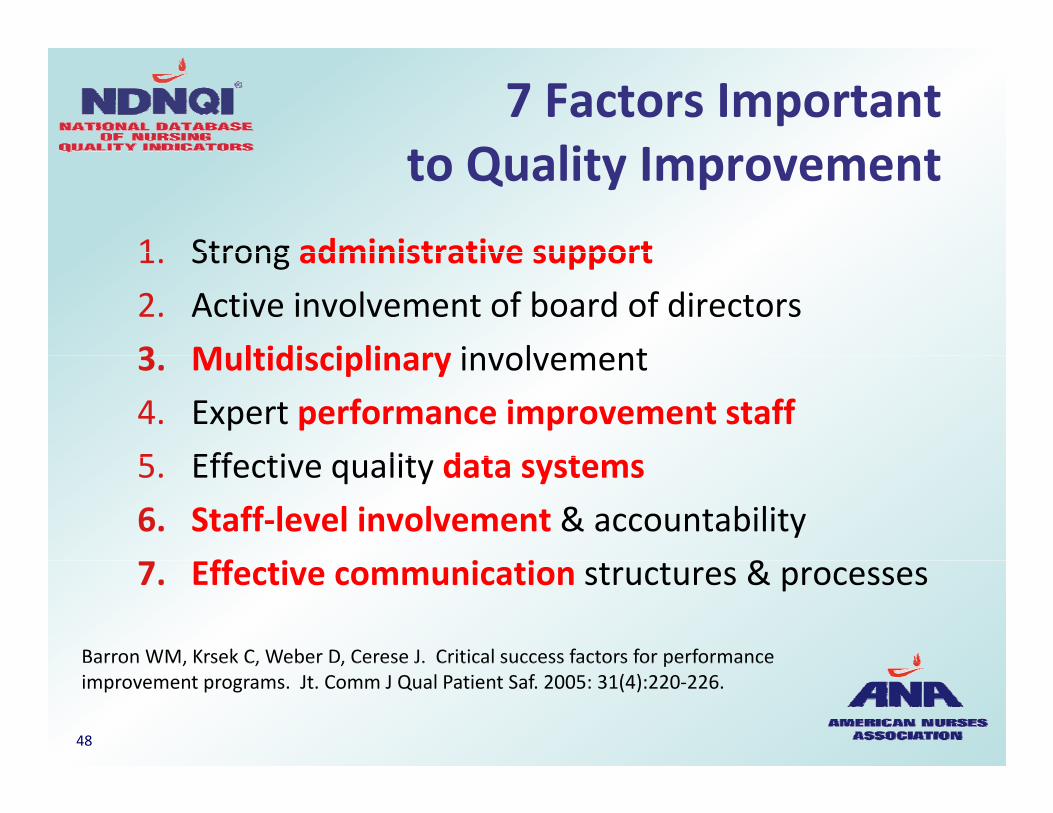
7 Factors Importantt Q lit I tto Quality Improvement
1 Strong administrative support1. Strong administrative support
2. Active involvement of board of directors
3 Multidisciplinary involvement3. Multidisciplinary involvement
4. Expert performance improvement staff
5 Eff ti lit d t t5. Effective quality data systems
6. Staff‐level involvement & accountability
ff i i i &7. Effective communication structures & processes
Barron WM, Krsek C, Weber D, Cerese J. Critical success factors for performance arron WM, Krsek C, Weber , Cerese J. Critical success factors for performanceimprovement programs. Jt. Comm J Qual Patient Saf. 2005: 31(4):220‐226.
48

Champions for QI are:Champions for QI are: Opinion leaders and change agents
P i i d i l kill• Possess strong communication and interpersonal skills
• Have ability to influence others
• Seen as credible by peers and senior management• Seen as credible by peers and senior management
Advocate the use of evidence based practice
Adopt & model care management practices Adopt & model care management practices
Recognize improvement
Unit based Unit based
Wang MC, Hyun JK, Harrison M, Shortell SM, Fraser I. Redesigning health systems for quality: Lessons from emerging practices. Jt. Comm J. Qual Patient Saf. 2006: 32(11): 599‐611
49

PersistencePersistence
“There is no quick fix or easy overallThere is no quick fix or easy overall remedy. Instead, it seems clear that quality improvement in health care asquality improvement in health care, as in other sectors, requires a coordinated, d lib i d i ddeliberate, consistent, and sustained approach” (AHRQ, 2008)
http://www ahrq gov/qual/nhqr08/Key htmhttp://www.ahrq.gov/qual/nhqr08/Key.htm
50

Future NDNQI ToolQ
51

Literature/Research WidgetIn Development
C t t ill l ti Content will evolve over time
To obtain information within NDNQI Qwebsite, you will click on button in a matrix of “Problem by Unit Type”y yp
The content will be nursing factors that i fl t th it tinfluence outcome on the unit type
52

All Aboard!!
Use the Reports education moduleseducation modules
Give us feedback!
Share your successes!

Contact NDNQI for More I f tiInformation
www.nursingquality.org
(913) 588‐1691(913) 588 1691