New Design Chart for Basic Wind Speeds in Brazil
17
10(2013) 707 – 723 Abstract The design charts for basic wind speeds currently in use in Brazil [1] were created in 1977, based on wind speed records from 1950 to 1974. The database covered up to 25 years of wind records obtained in 49 weather stations, totaling 919 station×years of data. Since 1974, additional 37 years of wind records became available, but have not been incorporated in the design code. Hence, the updated wind charts proposed in this paper are long overdue. In this paper, 62 years of wind records in Brazil are gathered in order to construct updated and more reliable wind charts. The original data by Padaratz [2] are complemented by data from 104 airport weather stations, made available through the Wolfram Research Database [3]. In total, 4142 station×years of data are used in the present study, hence providing much better cover in terms of space and time span. Maximum annual wind speeds for the individual stations are fitted to Gumbel distribu- tions, from which basic wind speeds are evaluated (mean return peri- od of 50 years). Basic wind speeds are used to build a non-linear regression model, using the p-value of the Anderson-Darling good- ness-of-fit test as regression weight. This ensures that extreme value wind distributions for which a good fit is obtained are given more importance in the regression model, reducing the influence of spurious data. The regression model developed herein is used to plot a new design chart for basic wind speeds in Brazil. It is proposed that this new wind chart be incorporated in the Brazilian code for design of structures subject to wind [1]. In this regard, it is observed that basic wind speeds obtained herein are higher than the wind speeds of the current chart for significant parts of Brazil (notably the center, northeast and north), and are the same or smaller in some parts of the south and southeast. It is shown herein that the main differences between the current and the proposed charts are not due to different modeling assumptions, but are mainly due to the new data. The proposed chart is updated, and is more reliable than the chart cur- rently in use, as it reflects 4142 station×years of data, and covers up to 62 years of wind records. Keywords basic design wind, nominal design wind, wind loading, extreme value distribution, Gumbel distribution, structural safety, structural design code. New Design Chart for Basic Wind Speeds in Brazil André T. Beck* and Márcio R. S. Corrêa Department of Structural Engineering, University of São Paulo - Brazil Received 01 May 2012 In revised form 09 Oct 2012 *Author email: [email protected]
Transcript of New Design Chart for Basic Wind Speeds in Brazil

10(2013) 707 – 723
Abstract The design charts for basic wind speeds currently in use in Brazil [1] were created in 1977, based on wind speed records from 1950 to 1974. The database covered up to 25 years of wind records obtained in 49 weather stations, totaling 919 station×years of data. Since 1974, additional 37 years of wind records became available, but have not been incorporated in the design code. Hence, the updated wind charts proposed in this paper are long overdue. In this paper, 62 years of wind records in Brazil are gathered in order to construct updated and more reliable wind charts. The original data by Padaratz [2] are complemented by data from 104 airport weather stations, made available through the Wolfram Research Database [3]. In total, 4142 station×years of data are used in the present study, hence providing much better cover in terms of space and time span. Maximum annual wind speeds for the individual stations are fitted to Gumbel distribu-tions, from which basic wind speeds are evaluated (mean return peri-od of 50 years). Basic wind speeds are used to build a non-linear regression model, using the p-value of the Anderson-Darling good-ness-of-fit test as regression weight. This ensures that extreme value wind distributions for which a good fit is obtained are given more importance in the regression model, reducing the influence of spurious data. The regression model developed herein is used to plot a new design chart for basic wind speeds in Brazil. It is proposed that this new wind chart be incorporated in the Brazilian code for design of structures subject to wind [1]. In this regard, it is observed that basic wind speeds obtained herein are higher than the wind speeds of the current chart for significant parts of Brazil (notably the center, northeast and north), and are the same or smaller in some parts of the south and southeast. It is shown herein that the main differences between the current and the proposed charts are not due to different modeling assumptions, but are mainly due to the new data. The proposed chart is updated, and is more reliable than the chart cur-rently in use, as it reflects 4142 station×years of data, and covers up to 62 years of wind records. Keywords basic design wind, nominal design wind, wind loading, extreme value distribution, Gumbel distribution, structural safety, structural design code.
New Design Chart for Basic Wind Speeds in Brazil
André T. Beck* and Márcio R. S. Corrêa
Department of Structural Engineering, University of São Paulo - Brazil Received 01 May 2012 In revised form 09 Oct 2012 *Author email: [email protected]
708 Beck A.T et al. / New Design Chart for Basic Wind Speeds in Brazil
Latin American Journal of Solids and Structures 10(2013) 707 – 723
1 INTRODUCTION
Design charts for basic wind speeds are the core of design codes for structures subject to wind loads. Wind loads are stochastic processes, which fluctuate both in time and in space. In order to deal with randomness of wind loads in time, nominal wind loads, corresponding to given mean return periods associated to structural design live, have to be determined. Randomness of wind loads in space is dealt with by means of charts, which provide different design wind loads for different geographical location according to wind incidence and intensity.
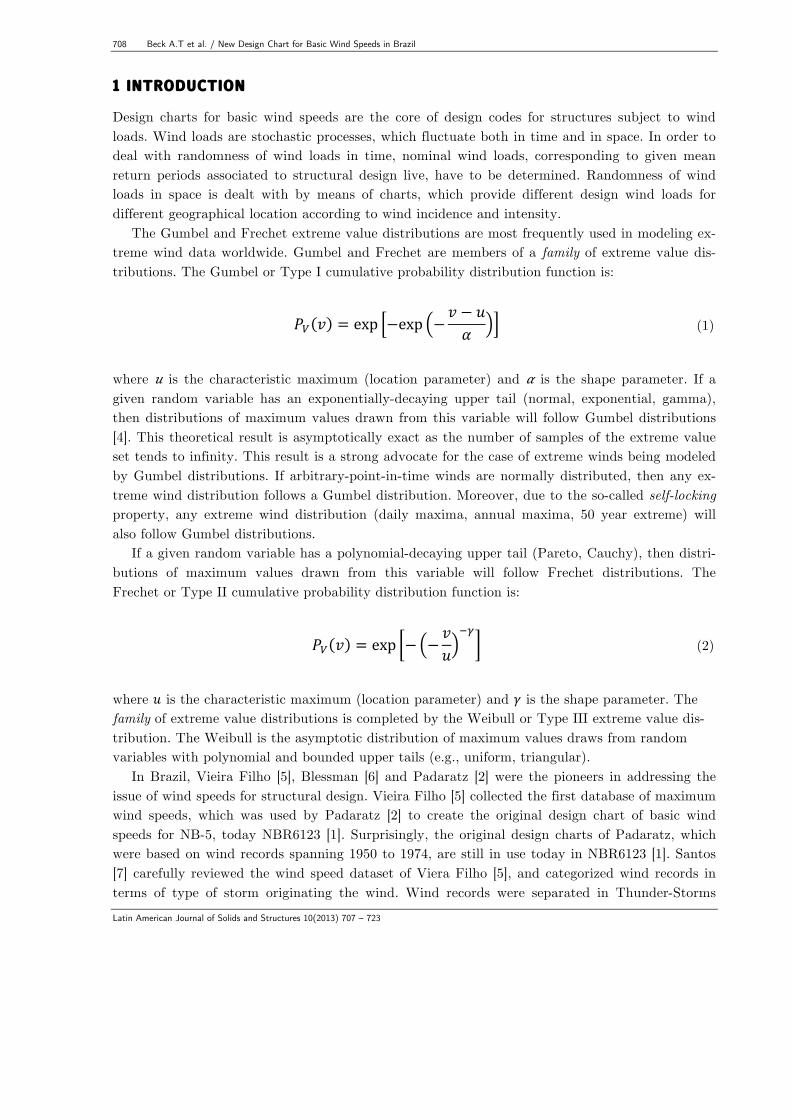
The Gumbel and Frechet extreme value distributions are most frequently used in modeling ex-treme wind data worldwide. Gumbel and Frechet are members of a family of extreme value dis-tributions. The Gumbel or Type I cumulative probability distribution function is:
𝑃! 𝑣 = exp −exp −𝑣 − 𝑢𝛼 (1)
where 𝑢 is the characteristic maximum (location parameter) and 𝛼 is the shape parameter. If a given random variable has an exponentially-decaying upper tail (normal, exponential, gamma), then distributions of maximum values drawn from this variable will follow Gumbel distributions [4]. This theoretical result is asymptotically exact as the number of samples of the extreme value set tends to infinity. This result is a strong advocate for the case of extreme winds being modeled by Gumbel distributions. If arbitrary-point-in-time winds are normally distributed, then any ex-treme wind distribution follows a Gumbel distribution. Moreover, due to the so-called self-locking property, any extreme wind distribution (daily maxima, annual maxima, 50 year extreme) will also follow Gumbel distributions.
If a given random variable has a polynomial-decaying upper tail (Pareto, Cauchy), then distri-butions of maximum values drawn from this variable will follow Frechet distributions. The Frechet or Type II cumulative probability distribution function is:
𝑃! 𝑣 = exp − −𝑣𝑢
!! (2)
where 𝑢 is the characteristic maximum (location parameter) and 𝛾 is the shape parameter. The family of extreme value distributions is completed by the Weibull or Type III extreme value dis-tribution. The Weibull is the asymptotic distribution of maximum values draws from random variables with polynomial and bounded upper tails (e.g., uniform, triangular).
In Brazil, Vieira Filho [5], Blessman [6] and Padaratz [2] were the pioneers in addressing the issue of wind speeds for structural design. Vieira Filho [5] collected the first database of maximum wind speeds, which was used by Padaratz [2] to create the original design chart of basic wind speeds for NB-5, today NBR6123 [1]. Surprisingly, the original design charts of Padaratz, which were based on wind records spanning 1950 to 1974, are still in use today in NBR6123 [1]. Santos [7] carefully reviewed the wind speed dataset of Viera Filho [5], and categorized wind records in terms of type of storm originating the wind. Wind records were separated in Thunder-Storms

Beck A.T et al / New Design Chart for Basic Wind Speeds in Brazil 709
Latin American Journal of Solids and Structures 10(2013) 707 – 723
(TS) and Extended mature Pressure Systems (EPS), as well as according to wind direction. The author built a map of extreme winds in the center and south of Brazil, using Gumbel distribu-tions to fit the data. Importantly, Santos [7] showed that categorizing wind records in terms of storm type leads to better fit to the data, when compared to the fit of mixed wind series. Bau-tista [8] studied wind speeds in Piracicaba, SP, Brazil, and found the Gumbel distribution to pro-vide a best fit to the data. More recently, using a database spanning from 1995 to 2009, Almeida [9] concluded that the Gumbel distribution was more adequate than the Frechet distribution to represent the wind speed series obtained at weather stations in Brazilian airports.
Historically, the Gumbel and Frechet distributions have most frequently been used to charac-terize extreme wind speeds worldwide. Riera and Rocha [10] present a large review of research programs which used the Gumbel or Frechet distributions to develop National Codes, such as Canadian, English, Australian, Swedish and Danish codes (Gumbel distribution) and North American (US), Russian, Argentinean and Brazilian codes (Frechet distribution). However, one of the main conclusions of the study is that [10]: “EPS and TS wind series are better represented by the Fisher-Tippet Type I (Gumbel) distribution than by any other extreme value or standard dis-tribution, worldwide.”
Wind regimes are affected by seasonal variations during the year. Hence, one year is the smallest period for which cyclic oscillations can be disregarded. From continuous or from hourly wind records, yearly maximum wind speeds are collected. The yearly maximum wind probability distribution is obtained from a series of such records, spanning a few years. The Gumbel or Frechet probability distributions (Eqs. 1 or 2) can be fitted to such data. If 𝑃!! 𝑣 is the yearly maximum distribution (1 year), then the 50-year extreme wind distribution is obtained as:
𝑃!!" 𝑣 = 𝑃!! 𝑣!"
(3)
Eq. (3) assumes independence between the yearly maximum winds. Due to the self-locking prop-erty, if 𝑃!! 𝑣 follows a Gumbel distribution, then 𝑃!!" 𝑣 will also follow a Gumbel distribution. The characteristic maximum of the 50-year extreme value distribution can be obtained as:
𝑢!" = 𝑃!!!! 1− 1/50 (4)
where 𝑃!!!! is the inverse of the cumulative distribution function. By definition, the characteristic maximum is also the wind speed with a mean return period of 50 years. This is called the basic design wind speed in the NBR6123 Brazilian design code [1]:
𝑢!" ≡ 𝑣! (5)

710 Beck A.T et al. / New Design Chart for Basic Wind Speeds in Brazil
Latin American Journal of Solids and Structures 10(2013) 707 – 723
The relationship between the probability density functions of the yearly and 50-year extreme value distributions is shown in Figure 1. It can be observed that the characteristic maximum for the 50-year extreme value distribution (vertical dashed line in Figure 1) represents a tail proba-bility of 2% for the 1-year extreme value distribution but 63% for the 50-year extreme value dis-tribution. Hence, the nominal wind speed with a mean return period of 50 years has a probability of 2% of being exceeded in a single year, but has a probability of 63% of being exceeded in 50 years.
The (up-dated) design charts presented herein are fundamental for the safe (and economical) design of structures subject to wind actions in Brazil. Hence, this article presents a relevant con-tribution towards the safety of structures designed in Brazil. Moreover, the wind statistics de-scribed herein are also fundamental for the reliability analysis of structures subject to wind loads [11, 12]. In fact, this study is motivated by the long-term goal of performing the reliability-based calibration of Brazilian structural design codes. Initiatives in this regard have already been taken in Beck and Dória [13], Beck et al. [14], Chaves et al. [15], Beck and Souza Jr. [16] and Santiago and Beck [17].
Figure 1 Relationship between 1-year and 50-year extreme value distributions.
2 WORK OF PADARATZ AND DESIGN CHARTS OF NBR6123
2.1 The database of Padaratz
When Padaratz produced his pioneering work on structural design winds in Brazil [2], he used the data that were available at that time. This included up to 25 years of maximum wind speed rec-ords (1950 to 1974) at 49 airport weather stations around the country (Figure 2). The data set contained records spanning between 8 and 25 years (we disregard one station for which only 2 years of record were available). Also, the data from the Agronomical Institute of Campinas used by Padaratz are not considered here, as we want to avoid data which may be affected by the topographical surroundings of the weather station. In total, 919 station×years of data were used

Beck A.T et al / New Design Chart for Basic Wind Speeds in Brazil 711
Latin American Journal of Solids and Structures 10(2013) 707 – 723
by Padaratz to derive the wind charts that are used until today to design structures subject to wind loads in Brazil [1].
Figure 2 Fourty-eight weather stations considered by Padaratz [2].
2.2 Model ing assumptions by Padaratz and assumptions made in this work
The reduced size of the dataset available to Padaratz leaded him to make some modeling assump-tions which are not necessary in the present study. First, in order to be conservative, Padaratz chose to use the Frechet distribution to fit his annual maximum wind speed data. Second, be-cause the records for many weather stations spanned only a few years, Padaratz chose to use a constant shape parameter γ for all the Frechet distribution fits, using the number of years of the series as weights to evaluate the arithmetic mean of this parameter. Due to the small number of years, Padaratz also included an unbiased correction factor, depending on sample size and derived by Thoman et al. [18], for the maximum likelihood estimator of the shape parameter, originally applied to Weibull distributions. In this section, these main assumptions are reviewed and com-pared to the assumptions made in the present study.
The Frechet distribution is known to be more conservative than the Gumbel distribution when fitting annual maximum wind speeds. In other words, the Frechet distribution leads to higher predictions of the nominal wind speed with mean return period of 50 years. Figures 3 and 4 illus-trate the issue, by comparing Gumbel and Frechet fits to the data of Padaratz for the Floria-nópolis station. In Figure 3, the two fits are nearly indistinguishable, and both are observed to represent the data very well. However, the basic wind speed for the Gumbel fit is 𝑣! = 40.5 m/s, whereas for the Frechet fit it is 𝑣! = 45.7 m/s. The difference between the two fits is only evident in Figure 4, where the two distributions are plot on top of each other. In Figure 4 it can be ob-served that the Frechet distribution is more skewed to the left: this lifts the right tail, leading to higher predictions of the 50 year return wind (tail probability of 0.98, following Eq. 4). The An-

712 Beck A.T et al. / New Design Chart for Basic Wind Speeds in Brazil
Latin American Journal of Solids and Structures 10(2013) 707 – 723
derson-Darling goodness-of-fit test returns p-values (probability that the data originated from the fitted distribution, at 5% significance level) of p=0.95 for the Gumbel fit and p=0.87 for the Frechet fit, hence the Gumbel fit is better. Interestingly, the largest wind record for this station is 45.8 m/s. This should be no surprise, as basic wind speeds have a mean return period of 50 years, and it is not unlikely to find such observation in a record spanning 25 years. The maxi-mum record for Florianópolis (45.8 m/s or 165 km/h) is also the largest wind speed for the whole Padaratz database and for the expanded 4142 station×year database considered herein.
Figure 3 Comparison of Gumbel (left) and Frechet (right) distribution fits to the Padaratz [2] data for Florianópolis station.
Figure 4 Comparison of Gumbel (cont. line) and Frechet (dashed line) distribution fits to the Padaratz [2] data for Florianópolis station.

Beck A.T et al / New Design Chart for Basic Wind Speeds in Brazil 713
Latin American Journal of Solids and Structures 10(2013) 707 – 723
The difference between Gumbel and Frechet distribution fits for selected stations of the Pa-daratz database is illustrated in Table 1. The stations reported in this table are some of those for which the highest basic winds where obtained by Padaratz. They are located in a semi-circle which surrounds the southern states of Brazil, closely following the contour-lines of the Padaratz wind chart for basic winds of 45 and 50 m/s. It is observed in Table 1 that the Gumbel fit pre-sents higher p-value for all datasets, and results in significantly smaller basic wind speeds.
Table 1 Comparison of Gumbel and Frechet fits to selected stations of the Padaratz dataset.
Station 𝑣! (m/s) for Gumbel fit (p-value)
𝑣! (m/s) for Frechet fit (p-value)
Florianópolis 40.5 (0.95) 45.7 (0.87)
Porto Alegre 37.9 (0.50) 41.6 (0.34)
Uruguaiana 47.8 (0.89) 59.6 (0.58)
Foz do Iguaçu 38.2 (0.95) 60.6 (0.53)
Ponta Porã 24.6 (0.68) 26.4 (0.57)
The wind records available to Padaratz spanned at most 25 years, hence only half of the mean
return period for the winds he was trying to predict. In retrospect, conservatively choosing a Frechet distribution may have been a proper modeling assumption at that time. However, our study shows that the Gumbel distribution yields a better fit for 31 of the 48 stations of the Pa-daratz database, against 17 better fits by the Frechet distribution (excluding the Anápolis sta-tion, for which only two years of wind records were available). For the whole Padaratz database, the Frechet fit yielded basic wind speeds that are on average 22% higher than the wind speeds obtained using a Gumbel fit.
Today, there is worldwide evidence that the Gumbel distribution fits extreme wind speed data better than the Frechet distribution [10]. Moreover:
a. the Gumbel distribution was found to be better for 31 (against 17) of the stations forming the Padaratz database;
b. the Gumbel distribution was found to be better for 87 (against 17) of the stations forming the complete database considered herein;
c. the current database spans 62 years, reducing the necessity of being conservative in evaluating a 50-year mean return wind.
The considerations above lead us to choose a Gumbel distribution to fit the extreme wind speed data.
Furthermore, Padaratz chose to use a constant shape parameter γ for all the Frechet distribu-tion fits. Based on a selection of 20 stations for which the wind records were longer, Padaratz arrived at the constant value of 𝛾 = 6.37, which was used together with the wind records to eval-uate the location parameter 𝑢 for all the stations. There is evidence that winds originating from different climatic phenomena can be represented using constant γ values. For instance, Thom [19]

714 Beck A.T et al. / New Design Chart for Basic Wind Speeds in Brazil
Latin American Journal of Solids and Structures 10(2013) 707 – 723
stated that winds originated from extra-tropical storms (EPS) could be characterized by a Frechet distribution with 𝛾 = 9.0, while winds caused by tropical thunderstorms (TS) could be characterized by a Frechet distribution with 𝛾 = 4.5, regardless of location. Hence, a mixed (EPS and TS) wind population could have a scale parameter 𝛾 = 6.37. However, assuming this parame-ter to be constant over the whole national territory is equivalent to assuming that in every weather station the proportion of EPS and TS is the same, which is not likely the case. In con-trast, in the present study Gumbel distributions are fitted to the data, and parameters of the distribution are evaluated from the data for each weather station.
Riera and Rocha [10] built on the idea by Thom [19] and proposed a bi-modal distribution to be used for mixed populations of EPS and TS winds. This distribution is a weighted sum of two Frechet distributions with scale parameters 𝛾 = 9.0 and 𝛾 = 4.5. The drawback of this approach is that the relative frequencies of each type of wind (EPS or TS) would have to be known for each weather station. This information is not readily available, and obtaining it would require tedious work of investigation of the wind records at each weather station.
2.3 Basic wind charts using data by Padaratz but our model ing assumptions
In order to investigate how much our modeling assumptions differ from the modeling assumptions by Padaratz, we started by applying our modeling assumptions to the Padaratz data. Hence, the wind speed records of Padaratz were fitted to Gumbel distributions, with parameters evaluated from the data. A grid of basic wind speed was obtained, and a linear regression model was con-structed. The p-value of the Anderson-Darling goodness-of-fit test was used as weight in the re-gression model, putting more confidence in those basic wind speeds for which the Gumbel distri-bution fit was better. The resulting basic wind speed chart is shown in Figure 5. By comparing this figure with the current design chart of NBR6123 [1], one can measure the effects of the dif-ferent modeling assumptions.
First, it is observed that the general trend is very similar. Basic winds of around 25 m/s are observed over the northeast of Brazil in both charts. Winds of 30 m/s are observed in the north coast of Brazil, but in our chart they remain over the ocean, whereas in the Padaratz chart they extend over the mainland. Winds of 30 m/s are observed in the central part of Brazil, extending east to west over the latitude of Brasilia. In our chart, this curve extends over parts of Amazon over Manaus, where the Padaratz chart yields winds of 25 m/s. Over the western part of the Amazon, the winds predicted in our chart are a little higher. Winds of 35 m/s are observed over the states of Minas Gerais, São Paulo and Mato Grosso, which are similar in both charts. Finally, winds of 40 m/s are observed in the central parts of the states of Santa Catarina and Rio Grande do Sul.
The main differences between the two charts are the 45 and 50 m/s wind speed contour-lines, which appear in the Padaratz chart, surrounding the state of Rio Grande do Sul and over the western side of the states of Paraná and Santa Catarina. It was noted in the previous section that these higher wind speeds found by Padaratz are a direct consequence of using a Frechet fit to the data (Table 1). Hence, it is observed that the conservative assumption by Padaratz actually pro-duced smaller basic winds over significant parts of Brazil, where wind speeds are not very high (𝑣! < 35 m/s). However, it produced higher winds in the south of Brazil, where 𝑣! is around or
Beck A.T et al / New Design Chart for Basic Wind Speeds in Brazil 715
Latin American Journal of Solids and Structures 10(2013) 707 – 723
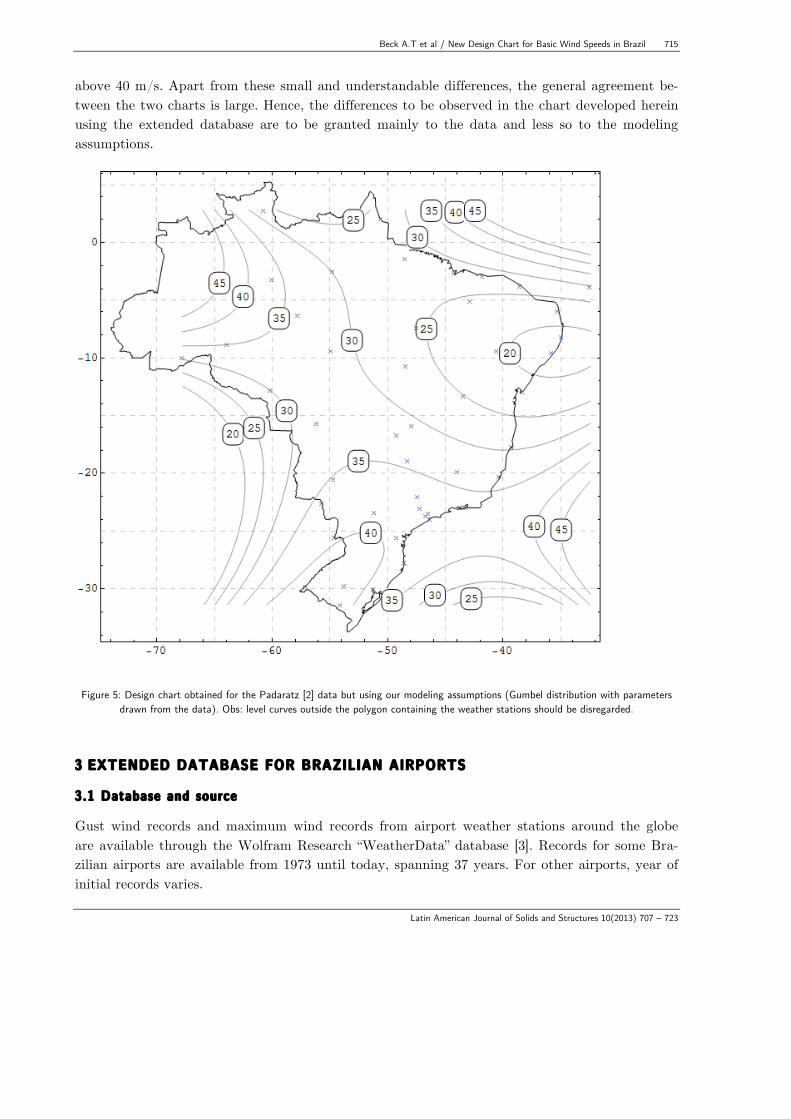
above 40 m/s. Apart from these small and understandable differences, the general agreement be-tween the two charts is large. Hence, the differences to be observed in the chart developed herein using the extended database are to be granted mainly to the data and less so to the modeling assumptions.
Figure 5: Design chart obtained for the Padaratz [2] data but using our modeling assumptions (Gumbel distribution with parameters
drawn from the data). Obs: level curves outside the polygon containing the weather stations should be disregarded. 3 EXTENDED DATABASE FOR BRAZILIAN AIRPORTS
3.1 Database and source
Gust wind records and maximum wind records from airport weather stations around the globe are available through the Wolfram Research “WeatherData” database [3]. Records for some Bra-zilian airports are available from 1973 until today, spanning 37 years. For other airports, year of initial records varies.

716 Beck A.T et al. / New Design Chart for Basic Wind Speeds in Brazil
Latin American Journal of Solids and Structures 10(2013) 707 – 723
Airport weather stations are appropriate to obtain wind observations, as the readings are not affected by surrounding topographical features. Since airports are located in large flat areas, wind readings are less likely to be affected by nearby mountains, hills, tall threes or buildings. As men-tioned, the data of the Agronomical Institute of Campinas, considered by Padaratz, were not included in our study, due to possible interferences of surrounding topographical features. Similar-ly, data for many other Brazilian weather stations, located in urban of rural areas but with un-known topographical surrounding, where not considered, despite being available in the Wolfram Research database.
In Brazil, airport weather stations are controlled and run by the Air Space Department of Control (DECEA), which is linked to the Aeronautical Command and to the Ministry of Defense. Airport weather stations are part of a larger network of meteorological stations run by DECEA (REDEMET). The National Aeronautics Meteorological Center (CNMA) of DECEA is signatory of a global agreement (WAFS) to share meteorological data of relevance to civil aviation, under the auspices of the International Civil Aviation Organization (ICAO).
The wind data provided to CNMA is collected at Brazilian airports by the Brazilian Airforce National Service of Flight Protection. Wind speed readings are made at every hour, but during intense storms "instantaneous" peak values are recorded. Readings include 30 second means and “3 second” gust speeds. Gust winds are defined as wind velocities which exceed the 30s means by more than 60%. Yearly maximum (30s) winds are available through the Wolfram Research data-base for up to 37 years, although the time span varies considerably for different weather stations. Gust wind records are scarce, in comparison to 30s means. Hence, for every station and year for which some record was available, we chose the maximum value between the gust speed reading and 1.15 times the 30s mean reading. The correction factor to convert 30s mean to gust speed has been used before by Padaratz [2] and by Riera and Rocha [10]. The maximum operator is neces-sary because, as had been observed by Padaratz [2], for some years the gust speed in record is smaller than the 30s mean. Clearly, this indicates some inconsistency of the records, which is not possible to overcome in a more precise way.
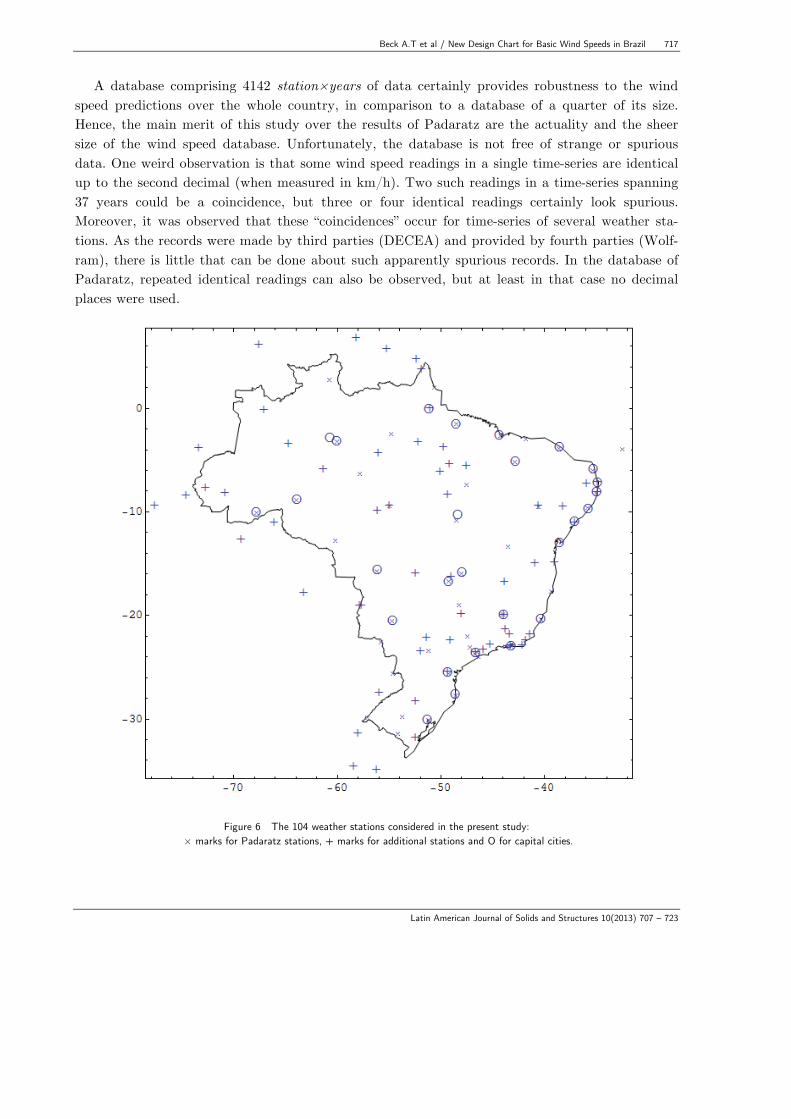
In this article, wind data from 104 airport weather stations are collected and processed using the software Mathematica [3]. These data are complemented with the data from Padaratz cover-ing the years 1950 to 1974, as available. Hence, 62 years of wind records are obtained for 15 weather stations, and 50 or more years are obtained for 32 stations, with smaller-length records for other stations. The smallest time-history contains only 8 years of data. In total, a database comprising 4142 station×years of data is collected in the present study. This provides significant-ly better coverage in space and time-span, comparing to the original dataset of Padaratz [2]. The coverage of the 104 weather stations considered herein is presented in Figure 6. Note that several stations were selected surrounding Brazilian land borders. These weather stations are included in the study in order to provide smooth wind charts over the whole territory. In Figure 5, for in-stance, it is observed that the absence of weather stations in the north-western part of the Ama-zon leads to extrapolation of the fitted regression model. In order to avoid extrapolation, hence allowing high-order regression curves to be used, neighboring weather stations are included in the present study.
Beck A.T et al / New Design Chart for Basic Wind Speeds in Brazil 717
Latin American Journal of Solids and Structures 10(2013) 707 – 723
A database comprising 4142 station×years of data certainly provides robustness to the wind speed predictions over the whole country, in comparison to a database of a quarter of its size. Hence, the main merit of this study over the results of Padaratz are the actuality and the sheer size of the wind speed database. Unfortunately, the database is not free of strange or spurious data. One weird observation is that some wind speed readings in a single time-series are identical up to the second decimal (when measured in km/h). Two such readings in a time-series spanning 37 years could be a coincidence, but three or four identical readings certainly look spurious. Moreover, it was observed that these “coincidences” occur for time-series of several weather sta-tions. As the records were made by third parties (DECEA) and provided by fourth parties (Wolf-ram), there is little that can be done about such apparently spurious records. In the database of Padaratz, repeated identical readings can also be observed, but at least in that case no decimal places were used.
Figure 6 The 104 weather stations considered in the present study: × marks for Padaratz stations, + marks for additional stations and O for capital cities.
718 Beck A.T et al. / New Design Chart for Basic Wind Speeds in Brazil
Latin American Journal of Solids and Structures 10(2013) 707 – 723
3.2 Comparison with data from Padaratz
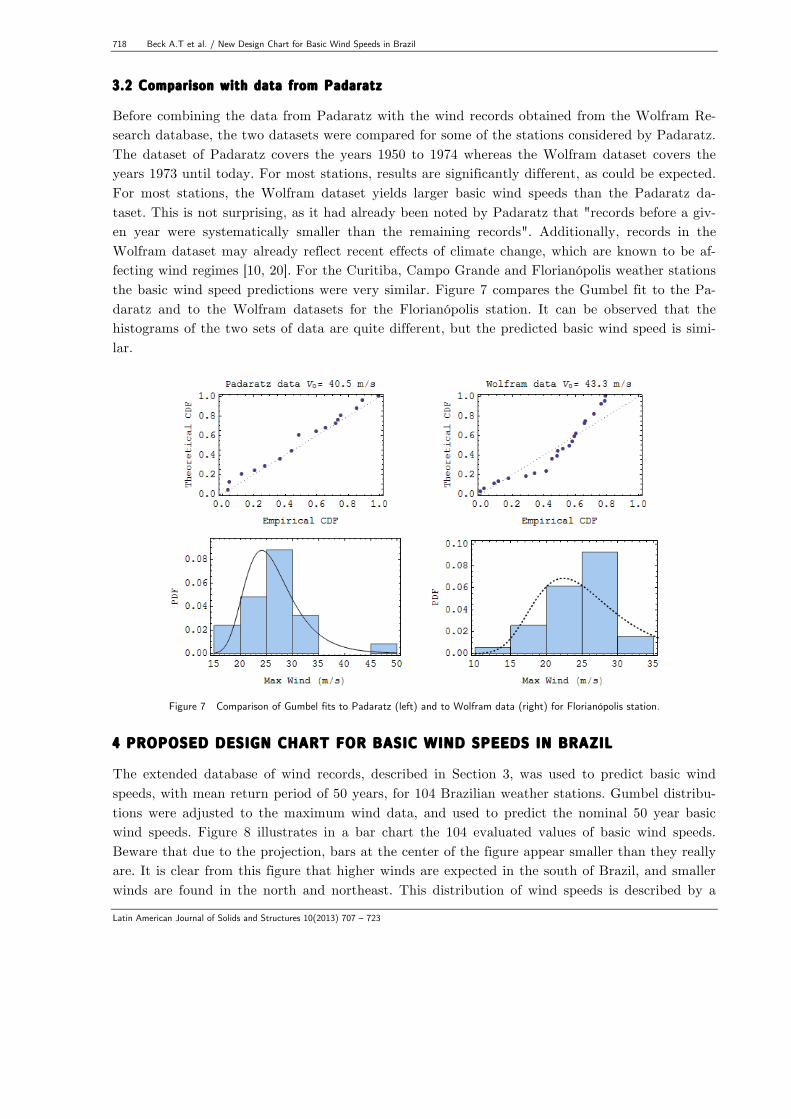
Before combining the data from Padaratz with the wind records obtained from the Wolfram Re-search database, the two datasets were compared for some of the stations considered by Padaratz. The dataset of Padaratz covers the years 1950 to 1974 whereas the Wolfram dataset covers the years 1973 until today. For most stations, results are significantly different, as could be expected. For most stations, the Wolfram dataset yields larger basic wind speeds than the Padaratz da-taset. This is not surprising, as it had already been noted by Padaratz that "records before a giv-en year were systematically smaller than the remaining records". Additionally, records in the Wolfram dataset may already reflect recent effects of climate change, which are known to be af-fecting wind regimes [10, 20]. For the Curitiba, Campo Grande and Florianópolis weather stations the basic wind speed predictions were very similar. Figure 7 compares the Gumbel fit to the Pa-daratz and to the Wolfram datasets for the Florianópolis station. It can be observed that the histograms of the two sets of data are quite different, but the predicted basic wind speed is simi-lar.
Figure 7 Comparison of Gumbel fits to Padaratz (left) and to Wolfram data (right) for Florianópolis station.
4 PROPOSED DESIGN CHART FOR BASIC WIND SPEEDS IN BRAZIL
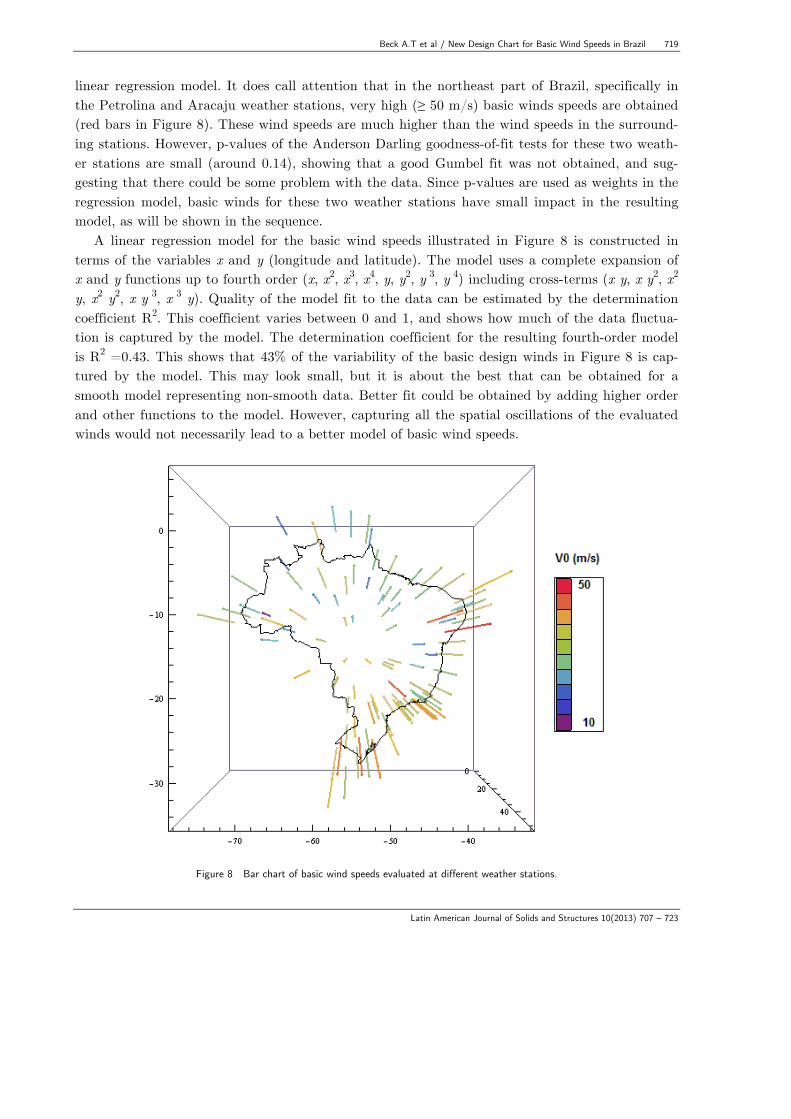
The extended database of wind records, described in Section 3, was used to predict basic wind speeds, with mean return period of 50 years, for 104 Brazilian weather stations. Gumbel distribu-tions were adjusted to the maximum wind data, and used to predict the nominal 50 year basic wind speeds. Figure 8 illustrates in a bar chart the 104 evaluated values of basic wind speeds. Beware that due to the projection, bars at the center of the figure appear smaller than they really are. It is clear from this figure that higher winds are expected in the south of Brazil, and smaller winds are found in the north and northeast. This distribution of wind speeds is described by a
Beck A.T et al / New Design Chart for Basic Wind Speeds in Brazil 719
Latin American Journal of Solids and Structures 10(2013) 707 – 723
linear regression model. It does call attention that in the northeast part of Brazil, specifically in the Petrolina and Aracaju weather stations, very high (≥ 50 m/s) basic winds speeds are obtained (red bars in Figure 8). These wind speeds are much higher than the wind speeds in the surround-ing stations. However, p-values of the Anderson Darling goodness-of-fit tests for these two weath-er stations are small (around 0.14), showing that a good Gumbel fit was not obtained, and sug-gesting that there could be some problem with the data. Since p-values are used as weights in the regression model, basic winds for these two weather stations have small impact in the resulting model, as will be shown in the sequence.
A linear regression model for the basic wind speeds illustrated in Figure 8 is constructed in terms of the variables x and y (longitude and latitude). The model uses a complete expansion of x and y functions up to fourth order (x, x2, x3, x4, y, y2, y 3, y 4) including cross-terms (x y, x y2, x2 y, x2 y2, x y 3, x 3 y). Quality of the model fit to the data can be estimated by the determination coefficient R2. This coefficient varies between 0 and 1, and shows how much of the data fluctua-tion is captured by the model. The determination coefficient for the resulting fourth-order model is R2 =0.43. This shows that 43% of the variability of the basic design winds in Figure 8 is cap-tured by the model. This may look small, but it is about the best that can be obtained for a smooth model representing non-smooth data. Better fit could be obtained by adding higher order and other functions to the model. However, capturing all the spatial oscillations of the evaluated winds would not necessarily lead to a better model of basic wind speeds.
Figure 8 Bar chart of basic wind speeds evaluated at different weather stations.

720 Beck A.T et al. / New Design Chart for Basic Wind Speeds in Brazil
Latin American Journal of Solids and Structures 10(2013) 707 – 723
The new, proposed design chart for basic wind speeds in Brazil is obtained from the regression model and is presented in Figure 9. In this chart, it can be observed that design winds are signifi-cantly higher for the center, north and northeast of Brazil, in comparison to the chart currently in use [1]. This difference can be attributed to the new data, as argued in Section 2.3. Basic wind speeds are smaller for some parts of the south and southeast of Brazil. This result is a conse-quence of both the new data and the modeling assumptions (Gumbel fit), as discussed in Section 2.3.
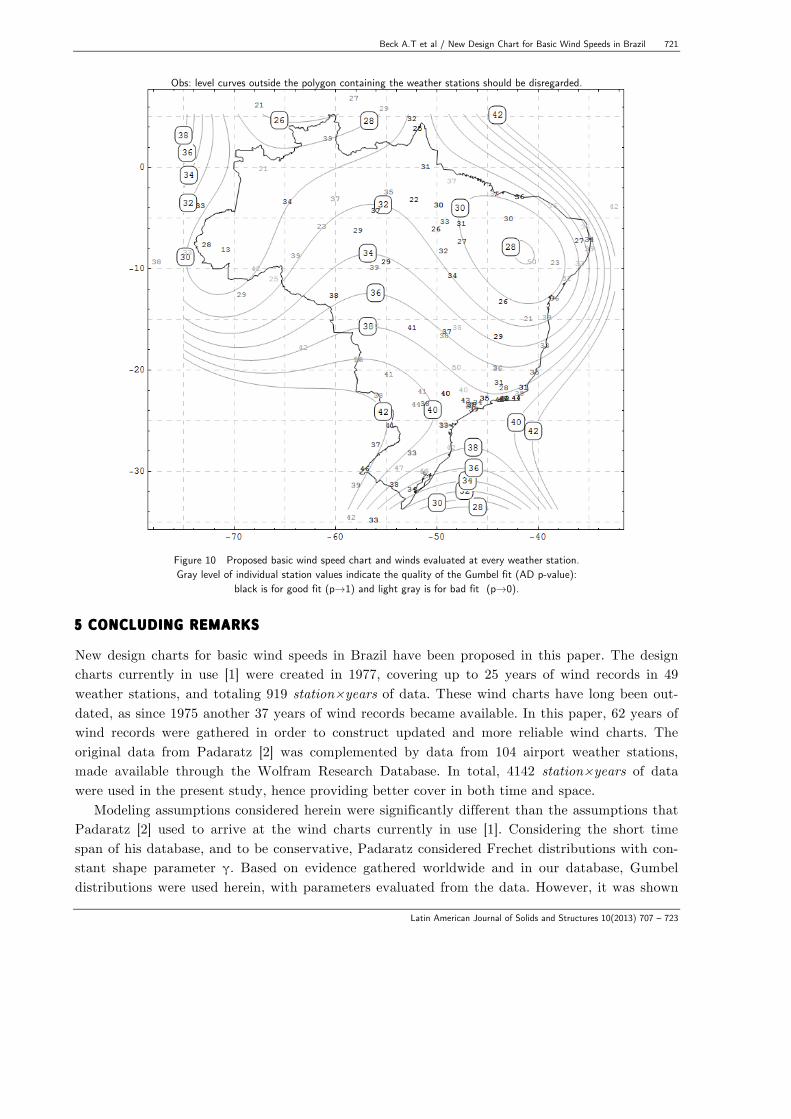
Quality of model fit to the data can also be evaluated from Figure 10. This figure combines the wind chart obtained from the fitted model (Figure 9) with individual wind speeds evaluated at every weather station (Figure 8). The individual values are shown in a gray-scale, according to the quality of the Gumbel distribution fit (AD p-value). Black values represent a good fit (p→1) and light gray represents bad fit (p→0). In this figure, contour lines should agree with individual values appearing in black, and do not necessarily have to agree with individual values shown in gray. For instance, results for the two weather stations in the north-east (Petrolina and Aracaju), for which very high basic winds speeds were obtained (≥ 50 m/s), appear as light gray values in Figure 10. It can be observed that the model was not influenced by these individual values, and the basic design wind obtained for that region is around 30 m/s.
Figure 9 New proposed basic wind speed chart based on complete dataset.
Beck A.T et al / New Design Chart for Basic Wind Speeds in Brazil 721
Latin American Journal of Solids and Structures 10(2013) 707 – 723
Obs: level curves outside the polygon containing the weather stations should be disregarded.
Figure 10 Proposed basic wind speed chart and winds evaluated at every weather station. Gray level of individual station values indicate the quality of the Gumbel fit (AD p-value):
black is for good fit (p→1) and light gray is for bad fit (p→0). 5 CONCLUDING REMARKS
New design charts for basic wind speeds in Brazil have been proposed in this paper. The design charts currently in use [1] were created in 1977, covering up to 25 years of wind records in 49 weather stations, and totaling 919 station×years of data. These wind charts have long been out-dated, as since 1975 another 37 years of wind records became available. In this paper, 62 years of wind records were gathered in order to construct updated and more reliable wind charts. The original data from Padaratz [2] was complemented by data from 104 airport weather stations, made available through the Wolfram Research Database. In total, 4142 station×years of data were used in the present study, hence providing better cover in both time and space.
Modeling assumptions considered herein were significantly different than the assumptions that Padaratz [2] used to arrive at the wind charts currently in use [1]. Considering the short time span of his database, and to be conservative, Padaratz considered Frechet distributions with con-stant shape parameter γ. Based on evidence gathered worldwide and in our database, Gumbel distributions were used herein, with parameters evaluated from the data. However, it was shown
722 Beck A.T et al. / New Design Chart for Basic Wind Speeds in Brazil
Latin American Journal of Solids and Structures 10(2013) 707 – 723
that our modeling assumptions, when applied to the database of Padaratz, lead to wind charts that are not significantly different to the charts obtained by Padaratz. This is an important ob-servation, as it shows that the main differences between wind charts of Padaratz and the wind charts derived herein (using the complete 4142 station×year database) are mostly due to the data than to the modeling assumptions.
Wind records for the individual stations were fitted to Gumbel distributions, from which 104 basic wind speeds were evaluated, for a mean return period of 50 years. Basic wind speeds were used to build a linear regression model, using the p-value of the Anderson-Darling goodness-of-fit test as regression weight. This guarantees that extreme value wind distributions for which a good fit was obtained are given more importance in the regression model, reducing the influence of spurious data.
The regression model developed herein can be used to estimate wind speeds in any location in Brazil, and was used to plot a new design chart for basic wind speeds in Brazil. It is not our in-tention to say the last word about the subject, much to the contrary. It is proposed that the wind chart developed herein, or a modified version following discussion with the interested parties, be incorporated in the Brazilian code for design of structures subject to wind [1]. In this regard, it is important to observe that basic wind speeds obtained herein are higher than the wind speeds of the current chart for significant parts of Brazil (notably the center, northeast and north), and are the same or smaller in some parts of the south and southeast.
Acknowledgement The authors kindly acknowledge financial support of this research project by the agencies CNPq (National Council for Research and Development) and FAPESP (São Paulo State Foundation for Research). References
[1] NBR6123:1988: “Wind Loads in Buildings”. ABNT - Brazilian Association of Technical Codes, Rio de Janei-ro (in Portuguese).
[2] Padaratz, I.J., 1977. “Basic wind speed in Brazil”, M.Sc. Thesis, UFRGS (in Portuguese). [3] Wolfram Research, 2012. “Mathematica 8.0”, Champaign, IL, USA (http://www.wolfram.com/). [4] Gumbel, E.J., 1958: “Statistics of Extremes”, Columbia University Press, NY (Dover edition, 2004). [5] Vieira Filho, J.M.S., 1975: “Maximum Wind Speeds in Brazil”, M.Sc. Thesis, UFRGS (in Portuguese). [6] Blessman, J., 1974: “Time interval for evaluating basic wind speeds”, Série Engenharia Estrutural, UFRGS
(in Portuguese). [7] Santos, M. dos, 1989. “Regionalization of Extreme Wind Velocities and Temperatures in Center-South of
Brazil”, M.Sc. Thesis, UFRGS (in Portuguese). [8] Bautista, E.A.L., 2002. “Generalized extreme value distribution applied to the study of the maximum wind
speeds in Piracicaba, SP”, M.Sc. Thesis, USP (in Portuguese). [9] Almeida, L.O., 2010. “A study for updating the wind speed chart in NBR 6123”, M.Sc. Thesis, ITA (in Por-
tuguese). [10] Riera, J.D. and Rocha, M.M. 1998, “Load definition for wind design and reliability assessments: extreme
wind climate”. In: Rieira and Davenport (eds.), “Wind effects on Buildings and Structures”, Balkema, Rot-terdam.
[11] Beck, A.T., Rosa, E., 2006: “Structural Reliability Analysis Using Deterministic Finite Element Programs”. Latin American Journal of Solids and Structures 3, 197 – 222.

Beck A.T et al / New Design Chart for Basic Wind Speeds in Brazil 723
Latin American Journal of Solids and Structures 10(2013) 707 – 723
[12] Beck, A.T., Verzenhassi, C.C., 2008: “Risk Optimization of a Steel Frame Communications Tower Subject to Tornado Winds”, Latin American Journal of Solids and Structures 5, 187 - 203.
[13] Beck, A.T., Dória A.S., 2008: “Reliability analysis of I-section steel columns designed according to new Bra-zilian building codes”, Journal of the Braz. Soc. of Mech. Sci. & Eng. 30, 152-150.
[14] Beck, A. T., De Oliveira, W. L. A., De Nardim, S., ElDebs, A. L. H. C., 2009: “Reliability-based Evaluation of Design Code Provisions for Circular Concrete-Filled Steel Columns”. Engineering Structures 31, 2299-2308.
[15] Chaves, I.A., Beck, A.T., Malite M., 2010: “Reliability-based Evaluation of Design Guidelines for Cold-Formed Steel-Concrete Composite Beams”, Journal of the Braz. Soc. of Mech. Sci. & Eng. 32, 442-449.
[16] Beck, A.T., Souza Jr., A.C., 2010: “A first attempt towards reliability-based calibration of Brazilian struc-tural design codes”, Journal of the Braz. Soc. of Mech. Sci. & Eng. 32, 119 - 127.
[17] Santiago, W.C., Beck, A. T., 2011: “A Study of Brazilian Concrete Strength (Non-)Compliance and its Ef-fects on Reliability of Short Columns”, IBRACON Structures and Materials Journal 4, 663 - 690.
[18] Thoman, D.R.; Bain, L.J.; Ante, C.E., 1969. “Inferences on the Parameters of the Weibull Distribution”, Technometrics, Aug.1969.v.11, n.3, p.445-60.
[19] Thom, H.C.S., 1968. “New distributions of extreme winds in the United States”. Proceedings of the American Society of Civil Engineers, Journal of Structural Division, 94(ST7), 1787-1801.
[20] Berz, G. 1994: “The worldwide increasing windstorm risk: damage analysis and perspectives for the future”, Structural Safety and Reliability, Proceedings of ICOSSAR 93, Vol. 3, 1623-29.