New Concepts in Controlling Asphalt Strain for Perpetual...
41
New Concepts in Controlling Asphalt Strain for Perpetual Pavement Design Dr. Mary M. Robbins Dr. David H. Timm, P.E.
Transcript of New Concepts in Controlling Asphalt Strain for Perpetual...

New Concepts in Controlling Asphalt Strain for Perpetual Pavement Design
Dr. Mary M. Robbins Dr. David H. Timm, P.E.

Goal of Perpetual Pavement Design • Design so there are NO deep structural distresses
– Bottom up fatigue cracking – Structural rutting
• All distresses can be quickly remedied from surface • Result in a structure with ‘Perpetual’ or ‘Long Life’

Perpetual Pavement in the U.S. • Asphalt Pavement Alliance Awards Program • 35+ years of service • Minimal structural improvements • No deep structural distresses
– Problems at surface easily and quickly remedied
http://www.asphaltmagazine.com/dotAsset/4af55c62-42dd-4bbe-a6cc-8f647455eb22.jpg

U.S. Perpetual Pavement Award Winners

Designing Perpetual Pavements
Newcomb, 2001
Presenter
Presentation Notes
This schematic shows the basic ideas behind perpetual pavements. Design for high compression and shear at the pavement surface. Design for high tensile strains at the bottom of the AC. Build on a good foundation. This slide only shows subgrade, but aggregate base and subbase layers are often used.

M-E Perpetual Pavement Design
No Damage Accumulation
Log N
Log ε
Threshold Strain
E1 E2 E3
D1 D2 D3
P
A
εt
εv
Presenter
Presentation Notes
We now revisit the M-E design framework see that perpetual pavements are a natural extension of the M-E principles. First, we must acknowledge that all materials have an endurance limit, or threshold strain, below which no damage will occur. Once we understand this, it is straightforward to incorporate a threshold strain in the design procedure. We begin again with the pavement structure. Defining the thickness and material properties Begin animations… Expected loads are simulated Resulting pavement responses are computed.�Again, this is the “M” part of M-E design Transfer functions are again applied, but we now see that a Threshold strain has been accounted for on the plot. If we have strains exceeding the limit, We have a finite number of cycles to failure (Nf) and damage may accumulate However, if we design it right, we can be just below the threshold strain and have no damage accumulation. This is the goal of perpetual pavement design.

What is the Endurance Limit for HMA? • 1972 – Monismith estimates about 70 µε • 2001 – I-710 designed at 70 µε • 2002 – 70 µε used by APA • 2007 – NCHRP 9-38 Lab Study
• 100 µε for unmod binders • 250 µε for mod binders • More severe than field
• 2007 – MEPDG uses 100 to 250 µε • 2008 – Field measurements at NCAT Test Track show much
higher strains
http
://w
ww
.pav
emen
tinte
ract
ive.
org/
wp-
cont
ent/
uplo
ads/
2011
/07/
Devi
ce1.
jpg
Presenter
Presentation Notes
This is a brief history of the endurance limit. Lacking better data, using 100 microstrain appears to be a conservative value.

Endurance Limit in Laboratory
Normal Fatigue Testing Results VersusEndurance Limit Testing
0
200
400
600
800
1000
1200
1000 100000 10000000 1.1E+08
Number of Loads to Failure
Stra
in, (
10E
-06)
Endurance Limit
Normal Range forFatigue Testing
0
200
400
600
800
1000
1200
1000 100000 10000000 1.1E+08
Number of Loads to Failure
Stra
in, (
10E
-06)
Endurance Limit
0
200
400
600
800
1000
1200
1000 100000 10000000 1.1E+08
Number of Loads to Failure
Stra
in, (
10E
-06)
Endurance Limit
Normal Range forFatigue Testing
http
://w
ww
.pav
emen
tinte
ract
ive.
org/
wp-
cont
ent/
uplo
ads/
2011
/07/
Devi
ce1.
jpg
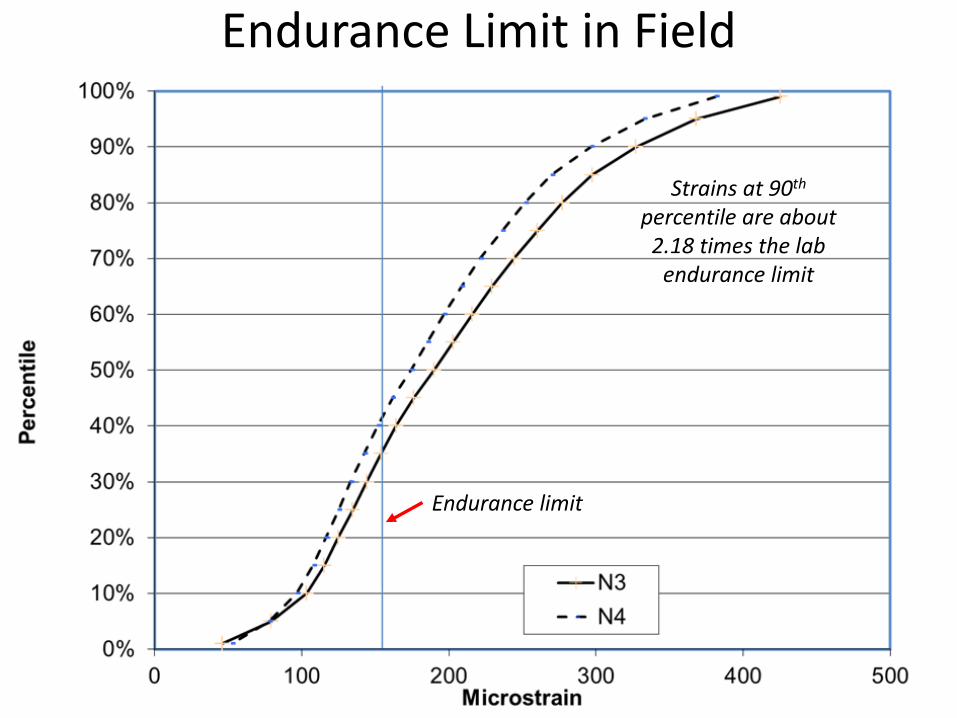
Endurance Limit in Field
Endurance limit
Strains at 90th percentile are about
2.18 times the lab endurance limit

Need for Distribution-Based Design • Pavements experience wide range of loading and
environmental conditions – Results in wide range of strain responses
• Traditional M-E design uses transfer functions and Miner’s Hypothesis to sum damage over time – Fatigue transfer functions difficult to develop and may not
provide sufficient accuracy – Transfer functions not needed with perpetual pavement
design • Designing with a strain distribution will limit fatigue
cracking and avoid transfer functions – Also arrive at reasonable perpetual (maximum) pavement
thicknesses

DEVELOPMENT OF DISTRIBUTION-BASED DESIGN CRITERIA

Perpetual Pavement Design Framework
Traffic
Climate Material Properties
Pavement Structure
Mechanical Analysis
σ, ε
Response Criteria: Fatigue Cracking
Rutting

NCAT Pavement Test Track: Opelika, AL • 1.7 mile closed-loop test facility • 46 asphalt test sections (200 ft/section) • 10 Million ESALs in two years
– 5 trucks operate 16 hours/day • Surface performance monitored on a weekly basis • Some sections feature embedded pavement
response instrumentation
Scope

PerRoad
• Stochastic M-E design framework
• Accounts for seasonal variation
• Variability in layer thickness and layer moduli

Scope Category Parameter Description
Traffic
• 5 triple trailer trucks • Range of axle loads
Climate
• Mid-depth Pavement Temperatures

Scope Category Parameter Description
Cross-section
• 2006 & 2009 Test Track Sections
• AC Layer: Average and COV of layer thickness
• Base Layer: Average and COV of layer thickness
Material Properties
• Base, and Subgrade: Backcalculate Mr
• Backcalculated AC Modulus E1, adjusted for Seasonal temperatures:
h Base
𝑬𝑬𝟏𝟏 = 𝜶𝜶𝟏𝟏(𝒆𝒆𝜶𝜶𝟐𝟐𝑻𝑻)

Scope Section Year Placed Cracking/Type
N3 2003 Yes/Top-down N4 2003 Yes/Top-down N8 2006 Yes/Fatigue N9 2006 Yes/Top-down
N10 2006 Yes/Fatigue S11 2006 Yes/Fatigue N10 2009 Yes/Fatigue N11 2009 Yes/Fatigue S8 2009 Yes/Fatigue S9 2009 Yes/Fatigue
S10 2009 Yes/Fatigue S11 2009 Yes/Fatigue
Development
Validation

Test Sections for Development of Criteria

Cumulative Distributions for Predicted Tensile Strain
FEL = 118 µε
Section FEL (µε) Percentile at FEL N3 (2006) 151 72nd N4 (2006) 146 71st N8 (2006) 203 70th N9 (2006) 203 99th
N10 (2006) 130 33rd S11 (2006) 118 19th
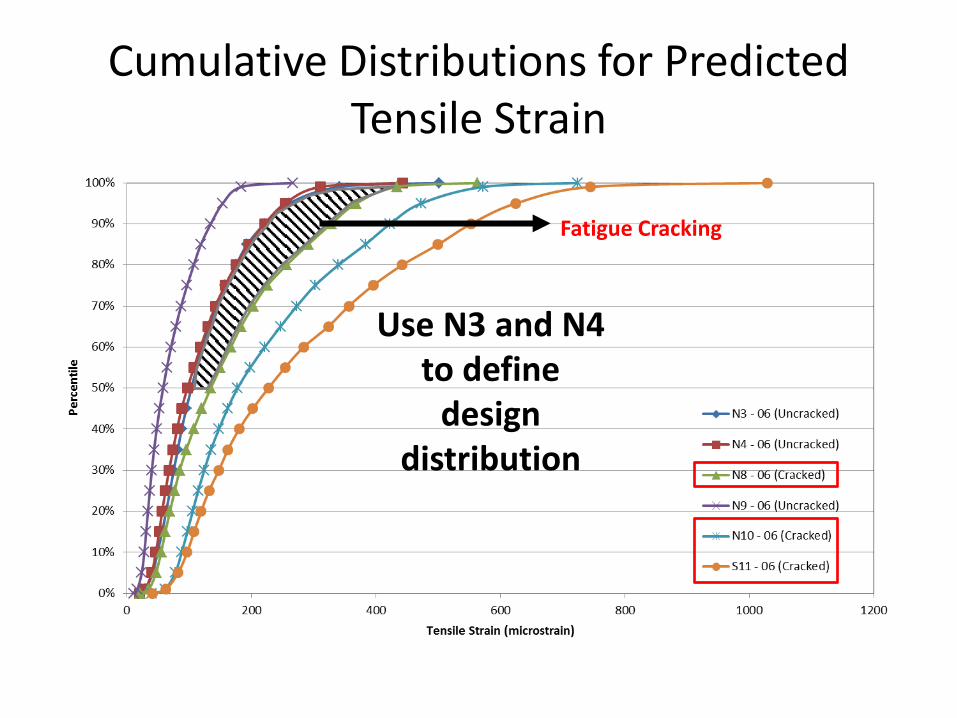
Cumulative Distributions for Predicted Tensile Strain
Fatigue Cracking
Use N3 and N4 to define
design distribution

Fatigue Ratio • Fatigue Ratio*:
– Rn = fatigue ratio at nth percentile – εn = tensile strain at bottom of AC, at nth percentile – εf = laboratory-determined fatigue threshold
𝑹𝑹𝒏𝒏 =𝜺𝜺𝒏𝒏𝜺𝜺𝒇𝒇
*Willis, J.R. and D.H. Timm. Field-Based Strain Thresholds for Flexible Perpetual Pavement Designs, Report No. 09-09, National Center for Asphalt Technology, Auburn University, 2009.

Results
Percentile
Maximum Design Fatigue
Ratio N8 (FC)
N9 (NC)
N10 (FC)
S11 (FC)
50% 0.68 0.66 0.29 1.37 1.93 55% 0.74 0.74 0.32 1.52 2.15 60% 0.81 0.82 0.35 1.70 2.41 65% 0.88 0.90 0.39 1.90 2.74 70% 0.96 1.00 0.43 2.10 3.02 75% 1.06 1.11 0.48 2.32 3.35 80% 1.18 1.26 0.53 2.61 3.75 85% 1.31 1.43 0.59 2.95 4.24 90% 1.49 1.62 0.66 3.25 4.69 95% 1.73 1.82 0.76 3.64 5.30 99% 2.19 2.14 0.91 4.40 6.31

Criteria
Percentile
Limiting Design Distribution for Predicted Strain
Maximum Design Fatigue Ratio for Predicted Strain
1% 29 5% 41
10% 48 15% 54 20% 60 25% 66 30% 71 35% 78 40% 84 45% 91 50% 100 0.68 55% 110 0.74 60% 120 0.81 65% 131 0.88 70% 143 0.96 75% 158 1.06 80% 175 1.18 85% 194 1.31 90% 221 1.49 95% 257 1.73 99% 326 2.19

VALIDATION RESULTS

Validation Dataset

Validation Dataset
Core on transverse crack
Core on longitudinal crack
Section S8

Validation Results
Section
Fatigue Endurance Limit (µε)
Percentile at Fatigue Endurance Limit based on
Predicted Strain Distribution
N10 (2009) 100 37th N11 (2009) 134 45th S8 (2009) 92 9th S9 (2009) 92 18th
S10 (2009) 99 16th S11 (2009) 94 6th
FEL = 134 µε

CRITERIA IN DESIGN

Perpetual Pavement Design Framework
Traffic
Climate Material Properties
Pavement Structure
Mechanical Analysis
σ, ε
Response Criteria: Fatigue Cracking
Rutting

Perpetual Pavement Design
Adjust cross-section to meet design limit

Perpetual Pavement Design

Perpetual Pavement Design
• Develop maximum AC thickness tables • Following SHRP R23 report*, developed tables
based on regional conditions – Minneapolis – Baltimore – Phoenix
*Jackson, N., J. Mahoney, and J. Puccinelli. Using Existing Pavement in Place and Achieving Long Life, Final Report, SHRP 2 R23, TRB, Washington, D.C., 2012.

Develop Maximum Thickness City
Overall Mean Temperature (°F)
Seasonal Information Month Duration Temperatures (°F)
Minneapolis
45°F Winter 17 weeks 21 Spring 13 weeks 45 Summer 13 weeks 70 Fall 9 weeks 56
Phoenix
70°F Winter 13 weeks 54 Spring 13 weeks 68 Summer 17 weeks 87 Fall 9 weeks 66
Baltimore
56°F Winter 13 weeks 35 Spring 13 weeks 54 Summer 17 weeks 74 Fall 9 weeks 53
Jackson, N., J. Mahoney, and J. Puccinelli. Using Existing Pavement in Place and Achieving Long Life, Final Report, SHRP 2 R23, TRB, Washington, D.C., 2012.

Develop Maximum thickness
• Developed tables based on varying subgrade and base moduli • Criteria:
– Fatigue Cracking = Design cumulative strain distribution – Rutting = 50th percentile < 200µε
Layer Modulus (psi) Poisson’s Ratio
Thickness
Input
Distribution (COV)
Input Average Distribution (COV)
AC Varied based on binder and
season
Log-normal (30%)
0.35 Varied Normal (5%)
Base 30, 50, 100, 250, and 500 ksi
Log-normal (40%)
0.4 6, 8 and 10 in. Normal (8%)
Subgrade 5, 10, and 20 ksi Log-normal (50%)
0.45 Semi-infinite Not applicable

Maximum Thickness Base = 6 inches
Subgrade Mr (ksi)
Base Mr (ksi)
Calculated AC Thickness (in.) Range of
Maximum Thicknesses (in.)
Minneapolis (PG 64-34)
Phoenix (PG 70-22)
Baltimore (PG 64-22) Average
5 30 12.5 15.5 14 14.0 12.5-15.5 5 50 12 15 14 13.7 12-15 5 100 12 14 13.5 13.2 12-14 5 250 8.5 12 10 10.2 8.5-12 5 500 8 11 9 9.3 8-11
10 30 10.5 14 12 12.2 10.5-14 10 50 10.5 13 12 11.8 10.5-13 10 100 10 12 11 11.0 10-12 10 250 8.5 11 9.5 9.7 8.5-11 10 500 7.5 10.5 8.5 8.8 7.5-10.5 20 30 9 12.5 10 10.5 9-12.5 20 50 8.5 12.5 9.5 10.2 8.5-12.5 20 100 8 12 9 9.7 8-12 20 250 7.5 10.5 8.5 8.8 7.5-10.5 20 500 7 10 8 8.3 7-10

Maximum AC Thickness

Conclusions
• No relationship between FEL, predicted strain levels and performance found for sections from 2006 and 2009 cycles
• Consider cumulative distribution of predicted strain rather than a single strain threshold
• All control points should be met on updated criteria – Design fatigue ratios should be less than all maximum
fatigue ratios at the 50th-99th percentiles
• Additional research to incorporate reliability – To guard against erroneous values due to high FEL

Recommendations
• Utilize strain distribution in place of conservative limiting strain of 70 µε – Re-design of PerRoad will include distribution
• Maximum AC thickness tables can be developed for state-specific climate, material, and subgrade conditions
• Maximum AC thickness tables can be used in conjunction with agency-specific design procedures to optimize pavement thickness
• For More information: NCAT Report 15-05

Acknowledgements
We would like to thank NAPA for supporting this research

Thank you

Dr. David H. Timm Brasfield & Gorrie Professor Department of Civil Engineering, Auburn University Email: [email protected] Dr. Mary M. Robbins Assistant Research Professor National Center for Asphalt Technology at Auburn University
Email: [email protected]


![Summary - labotec.co.za · Drug delivery systems \⠀䐀䐀匀尩 offer an easy prospective for improving the therapeutic efficiency o對f the existing drugs [1]. Enhanced therapeutic](https://static.fdocuments.in/doc/165x107/5f11d9a91b3511398358701f/summary-drug-delivery-systems-aoe-offer-an-easy-prospective-for-improving.jpg)