NEW Collective Bargaining -...
169
Collective bargaining and workplace performance: An investigation using the Workplace Employee Relations Survey 1998 Alex Bryson David Wilkinson Employment Relations Research Series No. 12
Transcript of NEW Collective Bargaining -...

Collective bargainingand workplace performance:
An investigation using the WorkplaceEmployee Relations Survey 1998
Alex BrysonDavid Wilkinson
Employment Relations Research Series No. 12

The views expressed in this report are the authors’ and do not necessarily reflect those of theDepartment of Trade and Industry.
© Crown Copyright 2001.

Acknowledgements
We would like to thank Barbara Kersley, John McQueeney, Carmen Alpin and theircolleagues at the Department of Trade and Industry for valuable comments on earlierversions of this paper, and for guidance throughout the study. We also appreciatedcomments on an earlier draft given by participants in an internal DTI seminar. Thanksalso to John Forth at NIESR for his advice and comments which were enormouslyvaluable in editing the WERS data to obtain accurate recognition and coverage data.
iii

iv
Foreword
Promoting good employment relations is an important task of government. Our role inthe Department of Trade and Industry is to encourage the development of a skilled andflexible labour market founded on the principle of partnership at work.
The Department commissions an ongoing programme of evaluation and research inemployment relations. In-house researchers, economists and policy advisors deviseresearch projects to be conducted on our behalf by external researchers, who arechosen through a competitive tendering process. Projects typically look at areas wherewe are interested in identifying good practice, in assessing the impact of particularpolicies or regulations, or examining emergent trends. Details of the programme appearregularly in Labour Market Trends and can be found at http:/www.dti.gov.uk/er/emar
The Research Series is where we disseminate the results of this work. The viewsexpressed in these publications do not necessarily reflect those of the Department. Wepublish these reports as a contribution towards an open debate about how we mightbest achieve our overall aim of improving competitiveness.
Mark BeatsonDirector, Employment Market Analysis and Research Branch
v

vi

Contents
Glossary ix
Executive summary xi
1. The aims of the study and the policy context 1
2. The role of trade unions 3
2.1 Changes in collective bargaining 32.1.1 Bargaining arrangements 32.1.2 Bargaining coverage 42.1.3 Bargaining levels 5
2.2 The influence of bargaining on workplacefinancial performance and climate 5
2.3 Other measures of trade unionism 82.3.1 The effects of union strength 82.3.2 The effects of support for unions among
employers and employees 112.3.3 Employee perceptions of union influence
and effectiveness 122.4 Summary 13
3. Procedures for collective bargaining: a typology 14
3.1 Bargaining arrangements at the workplace 143.2 Levels of collective bargaining 153.3 Summary 17
4. Management perceptions of the employee relations climate 19
4.1 Possible links between collective bargaining andmanagerial perceptions of climate 20
4.2 Associations between collective bargaining andmanagerial perceptions of climate 21
4.3 Multivariate analyses of the associations betweencollective bargaining and managerialperceptions of climate 234.3.1 Modelling procedures 234.3.2 Limitations to the analysis 234.3.3 Control variables 24
4.4 Results 244.4.1 The impact of bargaining arrangements 244.4.2 The impact of bargaining levels 27
4.5 Summary 28
vii
5. Employee perceptions of the employee relations climate 31
5.1 Possible links between collective bargaining andemployee perceptions of climate 32
5.2 Associations between collective bargaining andemployee perceptions of climate 34
5.3 Multivariate analyses of the associations betweencollective bargaining and employee perceptions of climate 345.3.1 The sample 365.3.2 Tackling limitations to the analysis 365.3.3 Control variables 36
5.4 Results 375.4.1 The impact of bargaining arrangements 375.4.2 The impact of bargaining levels 42
5.5 Summary 45
6. Workplace financial performance 48
6.1 The measure of financial performance 486.2 Associations between workplace financial performance
and collective bargaining 516.3 Control variables 546.4 Multivariate models of workplace financial performance 54
6.4.1 Whole economy and trading sector models of collectivebargaining arrangements and financial performance 55
6.4.2 Private trading sector models of collective bargainingarrangements and workplace financial performance 56
6.4.3 Summary of the impact of collective bargaining arrangementson financial performance 56
6.4.4 Collective bargaining levels and workplacefinancial performance 56
6.4.5 Summary of findings on the impact of collective bargaining on workplace financial performance 58
6.4.6 Union recognition, the market, and workplacefinancial performance 59
6.5 Summary 61
7. Conclusions 62
7.1 Findings 627.2 Reflections on wider issues raised by the study 63
References 67
Appendix 1: A description of the Workplace EmployeeRelations Survey 1998 71
Appendix 2: Modelling procedures 72
Appendix 3: Controls used in analyses of managerial perceptionsof the employee relations climate 73
Appendix 4: Controls used in analyses of employeeperceptions of climate 75
Appendix 5: Controls used in analyses of managerial perceptions of the workplace’s relative financial performance 76
Appendix Tables 78
viii
Glossary
Bargaining arrangement
The way in which unions (and employers) are organised for bargaining purposes. Specifically,whether the employer negotiates with a single union or multiple unions and, if with more thanone union, whether negotiations are with unions separately or jointly.
Bargaining coverage
The percentage of workers in a workplace whose pay is set by collective bargaining.
Bargaining levels
The levels at which pay bargaining occurs (workplace, organisation or industry).
Closed shop
Where employees are required to be union members. Where some employees have to bemembers of a union to get or keep their jobs, this is called a post-entry closed shop. If newrecruits have to be union members before they start work, this is called a pre-entry closed shop.
Recognised union
Throughout the Workplace Industrial Relations Surveys Series (WIRS), managers who say thereare union members at the workplace have been asked whether any of the unions are recognisedby the employer for negotiating pay for any section of the workforce at the establishment. Thisinformation is collected for each union. If negotiations take place at a higher level in anorganisation, but apply to employees in the sampled establishment, the union is recognised.
Single-table bargaining
Multiple unions negotiating jointly with an employer.
Union density
The percentage of employees in union membership.
Unionised workplaces
Those workplaces recognising union(s) for pay bargaining.
ix

WERS98
The Workplace Employee Relations Survey 1998, the most recent in the WIRS series, departsfrom its predecessors in two important respects. It is representative of British workplaces with10 or more employees, and it contains a survey of employees.
WIRS
The Workplace Industrial Relations Surveys series, which is a nationally representative survey ofworkplaces in Britain with 25 or more employees conducted in 1980, 1984, 1990 and 1998.WIRS80, WIRS84 and WIRS90 refer to the respective surveys.
Collective bargaining and workplace performance
x
Executive summary
Aims of the study
The purpose of this study is to investigate what impact, if any, collective bargaining had onmanagerial and employee perceptions of the employee relations climate and managerialperceptions of workplace financial performance in Britain by the end of the 1990s. Thisassessment is made using descriptive and multivariate analyses of the 1998 WorkplaceEmployee Relations Survey (WERS98), a nationally representative survey of workplaces andemployees in all but the smallest workplaces.
The study has two principal aims:
(a) mapping the extent of different aspects of collective bargaining in Britain; and
(b) identifying associations between aspects of collective bargaining and performance usingmultivariate techniques, which control for other influences.
Mapping collective bargaining
In mapping collective bargaining, distinctions were made between:
• bargaining arrangements, by which we mean ways in which unions and employers areorganised for bargaining purposes and, specifically, whether the employer negotiates witha single union or multiple unions and, if with more than one union, whether negotiations arewith unions separately or jointly;
• bargaining coverage, that is, the percentage of workers in a workplace whose pay is set bycollective bargaining;
• bargaining levels, that is, the level at which pay bargaining occurs (workplace, organisationor industry).
Simple typologies were developed for these three aspects of bargaining, and these were usedin the analyses. WERS shows that, among workplaces with at least 10 employees:
• 36 per cent of all workplaces recognise trade unions. Approximately two-fifths are in theprivate sector.
• Around a quarter of all workplaces recognise only one union. These single union workplaceswere split evenly across the public and private sectors.
• Only 14 per cent of all workplaces recognise more than one union: 38 per cent in the publicsector and 5 per cent in the private sector.
• 8 per cent of workplaces have single-table bargaining (22 per cent in the public sector and3 per cent in the private sector).
• In around 6 per cent of workplaces employers negotiate with separate unions over pay (13 per cent in the public sector, 2 per cent in the private sector).
xi

Associations between collective bargaining and performance
Managerial perceptions of the employee relations climate
• 90 per cent of managers rated the employee relations climate as either ‘very good’ or ‘good’.
• Across the economy as a whole, bargaining arrangements and bargaining levels had littleeffect on managerial perceptions of climate. Climate was viewed most positively wheresome but by no means all workers had their pay set by collective bargaining. Managementsupport for unions also fostered better climate.
• In the private sector, climate was poorer in the small percentage of workplaces where therewere three or more recognised unions, and they were better where there was mid-rangebargaining coverage and in the less than 1 per cent of workplaces with multi-level bargaining.
• In the public sector, climate was better where separate bargaining with groups of unionswas avoided, but there was no advantage to single-table bargaining over separatenegotiations with individual unions. Bargaining levels were not associated with climate.Climate was better where a low percentage of employees were covered by collectivebargaining, but poorest where there was no effective bargaining over pay.
Employee perceptions of the employee relations climate
• Employees had poorer perceptions of the employee relations climate than managers did.Fifty-five per cent of employees regarded the employee relations climate as ‘very good’ or‘good’. Employee perceptions of climate were poorer than managers’ perceptions withinthe same workplace in nearly half of all cases.
• In the economy as a whole, climate was poorer where there was separate bargaining witheach union, and where there were multiple unions. Climate was better in the less than 1 percent of workplaces with multi-level bargaining, where management supported unions, andwhere employees perceived unions as effective.
• In the private sector, climate was poorest in the small proportion of workplaces where therewas separate bargaining with each union. In the public sector, employee perceptions ofclimate were better where there was multi-level bargaining.
• Union members had poorer perceptions of climate than non-members did, whetherrecognised unions were present or not. This is a common finding in the literature on climate,so it is not an unexpected finding. Their perceptions of climate were poorer where there wasseparate bargaining, whereas collective bargaining did not affect non-members’perceptions of climate.
Managerial perceptions of workplace financial performance
• Financial performance is defined in terms of managers’ perceptions of the workplace’sperformance relative to similar workplaces in the same industry.
• Union recognition and bargaining arrangements were not associated with financialperformance. This finding held for the whole economy, the trading sector and the privatetrading sector, and when restricting the analysis to those using profit or value added as theirmeasure of performance.
• However, unions improved financial performance where the workplace faced a declining orturbulent market.
• Industry-level bargaining was associated with better financial performance. However, it isnot possible to determine the direction of causation.
Collective bargaining and workplace performance
xii
Implications of the findings
Despite moves towards simplified bargaining arrangements in the 1990s, there was no clearevidence of benefits arising from management dealing with a unified worker voice, although theavoidance of separate bargaining arrangements appeared advantageous in some circumstances.Analysis of panel data may shed further light on the issue.
Employer orientations to unions and union membership played an important role in determiningperformance outcomes. Managerial support for unions and union membership, and apreparedness to engage seriously with unions, brought rewards in terms of improved climate.Employees’ belief that managers took unions seriously improved their perceptions of climate,even where unions were not recognised. Equally, where unions were present, managementopposition to them was detrimental to climate. This is consistent with the notion that theworkplace can benefit from social partnership.
Unions were also beneficial where employees viewed them as effective in ‘delivering’ for them.The question that arises is what are the conditions under which employees perceive unions aseffective, and thus able to contribute to better employee relations?
The absence of general union effects on financial performance, and their positive effects in theface of difficult product market conditions, implies that the negative influences of unions onperformance, identified in earlier studies (McNabb and Whitfield, 1997; Machin et al., 1991,1993; Machin and Stewart, 1990, 1996) have diminished in the 1990s.
Directions for future research
This research could be usefully extended in the following ways.
Panel analysis: Using the Workplace Industrial Relations Survey (WIRS) 1990-1998 Panel itwould be easier to make causal inferences about the impact of unions on performance. Thesedata also permit analysis of the impact of switches in regime, such as a move towards single-tablebargaining, on changes in performance.
Alternative performance measures: The robustness of results could be tested on alternativemeasures of climate and performance. The latter could include financial information from theAnnual Business Inquiry that could be matched to manufacturing workplaces in WERS.Research could be extended to other performance indicators such as labour productivity.
Organisation-level analysis: In many instances, non-independent workplaces are expected tofollow policies or procedures emanating from higher up in the organisation. Organisation-levelanalysis would therefore be a useful complement to the workplace-level analysis presented here.
Tackling the changing nature of unions: Aspects of unionism which have not featuredprominently in previous empirical research, such as their effectiveness in ‘delivering’ formembers and employers, and managerial attitudes towards unions, negotiation andconsultation, could be explored more thoroughly in future. As regards more traditionalmeasures, there are mismatches in the WERS data between indicators of union recognition andbargaining coverage. These ought to be investigated further to establish whether they reflect‘real world’ circumstances or data issues.
Executive summary
xiii
Overview of the report
The main body of the report provides:
• An outline of the current policy context and overview of the changing influence of tradeunions in Great Britain over the last two decades (Chapters 1 and 2).
• An outline of the theories linking unions with the employee relations climate and workplaceperformance, and a review of the empirical literature on these links (Chapter 2).
• A map of the terrain identifying the main features of collective bargaining using WERS98.This provides a simplified typology of bargaining arrangements, coverage and levels usedin the subsequent analysis (Chapter 3).
• An analysis of the association between unions and managerial perceptions of the employeerelations climate based on WERS98 (Chapter 4).
• An analysis of the association between unions and employee perceptions of the employeerelations climate based on WERS98 (Chapter 5).
• An analysis of the association between unions and managerial perceptions of workplacefinancial performance based on WERS98 (Chapter 6).
• Conclusions bringing together the main findings relating to bargaining arrangements,bargaining levels, bargaining coverage, managerial attitudes to unions, and union strengthand effectiveness, sets them in the wider policy context, identifies the contribution made bythe study, and discusses some conceptual and methodological issues that should beaddressed to take the debate forward.
The appendices are provided for those with a technical interest in methodology and thespecification of econometric models.
Appendix One provides a description of the Workplace Employee Relations Survey 1998.
Appendix Two explains modelling procedures.
Appendix Three presents the control variables used in analyses of managerial perceptions of theemployee relations climate.
Appendix Four presents the control variables used in analyses of employee perceptions of climate.
Appendix Five presents the control variables used in analyses of managerial perceptions of theworkplace’s relative financial performance.
Collective bargaining and workplace performance
xiv
CHAPTER 1
The aims of the study and the policy context
The Department of Trade and Industry commissioned the Policy Studies Institute to study whatimpact, if any, trade unions had on workplace performance in Britain by the end of the 1990s.Research for the 1980s had indicated that, on the whole, unions had a negative impact onworkplace economic performance and, in many instances, were associated with a pooreremployee relations climate. However, there were grounds for believing that two decades ofdecline may have undermined union influence on workplace performance. The paperinvestigates the effects of collective bargaining on workplace performance using the 1998Workplace Employee Relations Survey (WERS98), a nationally representative survey ofworkplaces and employees in all but the smallest workplaces.1 In assessing workplaceperformance, we examine managers’ perceptions of workplace financial performance, andmanagement and employee perceptions of the employee relations climate. The objective is to‘map’ the effect of unions prior to the introduction of statutory rights to union recognition underthe Employment Relations Act 1999.
The unionised sector of the economy has shrunk due to a continual fall in union membershipsince the early 1980s and, since the mid-1980s, a rapid drop in the number of employersrecognising unions for collective bargaining (Millward et al., 2000). Where unions have retaineda foothold, they appear to have lost influence over a range of workplace outcomes (Stewart,1995; Gallie and Rose, 1996: 47). This has prompted one commentator to suggest thatcollective bargaining ‘may at times constitute a hollow shell’ (Hyman, 1997: 318), with unionsincreasingly ‘dominated by the employer, with no independent representation of workers’interests’ (Hyman, 1997: 314). According to Hyman, this situation reflects ‘labour marketspervaded by insecurity, a restructured workforce and a profoundly hostile legal framework’(1997: 314). The implication is that employers are choosing to use the shift in bargaining powerresulting from these changes to refashion their relationship with organised labour in the hope ofregaining managerial prerogatives. There is evidence to support this contention. Gallie et al.,(1998: 107) identify a ‘hardening of employer attitudes to unions since the mid-1980s’ in theirsurvey data, and case studies have uncovered instances in which recognised unions are by-passed in managerial decision-making (Marchington and Parker, 1990; Darlington, 1994).Previous analysis of WERS98 showed that managers in workplaces with recognised unionsoften prefer to deal directly with employees (Cully et al., 1999: 88).
However, the most recent evidence indicates that, while there has been a marked decline inunion density and bargaining coverage in the 1990s, in some important respects – on-site unionrepresentation, joint regulation over procedures, and the scope of collective bargaining – therehas been surprisingly little change (Millward et al., 2000: 138-183). The pattern of union declinemay be less uniform than is often portrayed, suggesting the value of identifying the effects ofdifferent aspects of trade unions in different contexts.
On the whole, these trends suggest unions’ influence over workplace performance may havediminished in the last decade since that influence is increasingly contingent on theirorganisational strength and bargaining power (Machin and Stewart, 1996; Menezes-Filho, 1997).The extent and direction of unions’ impact on the employee relations climate is also uncertainsince this depends on unions’ strength, their effectiveness and management support for unions(Bryson, 1999a).
1

The remainder of the paper is set out as follows. Chapter Two discusses the role unions play ininfluencing workplace performance in theory and in practice; introduces aspects of tradeunionism used in the analysis; and describes changes in the nature of collective bargaining sincethe 1980s. Chapter Three presents a typology for collective bargaining procedures whichprovides the rationale for the bargaining variables that appear in our analysis. Chapter Four isthe first of our three substantive chapters assessing the impact of collective bargaining onperformance. It assesses influences on managerial perceptions of the employee relationsclimate. Having identified possible links between bargaining and perceptions of climate, itpresents descriptive analyses, followed by multivariate analyses before concluding with asummary. This is the format for Chapter Five, which deals with employee perceptions of climate,and for Chapter Six, which analyses workplace financial performance. Chapter Seven concludes,pulling together the main findings and reflecting on broader issues raised by the study.
Endnote
1 A description of WERS98 is presented in Appendix One.
Collective bargaining and workplace performance
2
CHAPTER 2
The role of trade unions
In this chapter we do three things:
• identify the main trends in the nature of collective bargaining since the 1980s;
• discuss the possible influences of bargaining on workplace financial performance and climate;
• discuss the potential impact of other aspects of unions on performance.
2.1 Changes in collective bargaining
Although much has been written about the influence of unions over the last decade, littleattention has been paid to the impact of collective bargaining on performance. Yet, as notedbelow, collective bargaining can have a profound effect on workplace outcomes. Weconcentrate on three aspects of collective bargaining covered in the Workplace IndustrialRelations Surveys: bargaining arrangements, bargaining coverage, and bargaining levels. Themain trends are noted in Box 2.1.
2.1.1 Bargaining arrangements
Bargaining arrangements refer to the ways in which unions (and employers) are organised forbargaining purposes. An individual union may negotiate separately for different groups ofworkers but, in the main, the number of recognised unions at a workplace sets a limit on thenumber of separate bargaining groups. Separate unions may negotiate together. Where allrecognised unions negotiate together this is known as ‘single-table bargaining’.
During the 1990s, there was a major switch away from separate bargaining to joint bargainingin workplaces where collective bargaining was the dominant form of pay determination (Millwardet al., 2000: 203). In 1990, only 40 per cent of these workplaces had single bargaining units. Thishad risen to 77 per cent in 1998. The trend was apparent in private services, privatemanufacturing, and the public sector. The principal cause of the trend to single-table bargainingwas not the reduction in multi-unionism which occurred over the period, but a simplification ofbargaining arrangements where more than one union existed (Millward et al., 2000: 204). Thechange was the result of behavioural change in workplaces which continued in operation overthe period, coupled with the near universal adoption of single-table bargaining among unionisedworkplaces that had come into being since 1990 and those growing above the 25-employeethreshold used for sampling in the WIRS series. If these trends continue, single-table bargainingwill become still more prevalent.
3
Box 2.1: Trends in collective bargaining where unions are recognised for pay bargaining, 1984-1998
● Decline in multi-unionism● Increase in single-table bargaining● Fall in percentage of employees covered by collective bargaining● Decline in multi-employer bargaining and a rise in multi-site single-employer bargaining

Bargaining structures are not simply determined by unions. Indeed, when Millward et al. (2000)investigated the reasons why continuing workplaces had shifted to single-table bargaining, theyconcluded that ‘many, if not most, of the moves towards simpler negotiating arrangements wereat the instigation of management’ (Millward et al., 2000: 205). If, as suggested in Chapter One,employers have successfully exploited shifts in bargaining power to refashion bargainingarrangements to their advantage, this implies an association between single-table bargainingand better performance.
2.1.2 Bargaining coverage
The percentage of workers whose pay is jointly determined by employers and unions throughcollective bargaining is a crucial measure of union influence in the workplace. By this measure,unions have lost a good deal of influence over joint regulation since the mid-1980s, despitebeing formally recognised for pay bargaining. There has been a marked decline in collectivebargaining coverage in unionised workplaces since 1984 affecting all three broad sectors of theeconomy (Millward et al., 2000: 159-167). Mean collective bargaining coverage among unionisedworkplaces with 25 or more employees fell from 86 per cent to 67 per cent between 1984 and1998. Furthermore, for the first time, a sizeable proportion of workplaces with recognised unionsreported having no workers covered by collective bargaining. This phenomenon was particularlypronounced in the private sector, as indicated in Table 2.1 (which also incorporates workplaceswith 10-24 employees).2 The rate of decline, and the emergence of many unionised establishmentswith no effective bargaining, has been so dramatic that commentators suggest it ‘may mark aqualitatively different phase in the development of unionism’ (Millward et al., 2000: 167).
The decline in coverage in the 1990s was due to changes in the behaviour of continuingworkplaces, combined with particularly low coverage among unionised workplaces that hadcome into being since 1990 and those growing above the 25-employee threshold used forsampling in the WIRS series. Declining coverage accompanied declining union density, a findingconsistent with the proposition that managements have reduced coverage where support forunions has diminished. However, coverage fell most rapidly where there was no closed shop oremployer endorsement of membership, suggesting that dwindling employee support for unionsmay also have played a part.
Collective bargaining and workplace performance
4
Table 2.1: Employee coverage by collective bargaining in workplaces with recognised unionsin 1998
Private sector Public sector All
None 30 8 181-19 per cent 5 6 620-39 per cent 2 8 540-59 per cent 6 10 860-79 per cent 8 8 880-99 per cent 20 5 11100 per cent 28 56 44
Mean 56 73 66
Weighted base 319 429 748Unweighted base 560 573 1,133
Bases: all establishments with 10 or more employees where recognised trade unions. Note: in 7 per cent of privatesector workplaces and 5 per cent of public sector workplaces (unweighted) respondents did not know the percentageof employees covered by collective bargaining. These are excluded from the table.

2.1.3 Bargaining levels
Where unions are recognised, pay bargaining may occur at workplace-level, higher up in theorganisation where the workplace is part of a multi-site organisation, in a multi-employer setting,or a combination of these. How near or far the locus of decision-making is from the workplacecan determine the significance of workplace-level inputs from management and workers on-site. It may therefore shed light on conditions under which workplace unionism has an impacton performance. Chapter Three presents descriptive information on the incidence of thesearrangements in 1998 with a typology characterising workplaces according to bargaining levels.
Our analysis of the impact of unions on performance is at the level of the workplace. However,it is increasingly the case that recognition for pay bargaining affects only a minority of workers,even where unions are recognised for pay bargaining. In 1998, collective bargaining coveragewas less than 50 per cent in 39 per cent of workplaces with 25 or more employees withrecognised unions (Millward et al., 2000: 160), and 33 per cent in workplaces with 10 or moreemployees. In characterising pay determination at workplace-level, one has to invent some rulesas to when a workplace can be said to have collective bargaining and, if so, at what level it occurs.
Millward et al. (2000: 185-187) characterise workplaces with 25 or more employees accordingto the wage-setting arrangement that applies to the majority of employees at the establishment.3
Thus, where coverage is 50 per cent or more, the workplace is treated as a collective bargainingestablishment. Using this definition, the percentage of collective bargaining workplaces withworkplace-level bargaining has remained roughly constant since 1984, at around 10 per cent.However, multi-employer bargaining has declined, while the percentage where the most distantlevel of negotiation was multi-site employer level has doubled. In Chapter Three we presentsimilar information for workplaces with 10 or more employees in WERS98, distinguishingbetween those in which the majority of workers have their pay set by collective bargaining, andthose which do not.
2.2 The influence of bargaining on workplace financial performanceand climate
Relations between unions and employers are often portrayed as a ‘zero-sum game’, where unionmembers benefit at the expense of employers, and vice versa. However, there is theory andevidence to indicate that both workers and employers can benefit from unions under certain conditions.
Unions may have offsetting influences on workplace performance and climate arising from theirdual function in bargaining on behalf of members for improved pay and conditions, on the onehand, and in representing the ‘voice’ of workers to management on the other. Consequently,their actual impact on performance is a matter for empirical investigation.
Where unions use their bargaining power to take a greater share of profits at the expense of thefirm, this will reduce profitability. If this entails discord or conflict, or managers find union strengthlimits their ability to manage effectively, managers’ perceptions of management-employeerelations climate may deteriorate. However, if managers are content to pay higher wages, theremay be no impact on employers’ perceptions of climate. Higher pay may make employees moreinclined to view climate positively. But again, if the process of negotiation results in discord or theinability of managers to work efficiently promotes employee perceptions of managerial incompetence,this may colour employee perceptions of climate in spite of the better conditions they enjoy.
By giving ‘voice’ to workers’ concerns and grievances, and by helping to represent thoseconcerns and grievances to management, unions may significantly increase worker motivationand organisational commitment, thereby improving productivity and performance, as well asimproving perceptions of good workplace governance and contributing to collaborativemanagement-employee relations (Freeman and Medoff, 1984).4
The role of trade unions
5
So strong unions may be beneficial or harmful to management, influencing perceptions ofperformance and climate. However, weak unions may also be problematic for management.Although they will be unable to wield much bargaining power, they may also be unable to act asan effective voice for employees, in which case one might expect them to have a negligibleeffect on performance and climate.
It makes little sense for employers to maintain ineffectual unions, since unions require influenceif they are to reduce the employer agency costs in maintaining and enforcing desired levels ofworker effort. Also, distributive bargaining relies on ‘interdependency’ between employer andunion, at least in the long run (Walton and McKersie, 1965).
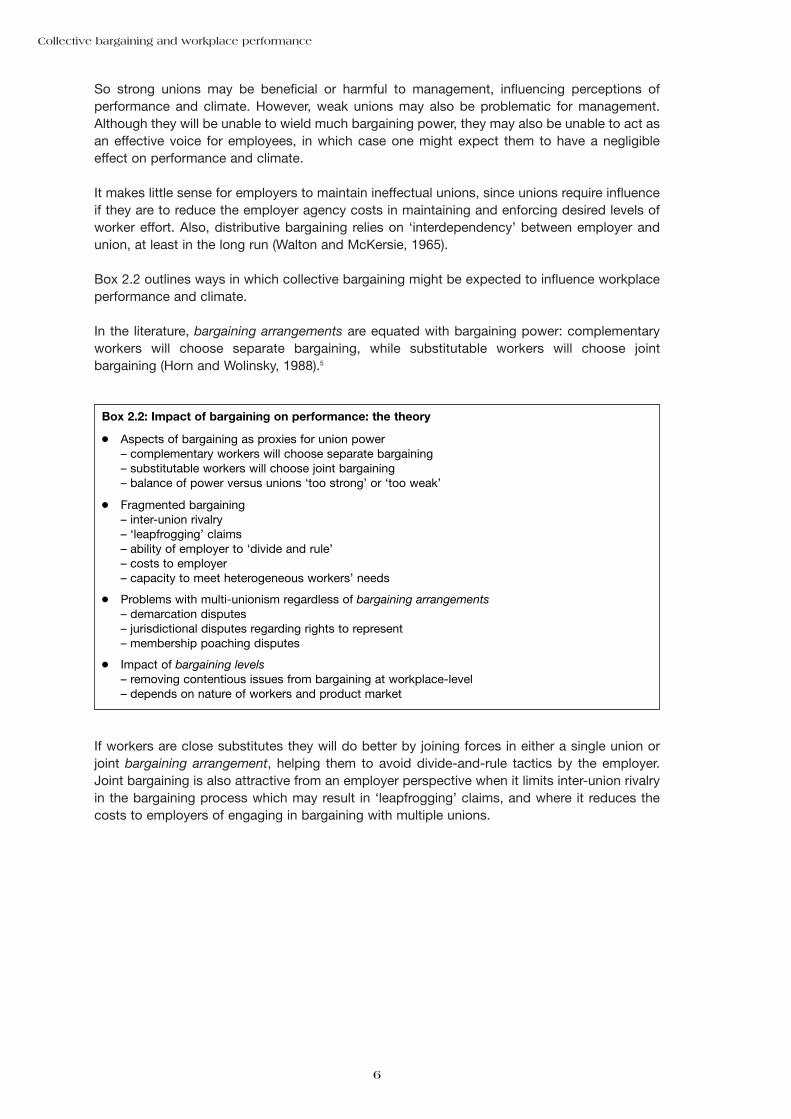
Box 2.2 outlines ways in which collective bargaining might be expected to influence workplaceperformance and climate.
In the literature, bargaining arrangements are equated with bargaining power: complementaryworkers will choose separate bargaining, while substitutable workers will choose jointbargaining (Horn and Wolinsky, 1988).5
If workers are close substitutes they will do better by joining forces in either a single union orjoint bargaining arrangement, helping them to avoid divide-and-rule tactics by the employer.Joint bargaining is also attractive from an employer perspective when it limits inter-union rivalryin the bargaining process which may result in ‘leapfrogging’ claims, and where it reduces thecosts to employers of engaging in bargaining with multiple unions.
Collective bargaining and workplace performance
6
Box 2.2: Impact of bargaining on performance: the theory
● Aspects of bargaining as proxies for union power– complementary workers will choose separate bargaining– substitutable workers will choose joint bargaining– balance of power versus unions ‘too strong’ or ‘too weak’
● Fragmented bargaining– inter-union rivalry– ‘leapfrogging’ claims– ability of employer to ‘divide and rule’– costs to employer– capacity to meet heterogeneous workers’ needs
● Problems with multi-unionism regardless of bargaining arrangements– demarcation disputes– jurisdictional disputes regarding rights to represent– membership poaching disputes
● Impact of bargaining levels – removing contentious issues from bargaining at workplace-level– depends on nature of workers and product market

If groups of workers are highly complementary, each group is powerful under separatebargaining as the employer needs all groups to maintain production. Furthermore, separatebargaining arrangements may permit consideration of different issues facing different groups ofworkers. If this delivers desirable outcomes for workers, the process may result in increasedworker motivation, improved productivity and thus performance. Nevertheless, separatebargaining always carries with it the risk that employers will be able to ‘divide-and-rule’, leadingto a deterioration in employees’ perceptions of the employee relations climate.
What happens in practice depends on the relative bargaining power of the parties involved andon whether workers are complements or substitutes for one another.
It is important to distinguish between the effects of the number of recognised unions per se, andseparate and joint bargaining in a multiple union context. One reason for this is that themechanisms by which multi-unionism may reduce efficiency, such as demarcation disputes,jurisdictional disputes regarding rights to represent, membership poaching disputes, and‘competitive militancy’ may all occur under joint bargaining, although it is rare in practice(Dobson, 1997). It is also possible that multi-unionism may increase productivity amongheterogeneous workers if it is a superior means of diagnosing and articulating workers’grievances (Metcalf, et al., 1993: 9).
Theoretical work demonstrates that, under certain conditions, industry-wide bargaining delivershigher wages, more strikes and lower profitability than ‘local’ bargaining.6 So there may also begrounds for linking bargaining levels with workplace performance outcomes.
Box 2.3 presents the fairly limited evidence for Britain on the impact of bargaining onperformance. There is support for the contention that fragmented bargaining arrangements areassociated with poorer performance, but the evidence on multi-unionism is mixed. Industry-level bargaining is associated with lower profitability. In subsequent chapters we establishwhether these findings hold in the late 1990s when union influence had declined somewhat andbargaining arrangements were very different.
There is no empirical evidence linking bargaining arrangements to climate.
The role of trade unions
7
Box 2.3: Empirical studies identifying effects of bargaining on performance
Study
Machin, Stewart and Van Reenen(1991, 1993) using WIRS84
McNabb and Whitfield (1997) using WIRS90
Menezes-Filho (1997)
Moreton (1999) using WIRS90
Outcome
Financial performance
Financial performance
Firm profitability
Labour productivity
Effect
-ve effect of separate bargaining amongmanual workers in manufacturing, butno effect of multi-unionism per se
-ve effect of multi-unionism per se
-ve effect of industry-level bargaining inmulti-union firms with joint bargaining
-ve effect of separate bargaining
2.3 Other measures of trade unionism
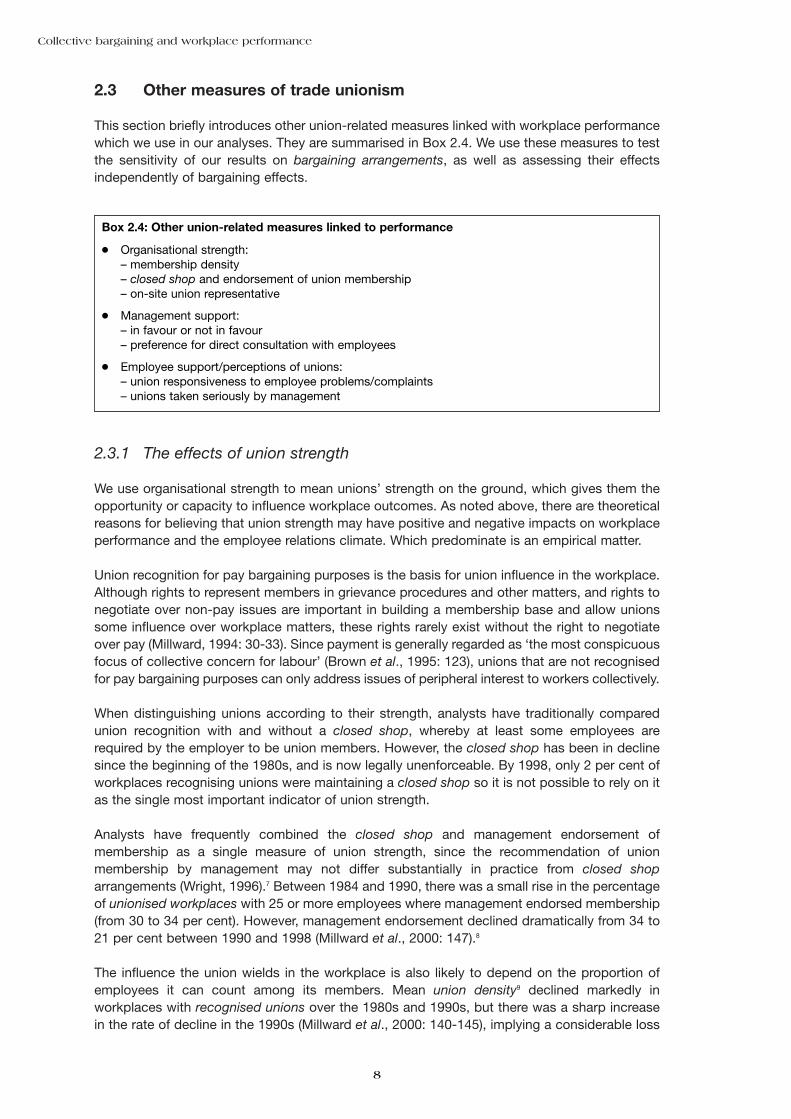
This section briefly introduces other union-related measures linked with workplace performancewhich we use in our analyses. They are summarised in Box 2.4. We use these measures to testthe sensitivity of our results on bargaining arrangements, as well as assessing their effectsindependently of bargaining effects.
2.3.1 The effects of union strength
We use organisational strength to mean unions’ strength on the ground, which gives them theopportunity or capacity to influence workplace outcomes. As noted above, there are theoreticalreasons for believing that union strength may have positive and negative impacts on workplaceperformance and the employee relations climate. Which predominate is an empirical matter.
Union recognition for pay bargaining purposes is the basis for union influence in the workplace.Although rights to represent members in grievance procedures and other matters, and rights tonegotiate over non-pay issues are important in building a membership base and allow unionssome influence over workplace matters, these rights rarely exist without the right to negotiateover pay (Millward, 1994: 30-33). Since payment is generally regarded as ‘the most conspicuousfocus of collective concern for labour’ (Brown et al., 1995: 123), unions that are not recognisedfor pay bargaining purposes can only address issues of peripheral interest to workers collectively.
When distinguishing unions according to their strength, analysts have traditionally comparedunion recognition with and without a closed shop, whereby at least some employees arerequired by the employer to be union members. However, the closed shop has been in declinesince the beginning of the 1980s, and is now legally unenforceable. By 1998, only 2 per cent ofworkplaces recognising unions were maintaining a closed shop so it is not possible to rely on itas the single most important indicator of union strength.
Analysts have frequently combined the closed shop and management endorsement ofmembership as a single measure of union strength, since the recommendation of unionmembership by management may not differ substantially in practice from closed shoparrangements (Wright, 1996).7 Between 1984 and 1990, there was a small rise in the percentageof unionised workplaces with 25 or more employees where management endorsed membership(from 30 to 34 per cent). However, management endorsement declined dramatically from 34 to21 per cent between 1990 and 1998 (Millward et al., 2000: 147).8
The influence the union wields in the workplace is also likely to depend on the proportion ofemployees it can count among its members. Mean union density9 declined markedly inworkplaces with recognised unions over the 1980s and 1990s, but there was a sharp increasein the rate of decline in the 1990s (Millward et al., 2000: 140-145), implying a considerable loss
Collective bargaining and workplace performance
8
Box 2.4: Other union-related measures linked to performance
● Organisational strength:– membership density– closed shop and endorsement of union membership– on-site union representative
● Management support:– in favour or not in favour– preference for direct consultation with employees
● Employee support/perceptions of unions:– union responsiveness to employee problems/complaints– unions taken seriously by management

of influence in the workplace. By 1998, it stood at 56 per cent.10 Higher union density mayinfluence employer and employee perceptions of a union’s legitimacy in representing workers’interests, predisposing them to take greater account of what the union is saying. Where unionsrepresent most of the workforce, they can represent workers’ interests with a strong ‘voice’.Where they represent a minority of workers, they may lack influence over sections of theworkforce. Consequently, their ability to work constructively with employers may be hamperedby their inability to deliver worker support for change. Equally, their ability to disrupt productionis diminished. These considerations may explain why employers are less likely to listen to theunion if only a minority of employees back it than if the union represents a majority voice – evenif the employer has chosen to recognise the union (Cully et al., 1999: 105-106).
Despite being an indicator of union strength, workplace union density has not featured in manyanalyses of workplace performance or employee relations climate, primarily because ofdifficulties in interpreting its effects. The proportion of a workforce that is unionised may bedirectly influenced by the performance of the workplace. For instance, where performance ispoor and workers fear for their jobs, they may be more inclined to join a union. In this case,higher union density may be correlated with poor performance, but it is the poor performancethat has resulted in higher density, rather than vice versa. Similarly, employees’ propensity to joina union may be affected by the existing employee relations climate. The second difficulty inusing workplace-level union density in estimating performance and climate is the difficulty ininterpreting what union density is capturing, since it is highly correlated with a number of otherunion measures, such as managerial support for unions, and managers’ desire to consult withunions rather than directly with employees (Cully et al., 1999: 90).
Another indicator of union organisational strength is the presence of a trade unionrepresentative. Union representatives may also be viewed as ‘voice mechanisms’, operating asa channel for communication between local membership and management, and assisting in theresolution of disputes and grievances (Cully et al., 1999: 201-3). WERS98 provides evidence thatworker representatives are increasingly conforming to this role, attaching greater importance to‘dealing with problems raised by the treatment of employees by management, and to resolvingdisputes’ (Cully et al., 1999: 201), rather than the more ‘traditional’ activities of maintainingwages and benefits. If they are effective in this role, the presence of representatives on-site maycontribute to more positive perceptions of management-employee relations.11
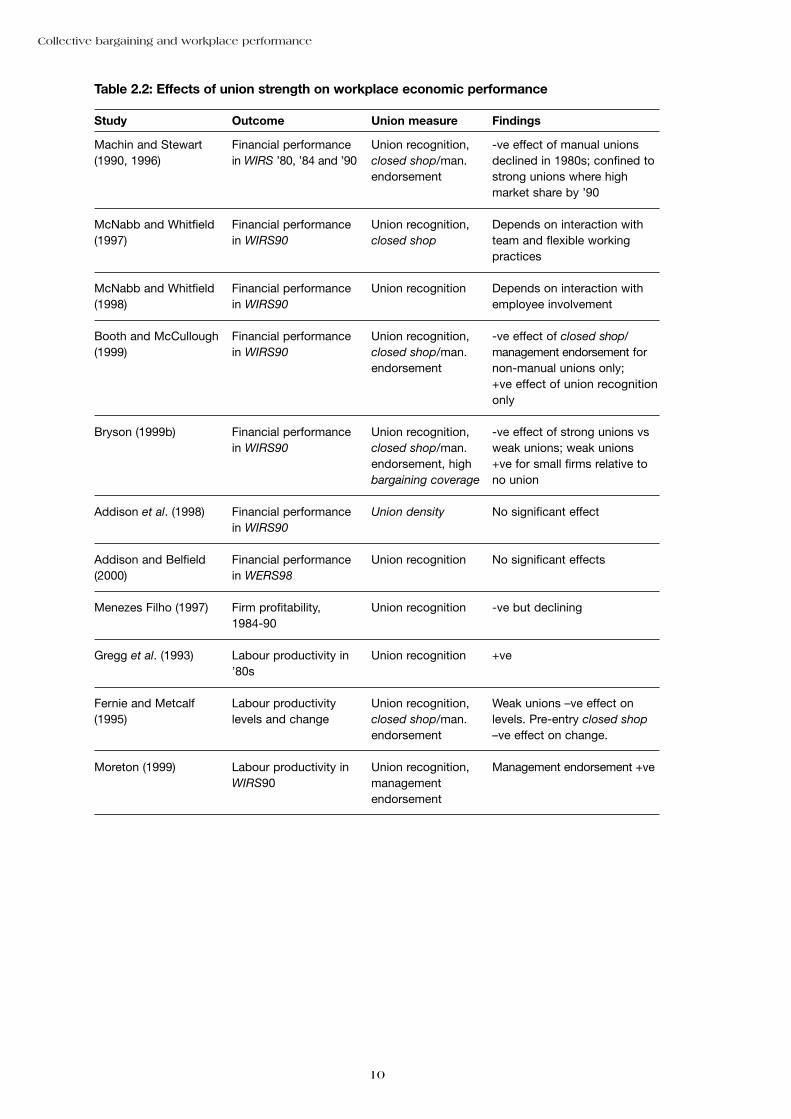
Some of the extensive literature on the impact of union strength on workplace performance issummarised in Table 2.2.12 It indicates that workplace economic performance does differ withthe strength of unions, but that the effect varies with the nature of the workers covered, the marketthe workplace operates in, and the interaction of unions with other employment practices. It alsoseems that the negative effect of unions on performance may have lessened over time.
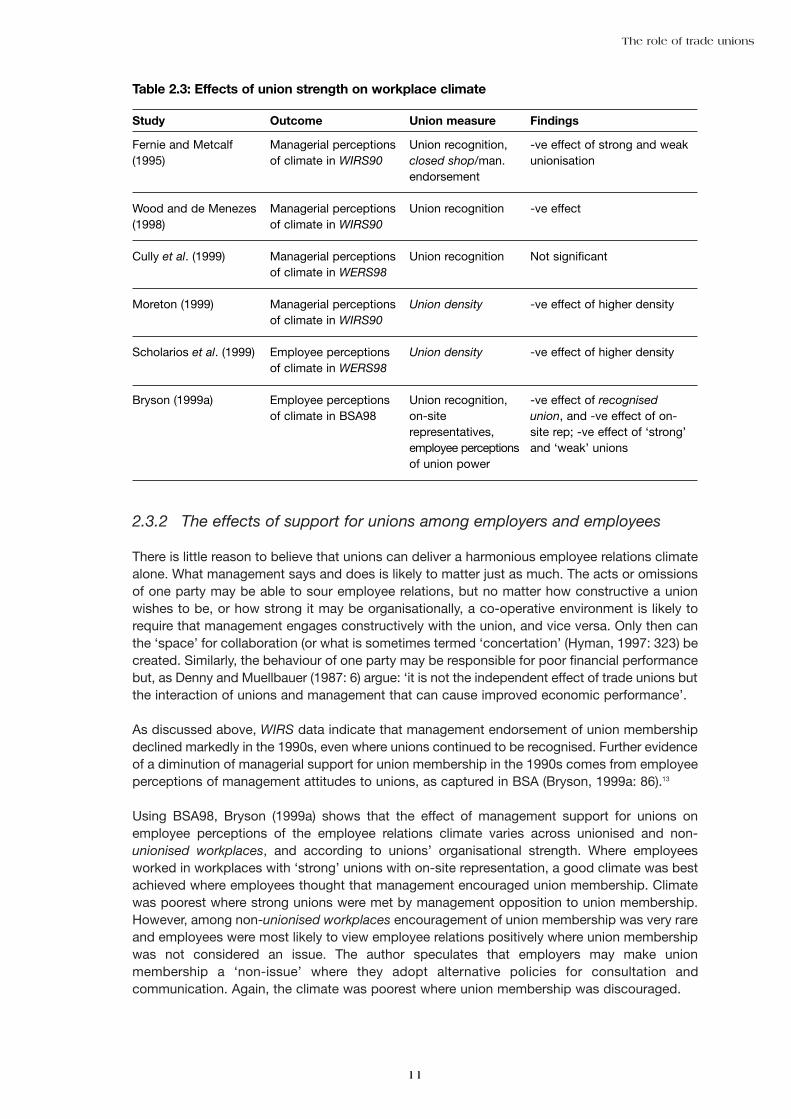
Union effects on the employee relations climate are uncertain, a priori. However, empiricalresearch indicates that the impact of recognised unions on managerial perceptions of aworkplace’s employee relations climate is contingent on the degree of union organisationalstrength (Table 2.3). Of particular note is the finding that climate ‘is worse where the strong andweak versions of unionisation exist than it is in non-union workplaces or those with middlingunion strength’ (Fernie and Metcalf, 1995: 401).
Fernie and Metcalf suggest that ‘the benefits from having a union representing the bulk of the labourforce in a workplace... flow from greater voice and representativeness and less fragmentation ofworkplace employee relations’ (1995). The table suggests this applies to both management andemployees in general. Managerial perceptions of a poor employee relations climate where weakunionism exists may reflect the union’s ability to voice employees’ grievances coupled with itsinability to deliver worker commitment in resolving problems.
The role of trade unions
9
Collective bargaining and workplace performance
10
Table 2.2: Effects of union strength on workplace economic performance
Study
Machin and Stewart(1990, 1996)
McNabb and Whitfield(1997)
McNabb and Whitfield(1998)
Booth and McCullough(1999)
Bryson (1999b)
Addison et al. (1998)
Addison and Belfield(2000)
Menezes Filho (1997)
Gregg et al. (1993)
Fernie and Metcalf(1995)
Moreton (1999)
Outcome
Financial performancein WIRS ’80, ’84 and ’90
Financial performancein WIRS90
Financial performancein WIRS90
Financial performancein WIRS90
Financial performancein WIRS90
Financial performancein WIRS90
Financial performancein WERS98
Firm profitability, 1984-90
Labour productivity in’80s
Labour productivitylevels and change
Labour productivity inWIRS90
Union measure
Union recognition,closed shop/man.endorsement
Union recognition,closed shop
Union recognition
Union recognition,closed shop/man.endorsement
Union recognition,closed shop/man.endorsement, highbargaining coverage
Union density
Union recognition
Union recognition
Union recognition
Union recognition,closed shop/man.endorsement
Union recognition,managementendorsement
Findings
-ve effect of manual unionsdeclined in 1980s; confined tostrong unions where highmarket share by ’90
Depends on interaction withteam and flexible workingpractices
Depends on interaction withemployee involvement
-ve effect of closed shop/management endorsement fornon-manual unions only; +ve effect of union recognitiononly
-ve effect of strong unions vsweak unions; weak unions +ve for small firms relative tono union
No significant effect
No significant effects
-ve but declining
+ve
Weak unions –ve effect onlevels. Pre-entry closed shop–ve effect on change.
Management endorsement +ve
2.3.2 The effects of support for unions among employers and employees
There is little reason to believe that unions can deliver a harmonious employee relations climatealone. What management says and does is likely to matter just as much. The acts or omissionsof one party may be able to sour employee relations, but no matter how constructive a unionwishes to be, or how strong it may be organisationally, a co-operative environment is likely torequire that management engages constructively with the union, and vice versa. Only then canthe ‘space’ for collaboration (or what is sometimes termed ‘concertation’ (Hyman, 1997: 323) becreated. Similarly, the behaviour of one party may be responsible for poor financial performancebut, as Denny and Muellbauer (1987: 6) argue: ‘it is not the independent effect of trade unions butthe interaction of unions and management that can cause improved economic performance’.
As discussed above, WIRS data indicate that management endorsement of union membershipdeclined markedly in the 1990s, even where unions continued to be recognised. Further evidenceof a diminution of managerial support for union membership in the 1990s comes from employeeperceptions of management attitudes to unions, as captured in BSA (Bryson, 1999a: 86).13
Using BSA98, Bryson (1999a) shows that the effect of management support for unions onemployee perceptions of the employee relations climate varies across unionised and non-unionised workplaces, and according to unions’ organisational strength. Where employeesworked in workplaces with ‘strong’ unions with on-site representation, a good climate was bestachieved where employees thought that management encouraged union membership. Climatewas poorest where strong unions were met by management opposition to union membership.However, among non-unionised workplaces encouragement of union membership was very rareand employees were most likely to view employee relations positively where union membershipwas not considered an issue. The author speculates that employers may make unionmembership a ‘non-issue’ where they adopt alternative policies for consultation andcommunication. Again, the climate was poorest where union membership was discouraged.
The role of trade unions
11
Table 2.3: Effects of union strength on workplace climate
Study
Fernie and Metcalf(1995)
Wood and de Menezes(1998)
Cully et al. (1999)
Moreton (1999)
Scholarios et al. (1999)
Bryson (1999a)
Outcome
Managerial perceptionsof climate in WIRS90
Managerial perceptionsof climate in WIRS90
Managerial perceptionsof climate in WERS98
Managerial perceptionsof climate in WIRS90
Employee perceptionsof climate in WERS98
Employee perceptionsof climate in BSA98
Union measure
Union recognition,closed shop/man.endorsement
Union recognition
Union recognition
Union density
Union density
Union recognition,on-siterepresentatives,employee perceptionsof union power
Findings
-ve effect of strong and weakunionisation
-ve effect
Not significant
-ve effect of higher density
-ve effect of higher density
-ve effect of recognised union, and -ve effect of on-site rep; -ve effect of ‘strong’and ‘weak’ unions
2.3.3 Employee perceptions of union influence and effectiveness
The formal right to negotiate collectively over aspects of work offers unions the opportunity toinfluence workplace outcomes. The degree to which unions can actually affect the terms andconditions of members depends upon the effectiveness with which they can capitalise on suchopportunities. According to Deery et al. (1995), the perception that a union is effectivelyprotecting and advancing its members’ interests can result in positive perceptions of theemployee relations climate. The effectiveness of unions is referred to as ‘union instrumentality’,defined as ‘the degree to which the union achieves the valued goals of employees’ (Deery et al.,1995: 9). Deery and colleagues suggest that ‘where a union is perceived to be more effective orinstrumental in achieving valued goals for its members it could be hypothesised that thoseemployees would hold more positive attitudes about the industrial relations climate’ (Deery etal., 1995: 4). The paper provides empirical evidence in support of this contention based on alarge automotive manufacturer in Australia.14 However, research by the same team in a largegovernment utility in Australia found that the union and employer ‘could most appropriately beseen as being in competition for the commitment of their organisational members’ (Deery et al.,1994: 594). Furthermore, ceteris paribus, union commitment was significantly reduced whenemployees perceived the employee relations climate as positive. This prompts the authors tosuggest that ‘adversarial relationships actually underpin a number of the aspects of unioncommitment’ (Deery et al., 1994: 593).
Deery et al. (1999: 535) seek to account for these divergent findings in terms of ‘the strategiesand actions of management and union officials’, suggesting that the ‘critical determinant of therelationship between employee relations climate and organisational and union outcomes may bethe role that each party plays in delivering particular benefits to employees’. It seems that,although union instrumentality may influence perceptions of climate by engendering greateremployee allegiance to both the union and the employing organisation, thus resulting in moreco-operative and harmonious management-employee relations, this is not the only mechanismby which union instrumentality may improve perceptions of climate. It may also occur becauseperceptions of union effectiveness are associated with perceptions of a fairer, more challengingand satisfying work environment. This, in turn, can positively influence perceptions of theemployee relations climate (Deery et al., 1999: 546).
Bryson (1999a) presents evidence from BSA98 supporting the contention that there is a positiveassociation between union instrumentality and positive perceptions of the employee relationsclimate. He finds that, where unions were perceived as doing their job well, where they wereviewed as responsive to members’ problems and complaints, and where they were thought tobe helping in the smooth-running of the workplace, perceptions of the employee relationsclimate were better than in cases where unions were not perceived as effective.
Gallie et al. (1998: 72-86) find that employees perceive supervision to be tighter, and technicaland bureaucratic methods of management control to be more evident where unions are perceivedas having greater influence. The authors suggest that ‘a reasonable inference, then, is that intensivecontrol systems were preferred by organisations where managerial power was contested’ (Gallieet al.,1998: 85). It may be that, where unions contest ‘the terrain’ with management, employeeperceptions of the working environment actually deteriorate, in which case perceptions of theemployee relations climate may also deteriorate. This line of reasoning cautions against a simpleassumption that effective unionism will translate into better climate.
Collective bargaining and workplace performance
12

2.4 Summary
This chapter identifies ways in which collective bargaining, and the role of unions more generally,can affect workplace performance. Unions may have both positive and negative effects onperformance. Which predominate is an empirical question. In the 1980s, the negative effects ofunionism predominated, but these effects had diminished by 1990 with a decline in unionstrength. There was also emerging evidence that the positive effects of unions were most likelyto emerge where there was a balance of power between unions and management in theworkplace, where management were supportive of unions, and where employees perceivedtheir unions as effective.
Endnotes
2 These data are not strictly comparable to those presented for 25 or more employees in Millward et al. (2000). Sincethe book was written, considerable effort has been devoted to further editing of the data to obtain accuraterecognition and coverage data. We would like to thank John Forth and the WERS Dissemination Service for theirvaluable assistance in this enterprise.
3 This marks a departure from earlier WIRS analyses which accorded primacy to collective bargaining, however smallthe proportion covered by bargaining.
4 Unions may raise the share of rents going to workers relative to non-unionised establishments, without necessarilyreducing the total value of the establishment. This is because the rent-earning ability of the establishment may risein the presence of a union due to union-induced productivity effects. In other words, although a greater share of thepie may be diverted from owners to workers, the pie may be larger in the presence of unions. As Machin and Stewart(1990: 329) point out, most of the empirical literature does not tackle the impact of unions on the total value of theestablishment. Instead, it is concerned with post-distribution financial performance.
5 Naylor (1995) demonstrates why separate bargaining is associated with unions capturing more of the available rentsat a workplace.
6 Davidson (1988) demonstrates that in unionised oligopolistic industries national unions representing all workers in anindustry achieve higher wages than separate, independent unions. Cheung and Davidson (1991) demonstrate thatunions representing workers of more than one firm face greater incentives to reject wage offers than independentunions, leading to greater levels of strike activity. In a macro-economic framework, Palokangas (2000) demonstratesthat unions have an incentive to set lower wages when bargaining is either highly centralised or highly decentralised,but for different reasons. Where each union controls a large fraction of the economy, wage increases lead toincreases in consumer prices, acting as an incentive to curb wage claims. In cases where each union controls onlya small fraction of the economy, unions face a high wage elasticity of employment, a factor also depressing wageclaims. From this perspective, unions face fewer incentives to set low wages where bargaining occurs at anintermediary level such as industry-level.
7 However, management endorsement is an ambiguous measure of union strength because, although it may assist inthe recruitment of members, thus strengthening a union, it may be a sign that a union is not wholly independent ofmanagement, and may even be reliant on management support for its position. Therefore union strength andmanagement support for a union are conceptually different. A union may be strong without management support.Where it is strong in the face of management opposition, the employee relations climate may be conflictual. Whereit is strong and has management support, climate may be better.
8 In 1998, the rate of management endorsement was 20 per cent among workplaces with 10 or more employeesrecognising unions.
9 Mean workplace-level union density is the sum of the percentage of employees in membership for each workplace,divided by the number of workplaces. This measure is the one we use in our analyses. It differs from aggregate uniondensity, the mean of which is derived by summing the members across a set of workplaces and then dividing by thetotal number of employees in those workplaces.
10 Among workplaces with 10 or more employees mean union density was 58 per cent in 1998.
11 If unions were losing their organisational strength in the 1990s, one might have expected a continuation in the declineof on-site representation which had begun in the latter half of the 1980s. In fact, evidence from the WERS98 cross-section and panel indicates that on-site representation stabilised in the 1990s, with around seven in ten workplaceswith 25 or more employees and a recognised union also having an on-site representative (Millward et al., 2000:153-154). Among workplaces with 10 or more employees with recognised unions, 59 per cent had an on-siterepresentative in 1998.
12 For completeness we include analyses of labour productivity, although the paper does not present analyses oflabour productivity.
13 Note that there is a typographical error in Bryson (1999a). The data relate to the period 1989 to 1998.
14 Some have argued that unions can ‘satisfy worker needs in a neo-liberal environment only through a successfulengagement with employers. Putting the point negatively, a union that understands worker needs, but can’t shiftemployer behaviour, is ineffective’ (Boxall and Haynes, 1997: 571).
The role of trade unions
13
CHAPTER 3
Procedures for collective bargaining: a typology
This chapter describes procedures for collective bargaining. We present typologies which focuson two distinct aspects of bargaining. The first distinguishes between single unionestablishments and multiple union establishments with joint or separate bargainingarrangements. The second concerns the locus of collective bargaining, identifying whethercollective bargaining takes place at the workplace level, industry level or, for multiple-establishment enterprises, at the organisation level. We devise a typology for both aspects ofbargaining, referring to the former as ‘bargaining arrangements’ and the latter ‘bargaining levels’.
3.1 Bargaining arrangements at the workplace
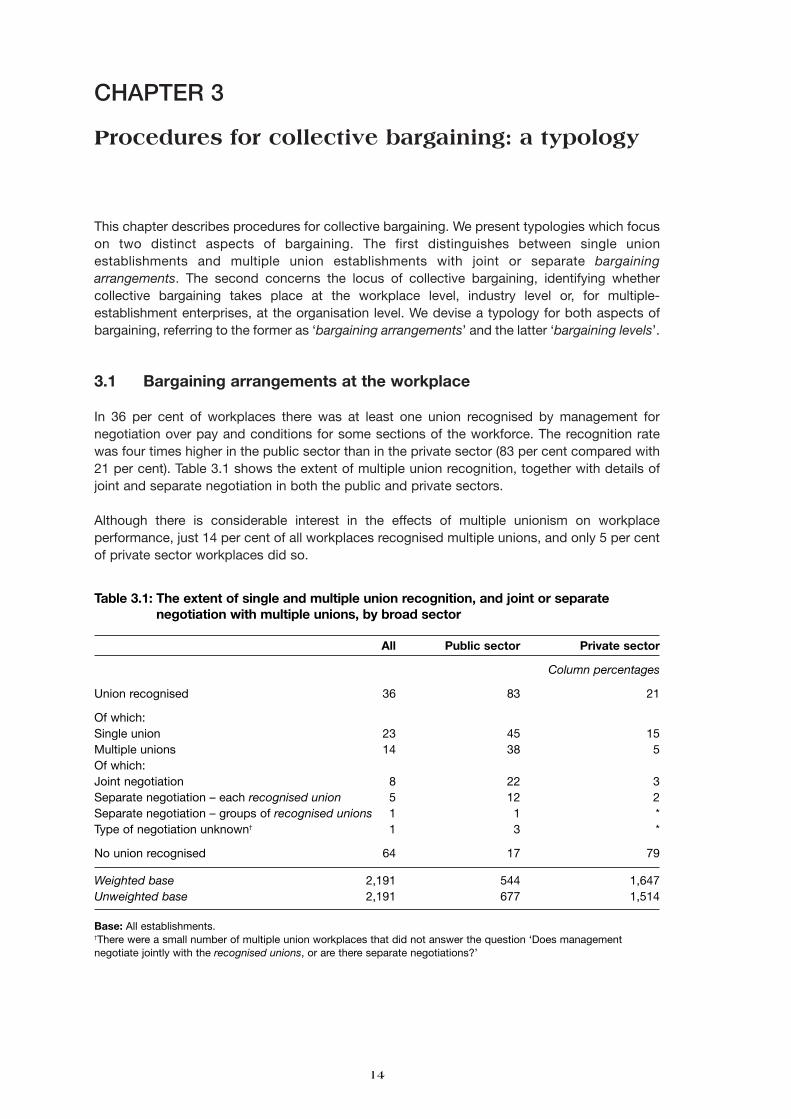
In 36 per cent of workplaces there was at least one union recognised by management fornegotiation over pay and conditions for some sections of the workforce. The recognition ratewas four times higher in the public sector than in the private sector (83 per cent compared with21 per cent). Table 3.1 shows the extent of multiple union recognition, together with details ofjoint and separate negotiation in both the public and private sectors.
Although there is considerable interest in the effects of multiple unionism on workplaceperformance, just 14 per cent of all workplaces recognised multiple unions, and only 5 per centof private sector workplaces did so.
14
Table 3.1: The extent of single and multiple union recognition, and joint or separatenegotiation with multiple unions, by broad sector
All Public sector Private sector
Column percentages
Union recognised 36 83 21
Of which:Single union 23 45 15Multiple unions 14 38 5Of which:Joint negotiation 8 22 3Separate negotiation – each recognised union 5 12 2Separate negotiation – groups of recognised unions 1 1 *Type of negotiation unknown† 1 3 *
No union recognised 64 17 79
Weighted base 2,191 544 1,647Unweighted base 2,191 677 1,514
Base: All establishments.†There were a small number of multiple union workplaces that did not answer the question ‘Does managementnegotiate jointly with the recognised unions, or are there separate negotiations?’

Where there was more than one union recognised, respondents were asked ‘Does managementnegotiate jointly with the recognised unions, or are there separate negotiations?’ Three answerswere pre-coded: joint negotiation; separate negotiation with each recognised union; andseparate negotiation with groups of recognised unions. Roughly three out of five multiple unionworkplaces negotiated jointly with the recognised unions. In most other multiple unionworkplaces, separate negotiation took place with each recognised union.15
Three out of five multiple union workplaces recognised just two unions, with a further 25 per centrecognising three. More than half the multiple union workplaces with separate bargaining withgroups of unions, recognised four or more unions.
3.2 Levels of collective bargaining
The identification of levels of collective bargaining is more complex and is determined by theanswers given to the following questions.
Question 1. Were one or more unions recognised by management for negotiating pay andconditions for any sections of the workplace?
Question 2. Does collective bargaining over pay setting cover:
(a) no workers(b) fewer than 50 per cent of workers(c) 50 per cent or more of workers?16
Question 3. Does collective bargaining occur at:
(a) one level(b) more than one level?
Question 4. Does one level cover more than 50 per cent of employees?
Procedures for collective bargaining: a typology
15
Table 3.2: Collective bargaining coverage and levels, by broad sector
All Public sector Private sector
Column percentages
No recognition:No coverage 58 6 75Minority coverage 2 3 1Majority coverage 5 8 3
Recognition:No collective bargaining 6 7 6Minority coverage 5 16 2Majority coverage, workplace-level 2 * 2Majority coverage, organisation-level 10 22 6Majority coverage, industry-level 12 36 4Majority coverage, multiple-level * 1 *
Weighted base 2,111 630 1,594Unweighted base 2,081 517 1,451
Base: all establishments where there is information on collective bargaining.
There is an apparent anomaly in the responses to the first two questions. We might expect thatanyone answering ‘no’ to Question One must answer (a) to Question Two. However, Table 3.2(rows two and three) indicates that in 7 per cent of all workplaces the managerial respondentreported that at least some workers had their pay set by collective bargaining, but they did notreport any union recognition.
Similarly, we may expect that a ‘yes’ response to Question One must be accompanied by aresponse of (b) or (c) to Question Two. Here, Table 3.2 (row four) indicates that 6 per cent ofworkplaces reported at least one recognised union, but no collective bargaining for anyoccupational group at the workplace.
These seeming anomalies may arise due to the structure of the survey questionnaire. In onesection of the survey, a series of questions is asked that leads to identification of workplaceswhere unions were recognised by management for negotiating pay and conditions for anysections of the workforce in the establishment. In a different section respondents are asked toidentify from a list of statements how pay is set for each occupational group. The list includescollective bargaining. There is no link between the two sets of questions. Furthermore,respondents are only asked whether unions are recognised for pay bargaining if they have saidthat there are union members on-site. In fact, it is possible for a union to be recognised for paybargaining, even when none of the workers covered is a union member. This might occur, forexample, where bargaining at organisation-level determines pay across all establishments in theorganisation, including some without any union members. However, there are good reasons whymanagers may report some coverage despite the absence of a recognised union. For example,if an employer follows an external collective bargaining agreement, they may report thepresence of collective bargaining irrespective of the presence of union members or recognisedunions at the workplace.17
Equally, there may be reasons why managers report no collective bargaining coverage despitethe presence of recognised unions. It could be that the recognised unions are not effective inpay bargaining.18 In some cases, a small minority of an occupational group may have unionrecognition while the majority in that group have pay determined in some other way. In this case,the managerial respondent would say there was union recognition, but collective bargainingwould not characterise the way pay is set for the majority in any occupational group. For thesereasons we retain these distinctions in our bargaining typology.
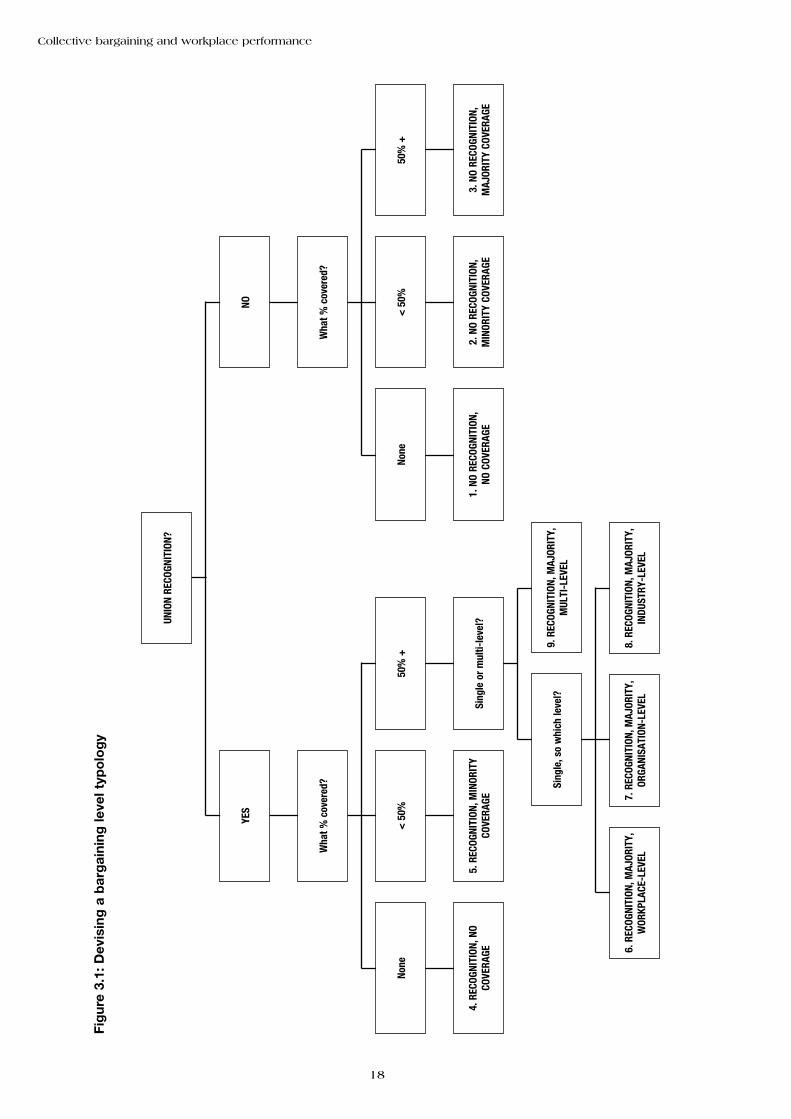
Our purpose is to characterise workplaces according to their bargaining. The decision-treedescribing how we do this is presented in Figure 3.1. Where there is bargaining coverage but norecognition, we identify whether coverage accounted for more or less than 50 per cent ofemployees (Question Two). Those workplaces where coverage was less than 50 per cent wecategorise as ‘Minority coverage’ workplaces (Table 3.2 row three) and those with 50 per centor more collective bargaining coverage we categorise as ‘Majority coverage’ workplaces (Table3.2 row three). Through Questions Three and Four we could identify the level at which collectivebargaining occurs, but given the small number of workplaces with majority coverage and norecognition we decided not to pursue this breakdown any further.
Turning to workplaces that report recognition and some collective bargaining, we first considerresponses to Question Two to determine whether collective bargaining covers the minority ormajority of employees. We find that in 5 per cent of workplaces collective bargaining coverageaccounted for less than 50 per cent of employees at the workplace, hence we categorise theseworkplaces as recognised, minority coverage collective bargaining workplaces (row five). Theremaining workplaces all have union recognition and majority coverage collective bargaining.We then identify whether collective bargaining occurs at just one level or more than one level(Question Three). If collective bargaining occurs at just one level then these workplaces arecategorised according to that level, that is majority coverage workplace-, organisation- orindustry-level collective bargaining workplaces.
Collective bargaining and workplace performance
16

Workplaces with single-level bargaining form the bulk of the workplaces described in rows sixto eight of Table 3.2. However, if collective bargaining occurs at more than one level and oneparticular level of collective bargaining covers more than 50 per cent of employees in the workplace(Question Four), then we also categorise that workplace according to that level. Hence theseworkplaces will also be included in the numbers in rows six to eight of Table 3.2. This occurrenceis quite rare. In most workplaces with collective bargaining it occurs at only one level.
The final category described in Table 3.2 covers the remaining workplaces. These all havemajority coverage collective bargaining, more than one level of collective bargaining and nosingle level covers more than 50 per cent of employees. These workplaces are categorised asmajority coverage multiple-level collective bargaining workplaces.
Table 3.2 also shows that in 58 per cent of workplaces no recognition and no collectivebargaining coverage was reported (row one). In recognised workplaces with majority coveragecollective bargaining, it typically takes place at either organisation- or industry-level. Fewworkplaces bargain at workplace-level, and less than 1 per cent of workplaces had multiple-level collective bargaining coverage.
3.3 Summary
This chapter introduces two typologies characterising bargaining arrangements in Britain. Thefirst typology distinguishes workplaces according to the degree of fragmentation there is in theirbargaining arrangements. Figures on the incidence of each arrangement indicate that, althoughthere is considerable interest in the value of single-table bargaining, multiple unionism is largelya public sector phenomenon, so that the effects of fragmented bargaining affect relatively fewin the private sector. The second typology identifies the locus of bargaining. It splits workplacesinto those with and without recognised unions, then establishes what percentage of workers arecovered by bargaining. In unionised workplaces with at least 50 per cent of workers covered bybargaining we classify workplaces according to the level of bargaining (industry-level,organisation-level, workplace-level, or multi-level).
Endnotes
15 WERS98 also contains information on the actual number of bargaining units at the workplace. However,investigations indicated that these data were not consistent with information on separate versus joint bargaining ina minority of cases. We have therefore ignored these data, but the relationship between these two data items isworthy of further investigation.
16 In 1984 and 1990 WIRS asked directly what proportion of employees were covered by negotiations betweenmanagement and recognised unions or groups of unions. In 1998, there were up to nine questions asking how paywas determined for each major occupational group at the workplace. Responses that referred to collectivebargaining have been summed in relation to the number of employees in the relevant occupational group to providethe number covered at each workplace.
17 It is arguable that, if a workplace includes workers covered by collective bargaining, then it has union recognition,irrespective of whether the managerial respondent says so. However, we think it is wise to retain the distinction sincewe do not know whether this combination of no recognition with bargaining coverage reflects the ‘real world’ or thevagaries of questionnaire design. The design reflects previous WIRS surveys but, since collective bargaining hasaltered so much in recent years, it would be wise to pilot this section of the questionnaire thoroughly in any future WERS.
18 See Millward et al. (2000: 163-167) for a discussion of this possibility.
Procedures for collective bargaining: a typology
17
18
Collective bargaining and workplace performance
YES
NO
Wha
t % c
over
ed?
Wha
t % c
over
ed?
None
< 5
0%50
% +
None
< 5
0%50
% +
4. R
ECOG
NITI
ON, N
OCO
VERA
GE5.
REC
OGNI
TION
, MIN
ORIT
YCO
VERA
GESi
ngle
or
mul
ti-le
vel?
1. N
O RE
COGN
ITIO
N,
NO C
OVER
AGE
2. N
O RE
COGN
ITIO
N,
MIN
ORIT
Y CO
VERA
GE3.
NO
RECO
GNIT
ION,
MAJ
ORIT
Y CO
VERA
GE
Sing
le, s
o w
hich
leve
l?
6. R
ECOG
NITI
ON, M
AJOR
ITY,
WOR
KPLA
CE-L
EVEL
7. R
ECOG
NITI
ON, M
AJOR
ITY,
ORGA
NISA
TION
-LEV
EL
Fig
ure
3.1:
Dev
isin
g a
bar
gai
ning
leve
l typ
olo
gy
UNIO
N RE
COGN
ITIO
N?
9. R
ECOG
NITI
ON, M
AJOR
ITY,
M
ULTI
-LEV
EL
8. R
ECOG
NITI
ON, M
AJOR
ITY,
INDU
STRY
-LEV
EL
CHAPTER 4
Management perceptions of the employeerelations climate
In this chapter, we consider the links between collective bargaining and managerial perceptionsof the employee relations climate, captured by responses to a single question asked at the endof the face-to-face interview conducted with the most senior workplace manager responsiblefor employee relations. The question is: ‘Finally, looking at this scale, how would you rate therelationship between management and employees generally at this workplace?’ The five-pointordinal scale runs from ‘very good’ to ‘very poor’.
The distribution of responses is presented in Table 4.1. It is immediately apparent that managersgenerally have very favourable perceptions of the employee relations climate at their workplace,a finding which has emerged in analyses of WIRS90 using a similar measure (Fernie and Metcalf,1995; Fernie, Metcalf and Woodland, 1994). So few managers view the climate as poor or verypoor that we have merged these two categories for the remainder of the analyses in this chapter.
Our purpose in this chapter is to examine influences on managerial perceptions of climate. Inparticular, we explore the links between climate and facets of collective bargaining at theworkplace. We wish to establish whether different forms of bargaining arrangement areassociated with different perceptions of climate. We begin by outlining why we might expect tofind a relationship between collective bargaining arrangements and managers’ perceptions ofclimate. Next we present descriptive analyses to identify whether there are any simpleassociations between bargaining arrangements, bargaining levels, bargaining coverage, andclimate. Finally, we turn to multivariate analysis to establish whether collective bargaining hasany independent effects on climate, controlling for a range of other variables which weanticipate may also affect climate.
19
Table 4.1: Managerial ratings of management-employee relations in 1998
%
Very good 42Good 48Neither good nor poor 8Poor 2Very poor 1
Weighted base 2,185Unweighted base 2,188
Note: all workplaces excluding the 3 unweighted cases with missing data.

4.1 Possible links between collective bargaining and managerialperceptions of climate
From the small amount of empirical research conducted in Britain, it seems that managementperceives the workplace employee relations climate to be better where they deal with a unifiedworker voice able to represent the majority of workers. This may occur where there is a singleunion, rather than multiple unions, provided that the union represents a sizeable proportion ofworkers. It may also occur in a multi-union context if the unions are able to negotiate jointly withmanagement on a single-table. Both routes avoid the fragmentation of bargaining that can resultin inter-union rivalry, ‘leapfrogging’ claims, and the costs to the employer in bargaining withunions, all of which may contribute to management having a poorer perception of climate.
There are a number of caveats to this broad argument.
The first is that employees will only be satisfied with a single union or joint bargaining if thesearrangements meet their needs. To the extent that multi-unionism is better able to reflect theneeds of heterogeneous workers, it may foster a better climate that is apparent to employeesand employers alike. Single unionism may be particularly unsuited to meeting the majority ofemployees’ needs because it covers a relatively small percentage of workers (in terms of unionmembership and bargaining coverage).19
Secondly, climate may deteriorate in the presence of multi-unionism, not because of thebargaining process, but because of other aspects of multi-unionism. These include demarcationdisputes, jurisdictional disputes regarding rights to represent, and membership poachingdisputes. If this is the case, multi-unionism may be associated with poorer managerialperceptions of climate, whether there is joint bargaining or not.
Thirdly, the theoretical and empirical literature indicates that what matters ultimately is therelative bargaining power of workers and management. What is most conducive to a positivemanagerial perception of climate is a balance of power between unions and management. Asnoted in Chapter Two, where unions are too ‘strong’ they may severely limit management’sability to operate effectively, or successfully divert greater shares of available rents toworkers, potentially resulting in discord or conflict. ‘Weak’ unions, on the other hand, may beineffectual as a voice for employees or as an agent for employers in bringing changesmanagement views as necessary.
Bargaining structures are often equated with bargaining power. Yet, it is often assumed thatworkers are free to adopt the form of bargaining best suited to their needs. In reality, the movetowards single-table bargaining during the 1990s appears to have been at the behest ofemployers, suggesting that employers felt they had something to gain through the avoidance ofseparate bargaining arrangements. In practice, whether joint or separate bargaining representsworker strength or weakness depends on the extent of substitutability across workers (Horn andWolinsky, 1988). As discussed in Chapter Three, if workers are close substitutes they will dobetter by joining forces in either a single union or joint bargaining arrangement, helping them toavoid divide-and-rule tactics by the employer. However, if groups of workers are highlycomplementary, each group is powerful under separate bargaining as the employer needs allgroups to maintain production. Thus, in theory, complementary workers will choose separatebargaining, while substitutable workers will choose joint bargaining. Unfortunately, we do nothave information in our data to identify instances in which workers are complements orsubstitutes, making it difficult to establish whether particular types of arrangement representunion ‘strength’ or ‘weakness’. However, we test the sensitivity of our results to the inclusion ofa range of other union strength measures, as will become apparent later in this chapter. Theseinclude the percentage of workers in the workplace covered by collective bargaining.
Collective bargaining and workplace performance
20

Turning to the level at which collective bargaining is conducted, theoretical work demonstratesthat, under certain conditions, industry-level bargaining delivers higher wages than ‘local’bargaining, but at the expense of greater conflict. However, it is conceivable that organisation-level or industry-level bargaining may reduce conflict arising from negotiations that wouldotherwise occur at workplace-level. By removing the loci of bargaining away from theworkplace, these forms of bargaining may improve workplace climate by allowing managers andworkers to focus on less contentious issues, and minimise the blame attributable to either sidewhen negotiations do not deliver what either side may have wished for.
4.2 Associations between collective bargaining and managerialperceptions of climate
Descriptive analyses reveal little difference in managerial perceptions of climate acrossworkplaces with and without recognised unions, although managers were slightly more likely toview the climate as ‘very good’ where there was no recognised union (Table 4.2). However, thereare indications that climate deteriorates in multi-union workplaces, with the percentage ofmanagers saying relations were ‘very good’ declining markedly where three or more unions arerecognised. There is a suggestion that climate differs across multi-union workplaces accordingto the bargaining arrangements in place. Climate is poorest where separate bargaining occurswith groups of unions. However, there is little to choose between climate in multi-unionworkplaces with joint bargaining and those with separate bargaining with each union. What ismore, none of the multi-union bargaining arrangements are associated with climate that is aspositive as the climate in a single union setting.
Turning to bargaining coverage at the bottom of the table, there is some support for thecontention that managers view climate most positively where there is a balance of powerbetween management and workers. Climate is poorest where there is full coverage, but it is alsopoor where there is zero coverage, that is, where workers’ collective bargaining power is at itshighest or is non-existent. If we consider coverage alongside recognition and bargaining levels(the fourth block of items in the table), this association between middle-level coverage and goodclimate is clearly apparent. Where there is union recognition and a minority of workers is coveredby collective bargaining, 60 per cent of managers viewed climate as ‘very good’. This comparesto 38 per cent where there is recognition but no effective collective bargaining, and figures ofbetween 25 and 39 per cent where a majority of workers in recognised workplaces are coveredby collective bargaining. Where there is majority coverage in recognised workplaces, managersview climate most positively where they are less involved in bargaining, namely where bargainingoccurs at industry-level.
Among workplaces without recognised unions, the percentage with ‘very good’ climate falls withan increase in bargaining coverage, from 45 per cent where there is no coverage to 32 per centwhere there is majority coverage.
Management perceptions of the employee relations climate
21
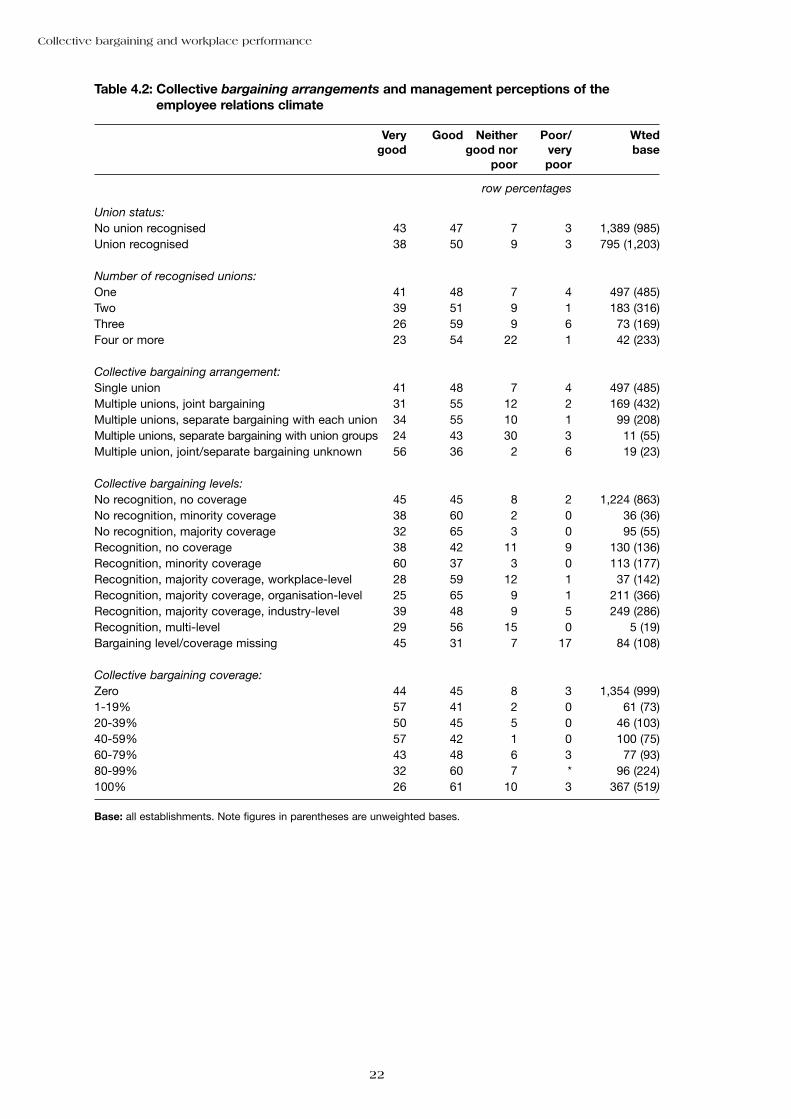
Collective bargaining and workplace performance
22
Table 4.2: Collective bargaining arrangements and management perceptions of theemployee relations climate
Very Good Neither Poor/ Wted good good nor very base
poor poor
row percentages
Union status:No union recognised 43 47 7 3 1,389 (985)Union recognised 38 50 9 3 795 (1,203)
Number of recognised unions:One 41 48 7 4 497 (485)Two 39 51 9 1 183 (316)Three 26 59 9 6 73 (169)Four or more 23 54 22 1 42 (233)
Collective bargaining arrangement:Single union 41 48 7 4 497 (485)Multiple unions, joint bargaining 31 55 12 2 169 (432)Multiple unions, separate bargaining with each union 34 55 10 1 99 (208)Multiple unions, separate bargaining with union groups 24 43 30 3 11 (55)Multiple union, joint/separate bargaining unknown 56 36 2 6 19 (23)
Collective bargaining levels: No recognition, no coverage 45 45 8 2 1,224 (863)No recognition, minority coverage 38 60 2 0 36 (36)No recognition, majority coverage 32 65 3 0 95 (55)Recognition, no coverage 38 42 11 9 130 (136)Recognition, minority coverage 60 37 3 0 113 (177)Recognition, majority coverage, workplace-level 28 59 12 1 37 (142)Recognition, majority coverage, organisation-level 25 65 9 1 211 (366)Recognition, majority coverage, industry-level 39 48 9 5 249 (286)Recognition, multi-level 29 56 15 0 5 (19)Bargaining level/coverage missing 45 31 7 17 84 (108)
Collective bargaining coverage:Zero 44 45 8 3 1,354 (999)1-19% 57 41 2 0 61 (73)20-39% 50 45 5 0 46 (103)40-59% 57 42 1 0 100 (75)60-79% 43 48 6 3 77 (93)80-99% 32 60 7 * 96 (224)100% 26 61 10 3 367 (519)
Base: all establishments. Note figures in parentheses are unweighted bases.

4.3 Multivariate analyses of the associations between collectivebargaining and managerial perceptions of climate
The descriptive analyses presented above indicate that managerial perceptions of climate varywith aspects of collective bargaining. However, to establish whether there is a truly independentassociation between bargaining arrangements and managerial perceptions of climate we needto use the statistical technique of multivariate regression analysis which enables us to holdconstant a range of other factors that may also influence climate. In this chapter we introducethe modelling technique used in this analysis, as well as the analyses of employees’ perceptionsof climate and managers’ perceptions of financial performance presented in the following twochapters. Then we introduce our data, including the control variables used in the analysis,before presenting our results.
4.3.1 Modelling procedures20
Our outcome variable of interest is managerial perceptions of the employee relations climate. Itis a categorical indicator defined in terms of ordered responses, so we use an ordered probitestimator. Due to the small number of respondents saying climate was ‘poor’ or ‘very poor’ wehave collapsed these two categories so that the outcome variable runs from 1 ‘poor/very poor’to 4 ‘very good’, as in Table 4.2. Our method, described in Appendix Two, takes account of thecomplex survey design in WERS98 allowing results to be generalised to the workplace andemployee populations from which the samples were drawn.
Effects of categorical variables such as the type of bargaining arrangement are evaluatedagainst a ‘reference’ category. These categories are identified in the tables, and significancetests in the tables are based on comparisons of coefficients with the reference category.However, there may be statistically significant effects across categories. We test for these andreport on all significant effects.21
4.3.2 Limitations to the analysis
Since our collective bargaining variables (and other variables entering our models) are measuredat the same moment in time as our performance outcomes, we must be cautious whenattributing a causal link running from bargaining arrangements to performance. It may even bethe case that the arrow of causation runs in the opposite direction. For example, managementin a multi-union workplace with poor climate may switch to single-table bargaining in the hopethat it will help remedy the problem. In this case, the model will understate any positiveassociation between single-table bargaining and good climate. In practice, bargainingarrangements are relatively durable, giving us some confidence that our bargaining measurespre-date management’s perceptions of climate and financial performance at the time of thesurvey interview.
The second limitation to our methodology is that bargaining arrangements are not randomlydistributed across workplaces. If there are differences between workplaces which we do notobserve and which predispose them to particular sorts of bargaining arrangement, and thesedifferences are correlated with performance, then our estimates of bargaining effects may bebiased. This is because the unobserved differences across workplaces, which ‘sort’ them intodifferent arrangements, explain part of the performance we are seeking to explain. In this paperwe have simply incorporated a wide range of factors that we know influence perceptions ofclimate and financial performance to minimise the problem of omitted variables bias. We alsotest whether our findings hold across sub-samples where we might expect systematicdifferences in associations between bargaining arrangements and performance.
Management perceptions of the employee relations climate
23
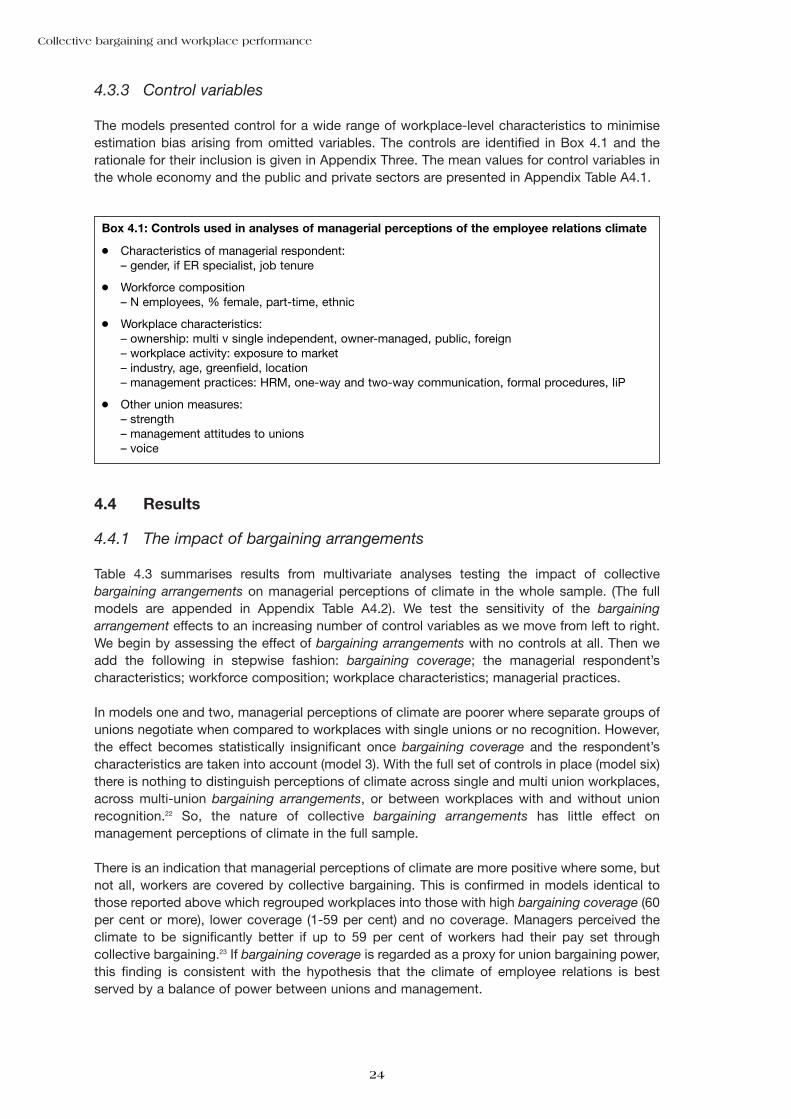
4.3.3 Control variables
The models presented control for a wide range of workplace-level characteristics to minimiseestimation bias arising from omitted variables. The controls are identified in Box 4.1 and therationale for their inclusion is given in Appendix Three. The mean values for control variables inthe whole economy and the public and private sectors are presented in Appendix Table A4.1.
4.4 Results
4.4.1 The impact of bargaining arrangements
Table 4.3 summarises results from multivariate analyses testing the impact of collectivebargaining arrangements on managerial perceptions of climate in the whole sample. (The fullmodels are appended in Appendix Table A4.2). We test the sensitivity of the bargainingarrangement effects to an increasing number of control variables as we move from left to right.We begin by assessing the effect of bargaining arrangements with no controls at all. Then weadd the following in stepwise fashion: bargaining coverage; the managerial respondent’scharacteristics; workforce composition; workplace characteristics; managerial practices.
In models one and two, managerial perceptions of climate are poorer where separate groups ofunions negotiate when compared to workplaces with single unions or no recognition. However,the effect becomes statistically insignificant once bargaining coverage and the respondent’scharacteristics are taken into account (model 3). With the full set of controls in place (model six)there is nothing to distinguish perceptions of climate across single and multi union workplaces,across multi-union bargaining arrangements, or between workplaces with and without unionrecognition.22 So, the nature of collective bargaining arrangements has little effect onmanagement perceptions of climate in the full sample.
There is an indication that managerial perceptions of climate are more positive where some, butnot all, workers are covered by collective bargaining. This is confirmed in models identical tothose reported above which regrouped workplaces into those with high bargaining coverage (60per cent or more), lower coverage (1-59 per cent) and no coverage. Managers perceived theclimate to be significantly better if up to 59 per cent of workers had their pay set throughcollective bargaining.23 If bargaining coverage is regarded as a proxy for union bargaining power,this finding is consistent with the hypothesis that the climate of employee relations is bestserved by a balance of power between unions and management.
Collective bargaining and workplace performance
24
Box 4.1: Controls used in analyses of managerial perceptions of the employee relations climate
● Characteristics of managerial respondent: – gender, if ER specialist, job tenure
● Workforce composition– N employees, % female, part-time, ethnic
● Workplace characteristics:– ownership: multi v single independent, owner-managed, public, foreign– workplace activity: exposure to market– industry, age, greenfield, location– management practices: HRM, one-way and two-way communication, formal procedures, IiP
● Other union measures:– strength– management attitudes to unions– voice

What also matters in determining managerial perceptions of climate is the nature of theindividual, notably whether they are an employee relations specialist or not, and the time theyhave been in post; workforce composition; workplace size; industry, age and region. Being a‘good’ employer, as signaled by the IiP award, is associated with good climate.24
We ran identical models to those presented in Table 4.3, this time replacing the bargainingarrangement variable with one counting the number of recognised unions to see whether therewere any discernible effects associated with multi-unionism per se. Without controls, the modelreflects the descriptive findings in Table 4.2: climate deteriorates in the presence of three ormore recognised unions. The detrimental effect of three or more recognised unions relative tonon-unionism persists when all but the management practice controls are added.25 However, themulti-union effect loses significance with the introduction of the management practice variables.Of these practice variables, only the Investors in People control is strongly associated with abetter climate. It is possible that non-unionised workplaces engage in good practices thatimprove climate; once this is accounted for in the model, managerial perceptions of climate areno different in non-unionised workplaces than they are in unionised workplaces, and multi-unionism is not significant.26
We introduced additional union controls one at a time to our baseline bargaining arrangementmodels to establish whether our results were sensitive to their inclusion. We experimented withsix union measures, each entering the baseline model containing bargaining arrangements,bargaining coverage and the full set of controls. No significant bargaining arrangement effectsemerged. The three additional union variables capturing other aspects of union strength (on-siteunion representation, union density, and the closed shop/management endorsement ofmembership) were all insignificant, as was our measure capturing union and non-union voice.However, managerial perceptions of climate were better where management expressedthemselves as being ‘in favour of trade union membership’.27 More broadly, managerialperceptions of climate were also better where managers strongly disagreed with the statement‘most decisions at this workplace are made without consulting employees’.
Management perceptions of the employee relations climate
25
Table 4.3: Impact of bargaining arrangements on managerial perceptions ofmanagement-employee relations in 1998
M1 M2 M3 M4 M5 M6CBA + barg. + + + + man.only coverage resp. wkforce wkplace practice
Collective bargaining arrangements (ref: joint bargaining)
Single union 0.194 0.244 0.081 -0.030 0.088 0.028(1.18) (1.48) (0.50) (0.16) (0.49) (0.15)
Separate bargaining, each union 0.113 0.145 0.049 0.029 0.049 0.045(0.63) (0.87) (0.26) (0.15) (0.26) (0.24)
Separate bargaining, groups of unions -0.357 -0.248 -0.103 -0.122 -0.158 0.332(1.37) (0.96) (0.41) (0.38) (0.44) (1.06)
Multi-union, arrangement missing 0.485 0.495 0.309 0.225 0.253 -0.197(1.03) (0.96) (0.60) (0.45) (0.51) (0.37)
No recognition 0.252 0.308 0.138 0.117 0.264 0.231(1.85) (1.54) (0.67) (0.54) (1.21) (1.04)
Observations 2,188 2,086 2,079 2,033 1,983 1,890
Base: all workplaces with non-missing data. T-statistics in parentheses. * = sig at 5%; ** = sig at 1% Note: M1 meansmodel one, et cetera.
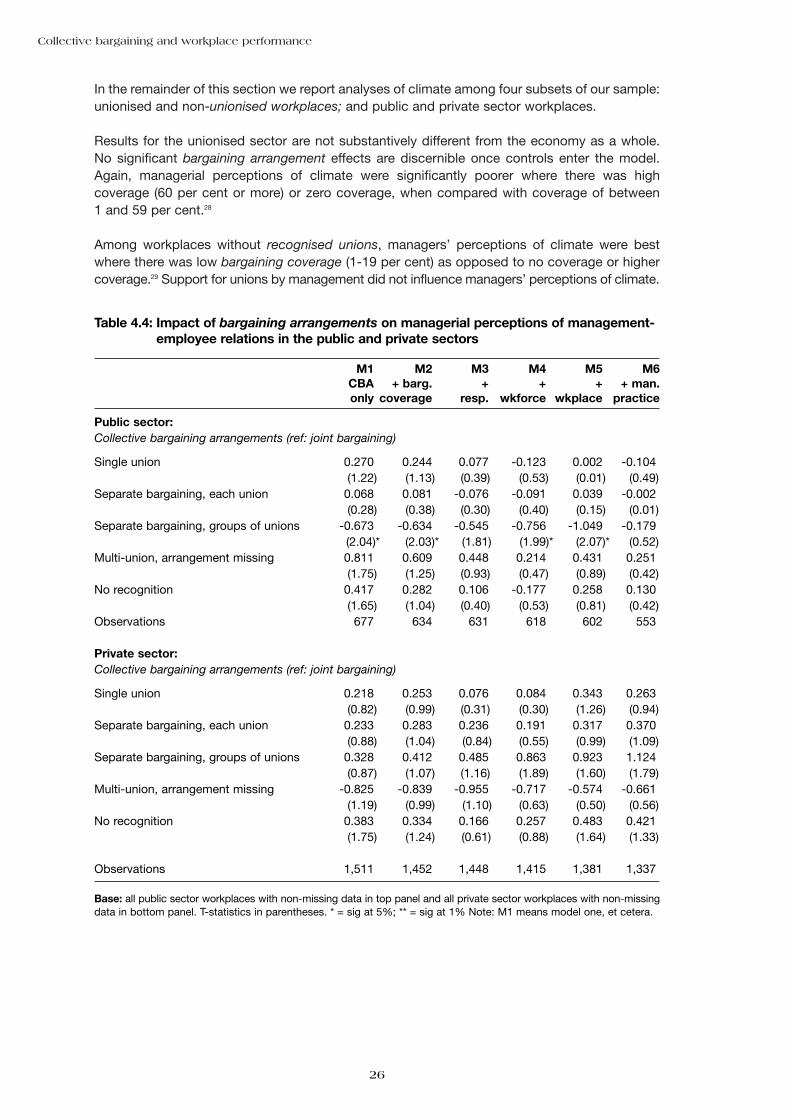
In the remainder of this section we report analyses of climate among four subsets of our sample:unionised and non-unionised workplaces; and public and private sector workplaces.
Results for the unionised sector are not substantively different from the economy as a whole.No significant bargaining arrangement effects are discernible once controls enter the model.Again, managerial perceptions of climate were significantly poorer where there was highcoverage (60 per cent or more) or zero coverage, when compared with coverage of between1 and 59 per cent.28
Among workplaces without recognised unions, managers’ perceptions of climate were bestwhere there was low bargaining coverage (1-19 per cent) as opposed to no coverage or highercoverage.29 Support for unions by management did not influence managers’ perceptions of climate.
Collective bargaining and workplace performance
26
Table 4.4: Impact of bargaining arrangements on managerial perceptions of management-employee relations in the public and private sectors
M1 M2 M3 M4 M5 M6CBA + barg. + + + + man.only coverage resp. wkforce wkplace practice
Public sector:Collective bargaining arrangements (ref: joint bargaining)
Single union 0.270 0.244 0.077 -0.123 0.002 -0.104(1.22) (1.13) (0.39) (0.53) (0.01) (0.49)
Separate bargaining, each union 0.068 0.081 -0.076 -0.091 0.039 -0.002(0.28) (0.38) (0.30) (0.40) (0.15) (0.01)
Separate bargaining, groups of unions -0.673 -0.634 -0.545 -0.756 -1.049 -0.179(2.04)* (2.03)* (1.81) (1.99)* (2.07)* (0.52)
Multi-union, arrangement missing 0.811 0.609 0.448 0.214 0.431 0.251(1.75) (1.25) (0.93) (0.47) (0.89) (0.42)
No recognition 0.417 0.282 0.106 -0.177 0.258 0.130(1.65) (1.04) (0.40) (0.53) (0.81) (0.42)
Observations 677 634 631 618 602 553
Private sector:Collective bargaining arrangements (ref: joint bargaining)
Single union 0.218 0.253 0.076 0.084 0.343 0.263(0.82) (0.99) (0.31) (0.30) (1.26) (0.94)
Separate bargaining, each union 0.233 0.283 0.236 0.191 0.317 0.370(0.88) (1.04) (0.84) (0.55) (0.99) (1.09)
Separate bargaining, groups of unions 0.328 0.412 0.485 0.863 0.923 1.124(0.87) (1.07) (1.16) (1.89) (1.60) (1.79)
Multi-union, arrangement missing -0.825 -0.839 -0.955 -0.717 -0.574 -0.661(1.19) (0.99) (1.10) (0.63) (0.50) (0.56)
No recognition 0.383 0.334 0.166 0.257 0.483 0.421(1.75) (1.24) (0.61) (0.88) (1.64) (1.33)
Observations 1,511 1,452 1,448 1,415 1,381 1,337
Base: all public sector workplaces with non-missing data in top panel and all private sector workplaces with non-missingdata in bottom panel. T-statistics in parentheses. * = sig at 5%; ** = sig at 1% Note: M1 means model one, et cetera.
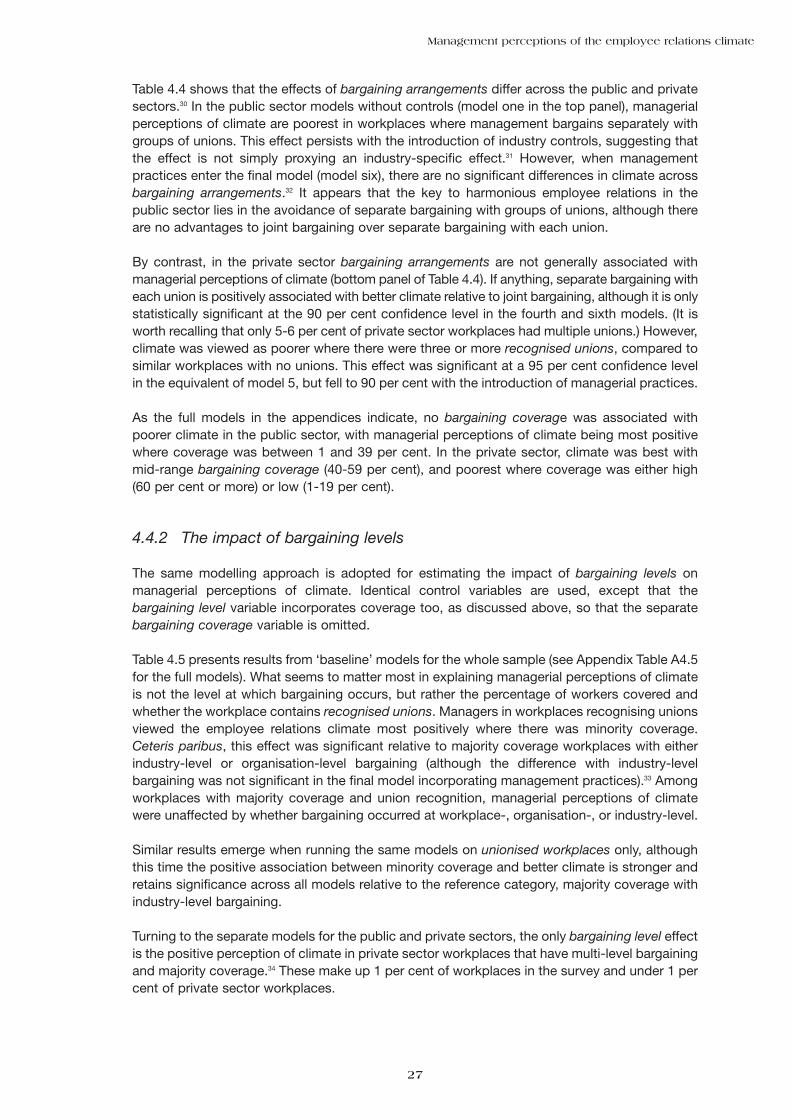
Table 4.4 shows that the effects of bargaining arrangements differ across the public and privatesectors.30 In the public sector models without controls (model one in the top panel), managerialperceptions of climate are poorest in workplaces where management bargains separately withgroups of unions. This effect persists with the introduction of industry controls, suggesting thatthe effect is not simply proxying an industry-specific effect.31 However, when managementpractices enter the final model (model six), there are no significant differences in climate acrossbargaining arrangements.32 It appears that the key to harmonious employee relations in thepublic sector lies in the avoidance of separate bargaining with groups of unions, although thereare no advantages to joint bargaining over separate bargaining with each union.
By contrast, in the private sector bargaining arrangements are not generally associated withmanagerial perceptions of climate (bottom panel of Table 4.4). If anything, separate bargaining witheach union is positively associated with better climate relative to joint bargaining, although it is onlystatistically significant at the 90 per cent confidence level in the fourth and sixth models. (It isworth recalling that only 5-6 per cent of private sector workplaces had multiple unions.) However,climate was viewed as poorer where there were three or more recognised unions, compared tosimilar workplaces with no unions. This effect was significant at a 95 per cent confidence levelin the equivalent of model 5, but fell to 90 per cent with the introduction of managerial practices.
As the full models in the appendices indicate, no bargaining coverage was associated withpoorer climate in the public sector, with managerial perceptions of climate being most positivewhere coverage was between 1 and 39 per cent. In the private sector, climate was best withmid-range bargaining coverage (40-59 per cent), and poorest where coverage was either high(60 per cent or more) or low (1-19 per cent).
4.4.2 The impact of bargaining levels
The same modelling approach is adopted for estimating the impact of bargaining levels onmanagerial perceptions of climate. Identical control variables are used, except that thebargaining level variable incorporates coverage too, as discussed above, so that the separatebargaining coverage variable is omitted.
Table 4.5 presents results from ‘baseline’ models for the whole sample (see Appendix Table A4.5for the full models). What seems to matter most in explaining managerial perceptions of climateis not the level at which bargaining occurs, but rather the percentage of workers covered andwhether the workplace contains recognised unions. Managers in workplaces recognising unionsviewed the employee relations climate most positively where there was minority coverage.Ceteris paribus, this effect was significant relative to majority coverage workplaces with eitherindustry-level or organisation-level bargaining (although the difference with industry-levelbargaining was not significant in the final model incorporating management practices).33 Amongworkplaces with majority coverage and union recognition, managerial perceptions of climatewere unaffected by whether bargaining occurred at workplace-, organisation-, or industry-level.
Similar results emerge when running the same models on unionised workplaces only, althoughthis time the positive association between minority coverage and better climate is stronger andretains significance across all models relative to the reference category, majority coverage withindustry-level bargaining.
Turning to the separate models for the public and private sectors, the only bargaining level effectis the positive perception of climate in private sector workplaces that have multi-level bargainingand majority coverage.34 These make up 1 per cent of workplaces in the survey and under 1 percent of private sector workplaces.
Management perceptions of the employee relations climate
27
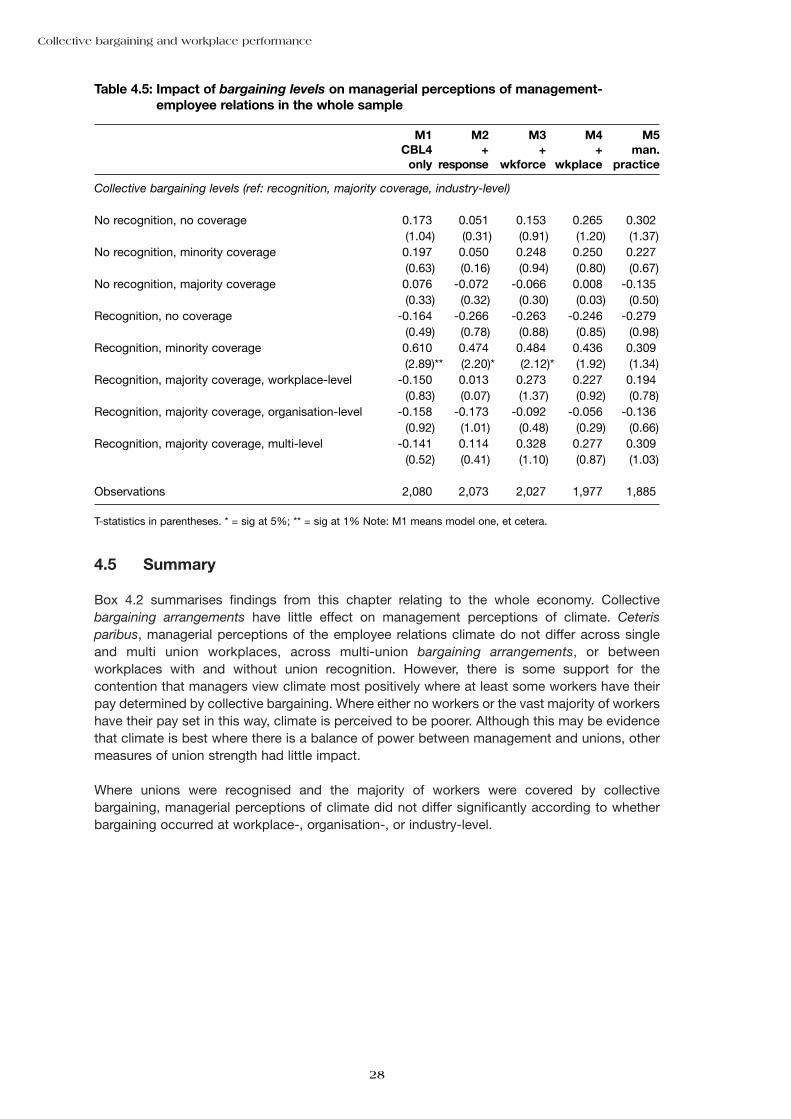
4.5 Summary
Box 4.2 summarises findings from this chapter relating to the whole economy. Collectivebargaining arrangements have little effect on management perceptions of climate. Ceterisparibus, managerial perceptions of the employee relations climate do not differ across singleand multi union workplaces, across multi-union bargaining arrangements, or betweenworkplaces with and without union recognition. However, there is some support for thecontention that managers view climate most positively where at least some workers have theirpay determined by collective bargaining. Where either no workers or the vast majority of workershave their pay set in this way, climate is perceived to be poorer. Although this may be evidencethat climate is best where there is a balance of power between management and unions, othermeasures of union strength had little impact.
Where unions were recognised and the majority of workers were covered by collectivebargaining, managerial perceptions of climate did not differ significantly according to whetherbargaining occurred at workplace-, organisation-, or industry-level.
Collective bargaining and workplace performance
28
Table 4.5: Impact of bargaining levels on managerial perceptions of management-employee relations in the whole sample
M1 M2 M3 M4 M5CBL4 + + + man.
only response wkforce wkplace practice
Collective bargaining levels (ref: recognition, majority coverage, industry-level)
No recognition, no coverage 0.173 0.051 0.153 0.265 0.302(1.04) (0.31) (0.91) (1.20) (1.37)
No recognition, minority coverage 0.197 0.050 0.248 0.250 0.227(0.63) (0.16) (0.94) (0.80) (0.67)
No recognition, majority coverage 0.076 -0.072 -0.066 0.008 -0.135(0.33) (0.32) (0.30) (0.03) (0.50)
Recognition, no coverage -0.164 -0.266 -0.263 -0.246 -0.279(0.49) (0.78) (0.88) (0.85) (0.98)
Recognition, minority coverage 0.610 0.474 0.484 0.436 0.309(2.89)** (2.20)* (2.12)* (1.92) (1.34)
Recognition, majority coverage, workplace-level -0.150 0.013 0.273 0.227 0.194(0.83) (0.07) (1.37) (0.92) (0.78)
Recognition, majority coverage, organisation-level -0.158 -0.173 -0.092 -0.056 -0.136(0.92) (1.01) (0.48) (0.29) (0.66)
Recognition, majority coverage, multi-level -0.141 0.114 0.328 0.277 0.309(0.52) (0.41) (1.10) (0.87) (1.03)
Observations 2,080 2,073 2,027 1,977 1,885
T-statistics in parentheses. * = sig at 5%; ** = sig at 1% Note: M1 means model one, et cetera.
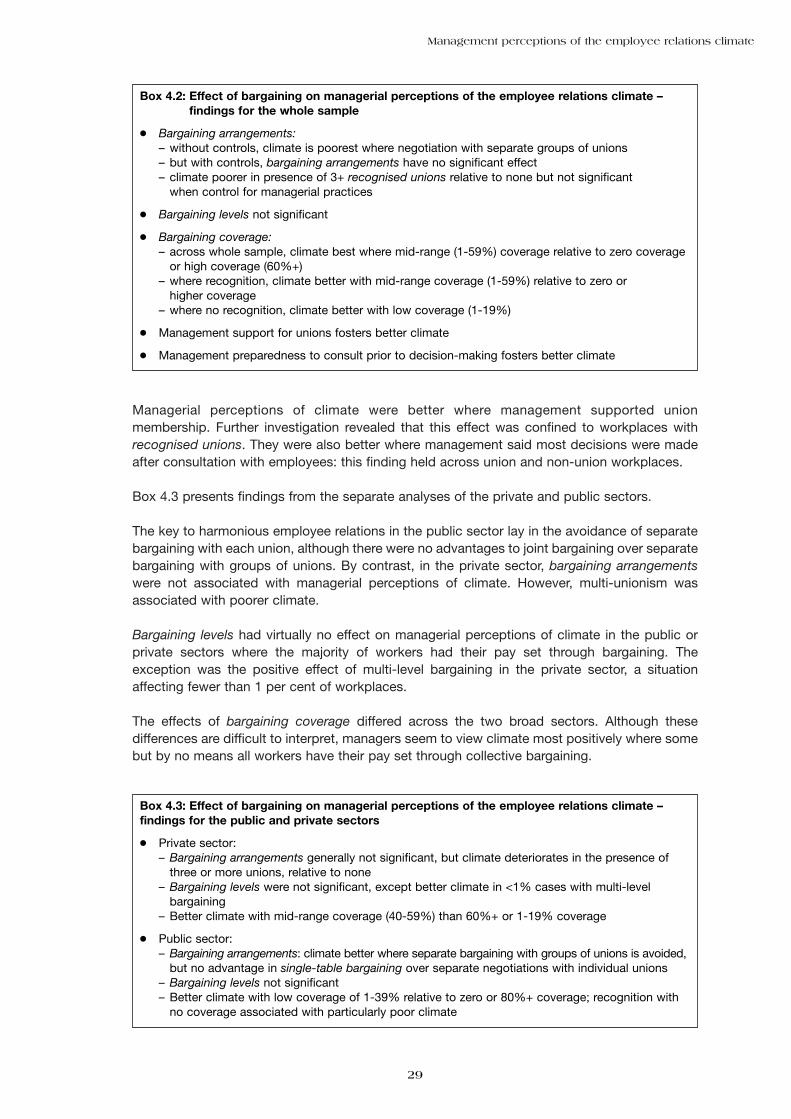
Managerial perceptions of climate were better where management supported unionmembership. Further investigation revealed that this effect was confined to workplaces withrecognised unions. They were also better where management said most decisions were madeafter consultation with employees: this finding held across union and non-union workplaces.
Box 4.3 presents findings from the separate analyses of the private and public sectors.
The key to harmonious employee relations in the public sector lay in the avoidance of separatebargaining with each union, although there were no advantages to joint bargaining over separatebargaining with groups of unions. By contrast, in the private sector, bargaining arrangementswere not associated with managerial perceptions of climate. However, multi-unionism wasassociated with poorer climate.
Bargaining levels had virtually no effect on managerial perceptions of climate in the public orprivate sectors where the majority of workers had their pay set through bargaining. Theexception was the positive effect of multi-level bargaining in the private sector, a situationaffecting fewer than 1 per cent of workplaces.
The effects of bargaining coverage differed across the two broad sectors. Although thesedifferences are difficult to interpret, managers seem to view climate most positively where somebut by no means all workers have their pay set through collective bargaining.
Management perceptions of the employee relations climate
29
Box 4.3: Effect of bargaining on managerial perceptions of the employee relations climate –findings for the public and private sectors
● Private sector:– Bargaining arrangements generally not significant, but climate deteriorates in the presence of
three or more unions, relative to none– Bargaining levels were not significant, except better climate in <1% cases with multi-level
bargaining– Better climate with mid-range coverage (40-59%) than 60%+ or 1-19% coverage
● Public sector:– Bargaining arrangements: climate better where separate bargaining with groups of unions is avoided,
but no advantage in single-table bargaining over separate negotiations with individual unions– Bargaining levels not significant– Better climate with low coverage of 1-39% relative to zero or 80%+ coverage; recognition with
no coverage associated with particularly poor climate
Box 4.2: Effect of bargaining on managerial perceptions of the employee relations climate –findings for the whole sample
● Bargaining arrangements: – without controls, climate is poorest where negotiation with separate groups of unions– but with controls, bargaining arrangements have no significant effect– climate poorer in presence of 3+ recognised unions relative to none but not significant
when control for managerial practices
● Bargaining levels not significant
● Bargaining coverage:– across whole sample, climate best where mid-range (1-59%) coverage relative to zero coverage
or high coverage (60%+)– where recognition, climate better with mid-range coverage (1-59%) relative to zero or
higher coverage– where no recognition, climate better with low coverage (1-19%)
● Management support for unions fosters better climate
● Management preparedness to consult prior to decision-making fosters better climate

Endnotes
19 At 52 per cent and 61 per cent respectively, its mean union density and bargaining coverage are lower than for anyother bargaining arrangement.
20 This subsection, subsection 4.3.2 and Appendix Two (which gives a full account of procedures adopted) also applyto the analyses presented in Chapters Five and Six.
21 We do so by rebasing our equations, that is, altering reference categories, and, in other cases, by computing whethereffects are significant using STATA’s SVYLC command (STATA Manual Release 6, Volume 4, pp. 36-50).
22 A variant of this model, replacing the bargaining arrangement variable with a simple indicator of union recognitionconfirmed that, across all specifications, union recognition was negatively associated with managerial perceptions ofclimate, but not significantly so.
23 Climate was significantly better at the 95 per cent or 90 per cent level of confidence where there was lower coverage(1-59 per cent) than where there was zero or high (60 per cent or more) coverage in all models except the final modelincorporating management practices. In this model the negative effect of zero coverage became non-significant. Thiswas due to the drop in sample sizes with the incorporation of management practices, rather than the effect of thesepractices on bargaining coverage.
24 The count of HRM practices was positive but not significant. In models not shown we found a number of individualpractices had positive significant effects (highly autonomous work-teams, high percentages of workers in problem-solving groups, greater empowerment for workers, and awareness of job responsibilities through ongoing training).Others (performance-related pay, training to do other workers’ jobs, and the existence of grievance and collectivedisputes procedures) had negative effects.
25 Relative to non-union workplaces, the negative effect of having four or more unions is significant at a 95 per cent levelof confidence; the effect of three unions is significant at a 10 per cent level. The effects of having three or four ormore recognised unions are not significant relative to single unionism.
26 Some of the reduction in the union recognition coefficients is accounted for by confining the analysis to workplaceswith non-missing data on the management practice variables, but it does not account for all of the reduction.
27 Compared to ‘not being in favour’, the effect is significant at a 95 per cent confidence level (t-statistic = 2.08).
28 In the model with a full set of controls, the coefficient for no coverage is –0.95 with a t-statistic of 3.61, whereas thecoefficient for high coverage is –0.76, with a t-statistic of 4.01. The only other dimension of unionism to have asignificant effect on managerial perceptions of climate in the union sector was management’s general attitudetowards union membership. Where it was favourable, perceptions of climate were better.
29 The effect was significant at a 95 per cent confidence level relative to zero coverage (t-statistic = 2.07).
30 The full models are presented in Appendix Tables A4.3 and A4.4 respectively. Note that the public and private sectormodels are not identical since the public sector model omits foreign ownership, if the workplace is run by an owner-manager, and SIC category 7, financial services.
31 Since arrangements involving separate negotiations with groups of unions involve more unions than otherarrangements, we tested to see whether the effect was simply the result of having a higher number of recognisedunions. This was not the case.
32 Restriction of the penultimate model to the management practice control sub-sample indicates that this change isdue to the restriction of the sample resulting from the introduction of these variables, rather than any effect of themanagement practices on the bargaining arrangement variable.
33 Climate did not differ significantly in unionised workplaces with minority coverage and those with majority coveragewhere the bargaining occurred at the workplace.
34 The effect is statistically significant relative to other scenarios with the exception of no recognition, no coverage andrecognition with minority coverage.
30
Collective bargaining and workplace performance
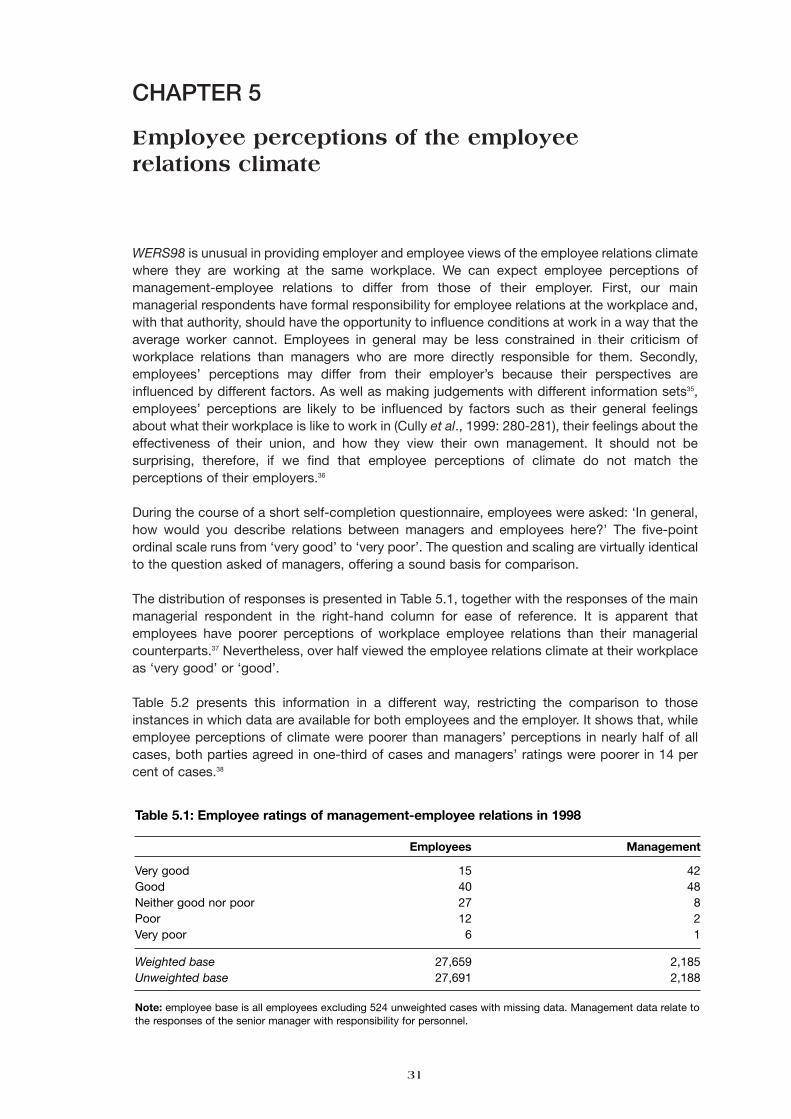
CHAPTER 5
Employee perceptions of the employeerelations climate
WERS98 is unusual in providing employer and employee views of the employee relations climatewhere they are working at the same workplace. We can expect employee perceptions ofmanagement-employee relations to differ from those of their employer. First, our mainmanagerial respondents have formal responsibility for employee relations at the workplace and,with that authority, should have the opportunity to influence conditions at work in a way that theaverage worker cannot. Employees in general may be less constrained in their criticism ofworkplace relations than managers who are more directly responsible for them. Secondly,employees’ perceptions may differ from their employer’s because their perspectives areinfluenced by different factors. As well as making judgements with different information sets35,employees’ perceptions are likely to be influenced by factors such as their general feelingsabout what their workplace is like to work in (Cully et al., 1999: 280-281), their feelings about theeffectiveness of their union, and how they view their own management. It should not besurprising, therefore, if we find that employee perceptions of climate do not match theperceptions of their employers.36
During the course of a short self-completion questionnaire, employees were asked: ‘In general,how would you describe relations between managers and employees here?’ The five-pointordinal scale runs from ‘very good’ to ‘very poor’. The question and scaling are virtually identicalto the question asked of managers, offering a sound basis for comparison.
The distribution of responses is presented in Table 5.1, together with the responses of the mainmanagerial respondent in the right-hand column for ease of reference. It is apparent thatemployees have poorer perceptions of workplace employee relations than their managerialcounterparts.37 Nevertheless, over half viewed the employee relations climate at their workplaceas ‘very good’ or ‘good’.
Table 5.2 presents this information in a different way, restricting the comparison to thoseinstances in which data are available for both employees and the employer. It shows that, whileemployee perceptions of climate were poorer than managers’ perceptions in nearly half of allcases, both parties agreed in one-third of cases and managers’ ratings were poorer in 14 percent of cases.38
31
Table 5.1: Employee ratings of management-employee relations in 1998
Employees Management
Very good 15 42Good 40 48Neither good nor poor 27 8Poor 12 2Very poor 6 1
Weighted base 27,659 2,185Unweighted base 27,691 2,188
Note: employee base is all employees excluding 524 unweighted cases with missing data. Management data relate tothe responses of the senior manager with responsibility for personnel.
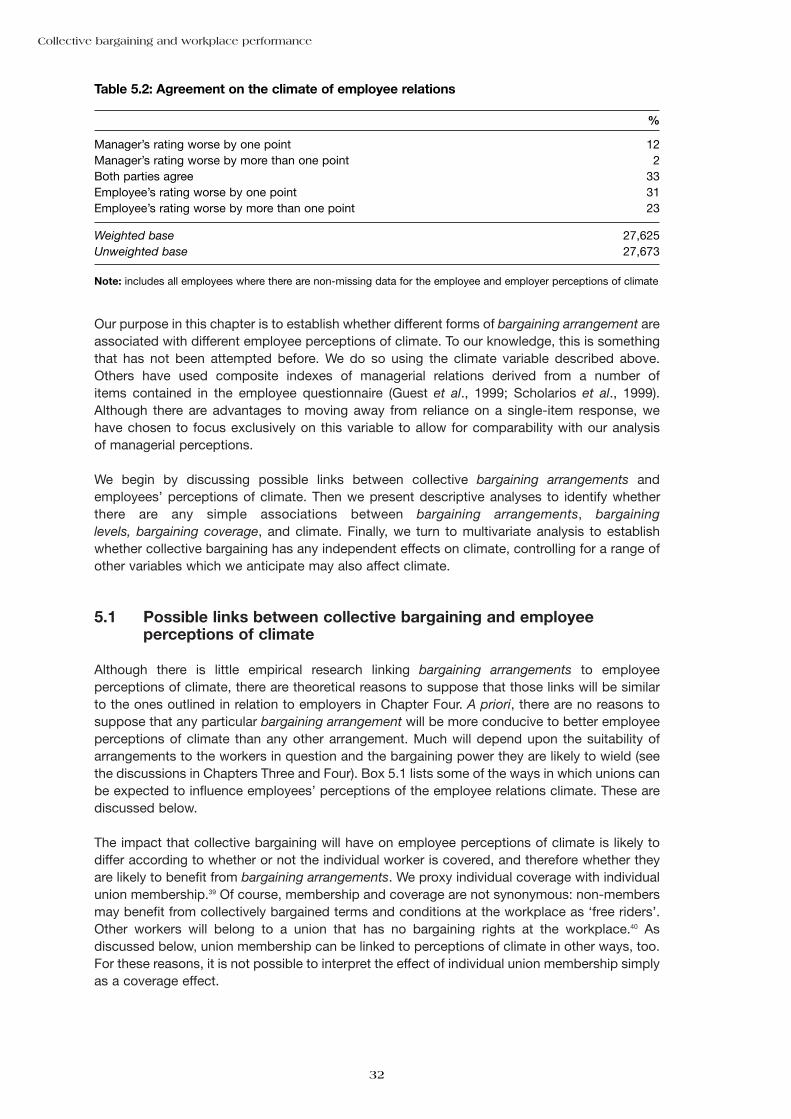
Our purpose in this chapter is to establish whether different forms of bargaining arrangement areassociated with different employee perceptions of climate. To our knowledge, this is somethingthat has not been attempted before. We do so using the climate variable described above.Others have used composite indexes of managerial relations derived from a number ofitems contained in the employee questionnaire (Guest et al., 1999; Scholarios et al., 1999).Although there are advantages to moving away from reliance on a single-item response, wehave chosen to focus exclusively on this variable to allow for comparability with our analysisof managerial perceptions.
We begin by discussing possible links between collective bargaining arrangements andemployees’ perceptions of climate. Then we present descriptive analyses to identify whetherthere are any simple associations between bargaining arrangements, bargaininglevels, bargaining coverage, and climate. Finally, we turn to multivariate analysis to establishwhether collective bargaining has any independent effects on climate, controlling for a range ofother variables which we anticipate may also affect climate.
5.1 Possible links between collective bargaining and employeeperceptions of climate
Although there is little empirical research linking bargaining arrangements to employeeperceptions of climate, there are theoretical reasons to suppose that those links will be similarto the ones outlined in relation to employers in Chapter Four. A priori, there are no reasons tosuppose that any particular bargaining arrangement will be more conducive to better employeeperceptions of climate than any other arrangement. Much will depend upon the suitability ofarrangements to the workers in question and the bargaining power they are likely to wield (seethe discussions in Chapters Three and Four). Box 5.1 lists some of the ways in which unions canbe expected to influence employees’ perceptions of the employee relations climate. These arediscussed below.
The impact that collective bargaining will have on employee perceptions of climate is likely todiffer according to whether or not the individual worker is covered, and therefore whether theyare likely to benefit from bargaining arrangements. We proxy individual coverage with individualunion membership.39 Of course, membership and coverage are not synonymous: non-membersmay benefit from collectively bargained terms and conditions at the workplace as ‘free riders’.Other workers will belong to a union that has no bargaining rights at the workplace.40 Asdiscussed below, union membership can be linked to perceptions of climate in other ways, too.For these reasons, it is not possible to interpret the effect of individual union membership simplyas a coverage effect.
Collective bargaining and workplace performance
32
Table 5.2: Agreement on the climate of employee relations
%
Manager’s rating worse by one point 12Manager’s rating worse by more than one point 2Both parties agree 33Employee’s rating worse by one point 31Employee’s rating worse by more than one point 23
Weighted base 27,625Unweighted base 27,673
Note: includes all employees where there are non-missing data for the employee and employer perceptions of climate
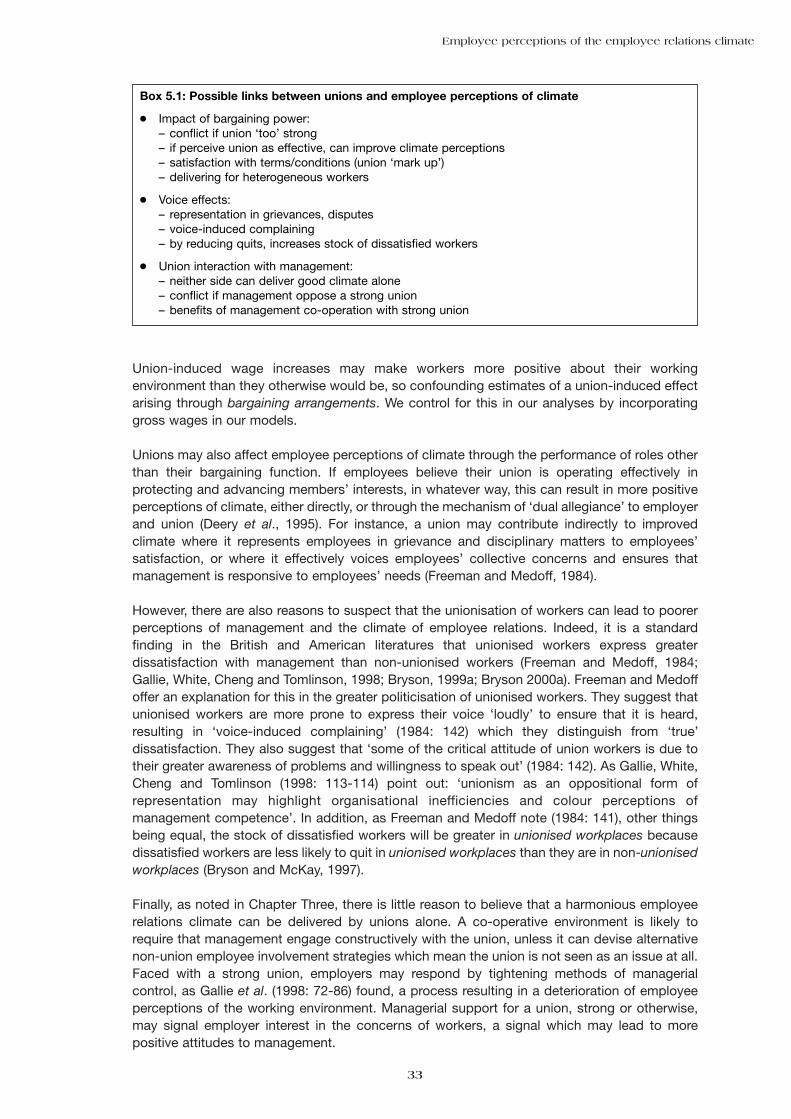
Union-induced wage increases may make workers more positive about their workingenvironment than they otherwise would be, so confounding estimates of a union-induced effectarising through bargaining arrangements. We control for this in our analyses by incorporatinggross wages in our models.
Unions may also affect employee perceptions of climate through the performance of roles otherthan their bargaining function. If employees believe their union is operating effectively inprotecting and advancing members’ interests, in whatever way, this can result in more positiveperceptions of climate, either directly, or through the mechanism of ‘dual allegiance’ to employerand union (Deery et al., 1995). For instance, a union may contribute indirectly to improvedclimate where it represents employees in grievance and disciplinary matters to employees’satisfaction, or where it effectively voices employees’ collective concerns and ensures thatmanagement is responsive to employees’ needs (Freeman and Medoff, 1984).
However, there are also reasons to suspect that the unionisation of workers can lead to poorerperceptions of management and the climate of employee relations. Indeed, it is a standardfinding in the British and American literatures that unionised workers express greaterdissatisfaction with management than non-unionised workers (Freeman and Medoff, 1984;Gallie, White, Cheng and Tomlinson, 1998; Bryson, 1999a; Bryson 2000a). Freeman and Medoffoffer an explanation for this in the greater politicisation of unionised workers. They suggest thatunionised workers are more prone to express their voice ‘loudly’ to ensure that it is heard,resulting in ‘voice-induced complaining’ (1984: 142) which they distinguish from ‘true’dissatisfaction. They also suggest that ‘some of the critical attitude of union workers is due totheir greater awareness of problems and willingness to speak out’ (1984: 142). As Gallie, White,Cheng and Tomlinson (1998: 113-114) point out: ‘unionism as an oppositional form ofrepresentation may highlight organisational inefficiencies and colour perceptions ofmanagement competence’. In addition, as Freeman and Medoff note (1984: 141), other thingsbeing equal, the stock of dissatisfied workers will be greater in unionised workplaces becausedissatisfied workers are less likely to quit in unionised workplaces than they are in non-unionisedworkplaces (Bryson and McKay, 1997).
Finally, as noted in Chapter Three, there is little reason to believe that a harmonious employeerelations climate can be delivered by unions alone. A co-operative environment is likely torequire that management engage constructively with the union, unless it can devise alternativenon-union employee involvement strategies which mean the union is not seen as an issue at all.Faced with a strong union, employers may respond by tightening methods of managerialcontrol, as Gallie et al. (1998: 72-86) found, a process resulting in a deterioration of employeeperceptions of the working environment. Managerial support for a union, strong or otherwise,may signal employer interest in the concerns of workers, a signal which may lead to morepositive attitudes to management.
Employee perceptions of the employee relations climate
33
Box 5.1: Possible links between unions and employee perceptions of climate
● Impact of bargaining power:– conflict if union ‘too’ strong– if perceive union as effective, can improve climate perceptions– satisfaction with terms/conditions (union ‘mark up’)– delivering for heterogeneous workers
● Voice effects:– representation in grievances, disputes– voice-induced complaining– by reducing quits, increases stock of dissatisfied workers
● Union interaction with management:– neither side can deliver good climate alone– conflict if management oppose a strong union– benefits of management co-operation with strong union

5.2 Associations between collective bargaining and employeeperceptions of climate
Descriptive analyses provide stronger evidence of an association between union recognitionand perceptions of poorer climate among employees than there was for the main managerialrespondent (Table 5.3). As in the case of the main managerial respondent, employee perceptionsof climate deteriorated in multi-union workplaces. The ‘climate gap’ between single union andmulti-union workplaces remains, irrespective of the bargaining arrangements adopted by multi-union workplaces.
Those employed by workplaces with no bargaining coverage have more positive perceptions ofthe employee relations climate than other employees, but as the middle section of Table 5.3indicates, associations between bargaining coverage and employee perceptions of climate differacross workplaces with and without union recognition. Where unions are not recognised, climateis poorest where a minority of workers are covered. In the unionised sector, on the other hand,there is little to choose between the perceptions of employees working with no coverage, minoritycoverage or majority coverage. However, among workplaces with majority coverage, employeeshave poorer perceptions of climate where they are more directly involved in bargaining over theirown terms and conditions, namely where bargaining occurs at workplace-level.
Finally, as anticipated, union members have poorer perceptions of climate than non-members,whether they work in workplaces with a recognised union or not. However, as the bottomsection of Table 5.3 indicates, the negative association between climate and recognition persists,controlling for individual membership. Other research using a nationally representative sampleof employees in 1998 found these ‘membership’ and ‘workplace recognition’ effects persistedafter controlling for other individual and workplace-level variables (Bryson, 1999a).41
5.3 Multivariate analyses of the associations between collectivebargaining and employee perceptions of climate
The descriptive analyses presented above suggest that employee perceptions of climate variedmore with aspects of collective bargaining than was the case among managerial respondents.To establish whether there is a truly independent association between bargaining arrangementsand employee perceptions of climate we use multivariate regression analysis. The distribution ofour outcome variable is such that there is no need to collapse the ‘poor’ and ‘very poor’ categoriesinto a single category. So the outcome variable for our models is precisely the one presentedabove. Significant positive coefficients indicate variables associated with better climate.
Since our general modelling approach is identical to the approach adopted in Chapter Three, werefer the reader to Chapter Three and Appendix Two for a description of those techniques. Theremainder of this section focuses on those aspects of the analysis that differ from the analysisof managerial perceptions.
Collective bargaining and workplace performance
34

Employee perceptions of the employee relations climate
35
Table 5.3: Collective bargaining and employee perceptions of the employee relations climate
Very Good Neither Poor Very Weighted good good nor poor base
poor
row percentages
Workplace union status:No union recognised 20 42 23 10 5 11,576 (11,073)Union recognised 12 38 30 14 7 16,084 (16,618)
Number of recognised unions:One 16 39 27 12 6 6,119 (6,575)Two 10 40 28 15 7 3,969 (4,404)Three 7 37 34 15 7 2,131 (2,392)Four or more 9 33 33 17 8 3,865 (3,247)
Collective bargaining arrangement:Single union 16 39 27 12 6 6,119 (6,575)Multiple unions, joint bargaining 10 37 32 15 6 5,627 (6,000)Multiple unions, separate bargaining with each union 8 36 28 18 10 2,988 (2,923)Multiple unions, separate bargaining with union groups 7 35 35 15 7 919 (719)Multiple union, joint/separate bargaining unknown 11 43 34 9 3 431 (401)
Collective bargaining levels: No recognition, no coverage 20 42 23 10 5 10,026 (9,701)No recognition, minority coverage 11 43 29 13 3 438 (444)No recognition, majority coverage 26 38 21 10 4 771 (603)Recognition, no coverage 15 38 30 11 6 1,814 (1,773)Recognition, minority coverage 14 38 30 12 6 2,281 (2,262)Recognition, majority coverage, workplace-level 7 33 32 19 9 2,415 (1,879)Recognition, majority coverage, organisation-level 11 38 29 15 7 4,872 (5,303)Recognition, majority coverage, industry-level 13 39 29 12 7 3,794 (4,218)Recognition, multi-level 12 44 27 15 2 238 (303)
Collective bargaining coverage:Zero 19 42 24 10 5 11,840 (11,474)1-19% 13 40 30 11 6 878 (884)20-39% 14 39 31 11 5 1,399 (1,398)40-59% 14 43 23 17 3 1,053 (906)60-79% 15 32 28 16 9 1,518 (1,412)80-99% 8 34 32 18 9 3,368 (2,996)100% 12 40 29 13 6 6,619 (7,461)
Individual union membership:Member, workplace with recognised union 9 35 31 16 9 9,789 (10,172)Member, workplace without recognised union 14 37 29 14 6 1,035 (1,046)Non-member, workplace with recognised union 16 42 28 10 4 6,253 (6,407)Non-member, workplace without recognised union 21 43 23 10 4 10,488 (9,979)
Base: all employees with non-missing data. Note figures in parentheses are unweighted bases.
5.3.1 The sample
Others have confined their analyses of employees’ perceptions of climate to non-managerialemployees, perhaps because managers are overwhelmingly positive in their assessment of climateand lie on one side of the management-employee line, while non-managerial employees lie onthe other (Cully et al., 1999: 276-283). We adopt an alternative approach, analysing theperceptions of all employees with non-missing data. After all, most managers experience ‘beingmanaged’ or supervised. Those managers actually responsible for employee relations atsampled workplaces were eligible for the main management questionnaire, and were notincluded in the eligible sample of employees at the workplace. Our models include occupationalcontrols to account for more positive perceptions of climate further up the occupational hierarchy.
5.3.2 Tackling limitations to the analysis
The selection problem discussed in Chapter Four arising from the non-random distribution ofbargaining arrangements is compounded in the case of matched employee-employer data sincethere is possible sorting among workplaces and among employees. In this report we havesimply incorporated a wide range of factors that we know influence employee perceptions ofmanagement to minimise the problem of omitted variables bias. We also test whether ourfindings hold across sub-samples where we might expect systematic differences in theassociation between bargaining arrangements and perceptions of management (within theunionised and non-unionised sectors, the public and private sectors, and among unionmembers and non-members).
A second problem we face is that two control variables in particular may not be independent ofour outcome variable. These are union membership status and job tenure. Employees maybecome union members because employee relations are poor. Since union members are heavilyconcentrated in workplaces with recognised unions, this negative association betweenmembership and climate may understate any negative association between union recognitionand climate. Job tenure may not be independent of the employee relations climate becausethose viewing the climate as poor may leave. As discussed earlier, unions increase job tenure,other things being equal, and since perceptions of climate tend to deteriorate with increasedtenure, models containing job tenure may understate any negative association between unionsand climate. To overcome this problem, we test the sensitivity of our results to the exclusion ofindividual union membership and job tenure.
5.3.3 Control variables
The combination of employee data on demographics, qualifications, job characteristics, andattitudes to their job, management and unions, coupled with workplace data obtained from themanager responsible for personnel or human resource issues at the site, allows us to control fora very wide range of individual-level and workplace-level information to estimate preciselyinfluences on managerial responsiveness to employees. The controls are identified in Box 5.2.Appendix Table A5.1 defines these variables and shows their incidence in the sample as awhole, and the public and private sectors separately. Appendix Four discusses the rationale forthe inclusion of the chosen controls.
Collective bargaining and workplace performance
36

5.4 Results
5.4.1 The impact of bargaining arrangements
Table 5.4 summarises results from multivariate analyses testing the impact of collectivebargaining arrangements on employee perceptions of climate in the whole sample. (The fullmodels are appended in Appendix Table A5.2). We test the sensitivity of the bargainingarrangement effects to an increasing number of control variables as we move from left to right.We begin by assessing the effect of bargaining arrangements with no controls at all. Then weadd the following in stepwise fashion: bargaining coverage; employees’ demographiccharacteristics; job characteristics; workplace characteristics.
Among multi-union workplaces, employee perceptions of climate are more favourable wherethose unions bargain jointly rather than separately. This remains so on entering demographiccontrols and job characteristics (models 3 and 4). However, once workplace controls are added(model 5), employee perceptions do not differ significantly whether unions bargain jointly or asseparate groups. Perceptions of climate remain significantly poorer where each union bargainsseparately. Indeed, climate is poorer where each union negotiates separately than under anyother form of bargaining arrangement, suggesting that it is the avoidance of this arrangement,rather than the adoption of any other particular arrangement, which is advisable from anemployee relations perspective.
Bargaining coverage of 80-99 per cent is associated with poorer climate when compared to zerocoverage, but in the model with full controls the coefficient is similar to the coefficient for verylow coverage (1-19 per cent), so the coverage effects are hard to interpret.
All demographic characteristics are strongly associated with employees’ perceptions of climate,as are most job characteristics. Although workplace characteristics seem to be less salient,employees’ perceptions do differ according to workplace size, workforce composition,ownership, industry and location. Being a ‘good’ employer, as signalled by the IiP award, isassociated with good climate, as was the case with managerial respondents.42 Managerialperceptions of climate were poorer when the respondent was an employee relations specialist.The presence of an employee relations specialist is also associated with poorer employeeperceptions of climate, indicating that the effect is not simply due to the outlook of specialistswhen compared with non-specialist managers, but may also be due to aspects of managementpractice associated with specialists.
Employee perceptions of the employee relations climate
37
Box 5.2: Controls used in analyses of employee perceptions of the employee relations climate
Individual-level:
● Demographic: gender, age, education, ethnicity
● Job: occupation, workplace tenure, hours,contract-type, gross wage
● Union membership status
● Employee perceptions of union effectiveness
● Employee perceptions of managementattitudes to union membership
Workplace-level:
● Workforce composition: N employees, Noccupations, % female, % managers, %female managers, % ethnic, % part-time,union density
● Ownership: public, foreign, multi-site organisation
● Age
● Workplace activity
● Management practices: ER specialist, HRMpractices, N direct voice channels, IiP
● Industry
● Region
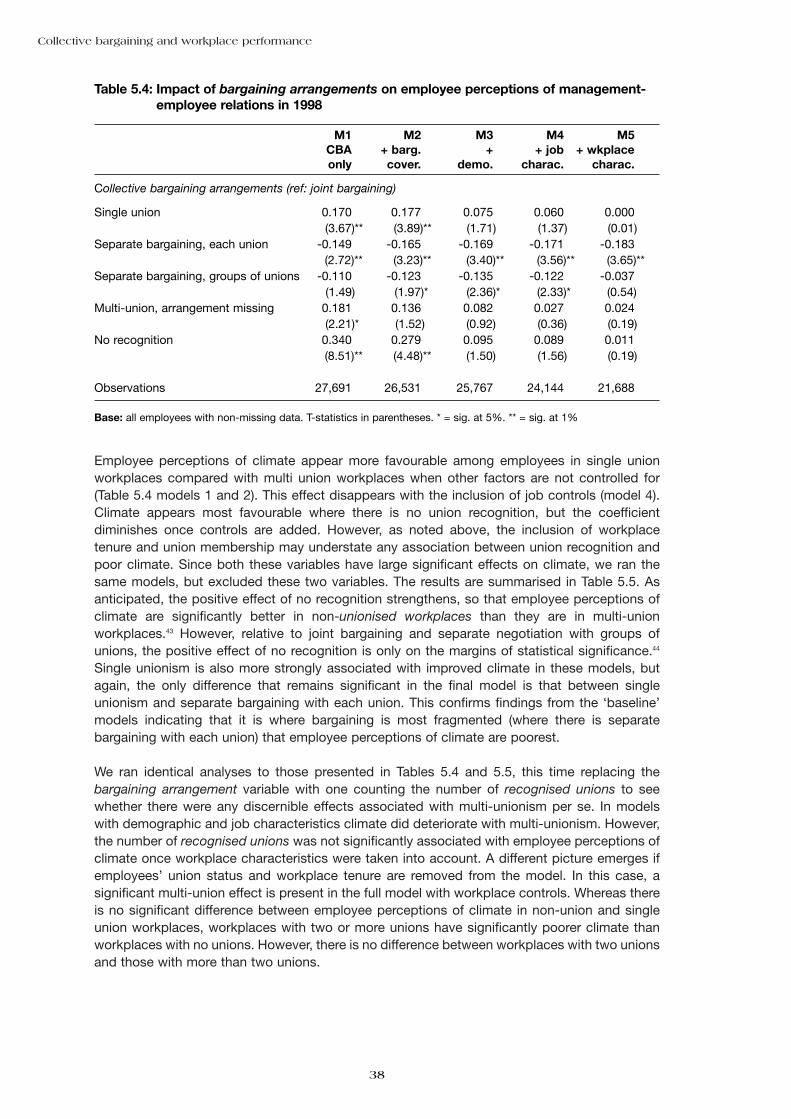
Employee perceptions of climate appear more favourable among employees in single unionworkplaces compared with multi union workplaces when other factors are not controlled for(Table 5.4 models 1 and 2). This effect disappears with the inclusion of job controls (model 4).Climate appears most favourable where there is no union recognition, but the coefficientdiminishes once controls are added. However, as noted above, the inclusion of workplacetenure and union membership may understate any association between union recognition andpoor climate. Since both these variables have large significant effects on climate, we ran thesame models, but excluded these two variables. The results are summarised in Table 5.5. Asanticipated, the positive effect of no recognition strengthens, so that employee perceptions ofclimate are significantly better in non-unionised workplaces than they are in multi-unionworkplaces.43 However, relative to joint bargaining and separate negotiation with groups ofunions, the positive effect of no recognition is only on the margins of statistical significance.44
Single unionism is also more strongly associated with improved climate in these models, butagain, the only difference that remains significant in the final model is that between singleunionism and separate bargaining with each union. This confirms findings from the ‘baseline’models indicating that it is where bargaining is most fragmented (where there is separatebargaining with each union) that employee perceptions of climate are poorest.
We ran identical analyses to those presented in Tables 5.4 and 5.5, this time replacing thebargaining arrangement variable with one counting the number of recognised unions to seewhether there were any discernible effects associated with multi-unionism per se. In modelswith demographic and job characteristics climate did deteriorate with multi-unionism. However,the number of recognised unions was not significantly associated with employee perceptions ofclimate once workplace characteristics were taken into account. A different picture emerges ifemployees’ union status and workplace tenure are removed from the model. In this case, asignificant multi-union effect is present in the full model with workplace controls. Whereas thereis no significant difference between employee perceptions of climate in non-union and singleunion workplaces, workplaces with two or more unions have significantly poorer climate thanworkplaces with no unions. However, there is no difference between workplaces with two unionsand those with more than two unions.
Collective bargaining and workplace performance
38
Table 5.4: Impact of bargaining arrangements on employee perceptions of management-employee relations in 1998
M1 M2 M3 M4 M5CBA + barg. + + job + wkplaceonly cover. demo. charac. charac.
Collective bargaining arrangements (ref: joint bargaining)
Single union 0.170 0.177 0.075 0.060 0.000(3.67)** (3.89)** (1.71) (1.37) (0.01)
Separate bargaining, each union -0.149 -0.165 -0.169 -0.171 -0.183(2.72)** (3.23)** (3.40)** (3.56)** (3.65)**
Separate bargaining, groups of unions -0.110 -0.123 -0.135 -0.122 -0.037(1.49) (1.97)* (2.36)* (2.33)* (0.54)
Multi-union, arrangement missing 0.181 0.136 0.082 0.027 0.024(2.21)* (1.52) (0.92) (0.36) (0.19)
No recognition 0.340 0.279 0.095 0.089 0.011(8.51)** (4.48)** (1.50) (1.56) (0.19)
Observations 27,691 26,531 25,767 24,144 21,688
Base: all employees with non-missing data. T-statistics in parentheses. * = sig. at 5%. ** = sig. at 1%

We introduced additional union controls one at a time to our baseline bargaining arrangementmodels to establish whether our results were sensitive to their inclusion. We experimented witheight union measures, each entering the baseline model containing bargaining arrangements,bargaining coverage and the full set of controls.
The association between separate bargaining with each union and poorer climate remainedsignificant throughout relative to all other bargaining arrangements. Employees perceived theclimate to be better where they said that unions at their workplace took notice of members’problems and complaints, and where they agreed ‘unions are taken seriously by managementat this workplace’. Both effects were highly significant. This lends support to the suggestion thatunions that are perceived as effective by employees can contribute to improved employeerelations. Management support for unions also contributed to a better climate. Wheremanagement said they recommended union membership to their employees, or whereemployees thought their management was ‘in favour’ of union membership, employees’perceptions of climate were more favourable. Equally, where employees thought theirmanagement was ‘not in favour’ of union membership, climate was poorer. Again, the effectswere highly significant. Although this evidence is consistent with the idea that employeerelations benefit where management and unions support one another, not all the evidence pointsin this direction. When we added the main managerial respondent’s perception ofmanagement’s attitudes to union membership to the baseline model, employees viewed climateas better only when the managerial respondent said that union membership was ‘not an issue’.The other union indicator with a significant effect on employee perceptions of climate was on-site union representation.45 The presence of an on-site union representative was associated withpoorer perceptions of climate, confirming previous research (Bryson, 1999a). This may be anindicator of union strength on the ground, which may contribute to poorer climate (althoughunion density and bargaining coverage are largely insignificant). Alternatively, on-siterepresentation may result in ‘voice-induced complaining’ discussed earlier.
In the remainder of this section we report analyses of climate among subsets of our sample.We begin with employees in the public and private sectors. Then we focus on those in theunionised sector, reporting effects for all workers in the sector, and then for members and non-members separately.
Employee perceptions of the employee relations climate
39
Table 5.5: Models estimating impact of bargaining arrangements on employee perceptionsof climate, excluding workplace tenure and union membership
+ coverage and + job + workplace demographics characteristics characteristics
Collective bargaining arrangements (ref: joint bargaining)
Single union 0.126 0.098 0.033(2.83)** (2.21)* (0.73)
Separate bargaining, each union -0.155 -0.159 -0.168(3.08)** (3.30)** (3.41)**
Separate bargaining, groups of unions -0.137 -0.131 -0.043(2.29)* (2.41)* (0.63)
Multi-union, arrangement missing 0.102 0.042 0.030(1.14) (0.54) (0.25)
No recognition 0.227 0.191 0.101(3.67)** (3.35)** (1.77)
Observations 25,840 24,250 21,780
Base: all employees with non-missing data. T-statistics in parentheses. * = sig. at 5%; ** = sig. at 1%

Table 5.6 shows that the effects of bargaining arrangements differ across the public and privatesectors.46 In general, the private sector models reflect those for the whole sample. The negativeeffect of separate bargaining with each union is apparent, as are the initial positive effects ofsingle unionism and non-unionism that disappear with the introduction of controls. In contrastto the whole sample model, however, employee perceptions of climate are most favourablewhere there is bargaining with separate groups of unions. The effect is not particularly robust,however: the sign on the coefficient only becomes positive in the final model with full controls,and is only significant at a 90 per cent confidence level relative to joint bargaining. This is likelyto reflect the fact that this bargaining arrangement is uncommon in private sector workplaces,accounting for fewer than 1 per cent of these workplaces.
In the public sector, there are indications that employees perceive climate as poorer where thereis separate bargaining with groups of unions. However, this effect loses significance with theintroduction of workplace controls (model 5 in the top panel of Table 5.6). The negative effect ofseparate bargaining with each union is very weak in the public sector, only reaching significanceat a 10 per cent level in the penultimate model (model 4 in the top panel). The only public sectorbargaining effect to survive the introduction of workplace controls is the positive perception ofclimate where there are no unions recognised.
Collective bargaining and workplace performance
40
Table 5.6: Impact of bargaining arrangements on employee perceptions of management-employee relations in the public and private sectors
M1 M2 M3 M4 M5CBA + barg. + + job + wkplaceonly cover. demo. charac. charac.
Public sector:Collective bargaining arrangements (ref: joint bargaining)
Single union 0.210 0.175 0.134 0.109 0.005(2.68)** (2.17)* (1.79) (1.47) (0.07)
Separate bargaining, each union -0.135 -0.118 -0.102 -0.128 -0.089(1.95) (1.62) (1.46) (1.89) (1.21)
Separate bargaining, groups of unions -0.121 -0.135 -0.167 -0.158 -0.116(1.57) (1.57) (2.00)* (2.18)* (1.20)
Multi-union, arrangement missing 0.121 0.110 0.094 0.044 0.143(1.33) (1.16) (0.99) (0.55) (1.11)
No recognition 0.308 0.248 0.173 0.153 0.255(2.91)** (2.12)* (1.47) (1.41) (2.71)**
Observations 9,593 9,040 8,725 8,209 6,973
Private sector:Collective bargaining arrangements (ref: joint bargaining)
Single union 0.237 0.204 0.033 0.018 -0.012(4.04)** (3.69)** (0.58) (0.30) (0.19)
Separate bargaining, each union -0.121 -0.163 -0.219 -0.208 -0.168(1.47) (2.40)* (3.26)** (3.17)** (2.50)*
Separate bargaining, groups of unions -0.169 -0.071 -0.047 -0.029 0.132(1.75) (0.66) (0.54) (0.31) (1.90)
Multi-union, arrangement missing 0.134 0.068 -0.051 -0.147 -0.120(0.62) (0.32) (0.21) (0.68) (0.55)
No recognition 0.466 0.302 0.035 0.041 -0.063(9.15)** (3.82)** (0.43) (0.53) (0.78)
Observations 18,098 17,491 17,042 15,935 14,715
T-statistics in parentheses. * = sig. at 5%; ** = sig. at 1%

Results for the unionised sector are not substantively different from the economy as a whole(Table 5.7).47 However, effects differ markedly according to individuals’ union membershipstatus.48 The association between poorer perceptions of climate and separate bargainingarrangements is strong among union members (middle panel of Table 5.7). Although thedifference between separate bargaining with groups of unions and joint bargaining is only on themargins of statistical significance when workplace controls are entered (model 5), the negativeeffect of separate bargaining with each union remains strong throughout.
By contrast, bargaining arrangements have little influence on non-members’ perceptions ofclimate, even though this model is confined to those non-members in unionised workplaces.49 Itmay be that non-members’ perceptions of the employee relations climate in their workplace areunaffected by bargaining arrangements because they are removed from bargaining processesand, if their terms and conditions are not set by bargaining, they will have less of a stake in the
Employee perceptions of the employee relations climate
41
Table 5.7: Impact of bargaining arrangements on employee perceptions of management-employee relations in unionised workplaces
M1 M2 M3 M4 M5CBA + barg. + + job + wkplaceonly cover. demo. charac. charac.
All employees:Collective bargaining arrangements (ref: joint bargaining)
Single union 0.173 0.183 0.083 0.073 0.009(3.67)** (3.98)** (1.89) (1.63) (0.18)
Separate bargaining, each union -0.152 -0.169 -0.169 -0.174 -0.178(2.72)** (3.24)** (3.37)** (3.60)** (3.55)**
Separate bargaining, groups of unions -0.112 -0.124 -0.136 -0.128 -0.054(1.48) (1.91) (2.27)* (2.37)* (0.75)
Multi-union, arrangement missing 0.185 0.144 0.093 0.011 -0.015(2.22)* (1.57) (1.03) (0.15) (0.14)
Observations 16,618 15,783 15,341 14,460 12,781
Union members:Collective bargaining arrangements (ref: joint bargaining)
Single union 0.104 0.119 0.090 0.087 -0.004(1.88) (2.19)* (1.65) (1.52) (0.06)
Separate bargaining, each union -0.210 -0.219 -0.194 -0.190 -0.211(3.41)** (3.64)** (3.24)** (3.22)** (3.41)**
Separate bargaining, groups of unions -0.182 -0.167 -0.168 -0.168 -0.142(2.55)* (2.52)* (2.33)* (2.54)* (1.66)
Multi-union, arrangement missing 0.222 0.180 0.156 0.063 0.027(2.64)** (2.01)* (1.83) (0.84) (0.22)
Observations 10,172 9,706 9,448 8,895 7,820
Union non-members:Collective bargaining arrangements (ref: joint bargaining)
Single union 0.103 0.122 0.075 0.057 0.038(1.72) (2.06)* (1.26) (1.02) (0.63)
Separate bargaining, each union -0.087 -0.102 -0.095 -0.124 -0.110(1.19) (1.42) (1.26) (1.99)* (1.67)
Separate bargaining, groups of unions 0.064 0.007 -0.041 -0.006 0.134(0.63) (0.06) (0.39) (0.06) (1.24)
Multi-union, arrangement missing 0.066 0.028 -0.022 -0.074 -0.103(0.63) (0.24) (0.18) (0.49) (0.81)
Observations 6,407 6,042 5,893 5,565 4,961
T-statistics in parentheses. * = sig. at 5%; ** = sig. at 1%
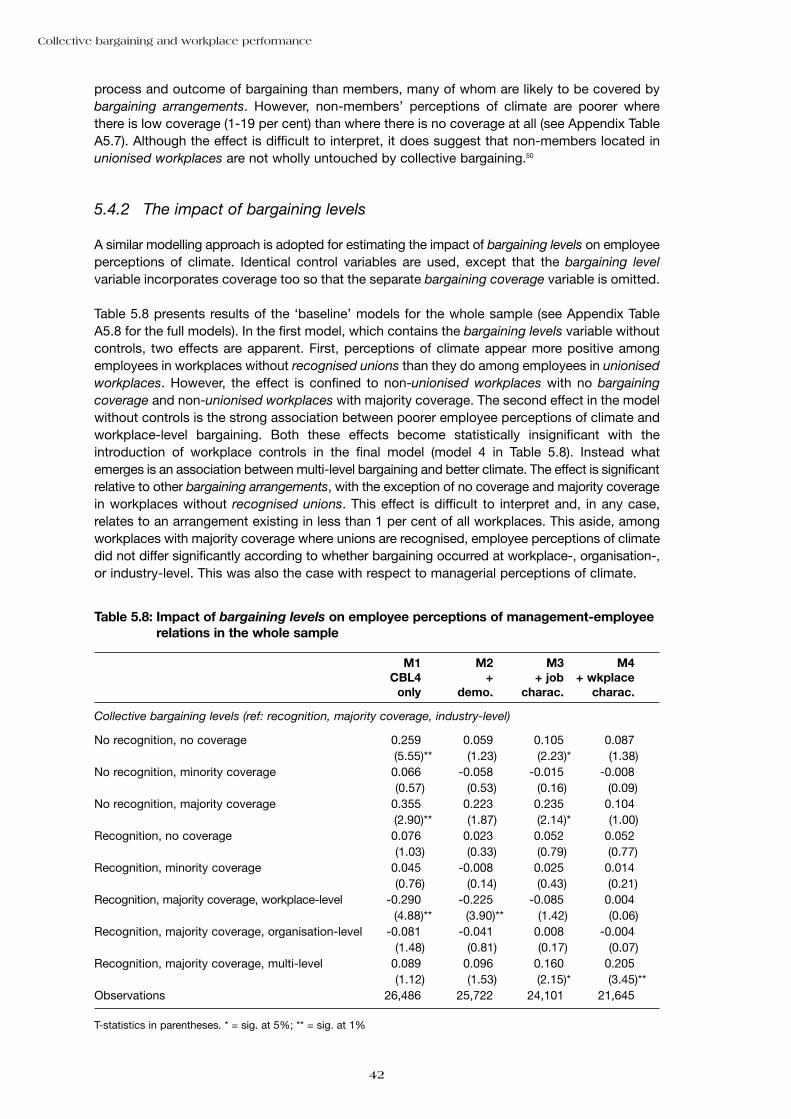
Collective bargaining and workplace performance
42
Table 5.8: Impact of bargaining levels on employee perceptions of management-employeerelations in the whole sample
M1 M2 M3 M4CBL4 + + job + wkplace
only demo. charac. charac.
Collective bargaining levels (ref: recognition, majority coverage, industry-level)
No recognition, no coverage 0.259 0.059 0.105 0.087(5.55)** (1.23) (2.23)* (1.38)
No recognition, minority coverage 0.066 -0.058 -0.015 -0.008(0.57) (0.53) (0.16) (0.09)
No recognition, majority coverage 0.355 0.223 0.235 0.104(2.90)** (1.87) (2.14)* (1.00)
Recognition, no coverage 0.076 0.023 0.052 0.052(1.03) (0.33) (0.79) (0.77)
Recognition, minority coverage 0.045 -0.008 0.025 0.014(0.76) (0.14) (0.43) (0.21)
Recognition, majority coverage, workplace-level -0.290 -0.225 -0.085 0.004(4.88)** (3.90)** (1.42) (0.06)
Recognition, majority coverage, organisation-level -0.081 -0.041 0.008 -0.004(1.48) (0.81) (0.17) (0.07)
Recognition, majority coverage, multi-level 0.089 0.096 0.160 0.205(1.12) (1.53) (2.15)* (3.45)**
Observations 26,486 25,722 24,101 21,645
T-statistics in parentheses. * = sig. at 5%; ** = sig. at 1%
process and outcome of bargaining than members, many of whom are likely to be covered bybargaining arrangements. However, non-members’ perceptions of climate are poorer wherethere is low coverage (1-19 per cent) than where there is no coverage at all (see Appendix TableA5.7). Although the effect is difficult to interpret, it does suggest that non-members located inunionised workplaces are not wholly untouched by collective bargaining.50
5.4.2 The impact of bargaining levels
A similar modelling approach is adopted for estimating the impact of bargaining levels on employeeperceptions of climate. Identical control variables are used, except that the bargaining levelvariable incorporates coverage too so that the separate bargaining coverage variable is omitted.
Table 5.8 presents results of the ‘baseline’ models for the whole sample (see Appendix TableA5.8 for the full models). In the first model, which contains the bargaining levels variable withoutcontrols, two effects are apparent. First, perceptions of climate appear more positive amongemployees in workplaces without recognised unions than they do among employees in unionisedworkplaces. However, the effect is confined to non-unionised workplaces with no bargainingcoverage and non-unionised workplaces with majority coverage. The second effect in the modelwithout controls is the strong association between poorer employee perceptions of climate andworkplace-level bargaining. Both these effects become statistically insignificant with theintroduction of workplace controls in the final model (model 4 in Table 5.8). Instead whatemerges is an association between multi-level bargaining and better climate. The effect is significantrelative to other bargaining arrangements, with the exception of no coverage and majority coveragein workplaces without recognised unions. This effect is difficult to interpret and, in any case,relates to an arrangement existing in less than 1 per cent of all workplaces. This aside, amongworkplaces with majority coverage where unions are recognised, employee perceptions of climatedid not differ significantly according to whether bargaining occurred at workplace-, organisation-,or industry-level. This was also the case with respect to managerial perceptions of climate.
When individual union membership and workplace tenure are removed from the models forreasons discussed earlier, the positive association between no recognition and good climatecomes through more strongly, as was the case in the bargaining arrangement models. Indeed,the combination of no recognition and no coverage is associated with better employeeperceptions of climate than any other scenario, other than majority coverage with no recognitionand majority coverage with multi-level bargaining, where the difference is not significant. As inthe baseline model that includes union membership and workplace tenure, the only significanteffect within the unionised sector is the positive effect of multi-level bargaining.
A similar pattern of results emerges when running the same models on unionised workplacesonly, although the positive effect of multi-level bargaining is stronger. Once again, there are cleardifferences across the public and private sectors (Table 5.9). In the private sector model withoutcontrols (model 1 in the bottom panel of Table 5.9), employee perceptions of climate are betterwhere unions are absent or, where they are recognised, there is no bargaining coverage.However, these effects gradually disappear with the inclusion of controls until, in the final modelwith workplace controls (model 4), the only significant effect is the positive effect of multi-levelbargaining relative to recognition with minority coverage.51
In the public sector, multi-level bargaining is also associated with good climate in the fullyspecified model (model 4 in the top panel of Table 5.9). In the first three models, it appears thatworkplace-level bargaining with majority coverage is associated with significantly poorer climatethan bargaining at industry-level. However, the effect loses significance on the introduction ofworkplace characteristics. Both recognition and the extent of bargaining coverage areimportant. In the public sector, employees are most likely to view climate positively where thereis no recognition but the majority of workers are covered by collective bargaining. This effectpersists with the introduction of controls.
The effects reported in this section do not conform to our expectations from the theoriesdiscussed in previous sections and are difficult to interpret. But clearly, whether or not a unionis recognised, and the extent of bargaining coverage in the workplace, can have importanteffects on employees’ perceptions of climate.
Employee perceptions of the employee relations climate
43
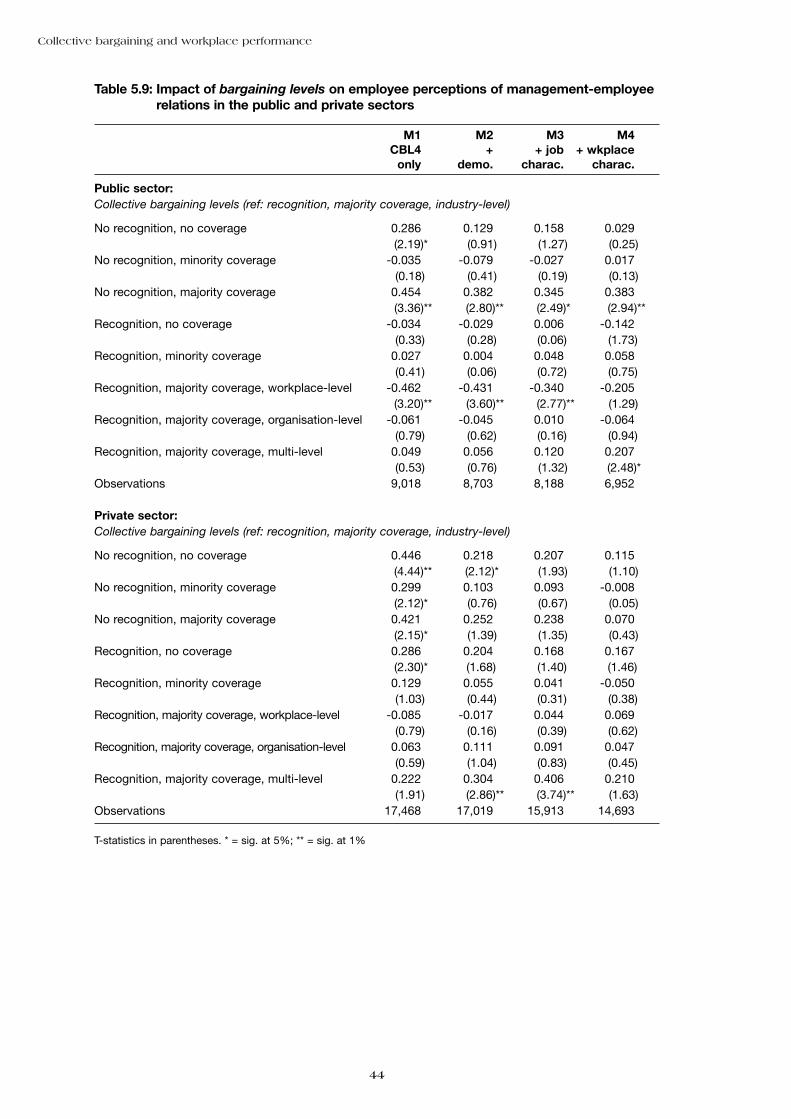
Collective bargaining and workplace performance
44
Table 5.9: Impact of bargaining levels on employee perceptions of management-employeerelations in the public and private sectors
M1 M2 M3 M4CBL4 + + job + wkplace
only demo. charac. charac.
Public sector:Collective bargaining levels (ref: recognition, majority coverage, industry-level)
No recognition, no coverage 0.286 0.129 0.158 0.029(2.19)* (0.91) (1.27) (0.25)
No recognition, minority coverage -0.035 -0.079 -0.027 0.017(0.18) (0.41) (0.19) (0.13)
No recognition, majority coverage 0.454 0.382 0.345 0.383(3.36)** (2.80)** (2.49)* (2.94)**
Recognition, no coverage -0.034 -0.029 0.006 -0.142(0.33) (0.28) (0.06) (1.73)
Recognition, minority coverage 0.027 0.004 0.048 0.058(0.41) (0.06) (0.72) (0.75)
Recognition, majority coverage, workplace-level -0.462 -0.431 -0.340 -0.205(3.20)** (3.60)** (2.77)** (1.29)
Recognition, majority coverage, organisation-level -0.061 -0.045 0.010 -0.064(0.79) (0.62) (0.16) (0.94)
Recognition, majority coverage, multi-level 0.049 0.056 0.120 0.207(0.53) (0.76) (1.32) (2.48)*
Observations 9,018 8,703 8,188 6,952
Private sector:Collective bargaining levels (ref: recognition, majority coverage, industry-level)
No recognition, no coverage 0.446 0.218 0.207 0.115(4.44)** (2.12)* (1.93) (1.10)
No recognition, minority coverage 0.299 0.103 0.093 -0.008(2.12)* (0.76) (0.67) (0.05)
No recognition, majority coverage 0.421 0.252 0.238 0.070(2.15)* (1.39) (1.35) (0.43)
Recognition, no coverage 0.286 0.204 0.168 0.167(2.30)* (1.68) (1.40) (1.46)
Recognition, minority coverage 0.129 0.055 0.041 -0.050(1.03) (0.44) (0.31) (0.38)
Recognition, majority coverage, workplace-level -0.085 -0.017 0.044 0.069(0.79) (0.16) (0.39) (0.62)
Recognition, majority coverage, organisation-level 0.063 0.111 0.091 0.047(0.59) (1.04) (0.83) (0.45)
Recognition, majority coverage, multi-level 0.222 0.304 0.406 0.210(1.91) (2.86)** (3.74)** (1.63)
Observations 17,468 17,019 15,913 14,693
T-statistics in parentheses. * = sig. at 5%; ** = sig. at 1%

5.5 Summary
Employees’ perceptions of climate were poorer where there was bargaining with each unionseparately than under any other form of bargaining arrangement. The avoidance of thisarrangement, rather than the adoption of any other particular arrangement, might be advisablefrom an employee relations perspective.
We explained why there were grounds for excluding individual union membership and workplacetenure from our models. When we did so, positive associations between perceptions of climateand working in a non-union environment strengthened. Results from these models neverthelessconfirmed findings from the ‘baseline’ models indicating that it is where bargaining is mostfragmented (where there is separate bargaining with each union) that employee perceptions ofclimate are poorest.
Turning to bargaining levels, employees’ perceptions of climate in multi-union workplaces didnot differ significantly according to whether bargaining occurred at workplace-, organisation-, orindustry-level. There was one exception, namely the positive effect of multi-level bargaining, anarrangement existing in less than 1 per cent of workplaces.
When individual union membership and workplace tenure were removed from the model, thepositive association between no recognition and good climate came through more strongly. Thecombination of no recognition and no coverage was strongly associated with good climate.Climate also deteriorated in the presence of two or more unions. Unions’ impact on employeeperceptions of climate was not wholly captured by bargaining arrangements or coverage. Whereemployees viewed unions as effective, and where there were indications that management wassupportive of unions, they were associated with better employee perceptions of the climate.Equally, where employees thought their management was ‘not in favour’ of union membership,climate was poorer. This evidence is consistent with the idea that employee relations benefitwhere management and unions support one another.
Box 5.3 summarises results for different sectors of the economy. The effects of bargainingarrangements differed across the public and private sectors. In general, the private sectormodels reflected those for the whole sample, with climate poorest where there was separatebargaining with each union. In the public sector, on the other hand, the negative effect ofseparate bargaining with each union was very weak. The only public sector bargainingarrangement effect to survive the introduction of workplace controls was the positive perceptionof climate where there are no unions recognised.
Employee perceptions of the employee relations climate
45
Box 5.2: Effect of bargaining on employee perceptions of the employee relations climate –findings for the whole sample
● Bargaining arrangements: – Climate poorest where separate bargaining with each union– Without controls, climate poorer in multi-union workplaces with joint bargaining than single
union or no recognition workplaces. However, these effects become non-significant on entering controls
– Excluding workplace tenure and union membership reveals more positive climate in non-union workplaces and deterioration with multi-unionism
● Bargaining levels not significant, except better climate in <1% cases with multi-level bargaining
● Bargaining coverage results difficult to interpret
● Union effectiveness improves climate
● Management support for unions fosters better climate
● Climate poorer in presence of on-site representative
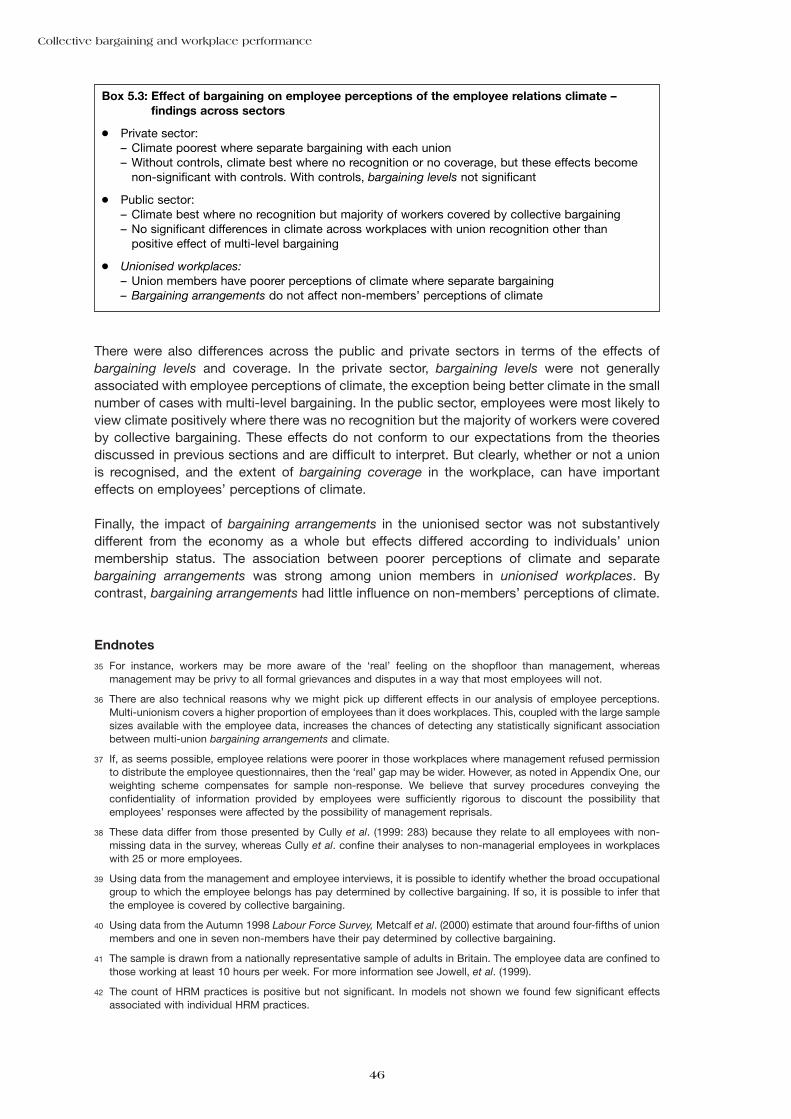
There were also differences across the public and private sectors in terms of the effects ofbargaining levels and coverage. In the private sector, bargaining levels were not generallyassociated with employee perceptions of climate, the exception being better climate in the smallnumber of cases with multi-level bargaining. In the public sector, employees were most likely toview climate positively where there was no recognition but the majority of workers were coveredby collective bargaining. These effects do not conform to our expectations from the theoriesdiscussed in previous sections and are difficult to interpret. But clearly, whether or not a unionis recognised, and the extent of bargaining coverage in the workplace, can have importanteffects on employees’ perceptions of climate.
Finally, the impact of bargaining arrangements in the unionised sector was not substantivelydifferent from the economy as a whole but effects differed according to individuals’ unionmembership status. The association between poorer perceptions of climate and separatebargaining arrangements was strong among union members in unionised workplaces. Bycontrast, bargaining arrangements had little influence on non-members’ perceptions of climate.
Endnotes
35 For instance, workers may be more aware of the ‘real’ feeling on the shopfloor than management, whereasmanagement may be privy to all formal grievances and disputes in a way that most employees will not.
36 There are also technical reasons why we might pick up different effects in our analysis of employee perceptions.Multi-unionism covers a higher proportion of employees than it does workplaces. This, coupled with the large samplesizes available with the employee data, increases the chances of detecting any statistically significant associationbetween multi-union bargaining arrangements and climate.
37 If, as seems possible, employee relations were poorer in those workplaces where management refused permissionto distribute the employee questionnaires, then the ‘real’ gap may be wider. However, as noted in Appendix One, ourweighting scheme compensates for sample non-response. We believe that survey procedures conveying theconfidentiality of information provided by employees were sufficiently rigorous to discount the possibility thatemployees’ responses were affected by the possibility of management reprisals.
38 These data differ from those presented by Cully et al. (1999: 283) because they relate to all employees with non-missing data in the survey, whereas Cully et al. confine their analyses to non-managerial employees in workplaceswith 25 or more employees.
39 Using data from the management and employee interviews, it is possible to identify whether the broad occupationalgroup to which the employee belongs has pay determined by collective bargaining. If so, it is possible to infer thatthe employee is covered by collective bargaining.
40 Using data from the Autumn 1998 Labour Force Survey, Metcalf et al. (2000) estimate that around four-fifths of unionmembers and one in seven non-members have their pay determined by collective bargaining.
41 The sample is drawn from a nationally representative sample of adults in Britain. The employee data are confined tothose working at least 10 hours per week. For more information see Jowell, et al. (1999).
42 The count of HRM practices is positive but not significant. In models not shown we found few significant effectsassociated with individual HRM practices.
Collective bargaining and workplace performance
46
Box 5.3: Effect of bargaining on employee perceptions of the employee relations climate –findings across sectors
● Private sector:– Climate poorest where separate bargaining with each union– Without controls, climate best where no recognition or no coverage, but these effects become
non-significant with controls. With controls, bargaining levels not significant
● Public sector:– Climate best where no recognition but majority of workers covered by collective bargaining – No significant differences in climate across workplaces with union recognition other than
positive effect of multi-level bargaining
● Unionised workplaces:– Union members have poorer perceptions of climate where separate bargaining– Bargaining arrangements do not affect non-members’ perceptions of climate
43 Similar patterns emerge if one replaces the bargaining arrangement variable with an indicator of union recognition.In the fully specified model equivalent to model 5 in Table 5.4, the union recognition effect is negative and significantat a 90 per cent confidence level ( t-statistic = 1.87). When tenure and union membership are removed, the effect issignificant at a 99 per cent confidence level (t-statistic = 3.88).
44 The differences are significant at a 90 per cent level of confidence. The t-statistics are 1.77 and 1.71 respectively.
45 Another significant union effect emerged when bargaining arrangements and bargaining coverage were removedfrom the model. When this was done, employee perceptions of climate were poorer where union density was at least75 per cent compared to workplaces with no union members.
46 The full models are presented in Appendix Tables A5.3 and A5.4 respectively.
47 The full models for the union sector are appended as Table A5.5. The full models for members and non-members inunionised workplaces are appended as Tables A5.6 and A5.7 respectively.
48 Whole economy models not presented indicate that individuals’ union membership status is more important thanworkplace-level union recognition in explaining employee perceptions of climate. Union members have significantlypoorer perceptions of climate than non-members, whether recognised unions are present or not.
49 In the penultimate model (model 4 in the bottom panel of Table 5.7) containing demographic and job controls,perceptions of climate are poorer under separate bargaining with each union than they are under joint bargaining, butthe effect is only on the margins of significance once workplace controls are entered (model 5).
50 Whole economy models not shown indicate that union membership effects dominated the effect of union recognitionsince union members had significantly poorer perceptions of climate, whether they worked in workplaces withrecognised unions or not.
51 T-statistic = 2.19.
Employee perceptions of the employee relations climate
47
CHAPTER 6
Workplace financial performance
As in previous WIRS surveys, managerial respondents to WERS98 were asked to assess thefinancial performance of their workplace relative to other workplaces in the same industry.Chapter Two reviews the literature estimating union effects on this performance measure. Herewe explain why this literature is a useful starting point for our analysis.
First, it is clear that unions’ impact on workplace performance diminished with their strength inthe second half of the 1980s (Machin and Stewart, 1990, 1996). If, as some have suggested(Millward et al., 2000), union strength has declined in the 1990s, we might expect a furtherdiminution in union effects.
Secondly, unions’ impact became contingent on the market power of the workplace in whichthey operated (Machin and Stewart, 1990, 1996). In 1984, workplaces with manual unionsperformed more poorly than others irrespective of the workplace’s market share, but by 1990the negative union effect was confined to workplaces with a closed shop or managementendorsement of the union and high market share.
Thirdly, there is evidence from the 1990 WIRS that union effects differ in combination withdifferent types of financial participation and employment practices (McNabb and Whitfield,1997, 1998). However, a recent attempt to replicate the results of McNabb and Whitfield (1998)using WERS98 found union effects were not significant, either with or without alternativemeasures of financial participation (Addison and Belfield, 2000).52 This raises the prospect thatunion effects detected in 1990 may no longer be apparent.
In this chapter, we draw on this literature to inform our analysis. Our analysis departs fromprevious research in two ways. First, our focus is the effect of collective bargaining. Secondly,in 1998 for the first time the financial performance question was asked of all respondents, so wecan present some analysis for the whole economy. However, in line with the existing literature,the main focus of our analysis remains on the private trading sector.
We start by considering our measure of financial performance. Then we explore the distributionof the responses on workplace financial performance and our measures of collective bargaining.Next we consider the control variables used in the analysis. Finally we present results of ourmultivariate analyses. This includes an exploration of union recognition effects in conjunctionwith market share, union strength and employee involvement measures previously addressed inthe literature.
6.1 The measure of financial performance
WERS98 puts the following question to managerial respondents:
‘I now want to ask you how your workplace is currently performing compared with otherestablishments in the same industry. How would you assess your workplace’s financialperformance?’
Responses are coded along a five-point ordinal scale, from ‘a lot better than average’ to ‘a lotbelow average’.
48

Workplace financial performance
49
The question is similar to others that have featured in the WIRS series. The measure hasundergone substantial reliability testing (Machin and Stewart 1990, 1996, Cully et al., 1999: 120-121). Recent research (Bryson, 2000b) finds financial performance in 1990 is a strong predictorof closure in 1998. Further testing of the financial performance variable in WERS98 (Cully, 1999:122-124) confirms that the measure is a sound basis for estimating union effects onperformance.
Table 6.1 shows the distribution of responses to the workplace financial performance questionfor the whole economy, together with those for the trading sector and the private trading sector.The distribution of responses is skewed, with respondents having a tendency to view theirworkplace performance as better than average. Very few respondents say performance is belowaverage, and only 1 per cent of respondents report workplace performance ‘a lot belowaverage’. This is not a problem for analysis, provided this tendency is not systematically relatedto characteristics of the workplace which may bias our estimates of union effects. Cully et al.(1999: 122-124) do not find any systematic bias in this and other similar measures, concludingthat the measures ‘seem more than suitable for the study of economic performance’.
The WIRS financial performance measure was originally designed so that it would be applicableacross establishments throughout the trading sector. Accounting measures of financialperformance (accounting profits, price-cost margins, stock market valuations, and so on) do nothave this property. For example, retailers frequently use sales per employee as a measure offinancial performance, an indicator of no value in measuring the performance of a manufacturingplant that delivers all its output to another unit of the same enterprise. The qualitative measurein WERS98 and previous WIRS overcomes this problem.
Since the question is asked of all workplaces, whole economy analyses are feasible. However,among non-trading workplaces, and workplaces that perform administrative or supportfunctions, concepts of profit and loss and ‘financial performance’ may be less meaningful. Thisis illustrated in Table 6.1 which shows that the percentage of workplaces unable to make ajudgement on financial performance falls when we narrow our focus to the trading sector, andfalls still further in the private trading sector.
Table 6.1: Workplace financial performance by sector
All Trading Private tradingworkplaces sector† sector
Column percentages
A lot better than average 13 13 15Better than average 35 38 39About average 31 31 31Below average 6 6 6A lot below average 1 * *No comparison possible 9 7 6Relevant data not available 5 4 2Don’t know or not answered 1 2 1
Weighted base 2,191 1,683 1,390Unweighted base 2,191 1,620 1,265
† The trading sector covers workplaces that produce goods or services for consumers or supply goods or services toother companies

Collective bargaining and workplace performance
50
Tab
le 6
.2: W
ork
pla
ce f
inan
cial
per
form
ance
by
per
form
ance
mea
sure
A lo
t be
tter
Bet
ter
than
Abo
utB
elow
A lo
t be
low
Wei
ghte
dU
nwei
ghte
d th
an a
vera
geav
erag
eav
erag
eav
erag
eav
erag
eav
erag
eba
se
row
per
cent
ages
All
wor
kpla
ces:
1541
367
11,
871
1,85
6
Fina
ncia
l Per
form
ance
Mea
sure
:
Pro
fit o
r va
lue
add
ed17
4135
61
954
952
Sal
es/F
ees/
Bud
get
847
386
*40
937
4C
osts
or
exp
end
iture
1539
388
*36
738
9S
tock
mar
ket
ind
icat
ors
2058
148
028
54O
ther
1920
4910
243
31D
on’t
know
7
5926
90
3125
Not
ans
wer
ed27
1935
316
4031

Non-response remains a significant problem. For the whole economy, 15 per cent of managerswere unable to provide an indication of financial performance, and even in the private tradingsector 9 per cent of managers were unable to do so. Given the potential for bias through non-response, we assessed whether response rates to the workplace financial performancequestion differed by our collective bargaining measures. We found that workplaces with multipleunions and either joint bargaining or separate bargaining with groups of unions were a little lesslikely to respond on workplace financial performance (with non-response rates of 17 and 20 percent respectively). Workplaces with mainly organisation-level or multiple-level collectivebargaining also had slightly higher levels of non-response (17 and 21 per cent respectively).
Even within the trading sector some managers are better placed to estimate the relative financialperformance of their workplace than others. Some establishments are cost centres, for whichrevenue cannot be disaggregated. Others are profit centres which hold information on costs andrevenues, while others are full-blown enterprises which hold information on profits, revenuesand capital employed. Only the last category corresponds to ‘firms’, for which indicators suchas returns on investment may be appropriate. To help with a ‘like with like’ comparison WERS98asks managers: ‘Which of these measures corresponds most closely to your interpretation offinancial performance?’ The options include: ‘Profit or value added’, ‘Sales/Fees/Budget’,‘Costs or expenditure’ and ‘Stock market indicators’.
More than half the managers referred to profit or value added (Table 6.2). A further 20 per centreferred to sales, fees or budgets, and another 20 per cent to costs or expenditure. Less than 5per cent of respondents used other measures and 5 per cent did not know or did not answer,despite answering the financial performance question. Since much of the theoretical literature isconcerned with union effects on profit, we test the sensitivity of our analyses to the type offinancial performance measure used by narrowing the focus of some analyses to thoseworkplaces where we have a measure of profits or value added.
Table 6.2 also shows that there was little to choose between perceptions of performance acrossthe three most often cited measures. Those referring to sales, fees or budgets were less likelyto report performance ‘a lot better than average’, but more likely to report ‘better than average’performance. However, those who judged financial performance according to stock marketcriteria were more inclined than others to view their workplace performance as better or a lotbetter than average, whereas those using ‘Other’ specific measures were less likely to reportperformance above average.
6.2 Associations between workplace financial performance andcollective bargaining
There was little difference in perceptions of financial performance between workplaces with andwithout union recognition (Table 6.3, rows two and three). However, there were some differencesin perceived performance across different types of bargaining arrangement. Among multipleunion workplaces, financial performance was viewed most positively where there was separatebargaining with each union, and was poorest in the small number of establishments where therewas separate negotiation with union groups and where the type of bargaining was unknown.There is no evidence of poorer performance arising from multiple unionism per se, althoughpatterns clearly differed with the number of recognised unions.
Workplace financial performance
51

Collective bargaining and workplace performance
52
Tab
le 6
.3: C
olle
ctiv
e b
arg
ain
ing
arr
ang
emen
tsan
d w
ork
pla
ce f
inan
cial
per
form
ance
A lo
t be
tter
Bet
ter
than
Abo
utB
elow
A lo
t be
low
Wei
ghte
dU
nwei
ghte
d th
an a
vera
geav
erag
eav
erag
eav
erag
eav
erag
eba
seba
se
row
per
cent
ages
All
wor
kpla
ces:
1541
367
11,
871
1,85
6
Rec
ogni
tion
stat
us:
No
unio
n re
cogn
ised
1541
367
11,
214
861
Uni
on r
ecog
nise
d14
4238
51
657
995
Col
lect
ive
bar
gain
ing
arra
ngem
ents
in r
ecog
nise
d s
ecto
r:
Sin
gle
unio
n12
4736
4*
428
406
Mul
tiple
uni
ons,
join
t b
arga
inin
g17
2943
83
125
349
Mul
tiple
uni
ons,
sep
arat
e b
arga
inin
g w
ith e
ach
unio
n19
3836
51
8717
6M
ultip
le u
nion
s, s
epar
ate
bar
gain
ing
with
uni
on g
roup
s4
3849
90
849
Mul
tiple
uni
ons,
join
t/se
par
ate
bar
gain
ing
unkn
own
108
6813
09
15
Num
ber
of
mul
tiple
uni
ons:
Two
1333
4310
114
926
2Th
ree
3125
351
849
132
Four
or
mor
e13
3845
4*
3219
5
Col
lect
ive
bar
gain
ing
leve
ls in
rec
ogni
sed
sec
tor:
No
reco
gniti
on:
No
cove
rage
1739
378
*1,
082
762
Min
ority
cov
erag
e8
674
021
3129
Maj
ority
cov
erag
e4
5043
30
7445
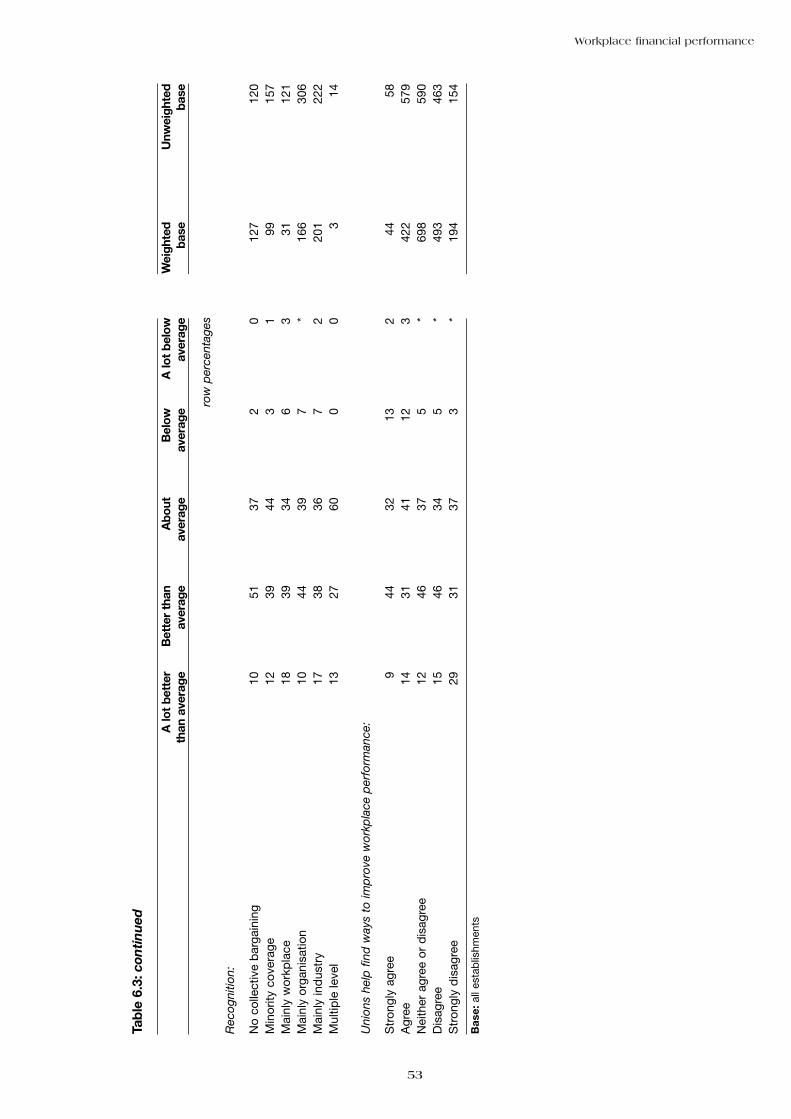
Workplace financial performance
53
Tab
le 6
.3:c
onti
nu
ed
A lo
t be
tter
Bet
ter
than
Abo
utB
elow
A lo
t be
low
Wei
ghte
dU
nwei
ghte
d th
an a
vera
geav
erag
eav
erag
eav
erag
eav
erag
eba
seba
se
row
per
cent
ages
Rec
ogni
tion:
No
colle
ctiv
e b
arga
inin
g10
5137
20
127
120
Min
ority
cov
erag
e12
3944
31
9915
7M
ainl
y w
orkp
lace
1839
346
331
121
Mai
nly
orga
nisa
tion
1044
397
*16
630
6M
ainl
y in
dus
try
1738
367
220
122
2M
ultip
le le
vel
1327
600
03
14
Uni
ons
help
fin
d w
ays
to im
pro
ve w
orkp
lace
per
form
ance
:
Str
ongl
y ag
ree
944
3213
244
58A
gree
1431
4112
342
257
9N
eith
er a
gree
or
dis
agre
e12
4637
5*
698
590
Dis
agre
e15
4634
5*
493
463
Str
ongl
y d
isag
ree
2931
373
*19
415
4
Bas
e: a
ll es
tab
lishm
ents

Turning to bargaining levels, among workplaces with no union recognition, those with noworkers covered by collective bargaining were most likely to have performance ‘a lot better thanaverage’. Those with a minority of workers covered were most likely to report poorer thanaverage performance and better than average performance.
Among workplaces with recognised unions, there was no clear pattern in the reporting ofperformance across our bargaining level categories. Where there was majority coverage, therewas little difference between mainly workplace-, organisation- and industry-level bargaining.
Managers were also asked to state their level of agreement with whether ‘unions help find waysto improve workplace performance’. There was some evidence that where there wasdisagreement with this view the reporting of performance was better.
6.3 Control variables
Many of the workplace control variables used in the modelling of financial performance aresimilar to those used for climate (Box 6.1). Appendix Table A6.1 defines the variables used here,and shows their incidence in the whole economy for the sample of workplaces where we haveinformation available for workplace financial performance. Appendix Five discusses therationale for inclusion of controls in our models.
6.4 Multivariate models of workplace financial performance
We now turn to multivariate analysis of workplace financial performance. Our workplace financialperformance measure is an ordinal variable, ranging from ‘a lot below average’ to ‘a lot betterthan average’. We therefore use the ordered probit estimation techniques discussed in AppendixTwo. Significant positive coefficients indicate variables associated with better financial performance.The models are presented in a similar way to the climate analyses, with tables showingcoefficients from the estimation models and t-statistics denoting significance levels. The analysesalso take account of the complex survey design in WERS98, as explained in Appendix Two.
Collective bargaining and workplace performance
54
Box 6.1: Control variables used in analyses of managerial perceptions of the workplace’sfinancial performance
● Respondent’s job title
● Workforce composition– number of employees, employment growth, % female, % part-time
● Workplace characteristics– sector, industry, location– management practices: HRM, one-way and two-way communication, financial participation
● Market factors– market share– value of sales– growing market– low competition– product diversity
● Other union measures– strength– management attitudes to unions– voice
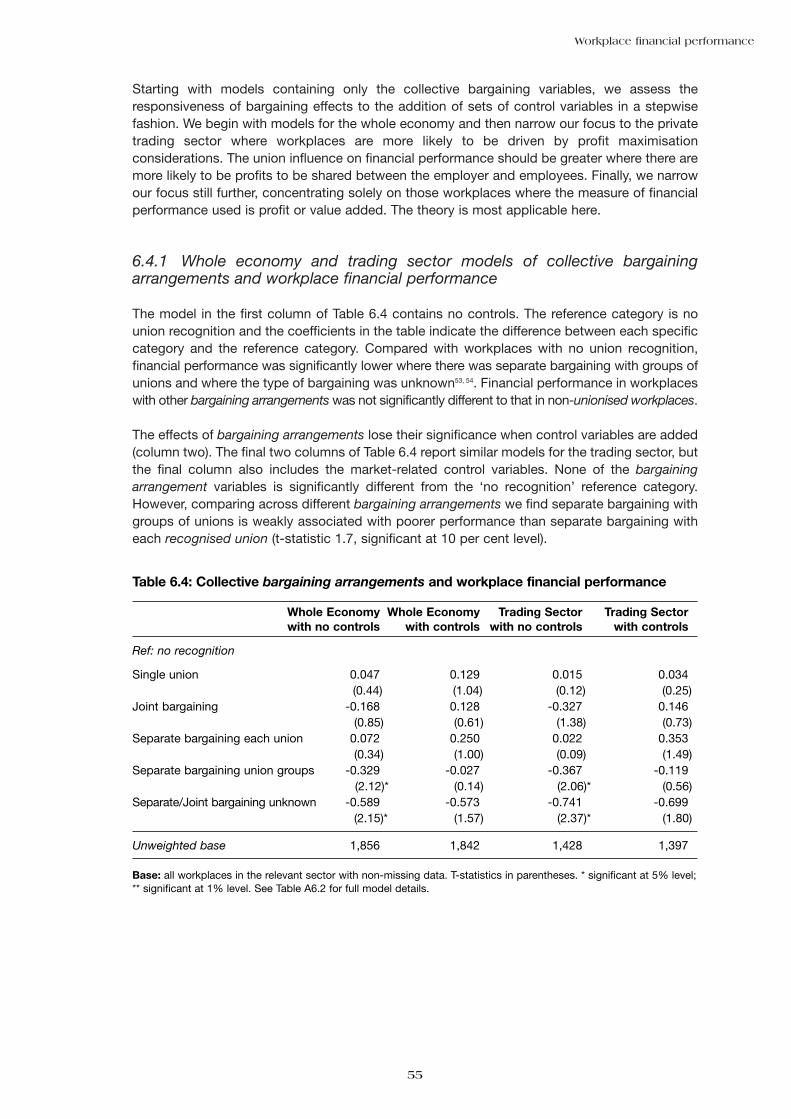
Starting with models containing only the collective bargaining variables, we assess theresponsiveness of bargaining effects to the addition of sets of control variables in a stepwisefashion. We begin with models for the whole economy and then narrow our focus to the privatetrading sector where workplaces are more likely to be driven by profit maximisationconsiderations. The union influence on financial performance should be greater where there aremore likely to be profits to be shared between the employer and employees. Finally, we narrowour focus still further, concentrating solely on those workplaces where the measure of financialperformance used is profit or value added. The theory is most applicable here.
6.4.1 Whole economy and trading sector models of collective bargainingarrangements and workplace financial performance
The model in the first column of Table 6.4 contains no controls. The reference category is nounion recognition and the coefficients in the table indicate the difference between each specificcategory and the reference category. Compared with workplaces with no union recognition,financial performance was significantly lower where there was separate bargaining with groups ofunions and where the type of bargaining was unknown53, 54. Financial performance in workplaceswith other bargaining arrangements was not significantly different to that in non-unionised workplaces.
The effects of bargaining arrangements lose their significance when control variables are added(column two). The final two columns of Table 6.4 report similar models for the trading sector, butthe final column also includes the market-related control variables. None of the bargainingarrangement variables is significantly different from the ‘no recognition’ reference category.However, comparing across different bargaining arrangements we find separate bargaining withgroups of unions is weakly associated with poorer performance than separate bargaining witheach recognised union (t-statistic 1.7, significant at 10 per cent level).
Workplace financial performance
55
Table 6.4: Collective bargaining arrangements and workplace financial performance
Whole Economy Whole Economy Trading Sector Trading Sectorwith no controls with controls with no controls with controls
Ref: no recognition
Single union 0.047 0.129 0.015 0.034(0.44) (1.04) (0.12) (0.25)
Joint bargaining -0.168 0.128 -0.327 0.146(0.85) (0.61) (1.38) (0.73)
Separate bargaining each union 0.072 0.250 0.022 0.353(0.34) (1.00) (0.09) (1.49)
Separate bargaining union groups -0.329 -0.027 -0.367 -0.119(2.12)* (0.14) (2.06)* (0.56)
Separate/Joint bargaining unknown -0.589 -0.573 -0.741 -0.699(2.15)* (1.57) (2.37)* (1.80)
Unweighted base 1,856 1,842 1,428 1,397
Base: all workplaces in the relevant sector with non-missing data. T-statistics in parentheses. * significant at 5% level;** significant at 1% level. See Table A6.2 for full model details.
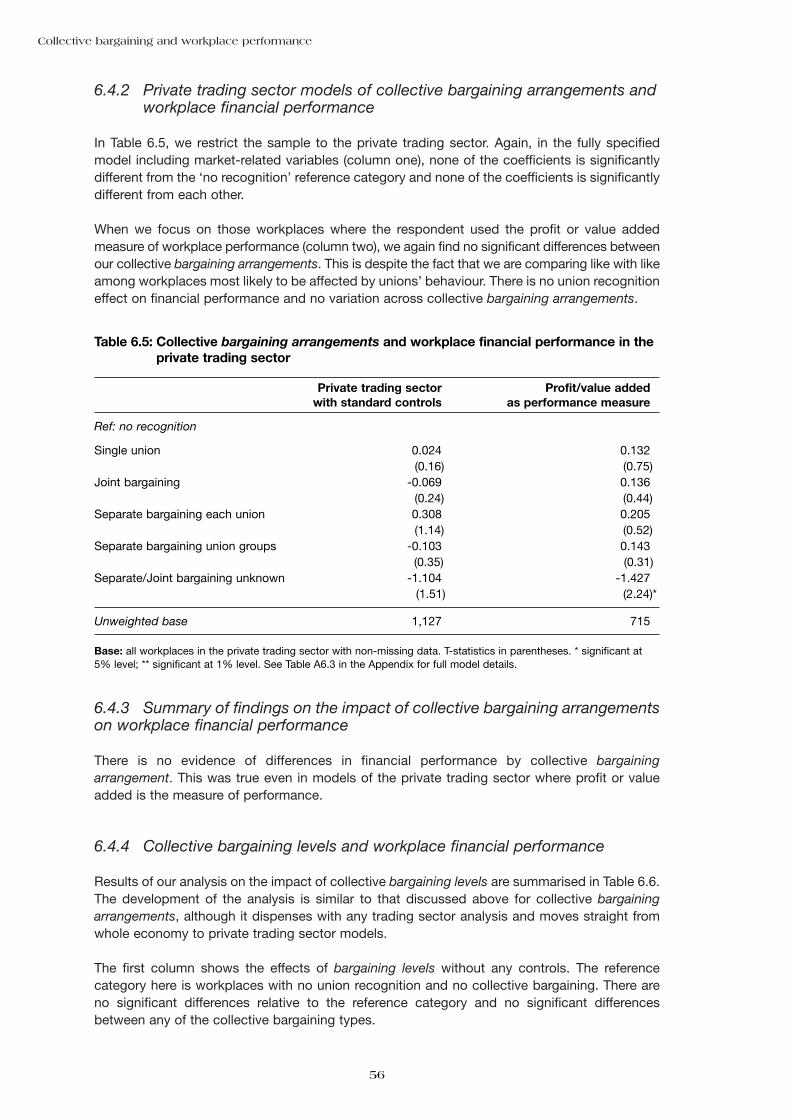
6.4.2 Private trading sector models of collective bargaining arrangements andworkplace financial performance
In Table 6.5, we restrict the sample to the private trading sector. Again, in the fully specifiedmodel including market-related variables (column one), none of the coefficients is significantlydifferent from the ‘no recognition’ reference category and none of the coefficients is significantlydifferent from each other.
When we focus on those workplaces where the respondent used the profit or value addedmeasure of workplace performance (column two), we again find no significant differences betweenour collective bargaining arrangements. This is despite the fact that we are comparing like with likeamong workplaces most likely to be affected by unions’ behaviour. There is no union recognitioneffect on financial performance and no variation across collective bargaining arrangements.
6.4.3 Summary of findings on the impact of collective bargaining arrangementson workplace financial performance
There is no evidence of differences in financial performance by collective bargainingarrangement. This was true even in models of the private trading sector where profit or valueadded is the measure of performance.
6.4.4 Collective bargaining levels and workplace financial performance
Results of our analysis on the impact of collective bargaining levels are summarised in Table 6.6.The development of the analysis is similar to that discussed above for collective bargainingarrangements, although it dispenses with any trading sector analysis and moves straight fromwhole economy to private trading sector models.
The first column shows the effects of bargaining levels without any controls. The referencecategory here is workplaces with no union recognition and no collective bargaining. There areno significant differences relative to the reference category and no significant differencesbetween any of the collective bargaining types.
Collective bargaining and workplace performance
56
Table 6.5: Collective bargaining arrangements and workplace financial performance in theprivate trading sector
Private trading sector Profit/value addedwith standard controls as performance measure
Ref: no recognition
Single union 0.024 0.132(0.16) (0.75)
Joint bargaining -0.069 0.136(0.24) (0.44)
Separate bargaining each union 0.308 0.205(1.14) (0.52)
Separate bargaining union groups -0.103 0.143(0.35) (0.31)
Separate/Joint bargaining unknown -1.104 -1.427(1.51) (2.24)*
Unweighted base 1,127 715
Base: all workplaces in the private trading sector with non-missing data. T-statistics in parentheses. * significant at5% level; ** significant at 1% level. See Table A6.3 in the Appendix for full model details.
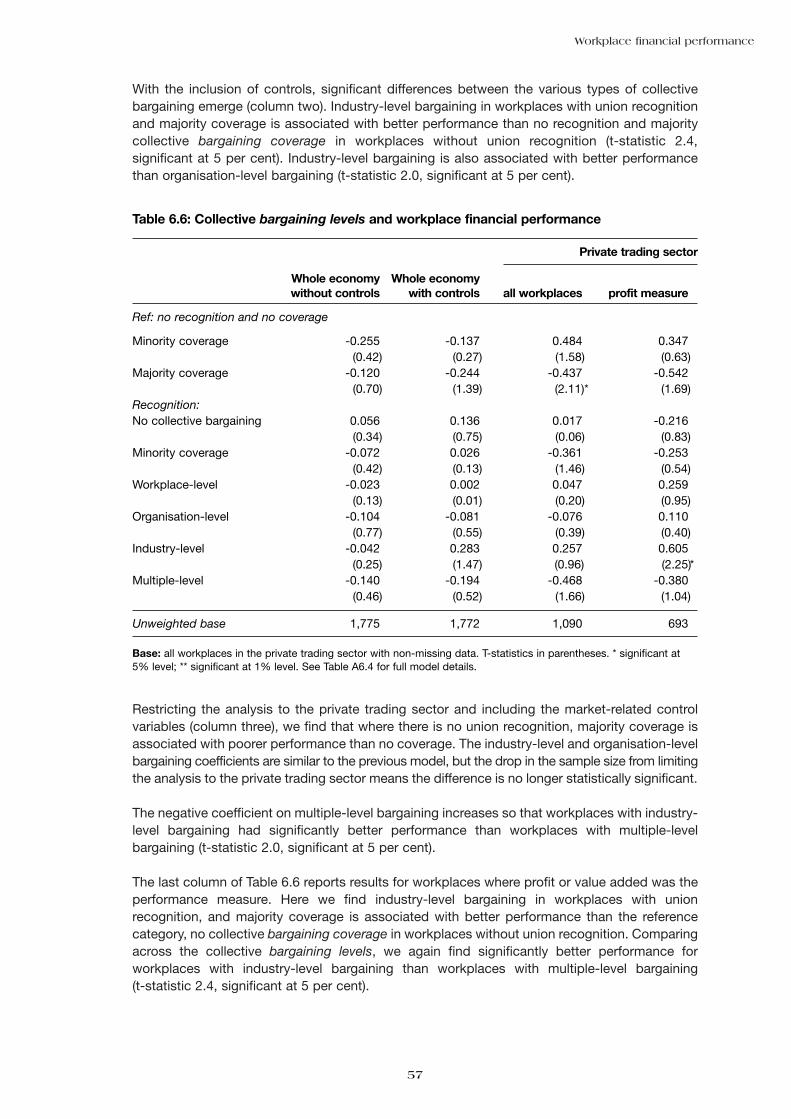
With the inclusion of controls, significant differences between the various types of collectivebargaining emerge (column two). Industry-level bargaining in workplaces with union recognitionand majority coverage is associated with better performance than no recognition and majoritycollective bargaining coverage in workplaces without union recognition (t-statistic 2.4,significant at 5 per cent). Industry-level bargaining is also associated with better performancethan organisation-level bargaining (t-statistic 2.0, significant at 5 per cent).
Restricting the analysis to the private trading sector and including the market-related controlvariables (column three), we find that where there is no union recognition, majority coverage isassociated with poorer performance than no coverage. The industry-level and organisation-levelbargaining coefficients are similar to the previous model, but the drop in the sample size from limitingthe analysis to the private trading sector means the difference is no longer statistically significant.
The negative coefficient on multiple-level bargaining increases so that workplaces with industry-level bargaining had significantly better performance than workplaces with multiple-levelbargaining (t-statistic 2.0, significant at 5 per cent).
The last column of Table 6.6 reports results for workplaces where profit or value added was theperformance measure. Here we find industry-level bargaining in workplaces with unionrecognition, and majority coverage is associated with better performance than the referencecategory, no collective bargaining coverage in workplaces without union recognition. Comparingacross the collective bargaining levels, we again find significantly better performance forworkplaces with industry-level bargaining than workplaces with multiple-level bargaining(t-statistic 2.4, significant at 5 per cent).
Workplace financial performance
57
Table 6.6: Collective bargaining levels and workplace financial performance
Private trading sector
Whole economy Whole economywithout controls with controls all workplaces profit measure
Ref: no recognition and no coverage
Minority coverage -0.255 -0.137 0.484 0.347(0.42) (0.27) (1.58) (0.63)
Majority coverage -0.120 -0.244 -0.437 -0.542(0.70) (1.39) (2.11)* (1.69)
Recognition:No collective bargaining 0.056 0.136 0.017 -0.216
(0.34) (0.75) (0.06) (0.83)Minority coverage -0.072 0.026 -0.361 -0.253
(0.42) (0.13) (1.46) (0.54)Workplace-level -0.023 0.002 0.047 0.259
(0.13) (0.01) (0.20) (0.95)Organisation-level -0.104 -0.081 -0.076 0.110
(0.77) (0.55) (0.39) (0.40)Industry-level -0.042 0.283 0.257 0.605
(0.25) (1.47) (0.96) (2.25)*Multiple-level -0.140 -0.194 -0.468 -0.380
(0.46) (0.52) (1.66) (1.04)
Unweighted base 1,775 1,772 1,090 693
Base: all workplaces in the private trading sector with non-missing data. T-statistics in parentheses. * significant at5% level; ** significant at 1% level. See Table A6.4 for full model details.
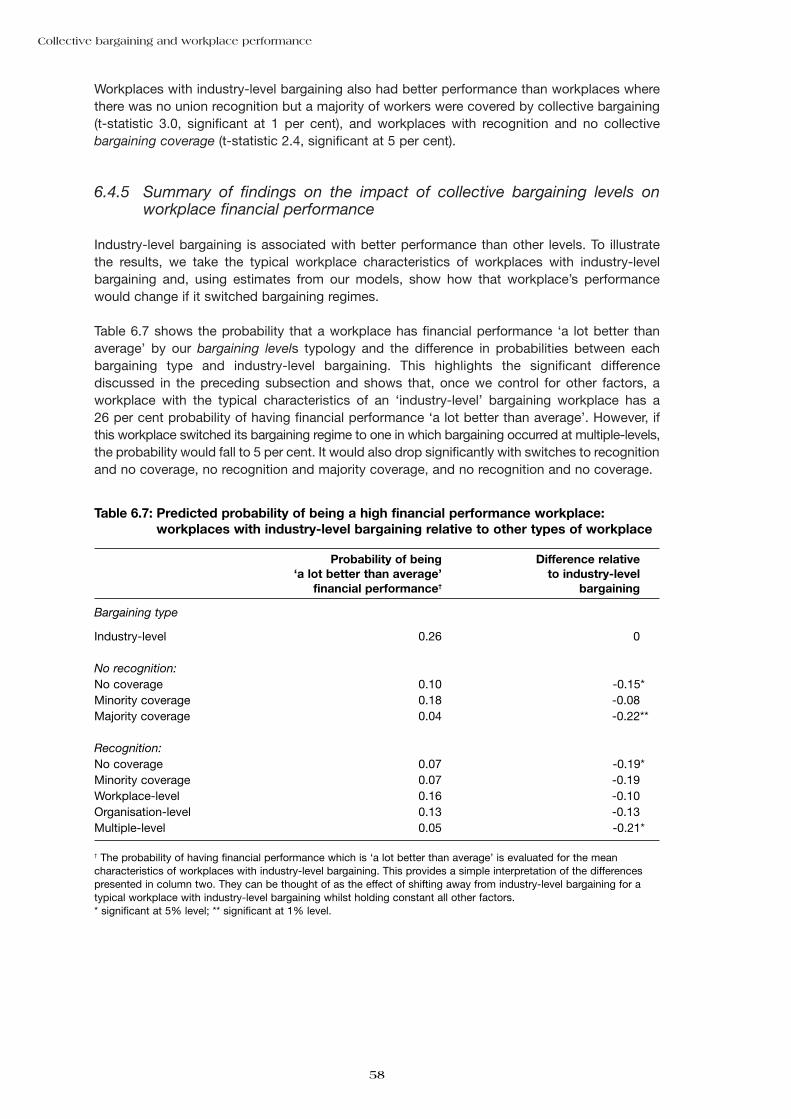
Workplaces with industry-level bargaining also had better performance than workplaces wherethere was no union recognition but a majority of workers were covered by collective bargaining(t-statistic 3.0, significant at 1 per cent), and workplaces with recognition and no collectivebargaining coverage (t-statistic 2.4, significant at 5 per cent).
6.4.5 Summary of findings on the impact of collective bargaining levels onworkplace financial performance
Industry-level bargaining is associated with better performance than other levels. To illustratethe results, we take the typical workplace characteristics of workplaces with industry-levelbargaining and, using estimates from our models, show how that workplace’s performancewould change if it switched bargaining regimes.
Table 6.7 shows the probability that a workplace has financial performance ‘a lot better thanaverage’ by our bargaining levels typology and the difference in probabilities between eachbargaining type and industry-level bargaining. This highlights the significant differencediscussed in the preceding subsection and shows that, once we control for other factors, aworkplace with the typical characteristics of an ‘industry-level’ bargaining workplace has a26 per cent probability of having financial performance ‘a lot better than average’. However, ifthis workplace switched its bargaining regime to one in which bargaining occurred at multiple-levels,the probability would fall to 5 per cent. It would also drop significantly with switches to recognitionand no coverage, no recognition and majority coverage, and no recognition and no coverage.
Collective bargaining and workplace performance
58
Table 6.7: Predicted probability of being a high financial performance workplace:workplaces with industry-level bargaining relative to other types of workplace
Probability of being Difference relative‘a lot better than average’ to industry-level
financial performance† bargaining
Bargaining type
Industry-level 0.26 0
No recognition:No coverage 0.10 -0.15*Minority coverage 0.18 -0.08Majority coverage 0.04 -0.22**
Recognition:No coverage 0.07 -0.19*Minority coverage 0.07 -0.19Workplace-level 0.16 -0.10Organisation-level 0.13 -0.13Multiple-level 0.05 -0.21*
† The probability of having financial performance which is ‘a lot better than average’ is evaluated for the meancharacteristics of workplaces with industry-level bargaining. This provides a simple interpretation of the differencespresented in column two. They can be thought of as the effect of shifting away from industry-level bargaining for atypical workplace with industry-level bargaining whilst holding constant all other factors. * significant at 5% level; ** significant at 1% level.
The extent of industry-level bargaining has fallen substantially since 1984 and it has previouslybeen associated with negative performance between 1984 and 1990 (Menezes-Filho, 1997). Itis not possible to discern the direction of causality between industry-level bargaining andworkplace financial performance from our analyses. It may be that industry-level bargaining hascontributed to better performance. However, it is equally plausible that, with the fall in industry-level bargaining in the 1990s, it is only high-performance workplaces that have maintainedindustry-level bargaining because they were not perceived to have damaged performance.There is some support for this notion in WERS98, since managers in workplaces with industry-level bargaining had the most favourable attitude towards union membership and were morelikely to recommend union membership.
6.4.6 Union recognition, the market and workplace financial performance
Replacing our collective bargaining variables with a simple indicator of union recognition inmodels presented above indicates no association between union recognition per se andworkplace financial performance. This suggests a continuation in the declining influence ofunions’ impact on financial performance which began in the mid-1980s. Significant union effectswere only found in 1990 under specific circumstances associated with strong unions,workplaces with some market power, and certain types of financial participation andemployment practices (Machin and Stewart, 1990, 1996; Booth and McCulloch, 1999; Bryson,1999b). Using WERS98, Addison and Belfield (2000) found no recognition effects and nointeraction effects associated with financial participation. Here, we look again at these issues todiscern whether any recognition effect can be found under any of these circumstances. Theanalysis presented here is not the main focus of this report and should be thought of asexploratory in nature.
We focus on our favoured models for the private trading sector where profit or value added isthe measure of performance. First we consider union impacts associated with marketconditions. We look at three measures of market power: whether the UK market share of salesis greater than 50 per cent; whether managers’ assessment of the degree of market competition waslow or very low (compared to ‘very high’, ‘high’ and ‘neither high nor low’); and whether the marketfor the main product or service was growing (as opposed to ‘mature’, ‘declining’ or ‘turbulent’.
The first column of Table 6.8 reports our base model showing the three market variables and avariable indicating whether there was recognition. Here we find no effect on financialperformance from recognition, but some strong competition effects. The next three columns inturn split the recognition effect into: unionised workplaces with high and low market share;unionised workplaces with low and ‘not low’ competition; and unionised workplaces in growingand ‘not growing’ markets. Each union recognition effect is evaluated against its own non-unioncounterpart. In column two, workplaces are split according to whether they have unionrecognition and their market share. The reference category for the three variables shown is ‘nounion recognition, market share less than 50%’. Union effects are not significant, regardless ofmarket share. In column three, workplaces are split according to union status and the degree ofmarket competition faced. Again, union effects are not significant, though among non-unionworkplaces, those facing lower competition appear to perform more poorly.
There is, however, a positive impact of union recognition on workplace financial performance(significant at 10 per cent) where the market is ‘not growing’ relative to like non-unionworkplaces where the market is not growing (column four).55 Further investigation of this effectfinds no effect where the market is described as ‘mature’, and significant positive union benefitswhen the market is ‘declining’ (t-statistic 2.4, significant at 5 per cent) or ‘turbulent’ (t-statistic2.9, significant at 1 per cent).
Workplace financial performance
59

There is no evidence of a negative union impact on workplace financial performance where theworkplace has some form of market power. Evidence from WIRS90 (Machin and Stewart, 1996)only found a significant effect when there were strong unions and when there was high marketshare. The strong union measure they used was either a closed shop or managementendorsement of unions. Given the decline of the closed shop in the 1990s we use a differentmeasure of union strength. We split unions into strong, medium and weak categories based onunion density and collective bargaining coverage56. We find the positive union effect in turbulentor declining markets is associated with medium-strength unions only, but where the market isgrowing there are no union effects irrespective of union strength.
This is a new and interesting finding, indicating that strong unions are no longer associated withpoorer performance, even where the workplace has high market share or operates in a growingmarket. Instead we find a positive effect of mid-strength unions where the workplace is operatingin difficult market conditions. These effects may arise through unions’ ability to operate as aneffective ‘agent’ for the employer to procure maximum effort on the part of workers, or easingthe introduction of rapid alterations to work practices demanded by difficult market conditions.It may also come through unions’ ability to improve information flows between management andworkers, which may facilitate good management or maintain worker motivation.
Finally, we turn to financial participation and work practices. We find little evidence of any impactof financial participation or human resource management (HRM) practices on workplace financialperformance in our preferred model for the private trading sector. The number of HRM practiceshad a positive significant impact in the models for the private trading sector. However, when werestrict the sample to include just those workplaces with profit or value added as the performancemeasure, all the financial participation, joint consultative committee and HRM variables were no
Collective bargaining and workplace performance
60
Table 6.8: Union recognition, market power and workplace financial performance in theprivate trading sector
Recognition Recognition by Recognition by Recognition bymarket share degree of growing market
competition
Union recognition 0.123(0.78)
Market share >50 per cent 0.359 0.361 0.358 0.352(1.64) (1.33) (1.64) (1.59)
Union and market share <=50 per cent 0.052(0.29)
Union and market share >50 per cent 0.095(0.26)
Low competition -1.047 -1.036 -0.900 -1.130(3.28)** (3.30)** (2.47)* (3.46)**
Union and not low competition 0.154(0.95)
Union and low competition -0.695(0.98)
Growing market 0.475 0.483 0.462 0.616(3.01)** (3.09)** (2.93)** (3.30)**
Union and not growing market 0.389(1.87)
Union and growing market -0.138(0.67)
Observations 715 715 715 715
Base: all workplaces in the private trading sector with non-missing data. T-statistics in parentheses. * significant at5% level; ** significant at 1% level. All models include the full set of controls. See Table A6.5 for full model details.
longer significant. For this sample we were also unable to find any significant union interactioneffects with these variables. This finding supports the results of Addison and Belfield (2000) whoalso found no impact of financial participation on financial performance using WERS98.
6.5 Summary
Box 6.2 summarises our results. We find little evidence of collective bargaining arrangementeffects on workplace financial performance. However, there is a strong positive associationbetween industry-level bargaining and workplace financial performance. It may be that industry-level bargaining leads to better performance; however, it may also be true that only thoseemployers who performed well under industry-level bargaining have kept this form of paydetermination and these workplaces have continued to perform better than average. This typeof cross-sectional analysis is unable to determine the causal relationship.
There are other positive union effects associated with unfavourable market conditions,particularly where union strength is neither weak nor strong. Unions have a role to play inimproving workplace performance under difficult market circumstances, which may threaten thejob security and welfare of their members and may even lead to workplace closure. This pointsto a wider union impact beyond the collective bargaining focus of this report which certainlywarrants further investigation.
Endnotes
52 Like McNabb and Whitfield (1998), Addison and Belfield (2000) found union recognition had no significant effect onfinancial performance in conjunction with financial participation schemes. However, in contrast to McNabb andWhitfield, union recognition interactions with downward communication and upward problem-solving schemes werealso not significant.
53 This ‘unknown’ category includes those workplaces where there was multiple unionism, but there was no responseas to whether there was joint or separate bargaining. It has a significant negative coefficient in many of our models,but given the definition of the variable we cannot interpret its effect. We do not discuss performance for this categoryany further but we retain the coefficient in all tables for completeness.
54 Further models not shown indicated no significant differences between the performance of single union and multipleunion workplaces, and no effects arising from a higher number of recognised unions.
55 Not surprisingly, non-union workplaces in growing markets enjoyed better performance than non-union workplaceswhere the market was not growing.
56 We define strong unions as either having 100 per cent coverage or 100 per cent density; weak unions have less than50 per cent collective bargaining coverage and less than 50 per cent density. The remaining workplaces withrecognised unions are classified as medium-strength.
Workplace financial performance
61
Box 6.2: Effects of unions on financial performance
● Bargaining arrangements– No union recognition effect other than where the market is turbulent or declining– No difference between single and multiple unions– No difference between joint and separate bargaining– Findings hold for whole economy, trading sector and private trading sector– Findings hold if restrict to workplaces using profit/value added
● Bargaining levels– Industry-level bargaining associated with better financial performance
CHAPTER 7
Conclusions
In this final chapter, we pull together results from the three substantive chapters, organising thefindings under five headings corresponding to different aspects of unionism:
• Bargaining arrangements
• Bargaining levels
• Bargaining coverage
• Managerial attitudes to unions
• Union strength and effectiveness.
In the second part to the chapter we reflect on wider issues raised by the study.
7.1 Findings
Bargaining arrangements
Bargaining arrangements have little impact on workplace financial performance. However,fragmented negotiating arrangements were associated with poorer perceptions of climate.
Among managerial respondents in the public sector, climate was viewed as poorest where theemployer negotiated with separate groups of unions. Although bargaining arrangements werenot associated with managerial perceptions of climate in the private sector, multi-unionism wasassociated with poorer managerial perceptions of climate.
Employee perceptions of climate were also poorer in the presence of fragmented bargaining,although this time the effect was associated with separate bargaining with each union (as opposedto negotiation with groups of unions). Further investigation revealed that this effect was confinedto the private sector, and to union members. Across the economy as a whole, multi-unionismwas associated with poorer employee perceptions of climate, mirroring the finding for managers.
Taken together, these findings suggest that fragmented bargaining and multi-unionism per sewere associated with poorer perceptions of the employee relations climate among managementand employees, although the effects were not evident everywhere or across all types ofrespondent. There is no evidence of a superior bargaining arrangement with clear advantagesover others. However, single-table bargaining is one way to ameliorate the effects of multi-unionism and fragmented bargaining. This might go some way to explaining moves towardssingle-table bargaining in the 1990s.
Bargaining levels
Although there has been much debate about the level at which bargaining is conducted inBritain and its influence on wage setting and inflation, bargaining levels had little effect onworkplace performance in general. Workplaces with multi-level bargaining enjoyed betterclimate than other workplaces. This was the only bargaining effect on managerial and employeeperceptions of climate. However, this arrangement existed in less than 1 per cent of workplaces.
62
Industry-level bargaining was associated with better financial performance than other levels ofbargaining. However, some caution should be exercised in interpreting the finding. Industry-levelbargaining has continued to decline in the 1990s, and it may be that those who retain it are thosewho can ‘afford’ to do so. There is therefore a question mark about the direction of causation.
Bargaining coverage
Bargaining coverage was not associated with workplace financial performance. Its effects onclimate were quite difficult to interpret. In both the public and private sectors, managerialperceptions of climate were most positive where there was mid-range bargaining coverage.Although this is consistent with the notion that climate is best where there is a balance of powerbetween unions and management, other measures of union strength were not significant.Furthermore, the effect was not apparent for employees.
Managerial attitudes to unions
Although management attitudes to unions and union membership were not associated withworkplace financial performance, they were associated with the employee relations climate.Employee perceptions of climate were better where management were supportive of unions.Where employees thought management were opposed to union membership, and where theythought management did not take unions seriously, employee relations were perceived to bepoor. Managerial perceptions of climate were also better where they expressed support forunions, although further investigation revealed that this association was confined to unionisedworkplaces. These findings are consistent with the notion that employee relations are betterwhere management and unions support one another.
Union effectiveness and union strength
The weakening of unions in the 1990s is reflected in our finding that unionisation per se, asindicated by the presence of unions recognised for pay bargaining, had no influence on financialperformance, or employer perceptions of climate by 1998. This was so, irrespective of unionstrength. However, unionisation clearly influenced employee perceptions of climate. Unionrecognition was associated with poorer perceptions of climate, though this association is largelyaccounted for by voice-induced complaining on the part of union members. Employeeperceptions of climate were also poorer in the presence of strong unions, as indicated by highunion density or the presence of an on-site union representative. However, unions also hadbeneficial effects on climate where employees perceived them as effective.
7.2 Reflections on wider issues raised by the study
Union effects
The focus of the study was the impact of various aspects of collective bargaining on workplaceperformance, as measured by workplace financial performance and the employee relationsclimate. The focus on various aspects of collective bargaining was merited for three reasons.First, their potential effects have been somewhat neglected in the empirical literature, despitethe existence of a theoretical literature linking performance and collective bargaining. Secondly,it is merited by policy developments, notably the enactment of the Employment Relations Act1999 which extends rights to negotiate over pay to employees where a majority wish for unionrecognition. The WERS98 data pre-date this legislation, thus offering an insight into the effects
Conclusions
63
of collective bargaining in a voluntarist framework. Thirdly, it is merited by developments ‘on theground’. During the 1990s, there were clear trends towards the simplification of bargainingarrangements through reductions in the number of recognised unions and moves towardssingle-table bargaining where multi-unionism persisted. One might have expected ‘returns’ tothese simplified bargaining arrangements in terms of financial performance or climateimprovement. Yet we found no clear evidence of benefits arising from management dealing witha unified worker voice, although the avoidance of separate bargaining arrangements appearedadvantageous in some circumstances. The picture emerging from our analysis of bargainingarrangements, coverage and levels is more complex. This complex picture is not necessarilynew; it may simply reflect our ability to paint a complex picture due to the richness of theWERS98 data. In any event, it cautions against being prescriptive about the benefits ofparticular modes of bargaining.
Interpreting the effects of collective bargaining is difficult because they do not always readilycorrespond with the theoretical framework outlined in the paper. The analysis raises as manyquestions as it answers. For example:
• Why do bargaining arrangements play such a minor role in understanding performance?
• Why do managers perceive climate to be better where some, but by no means all, workersare covered by collective bargaining?
An issue arising from the classification of workplaces by bargaining arrangement is themismatch between union recognition and bargaining coverage that is discussed in ChapterThree. The presence of recognised unions should correspond with the presence of workerswhose pay is determined by collective bargaining in all but exceptional cases. In fact, there area number of instances in which this is not the case. This may reflect deficiencies in thequestionnaire, knowledge of managerial respondents, real changes in the nature of bargaining,or a combination of these. This is an issue requiring further investigation in preparation for anyfuture WERS.
Some of these issues can be tackled through further research in ways outlined below. It will benecessary to identify theories that can generate testable hypotheses able to account for thedivergent effects of different aspects of collective bargaining. A simple dichotomy between the‘monopoly’ and ‘voice’ effects of unions is a good starting point, but it is only that.
Nevertheless, there are some clear messages emerging from the research.
First, more attention needs to be paid to union effectiveness since employee perceptions thatunions are ‘delivering’ for them were strongly associated with better perceptions of climate.Although unions may need a degree of bargaining and organisational strength to ‘deliver’, unioneffectiveness and union strength are conceptually different. A key question is:
• What are the conditions under which employees perceive unions as effective, and thus ableto contribute to better employee relations?
This was not the focal point for this study, and further quantitative research could usefullyaddress this question. Case study research and other qualitative methods could also add to ourunderstanding of the mechanisms and processes by which the behaviour of unions can affectperformance across different sectors of the economy.
Secondly, employer orientations to unions and union membership play an important role indetermining performance outcomes. Support for unions and union membership, and apreparedness to engage seriously with unions, brings rewards in terms of improved climate.Employees’ belief that managers took unions seriously improved their perceptions of climate,even where unions were not recognised. Equally, where unions were present, managementopposition to them was detrimental to climate. This raises an important question:
Collective bargaining and workplace performance
64

• Why is it that more employers are not supportive of unions when it is clear that managerialsupport for unions can be beneficial?
The question is particularly pertinent in the light of the Employment Relations Act 1999 wherebyemployers not currently recognising a union may be required to do so where there is majoritysupport for recognition among employees.
Thirdly, the negative effects of unions on workplace financial performance, apparent in earlieranalyses, are absent in 1998. These findings imply that, by the late 1990s, unions were no longerable to extract surplus rents from employers at the expense of profits. There are a number ofpossible explanations:
(a) This may be symptomatic of the general decline in union strength since the early 1980s.However, even where unions were strong there was no effect.
(b) Allied to the decline in union strength, there may no longer be a union mark-up on wages,and thus no knock-on effect to profits. In fact, we know from other research using WERS98,that unions can achieve a mark-up in particular circumstances, but there is no generalmark-up.
(c) Unions continue to operate only where employers can ‘afford’ them. In which case, unionsmay obtain a wage premium at the expense of profits only where employers are in a goodmarket position. In fact, our evidence suggests that union effects on financial performancedid not differ with the workplace’s product market circumstances.
(d) Unions’ negative effects on performance arising from their monopoly position may bebalanced by positive union effects arising from their ‘voice’ role, and other union-relatedeffects enhancing productivity.
(d) may help to explain an important finding from Chapter Six, namely the positive effect ofunions on performance in workplaces facing turbulent markets. Clearly, this is another importantarea for further investigation.
Directions for future research
Below we outline some ways in which future quantitative research could improve ourunderstanding of links between unions and performance.
Panel analysis: Causal inferences about the impact of unions on performance are best madewith panel data wherein union measures at time t1 can be used to estimate the impact onperformance at t2 or over the period t1 – t2. Such data can also identify switches in regime, suchas a move towards single-table bargaining, to directly estimate their effect on changes inperformance, something we are unable to do with our cross-sectional data. These data areavailable in the WIRS 1990-1998 Panel, and have already been used to analyse workplaceclosure and employment growth (Bryson, 2000b).
Alternative performance measures: What would the picture look like if other performancemeasures were analysed? Although there are clear advantages to using the near-identicalmeasures of climate in the WERS98 employee and employer surveys, other measures areavailable. The analysis of financial performance in this paper relies on a single measure.Although it has been demonstrated that this subjective measure of performance is a good basisfor analysis, it is always helpful to have alternative measures of a similar concept. For privatemanufacturing, such measures are available in the financial data contained in the AnnualBusiness Inquiry, which can be linked to WERS98. Of course, there are other organisationalperformance measures worthy of investigation in their own right. WERS98 contains a labourproductivity measure similar to those appearing in previous WIRS.
Conclusions
65
Organisation-level analysis: Workplace-level analysis of performance is important since, evenwhere workplaces are owned by larger organisations, they usually have a substantial degree ofautonomy in terms of the way they organise their labour and reach production targets.Nevertheless, in many instances, non-independent workplaces are expected to follow policiesor procedures emanating from higher up in the organisation. Organisation-level analysis wouldtherefore be a useful complement to the workplace-level analysis presented here. It would bepossible to undertake this analysis with WERS98 with a variable linking workplaces belongingto the same organisation. This could be done without unnecessarily compromising theanonymity of survey respondents.
Matching in data from other sources: We have made limited use of the ability to match in datafrom other sources. In future, it may be worthwhile enhancing the survey data with a wider arrayof information held elsewhere, often at industry-level, which may enhance the predictive powerof models estimating performance outcomes. These data might include capital investment,import penetration and measures of technological change.
Collective bargaining and workplace performance
66
References
Addison, J. T. and Belfield, C. (2000) Scottish Journal of Political Economy, forthcoming.
Addison, J. T., Siebert, W. S., Wagner, J. and Wei, X. (1998) ‘Worker Participation and FirmPerformance: Evidence from Germany and Britain’, University of Luneburg Working Paper No. 188.
Airey, C., Hales, J., Hamilton, R., Korovessis, C., McKernan, A. and Perdon, S. (1999) TheWorkplace Employee Relations Survey (WERS) 1997-8: Technical Report.
Boxall, P. and Haynes, P. (1997) ‘Strategy and Trade Union Effectiveness in a Neo-liberalEnvironment’, British Journal of Industrial Relations, 35, 4: 567-591.
Blanchflower, D. G. and Oswald, A. J. (1988) ‘Profit-related pay: prose discovered’, The EconomicJournal, 98: 720-730.
Blanchflower, D. G., Millward, N. and Oswald, A. J. (1991) ‘Unionism and EmploymentBehaviour’, The Economic Journal, 101: 815-834.
Booth, A. L. and McCullough, A. (1999) ‘Redundancy Pay, Unions and Employment’, TheManchester School, Vol. 67, No. 3: 346-366.
Brown, W., Marginson, P. and Walsh, J. (1995) ‘Management: pay determination and collectivebargaining’ in P. Edwards (ed.) Industrial Relations: Theory and Practice in Britain, Oxford: Blackwell.
Brown, W., Deakin, S., Hudson, M., Pratten, C. and Ryan, P. (1998) The Individualisation ofEmployment Contracts in Britain, Department of Trade and Industry Employment RelationsResearch Series 4, London: HMSO.
Bryson, A. (1999a) ‘Are unions good for industrial relations?’ in Jowell, R., Curtice, J., Park, A.,and Thomson, K. (eds) British Social Attitudes: the 16th Report – Who shares New Labourvalues?, Aldershot: Ashgate.
Bryson, A. (1999b) ‘The impact of employee involvement on small firms’ financial performance’,National Institute Economic Review, July, 70-87.
Bryson, A. (2000a) Have British Workers Lost Their Voice, Or Have They Gained A New One?An Analysis of Matched Employer-Employee Data, London: Policy Studies Institute WorkingPaper, forthcoming.
Bryson, A. (2000b) Employee Voice, Workplace Closure and Employment Growth: A PanelAnalysis, London: Policy Studies Institute Working Paper, forthcoming.
Bryson, A. and McKay, S. (1997) ‘What about the workers?’ in Jowell, R., Curtice, J., Park, A., Brook,L., Thomson, K. and Bryson, C., British Social Attitudes: the 14th Report, Aldershot: Ashgate.
Burgess, S., Lane, J. and Stevens, D. (1999) ‘Job Flows, Worker Flows and Churning’, forthcoming.
Cheung, F. K. and Davidson, C. (1991) ‘Bargaining structure and strike activity’, CanadianJournal of Economics, 91: 345-371.
Cooke, W.N. (1994) ‘Employee Participation Programs, Group-based Incentives and CompanyPerformance: a Union-Nonunion Comparison’, Industrial and Labor Relations Review, Vol. 47,No. 4: 594-609.
Cully, M. and Woodland, S. (1998) ‘Trade union membership and recognition 1996-97: ananalysis of data from the Certification Officer and the LFS’, Labour Market Trends, July, 353-364.
Cully, M., Woodland, S., O’Reilly, A., Dix, G. (1999) Britain at Work: As depicted by the 1998Workplace Employee Relations Survey, London: Routledge.
67

Darlington, R. (1994) ‘Shop stewards’ organisation in Ford Halewood: from Beynon to today’,Industrial Relations Journal, 25, 2: 136-149.
Dasmalchian, A., Blyton, P. and Adamson R., (1989) ‘Industrial Relations Climate: Testing aConstruct’, Journal of Occupational Psychology, 62: 21-32.
Davidson, C. (1988) ‘Multiunit Bargaining in Oligopolistic Industries’, Journal of LaborEconomics, 6, 3: 397-422.
Deery, S. J., Iverson, R. D. and Eriwin, P. J. (1994) ‘Predicting Organisational and Union Commitment:The Effect of Industrial Relations Climate’, British Journal of Industrial Relations, 32, 4: 581-597.
Deery, S. J., Erwin, P. J., and Iverson, R. D. (1995) ‘Union Management, Co-Operation, DualAllegiance and Organisational Performance’, Department of Management and Industrial Relations,University of Melbourne, Working Paper No. 89.
Denny, K., and Muellbauer, J. (1988) Economic and industrial relations explanations ofproductivity change: some evidence for the British manufacturing sector, 1980-1984, mimeo,Nuffield College, Oxford.
Dobson, J. R. (1997) ‘The Effects of Multi-unionism: a Survey of Large ManufacturingEstablishments’, British Journal of Industrial Relations, 35, 4: 547-566.
Donovan Commission (1968) Royal Commission on Trade Unions and Employers Associations,Report, Cmnd 3623, London: HMSO.
Fernie, S., Metcalf, D. and Woodland, S. (1994) ‘Does HRM Boost Employee-ManagementRelations?’, Centre for Economic Performance Working Paper No. 548.
Fernie, S. and Metcalf, D. (1995) ‘Participation, Contingent Pay, Representation and WorkplacePerformance: Evidence from Great Britain’, British Journal of Industrial Relations, 33, 3: 379-415.
Forth, J. and Millward, N. (2000) High involvement management, unions and pay, mimeo,National Institute of Social and Economic Research.
Freeman, R. and Medoff, J. (1984) What do unions do?, New York: Basic Books.
Gallie, D. and Rose, M. (1996) ‘Employer policies and trade union influence’ in D. Gallie, R. Pennand M. Rose (eds.) Trade Unionism in Recession, Oxford: OUP, 33-64.
Gallie, D., White, M., Cheng, Y. and Tomlinson, M. (1998) Restructuring the EmploymentRelationship, Oxford: OUP.
Gregg, P., Machin, S. and Metcalf, D. (1993) ‘Signals and Cycles? Productivity Growth andChanges in Union Status in British Companies, 1984-9’, The Economic Journal, 103: 894-907.
Greene, W. H. (1997) Econometric Analysis, 3rd edition, New York: Macmillan.
Guest, D., Michie, J., Conway, N. and Sheehan, M. (1999) ‘Partnership and Performance: AnAnalysis Using the 1998 Workplace Employee Relations Survey’, paper for BJIR/WERS98Conference, Cumberland Lodge.
Hildreth, A. K. G. (1999) ‘A new voice or a waste of time? Returns to using computers forcommunication in the workplace’, unpublished manuscript.
Horn, H. and Wolinsky, A. (1988) ‘Worker Substitutability and Patterns of Unionisation’, TheEconomic Journal, 98: 484-487.
Huselid, M. A. and Becker, B. E. (1996) ‘Methodological issues in cross-sectional and panelestimates of the human resource-firm performance link’, Industrial Relations, Vol. 35, No. 3: 400-422.
Hyman, R. (1997) ‘The Future of Employee Representation’, British Journal of Industrial Relations,35, 3: 309-336.
Collective bargaining and workplace performance
68
Jowell, R., Curtice, J., Park, A., Brook, L., Thomson, K., and Bryson, C. (1997) British SocialAttitudes: the 14th Report. The End of Conservative Values?, Aldershot: Ashgate.
Jowell, R., Curtice, J., Park, A. and Thomson, K. (1999) British Social Attitudes: the 16th Report.Who Shares New Labour Values?, Aldershot: Ashgate.
Labour Market Trends (1997) ‘Membership of trade unions in 1995 based on information fromthe Certification Officer’, Labour Market Trends February, 39.
McNabb, R. and Whitfield, K. (1997) ‘Unions, flexibility, team working and financial performance’,Organisation Studies, 15, 5: 821-838.
McNabb, R. and Whitfield, K. (1998) ‘The Impact of Financial Participation and EmployeeInvolvement on Financial Performance’, Scottish Journal of Political Economy, 45, 2: 171-187.
Machin, S. J. (1991) ‘Unions and the capture of economic rents: An investigation using Britishfirm level data’, International Journal of Industrial Organisation, 9: 261-274.
Machin, S. (1995) ‘Plant Closures and Unionisation in British Establishments’, British Journal ofIndustrial Relations, 33,1: 55-68.
Machin, S. and Stewart, M. (1990) ‘Unions and the financial performance of British private sectorestablishments’, Journal of Applied Econometrics, Vol. 5: 327-350.
Machin, S. and Stewart, M. (1996) ‘Trade Unions and Financial Performance’, Oxford EconomicPapers, 48: 213-241.
Machin, S., Stewart, M. and Van Reenen, J. (1991) ‘The Economic Effects of Multiple Unionism:Evidence from the 1984 Workplace Industrial Relations Survey’, mimeo.
Machin, S., Stewart, M. and Van Reenen, J. (1993) ‘The Economic Effects of Multiple Unionism:Evidence from the 1984 Workplace Industrial Relations Survey’, Scandinavian Journal ofEconomics, Vol. 95, No. 3: 279-296.
Machin, S. and Wadwhani, S. (1991) ‘The Effects of Unions on Organisational Change andEmployment’, The Economic Journal, 101: 835-854.
Marchington, M. and Parker, P. (1990) Changing Patterns of Employee Relations, HemelHempstead: Harvester Wheatsheaf.
Marshall, R. (1992) ‘The Future Role of Government in Industrial Relations’, Industrial Relations,31,1: 31-49.
Metcalf, D., Hansen, K. and Charlwood, A. (2000) ‘Unions and the Sword of Justice: Unions andPay Systems, Pay Inequality, Pay Discrimination and Low Pay’, Centre for EconomicPerformance Discussion Paper 0452.
Menezes-Filho, N. A. (1997) ‘Unions and profitability over the 1980s: Some Evidence on Union-firm Bargaining in the United Kingdom’, The Economic Journal, 107: 651-670.
Metcalf, D., Wadsworth, J. and Ingram, P. (1993) ‘Multi-unionism, size of bargaining group andstrikes’, Industrial Relations Journal, 24,1: 3-13.
Millward, N. (1994) The New Industrial Relations?, London: Policy Studies Institute.
Millward, N. and Stevens, M. (1986) British Workplace Industrial Relations 1980-1984: TheDE/ESRC/PSI/ACAS Surveys, Aldershot: Gower.
Millward, N., Stevens, M., Smart, D. and Hawes, W. R. (1992) Workplace industrial relations intransition, Aldershot, Dartmouth.
Millward, N., Bryson, A. and Forth, J. (2000) All Change at Work? British Employment Relations,1980-98, as portrayed by the Workplace Industrial Relations Survey Series, London: Routledge.
References
69

Moreton, D. (1999) ‘A model of labour productivity and union density in British private sectorunionised establishments’, Oxford Economic Papers, 51: 322-344.
Naylor, R. (1995) ‘On the economic effects of multiple unionism’, Scandinavian Journal ofEconomics, 97,1: 161-167.
Paci, P., Wagstaff, A., and Holl, P. (1993) ‘Measuring Union Power in British Manufacturing: aLatent Variable Approach’, Oxford Bulletin of Economics and Statistics, 55: 65-85.
Palokangas, T. (2000) Labour Unions, Public Policy and Economic Growth, Cambridge:Cambridge University Press.
Pfeffer, J. (1995) ‘Producing Sustainable Competitive Advantage through Effective Managementof People’, Academy Journal of Management Executive, 9, 1: 55-69.
Scholarios, D., Ramsay, H. and Harley, B. (1999) ‘High Noon on the High Road: Testing Insidethe Black Box of “High Performance” Work Systems’, paper for BJIR/WERS98 Conference,Cumberland Lodge.
Skinner, C. J. (1989) Introduction to Part A in Analysis of Complex Surveys, Skinner, C. J., Holt,D. and Smith, T. M. F., New York: John Wiley and Sons.
Skinner, C. (1997) The use of sample survey weights in the regression analysis of the WorkplaceIndustrial Relations Survey Data, University of Southampton, mimeo.
Smith, P. and Morton, G. (1997) Union Exclusion; Retrospect 1979-97 and Prospect, Paperpresented to the British Universities Industrial Relations Association Annual Conference, Bath.
STATA (1999) Manual Release 6 Volume 4, STATA Press, College Station, Texas.
Stewart, M. (1987) ‘Collective bargaining arrangements, closed shops and relative pay’,The Economic Journal, 97: 140-156.
Stewart, M. (1995) ‘Union wage differentials in an era of declining unionisation’, Oxford Bulletinof Economics and Statistics, Vol. 57, No. 2: 143-166.
Storey, J. (1992) Developments in the Management of Human Resources, Oxford: Blackwell.
Wajcman, J. (1996) ‘Desperately Seeking Differences: Is Management Style Gendered?’, BritishJournal of Industrial Relations, 34, 3: 333-349.
Wajcman, J. (2000) ‘Feminism Facing Industrial Relations in Britain’, British Journal of IndustrialRelations, Vol. 38, No. 2, June: 183-202.
Walton, R. and McKersie, R. (1965) A Behavioural Theory of Labor Negotiations, New York:McGraw-Hill.
Wood, S. and de Menezes, L. (1998) ‘High Commitment Management in the UK: Evidence fromthe Workplace Industrial Relations Survey, and Employers’ Manpower and Skills PracticesSurvey’, Human Relations, 51, 4: 485-515.
Wooden, M. and Hawke, A. (1997) Unions and employment growth in Australia: panel dataevidence, Paper presented at the Conference of Economists, University of Tasmania.
Wright, M. (1996) ‘The Collapse of Compulsory Unionism? Collective Organisation in HighlyUnionized British Companies, 1979-1991’, British Journal of Industrial Relations, 34, 4: 497-513.
70
Collective bargaining and workplace performance

APPENDIX 1 A description of the Workplace EmployeeRelations Survey 1998
The Workplace Employee Relations Survey 1998 (WERS98) is a nationally representative surveyof workplaces with 10 or more employees covering all sectors of the economy except agriculture.57
With weighting to account for complex survey design, survey results can be generalised withconfidence to the population of workplaces in Britain employing 10 or more employees.
Our analyses use two elements of the survey. The first is the management interview, conductedface-to-face with the most senior workplace manager responsible for employee relations. Thiswas supplemented by a pre-interview self-completion questionnaire providing workforce datathat might have involved interrogating records. Interviews were conducted in 2,191 workplaceswith a response rate of 80 per cent. The second element we use is the survey of employeeswithin workplaces where a management interview was obtained. Self-completionquestionnaires were distributed to a simple random sample of 25 employees (or all employeesin workplaces with 10-24) in the 1,880 cases where management permitted it.58 Of the 44,283questionnaires distributed, 28,237 (64 per cent) usable ones were returned.59 Details of what wascovered in the employee survey are presented in Chapter Seven.
Endnotes
57 For a comprehensive technical account of the survey see Airey et al. (1999) and for the initial analysis of the surveysee Cully et al. (1999). The survey data sets are available from The Data Archive, University of Essex.
58 The probability of worker selection is the product of the probability of the workplace being selected and theprobability of an employee being selected from within that workplace. Cully et al. (1999: 306) note the advantages ofthis approach.
59 The weighting scheme used in this paper compensates for sample non-response bias which was detected in theemployee survey (Airie et al., 1999: 91-92).
71
APPENDIX 2
Modelling procedures
The three outcome variables of interest in Chapters Four, Five and Six are all categoricalindicators defined in terms of ordered responses. We use ordered probit estimators to model therelationship between these dependent variables and sets of independent variables. In orderedprobit, an underlying unobservable score is estimated as a linear function of the independentvariables and a set of unknown ‘threshold’ parameters, or cut points. The probability ofobserving outcome i corresponds to the probability that the estimated linear function plusrandom error is within the range of the cut points estimated for the outcome. It is assumed thatthe error term is normally distributed (Greene, 1997).
Significant positive coefficients indicate variables associated with better performance. It is notpossible to directly quantify the effect of coefficients in the way that one can interpretcoefficients from a least squares regression, for example. However, one can use the coefficientsfrom the models to generate probabilities of better performance given a set of characteristicsthat can be set by the analyst. One may then identify shifts in that probability by switching‘regimes’, say from one in which the workplace is characterised by separate bargaining by eachunion to one in which there is single-table bargaining.60
Analyses take account of the complex survey design allowing results to be generalised to theworkplace and employee populations from which the samples were drawn. First, all models arerun on data weighted by the inverse of the employer’s sampling probability (the employee’ssampling probability in the case of Section Seven). As well as allowing the results to begeneralised to the population from which the sample is drawn, the use of probability weightsalso guards against estimation bias which can arise through differential sample selectionprobabilities.61 Secondly, we employ the Huber-White robust variance estimator that producesconsistent standard errors in the presence of heteroscedasticity.62
Thirdly, we obtain accurate standard errors by taking account of sample stratification and thenon-independence of employee observations due to clustering in the primary sampling units,namely workplaces.
This procedure uses pseudo-likelihood methods, the point estimates being those from aweighted ‘likelihood’ which is not the distribution function for the sample. Thus, standardlikelihood-ratio tests are not valid (Skinner, 1989, STATA Manual, Release 6, Volume 4, 1999).
Endnotes
60 For an illustration of this technique see Bryson (1999b).
61 Differential sampling fractions can result in standard estimator biases (Skinner, 1997). The weights account for all variationin sampling probabilities, thus eliminating differential sampling probability as a possible source of estimation bias.
62 The F statistic reported for each model is a Wald test based on the robustly estimated variance matrix.
72
APPENDIX 3
Controls used in analyses of managerialperceptions of the employee relations climate
Appendix Table A4.1 defines these variables and shows their incidence in the sample as a wholeand the public and private sectors separately. We discuss these controls here, with theexception of the collective bargaining variables already introduced in Chapter Three.
Respondent characteristics: We experimented with a number of variables capturing the natureof the managerial respondent. Our final models incorporate three. First, since previous researchindicated that women tend to have better perceptions of climate than men (Bryson and McKay,1997), we identify whether the respondent was a woman. Secondly, we include whether therespondent was a personnel or employee relations specialist since research with WIRS90 foundspecialists had poorer perceptions of climate than other managerial respondents (Fernie,Metcalf and Woodland, 1994). Previous research indicates that employees’ perceptions ofclimate deteriorate with time in their job; we incorporate job tenure on the assumption that thiseffect will also apply to managers.
Workforce composition: Managerial perceptions of climate are better in smaller workplaces(Fernie, Metcalf and Woodland, 1994), so we include a categorical variable capturing thenumber of employees at the workplace. Three additional variables capture the composition ofthe workforce: the percentage of women, part-timers and non-white ethnic minorities.
Workplace ownership, sector and location: Single-site and multi-site organisations differmarkedly in the way they manage employee relations, and across the public and private sectorsof the economy (Millward et al., 2000: 61-80), so our models control for this. The public/privatedistinction is fundamental since, as Appendix Table A4.1 shows, the bargaining arrangements inthe two sectors are very different. Therefore, as well as including the variable in our wholesample model to capture anything distinctive about a public sector ethos or culture, we also splitthe analyses by broad sector to allow the variance attributable to bargaining arrangements andother controls to differ across the two sectors. In the same way that smaller workplaces areoften associated with better managerial perceptions of climate, so too are smaller organisations,captured in our distinction between workplaces that are single independent establishments andthose belonging to multiple-establishment organisations. We also make use of information notpreviously available in WIRS which identifies workplaces owned by individuals or families alsoinvolved in the day-to-day running of the workplace. We include industry dummies to captureunmeasured industry differences. For the most part we use the one-digit standard industrialclassification, but we use the five-digit classification in some models – this is particularlyimportant when examining the effect of bargaining levels since arrangements differsystematically across industries. A twelve-category regional variable captures workplacelocation. Although debate about the ‘new’ industrial relations has died down somewhat, it is stillequated with younger workplaces, those set up on greenfield sites, and foreign-ownedworkplaces (Millward, 1994). We control for these factors.
Workplace activity: Workplace climate may be affected by the pressures associated withexposure to a competitive market environment. Our workplace activity variable distinguishesworkplaces producing goods and services for consumers, those supplying to other companies,those supplying to other parts of the organisation they belong to, those that do not producegoods or provide services for the open market, and those that are purely administrative offices.
73

Management practices: Any positive effects of employee involvement on firm performance maybe upwardly biased if they are simply an indicator that a workplace is well managed generallyand no attempt is made to control for ‘good management’ (Huselid and Becker, 1996). This isequally true with respect to the impact of bargaining arrangements on employers’ perceptionsof climate. We include a very wide range of management practices to account for this possibility,as recorded in Appendix Table A4.1. It is worth mentioning some of them briefly. First, there arethe human resource management practices. HRMSCORE is loosely based on the managerialconcepts outlined by Pfeffer (1995), which, he argues, produce a sustainable competitiveadvantage through the effective management of people. The measure is a count of practicesidentified by Pfeffer, supplemented by other aspects of human resource managementidentifiable in the literature.63 (In some models we include the count variable, in others we includethe full set of practices). Secondly, we include a range of voice and communication variablessupplementing the union-non-union voice variable referred to below. Some entail two-waycommunication, others one-way downward communication from management to employees.The third set of management practice variables relates to formal procedures: individualgrievance procedures, procedures for dealing with collective disputes, and formal writtenpolicies on equal opportunities or managing diversity. Finally, we identify whether the workplaceor organisation to which it belongs has been accredited as an Investor in People.64
Other union measures: Finally, we test the sensitivity of our bargaining variables to three otherfacets of trade unionism. First, union strength, as captured by the presence of an on-siterepresentative, a closed shop, or union density. Secondly, management’s attitudes to unionssignaled by their support for union membership65 and their preference for direct consultationwith employees over consultation with unions.66 Thirdly, the nature of worker voice, partlycaptured by the presence of an on-site union representative, but also by a variable thatdistinguishes workplaces with no voice, union-only voice, direct non-union voice only, or ‘dualchannel’ voice involving a combination of union and non-union voice.67
Endnotes
63 These dimensions, and the relevant WERS98 derived variables, are as follows: selectivity in recruiting (SELECTIV);employment security (JOBSECUR); incentive pay (PROFITPY, PERFPAY, CASHBO); employee ownership (ESOP);information sharing (NINFO); participation and empowerment (EMPOWER); self-managed teams (AUTOTEAM);training and skill development (PCOFFJOB, ONGOING); cross-utilisation and cross-training (TROTHJ2); symbolicegalitarianism (SAMETERM); promotion from within (INTERPRO). In addition, the score includes an indicator that theworkplace has a formal strategic plan (STRATEGY), strategic planning being a key component on HRM according tosome commentators (Storey, 1992), and widespread appraisal systems (APPRAISE). The variable is approximatelynormally distributed.
64 The Investors in People (IiP) award is given to workplaces or organisations by independent assessors from Trainingand Enterprise Councils in England and Wales (Local Enterprise Companies in Scotland) which have a plannedapproach to setting and communicating business objectives and developing people to meet those objectives.
65 The managerial respondent is asked whether management’s general attitude towards union membership amongemployees at the workplace is best described as in favour, not in favour or neutral. This question has the advantageof being asked of all respondents, whereas the endorsement question is confined to those with union members onsite. Where there is no union recognition, 39 per cent of employees believed managers were not in favour of unions.Although the figure was much smaller in workplaces with recognised unions (15 per cent), it nevertheless indicatesa substantial degree of opposition to unions on the part of management.
66 Almost three-quarters of managerial respondents agreed with the statement. Perhaps more revealing still is the factthat 18 per cent of managerial respondents in unionised workplaces agreed strongly with the statement, and a further36 per cent agreed.
67 Our ‘voice’ measure (VOICE3) identifies a union voice as being present where there is a recognised union or the unionappoints an employee representative to a joint consultative committee which meets regularly. Non-union voicecomprises direct voice (incorporating team briefings, regular meetings between senior management and theworkforce, and problem-solving groups) and non-union representative voice in the form of a joint consultativecommittee without union nominees which meets regularly.
Collective bargaining and workplace performance
74
75
APPENDIX 4
Controls used in analyses of employeeperceptions of climate
Appendix Table A5.1 defines the control variables and shows their incidence in the sample as awhole and the public and private sectors separately. We discuss these controls here, with theexception of the collective bargaining variables already introduced in Chapter Three and theworkplace characteristics discussed in Appendix Three.
Demographic characteristics of respondents: our analyses incorporate gender, age and ethnicity,all of which have been associated with employee perceptions of management in previous studies(Bryson and McKay, 1997; Gallie, White, Cheng and Tomlinson, 1999). More highly educatedworkers often have higher expectations of involvement, and may therefore be particularly criticalof management where participation is denied. We therefore include individuals’ highesteducational qualification, and whether they possess a vocational qualification.
Job-related characteristics: we control for five aspects of individuals’ jobs: occupation (basedon the 1990 Standard Occupational Classification); years spent working at the workplace; hoursusually worked each week; whether the contract is a permanent one; and gross weekly wage.Together, these variables help capture an individual’s attachment to their workplace, theinvestment they have made in working there, and their status in the organisation.
The twelve-category ordered variable capturing gross wages controls for a well-known unioneffect which may confound other union effects, namely the union mark-up on wages notedabove. Union-induced wage increases may make workers more positive about their workingenvironment than they otherwise would be, so confounding estimates of a union-induced effectarising through bargaining arrangements.
Union membership status: we distinguish between current union members, ex-members andindividuals that have never been union members. Controlling for individual union membershiphelps identify whether there is voice-induced complaining among union members and is a proxyfor individual coverage for collective bargaining.
Workforce composition: Two workforce composition variables are introduced alongside thoseused in Chapter Four. We include the percentage of managers who are women to identifywhether there is anything distinctive about the style of women managers which employeesrespond to.68 Secondly, we include a count variable identifying the total number of occupationsat the workplace to differentiate simpler and more complex work processes. The variable seeksto control for the possibility that effects associated with fragmented bargaining are simplypicking up the effects of a more fragmented workforce.
Other union measures: In addition to the variables described in Chapter Four, we use three unionmeasures taken from the employee self-completion questionnaire. Two relate to employees’perceptions of union effectiveness. The first is how strongly employees agreed that unions attheir workplace are responsive to employee problems and complaints. The second is howstrongly employees agree that unions or staff associations at the workplace ‘are taken seriouslyby management’. The third measure asks employees to assess their management’s attitude tounion membership among its employees, a question that mirrors one asked of management inthe main management survey interview.
Endnote
68 Whether managerial style is gendered has been the subject of much speculation and analysis recently (Wajcman, 1996, 2000).

APPENDIX 5
Controls used in analyses of managerial perceptionsof the workplace’s relative financial performance
Appendix Table A6.1 defines the control variables and shows their incidence in the public andprivate sectors separately, as well as the private trading sector. We discuss these controls here,with the exception of the collective bargaining variables already introduced in Chapter Three.
Respondent’s characteristics: We experimented with a number of variables capturing the natureof the managerial respondent. Our final models include just one measure which indicateswhether the respondent was the Proprietor, Owner, Managing Director, Partner, Financial Manager,Company Secretary or General Manager. Those with specialist employee relations titles are inthe reference category. The variable helps control for the possibility that managers involved infinancial matters may be better informed about the financial performance of the workplace.
Workforce composition: We experimented with variables for the size of both the workplace andthe organisation. Only very large workplaces had a significant impact on performance, hence weinclude a dummy variable indicating whether there were 500 or more employees in theworkplace. Additional variables indicate whether employment in the workplace increased in thelast year.69 Two variables capture the composition of the workforce: the percentage of womenand the percentage working part-time. The percentage of non-white ethnic minorities had noimpact on performance.
Workplace ownership, sector and location: There was no difference in financial performancebetween single-site and multi-site organisations, nor between UK and foreign-ownedworkplaces, hence these variables are not included in our final models. Whole sample modelscontrol for public and private sector ownership. Twelve industry classifications control forindustry-specific effects. The performance measure is based on workplace financialperformance relative to establishments in the same industry, so the industry classificationidentifies the basis for this comparison, but only to the extent that respondents are thinking ofbroad industrial sectors when making their comparisons. In the absence of information onperformance levels by industry, we experimented with a more disaggregated industryclassification but the sample sizes available in the survey meant that results from these modelswere volatile. A twelve-category regional variable captures workplace location. Performancewas not associated with location on a greenfield site, so this was omitted.
Workplace activity: Many of our models focus solely on the trading sector or the private tradingsector. The trading sector covered workplaces that produced goods or services for consumersor supplied goods or services to other companies.
Management practices: We include a wide range of management practices. McNabb andWhitfield (1997, 1998) found union effects on financial performance where there were differenttypes of financial participation or employee involvement. We follow their approach. Financialparticipation variables indicate whether there were any of the following schemes in operation atthe workplace: profit-related payment or bonus schemes; deferred profit-sharing schemes;employee share ownership schemes; individual or group performance-related schemes or othercash bonuses. Employee involvement variables identify whether there was upward problem-solving in the form of either quality circles, suggestion schemes or staff surveys.70 Downwardcommunication was not found to be significant and was not included, but the presence of a jointconsultative committee was included. In addition, the variable counting the number of human
76
resource management practices in the workplace was included. Variables identifying formalprocedures and whether the workplace or organisation to which it belongs has been accreditedas an Investor in People were not significant and were not included in the models.
Market-related variables: For the trading sector, there are a number of additional variables thatmay be expected to have an impact on financial performance. Machin and Stewart (1990, 1996)found a union impact only when there was high market share as measured by employment sharein the industry. WERS98 includes a direct measure of market share relating to the proportion ofUK sales. Included in our trading sector models is a variable identifying when the market sharewas greater than 50 per cent. Other market-related variables in the models include: whether themarket is growing (the other options include mature, declining or turbulent); whether the valueof sales of the main product or service has been rising, stable or falling; the manager’sassessment as to the degree of competition in the market; and whether the output of theestablishment is a single product or service, or different products or services. This variable isincluded to measure whether there is scope at the workplace to switch production in responseto performance.
Endnotes
69 An additional variable identifies workplaces where employment growth data is not available because the workplaceis less than a year old.
70 Note staff surveys only apply to workplaces that were five years or older, hence we also include a dummy identifyingworkplaces not responding to this question.
Appendix 5
77
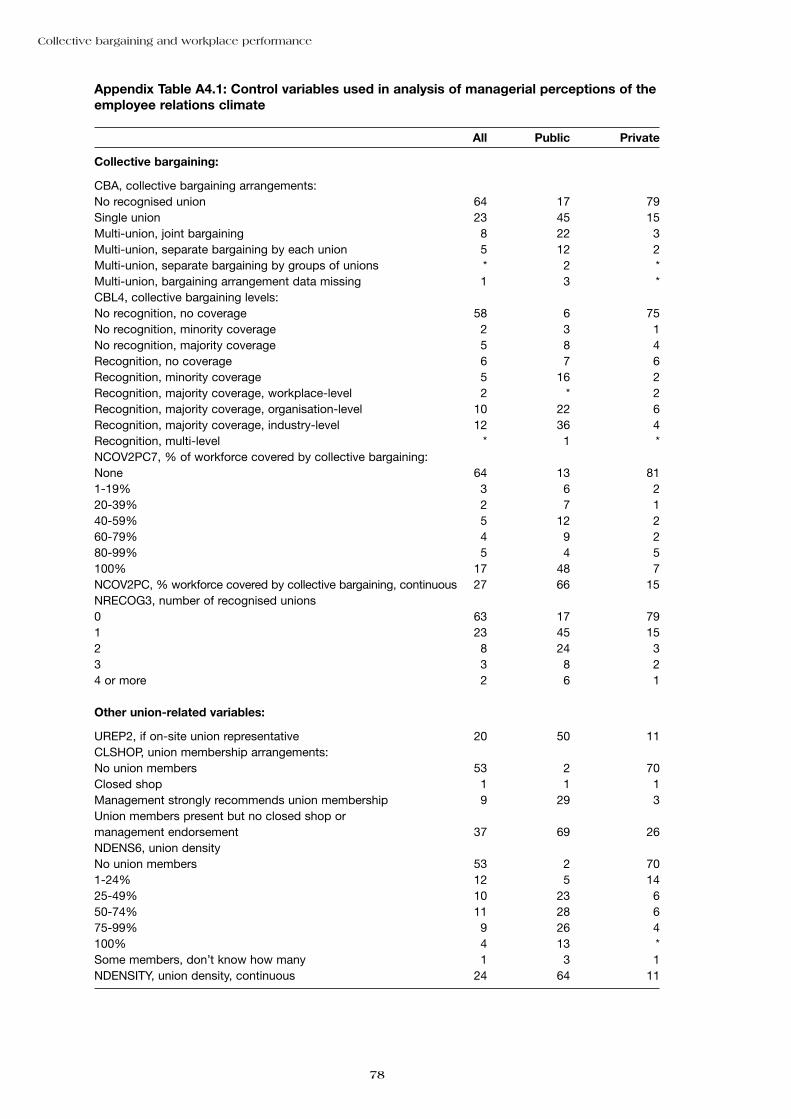
Collective bargaining and workplace performance
78
Appendix Table A4.1: Control variables used in analysis of managerial perceptions of theemployee relations climate
All Public Private
Collective bargaining:
CBA, collective bargaining arrangements:No recognised union 64 17 79Single union 23 45 15Multi-union, joint bargaining 8 22 3Multi-union, separate bargaining by each union 5 12 2Multi-union, separate bargaining by groups of unions * 2 *Multi-union, bargaining arrangement data missing 1 3 *CBL4, collective bargaining levels:No recognition, no coverage 58 6 75No recognition, minority coverage 2 3 1No recognition, majority coverage 5 8 4Recognition, no coverage 6 7 6Recognition, minority coverage 5 16 2Recognition, majority coverage, workplace-level 2 * 2Recognition, majority coverage, organisation-level 10 22 6Recognition, majority coverage, industry-level 12 36 4Recognition, multi-level * 1 *NCOV2PC7, % of workforce covered by collective bargaining:None 64 13 811-19% 3 6 220-39% 2 7 140-59% 5 12 260-79% 4 9 280-99% 5 4 5100% 17 48 7NCOV2PC, % workforce covered by collective bargaining, continuous 27 66 15NRECOG3, number of recognised unions0 63 17 791 23 45 152 8 24 33 3 8 24 or more 2 6 1
Other union-related variables:
UREP2, if on-site union representative 20 50 11CLSHOP, union membership arrangements:No union members 53 2 70Closed shop 1 1 1Management strongly recommends union membership 9 29 3Union members present but no closed shop ormanagement endorsement 37 69 26NDENS6, union densityNo union members 53 2 701-24% 12 5 1425-49% 10 23 650-74% 11 28 675-99% 9 26 4100% 4 13 *Some members, don’t know how many 1 3 1NDENSITY, union density, continuous 24 64 11

Appendix tables
79
All Public Private
EVIEWS, how would you describe management’s general attitude towards trade union membership among employeesat this establishment?In favour 28 71 13Not in favour 16 1 22Neutral 54 28 62Not an issue 2 0 3Other answer * * *APHRAS07, we would rather consult directly with employees than with unions:Strongly agree 32 16 37Agree 43 36 45Neither agree nor disagree 15 23 12Disagree 9 24 5Strongly disagree 1 2 1VOICE3, nature of worker voice:Union only 5 6 5Dual channel 30 80 16Non-union only 48 13 58No voice 17 1 21
Respondent’s characteristics:
RESPFEM, if respondent a woman 37 43 35SPECIAL, if respondent is employee relations specialist according to job title 19 25 17JTEN6PS, if respondent in current job for six or more years 37 35 38
Workforce composition:
PCFEM, % of workforce who are women 54 69 50PCPTCAT, % of workforce who are part-timers:None 18 9 21Under 10% 19 11 2210%, under 25% 15 14 1525%, under 50% 17 27 1350%, under 75% 20 31 1675% or more 12 8 13PCETHNI5, % of workforce from non-white ethnic minorities:None 62 65 61Under 5% 16 14 165-10% 11 8 1211-19% 5 3 620% or more 6 9 5NEMPSIZE, number of employees at workplace:10-24 50 43 5225-49 26 31 2550-99 13 13 12100-199 6 7 6200-499 4 4 4500 or more 1 2 1
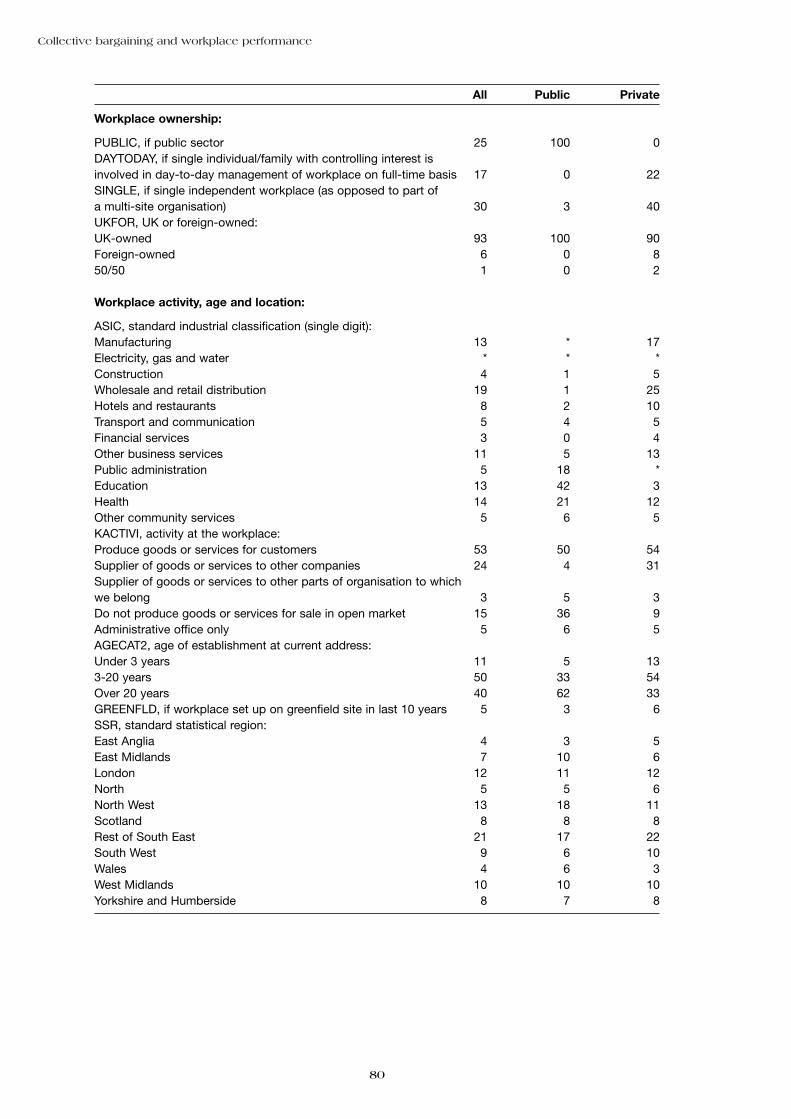
Collective bargaining and workplace performance
80
All Public Private
Workplace ownership:
PUBLIC, if public sector 25 100 0DAYTODAY, if single individual/family with controlling interest isinvolved in day-to-day management of workplace on full-time basis 17 0 22SINGLE, if single independent workplace (as opposed to part of a multi-site organisation) 30 3 40UKFOR, UK or foreign-owned:UK-owned 93 100 90Foreign-owned 6 0 850/50 1 0 2
Workplace activity, age and location:
ASIC, standard industrial classification (single digit):Manufacturing 13 * 17Electricity, gas and water * * *Construction 4 1 5Wholesale and retail distribution 19 1 25Hotels and restaurants 8 2 10Transport and communication 5 4 5Financial services 3 0 4Other business services 11 5 13Public administration 5 18 *Education 13 42 3Health 14 21 12Other community services 5 6 5KACTIVI, activity at the workplace:Produce goods or services for customers 53 50 54Supplier of goods or services to other companies 24 4 31Supplier of goods or services to other parts of organisation to whichwe belong 3 5 3Do not produce goods or services for sale in open market 15 36 9Administrative office only 5 6 5AGECAT2, age of establishment at current address:Under 3 years 11 5 133-20 years 50 33 54Over 20 years 40 62 33GREENFLD, if workplace set up on greenfield site in last 10 years 5 3 6SSR, standard statistical region:East Anglia 4 3 5East Midlands 7 10 6London 12 11 12North 5 5 6North West 13 18 11Scotland 8 8 8Rest of South East 21 17 22South West 9 6 10Wales 4 6 3West Midlands 10 10 10Yorkshire and Humberside 8 7 8

Appendix tables
81
All Public Private
Management practices:
HRMSCORE, count of 13 human resource management practices 6.8 7.3 6.6NINFO, number of items of information regularly given to employeesregarding internal investment plans, the financial position of theworkplace, and staffing plans:0 19 7 241 19 12 212 28 33 273 34 48 29AUTOTEAM, degree of autonomy for team-working, scoring pointsfor if any team-working, then extra points if team appoints ownteam-leaders, decides how work is done, has responsibility for specific products/services:0 24 14 281 5 3 62 28 29 283 37 49 334 5 4 6TROTHJ2, if some of employees from largest non-managerial occupational group are formally trained to jobs other than their own 69 67 69PCOFFJOB, percentage of experienced workers in largest non-managerial occupational group having formal off-the-jobtraining in the previous 12 months:None 24 5 301-19% 20 17 2220-39% 13 10 1440-59% 9 9 960-79% 8 10 780-99% 8 11 7100% 18 38 11ONGOING, if ongoing training is one of the main methods bywhich employees in the largest non-managerial occupational group are made aware of their job responsibilities 71 86 66SELECTIV, if skills, qualifications, experience and motivation allimportant in recruitment 54 71 49JOBSECUR, if policy of guaranteed job security, no compulsory redundancies 11 21 8EMPOWER, count based on whether largest non-managerialoccupational group at the workplace has a lot of variety in their work, discretion over how they do their work, and control over thepace at which they do their work:0 38 34 391 34 42 322 17 15 183 11 9 11APPRAISE, if 80% or more of non-managerial staff are formally appraised 53 49 55INTERPRO, if preference given to internal applicants, other things being equal, when filling vacancies 25 16 28SAMETERM, if management has same non-pay terms andconditions as employees in the largest non-managerialoccupational group 43 71 35PROFITPY, if workplace has a profit-related pay scheme 33 5 43PERFPAY, if workplace has performance-related pay scheme 18 12 20CASHBO, if workplace has cash bonuses 22 7 26ESOP, if workplace has an employee share option scheme 15 0 20

Collective bargaining and workplace performance
82
All Public Private
JCC, if workplace has a joint consultative committee dealing witha range of issues 20 31 17NONUCHAN, counts up to three direct non-union communicationchannels, based on: regular meetings with entire workforce; teambriefings involving identifiable work groups meeting at leastonce a month where at least some of the time is devoted toquestions from employees or employees offering their views;problem-solving groups such as quality circles 1.2 1.5 1.0REGMEET, if regular meetings with entire workforce present 42 53 38TBRIEF3, if team briefings involving identifiable work groupsmeeting at least once a month where at least some of the time isdevoted to questions from employees or employees offeringtheir views 42 59 37MANCHAIN, if systematic use of management chain or systematiccascading of information 54 74 47SUGGEST1, if suggestion scheme 24 29 23NEWSLET, if regular newsletter distributed to all employees 42 60 37OTHCONS, if other ways in which management communicates orconsults with employees 15 19 13PCQCIRC, proportion of non-managerial employees involved inproblem-solving groups/quality circles in last 12 months:None 70 61 731-19% 5 4 520-39% 7 6 740-79% 7 11 680% or more 12 17 10TARCON, if targets set in consultation with employees:Yes 45 58 40Targets set but no consultation 41 32 44No targets set 15 10 16STRATEGY, if workplace is covered by a formal strategic plan 74 93 68AWARD, if workplace or organisation to which it belongs has beenaccredited as an Investor in People 34 53 28GRIEVPRO, if formal procedure for dealing withindividual grievances 88 100 85FORMPROC, if formal procedure for dealing with collective disputes 50 85 38WRITPOL, if workplace has a formal written policy on equalopportunities or managing diversity 67 97 57
Base: all workplaces with 10 or more employees with non-missing data. Column 2 confined to public sector andcolumn 3 to private sector. Data weighted by probability of selection. Note: all column percentages, exceptHRMSCORE, NONUCHAN, which are mean scores.

Appendix tables
83
Appendix Table A4.2: ‘Baseline’ models estimating impact of bargaining arrangementson managerial perceptions of climate in the whole sample
(1) (2) (3) (4) (5) (6)mrelate3 mrelate3 mrelate3 mrelate3 mrelate3 mrelate3
Bargaining:Collective bargaining arrangements (ref: joint bargaining)
Single union 0.194 0.244 0.081 -0.030 0.088 0.028(1.18) (1.48) (0.50) (0.16) (0.49) (0.15)
Separate bargaining, each union 0.113 0.145 0.049 0.029 0.049 0.045(0.63) (0.87) (0.26) (0.15) (0.26) (0.24)
Separate bargaining, groups of unions -0.357 -0.248 -0.103 -0.122 -0.158 0.332
(1.37) (0.96) (0.41) (0.38) (0.44) (1.06)Multi-union, arrangement missing 0.485 0.495 0.309 0.225 0.253 -0.197
(1.03) (0.96) (0.60) (0.45) (0.51) (0.37)No recognition 0.252 0.308 0.138 0.117 0.264 0.231
(1.85) (1.54) (0.67) (0.54) (1.21) (1.04)
Bargaining coverage (ref: none)
100% -0.216 -0.122 -0.102 -0.100 -0.125(1.09) (0.61) (0.56) (0.56) (0.69)
80-99% -0.042 -0.015 -0.045 -0.100 -0.301(0.20) (0.07) (0.20) (0.46) (1.36)
60-79% 0.069 0.029 -0.042 -0.129 -0.120(0.26) (0.11) (0.18) (0.55) (0.52)
40-59% 0.486 0.412 0.375 0.380 0.311(1.79) (1.57) (1.53) (1.34) (1.03)
20-39% 0.326 0.308 0.405 0.335 0.293(1.52) (1.38) (1.93) (1.51) (1.25)
1-19% 0.510 0.463 0.429 0.408 0.306(1.72) (1.48) (1.51) (1.58) (1.02)
Respondent characteristics:
Female 0.055 -0.023 -0.051 -0.116(0.53) (0.23) (0.51) (1.13)
ER specialist -0.591 -0.536 -0.575 -0.487(5.24)** (4.46)** (4.45)** (3.67)**
Job tenure 6+ years 0.230 0.278 0.246 0.200(1.99)* (2.46)* (2.19)* (1.74)
Workforce composition:
% female 0.006 0.004 0.003(2.46)* (1.29) (1.08)
% part-time (ref: none)
Under 10% -0.525 -0.581 -0.617(3.34)** (3.85)** (4.01)**
10, < 25% -0.655 -0.646 -0.729(2.97)** (3.10)** (3.51)**
25, < 50% -0.360 -0.391 -0.415(1.73) (1.99)* (2.07)*
50, < 75% -0.159 -0.120 -0.087(0.74) (0.56) (0.40)
75%+ 0.218 0.379 0.401(0.93) (1.57) (1.62)

Collective bargaining and workplace performance
84
(1) (2) (3) (4) (5) (6)mrelate3 mrelate3 mrelate3 mrelate3 mrelate3 mrelate3
% non-white ethnic minority (ref: none)
Under 5% 0.037 -0.057 -0.067(0.36) (0.49) (0.55)
5-10% -0.208 -0.174 -0.283(1.20) (0.98) (1.62)
11-20% -0.614 -0.698 -0.735(2.40)* (2.76)** (2.90)**
Over 20% -0.341 -0.481 -0.495(1.47) (2.04)* (1.90)
Workplace characteristics:Workplace size (ref: 200-499 employees)
10-24 employees -0.347 -0.363(2.13)* (2.21)*
25-49 employees -0.108 -0.091(0.70) (0.60)
50-99 employees -0.201 -0.167(1.53) (1.28)
100-199 employees -0.142 -0.139(1.19) (1.12)
500 or more employees 0.197 0.212(1.62) (1.71)
Owner-managed 0.245 0.318(1.43) (1.89)
Public sector 0.010 -0.041(0.05) (0.20)
Country of ownership (ref: UK)Foreign-owned 0.150 0.133
(0.86) (0.72)50/50 ownership 1.686 1.659
(4.68)** (4.77)**Single independent workplace 0.007 0.074
(0.05) (0.52)
Standard industrial classification (ref: wholesale/retail dist.)
Manufacturing 0.004 0.089(0.02) (0.41)
Electricity, gas, water 1.005 1.012(3.64)** (3.80)**
Construction 0.102 0.248(0.39) (0.90)
Hotels and restaurants 0.385 0.473(1.74) (2.10)*
Transport and communication 0.124 0.212(0.54) (0.96)
Financial services 0.289 0.251(1.03) (0.87)
Other business services 0.217 0.343(1.14) (1.79)
Public administration 0.357 0.544(1.32) (1.99)*
Education 0.526 0.737(2.04)* (2.88)**

Appendix tables
85
(1) (2) (3) (4) (5) (6)mrelate3 mrelate3 mrelate3 mrelate3 mrelate3 mrelate3
Health 0.099 0.298(0.45) (1.31)
Other community services 0.283 0.453(1.11) (1.74)
Workplace activity (ref: produces goods or services for customers)
Supplier to other companies -0.106 -0.025(0.75) (0.18)
Supplier to other parts of the organisation 0.178 0.165(0.81) (0.71)
Does not produce for open market -0.084 -0.125(0.62) (0.87)
Adminstrative office 0.231 0.261(0.85) (1.00)
Age of workplace (ref: 3-20 years)
Under 3 years -0.217 -0.277(1.28) (1.55)
Over 20 years -0.211 -0.239(1.94) (2.27)*
Built on greenfield site in last 10 years 0.180 0.114(0.84) (0.51)
Standard statistical region (ref: rest of South East)
East Anglia 0.118 0.289(0.60) (0.220)
East Midlands 0.284 0.366(1.46) (1.77)
London 0.436 0.478(2.35)* (2.54)*
North 0.583 0.688(3.20)** (3.71)**
North West 0.456 0.448(2.58)* (2.44)*
Scotland 0.257 0.296(1.40) (1.57)
South West 0.000 0.092(0.00) (0.43)
Wales 0.577 0.625(2.41)* (2.64)**
West Midlands 0.377 0.554(1.85) (2.69)**
Yorks and Humberside 0.145 (1.48)(0.74) (1.12)
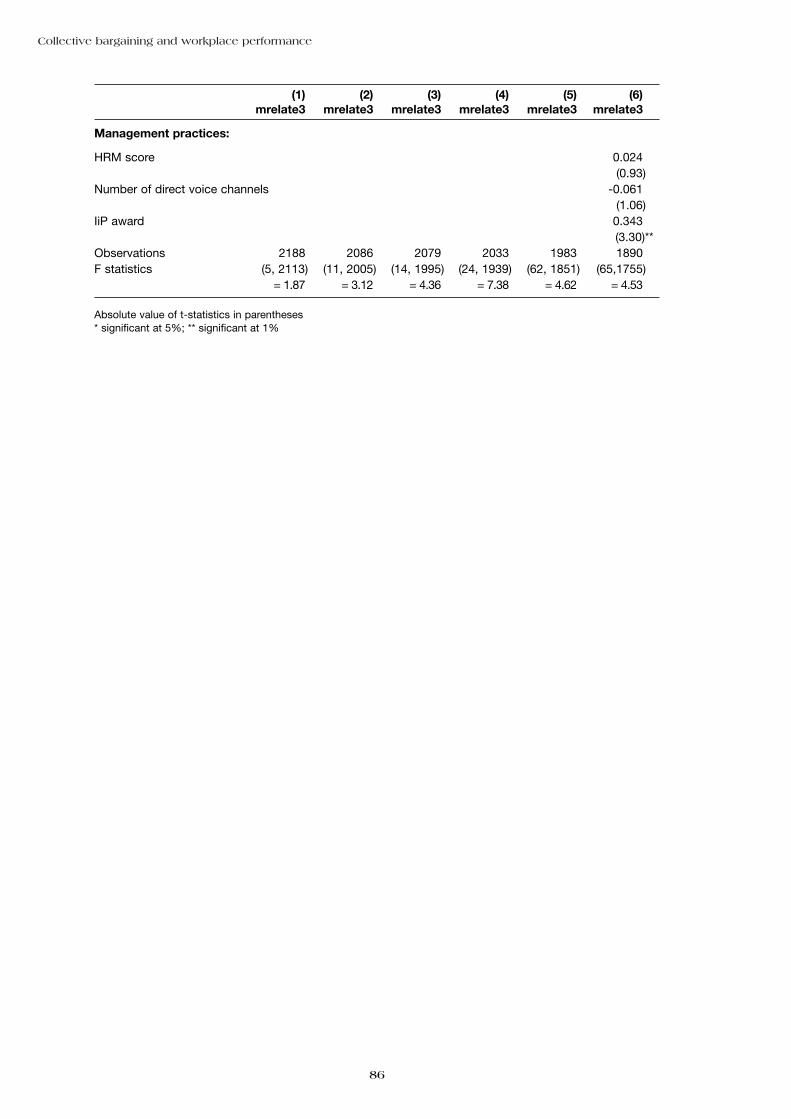
Collective bargaining and workplace performance
86
(1) (2) (3) (4) (5) (6)mrelate3 mrelate3 mrelate3 mrelate3 mrelate3 mrelate3
Management practices:
HRM score 0.024(0.93)
Number of direct voice channels -0.061(1.06)
IiP award 0.343(3.30)**
Observations 2188 2086 2079 2033 1983 1890F statistics (5, 2113) (11, 2005) (14, 1995) (24, 1939) (62, 1851) (65,1755)
= 1.87 = 3.12 = 4.36 = 7.38 = 4.62 = 4.53
Absolute value of t-statistics in parentheses* significant at 5%; ** significant at 1%
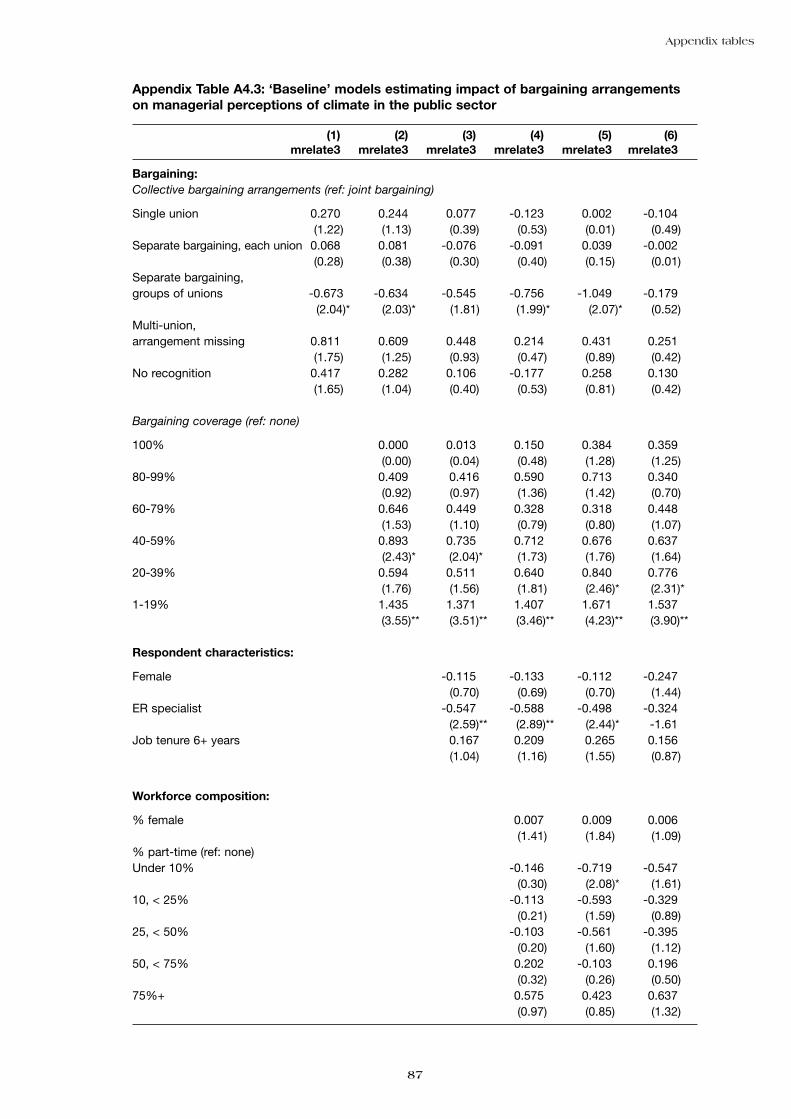
Appendix tables
87
Appendix Table A4.3: ‘Baseline’ models estimating impact of bargaining arrangementson managerial perceptions of climate in the public sector
(1)) (2)) (3)) (4)) (5)) (6))mrelate3) mrelate3) mrelate3) mrelate3) mrelate3) mrelate3)
Bargaining:Collective bargaining arrangements (ref: joint bargaining)
Single union 0.270) 0.244) 0.077) -0.123) 0.002) -0.104)(1.22) (1.13) (0.39) (0.53) (0.01) (0.49)
Separate bargaining, each union 0.068) 0.081) -0.076) -0.091) 0.039) -0.002)(0.28) (0.38) (0.30) (0.40) (0.15) (0.01)
Separate bargaining, groups of unions -0.673 -0.634) -0.545) -0.756) -1.049) -0.179)
(2.04)* (2.03)*) (1.81) (1.99)*) (2.07)* )(0.52)Multi-union, arrangement missing 0.811) 0.609) 0.448) 0.214) 0.431) 0.251)
(1.75) (1.25) (0.93) (0.47) (0.89) (0.42)No recognition 0.417) 0.282) 0.106) -0.177) 0.258) 0.130)
(1.65) (1.04) (0.40) (0.53) (0.81) (0.42)
Bargaining coverage (ref: none)
100% 0.000) 0.013) 0.150) 0.384) 0.359)(0.00) (0.04) (0.48) (1.28) (1.25)
80-99% 0.409) 0.416 0.590) 0.713) 0.340)(0.92) (0.97) (1.36) (1.42) (0.70)
60-79% 0.646) 0.449) 0.328) 0.318) 0.448)(1.53) (1.10) (0.79) (0.80) (1.07)
40-59% 0.893) 0.735) 0.712) 0.676) 0.637)(2.43)*) (2.04)*) (1.73) (1.76) (1.64)
20-39% 0.594) 0.511) 0.640) 0.840) 0.776)(1.76) (1.56) (1.81) (2.46)*) (2.31)*)
1-19% 1.435) 1.371) 1.407) 1.671) 1.537)(3.55)**) (3.51)**) (3.46)**) (4.23)**) (3.90)**)
Respondent characteristics:
Female -0.115) -0.133) -0.112) -0.247)(0.70) (0.69) (0.70) (1.44)
ER specialist -0.547) -0.588) -0.498) -0.324)(2.59)**) (2.89)**) (2.44)*) -1.61)
Job tenure 6+ years 0.167 0.209) 0.265 0.156)(1.04) (1.16) (1.55) (0.87)
Workforce composition:
% female 0.007) 0.009) 0.006)(1.41) (1.84) (1.09)
% part-time (ref: none)Under 10% -0.146) -0.719) -0.547)
(0.30) (2.08)*) (1.61)10, < 25% -0.113) -0.593) -0.329)
(0.21) (1.59) (0.89)25, < 50% -0.103) -0.561) -0.395)
(0.20) (1.60) (1.12)50, < 75% 0.202) -0.103) 0.196)
(0.32) (0.26) (0.50)75%+ 0.575) 0.423) 0.637)
(0.97) (0.85) (1.32)
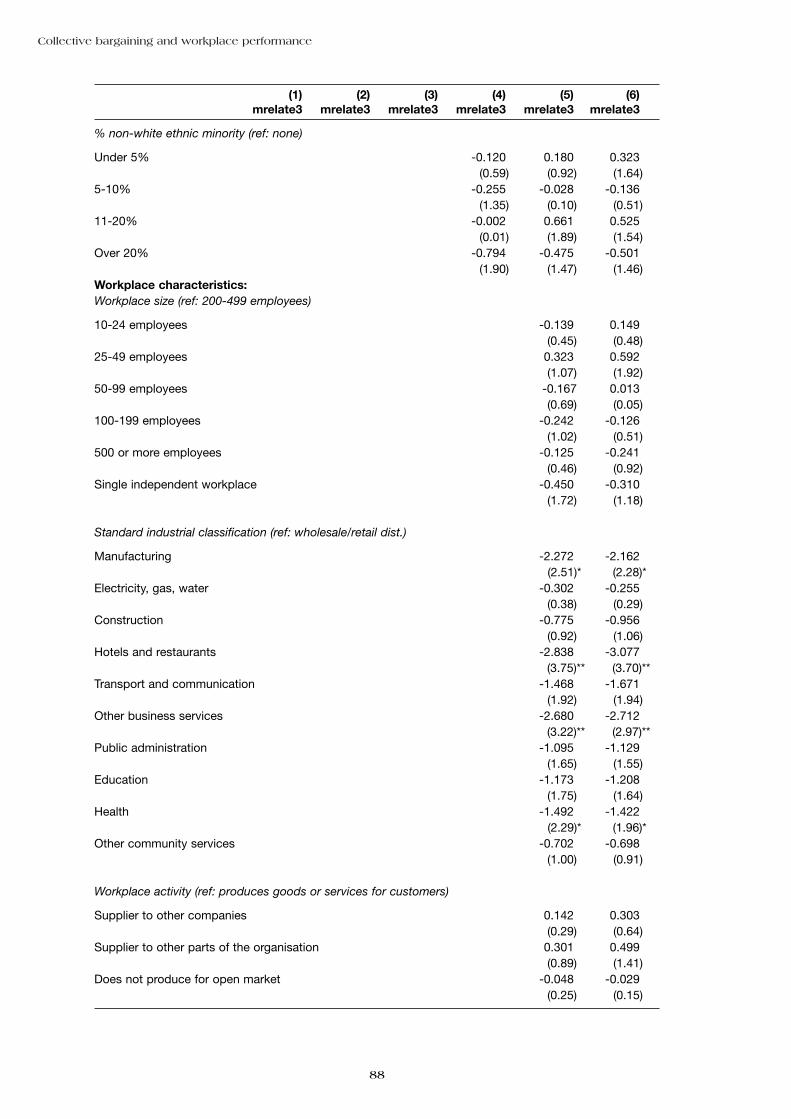
Collective bargaining and workplace performance
88
(1)) (2)) (3)) (4)) (5)) (6))mrelate3) mrelate3) mrelate3) mrelate3) mrelate3) mrelate3)
% non-white ethnic minority (ref: none)
Under 5% -0.120) 0.180) 0.323)(0.59) (0.92) (1.64)
5-10% -0.255) -0.028) -0.136)(1.35) (0.10) (0.51)
11-20% -0.002) 0.661) 0.525)(0.01) (1.89) (1.54)
Over 20% -0.794) -0.475) -0.501)(1.90) (1.47) (1.46)
Workplace characteristics:Workplace size (ref: 200-499 employees)
10-24 employees -0.139) 0.149)(0.45) (0.48)
25-49 employees 0.323) 0.592)(1.07) (1.92)
50-99 employees -0.167 0.013)(0.69) (0.05)
100-199 employees -0.242) -0.126)(1.02) (0.51)
500 or more employees -0.125) -0.241)(0.46) (0.92)
Single independent workplace -0.450) -0.310)(1.72) (1.18)
Standard industrial classification (ref: wholesale/retail dist.)
Manufacturing -2.272) -2.162)(2.51)*) (2.28)*)
Electricity, gas, water -0.302) -0.255)(0.38) (0.29)
Construction -0.775) -0.956)(0.92) (1.06)
Hotels and restaurants -2.838) -3.077)(3.75)**) (3.70)**)
Transport and communication -1.468) -1.671)(1.92) (1.94)
Other business services -2.680) -2.712)(3.22)**) (2.97)**)
Public administration -1.095) -1.129)(1.65) (1.55)
Education -1.173) -1.208)(1.75) (1.64)
Health -1.492) -1.422)(2.29)*) (1.96)*)
Other community services -0.702) -0.698)(1.00) (0.91)
Workplace activity (ref: produces goods or services for customers)
Supplier to other companies 0.142) 0.303)(0.29) (0.64)
Supplier to other parts of the organisation 0.301) 0.499)(0.89) (1.41)
Does not produce for open market -0.048) -0.029)(0.25) (0.15)
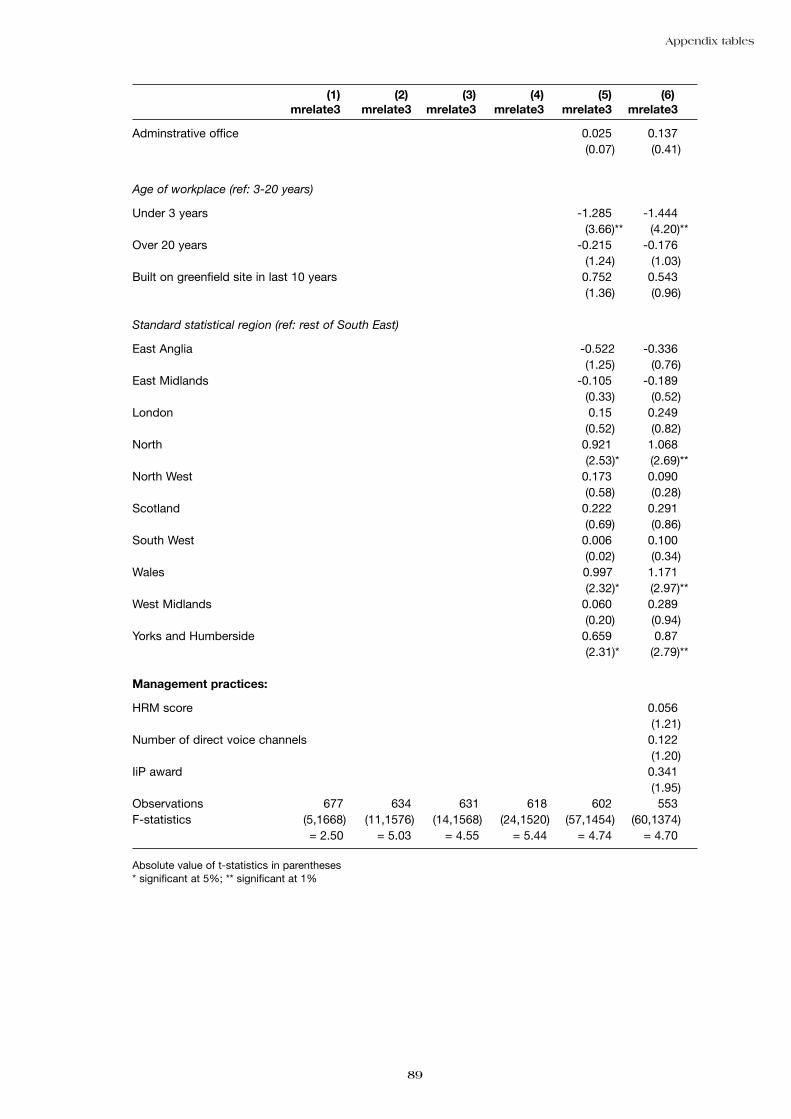
Appendix tables
89
(1)) (2)) (3)) (4)) (5)) (6)))mrelate3) mrelate3 mrelate3) mrelate3) mrelate3) mrelate3)
Adminstrative office 0.025) 0.137)(0.07) (0.41)
Age of workplace (ref: 3-20 years)
Under 3 years -1.285) -1.444)(3.66)**) (4.20)**)
Over 20 years -0.215) -0.176((1.24) (1.03)
Built on greenfield site in last 10 years 0.752) 0.543)(1.36) (0.96)
Standard statistical region (ref: rest of South East)
East Anglia -0.522 -0.336)(1.25) (0.76)
East Midlands -0.105) -0.189)(0.33) (0.52)
London 0.15) 0.249)(0.52) (0.82)
North 0.921) 1.068)(2.53)*) (2.69)**)
North West 0.173) 0.090)(0.58) (0.28)
Scotland 0.222) 0.291)(0.69) (0.86)
South West 0.006) 0.100)(0.02) (0.34)
Wales 0.997) 1.171)(2.32)*) (2.97)**)
West Midlands 0.060) 0.289)(0.20) (0.94)
Yorks and Humberside 0.659) 0.87)(2.31)*) (2.79)**)
Management practices:
HRM score 0.056)(1.21)
Number of direct voice channels 0.122)(1.20)
IiP award 0.341)(1.95)
Observations 677 634 631 618 602) 553)F-statistics (5,1668) (11,1576) (14,1568) (24,1520) (57,1454)) (60,1374)
= 2.50 = 5.03 = 4.55 = 5.44 = 4.74) = 4.70)
Absolute value of t-statistics in parentheses* significant at 5%; ** significant at 1%
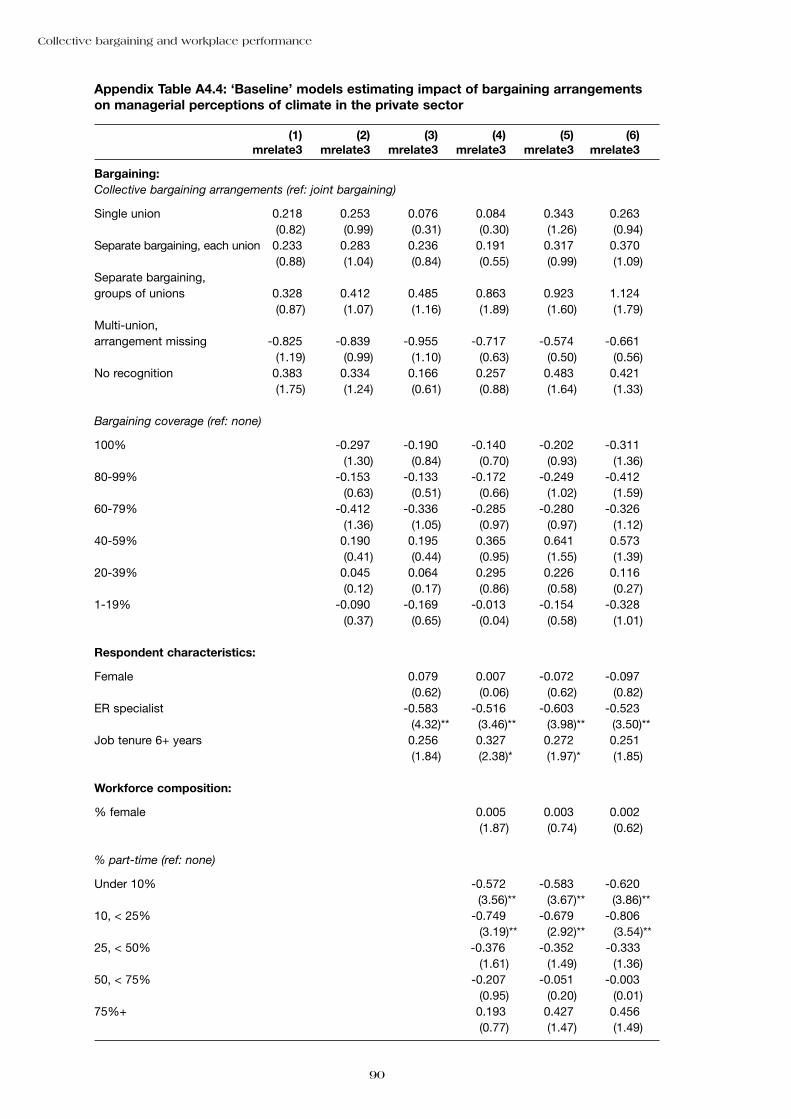
Collective bargaining and workplace performance
90
Appendix Table A4.4: ‘Baseline’ models estimating impact of bargaining arrangementson managerial perceptions of climate in the private sector
(1)) (2)) (3)) (4)) (5)) (6))mrelate3) mrelate3) mrelate3) mrelate3) mrelate3) mrelate3)
Bargaining:Collective bargaining arrangements (ref: joint bargaining)
Single union 0.218) 0.253) 0.076) 0.084) 0.343) 0.263)(0.82) (0.99) (0.31) (0.30) (1.26) (0.94)
Separate bargaining, each union 0.233) 0.283) 0.236) 0.191) 0.317) 0.370)(0.88) (1.04) (0.84) (0.55) (0.99) (1.09)
Separate bargaining, groups of unions 0.328) 0.412) 0.485) 0.863) 0.923) 1.124)
(0.87) (1.07) (1.16) (1.89) (1.60) (1.79)Multi-union, arrangement missing -0.825) -0.839) -0.955) -0.717) -0.574) -0.661)
(1.19) (0.99) (1.10) (0.63) (0.50) (0.56)No recognition 0.383) 0.334) 0.166) 0.257) 0.483) 0.421)
(1.75) (1.24) (0.61) (0.88) (1.64) (1.33)
Bargaining coverage (ref: none)
100% -0.297) -0.190) -0.140) -0.202) -0.311)(1.30) (0.84) (0.70) (0.93) (1.36)
80-99% -0.153) -0.133) -0.172) -0.249) -0.412)(0.63) (0.51) (0.66) (1.02) (1.59)
60-79% -0.412) -0.336) -0.285) -0.280) -0.326)(1.36) (1.05) (0.97) (0.97) (1.12)
40-59% 0.190) 0.195) 0.365) 0.641) 0.573)(0.41) (0.44) (0.95) (1.55) (1.39)
20-39% 0.045) 0.064) 0.295) 0.226) 0.116)(0.12) (0.17) (0.86) (0.58) (0.27)
1-19% -0.090) -0.169) -0.013) -0.154) -0.328)(0.37) (0.65) (0.04) (0.58) (1.01)
Respondent characteristics:
Female 0.079) 0.007) -0.072) -0.097)(0.62) (0.06) (0.62) (0.82)
ER specialist -0.583) -0.516) -0.603) -0.523)(4.32)**) (3.46)**) (3.98)**) (3.50)**)
Job tenure 6+ years 0.256) 0.327) 0.272) 0.251)(1.84) (2.38)*) (1.97)* (1.85)
Workforce composition:
% female 0.005) 0.003) 0.002)(1.87) (0.74) (0.62)
% part-time (ref: none)
Under 10% -0.572) -0.583) -0.620)(3.56)**) (3.67)**) (3.86)**)
10, < 25% -0.749) -0.679) -0.806)(3.19)**) (2.92)**) (3.54)**)
25, < 50% -0.376) -0.352) -0.333)(1.61) (1.49) (1.36)
50, < 75% -0.207) -0.051) -0.003)(0.95) (0.20) (0.01)
75%+ 0.193) 0.427) 0.456)(0.77) (1.47) (1.49)
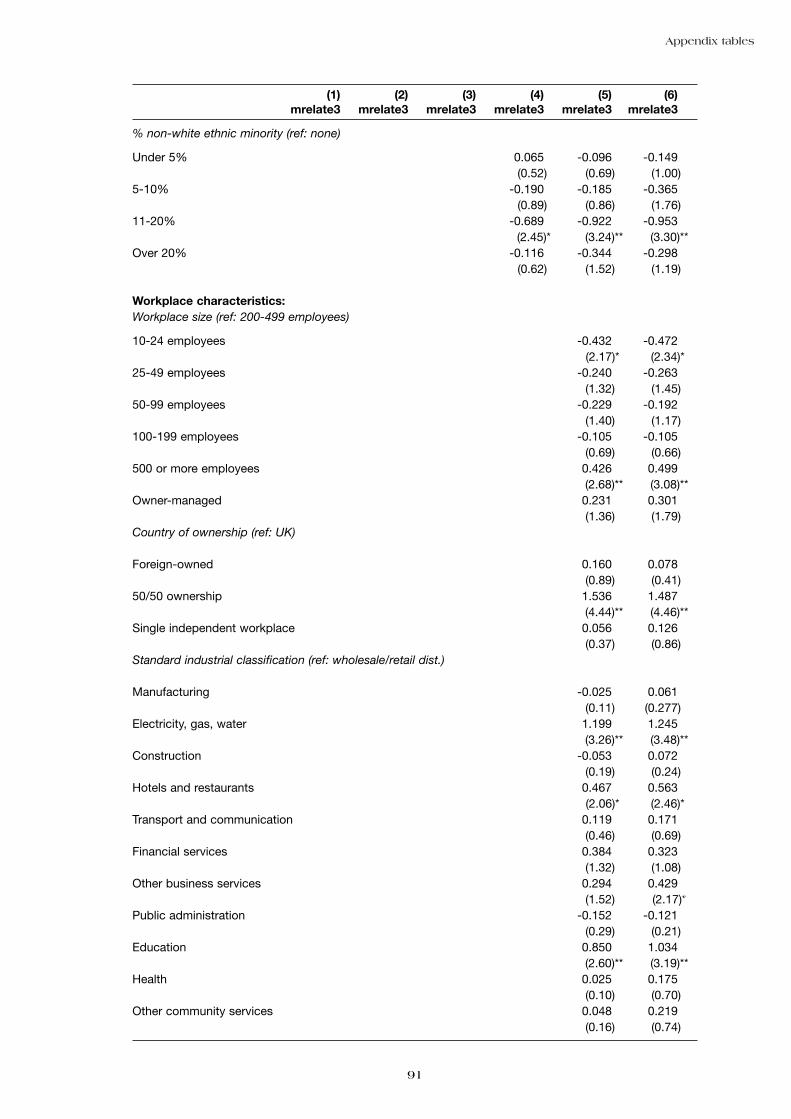
Appendix tables
91
(1)) (2)) (3)) (4)) (5)) (6))mrelate3) mrelate3) mrelate3) mrelate3) mrelate3) mrelate3)
% non-white ethnic minority (ref: none)
Under 5% 0.065) -0.096) -0.149)(0.52) (0.69) (1.00)
5-10% -0.190) -0.185) -0.365)(0.89) (0.86) (1.76)
11-20% -0.689) -0.922) -0.953)(2.45)*) (3.24)**) (3.30)**)
Over 20% -0.116) -0.344) -0.298)(0.62) (1.52) (1.19)
Workplace characteristics:Workplace size (ref: 200-499 employees)
10-24 employees -0.432) -0.472)(2.17)*) (2.34)*)
25-49 employees -0.240) -0.263)(1.32) (1.45)
50-99 employees -0.229) -0.192)(1.40) (1.17)
100-199 employees -0.105) -0.105)(0.69) (0.66)
500 or more employees 0.426) 0.499)(2.68)**) (3.08)**)
Owner-managed 0.231) 0.301)(1.36) (1.79)
Country of ownership (ref: UK)
Foreign-owned 0.160) 0.078)(0.89) (0.41)
50/50 ownership 1.536) 1.487)(4.44)**) (4.46)**)
Single independent workplace 0.056) 0.126)(0.37) (0.86)
Standard industrial classification (ref: wholesale/retail dist.)
Manufacturing -0.025) 0.061)(0.11) (0.277)
Electricity, gas, water 1.199) 1.245)(3.26)**) (3.48)**)
Construction -0.053) 0.072)(0.19) (0.24)
Hotels and restaurants 0.467) 0.563)(2.06)*) (2.46)*)
Transport and communication 0.119) 0.171)(0.46) (0.69)
Financial services 0.384) 0.323)(1.32) (1.08)
Other business services 0.294) 0.429)(1.52) (2.17)*)
Public administration -0.152) -0.121)(0.29) (0.21)
Education 0.850) 1.034)(2.60)**) (3.19)**)
Health 0.025) 0.175)(0.10) (0.70)
Other community services 0.048) 0.219)(0.16) (0.74)

Collective bargaining and workplace performance
92
(1)) (2)) (3)) (4)) (5)) (6))mrelate3) mrelate3) mrelate3) mrelate3) mrelate3) )mrelate3)
Workplace activity (ref: produces goods or services for customers)
Supplier to other companies -0.082) 0.001)(0.54) (0.01)
Supplier to other parts of the organisation 0.186) 0.139)(0.60) (0.43)
Does not produce for open market -0.123) -0.163)(0.59) (0.75)
Adminstrative office 0.587) 0.613)(2.15)*) (2.31)*)
Age of workplace (ref: 3-20 years)
Under 3 years 0.006) -0.031)(0.03) (0.17)
Over 20 years -0.219) -0.261)(1.62) (2.06)*)
Built on greenfield site in last 10 years 0.086) 0.066)(0.34) (0.25)
Standard statistical region (ref: rest of South East)
East Anglia 0.223) 0.427)(0.97) (1.94)
East Midlands 0.484) 0.570)(2.06)*) (2.41)*)
London 0.541) 0.566)(2.58)**) (2.65)**)
North 0.467) 0.550)(2.32)*) (2.77)**)
North West 0.492) 0.502)(2.32)*) (2.31)*)
Scotland 0.272) 0.320)(1.20) (1.41)
South West 0.006) 0.113)(0.02) (0.47)
Wales 0.466) 0.486)(1.64) (1.69)
West Midlands 0.419) 0.550)(1.74) (2.31)*)
Yorks and Humberside 0.108) 0.181)(0.46) (0.79)
Management practices:
HRM score 0.030)(1.07)
Number of direct voice channels -0.090)(1.31)
IiP award 0.354)(2.89)**)
Observations 1511 1452 1448 1415 1381 1337)F-statistics (5, 2016) (11,1916) (14,1906) (24,1855) (60,1771) (63,1680)
= 1.37) = 1.38) = 2.32) = 4.83) = 5.57) = 5.71))
Absolute value of t-statistics in parentheses* significant at 5%; ** significant at 1%
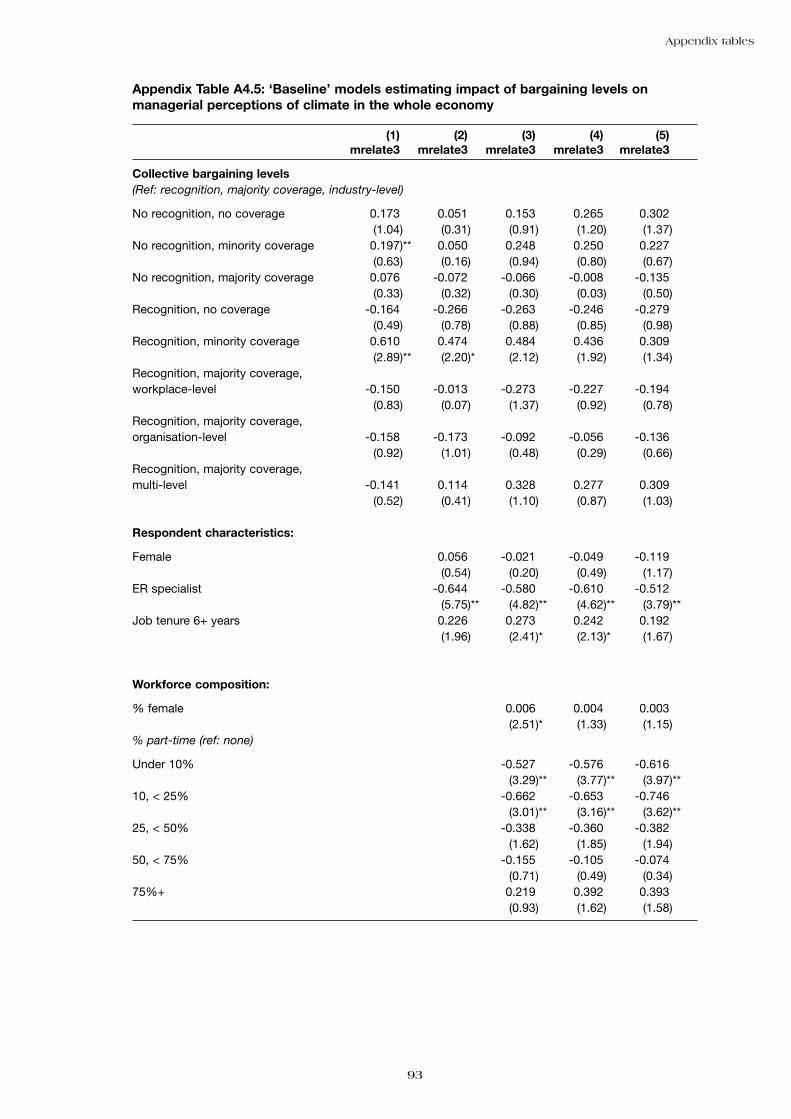
Appendix tables
93
Appendix Table A4.5: ‘Baseline’ models estimating impact of bargaining levels onmanagerial perceptions of climate in the whole economy
(1))** (2))** (3))** (4))** (5))**mrelate3)** mrelate3)** mrelate3)** mrelate3)** mrelate3)**
Collective bargaining levels (Ref: recognition, majority coverage, industry-level)
No recognition, no coverage 0.173)** 0.051)** 0.153)** 0.265)** 0.302)**(1.04)** (0.31)** (0.91)** (1.20)** (1.37)**
No recognition, minority coverage 0.197)** 0.050)** 0.248)** 0.250)** 0.227)**(0.63)** (0.16)** (0.94)** (0.80)** (0.67)**
No recognition, majority coverage 0.076)** -0.072)** -0.066)** -0.008)** -0.135)**(0.33)** (0.32)** (0.30)** (0.03)** (0.50)**
Recognition, no coverage -0.164)** -0.266)** -0.263)** -0.246)** -0.279)**(0.49)** (0.78)** (0.88)** (0.85)** (0.98)**
Recognition, minority coverage 0.610)** 0.474)** 0.484)** 0.436)** 0.309)**(2.89)** (2.20)** (2.12)** (1.92)** (1.34)**
Recognition, majority coverage, workplace-level -0.150)** -0.013)** -0.273)** -0.227)** -0.194)**
(0.83)** (0.07)** (1.37)** (0.92)** (0.78)**Recognition, majority coverage, organisation-level -0.158)** -0.173)** -0.092)** -0.056)** -0.136)**
(0.92)** (1.01)** (0.48)** (0.29)** (0.66)**Recognition, majority coverage, multi-level -0.141)** 0.114)** 0.328)** 0.277)** 0.309)**
(0.52)** (0.41)** (1.10)** (0.87)** (1.03)**
Respondent characteristics:
Female 0.056)** -0.021)** -0.049)** -0.119)**(0.54)** (0.20)** (0.49)** (1.17)**
ER specialist -0.644)** -0.580)** -0.610)** -0.512)**(5.75)** (4.82)** (4.62)** (3.79)**
Job tenure 6+ years 0.226)** 0.273)** 0.242)** 0.192)**(1.96)** (2.41)** (2.13)** (1.67)**
Workforce composition:
% female 0.006)** 0.004)** 0.003)**(2.51)** (1.33)** (1.15)**
% part-time (ref: none)
Under 10% -0.527)** -0.576)** -0.616)**(3.29)** (3.77)** (3.97)**
10, < 25% -0.662)** -0.653)** -0.746)**(3.01)** (3.16)** (3.62)**
25, < 50% -0.338)** -0.360)** -0.382)**(1.62)** (1.85)** (1.94)**
50, < 75% -0.155)** -0.105)** -0.074)**(0.71)** (0.49)** (0.34)**
75%+ 0.219)** 0.392)** 0.393)**(0.93)** (1.62)** (1.58)**
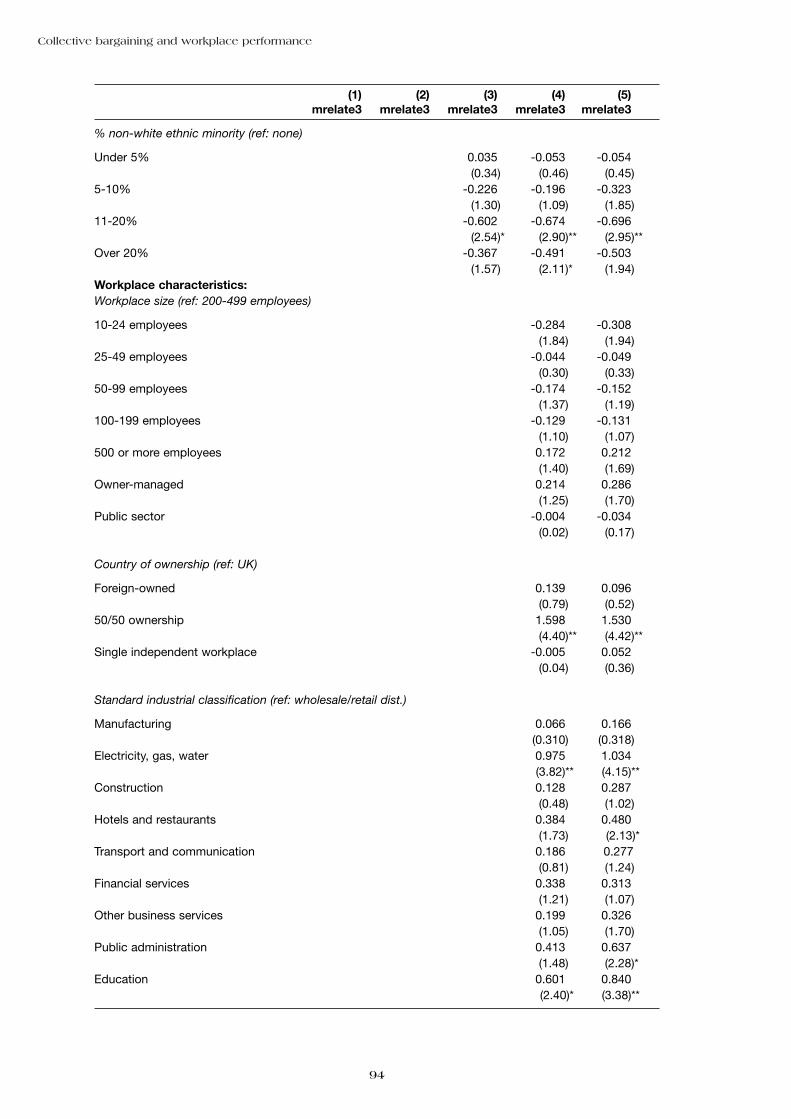
Collective bargaining and workplace performance
94
(1))** (2))** (3))** (4))** (5))**mrelate3)** mrelate3)** mrelate3)** mrelate3)** mrelate3)**
% non-white ethnic minority (ref: none)
Under 5% 0.035)** -0.053)** -0.054)**(0.34)** (0.46)** (0.45)**
5-10% -0.226)** -0.196**) -0.323)**(1.30)** (1.09)** (1.85)**
11-20% -0.602)** -0.674)** -0.696)**(2.54)** (2.90)** (2.95)**
Over 20% -0.367)** -0.491)** -0.503)**(1.57)** (2.11)** (1.94)**
Workplace characteristics:Workplace size (ref: 200-499 employees)
10-24 employees -0.284)** -0.308)**(1.84)** (1.94)**
25-49 employees -0.044)** -0.049)**(0.30)** (0.33)**
50-99 employees -0.174)** -0.152)**(1.37)** (1.19)**
100-199 employees -0.129)** -0.131)**(1.10)** (1.07)**
500 or more employees 0.172)** 0.212)**(1.40)** (1.69)**
Owner-managed 0.214)** 0.286)**(1.25)** (1.70)**
Public sector -0.004)** -0.034)**(0.02)** (0.17)**
Country of ownership (ref: UK)
Foreign-owned 0.139)** 0.096)**(0.79)** (0.52)**
50/50 ownership 1.598)** 1.530)**(4.40)** (4.42)**
Single independent workplace -0.005)** 0.052)**(0.04)** (0.36)**
Standard industrial classification (ref: wholesale/retail dist.)
Manufacturing 0.066)** 0.166)**(0.310)** (0.318)**
Electricity, gas, water 0.975)** 1.034)**(3.82)**) (4.15)**)
Construction 0.128)** 0.287)**(0.48)** (1.02)**
Hotels and restaurants 0.384)** 0.480)**(1.73)** (2.13)*)
Transport and communication 0.186)** 0.277)))(0.81)** (1.24)**
Financial services 0.338)** )0.313)**(1.21)** (1.07)**
Other business services 0.199)** 0.326)**(1.05)** (1.70)**
Public administration 0.413)** 0.637)**(1.48)** (2.28)**
Education 0.601)** 0.840)**(2.40)*) (3.38)**)
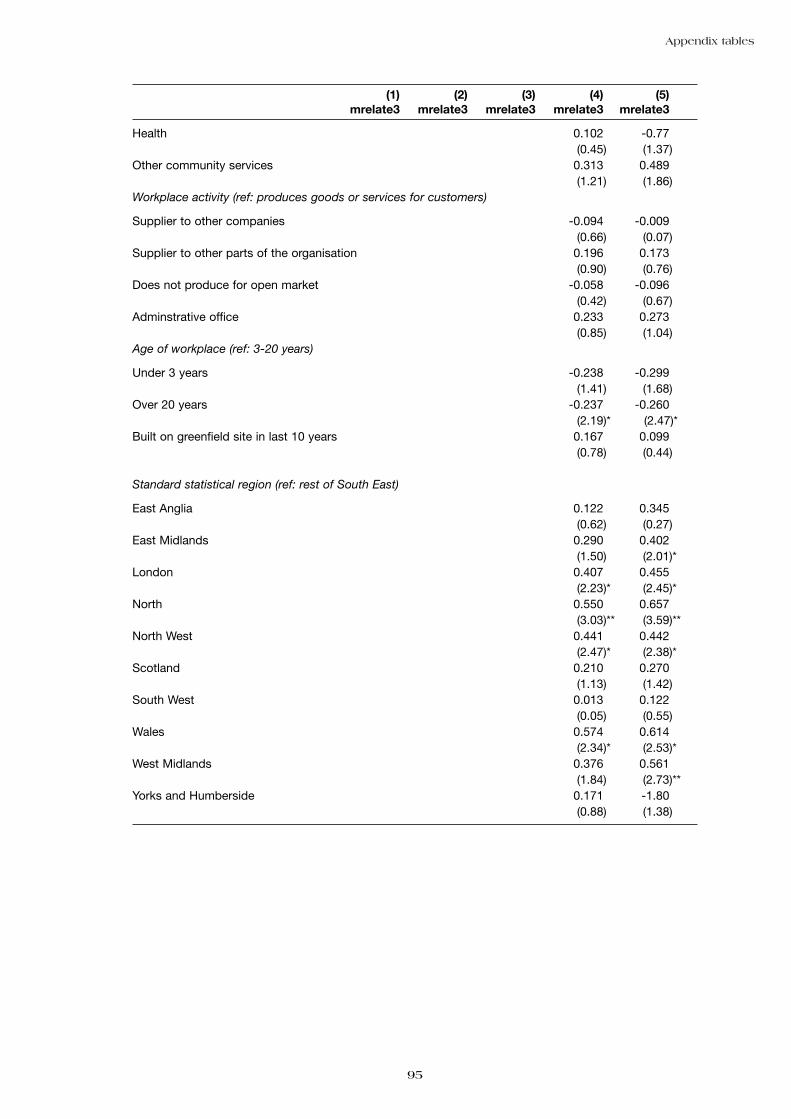
Appendix tables
95
(1))** (2))** (3))** (4))** (5))**mrelate3)** mrelate3)** mrelate3)** mrelate3)** mrelate3)**
Health 0.102)** -0.77)**(0.45)** (1.37)**
Other community services 0.313)** 0.489)**(1.21)** (1.86)**
Workplace activity (ref: produces goods or services for customers)
Supplier to other companies -0.094)** -0.009)**(0.66)** (0.07)**
Supplier to other parts of the organisation 0.196)** 0.173)**(0.90)** (0.76)**
Does not produce for open market -0.058)** -0.096)**(0.42)** (0.67)**
Adminstrative office 0.233)** 0.273)**(0.85)** (1.04)**
Age of workplace (ref: 3-20 years)
Under 3 years -0.238)** -0.299)**(1.41)** (1.68)**
Over 20 years -0.237)** -0.260)**(2.19)** (2.47)*)
Built on greenfield site in last 10 years 0.167)** 0.099)**(0.78)** (0.44)**
Standard statistical region (ref: rest of South East)
East Anglia 0.122)** 0.345)**(0.62)** (0.27)**
East Midlands 0.290)** 0.402)**(1.50)** (2.01)**
London 0.407)** 0.455)**(2.23)** (2.45)**
North 0.550)** 0.657)**(3.03)** (3.59)**
North West 0.441)** 0.442)**(2.47)** (2.38)**
Scotland 0.210)** 0.270)**(1.13)** (1.42)**
South West 0.013)** 0.122)**(0.05)** (0.55)**
Wales 0.574)** 0.614)**(2.34)** (2.53)**
West Midlands 0.376)** 0.561)**(1.84)** (2.73)**
Yorks and Humberside 0.171)** -1.80)**(0.88)** (1.38)**
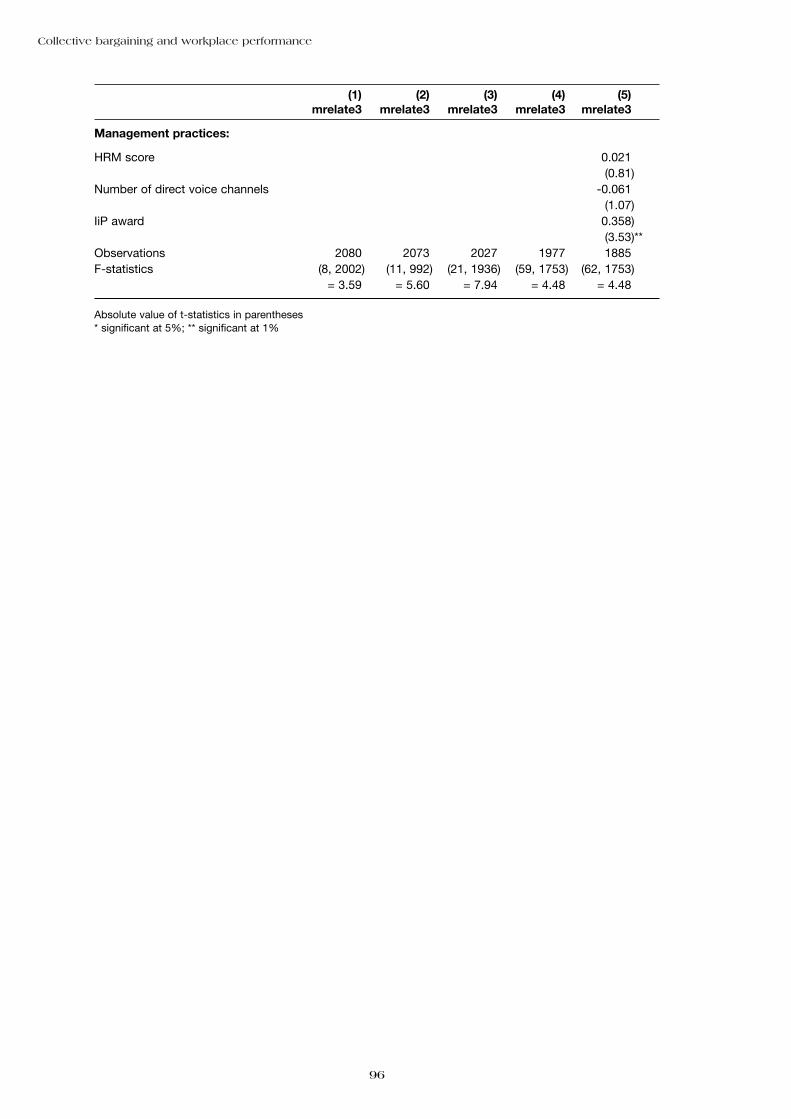
Collective bargaining and workplace performance
96
(1))** (2))** (3))** (4))** (5))**mrelate3)** mrelate3)** mrelate3)** mrelate3)** mrelate3)**
Management practices:
HRM score 0.021)**(0.81)**
Number of direct voice channels -0.061)**(1.07)**
IiP award 0.358)**(3.53)**
Observations 2080)** 2073)** 2027)** 1977)** 1885)**F-statistics (8, 2002)** (11, 992)** (21, 1936)** (59, 1753)** (62, 1753)**
= 3.59)** = 5.60)** = 7.94)** = 4.48)** = 4.48**)
Absolute value of t-statistics in parentheses* significant at 5%; ** significant at 1%
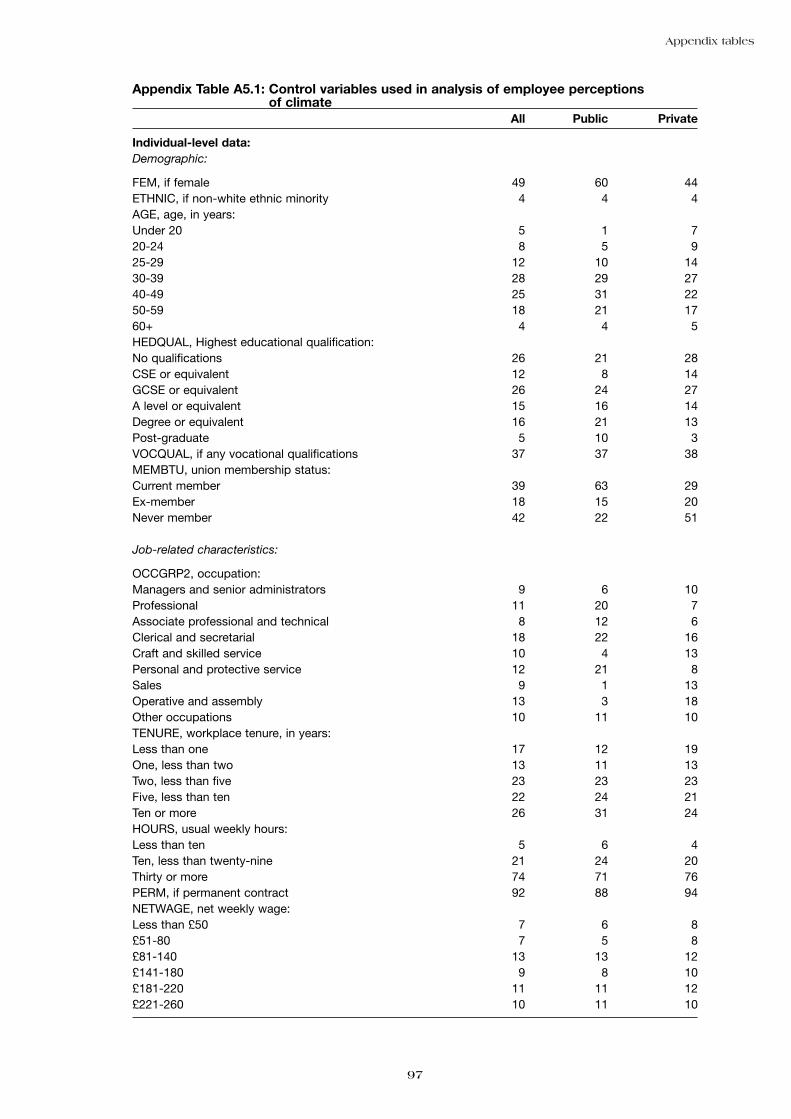
Appendix tables
97
Appendix Table A5.1: Control variables used in analysis of employee perceptions of climate
All Public Private
Individual-level data:Demographic:
FEM, if female 49 60 44ETHNIC, if non-white ethnic minority 4 4 4AGE, age, in years:Under 20 5 1 720-24 8 5 925-29 12 10 1430-39 28 29 2740-49 25 31 2250-59 18 21 1760+ 4 4 5HEDQUAL, Highest educational qualification:No qualifications 26 21 28CSE or equivalent 12 8 14GCSE or equivalent 26 24 27A level or equivalent 15 16 14Degree or equivalent 16 21 13Post-graduate 5 10 3VOCQUAL, if any vocational qualifications 37 37 38MEMBTU, union membership status:Current member 39 63 29Ex-member 18 15 20Never member 42 22 51
Job-related characteristics:
OCCGRP2, occupation:Managers and senior administrators 9 6 10Professional 11 20 7Associate professional and technical 8 12 6Clerical and secretarial 18 22 16Craft and skilled service 10 4 13Personal and protective service 12 21 8Sales 9 1 13Operative and assembly 13 3 18Other occupations 10 11 10TENURE, workplace tenure, in years:Less than one 17 12 19One, less than two 13 11 13Two, less than five 23 23 23Five, less than ten 22 24 21Ten or more 26 31 24HOURS, usual weekly hours:Less than ten 5 6 4Ten, less than twenty-nine 21 24 20Thirty or more 74 71 76PERM, if permanent contract 92 88 94NETWAGE, net weekly wage:Less than £50 7 6 8£51-80 7 5 8£81-140 13 13 12£141-180 9 8 10£181-220 11 11 12£221-260 10 11 10
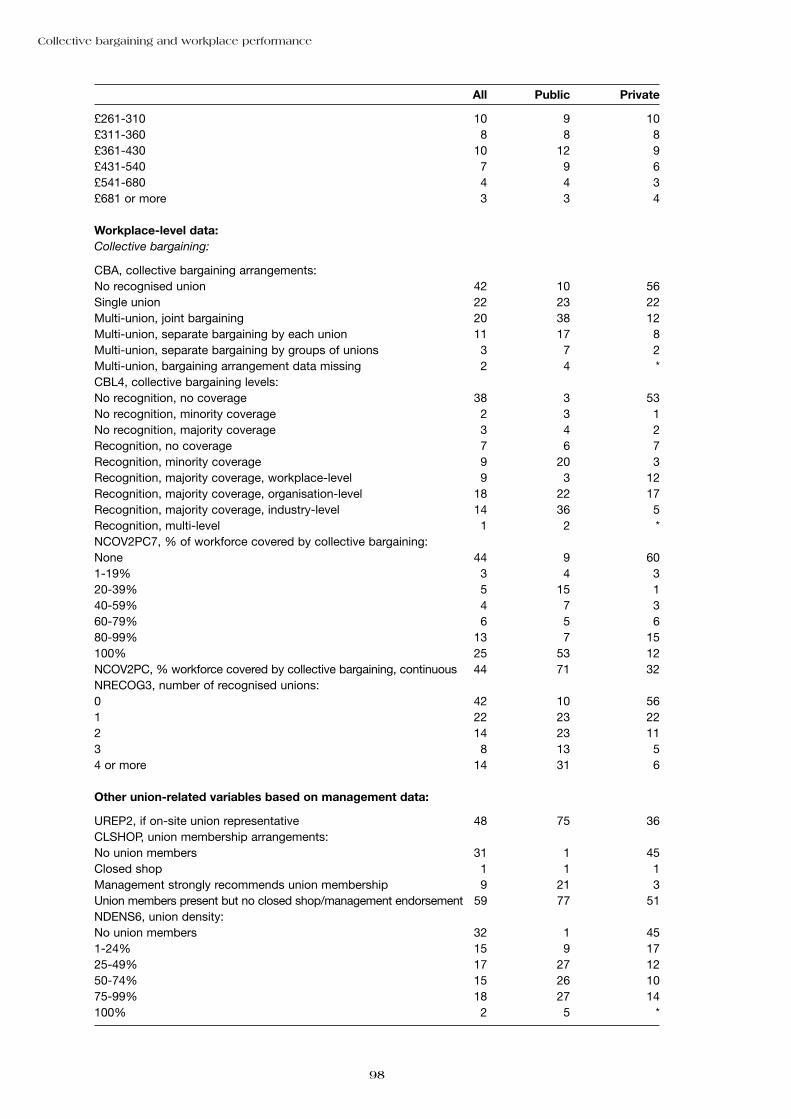
Collective bargaining and workplace performance
98
All Public Private
£261-310 10 9 10£311-360 8 8 8£361-430 10 12 9£431-540 7 9 6£541-680 4 4 3£681 or more 3 3 4
Workplace-level data:Collective bargaining:
CBA, collective bargaining arrangements:No recognised union 42 10 56Single union 22 23 22Multi-union, joint bargaining 20 38 12Multi-union, separate bargaining by each union 11 17 8Multi-union, separate bargaining by groups of unions 3 7 2Multi-union, bargaining arrangement data missing 2 4 *CBL4, collective bargaining levels:No recognition, no coverage 38 3 53No recognition, minority coverage 2 3 1No recognition, majority coverage 3 4 2Recognition, no coverage 7 6 7Recognition, minority coverage 9 20 3Recognition, majority coverage, workplace-level 9 3 12Recognition, majority coverage, organisation-level 18 22 17Recognition, majority coverage, industry-level 14 36 5Recognition, multi-level 1 2 *NCOV2PC7, % of workforce covered by collective bargaining:None 44 9 601-19% 3 4 320-39% 5 15 140-59% 4 7 360-79% 6 5 680-99% 13 7 15100% 25 53 12NCOV2PC, % workforce covered by collective bargaining, continuous 44 71 32NRECOG3, number of recognised unions:0 42 10 561 22 23 222 14 23 113 8 13 54 or more 14 31 6
Other union-related variables based on management data:
UREP2, if on-site union representative 48 75 36CLSHOP, union membership arrangements:No union members 31 1 45Closed shop 1 1 1Management strongly recommends union membership 9 21 3Union members present but no closed shop/management endorsement 59 77 51NDENS6, union density:No union members 32 1 451-24% 15 9 1725-49% 17 27 1250-74% 15 26 1075-99% 18 27 14100% 2 5 *
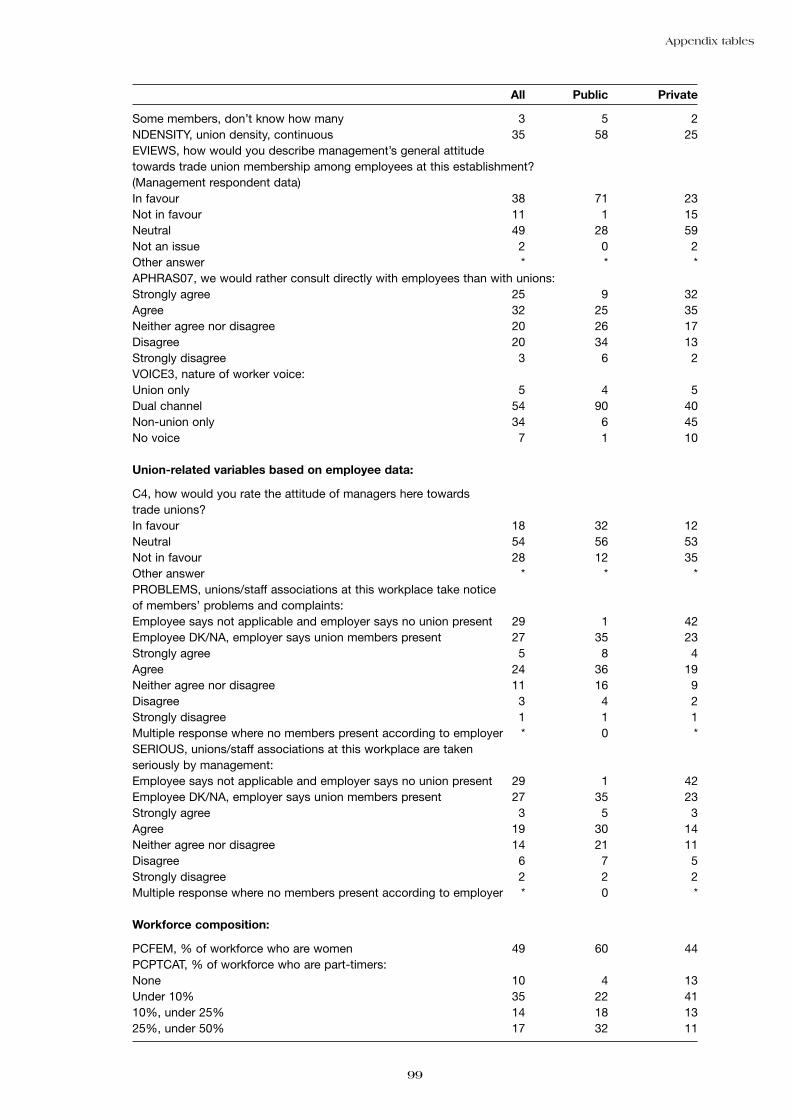
Appendix tables
99
All Public Private
Some members, don’t know how many 3 5 2NDENSITY, union density, continuous 35 58 25EVIEWS, how would you describe management’s general attitudetowards trade union membership among employees at this establishment?(Management respondent data)In favour 38 71 23Not in favour 11 1 15Neutral 49 28 59Not an issue 2 0 2Other answer * * *APHRAS07, we would rather consult directly with employees than with unions:Strongly agree 25 9 32Agree 32 25 35Neither agree nor disagree 20 26 17Disagree 20 34 13Strongly disagree 3 6 2VOICE3, nature of worker voice:Union only 5 4 5Dual channel 54 90 40Non-union only 34 6 45No voice 7 1 10
Union-related variables based on employee data:
C4, how would you rate the attitude of managers here towardstrade unions?In favour 18 32 12Neutral 54 56 53Not in favour 28 12 35Other answer * * *PROBLEMS, unions/staff associations at this workplace take noticeof members’ problems and complaints:Employee says not applicable and employer says no union present 29 1 42Employee DK/NA, employer says union members present 27 35 23Strongly agree 5 8 4Agree 24 36 19Neither agree nor disagree 11 16 9Disagree 3 4 2Strongly disagree 1 1 1Multiple response where no members present according to employer * 0 *SERIOUS, unions/staff associations at this workplace are takenseriously by management:Employee says not applicable and employer says no union present 29 1 42Employee DK/NA, employer says union members present 27 35 23Strongly agree 3 5 3Agree 19 30 14Neither agree nor disagree 14 21 11Disagree 6 7 5Strongly disagree 2 2 2Multiple response where no members present according to employer * 0 *
Workforce composition:
PCFEM, % of workforce who are women 49 60 44PCPTCAT, % of workforce who are part-timers:None 10 4 13Under 10% 35 22 4110%, under 25% 14 18 1325%, under 50% 17 32 11

Collective bargaining and workplace performance
100
All Public Private
50%, under 75% 16 20 1475% or more 7 4 9PCETHNI5, % of workforce from non-white ethnic minorities:None 37 34 38Under 5% 41 43 405-10% 10 10 1011-19% 6 6 720% or more 5 7 4PCMANFE2, % of managers who are women:None 22 16 25Under 50% 46 39 4950-99% 19 26 16All 7 10 6No managers at workplace 5 9 3NOCCS, number of occupations at the workplace 5.3 5.1 5.4NEMPSIZE, number of employees at workplace:10-24 13 9 1425-49 14 14 1550-99 15 12 16100-199 15 14 15200-499 20 17 22500 or more 24 34 19
Workplace ownership:
PUBLIC, if public sector 31 100 0SINGLE, if single independent workplace (as opposed to part of a multi-site organisation) 22 13 26UKFOR, UK or foreign-owned:UK-owned 86 100 80Foreign-owned 13 0 1850/50 1 0 2
Workplace activity, age and location:
ASIC, standard industrial classification (single digit):Manufacturing 23 * 34Electricity, gas and water 1 * 1Construction 3 3 3Wholesale and retail distribution 15 1 21Hotels and restaurants 4 1 6Transport and communication 6 6 6Financial services 4 0 6Other business services 8 2 11Public administration 9 28 *Education 10 27 3Health 13 27 7Other community services 3 4 3KACTIVI, activity at the workplace:Produce goods or services for customers 53 52 54Supplier of goods or services to other companies 22 3 31Supplier of goods/services to other parts of organisation 7 9 7Do not produce goods or services for sale in open market 14 32 6Administrative office only 4 5 3AGECAT2, age of establishment at current address:Under 3 years 8 6 83-20 years 41 30 46Over 20 years 51 64 46

Appendix tables
101
All Public Private
SSR, Standard statistical region:
East Anglia 5 5 5East Midlands 9 8 9London 10 12 9North 7 8 6North West 10 10 10Scotland 10 14 9Rest of South East 19 16 20South West 8 6 9Wales 4 6 3West Midlands 10 8 11Yorkshire and Humberside 8 6 9
Management practices:
SPECIAL, if main managerial respondent is an employee relations specialist 49 55 46HRMSCORE, count of 13 human resource management practices 7.5 7.7 7.4NINFO, number of items of information regularly given to employeesregarding internal investment plans, the financial position of theworkplace, and staffing plans:0 13 8 151 17 15 182 28 31 273 42 46 40AUTOTEAM, degree of autonomy for team-working, scoring pointsfor if any team-working, then extra points if team appoints ownteam-leaders, decides how work is done, has responsibility forspecific products/services:0 13 9 151 7 6 82 36 36 363 38 45 354 6 4 6TROTHJ2, if some of employees from largest non-managerial occupational group are formally trained to jobs other than their own 78 74 80PCOFFJOB, percentage of experienced workers in largestnon-managerial occupational group having formal off-the-jobtraining in the previous 12 months:None 13 4 161-19% 19 12 2320-39% 18 16 1940-59% 12 15 1160-79% 11 16 980-99% 12 15 11100% 15 22 12ONGOING, if ongoing training is one of the main methods bywhich employees in the largest non-managerial occupational group are made aware of their job responsibilities 69 88 61SELECTIV, if skills, qualifications, experience and motivation all important in recruitment 62 74 57JOBSECUR, if policy of guaranteed job security, no compulsory redundancies 15 25 10

Collective bargaining and workplace performance
102
All Public Private
EMPOWER, count based on whether largest non-managerial occupational group at the workplace has a lot of variety in theirwork, discretion over how they do their work, and control overthe pace at which they do their work:0 47 41 501 32 35 302 15 18 133 7 7 7APPRAISE, if 80% or more of non-managerial staff are formally appraised 57 51 60INTERPRO, if preference given to internal applicants, other things being equal, when filling vacancies 36 24 42SAMETERM, if management has same non-pay terms andconditions as employees in the largest non-managerialoccupational group 40 71 27PROFITPY, if workplace has a profit-related pay scheme 39 5 55PERFPAY, if workplace has performance-related pay scheme 27 25 28CASHBO, if workplace has cash bonuses 26 15 31ESOP, if workplace has an employee share option scheme 23 0 33JCC, if workplace has a joint consultative committee dealing witha range of issues 45 62 38NONUCHAN, counts up to three direct non-union communication channels, based on: regular meetings with entire workforce;team briefings involving identifiable work groups meeting at leastonce a month where at least some of the time is devoted toquestions from employees or employees offering their views;problem-solving groups such as quality circles 1.4 1.5 1.4REGMEET, if regular meetings with entire workforce present 35 38 34TBRIEF3, if team briefings involving identifiable work groupsmeeting at least once a month where at least some of the time is devoted to questions from employees or employees offeringtheir views 54 57 53MANCHAIN, if systematic use of management chain or systematic cascading of information 70 77 66SUGGEST1, if suggestion scheme 28 27 29NEWSLET, if regular newsletter distributed to all employees 65 79 58OTHCONS, if other ways in which management communicates or consults with employees 20 25 18PCQCIRC, proportion of non-managerial employees involved inproblem-solving groups/quality circles in last 12 months:None 52 51 531-19% 11 11 1120-39% 15 14 1640-79% 12 13 1180% or more 11 11 11TARCON, if targets set in consultation with employees:Yes 42 47 40Targets set but no consultation 49 44 52No targets set 9 10 9STRATEGY, if workplace is covered by a formal strategic plan 85 94 81AWARD, if workplace or organisation to which it belongs has been accredited as an Investor in People 35 39 34
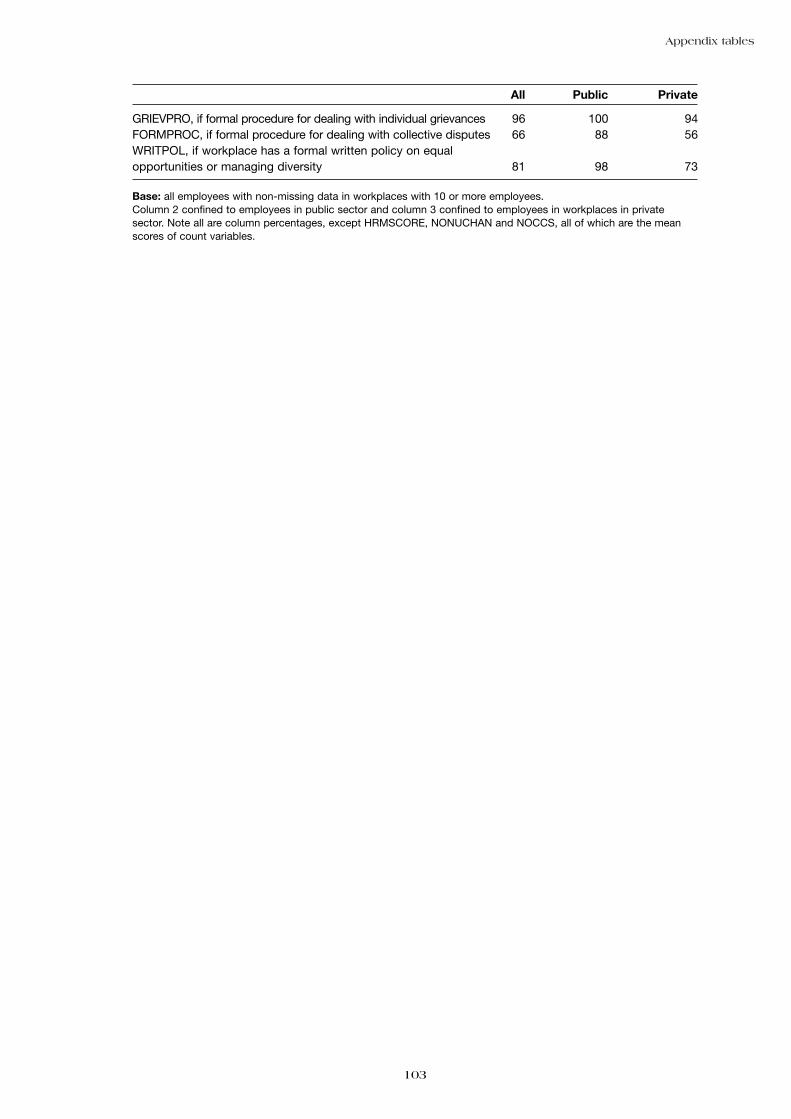
Appendix tables
103
All Public Private
GRIEVPRO, if formal procedure for dealing with individual grievances 96 100 94FORMPROC, if formal procedure for dealing with collective disputes 66 88 56WRITPOL, if workplace has a formal written policy on equal opportunities or managing diversity 81 98 73
Base: all employees with non-missing data in workplaces with 10 or more employees. Column 2 confined to employees in public sector and column 3 confined to employees in workplaces in privatesector. Note all are column percentages, except HRMSCORE, NONUCHAN and NOCCS, all of which are the meanscores of count variables.
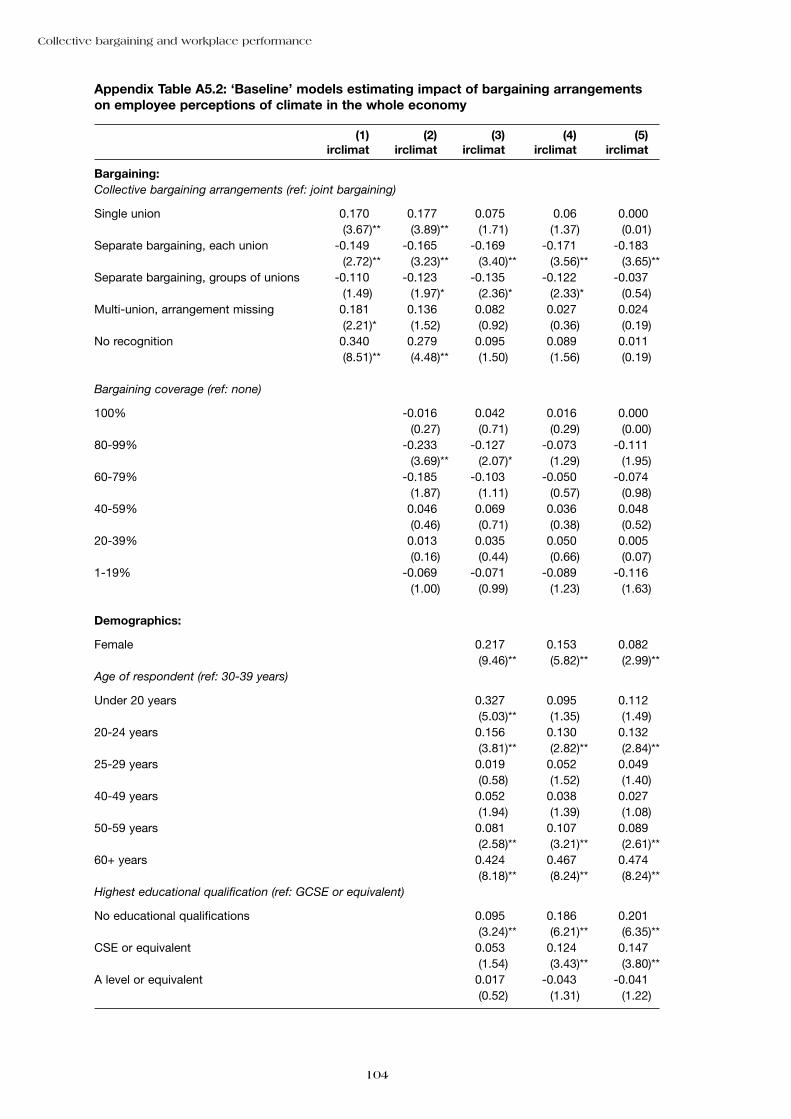
Collective bargaining and workplace performance
104
Appendix Table A5.2: ‘Baseline’ models estimating impact of bargaining arrangementson employee perceptions of climate in the whole economy
(1))** (2))** (3))** (4))** (5))**irclimat)** irclimat)** irclimat)** irclimat)** irclimat)**
Bargaining:Collective bargaining arrangements (ref: joint bargaining)
Single union 0.170)** 0.177)** 0.075)** 0.06)** 0.000)**(3.67)** (3.89)** (1.71)** (1.37)** (0.01)**
Separate bargaining, each union -0.149)** -0.165)** -0.169)** -0.171)** -0.183)**(2.72)** (3.23)** (3.40)** (3.56)** (3.65)**
Separate bargaining, groups of unions -0.110)** -0.123)** -0.135)** -0.122)** -0.037)**(1.49)** (1.97)** (2.36)** (2.33)** (0.54)**
Multi-union, arrangement missing 0.181)** 0.136)** 0.082)** 0.027)** 0.024)**(2.21)** (1.52)** (0.92)** (0.36)** (0.19)**
No recognition 0.340)** 0.279)** 0.095)** 0.089)** 0.011)**(8.51)** (4.48)** (1.50)** (1.56)** (0.19)**
Bargaining coverage (ref: none)
100% -0.016)** 0.042)** 0.016)** 0.000)**(0.27)** (0.71)** (0.29)** (0.00)**
80-99% -0.233)** -0.127)** -0.073)** -0.111)**(3.69)** (2.07)** (1.29)** (1.95)**
60-79% -0.185)** -0.103)** -0.050)** -0.074)**(1.87)** (1.11)** (0.57)** (0.98)**
40-59% 0.046)** 0.069)** 0.036)** 0.048)**(0.46)** (0.71)** (0.38)** (0.52)**
20-39% 0.013)** 0.035)** 0.050)** 0.005)**(0.16)** (0.44)** (0.66)** (0.07)**
1-19% -0.069)** -0.071)** -0.089)** -0.116)**(1.00)** (0.99)** (1.23)** (1.63)**
Demographics:
Female 0.217)** 0.153)** 0.082)**(9.46)** (5.82)** (2.99)**
Age of respondent (ref: 30-39 years)
Under 20 years 0.327)** 0.095)** 0.112)**(5.03)** (1.35)** (1.49)**
20-24 years 0.156)** 0.130)** 0.132)**(3.81)** (2.82)** (2.84)**
25-29 years 0.019)** 0.052)** 0.049)**(0.58)** (1.52)** (1.40)**
40-49 years 0.052)** 0.038)** 0.027)**(1.94)** (1.39)** (1.08)**
50-59 years 0.081)** 0.107)** 0.089)**(2.58)** (3.21)** (2.61)**
60+ years 0.424)** 0.467)** 0.474)**(8.18)** (8.24)** (8.24)**
Highest educational qualification (ref: GCSE or equivalent)
No educational qualifications 0.095)** 0.186)** 0.201)**(3.24)** (6.21)** (6.35)**
CSE or equivalent 0.053)** 0.124)** 0.147)**(1.54)** (3.43)** (3.80)**
A level or equivalent 0.017)** -0.043)** -0.041)**(0.52)** (1.31)** (1.22)**

Appendix tables
105
(1))** (2))** (3))** (4))** (5))**irclimat)** irclimat)** irclimat)** irclimat)** irclimat)**
Degree or equivalent 0.128)** -0.053)** -0.051)**(4.11)** (1.46)** (1.37)**
Post-graduate degree 0.167)** -0.114)** -0.132)**(4.05)** (2.46)** (2.70)**
Has vocational qualification -0.047)** -0.030)** -0.040)**(2.29)** (1.43)** (1.82)**
Member of non-white ethnic minority 0.050)** 0.062)** 0.139)**(1.02)** (1.13)** (2.24)**
Union membership (ref: current member)
Ex-member 0.183)** 0.072)** 0.100)**(5.93)** (2.32)** (3.14)**
Never member 0.335)** 0.199)** 0.237)**(11.63)** (6.65)** (7.70)**
Job characteristics:Occupational classification (ref: clerical and secretarial)
Managers and senior administrators 0.258)** 0.258)**(5.69)** (5.37)**
Professional 0.078)** -0.005)**(1.62)** (0.10)**
Associate professional and technical -0.018)** -0.018)**(0.39)** (0.35)**
Craft and skilled service -0.226)** -0.165)**(4.25)** (3.00)**
Personal and protective service 0.118)** 0.008)**(2.38)** (0.16)**
Sales -0.039)** 0.059)**(0.70)** (0.93)**
Operative and assembly -0.314)** -0.204)**(6.81)** (4.02)**
Other occupation -0.164)** -0.153)**(3.13)** (2.83)**
Workplace tenure (ref: 10+ years)
Less than one year 0.468)** 0.466)**(12.17)** (11.95)**
1, <2 years 0.206)** 0.208)**(5.12)** (5.08)**
2, <5 years 0.130)** 0.116)**(4.62)** (4.05)**
5, <10 years 0.036)** 0.032)**(1.23)** (1.06)**
Permanent employment contract -0.009)** 0.026)**(0.20)** (0.59)**
Usual weekly hours (ref: less than 10)
10, <29 hours -0.137)** -0.089)**(1.95)** (1.19)**
30+ hours -0.226)** -0.180)**(2.92)** (2.14)**
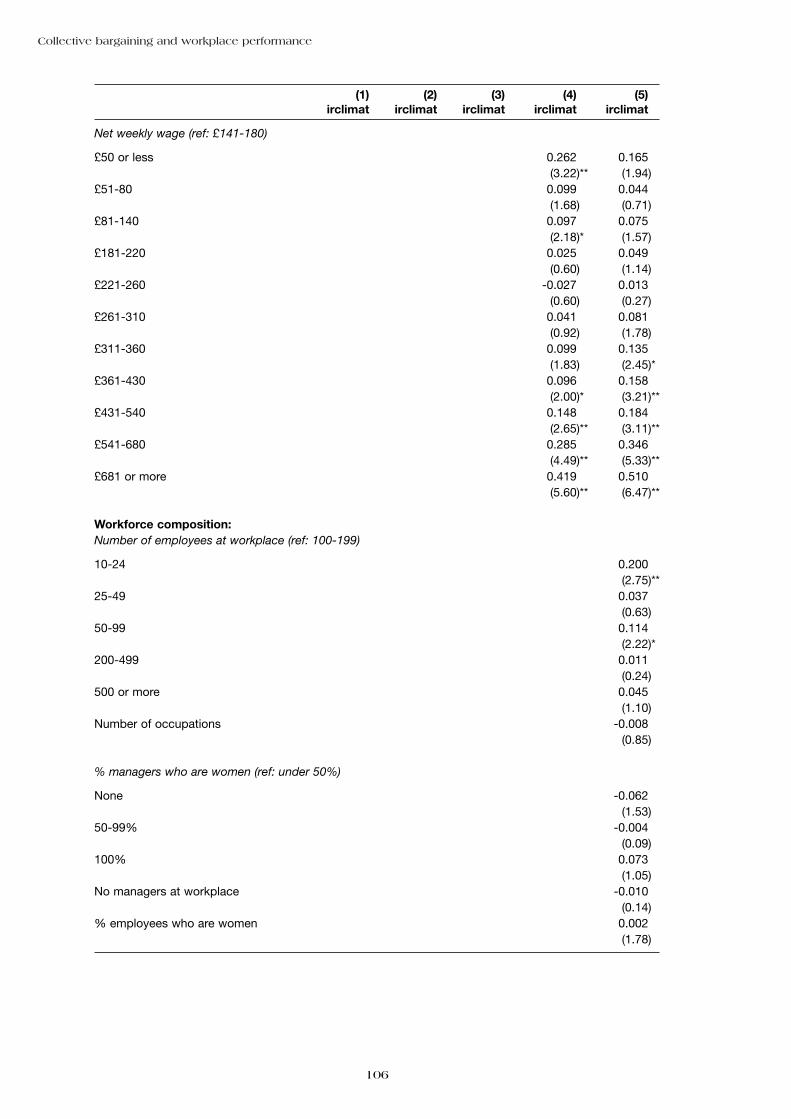
Collective bargaining and workplace performance
106
(1))** (2))** (3))** (4))** (5))**irclimat)** irclimat)** irclimat)** irclimat)** irclimat)**
Net weekly wage (ref: £141-180)
£50 or less 0.262)** 0.165)**(3.22)** (1.94)**
£51-80 0.099)** 0.044)**(1.68)** (0.71)**
£81-140 0.097)** 0.075)**(2.18)** (1.57)**
£181-220 0.025)** 0.049)**(0.60)** (1.14)**
£221-260 -0.027)** 0.013)**(0.60)** (0.27)**
£261-310 0.041)** 0.081)**(0.92)** (1.78)**
£311-360 0.099)** 0.135)**(1.83)** (2.45)**
£361-430 0.096)** 0.158)**(2.00)** (3.21)**
£431-540 0.148)** 0.184)**(2.65)** (3.11)**
£541-680 0.285)** 0.346)**(4.49)** (5.33)**
£681 or more 0.419)** 0.510)**(5.60)** (6.47)**
Workforce composition:Number of employees at workplace (ref: 100-199)
10-24 0.200)**(2.75)**
25-49 0.037)**(0.63)**
50-99 0.114)**(2.22)**
200-499 0.011)**(0.24)**
500 or more 0.045)**(1.10)**
Number of occupations -0.008)**(0.85)**
% managers who are women (ref: under 50%)
None -0.062)**(1.53)**
50-99% -0.004)**(0.09)**
100% 0.073)**(1.05)**
No managers at workplace -0.010)**(0.14)**
% employees who are women 0.002)**(1.78)**

Appendix tables
107
(1))** (2) (3))** (4))** (5))**irclimat)** irclimat irclimat)** irclimat)** irclimat)**
% employees working part-time (ref: under 10%)
None -0.043)**(0.81)**
10-24% -0.037)**(0.75)**
25-49% 0.017)**(0.28)**
50-74% 0.029)**(0.42)**
75% or more 0.079)**(0.93)**
% employees who are non-white (ref: none)
Under 5% -0.063)**(1.81)**
5-10% -0.104)**(1.81)**
11-19% -0.186)**(3.34)**
20% or more -0.174)**(2.19)**
Workplace characteristics:
Public sector -0.033)**(0.56)**
Place of ownership (ref: 100% UK)
Foreign-owned 0.064)**(1.34)**
50/50 0.221)**(2.20)**
Single independent workplace 0.026)**(0.62)**
Standard industrial classification (ref: manufacturing)
Electricity, gas and water 0.044)**(0.62)**
Construction 0.147)**(1.79)**
Wholesale and retail distribution -0.143)**(1.96)**
Hotels and restaurants 0.080)**(0.91)**
Transport and communication -0.065)**(1.03)**
Financial services 0.020)**(0.26)**
Other business services 0.070)**(1.03)**
Public administration 0.106)**(1.33)**
Education 0.189)**(2.21)**
Health 0.001)**(0.02)**

Collective bargaining and workplace performance
108
(1))** (2))** (3))** (4))** (5))**irclimat)** irclimat)** irclimat)** irclimat)** irclimat)**
Other community services 0.091)**(0.88)**
Workplace activity (ref: produces goods/services for customers)
Supplier to other companies -0.061)**(1.41)**
Supplier to other parts of organisation -0.006)**(0.11)**
Does not produce for open market 0.021)**(0.49)**
Administrative office only 0.054)**(0.75)**
Age of workplace at current address (ref: more than 20 years)
Under 3 years -0.115)**(1.70)**
Between 3 and 20 years 0.035)**(1.05)**
Respondent to managerial interview is an ER specialist -0.103)**(2.87)**
HRM score 0.010)**(1.12)**
Number of direct voice channels 0.014)**(0.84)**
IiP award 0.100)**(3.56)**
Region (ref: rest of South East)
East Anglia 0.043)**(0.62)**
East Midlands 0.114)**(1.93)**
London 0.117)**(1.97)**
North 0.063)**(0.96)**
North West 0.092)**(1.63)**
Scotland -0.031)**(0.51)**
South West 0.153)**(2.46)**
Wales 0.159)**(2.22)**
West Midlands 0.120)**(2.03)**
Yorkshire and Humberside 0.035)**(0.58)**
Observations 27691)** 26531)** 25767)** 24144)** 21688)**F-statistics (5,1706)** (11,1627)** (27,1611)** (53,1584)** (108,1350)**
= 27.93)** = 17.49)** = 25.74)** = 25.60)** = 15.54)**
Absolute value of t-statistics in parentheses* significant at 5%; ** significant at 1%

Appendix Table A5.3: ‘Baseline’ models estimating impact of bargaining arrangementson employee perceptions of climate in the public sector
(1))** (2))** (3))** (4))** (5))**irclimat)** irclimat)** irclimat)** irclimat)** irclimat)**
Bargaining:Collective bargaining arrangements (ref: joint bargaining)
Single union 0.210)** 0.175)** 0.134)** 0.109)** 0.005)**(2.68)** (2.17)** (1.79)** (1.47)** (0.07)**
Separate bargaining, each union -0.135)** -0.118)** -0.102)** -0.128)** -0.089)**(1.95)** (1.62)** (1.46)** (1.89)** (1.21)**
Separate bargaining, groups of unions -0.121)** -0.135)** -0.167)** -0.158)** -0.116)**(1.57)** (1.57)** (2.00)** (2.18)** (1.20)**
Multi-union, arrangement missing 0.121)** 0.110)** 0.094)** 0.044)** 0.143)**(1.33)** (1.16)** (0.99)** (0.55)** (1.11)**
No recognition 0.308)** 0.248)** 0.173)** 0.153)** 0.255)**(2.91)** (2.12)** (1.47)** (1.41)** (2.71)**
Bargaining coverage (ref: none)
100% -0.071)** -0.029)** -0.034)** 0.150)**(0.79)** (0.33)** (0.40)** (2.03)**
80-99% -0.111)** -0.067)** -0.038)** 0.111)**(1.00)** (0.58)** (0.36)** (1.00)**
60-79% 0.398)** 0.354)** 0.259)** 0.138)**(2.79)** (2.45)** (1.93)** (1.05)**
40-59% 0.114)** 0.121)** 0.043)** 0.213)**(0.72)** (0.82)** (0.28)** (1.65)**
20-39% -0.010)** 0.029)** 0.070)** 0.278)**(0.09)** (0.26)** (0.67)** (2.86)**
1-19% -0.132)** -0.135)** -0.165)** -0.120)**(0.99)** (0.98)** (1.30)** (1.03)**
Demographics:
Female 0.152)** 0.150)** 0.035)**(3.78)** (3.34)** (0.76)**
Age of respondent (ref: 30-39 years)
Under 20 years 0.416)** 0.284)** 0.334)**(1.74)** (1.21)** (1.31)**
20-24 years 0.112)** 0.023)** 0.086)**(1.35)** (0.25)** (1.02)**
25-29 years 0.029)** 0.021)** 0.005)**(0.43)** (0.31)** (0.07)**
40-49 years 0.066)** 0.042)** 0.042)**(1.59)** (1.01)** (1.13)**
50-59 years 0.182)** 0.208)** 0.196)**(3.43)** (3.87)** (3.42)**
60+ years 0.311)** 0.396)** 0.442)**(3.99)** (4.55)** (4.83)**
Highest educational qualification (ref: GCSE or equivalent)
No educational qualifications 0.089)** 0.148)** 0.184)**(1.70)** (2.81)** (3.10)**
CSE or equivalent 0.048)** 0.081)** 0.106)**(0.66)** (1.10)** (1.45)**
A level or equivalent -0.139)** -0.145)** -0.133)**(2.66)** (2.76)** (2.45)**
Appendix tables
109

Collective bargaining and workplace performance
110
(1))** (2))** (3))** (4))** (5))**irclimat)** irclimat)** irclimat)** irclimat)** irclimat)**
Degree or equivalent -0.051)** -0.140)** -0.101)**(1.07)** (2.53)** (1.74)**
Post-graduate degree -0.071)** -0.254)** -0.187)**(1.25)** (3.39)** (2.22)**
Has vocational qualification -0.010)** -0.002)** -0.005)**(0.30)** (0.05)** (0.13)**
Member of non-white ethnic minority 0.076)** 0.072)** 0.039)**(0.95)** (0.83)** (0.40)**
Union membership (ref: current member)
Ex-member 0.153)** 0.055)** 0.034)**(3.25)** (1.06)** (0.64)**
Never member 0.333)** 0.217)** 0.239)**(7.35)** (4.90)** (5.50)**
Job characteristics:Occupational classification (ref: clerical and secretarial)
Managers and senior administrators 0.340)** 0.390)**(4.19)** (4.36)**
Professional 0.107)** -0.035)**(1.40)** (0.46)**
Associate professional and technical -0.044)** -0.097)**(0.58)** (1.07)**
Craft and skilled service -0.186)** -0.014)**(1.91)** (0.14)**
Personal and protective service 0.153)** 0.052)**(2.25)** (0.71)**
Sales -0.162)** 0.150)**(0.49)** (0.42)**
Operative and assembly -0.148)** 0.004)**(1.14)** (0.04)**
Other occupation -0.209)** -0.245)**(2.10)** (2.59)**
Workplace tenure (ref: 10+ years)
Less than one year 0.538)** 0.485)**(8.98)** (7.36)**
1, <2 years 0.296)** 0.315)**(4.42)** (4.84)**
2, <5 years 0.187)** 0.168)**(3.76)** (3.16)**
5, <10 years 0.045)** 0.051)**(0.94)** (1.10)**
Permanent employment contract 0.027)** 0.004)**(0.39)** (0.06)**
Usual weekly hours (ref: less than 10)
10, <29 hours -0.086)** -0.053)**(0.77)** (0.46)**
30+ hours -0.120)** -0.184)**(0.93)** (1.35)**

Appendix tables
111
(1))** (2))** (3))** (4))** (5))**irclimat)** irclimat)** irclimat)** irclimat)** irclimat)**
Net weekly wage (ref: £141-180)
£50 or less 0.225)** 0.068)**(1.54)** (0.45)**
£51-80 0.195)** 0.165)**(1.79)** (1.51)**
£81-140 0.105)** 0.045)**(1.30)** (0.47)**
£181-220 0.067)** 0.084)**(0.79)** (0.99)**
£221-260 -0.109)** -0.029)**(1.26)** (0.33)**
£261-310 -0.055)** 0.059)**(0.62)** (0.66)**
£311-360 0.103)** 0.216)**(1.11)** (2.32)**
£361-430 -0.013)** 0.100)**(0.16)** (1.19)**
£431-540 0.064)** 0.127)**(0.65)** (1.28)**
£541-680 0.363)** 0.387)**(2.94)** (3.17)**
£681 or more 0.287)** 0.347)**(1.88)** (2.29)**
Workforce composition:Number of employees at workplace (ref: 100-199)
10-24 0.083)**(0.64)**
25-49 0.035)**(0.34)**
50-99 -0.019)**(0.21)**
200-499 -0.050)**(0.76)**
500 or more 0.021)**(0.35)**
Number of occupations -0.027)**(1.63)**
% managers who are women (ref: under 50%)
None 0.090)**(1.18)**
50-99% 0.003)**(0.06)**
100% 0.140)**(1.55)**
No managers at workplace 0.024)**(0.26)**
% employees who are women 0.006)**(3.74)**
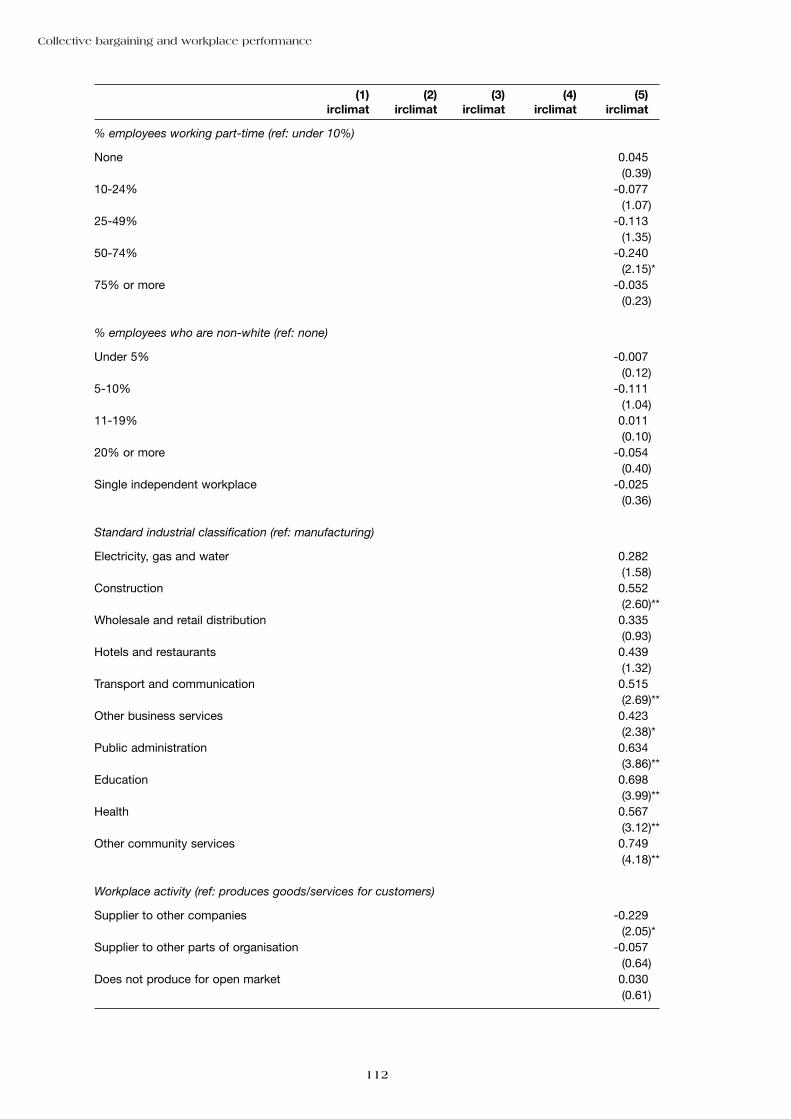
Collective bargaining and workplace performance
112
(1))** (2))** (3))** (4))** (5))**irclimat)** irclimat)** irclimat)** irclimat)** irclimat)**
% employees working part-time (ref: under 10%)
None 0.045)**(0.39)**
10-24% -0.077)**(1.07)**
25-49% -0.113)**(1.35)**
50-74% -0.240)**(2.15)**
75% or more -0.035)**(0.23)**
% employees who are non-white (ref: none)
Under 5% -0.007)**(0.12)**
5-10% -0.111)**(1.04)**
11-19% 0.011)**(0.10)**
20% or more -0.054)**(0.40)**
Single independent workplace -0.025)**(0.36)**
Standard industrial classification (ref: manufacturing)
Electricity, gas and water 0.282)**(1.58)**
Construction 0.552)**(2.60)**
Wholesale and retail distribution 0.335)**(0.93)**
Hotels and restaurants 0.439)**(1.32)**
Transport and communication 0.515)**(2.69)**
Other business services 0.423)**(2.38)**
Public administration 0.634)**(3.86)**
Education 0.698)**(3.99)**
Health 0.567)**(3.12)**
Other community services 0.749)**(4.18)**
Workplace activity (ref: produces goods/services for customers)
Supplier to other companies -0.229)**(2.05)**
Supplier to other parts of organisation -0.057)**(0.64)**
Does not produce for open market 0.030)**(0.61)**

Appendix tables
113
(1))** (2))** (3))** (4))** (5)**irclimat)** irclimat)** irclimat)** irclimat)** irclimat)**
Administrative office only -0.082)**(0.58)**
Age of workplace at current address (ref: more than 20 years)
Under 3 years -0.060)**(0.46)**
Between 3 and 20 years 0.101)**(1.75)**
Respondent to managerial interview is an ER specialist -0.067)**)* (1.17)**HRM score 0.009)**
(0.66)**Number of direct voice channels -0.016)**
(0.53)**IiP award 0.095)**
(1.97)**
Region (ref: rest of South East)
East Anglia 0.141)**(1.03)**
East Midlands 0.150)**(1.70)**
London -0.061)**(0.59)**
North 0.069)**(0.76)**
North West -0.062)**(0.64)**
Scotland 0.031)**(0.34)**
South West 0.235)**(2.03)**
Wales 0.099)**(1.20)**
West Midlands 0.204)**(2.32)**
Yorkshire and Humberside -0.058)**(0.53)**
Observations 9593)** 9040)** 8725)** 8209)** 6973)**F statistics (5,1293)** (11,1224)** (27,1208)** (53,1181)** (104, 991)**
= 5.70)** = 4.85)** = 7.13)** = 10.84)** = 25.91)**
Absolute value of t-statistics in parentheses* significant at 5%; ** significant at 1%

Collective bargaining and workplace performance
114
Appendix Table A5.4: ‘Baseline’ models estimating impact of bargaining arrangementson employee perceptions of climate in the private sector
(1))** (2))** (3))** (4))** (5))**irclimat)** irclimat)** irclimat)** irclimat)** irclimat)**
Bargaining:Collective bargaining arrangements (ref: joint bargaining)
Single union 0.237)** 0.204)** 0.033)** 0.018)** -0.012)**(4.04)** (3.69)** (0.58)** (0.30)** (0.19)**
Separate bargaining, each union -0.121)** -0.163)** -0.219)** -0.208)** -0.168)**(1.47)** (2.40)** (3.26)** (3.17)** (2.50)**
Separate bargaining, groups of unions -0.169)** -0.071)** -0.047)** -0.029)** 0.132)**(1.75)** (0.66)** (0.54)** (0.31)** (1.90)**
Multi-union, arrangement missing 0.134)** 0.068)** -0.051)** -0.147)** -0.120)**(0.62)** (0.32)** (0.21)** (0.68)** (0.55)**
No recognition 0.466)** 0.302)** 0.035)** 0.041)** -0.063)**(9.15)** (3.82)** (0.43)** (0.53)** (0.78)**
Bargaining coverage (ref: none)
100% -0.034)** 0.009)** 0.005)** -0.041)**(0.42)** (0.11)** (0.07)** (0.61)**
80-99% -0.258)** -0.170)** -0.129)** -0.170)**(3.41)** (2.32)** (1.94)** (2.58)**
60-79% -0.366)** -0.265)** -0.189)** -0.158)**(3.67)** (2.74)** (1.93)** (1.75)**
40-59% -0.062)** -0.025)** -0.017)** -0.042)**(0.42)** (0.18)** (0.13)** (0.31)**
20-39% -0.215)** -0.194)** -0.181)** -0.294)**(1.46)** (1.43)** (1.30)** (2.27)**
1-19% -0.058)** -0.063)** -0.053)** -0.139)**(0.71)** (0.78)** (0.63)** (1.40)**
Demographics:
Female 0.210)** 0.152)** 0.118)**(7.43)** (4.65)** (3.52)**
Age of respondent (ref: 30-39 years)
Under 20 years 0.339)** 0.122)** 0.116)**(4.85)** (1.58)** (1.41)**
20-24 years 0.164)** 0.172)** 0.159)**(3.50)** (3.27)** (2.99)**
25-29 years 0.028)** 0.067)** 0.062)**(0.75)** (1.69)** (1.54)**
40-49 years 0.041)** 0.028)** 0.030)**(1.20)** (0.79)** (0.93)**
50-59 years 0.027)** 0.050)** 0.047)**(0.70)** (1.22)** (1.14)**
60+ years 0.461)** 0.495)** 0.480)**(7.08)** (7.05)** (6.87)**
Highest educational qualification (ref: GCSE or equivalent)
No educational qualifications 0.115)** 0.211)** 0.206)**(3.24)** (5.81)** (5.49)**
CSE or equivalent 0.070)** 0.140)** 0.159)**(1.77)** (3.38)** (3.58)**
A level or equivalent 0.079)** -0.003)** -0.010)**(1.97)** (0.08)** (0.24)**
Degree or equivalent 0.199)** -0.020)** -0.035)**(4.91)** (0.43)** (0.73)**

Appendix tables
115
(1))** (2))** (3))** (4))** (5))**irclimat)** irclimat)** irclimat)** irclimat)** irclimat)**
Post-graduate degree 0.313)** -0.019)** -0.075)**(5.02)** (0.31)** (1.25)**
Has vocational qualification -0.064)** -0.049)** -0.054)**(2.55)** (1.93)** (2.04)**
Member of non-white ethnic minority 0.027)** 0.060)** 0.181)**(0.44)** (0.87)** (2.39)**
Union membership (ref: current member)
Ex-member 0.206)** 0.085)** 0.124)**(4.88)** (2.07)** (2.84)**
Never member 0.341)** 0.196)** 0.235)**(8.49)** (4.60)** (5.27)**
Job characteristics:Occupational classification (ref: clerical and secretarial)
Managers and senior administrators 0.241)** 0.226)**(4.47)** (3.96)**
Professional 0.078)** 0.052)**(1.22)** (0.81)**
Associate professional and technical 0.028)** 0.044)**(0.47)** (0.74)**
Craft and skilled service -0.214)** -0.172)**(3.60)** (2.80)**
Personal and protective service 0.029)** -0.040)**(0.37)** (0.52)**
Sales -0.019)** 0.066)**(0.33)** (0.99)**
Operative and assembly -0.304)** -0.205)**(6.09)** (3.77)**
Other occupation -0.142)** -0.116)**(2.34)** (1.90)**
Workplace tenure (ref: 10+ years)
Less than one year 0.442)** 0.465)**(9.22)** (9.97)**
1, <2 years 0.162)** 0.174)**(3.26)** (3.49)**
2, <5 years 0.095)** 0.101)**(2.85)** (2.99)**
5, <10 years 0.029)** 0.036)**(0.77)** (0.92)**
Permanent employment contract 0.004)** 0.039)**(0.06)** (0.67)**
Usual weekly hours (ref: less than 10)
10, <29 hours -0.104)** -0.090)**(1.18)** (0.96)**
30+ hours -0.214)** -0.148)**(2.22)** (1.43)**
Net weekly wage (ref: £141-180)
£50 or less 0.264)** 0.198)**(2.76)** (0.33)**
£51-80 0.065)** 0.026)**(0.91)** (0.36)**
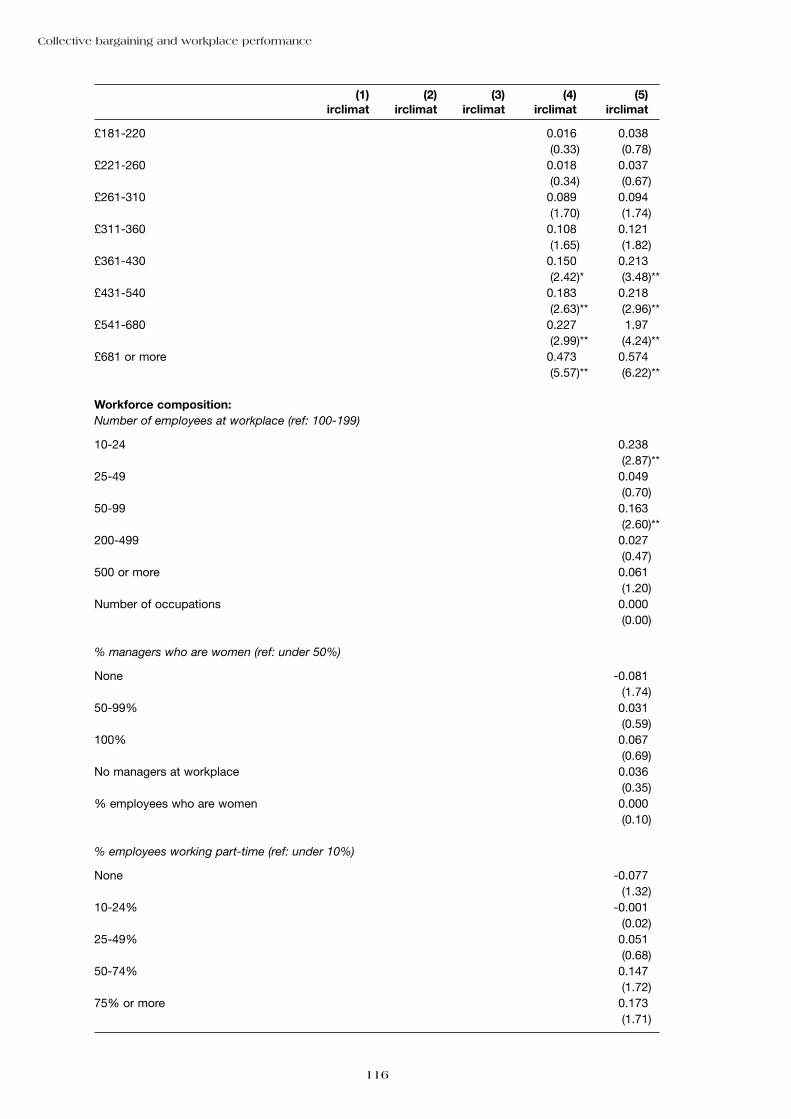
Collective bargaining and workplace performance
116
(1))** (2))** (3))** (4))** (5))**irclimat)** irclimat)** irclimat)** irclimat)** irclimat)**
£181-220 0.016)** 0.038)**(0.33)** (0.78)**
£221-260 0.018)** 0.037)**(0.34)** (0.67)**
£261-310 0.089)** 0.094)**(1.70)** (1.74)**
£311-360 0.108)** 0.121)**(1.65)** (1.82)**
£361-430 0.150)** 0.213)**(2.42)** (3.48)**
£431-540 0.183)** 0.218)**(2.63)** (2.96)**
£541-680 0.227)** 1.97)**(2.99)** (4.24)**
£681 or more 0.473)** 0.574)**(5.57)** (6.22)**
Workforce composition:Number of employees at workplace (ref: 100-199)
10-24 0.238)**(2.87)**
25-49 0.049)**(0.70)**
50-99 0.163)**(2.60)**
200-499 0.027)**(0.47)**
500 or more 0.061)**(1.20)**
Number of occupations 0.000)**(0.00)**
% managers who are women (ref: under 50%)
None -0.081)**(1.74)**
50-99% 0.031)**(0.59)**
100% 0.067)**(0.69)**
No managers at workplace 0.036)**(0.35)**
% employees who are women 0.000)**(0.10)**
% employees working part-time (ref: under 10%)
None -0.077)**(1.32)**
10-24% -0.001)**(0.02)**
25-49% 0.051)**(0.68)**
50-74% 0.147)**(1.72)**
75% or more 0.173)**(1.71)**
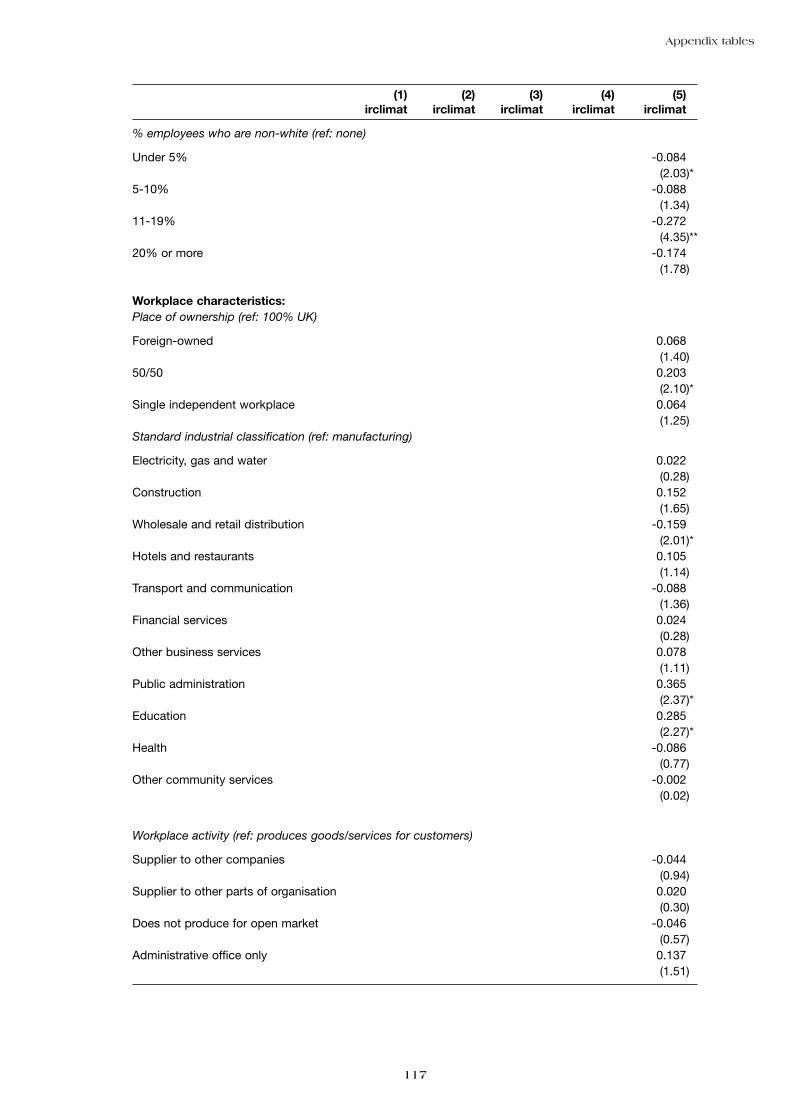
Appendix tables
117
(1))** (2))** (3))** (4))** (5))**irclimat)** irclimat)** irclimat)** irclimat)** irclimat)**
% employees who are non-white (ref: none)
Under 5% -0.084)**(2.03)**
5-10% -0.088)**(1.34)**
11-19% -0.272)**(4.35)**
20% or more -0.174)**(1.78)**
Workplace characteristics:Place of ownership (ref: 100% UK)
Foreign-owned 0.068)**(1.40)**
50/50 0.203)**(2.10)**
Single independent workplace 0.064)**(1.25)**
Standard industrial classification (ref: manufacturing)
Electricity, gas and water 0.022)**(0.28)**
Construction 0.152)**(1.65)**
Wholesale and retail distribution -0.159)**(2.01)**
Hotels and restaurants 0.105)**(1.14)**
Transport and communication -0.088)**(1.36)**
Financial services 0.024)**(0.28)**
Other business services 0.078)**(1.11)**
Public administration 0.365)**(2.37)**
Education 0.285)**(2.27)**
Health -0.086)**(0.77)**
Other community services -0.002)**(0.02)**
Workplace activity (ref: produces goods/services for customers)
Supplier to other companies -0.044)**(0.94)**
Supplier to other parts of organisation 0.020)**(0.30)**
Does not produce for open market -0.046)**(0.57)**
Administrative office only 0.137)**(1.51)**
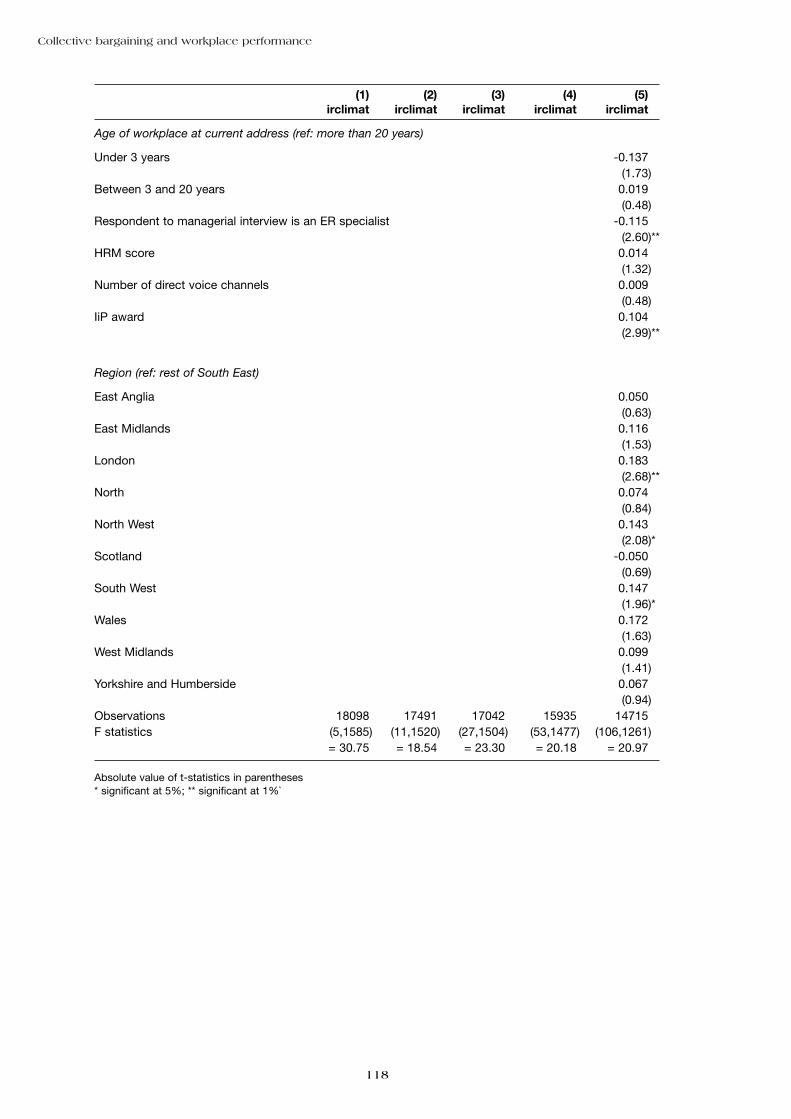
Collective bargaining and workplace performance
118
(1))** (2))** (3))** (4))** (5))**irclimat)** irclimat)** irclimat)** irclimat)** irclimat)**
Age of workplace at current address (ref: more than 20 years)
Under 3 years -0.137)**(1.73)**
Between 3 and 20 years 0.019)**(0.48)**
Respondent to managerial interview is an ER specialist -0.115)**(2.60)**
HRM score 0.014)**(1.32)**
Number of direct voice channels 0.009)**(0.48)**
IiP award 0.104)**(2.99)**
Region (ref: rest of South East)
East Anglia 0.050)**(0.63)**
East Midlands 0.116)**(1.53)**
London 0.183)**(2.68)**
North 0.074)**(0.84)**
North West 0.143)**(2.08)**
Scotland -0.050)**(0.69)**
South West 0.147)**(1.96)**
Wales 0.172)**(1.63)**
West Midlands 0.099)**(1.41)**
Yorkshire and Humberside 0.067)**(0.94)**
Observations 18098)** 17491)** 17042)** 15935)** 14715)**F statistics (5,1585)** (11,1520)** (27,1504)** (53,1477)** (106,1261)**
= 30.75)** = 18.54)** = 23.30)** = 20.18)** = 20.97)**
Absolute value of t-statistics in parentheses* significant at 5%; ** significant at 1%`

Appendix tables
119
Appendix Table A5.5: ‘Baseline’ models estimating impact of bargaining arrangementson employee perceptions of climate in the unionised sector
(1))** (2))** (3))** (4))** (5))**irclimat)** irclimat)** irclimat)** irclimat)** irclimat)**
Bargaining:Collective bargaining arrangements (ref: joint bargaining)
Single union 0.173)** 0.183)** 0.083)** 0.073)** 0.009)**(3.67)** (3.98)** (1.89)** (1.63)** (0.18)**
Separate bargaining, each union -0.152)** -0.169)** -0.169)** -0.174)** -0.178)**(2.72)** (3.24)** (3.37)** (3.60)** (3.55)**
Separate bargaining, groups of unions -0.112)** -0.124)** -0.136)** -0.128)** -0.054)**(1.48)** (1.91)** (2.27)** (2.37)** (0.75)**
Multi-union, arrangement missing 0.185)** 0.144)** 0.093)** 0.011)** -0.015)**(2.22)** (1.57)** (1.03)** (0.15)** (0.14)**
Bargaining coverage (ref: none)
100% -0.055)** -0.010)** -0.026)** 0.005)**(0.79)** (0.15)** (0.44)** (0.08)**
80-99% -0.264)** -0.167)** -0.107)** -0.093)**(3.68)** (2.34)** (1.70)** (1.39)**
60-79% -0.245)** -0.173)** -0.108)** -0.097)**(2.27)** (1.68)** (1.12)** (1.12)**
40-59% 0.062)** 0.058)** 0.016)** 0.089)**(0.62)** (0.57)** (0.16)** (0.86)**
20-39% 0.047)** 0.042)** 0.076)** 0.053)**(0.58)** (0.52)** (1.00)** (0.63)**
1-19% -0.116)** -0.155)** -0.163)** -0.164)**(1.22)** (1.59)** (1.61)** (1.77)**
Demographics:
Female 0.249)** 0.215)** 0.131)**(8.14)** (6.10)** (3.43)**
Age of respondent (ref: 30-39 years)
Under 20 years 0.201)** -0.004)** 0.018)**(2.11)** (0.04)** (0.18)**
20-24 years 0.096)** 0.080)** 0.079)**(1.66)** (1.25)** (1.19)**
25-29 years -0.001)** 0.025)** 0.024)**(0.02)** (0.53)** (0.48)**
40-49 years 0.052)** 0.022)** 0.011)**(1.51)** (0.64)** (0.38)**
50-59 years 0.131)** 0.144)** 0.129)**(3.18)** (3.31)** (2.91)**
60+ years 0.372)** 0.423)** 0.429)**(5.03)** (5.36)** (5.33)**
Highest educational qualification (ref: GCSE or equivalent)
No educational qualifications 0.041)** 0.151)** 0.165)**(1.10)** (3.93)** (3.90)**
CSE or equivalent -0.026)** 0.032)** 0.036)**(0.55)** (0.62)** (0.63)**
A level or equivalent -0.063)** -0.091)** -0.080)**(1.37)** (1.96)** (1.67)**
Degree or equivalent 0.058)** -0.111)** -0.091)**(1.46)** (2.52)** (1.99)**

Collective bargaining and workplace performance
120
(1))** (2))** (3))** (4))** (5))**irclimat)** irclimat)** irclimat)** irclimat)** irclimat)**
Post-graduate degree 0.030)** -0.241)** -0.231)**(0.64)** (4.25)** (3.59)**
Has vocational qualification -0.005)** 0.008)** 0.012)**(0.20)** (0.28)** (0.40)**
Member of non-white ethnic minority 0.121)** 0.110)** 0.161)**(1.85)** (1.44)** (1.86)**
Union membership (ref: current member)
Ex-member 0.197)** 0.062)** 0.077)**(4.90)** (1.57)** (1.85)**
Never member 0.351)** 0.186)** 0.201)**(9.83)** (5.07)** (5.30)**
Job characteristics:Occupational classification (ref: clerical and secretarial)
Managers and senior administrators 0.300)** 0.335)**(4.65)** (4.74)**
Professional 0.051)** -0.039)**(0.83)** (0.60)**
Associate professional and technical -0.072)** -0.101)**(1.12)** (1.38)**
Craft and skilled service -0.207)** -0.169)**(3.02)** (2.24)**
Personal and protective service 0.195)** 0.116)**(3.03)** (1.77)**
Sales -0.173)** 0.042)**(2.24)** (0.50)**
Operative and assembly -0.275)** -0.215)**(4.52)** (3.21)**
Other occupation -0.263)** -0.209)**(3.33)** (2.57)**
Workplace tenure (ref: 10+ years)
Less than one year 0.510)** 0.506)**(10.17)** (9.63)**
1, <2 years 0.251)** 0.249)**(4.56)** (4.15)**
2, <5 years 0.164)** 0.149)**(4.63)** (4.00)**
5, <10 years 0.029)** 0.036)**(0.76)** (0.90)**
Permanent employment contract 0.016)** -0.003)**(0.29)** (0.06)**
Usual weekly hours (ref: less than 10)
10, <29 hours -0.083)** 0.029)**(0.87)** (0.29)**
30+ hours -0.116)** -0.014)**(1.11)** (0.13)**
Net weekly wage (ref: £141-180) )**
£50 or less 0.373)** 0.312)**(3.01)** (2.48)**
£51-80 0.167)** 0.117)**(2.01)** (1.40)**

Appendix tables
121
(1))** (2))** (3))** (4))** (5))**irclimat)** irclimat)** irclimat)** irclimat)** irclimat)**
£81-140 0.046)** 0.017)**(0.76)** (0.25)**
£181-220 0.006)** 0.006)**(0.12)** (0.10)**
£221-260 -0.105)** -0.097)**(1.85)** (1.67)**
£261-310 0.008)** 0.046)**(0.15)** (0.78)**
£311-360 0.057)** 0.076)**(0.80)** (1.08)**
£361-430 0.043)** 0.100)**(0.71)** (1.66)**
£431-540 0.095)** 0.081)**(1.33)** (1.13)**
£541-680 0.316)** 0.297)**(3.75)** (3.60)**
£681 or more 0.441)** 0.466)**(3.97)** (4.21)**
Workforce composition:Number of employees at workplace (ref: 100-199)
10-24 0.132)**(1.24)**
25-49 0.057)**(0.68)**
50-99 0.153)**(2.28)**
200-499 0.028)**(0.50)**
500 or more 0.034)**(0.75)**
Number of occupations -0.013)**(1.17)**
% managers who are women (ref: under 50%)
None -0.034)**(0.65)**
50-99% 0.007)**(0.13)**
100% 0.164)**(1.89)**
No managers at workplace -0.015)**(0.16)**
% employees who are women 0.003)**(2.02)**
% employees working part-time (ref: under 10%)
None -0.030)**(0.39)**
10-24% -0.028)**(0.44)**
25-49% -0.012)**(0.17)**
50-74% -0.112)**(1.19)**

Collective bargaining and workplace performance
122
(1))** (2))** (3))** (4))** (5))**irclimat)** irclimat)** irclimat)** irclimat)** irclimat)**
75% or more 0.040)**(0.31)**
% employees who are non-white (ref: none)
Under 5% -0.069)**(1.56)**
5-10% -0.182)**(2.41)**
11-19% -0.129)**(1.68)**
20% or more -0.173)**(1.68)**
Workplace characteristics:
Public sector -0.061)**(0.89)**
Place of ownership (ref: 100% UK)
Foreign-owned -0.065)**(0.94)**
50/50 0.198)**(1.80)**
Single independent workplace -0.030)**(0.49)**
Standard industrial classification (ref: manufacturing)
Electricity, gas and water 0.023)**(0.30)**
Construction 0.064)**(0.55)**
Wholesale and retail distribution -0.264)**(2.22)**
Hotels and restaurants -0.318)**(1.77)**
Transport and communication -0.120)**(1.67)**
Financial services -0.071)**(0.81)**
Other business services -0.129)**(1.06)**
Public administration 0.031)**(0.33)**
Education 0.113)**(1.05)**
Health 0.057)**(0.54)**
Other community services 0.206)**(1.55)**
Workplace activity (ref: produces goods/services for customers)
Supplier to other companies 0.035)**(0.58)**
Supplier to other parts of organisation 0.066)**(1.06)**

Appendix tables
123
(1))** (2))** (3))** (4))** (5))**irclimat)** irclimat)** irclimatv irclimat)** irclimat)**
Does not produce for open market 0.020)**(0.41)**
Administrative office only -0.034)**(0.33)**
Age of workplace at current address (ref: more than 20 years)
Under 3 years 0.035)**(0.43)**
Between 3 and 20 years 0.039)**(0.88)**
Respondent to managerial interview is an ER specialist -0.094)**(2.07)**
HRM score 0.011)**(0.95)**
Number of direct voice channels 0.015)**(0.69)**
IiP award 0.082)**(2.40)**
Region (ref: rest of South East)
East Anglia 0.038)**(0.39)**
East Midlands 0.047)**(0.69)**
London 0.002)**(0.03)**
North -0.026)**(0.37)**
North West 0.027)**(0.38)**
Scotland -0.076)**(1.07)**
South West 0.132)**(1.71)**
Wales 0.112)**(1.37)**
West Midlands 0.146)**(2.13)**
Yorkshire and Humberside -0.045)**(0.65)**
Observations 16618)** 15783)** 15341)** 14460)** 12781)**F statistics (4,1681)** (10,1602)** (25,1586)** (52,1559)** (107,1325)**
= 10.31)** = 8.74)** = 15.37)** = 15.93)** = 11.76)**
Absolute value of t-statistics in parentheses* significant at 5%; ** significant at 1%
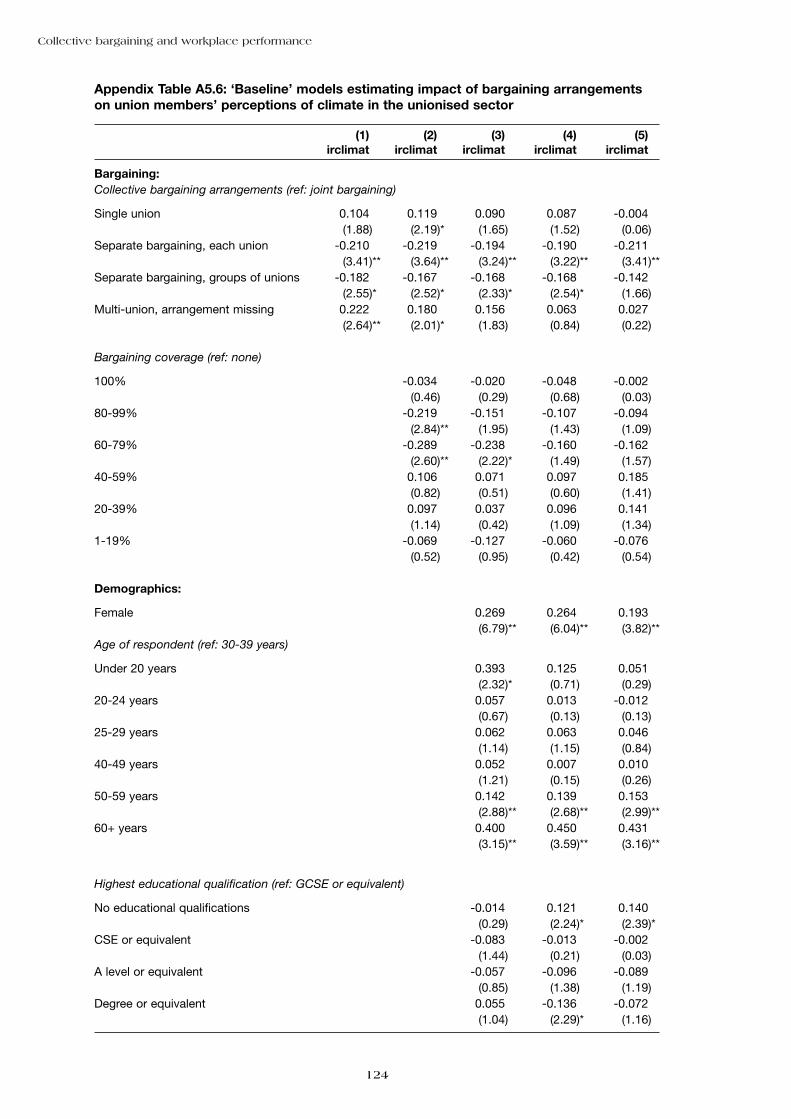
Collective bargaining and workplace performance
124
Appendix Table A5.6: ‘Baseline’ models estimating impact of bargaining arrangementson union members’ perceptions of climate in the unionised sector
(1))** (2))** (3))** (4))** (5))**irclimat)** irclimat)** irclimat)** irclimat)** irclimat)**
Bargaining:Collective bargaining arrangements (ref: joint bargaining)
Single union 0.104)** 0.119)** 0.090)** 0.087)** -0.004)**(1.88)** (2.19)** (1.65)** (1.52)** (0.06)**
Separate bargaining, each union -0.210)** -0.219)** -0.194)** -0.190)** -0.211)**(3.41)** (3.64)** (3.24)** (3.22)** (3.41)**
Separate bargaining, groups of unions -0.182)** -0.167)** -0.168)** -0.168)** -0.142)**(2.55)** (2.52)** (2.33)** (2.54)** (1.66)**
Multi-union, arrangement missing 0.222)** 0.180)** 0.156)** 0.063)** 0.027)**(2.64)** (2.01)** (1.83)** (0.84)** (0.22)**
Bargaining coverage (ref: none)
100% -0.034)** -0.020)** -0.048)** -0.002)**(0.46)** (0.29)** (0.68)** (0.03)**
80-99% -0.219)** -0.151)** -0.107)** -0.094)**(2.84)** (1.95)** (1.43)** (1.09)**
60-79% -0.289)** -0.238)** -0.160)** -0.162)**(2.60)** (2.22)** (1.49)** (1.57)**
40-59% 0.106)** 0.071)** 0.097)** 0.185)**(0.82)** (0.51)** (0.60)** (1.41)**
20-39% 0.097)** 0.037)** 0.096)** 0.141)**(1.14)** (0.42)** (1.09)** (1.34)**
1-19% -0.069)** -0.127)** -0.060)** -0.076)**(0.52)** (0.95)** (0.42)** (0.54)**
Demographics:
Female 0.269)** 0.264)** 0.193)**(6.79)** (6.04)** (3.82)**
Age of respondent (ref: 30-39 years)
Under 20 years 0.393)** 0.125)** 0.051)**(2.32)** (0.71)** (0.29)**
20-24 years 0.057)** 0.013)** -0.012)**(0.67)** (0.13)** (0.13)**
25-29 years 0.062)** 0.063)** 0.046)**(1.14)** (1.15)** (0.84)**
40-49 years 0.052)** 0.007)** 0.010)**(1.21)** (0.15)** (0.26)**
50-59 years 0.142)** 0.139)** 0.153)**(2.88)** (2.68)** (2.99)**
60+ years 0.400)** 0.450)** 0.431)**(3.15)** (3.59)** (3.16)**
Highest educational qualification (ref: GCSE or equivalent)
No educational qualifications -0.014)** 0.121)** 0.140)**(0.29)** (2.24)** (2.39)**
CSE or equivalent -0.083)** -0.013)** -0.002)**(1.44)** (0.21)** (0.03)**
A level or equivalent -0.057)** -0.096)** -0.089)**(0.85)** (1.38)** (1.19)**
Degree or equivalent 0.055)** -0.136)** -0.072)**(1.04)** (2.29)** (1.16)**

Appendix tables
125
(1))** (2))** (3))** (4))** (5))**irclimat)** irclimat)** irclimat)** irclimat)** irclimat)**
Post-graduate degree 0.074)** -0.234)** -0.202)**(1.10)** (3.06)** (2.32)**
Has vocational qualification 0.027)** 0.045)** 0.052)**(0.84)** (1.32)** (1.44)**
Member of non-white ethnic minority 0.146)** 0.140)** 0.240)**(1.58)** (1.34)** (2.19)**
Job characteristics:Occupational classification (ref: clerical and secretarial)
Managers and senior administrators 0.357)** 0.451)**(4.28)** (5.12)**
Professional 0.051)** -0.030)**(0.63)** (0.35)**
Associate professional and technical -0.128)** -0.100)**(1.86)** (1.28)**
Craft and skilled service -0.231)** -0.153)**(2.76)** (1.63**
Personal and protective service 0.138)** 0.129)**(1.69)** (1.61)**
Sales -0.219)** 0.047)**(2.03)** (0.36)**
Operative and assembly -0.234)** -0.149)**(3.54)** (2.13)**
Other occupation -0.263)** -0.165)**(2.56)** (1.70)**
Workplace tenure (ref: 10+ years)
Less than one year 0.549)** 0.582)**(8.62)** (8.37)**
1, <2 years 0.187)** 0.218)**(2.63)** (3.00)**
2, <5 years 0.117)** 0.116)**(2.78)** (2.55)**
5, <10 years -0.014)** 0.012)**(0.27)** (0.22)**
Permanent employment contract 0.071)** -0.026)**(0.74)** (0.30)**
Usual weekly hours (ref: less than 10)
10, <29 hours -0.031)** 0.103)**(0.20)** (0.63)**
30+ hours -0.096)** 0.054)**(0.64)** (0.33)**
Net weekly wage (ref: £141-180)
£50 or less 0.398)** 0.232)**(2.27)** (1.15)**
£51-80 0.297)** 0.264)**(2.22)** (1.98)**
£81-140 0.086)** 0.062)**(1.05)** (0.69)**
£181-220 0.063)** 0.044)**(0.91)** (0.60)**
£221-260 -0.078)** -0.103)**(1.10)** (1.30)**

Collective bargaining and workplace performance
126
(1))** (2))** (3))** (4))** (5))**irclimat)** irclimat)** irclimat)** irclimat)** irclimat)**
£261-310 0.060)** 0.055)**(0.84)** (0.69)**
£311-360 0.183)** 0.166)**(2.15)** (1.82)**
£361-430 0.117)** 0.158)**(1.59)** (1.96)**
£431-540 0.158)** 0.099)**(1.78)** (1.08)**
£541-680 0.430)** 0.343)**(4.22)** (3.30)**
£681 or more 0.440)** 0.411)**(3.11)** (2.80)**
Workforce composition:Number of employees at workplace (ref: 100-199)
10-24 0.080)**(0.60)**
25-49 -0.023)**(0.23)**
50-99 0.097)**(1.16)**
200-499 0.059)**(0.86)**
500 or more 0.055)**(1.00)**
Number of occupations -0.019)**(1.36)**
% managers who are women (ref: under 50%)
None 0.072)**(1.19)**
50-99% 0.087)**(1.35)**
100% 0.252)**(2.24)**
No managers at workplace 0.020)**(0.19)**
% employees who are women 0.004)**(2.73)**
% employees working part-time (ref: under 10%)
None -0.035)**(0.44)**
10-24% -0.018)**(0.21)**
25-49% -0.049)**(0.52)**
50-74% -0.055)**(0.45)**
75% or more 0.110)**(0.58)**
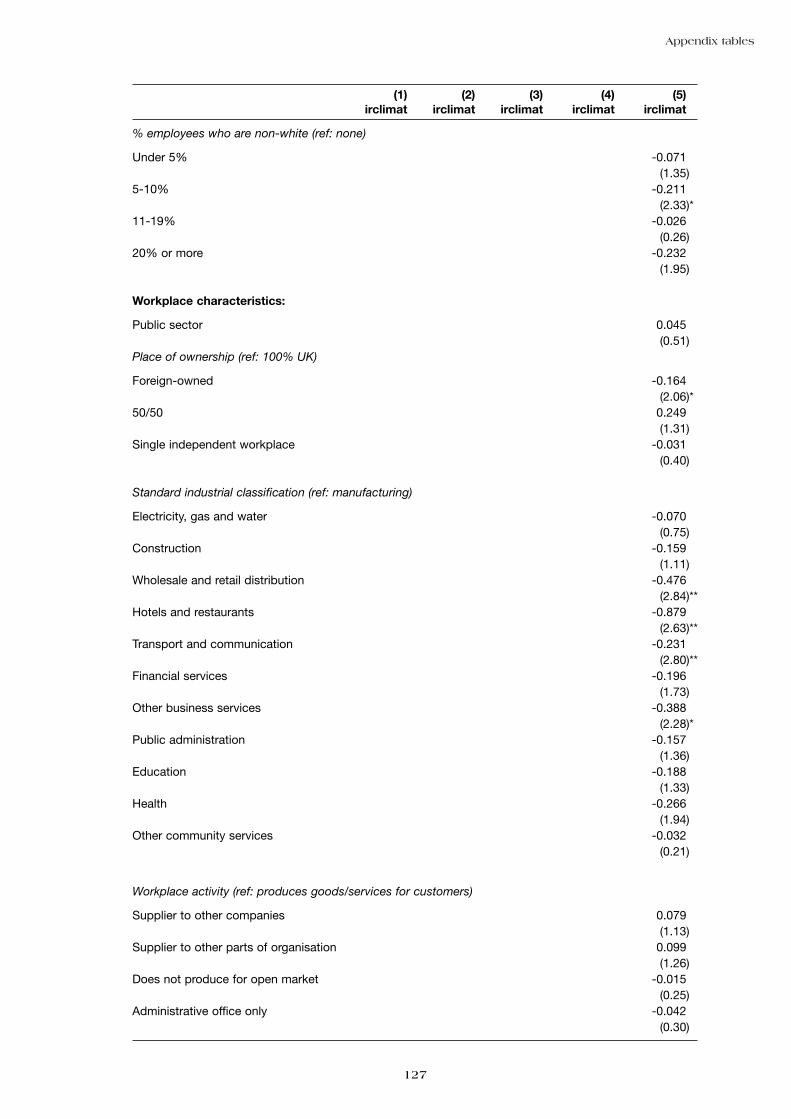
Appendix tables
127
(1))** (2))** (3))** (4))** (5))**irclimat)** irclimat)** irclimat)** irclimat)** irclimat)**
% employees who are non-white (ref: none)
Under 5% -0.071)**(1.35)**
5-10% -0.211)**(2.33)**
11-19% -0.026)**(0.26)**
20% or more -0.232)**(1.95)**
Workplace characteristics:
Public sector 0.045)**(0.51)**
Place of ownership (ref: 100% UK)
Foreign-owned -0.164)**(2.06)**
50/50 0.249)**(1.31)**
Single independent workplace -0.031)**(0.40)**
Standard industrial classification (ref: manufacturing)
Electricity, gas and water -0.070)**(0.75)**
Construction -0.159)**(1.11)**
Wholesale and retail distribution -0.476)**(2.84)**
Hotels and restaurants -0.879)**(2.63)**
Transport and communication -0.231)**(2.80)**
Financial services -0.196)**(1.73)**
Other business services -0.388)**(2.28)**
Public administration -0.157)**(1.36)**
Education -0.188)**(1.33)**
Health -0.266)**(1.94)**
Other community services -0.032)**(0.21)**
Workplace activity (ref: produces goods/services for customers)
Supplier to other companies 0.079)**(1.13)**
Supplier to other parts of organisation 0.099)**(1.26)**
Does not produce for open market -0.015)**(0.25)**
Administrative office only -0.042)**(0.30)**

Collective bargaining and workplace performance
128
(1))** (2))** (3))** (4))** (5))**irclimat)** irclimat)** irclimatv irclimat)** irclimat)**
Age of workplace at current address (ref: more than 20 years)
Under 3 years -0.014)**(0.13)**
Between 3 and 20 years 0.040)**(0.72)**
Respondent to managerial interview is an ER specialist -0.106)**(1.94)**
HRM score 0.019)**(1.36)**
Number of direct voice channels 0.030)**(1.12)**
IiP award 0.042)**(1.01)**
Region (ref: rest of South East)
East Anglia 0.042)**(0.31)**
East Midlands 0.041)**(0.44)**
London -0.038)**(0.39)**
North -0.065)**(0.76)**
North West 0.011)**(0.13)**
Scotland -0.048)**(0.54)**
South West 0.136)**(1.43)**
Wales 0.075)**(0.72)**
West Midlands 0.122)**(1.38)**
Yorkshire and Humberside -0.072)**(0.81)**
Observations 10172)** 9706)** 9448)**)** 8895)** 7820)**F statistics (4,1661)** (10,1582)** (24,1568)** (50,1541)** (105,1308)**
= 9.32)** = 7.64)** = 7.71)** = 11.31)** = 7.12)**
Absolute value of t-statistics in parentheses* significant at 5%; ** significant at 1%

Appendix tables
129
Appendix Table A5.7: ‘Baseline’ models estimating impact of bargaining arrangementson union non-members’ perceptions of climate in the unionised sector
(1))** (2))** (3))** (4))** (5))**irclimat)** irclimat)** irclimat)** irclimat)** irclimat)**
Bargaining:Collective bargaining arrangements (ref: joint bargaining)
Single union 0.103)** 0.122)** 0.075)** 0.057)** 0.038)**(1.72)** (2.06)** (1.26)** (1.02)** (0.63)**
Separate bargaining, each union -0.087)** -0.102)** -0.095)** -0.124)** -0.110)**(1.19)** (1.42)** (1.26)** (1.99)** (1.6)**
Separate bargaining, groups of unions 0.064)** 0.007)** -0.041)** -0.006)** 0.134)**(0.63)** (0.06)** (0.39)** (0.06)** (1.24)**
Multi-union, arrangement missing 0.066)** 0.028)** -0.022)** -0.074)** -0.103)**(0.63)** (0.24)** (0.18)** (0.49)** (0.81)**
Bargaining coverage (ref: none) )**
100% 0.007)** 0.007)** 0.005)** 0.034)**(0.06)** (0.07)** (0.06)** (0.51)**
80-99% -0.200)** -0.178)** -0.122)** -0.081)**(1.82)** (1.58)** (1.39)** (0.99)**
60-79% -0.061)** -0.038)** -0.020)** -0.020)**(0.43)** (0.26)** (0.15)** (0.19)**
40-59% 0.025)** 0.049)** -0.109)** -0.064)**(0.20)** (0.41)** (1.04)** (0.56)**
20-39% 0.032)** 0.021)** 0.020)** -0.074)**(0.26)** (0.17)** (0.19)** (0.71)**
1-19% -0.163)** -0.191)** -0.301)** -0.262)**(1.32)** (1.51)** (2.43)** (2.71)**
Demographics:
Female 0.204)** 0.109)** 0.034)**(4.55)** (2.21)** (0.65)**
Age of respondent (ref: 30-39 years)
Under 20 years 0.216)** -0.024)** 0.006)**(1.97)** (0.21)** (0.04)**
20-24 years 0.187)** 0.154)** 0.156)**(2.41)** (1.69)** (1.68)**
25-29 years -0.058)** 0.002)** 0.021)**(0.84)** (0.02)** (0.24)**
40-49 years 0.043)** 0.028)** 0.006)**(0.84)** (0.57)** (0.11)**
50-59 years 0.099)** 0.123)** 0.091)**(1.65)** (2.02)** (1.39)**
60+ years 0.280)** 0.326)** 0.372)**(2.95)** (3.18)** (3.43)**
Highest educational qualification (ref: GCSE or equivalent)
No educational qualifications 0.147)** 0.203)** 0.199)**(2.30)** (3.34)** (3.07)**
CSE or equivalent 0.087)** 0.134)** 0.136)**(1.21)** (1.78)** (1.74)**
A level or equivalent -0.070)** -0.093)** -0.062)**(1.11)** (1.44)** (0.89)**
Degree or equivalent 0.038)** -0.103)** -0.109)**(0.61)** (1.49)** (1.53)**
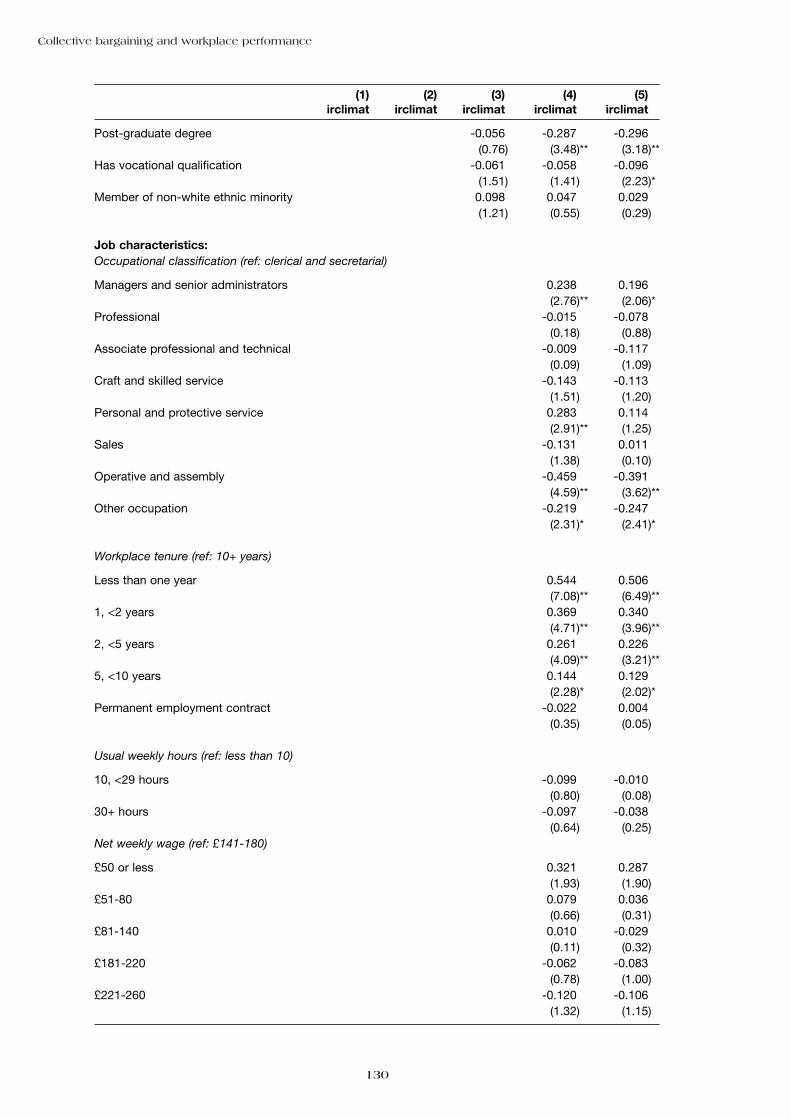
Collective bargaining and workplace performance
130
(1))** (2))** (3))** (4))** (5))**irclimat)** irclimat)** irclimat)** irclimat)** irclimat)**
Post-graduate degree -0.056)** -0.287)** -0.296)**(0.76)** (3.48)** (3.18)**
Has vocational qualification -0.061)** -0.058)** -0.096)**(1.51)** (1.41)** (2.23)**
Member of non-white ethnic minority 0.098)** 0.047)** 0.029)**(1.21)** (0.55)** (0.29)**
Job characteristics:Occupational classification (ref: clerical and secretarial)
Managers and senior administrators 0.238)** 0.196)**(2.76)** (2.06)**
Professional -0.015)** -0.078)**(0.18)** (0.88)**
Associate professional and technical -0.009)** -0.117)**(0.09)** (1.09)**
Craft and skilled service -0.143)** -0.113)**(1.51)** (1.20)**
Personal and protective service 0.283)** 0.114)**(2.91)** (1.25)**
Sales -0.131)** 0.011)**(1.38)** (0.10)**
Operative and assembly -0.459)** -0.391)**(4.59)** (3.62)**
Other occupation -0.219)** -0.247)**(2.31)** (2.41)**
Workplace tenure (ref: 10+ years)
Less than one year 0.544)** 0.506)**(7.08)** (6.49)**
1, <2 years 0.369)** 0.340)**(4.71)** (3.96)**
2, <5 years 0.261)** 0.226)**(4.09)** (3.21)**
5, <10 years 0.144)** 0.129)**(2.28)** (2.02)**
Permanent employment contract -0.022)** 0.004)**(0.35)** (0.05)**
Usual weekly hours (ref: less than 10)
10, <29 hours -0.099)** -0.010)**(0.80)** (0.08)**
30+ hours -0.097)** -0.038)**(0.64)** (0.25)**
Net weekly wage (ref: £141-180)
£50 or less 0.321)** 0.287)**(1.93)** (1.90)**
£51-80 0.079)** 0.036)**(0.66)** (0.31)**
£81-140 0.010)** -0.029)**(0.11)** (0.32)**
£181-220 -0.062)** -0.083)**(0.78)** (1.00)**
£221-260 -0.120)** -0.106)**(1.32)** (1.15)**
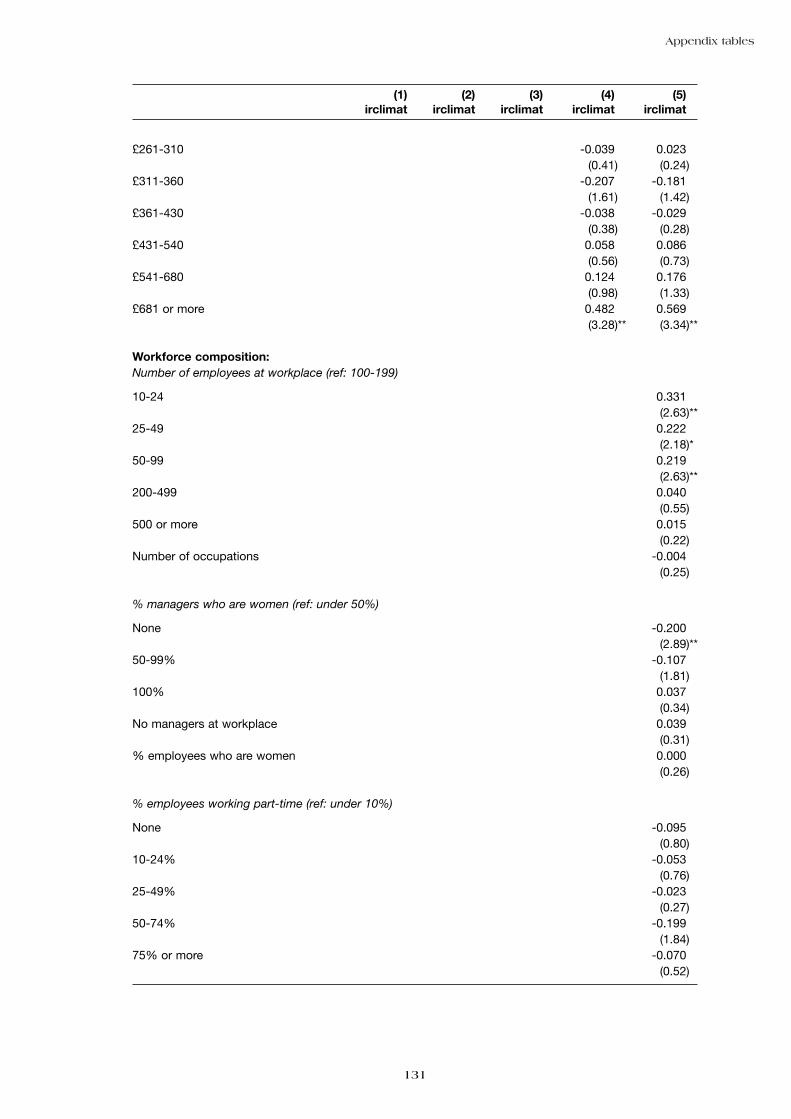
Appendix tables
131
(1))** (2))** (3))** (4))** (5))**irclimat)** irclimat)** irclimat)** irclimat)** irclimat)**
£261-310 -0.039)** 0.023)**(0.41)** (0.24)**
£311-360 -0.207)** -0.181)**(1.61)** (1.42)**
£361-430 -0.038)** -0.029)**(0.38)** (0.28)**
£431-540 0.058)** 0.086)**(0.56)** (0.73)**
£541-680 0.124)** 0.176)**(0.98)** (1.33)**
£681 or more 0.482)** 0.569)**(3.28)** (3.34)**
Workforce composition:Number of employees at workplace (ref: 100-199)
10-24 0.331)**(2.63)**
25-49 0.222)**(2.18)**
50-99 0.219)**(2.63)**
200-499 0.040)**(0.55)**
500 or more 0.015)**(0.22)**
Number of occupations -0.004)**(0.25)**
% managers who are women (ref: under 50%)
None -0.200)**(2.89)**
50-99% -0.107)**(1.81)**
100% 0.037)**(0.34)**
No managers at workplace 0.039)**(0.31)**
% employees who are women 0.000)**(0.26)**
% employees working part-time (ref: under 10%)
None -0.095)**(0.80)**
10-24% -0.053)**(0.76)**
25-49% -0.023)**(0.27)**
50-74% -0.199)**(1.84)**
75% or more -0.070)**(0.52)**
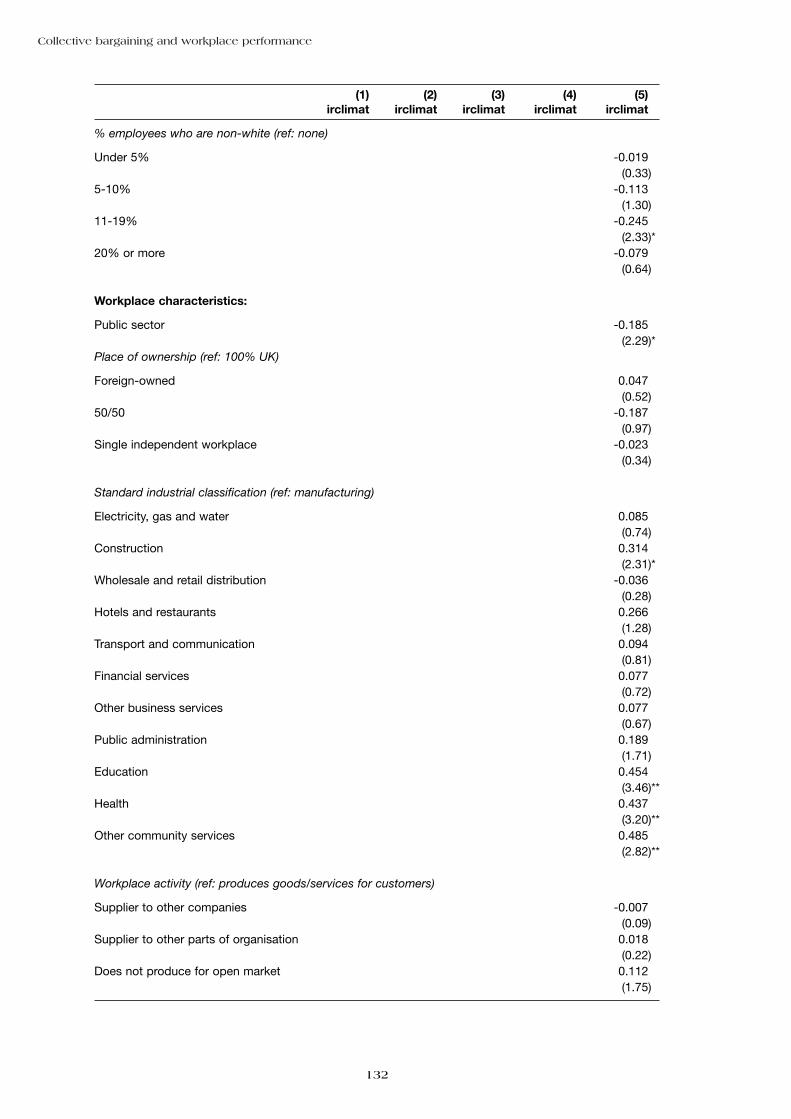
Collective bargaining and workplace performance
132
(1))** (2))** (3))** (4))** (5))**irclimat)** irclimat)** irclimat)** irclimat)** irclimat)**
% employees who are non-white (ref: none)
Under 5% -0.019)**(0.33)**
5-10% -0.113)**(1.30)**
11-19% -0.245)**(2.33)**
20% or more -0.079)**(0.64)**
Workplace characteristics:
Public sector -0.185)**(2.29)**
Place of ownership (ref: 100% UK)
Foreign-owned 0.047)**(0.52)**
50/50 -0.187)**(0.97)**
Single independent workplace -0.023)**(0.34)**
Standard industrial classification (ref: manufacturing)
Electricity, gas and water 0.085)**(0.74)**
Construction 0.314)**(2.31)**
Wholesale and retail distribution -0.036)**(0.28)**
Hotels and restaurants 0.266)**(1.28)**
Transport and communication 0.094)**(0.81)**
Financial services 0.077)**(0.72)**
Other business services 0.077)**(0.67)**
Public administration 0.189)**(1.71)**
Education 0.454)**(3.46)**
Health 0.437)**(3.20)**
Other community services 0.485)**(2.82)**
Workplace activity (ref: produces goods/services for customers)
Supplier to other companies -0.007)**(0.09)**
Supplier to other parts of organisation 0.018)**(0.22)**
Does not produce for open market 0.112)**(1.75)**
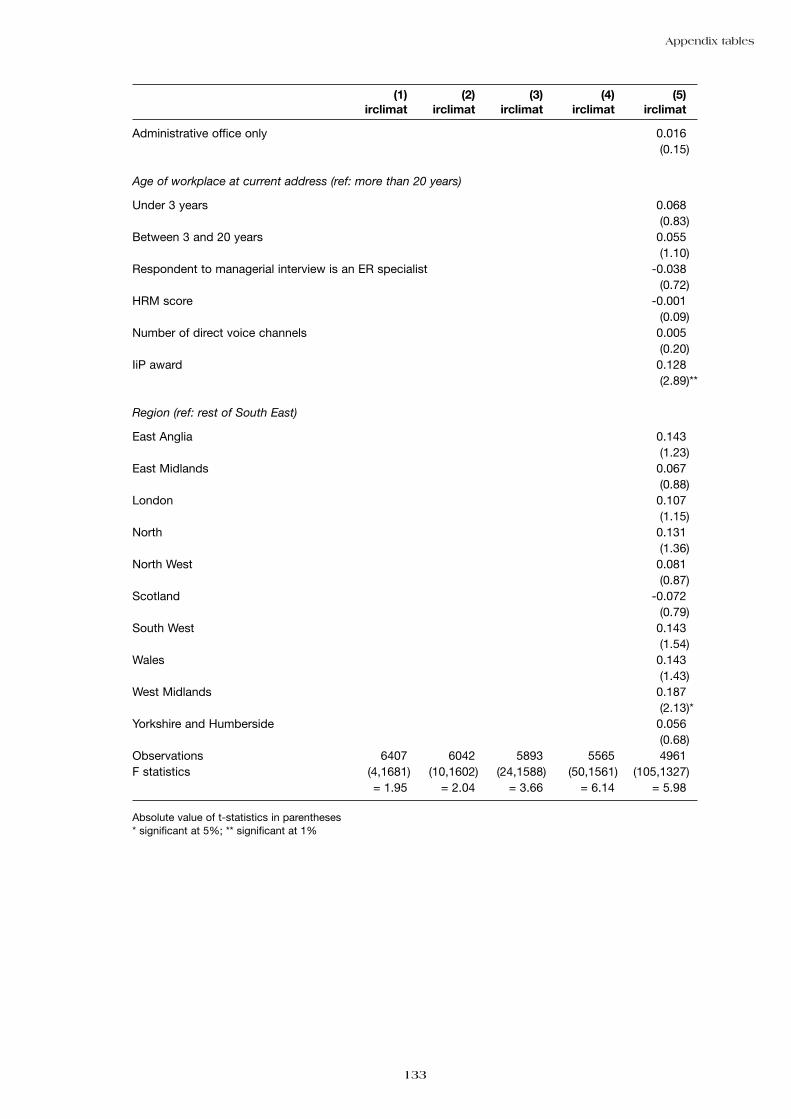
Appendix tables
133
(1))** (2))** (3))** (4))** (5))**irclimat)** irclimat)** irclimat)** irclimat)** irclimat)**
Administrative office only 0.016)**(0.15)**
Age of workplace at current address (ref: more than 20 years)
Under 3 years 0.068)**(0.83)**
Between 3 and 20 years 0.055)**(1.10)**
Respondent to managerial interview is an ER specialist -0.038)**(0.72)**
HRM score -0.001)**(0.09)**
Number of direct voice channels 0.005)**(0.20)**
IiP award 0.128)**(2.89)**
Region (ref: rest of South East)
East Anglia 0.143)**(1.23)**
East Midlands 0.067)**(0.88)**
London 0.107)**(1.15)**
North 0.131)**(1.36)**
North West 0.081)**(0.87)**
Scotland -0.072)**(0.79)**
South West 0.143)**(1.54)**
Wales 0.143)**(1.43)**
West Midlands 0.187)**(2.13)**
Yorkshire and Humberside 0.056)**(0.68)**
Observations 6407)** 6042)** 5893)** 5565)** 4961)**F statistics (4,1681)** (10,1602)** (24,1588)** (50,1561)** (105,1327)**
= 1.95)** = 2.04)** = 3.66)** = 6.14)** = 5.98)**
Absolute value of t-statistics in parentheses* significant at 5%; ** significant at 1%
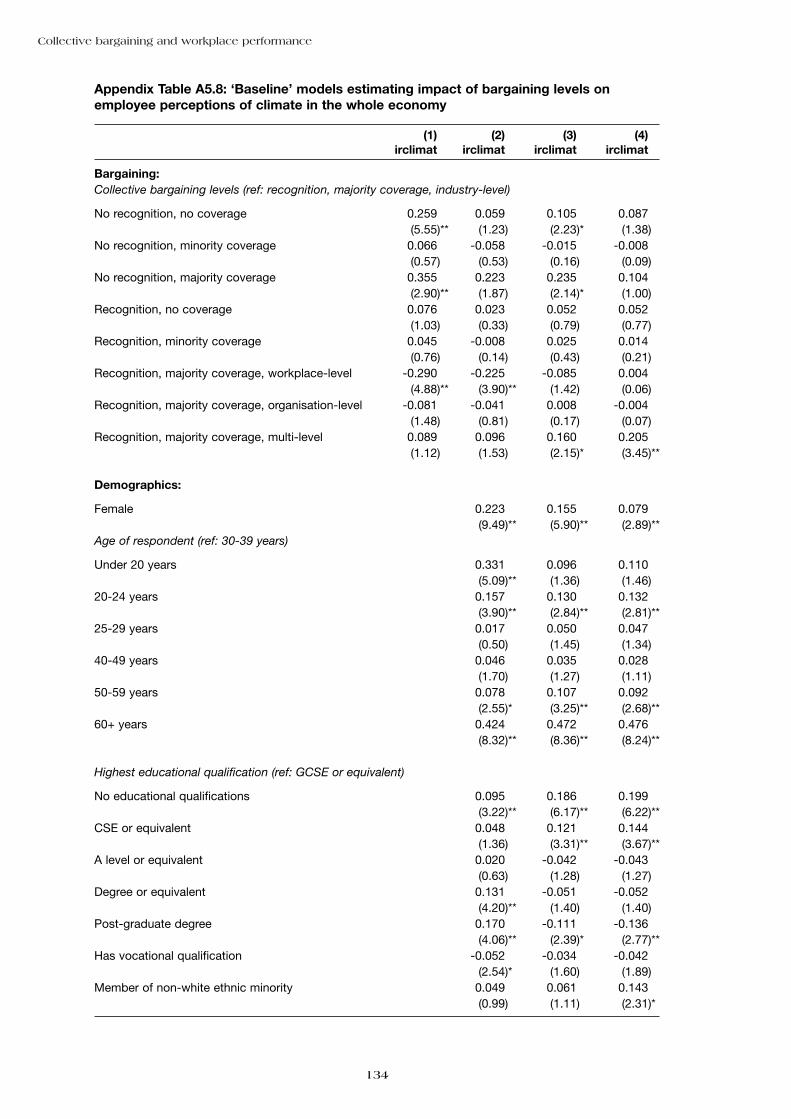
Collective bargaining and workplace performance
134
Appendix Table A5.8: ‘Baseline’ models estimating impact of bargaining levels onemployee perceptions of climate in the whole economy
(1))** (2))** (3))** (4))**irclimat)** irclimat)** irclimat)** irclimat)**
Bargaining:Collective bargaining levels (ref: recognition, majority coverage, industry-level)
No recognition, no coverage 0.259)** 0.059)** 0.105)** 0.087)**(5.55)** (1.23)** (2.23)** (1.38)**
No recognition, minority coverage 0.066)** -0.058)** -0.015)** -0.008)**(0.57)** (0.53)** (0.16)** (0.09)**
No recognition, majority coverage 0.355)** 0.223)** 0.235)** 0.104)**(2.90)** (1.87)** (2.14)** (1.00)**
Recognition, no coverage 0.076)** 0.023)** 0.052)** 0.052)**(1.03)** (0.33)** (0.79)** (0.77)**
Recognition, minority coverage 0.045)** -0.008)** 0.025)** 0.014)**(0.76)** (0.14)** (0.43)** (0.21)**
Recognition, majority coverage, workplace-level -0.290)** -0.225)** -0.085)** 0.004)**(4.88)** (3.90)** (1.42)** (0.06)**
Recognition, majority coverage, organisation-level -0.081)** -0.041)** 0.008)** -0.004)**(1.48)** (0.81)** (0.17)** (0.07)**
Recognition, majority coverage, multi-level 0.089)** 0.096)** 0.160)** 0.205)**(1.12)** (1.53)** (2.15)** (3.45)**
Demographics:
Female 0.223)** 0.155)** 0.079)**(9.49)** (5.90)** (2.89)**
Age of respondent (ref: 30-39 years)
Under 20 years 0.331)** 0.096)** 0.110)**(5.09)** (1.36)** (1.46)**
20-24 years 0.157)** 0.130)** 0.132)**(3.90)** (2.84)** (2.81)**
25-29 years 0.017)** 0.050)** 0.047)**(0.50)** (1.45)** (1.34)**
40-49 years 0.046)** 0.035)** 0.028)**(1.70)** (1.27)** (1.11)**
50-59 years 0.078)** 0.107)** 0.092)**(2.55)** (3.25)** (2.68)**
60+ years 0.424)** 0.472)** 0.476)**(8.32)** (8.36)** (8.24)**
Highest educational qualification (ref: GCSE or equivalent)
No educational qualifications 0.095)** 0.186)** 0.199)**(3.22)** (6.17)** (6.22)**
CSE or equivalent 0.048)** 0.121)** 0.144)**(1.36)** (3.31)** (3.67)**
A level or equivalent 0.020)** -0.042)** -0.043)**(0.63)** (1.28)** (1.27)**
Degree or equivalent 0.131)** -0.051)** -0.052)**(4.20)** (1.40)** (1.40)**
Post-graduate degree 0.170)** -0.111)** -0.136)**(4.06)** (2.39)** (2.77)**
Has vocational qualification -0.052)** -0.034)** -0.042)**(2.54)** (1.60)** (1.89)**
Member of non-white ethnic minority 0.049)** 0.061)** 0.143)**(0.99)** (1.11)** (2.31)**

Appendix tables
135
(1))** (2))** (3))** (4))**irclimat)** irclimat)** irclimat)** irclimat)**
Union membership (ref: current member)
Ex-member 0.195)** 0.080)** 0.103)**(6.30)** (2.55)** (3.20)**
Never member 0.347)** 0.207)** 0.238)**(12.18)** (6.87)** (7.72)**
Job characteristics:Occupational classification (ref: clerical and secretarial)
Managers and senior administrators 0.263)** 0.256)**(5.84)** (5.31)**
Professional 0.088)** -0.002)**(1.83)** (0.04)**
Associate professional and technical -0.010)** -0.015)**(0.21)** (0.28)**
Craft and skilled service -0.232)** -0.169)**(4.38)** (3.07)**
Personal and protective service 0.109)** 0.002)**(2.21)** (0.03)**
Sales -0.032)** 0.058)**(0.60)** (0.90)**
Operative and assembly -0.324)** -0.213)**(7.16)** (4.17)**
Other occupation -0.175)** -0.157)**(3.32)** (2.87)**
Workplace tenure (ref: 10+ years)
Less than one year 0.469)** 0.467)**(12.30)** (11.94)**
1, <2 years 0.207)** 0.211)**(5.19)** (5.17)**
2, <5 years 0.131)** 0.118)**(4.66)** (4.07)**
5, <10 years 0.040)** 0.037)**(1.35)** (1.22)**
Permanent employment contract 0.001)** 0.029)**(0.02)** (0.67)**
Usual weekly hours (ref: less than 10)
10, <29 hours -0.127)** -0.088)**(1.77)** (1.16)**
30+ hours -0.212)** -0.178)**(2.71)** (2.10)**
Net weekly wage (ref: £141-180)
£50 or less 0.271)** 0.162)**(3.37)** (1.91)**
£51-80 0.104)** 0.044)**(1.76)** (0.70)**
£81-140 0.098)** 0.074)**(2.19)** (1.57)**
£181-220 0.022)** 0.046)**(0.52)** (1.09)**
£221-260 -0.032)** 0.012)**(0.72)** (0.26)**
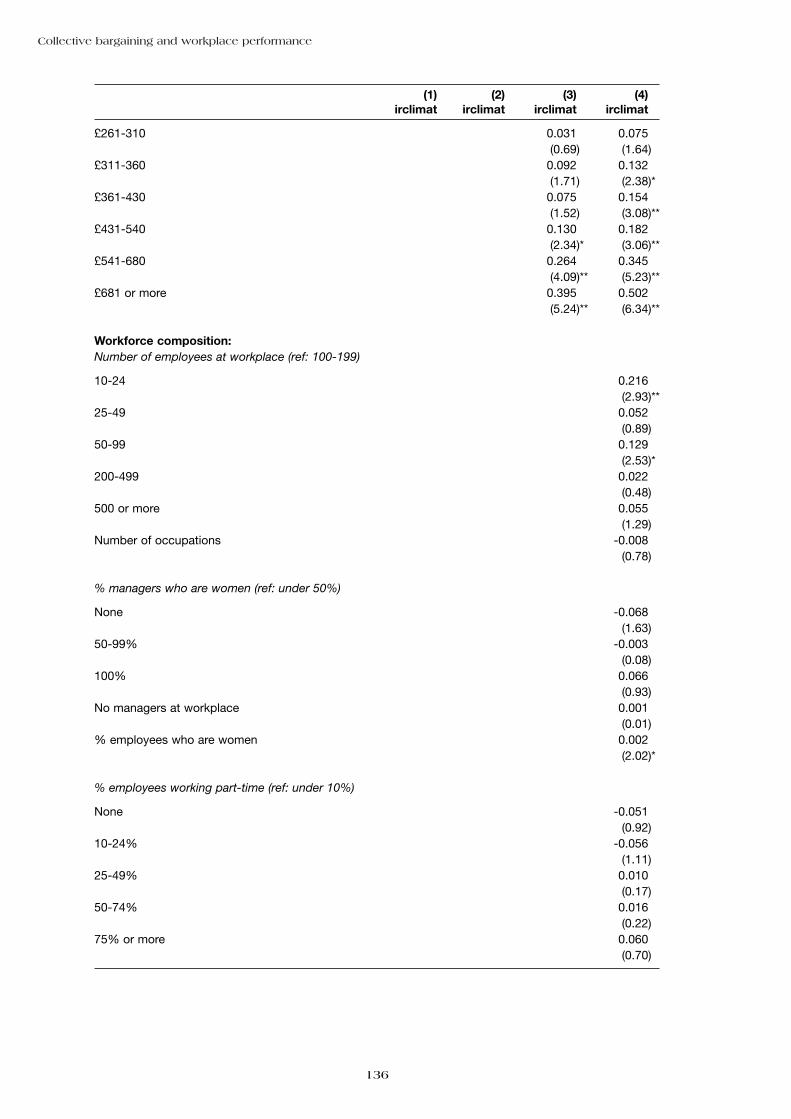
Collective bargaining and workplace performance
136
(1))** (2))** (3))** (4))**irclimat)** irclimat)** irclimat)** irclimat)**
£261-310 0.031)** 0.075)**(0.69)** (1.64)**
£311-360 0.092)** 0.132)**(1.71)** (2.38)**
£361-430 0.075)** 0.154)**(1.52)** (3.08)**
£431-540 0.130)** 0.182)**(2.34)** (3.06)**
£541-680 0.264)** 0.345)**(4.09)** (5.23)**
£681 or more 0.395)** 0.502)**(5.24)** (6.34)**
Workforce composition:Number of employees at workplace (ref: 100-199)
10-24 0.216)**(2.93)**
25-49 0.052)**(0.89)**
50-99 0.129)**(2.53)**
200-499 0.022)**(0.48)**
500 or more 0.055)**(1.29)**
Number of occupations -0.008)**(0.78)**
% managers who are women (ref: under 50%)
None -0.068)**(1.63)**
50-99% -0.003)**(0.08)**
100% 0.066)**(0.93)**
No managers at workplace 0.001)**(0.01)**
% employees who are women 0.002)**(2.02)**
% employees working part-time (ref: under 10%)
None -0.051)**(0.92)**
10-24% -0.056)**(1.11)**
25-49% 0.010)**(0.17)**
50-74% 0.016)**(0.22)**
75% or more 0.060)**(0.70)**

Appendix tables
137
(1))** (2))** (3))** (4))**irclimat)** irclimat)** irclimat)** irclimat)**
% employees who are non-white (ref: none)
Under 5% -0.075)**(2.13)**
5-10% -0.115)**(2.01)**
11-19% -0.181)**(3.23)**
20% or more -0.167)**(2.07)**
Workplace characteristics:
Public sector -0.008)**(0.13)**
Place of ownership (ref: 100% UK)
Foreign-owned 0.043)**(0.87)**
50/50 0.210)**(2.00)**
Single independent workplace 0.010)**(0.24)**
Standard industrial classification (ref: manufacturing)
Electricity, gas and water 0.072)**(1.02)**
Construction 0.166)**(1.99)**
Wholesale and retail distribution -0.125)**(1.69)**
Hotels and restaurants 0.102)**(1.16)**
Transport and communication -0.080)**(1.21)**
Financial services 0.046)**(0.60)**
Other business services 0.085)**(1.26)**
Public administration 0.080)**(1.00)**
Education 0.184)**(2.11)**
Health 0.018)**(0.21)**
Other community services 0.117)**(1.13)**
Workplace activity (ref: produces goods/services for customers)
Supplier to other companies -0.047)**(1.09)**
Supplier to other parts of organisation -0.003)**(0.05)**
Does not produce for open market 0.039)**(0.92)**

Collective bargaining and workplace performance
138
(1))** (2))** (3))** (4))**irclimat)** irclimat)** irclimat)** irclimat)**
Administrative office only 0.061)**(0.85)**
Age of workplace at current address (ref: more than 20 years)
Under 3 years -0.109)**(1.57)**
Between 3 and 20 years 0.043)**(1.28)**
Respondent to managerial interview is an ER specialist -0.102)**(2.84)**
HRM score 0.009)**(1.00)**
Number of direct voice channels 0.016)**(0.94)**
IiP award 0.099)**(3.48)**
Region (ref: rest of South East)
East Anglia 0.017)**(0.25)**
East Midlands 0.099)**(1.68)**
London 0.091)**(1.49)**
North 0.054)**(0.82)**
North West 0.086)**(1.50)**
Scotland -0.029)**(0.48)**
South West 0.147)**(2.32)**
Wales 0.155)**(2.16)**
West Midlands 0.106)**(1.79)**
Yorkshire and Humberside 0.025)**(0.41)**
Observations 26486)** 25722)** 24101)** 21645)**F statistics (8,1626)** (24,1610)** (50,1583)** (105,1349)**
= 17.03)** = 25.33)** = 24.34)** = 15.42)**
Absolute value of t-statistics in parentheses* significant at 5%; ** significant at 1%

Appendix tables
139
Appendix Table A6.1 Control variables used in analysis of workplace financial performance
All Public Private Privatesector sector trading
sector
CBA, collective bargaining arrangements:
No recognised union 65 16 78 78Single union 23 47 16 17Multi-union, joint bargaining 7 20 3 2Multi-union, separate bargaining by each union 5 14 2 2Multi-union, separate bargaining by groups of unions * 1 * *Multi-union, bargaining arrangement data missing * 1 * *
CBL4, collective bargaining levels:No recognition, no coverage 60 7 74 74No recognition, minority coverage 2 4 1 1No recognition, majority coverage 4 6 4 3Recognition, no coverage 7 7 7 7Recognition, minority coverage 5 18 2 2Recognition, majority coverage, workplace-level 2 * 2 2Recognition, majority coverage, organisation-level 9 20 6 6Recognition, majority coverage, industry-level 11 37 4 5Recognition, multi-level * 1 * *NCOV2PC7, % of workforce covered by collective bargaining:None 66 14 81 811-19% 3 7 2 220-39% 2 8 1 140-59% 5 13 2 360-79% 4 9 2 280-99% 4 3 5 5100% 16 46 8 8NCOV2PC, % workforce covered by collective bargaining, continuous 25 64 15 15NRECOG3, number of recognised unions0 65 16 78 781 23 47 16 172 8 25 3 33 3 6 2 14 or more 2 6 1 1
Other union-related variables:
UREP2, if on-site union representative 18 49 11 11CLSHOP, union membership arrangements:No union members 54 1 69 69Closed shop 1 * 1 2Management strongly recommends union membership 9 32 3 2Union members present but no closed shop or managementendorsement
36 67 27 28NDENS6, union density:No union members 55 1 69 691-24% 13 6 14 1525-49% 10 26 6 650-74% 10 28 6 675-99% 8 22 4 4100% 4 15 * *Some members, don’t know how many 1 2 1 1NDENSITY, union density, continuous 22 64 11 11

Collective bargaining and workplace performance
140
All Public Private Privatesector sector trading
sector
EVIEWS, how would you describe management’s general attitude towards trade union membership among employees at this establishment?In favour 25 70 13 13Not in favour 18 1 22 24Neutral 54 29 61 60Not an issue 3 0 3 3Other answer * 0 * *APHRAS06, unions help find ways to improve workplace performance:Strongly agree 2 6 1 2Agree 23 37 19 18Neither agree nor disagree 38 38 38 38Disagree 27 14 30 31Strongly disagree 10 5 12 11APHRAS07, we would rather consult directly with employees than with unions:Strongly agree 33 19 37 39Agree 44 37 46 45Neither agree nor disagree 14 21 12 12Disagree 8 22 4 3Strongly disagree 1 1 1 1VOICE3, nature of worker voice:Union only 5 3 5 5Dual channel 30 85 17 17Non-union only 48 11 57 56No voice 17 1 21 22VOICE4, nature of worker voice:Representative only 10 10 10 10Representative and direct 36 82 25 24Direct only 37 8 44 44No voice 17 1 21 22
Respondent’s characteristics:
RESPFEM, if respondent a woman 36 41 34 35FINMAN, if respondent is proprietor/owner/managing director/partner/financial manager/company secretary/general manager according to job title 81 73 83 82
Workforce composition:
PCFEM, % of workforce who are women 54 72 49 49PCPT, % of workforce who are part-timers 34 39 30 30PCETHNIC, % of workforce from non-white ethnic minorities 4 5 4 4NEMPSIZE, number of employees at workplace:10-24 50 42 52 5125-49 26 32 25 2650-99 12 12 12 13100-199 6 8 6 6200-499 4 4 4 4500 or more 1 2 1 1
Workplace ownership:
SINGLE, if single independent workplace (as opposed to part of a multi-site organisation) 31 3 39 39

Appendix tables
141
All Public Private Privatesector sector trading
sector
UKFOR, UK or foreign-owned:UK-owned 92 100 90 90Foreign-owned 6 0 8 950/50 1 0 2 1
Workplace activity, age and location:
ASIC, standard industrial classification (single digit):Manufacturing 14 * 18 20Electricity, gas and water * * * *Construction 4 1 5 4Wholesale and retail distribution 21 2 26 28Hotels and restaurants 9 2 10 11Transport and communication 5 4 5 5Financial services 3 0 4 5Other business services 11 6 12 12Public administration 4 15 * 0Education 12 44 4 4Health 13 21 11 9Other community services 5 6 5 3KACTIVI, activity at the workplace:Produce goods or services for customers 56 53 56 65Supplier of goods or services to other companies 24 3 30 35Supplier of goods or services to other parts of organisation to which we belong 3 5 2 0Do not produce goods or services for sale in open market 14 35 8 0Administrative office only 4 4 4 0AGECAT2, age of establishment at current address:Under 3 years 11 5 13 113 to 4 years 6 5 6 65 to 9 years 20 9 23 2510 to 20 years 25 20 26 27Over 20 years 38 61 32 32GREENFLD, if workplace set up on greenfield site in last 10 years 5 3 5 5
SSR, Standard statistical region:
East Anglia 4 2 4 4East Midlands 8 12 6 6London 11 12 10 10North 6 5 6 6North West 13 17 11 12Scotland 8 6 8 9Rest of South East 21 16 22 23South West 9 7 9 10Wales 4 5 3 3West Midlands 10 10 10 10Yorkshire and Humberside 8 8 9 7

Collective bargaining and workplace performance
142
All Public Private Privatesector sector trading
sector
Management practices:
HRMSCORE, count of 13 human resource management practices 6.8 7.5 6.7 6.7NINFO, number of items of information regularly given to employeesregarding internal investment plans, the financial position of the workplace, and staffing plans:0 18 6 22 211 18 11 20 202 29 28 29 293 35 55 30 30AUTOTEAM, degree of autonomy for team-working, scoring pointsfor if any team-working, then extra points if team appoints ownteam-leaders, decides how work is done, has responsibility forspecific products/services:0 25 14 28 281 5 2 6 52 28 28 28 293 36 52 32 304 6 4 6 7TROTHJ2, if some of employees from largest non-managerialoccupational group are formally trained to jobs other than their own 71 71 71 70PCOFFJOB, percentage of experienced workers in largest non-managerial occupational group having formaloff-the-job training in the previous 12 months:None 24 5 30 291-19% 21 19 22 2220-39% 13 12 13 1440-59% 9 8 10 1060-79% 8 9 7 880-99% 8 12 7 7100% 16 36 11 10ONGOING, if ongoing training is one of the main methods bywhich employees in the largest non-managerial occupationalgroup are made aware of their job responsibilities 69 85 65 65SELECTIV, if skills, qualifications, experience and motivation all important in recruitment 54 76 48 48JOBSECUR, if policy of guaranteed job security, no compulsory redundancies 11 22 8 7EMPOWER, count based on whether largest non-managerialoccupational group at the workplace has a lot of variety in their work,discretion over how they do their work, and control over the pace atwhich they do their work:0 38 34 40 391 33 39 31 322 17 16 18 173 11 11 11 12APPRAISE, if 80% or more of non-managerial staff are formally appraised 55 50 56 57INTERPRO, if preference given to internal applicants, other thingsbeing equal, when filling vacancies 26 16 29 30SAMETERM, if management has same non-pay terms and conditionsas employees in the largest non-managerial occupational group 41 69 33 32PROFITPY, if workplace has a profit-related pay scheme 36 6 44 46
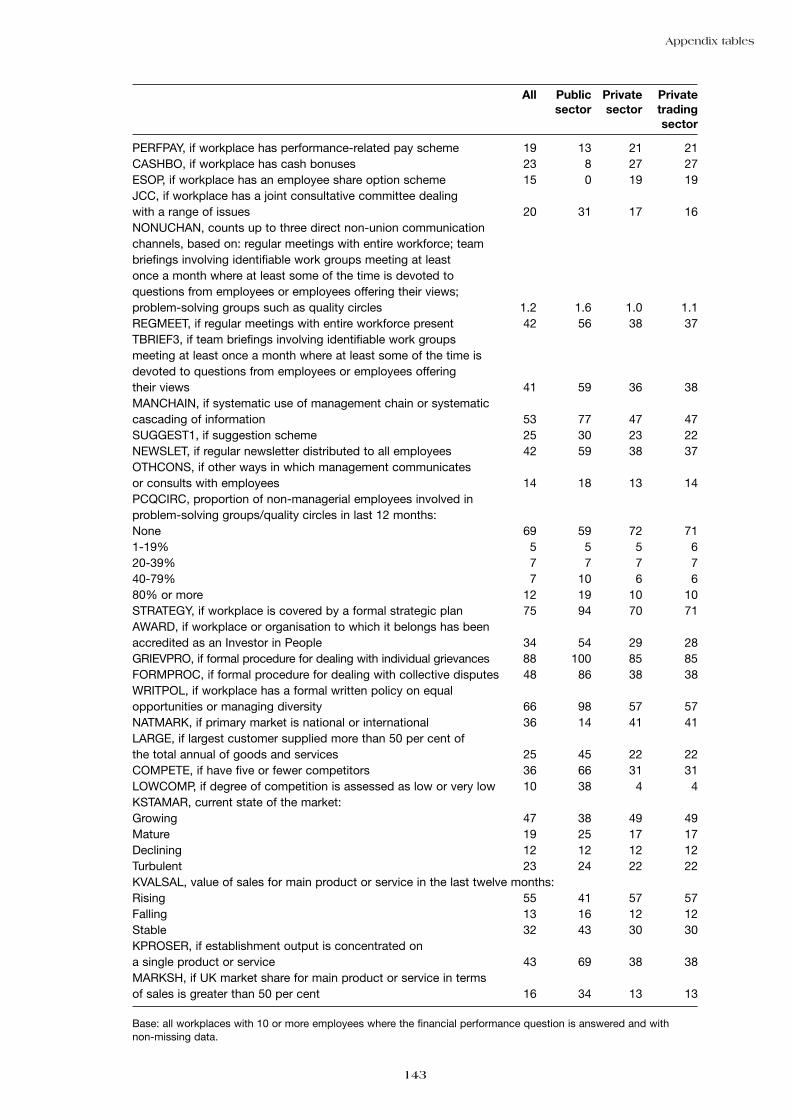
Appendix tables
143
All Public Private Privatesector sector trading
sector
PERFPAY, if workplace has performance-related pay scheme 19 13 21 21CASHBO, if workplace has cash bonuses 23 8 27 27ESOP, if workplace has an employee share option scheme 15 0 19 19JCC, if workplace has a joint consultative committee dealing with a range of issues 20 31 17 16NONUCHAN, counts up to three direct non-union communicationchannels, based on: regular meetings with entire workforce; teambriefings involving identifiable work groups meeting at least once a month where at least some of the time is devoted toquestions from employees or employees offering their views; problem-solving groups such as quality circles 1.2 1.6 1.0 1.1REGMEET, if regular meetings with entire workforce present 42 56 38 37TBRIEF3, if team briefings involving identifiable work groupsmeeting at least once a month where at least some of the time is devoted to questions from employees or employees offering their views 41 59 36 38MANCHAIN, if systematic use of management chain or systematiccascading of information 53 77 47 47SUGGEST1, if suggestion scheme 25 30 23 22NEWSLET, if regular newsletter distributed to all employees 42 59 38 37OTHCONS, if other ways in which management communicatesor consults with employees 14 18 13 14PCQCIRC, proportion of non-managerial employees involved inproblem-solving groups/quality circles in last 12 months:None 69 59 72 711-19% 5 5 5 620-39% 7 7 7 740-79% 7 10 6 680% or more 12 19 10 10STRATEGY, if workplace is covered by a formal strategic plan 75 94 70 71AWARD, if workplace or organisation to which it belongs has beenaccredited as an Investor in People 34 54 29 28GRIEVPRO, if formal procedure for dealing with individual grievances 88 100 85 85FORMPROC, if formal procedure for dealing with collective disputes 48 86 38 38WRITPOL, if workplace has a formal written policy on equalopportunities or managing diversity 66 98 57 57NATMARK, if primary market is national or international 36 14 41 41LARGE, if largest customer supplied more than 50 per cent ofthe total annual of goods and services 25 45 22 22COMPETE, if have five or fewer competitors 36 66 31 31LOWCOMP, if degree of competition is assessed as low or very low 10 38 4 4KSTAMAR, current state of the market:Growing 47 38 49 49Mature 19 25 17 17Declining 12 12 12 12Turbulent 23 24 22 22KVALSAL, value of sales for main product or service in the last twelve months:Rising 55 41 57 57Falling 13 16 12 12Stable 32 43 30 30KPROSER, if establishment output is concentrated ona single product or service 43 69 38 38MARKSH, if UK market share for main product or service in termsof sales is greater than 50 per cent 16 34 13 13
Base: all workplaces with 10 or more employees where the financial performance question is answered and with non-missing data.

Collective bargaining and workplace performance
144
Appendix Table A6.2: ‘Baseline’ models estimating impact of bargaining arrangementson workplace financial performance
(1))** (2))** (3))** (4))**Whole)** Whole)** Trading)** Trading)**
economy)** economy)** sector)** sector)**
Bargaining:Collective bargaining arrangements (ref: no recognition)
Single union 0.047)** 0.129)** 0.015)** 0.034)**(0.44)** (1.04)** (0.12)** (0.25)**
Joint bargaining -0.168)** 0.128)** -0.327)** 0.146)**(0.85)** (0.61)** (1.38)** (0.73)**
Separate bargaining, each union 0.072)** 0.250)** 0.022)** 0.353)**(0.34)** (1.01)** (0.09)** (1.49)**
Separate bargaining, groups of unions -0.329)** -0.027)** -0.367)** -0.119)**(2.12)** (0.14)** (2.06)** (0.56)**
Multi-union, arrangement missing -0.589)** -0.573)** -0.741)** -0.699)**(2.15)** (1.57)** (2.37)** (1.80)**
Respondent characteristics:
Non-ER specialist 0.254)** 0.251)**(2.49)** (2.29)**
Workforce composition:
% female 0.005)** 0.004)**(2.15)** (1.71)**
% part-time -0.004)** -0.006)**(1.81)** (1.99)**
Workplace characteristics:
500 or more employees 0.293)** 0.250)**(2.69)** (1.92)**
Employment growth in last year 0.269)** 0.050)**(2.79)** (0.50)**
Employment growth data missing 0.113)** -0.111)**(0.37)** (0.36)**
Public sector -0.417)** -0.477)**(2.37)** (2.28)**
Standard industrial classification (ref: manufacturing)
Electricity, gas, water 0.076)** 0.512)**(0.32)** (1.57)**
Construction -0.088)** 0.057)**(0.39)** (0.22)**
Wholesale and retail -0.077)** 0.048)**(0.36)** (0.21)**
Hotels and restaurants 0.055)** 0.140)**(0.22)** (0.47)**
Transport and communication -0.006)** -0.023)**(0.03)** (0.09)**
Financial services -0.167)** 0.047)**(0.72)** (0.18)**
Other business services -0.177)** -0.133)**(0.82)** (0.63)**
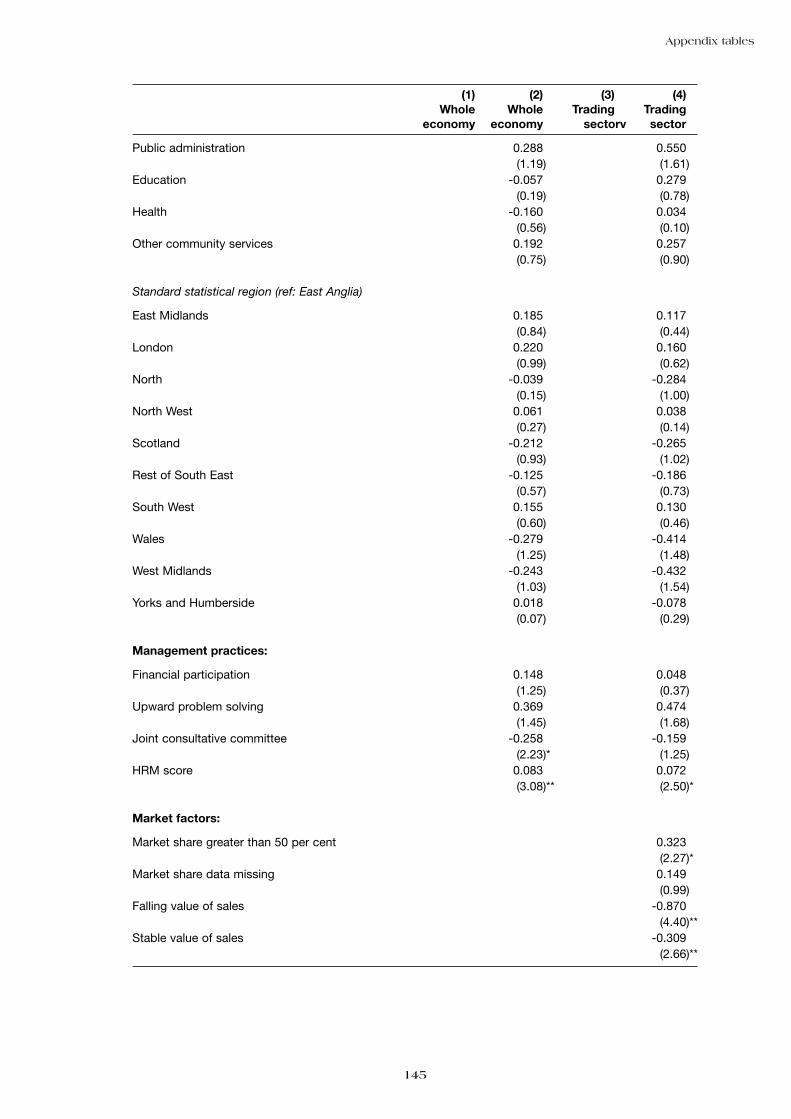
Appendix tables
145
(1))** (2))** (3))** (4))**Whole)** Whole)** Trading)** Trading)**
economy)** economy)** sectorv sector)**
Public administration 0.288)** 0.550)**(1.19)** (1.61)**
Education -0.057)** 0.279)**(0.19)** (0.78)**
Health -0.160)** 0.034)**(0.56)** (0.10)**
Other community services 0.192)** 0.257)**(0.75)** (0.90)**
Standard statistical region (ref: East Anglia)
East Midlands 0.185)** 0.117)**(0.84)** (0.44)**
London 0.220)** 0.160)**(0.99)** (0.62)**
North -0.039)** -0.284)**(0.15)** (1.00)**
North West 0.061)** 0.038)**(0.27)** (0.14)**
Scotland -0.212)** -0.265)**(0.93)** (1.02)**
Rest of South East -0.125)** -0.186)**(0.57)** (0.73)**
South West 0.155)** 0.130)**(0.60)** (0.46)**
Wales -0.279)** -0.414)**(1.25)** (1.48)**
West Midlands -0.243)** -0.432)**(1.03)** (1.54)**
Yorks and Humberside 0.018)** -0.078)**(0.07)** (0.29)**
Management practices:
Financial participation 0.148)** 0.048)**(1.25)** (0.37)**
Upward problem solving 0.369)** 0.474)**(1.45)** (1.68)**
Joint consultative committee -0.258)** -0.159)**(2.23)** (1.25)**
HRM score 0.083)** 0.072)**(3.08)** (2.50)**
Market factors:
Market share greater than 50 per cent 0.323)**(2.27)**
Market share data missing 0.149)**(0.99)**
Falling value of sales -0.870)**(4.40)**
Stable value of sales -0.309)**(2.66)**
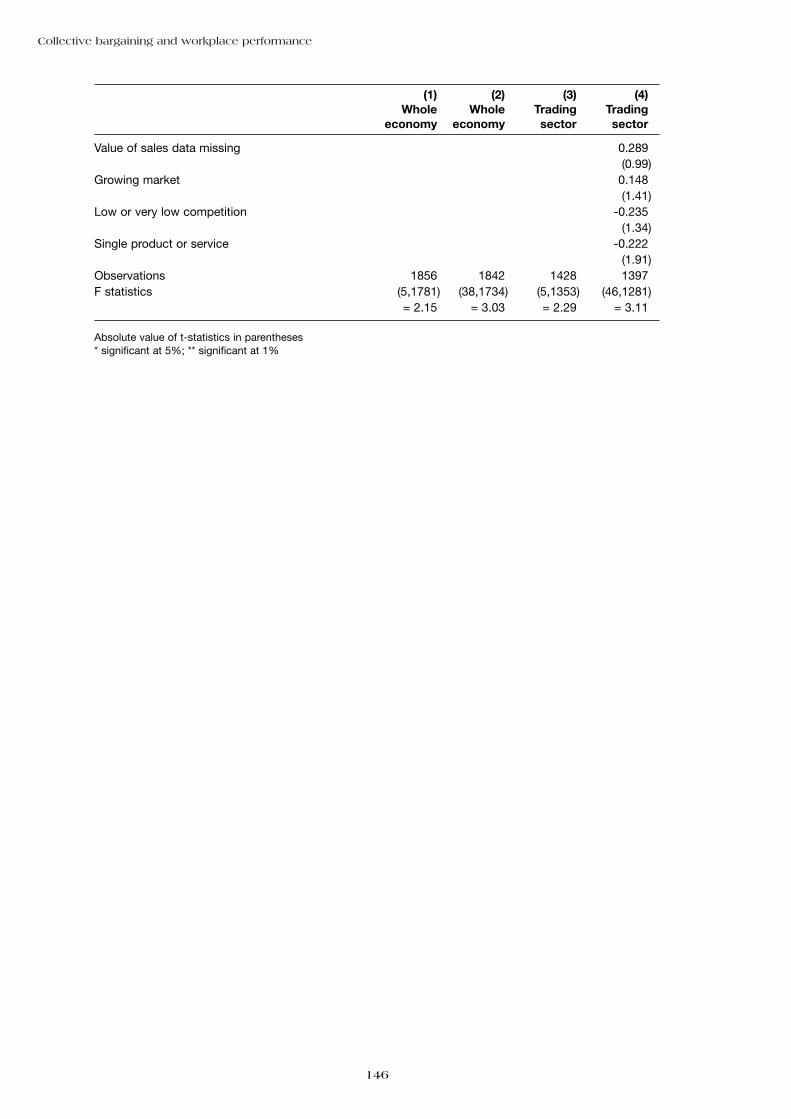
Collective bargaining and workplace performance
146
(1))** (2))** (3))** (4))**Whole)** Whole)** Trading)** Trading)**
economy)** economy)** sector)** sector)**
Value of sales data missing 0.289)**(0.99)**
Growing market 0.148)**(1.41)**
Low or very low competition -0.235)**(1.34)**
Single product or service -0.222)**(1.91)**
Observations 1856)** 1842)** 1428)** 1397)**F statistics (5,1781)** (38,1734)** (5,1353)** (46,1281)**
= 2.15)** = 3.03)** = 2.29)** = 3.11)**
Absolute value of t-statistics in parentheses* significant at 5%; ** significant at 1%

Appendix tables
147
Appendix Table A6.3 ‘Baseline’ models estimating impact of bargaining arrangements onworkplace financial performance in the private trading sector
(1))** (3))**Standard)** Profit or)**controls)** value added)**
measure)**
Bargaining:Collective bargaining arrangements (ref: no recognition)
Single union 0.024)** 0.132)**(0.16)** (0.75)**
Joint bargaining -0.069)** 0.136)**(0.24)** (0.44)**
Separate bargaining, each union 0.308)** 0.205)**(1.14)** (0.52)**
Separate bargaining, groups of unions -0.103)** 0.143)**(0.35)** (0.31)**
Multi-union, arrangement missing -1.104)** -1.427)**(1.51)** (2.24)**
Respondent characteristics:
Non-ER specialist 0.307)** 0.391)**(2.60)** (2.81)**
Workforce composition:
% female 0.004)** 0.007)**(1.37)** (1.87)**
% part-time -0.007)** -0.008)**(2.22)** (1.94)**
Workplace characteristics:
500 or more employees 0.329)** 0.338)**(2.16)** (1.69)**
Employment growth in last year 0.032)** 0.032)**(0.30)** (0.23)**
Employment growth data missing -0.031)** -0.654)**(0.10)** (1.87)**
Standard industrial classification (ref: manufacturing)
Electricity, gas, water 0.830)** 0.973)**(2.02)** (2.46)**
Construction -0.010)** 0.176)**(0.04)** (0.45)**
Wholesale and retail 0.074)** 0.088)**(0.33)** (0.33)**
Hotels and restaurants 0.101)** 0.361)**(0.35)** (1.01)**
Transport and communication -0.068)** -0.464)**(0.21)** (1.81)**
Financial services 0.152)** 0.085)**(0.60)** (0.24)**
Other business services -0.104)** -0.166)**(0.48)** (0.65)**
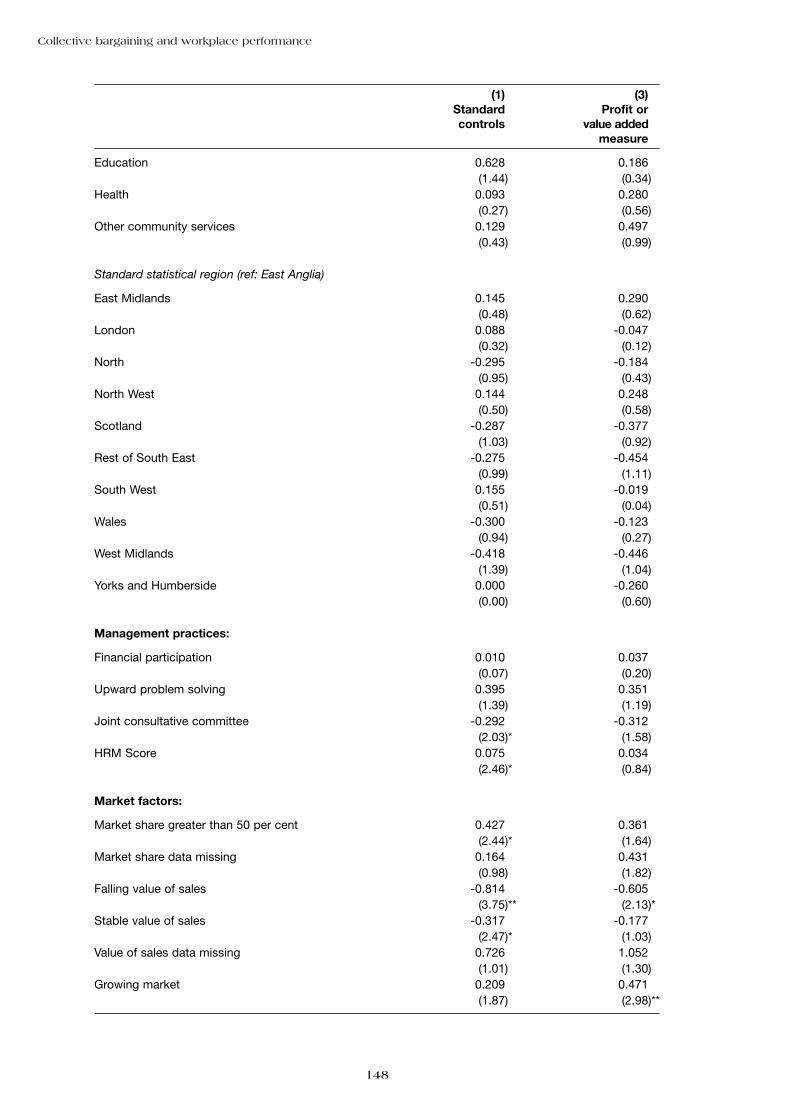
Collective bargaining and workplace performance
148
(1))** (3))**Standard)** Profit or)**controls)** value added)**
measure)**
Education 0.628)** 0.186)**(1.44)** (0.34)**
Health 0.093)** 0.280)**(0.27)** (0.56)**
Other community services 0.129)** 0.497)**(0.43)** (0.99)**
Standard statistical region (ref: East Anglia)
East Midlands 0.145)** 0.290)**(0.48)** (0.62)**
London 0.088)** -0.047)**(0.32)** (0.12)**
North -0.295)** -0.184)**(0.95)** (0.43)**
North West 0.144)** 0.248)**(0.50)** (0.58)**
Scotland -0.287)** -0.377)**(1.03)** (0.92)**
Rest of South East -0.275)** -0.454)**(0.99)** (1.11)**
South West 0.155)** -0.019)**(0.51)** (0.04)**
Wales -0.300)** -0.123)**(0.94)** (0.27)**
West Midlands -0.418)** -0.446)**(1.39)** (1.04)**
Yorks and Humberside 0.000)** -0.260)**(0.00)** (0.60)**
Management practices:
Financial participation 0.010)** 0.037)**(0.07)** (0.20)**
Upward problem solving 0.395)** 0.351)**(1.39)** (1.19)**
Joint consultative committee -0.292)** -0.312)**(2.03)** (1.58)**
HRM Score 0.075)** 0.034)**(2.46)** (0.84)**
Market factors:
Market share greater than 50 per cent 0.427)** 0.361)**(2.44)** (1.64)**
Market share data missing 0.164)** 0.431)**(0.98)** (1.82)**
Falling value of sales -0.814)** -0.605)**(3.75)** (2.13)**
Stable value of sales -0.317)** -0.177)**(2.47)** (1.03)**
Value of sales data missing 0.726)** 1.052)**(1.01)** (1.30)**
Growing market 0.209)** 0.471)**(1.87)** (2.98)**

Appendix tables
149
(1))** (3))**Standard)** Profit or)**controls)** value added)**
measure)**
Low or very low competition -0.272)** -1.042)**(1.10)** (3.26)**
Single product or service -0.263)** -0.406)**(2.09)** (2.52)**
Observations 1127)** 715)**F statistics (44,1019)** (44,615)**
= 2.30)** = 2.37)**
Absolute value of t-statistics in parentheses* significant at 5%; ** significant at 1%

Collective bargaining and workplace performance
150
Appendix Table A6.4 ‘Baseline’ models estimating impact of bargaining levels onworkplace financial performance
Whole economy)**)** Private trading sector)**with controls)**
(1))** (2))** (3))** (4))**No)** With)** All)** Profit/value)**
controls)** controls)** wkplaces)**added measure)**
Bargaining:Collective bargaining levels (ref: no recognition and no coverage)
No recognition and minority coverage -0.255)** -0.137)** 0.484)** 0.347)**(0.42)** (0.27)** (1.58)** (0.63)**
No recognition and majority coverage -0.120)** -0.244)** -0.437)** -0.542)**(0.70)** (1.39)** (2.11)** (1.69)**
Recognition and zero coverage 0.056)** 0.136)** 0.017)** -0.216)**(0.34)** (0.75)** (0.06)** (0.83)**
Recognition and minority coverage -0.072)** 0.026)** -0.361)** -0.253)**(0.42)** (0.13)** (1.46)** (0.54)**
Recognition and majority coverage, workplace-level -0.023)** 0.002)** 0.047)** 0.259)**Recognition and majority coverage, (0.13)** (0.01)** (0.20)** (0.95)**organisation-level -0.104)** -0.081)** -0.076)** 0.110)**Recognition and majority coverage, (0.77)** (0.55)** (0.39)** (0.40)**industry-level -0.042)** 0.283)** 0.257)** 0.605)**Recognition and majority coverage, (0.25)** (1.47)** (0.96)** (2.25)**multiple-level -0.140)** -0.194)** -0.468)** -0.380)*
(0.46)** (0.52)** (1.66)** (1.04)**Respondent characteristics:
Non-ER specialist 0.252)** 0.336)** 0.376)**(2.48)** (2.78)** (2.66)**
Workforce composition:
% female 0.005)** 0.004)** 0.008)**(2.06)** (1.39)** (2.14)**
% part-time -0.004)** -0.007)** -0.008)**(1.69)** (2.25)** (1.91)**
Workplace characteristics:
500 or more employees 0.364)** 0.394)** 0.391)**(3.42)** (2.63)** (1.87)**
Employment growth in last year 0.287)** 0.033)** 0.069)**(2.91)** (0.30)** (0.47)**
Employment growth data missing 0.027)** -0.168)** -0.772)**(0.07)** (0.44)** (2.10)**
Public sector -0.484)**(2.67)**
Standard industrial classification (ref: manufacturing)
Electricity, gas, water 0.264)** 0.790)** 1.031)**(1.23)** (2.23)** (3.09)**
Construction -0.061)** 0.005)** 0.184)**(0.26)** (0.02)** (0.44)**
Wholesale and retail -0.072)** 0.086)** 0.122)**(0.31)** (0.37)** (0.44)**
Hotels and restaurants 0.090)** 0.167)** 0.372)**(0.33)** (0.57)** (1.01)**

Appendix tables
151
Whole economy)**)** Private trading sector)**with controls)**
(1))** (2))** (3))** (4))**No)** With)** All)** Profit/value)**
controls)** controls)** wkplaces)**added measure)**
Transport and communication 0.126)** -0.063)** -0.437)**(0.57)** (0.18)** (1.67)**
Financial services -0.123)** 0.153)** 0.016)**(0.51)** (0.60)** (0.05)**
Other business services -0.163)** -0.089)** -0.155)**(0.72)** (0.40)** (0.58)**
Public administration 0.424)** )**(1.70)**
Education 0.056)** 0.672)** 0.197)**(0.18)** (1.51)** (0.38)**
Health -0.178)** 0.116)** 0.322)**(0.61)** (0.34)** (0.64)**
Other community services 0.225)** 0.112)** 0.561)**(0.83)** (0.36)** (1.06)**
Standard statistical region (ref: East Anglia)
East Midlands 0.153)** 0.042)** 0.181)**(0.66)** (0.13)** (0.38)**
London 0.172)** -0.055)** -0.115)**(0.76)** (0.19)** (0.28)**
North -0.105)** -0.478)** -0.301)**(0.41)** (1.50)** (0.69)**
North West -0.083)** -0.044)** 0.122)**(0.35)** (0.14)** (0.28)**
Scotland -0.279)** -0.440)** -0.453)**(1.16)** (1.50)** (1.10)**
Rest of South East -0.203)** -0.471)** -0.575)**(0.90)** (1.63)** (1.40)**
South West 0.119)** 0.007)** -0.097)**(0.45)** (0.02)** (0.21)**
Wales -0.359)** -0.478)** -0.189)**(1.53)** (1.45)** (0.41)**
West Midlands -0.299)** -0.571)** -0.483)**(1.23)** (1.85)** (1.14)**
Yorks and Humberside -0.073)** -0.169)** -0.387)**(0.27)** (0.54)** (0.91)**
Management practices:
Financial participation 0.180)** 0.008)** -0.009)**(1.50)** (0.06)** (0.05)**
Upward problem solving 0.378)** 0.437)** 0.478)**(1.46)** (1.54)** (1.58)**
Joint consultative committee -0.250)** -0.293)** -0.332)**(2.19)** (1.99)** (1.69)**
HRM score 0.081)** 0.082)** 0.041)**(2.98)** (2.59)** (0.96)**

Collective bargaining and workplace performance
152
Whole economy)**)** Private trading sector)**with controls)**
(1))** (2))** (3))** (4))**No)** With)** All)** Profit/value)**
controls)** controls)** wkplaces)**added measure)**
Market factors:
Market share greater than 50 per cent 0.432)** 0.457)**(2.33)** (1.87)**
Market share data missing 0.135)** 0.391)**(0.81)** (1.63)**
Falling value of sales -0.754)** -0.555)**(3.38)** (1.94)**
Stable value of sales -0.359)** -0.242)**(2.58)** (1.36)**
Value of sales data missing 0.941)** 0.979)**(1.21)** (1.20)**
Growing market 0.214)** 0.530)**(1.87)** (3.15)**
Low or very low competition -0.295)** -1.198)**(1.17)** (3.68)**
Single product or service -0.250)** -0.424)**(1.95)** (2.57)**
Observations 1775)** 1772)** 1090)** 693)**F statistics (8,1697)** (41,1661)** (47,980)** (47,590)**
= 0.20)** = 2.88)** = 2.72)** = 2.45)**
Absolute value of t-statistics in parentheses* significant at 5%; ** significant at 1%
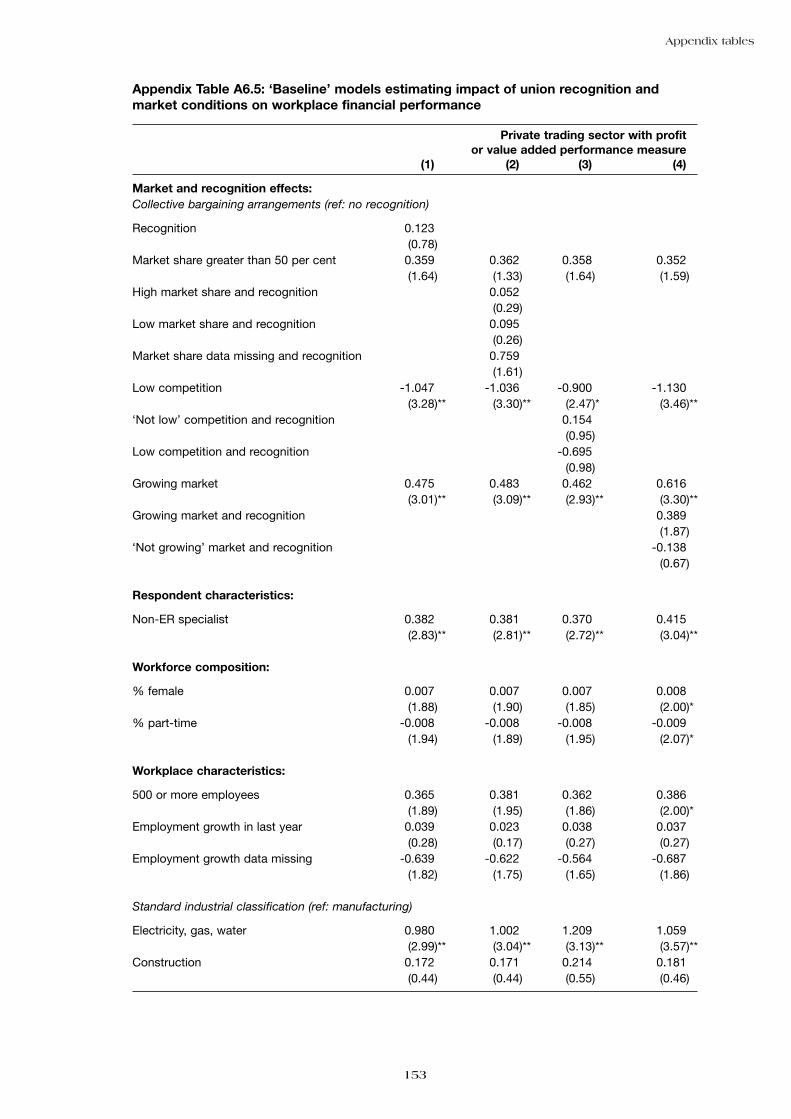
Appendix tables
153
Appendix Table A6.5: ‘Baseline’ models estimating impact of union recognition andmarket conditions on workplace financial performance
Private trading sector with profit)**or value added performance measure)**
(1))** (2))** (3))** (4))**
Market and recognition effects:Collective bargaining arrangements (ref: no recognition)
Recognition 0.123)**(0.78)**
Market share greater than 50 per cent 0.359)** 0.362)** 0.358)** 0.352)**(1.64)** (1.33)** (1.64)** (1.59)**
High market share and recognition 0.052)**(0.29)**
Low market share and recognition 0.095)**(0.26)**
Market share data missing and recognition 0.759)**(1.61)**
Low competition -1.047)** -1.036)** -0.900)** -1.130)**(3.28)** (3.30)** (2.47)** (3.46)**
‘Not low’ competition and recognition 0.154)**(0.95)**
Low competition and recognition -0.695)**(0.98)**
Growing market 0.475)** 0.483)** 0.462)** 0.616)**(3.01)** (3.09)** (2.93)** (3.30)**
Growing market and recognition 0.389)**(1.87)**
‘Not growing’ market and recognition -0.138)**(0.67)**
*Respondent characteristics:
Non-ER specialist 0.382)** 0.381)** 0.370)** 0.415)**(2.83)** (2.81)** (2.72)** (3.04)**
Workforce composition:
% female 0.007)** 0.007)** 0.007)** 0.008)**(1.88)** (1.90)** (1.85)** (2.00)**
% part-time -0.008)** -0.008)** -0.008)** -0.009)**(1.94)** (1.89)** (1.95)** (2.07)**
Workplace characteristics:
500 or more employees 0.365)** 0.381)** 0.362)** 0.386)**(1.89)** (1.95)** (1.86)** (2.00)**
Employment growth in last year 0.039)** 0.023)** 0.038)** 0.037)**(0.28)** (0.17)** (0.27)** (0.27)**
Employment growth data missing -0.639)** -0.622)** -0.564)** -0.687)**(1.82)** (1.75)** (1.65)** (1.86)**
Standard industrial classification (ref: manufacturing)
Electricity, gas, water 0.980)** 1.002)** 1.209)** 1.059)**(2.99)** (3.04)** (3.13)** (3.57)**
Construction 0.172)** 0.171)** 0.214)** 0.181)**(0.44)** (0.44)** (0.55)** (0.46)**

Collective bargaining and workplace performance
154
Private trading sector with profit)**or value added performance measure)**
(1))** (2))** (3))** (4))**
Wholesale and retail 0.082)** 0.096)** 0.096)** 0.086)**(0.31)** (0.36)** (0.36)** (0.33)**
Hotels and restaurants 0.349)** 0.357)** 0.353)** 0.382)**(0.98)** (0.99)** (0.99)** (1.08)**
Transport and communication -0.457)** -0.544)** -0.436)** 0.509)**(1.79)** (2.01)** (1.68)** (1.94)**
Financial services -0.013)** -0.041)** -0.025)** -0.020)**(0.04)** (0.12)** (0.07)** (0.06)**
Other business services -0.172)** -0.190)** -0.155)** -0.196)**(0.68)** (0.73)** (0.60)** (0.77)**
Education 0.190)** 0.162)** 0.210)** 0.188)**(0.35)** (0.30)** (0.39)** (0.37)**
Health 0.270)** 0.249)** 0.268)** 0.314)**(0.54)** (0.49)** (0.53)** (0.64)**
Other community services 0.502)** 0.502)** 0.486)** 0.519)**(1.01)** (0.97)** (0.94)** (1.02)**
Standard statistical region (ref: East Anglia)
East Midlands 0.295)** 0.242)** 0.302)** 0.292)**(0.63)** (0.53)** (0.65)** (0.61)**
London -0.069)** -0.094)** -0.058)** -0.069)**(0.17)** (0.24)** (0.14)** (0.16)**
North -0.163)** -0.235)** -0.148)** -0.191)**(0.38)** (0.57)** (0.34)** (0.43)**
North West 0.250)** 0.175)** 0.261)** 0.229)**(0.58)** (0.41)** (0.61)** (0.51)**
Scotland -0.370)** -0.388)** -0.344)** -0.409)**(0.90)** (0.98)** (0.84)** (0.96)**
Rest of South East -0.457)** -0.500)** -0.449)** -0.473)**(1.11)** (1.25)** (1.10)** (1.10)**
South West -0.009)** -0.047)** 0.000)** -0.067)**(0.02)** (0.11)** (0.00)** (0.14)**
Wales -0.117)** -0.122)** -0.163)** -0.129)**(0.26)** (0.28)** (0.36)** (0.28)**
West Midlands -0.444)** -0.484)** -0.436)** -0.411)**(1.04)** (1.16)** (1.02)** (0.93)**
Yorks and Humberside -0.258)** -0.302)** -0.238)** -0.319)**(0.60)** (0.71)** (0.55)** (0.70)**
)**Management practices:
Financial participation 0.033)** 0.005)** 0.040)** 0.010)**(0.18)** (0.03)** (0.22)** (0.06)**
Upward problem solving 0.351)** 0.361)** 0.301)** 0.348)**(1.18)** (1.21)** (1.05)** (1.14)**
Joint consultative committee -0.329)** -0.321)** -0.330)** -0.329)**(1.70)** (1.66)** (1.70)** (1.75)**
HRM score 0.034)** 0.035)** 0.033)** 0.035)**(0.85)** (0.86)** (0.81)** (0.87)**
Market factors:
Market share data missing 0.439)** 0.259)** 0.429)** 0.440)**(1.86)** (0.90)** (1.80)** (1.87)**
Falling value of sales -0.614)** -0.606)** -0.607)** -0.560)**(2.22)** (2.18)** (2.18)** (2.05)**
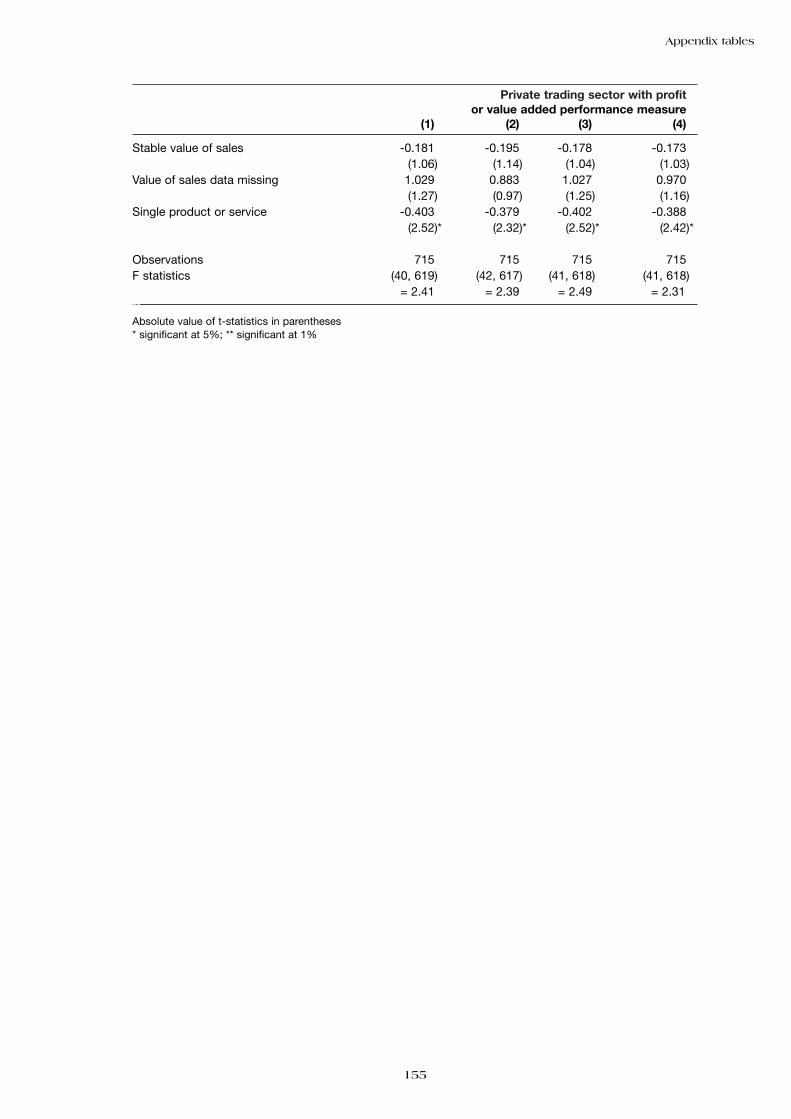
Private trading sector with profit)**or value added performance measure)**
(1))** (2))** (3))** (4))**
Stable value of sales -0.181)** -0.195)** -0.178)** -0.173)**(1.06)** (1.14)** (1.04)** (1.03)**
Value of sales data missing 1.029)** 0.883)** 1.027)** 0.970)**(1.27)** (0.97)** (1.25)** (1.16)**
Single product or service -0.403)** -0.379)** -0.402)** -0.388)**(2.52)** (2.32)** (2.52)** (2.42)**
Observations 715)** 715)** 715)** 715)**F statistics (40, 619)** (42, 617)** (41, 618)** (41, 618)**
= 2.41)** = 2.39)** = 2.49)** = 2.31)**)**Absolute value of t-statistics in parentheses* significant at 5%; ** significant at 1%
Appendix tables
155