NEW BUYERS’ ARRIVAL UNDER DYNAMIC PRICING...
35
1 NEW BUYERS’ ARRIVAL UNDER DYNAMIC PRICING MARKET MICROSTRUCTURE: THE CASE OF GROUP-BUYING DISCOUNTS ON THE INTERNET Robert J. Kauffman Professor and Department Chair, Information and Decision Sciences Bin Wang Doctoral Program in Information and Decision Sciences Information and Decision Sciences Carlson School of Management University of Minnesota Minneapolis, MN 55455 {rkauffman;bwang}@csom.umn.edu Note: An earlier version of this paper appeared in Proceedings of the 34 th Hawaii Conference on Systems Science, Maui, HI, IEEE Computer Society Press, Los Alamitos, CA, 2001. Forthcoming in the Journal of Management Information Systems, Fall 2001. _____________________________________________________________________________________ ABSTRACT Dynamic pricing mechanisms occur on the Internet when buyers and sellers negotiate the final transaction price for the exchange of goods or services. These mechanisms are used in online auctions (e.g., eBay.com, uBid.com) and name-your-own-price (Priceline.com) formats, for example. The current research studies the dynamics of one instance of dynamic pricing -- group-buying discounts -- used by MobShop.com, whose products’ selling prices drop as more buyers place their orders. We collect and analyze changes in the number of orders for MobShop-listed products over various periods of time, using an econometric model that reflects our understanding of bidder behavior in the presence of dynamic pricing and different levels of bidder participation. We find that the number of existing orders has a significant positive effect on new orders placed during each three-hour period, indicating the presence of a positive participation externality effect . We also find evidence for expectations of falling prices, a price drop effect . This occurs when the number of orders approaches the next price drop level and the price level for transacting will fall in the near future. The results also reveal a significant ending effect , as more orders were placed during the last three-hour period of the auction cycles. We also assess the efficacy of group-buying business models to shed light on the recent failures of many group-buying Web sites. Keywords: Bidding, dynamic pricing, electronic markets, group-buying discounts, Internet-based selling, market microstructure, online retailing, pricing mechanisms. _____________________________________________________________________________________ Acknowledgements. The authors wish to thank Baba Prasad, Eric Clemons, Rajiv Dewan, Yu-Ming Wang and Andrew Whinston, as well as five anonymous referees from the HICSS-34 and IJEC reviewing processes, for helpful suggestions and comments. Special thanks also are due to the participants in the “Economics, Information Systems and Electronic Commerce Doctoral Seminar,” held at the Carlson School of Management of the University of Minnesota during Spring 2000, for comments on an earlier version of this research. We also appreciated the assistance of Mark Melville and Becky Porter at MobShop.com in San Francisco with interviews and data collection. An earlier version of this paper appeared in Proceedings of the 34 th Hawaii Conference on Systems Science, Maui, HI, IEEE Computer Society Press, Los Alamitos, CA, 2001. All errors of fact or interpretation are the sole responsibility of the authors.
Transcript of NEW BUYERS’ ARRIVAL UNDER DYNAMIC PRICING...

1
NEW BUYERS’ ARRIVAL UNDER DYNAMIC PRICING MARKET MICROSTRUCTURE: THE CASE OF GROUP-BUYING DISCOUNTS ON THE INTERNET
Robert J. Kauffman
Professor and Department Chair, Information and Decision Sciences
Bin Wang Doctoral Program in Information and Decision Sciences
Information and Decision Sciences
Carlson School of Management University of Minnesota Minneapolis, MN 55455
{rkauffman;bwang}@csom.umn.edu
Note: An earlier version of this paper appeared in Proceedings of the 34th Hawaii Conference on Systems Science, Maui, HI, IEEE Computer Society Press, Los Alamitos, CA, 2001. Forthcoming in the Journal of Management Information Systems, Fall 2001.
_____________________________________________________________________________________
ABSTRACT
Dynamic pricing mechanisms occur on the Internet when buyers and sellers negotiate the final transaction price for the exchange of goods or services. These mechanisms are used in online auctions (e.g., eBay.com, uBid.com) and name-your-own-price (Priceline.com) formats, for example. The current research studies the dynamics of one instance of dynamic pricing -- group-buying discounts -- used by MobShop.com, whose products’ selling prices drop as more buyers place their orders. We collect and analyze changes in the number of orders for MobShop-listed products over various periods of time, using an econometric model that reflects our understanding of bidder behavior in the presence of dynamic pricing and different levels of bidder participation. We find that the number of existing orders has a significant positive effect on new orders placed during each three-hour period, indicating the presence of a positive participation externality effect. We also find evidence for expectations of falling prices, a price drop effect. This occurs when the number of orders approaches the next price drop level and the price level for transacting will fall in the near future. The results also reveal a significant ending effect, as more orders were placed during the last three-hour period of the auction cycles. We also assess the efficacy of group-buying business models to shed light on the recent failures of many group-buying Web sites.
Keywords: Bidding, dynamic pricing, electronic markets, group-buying discounts, Internet-based selling, market microstructure, online retailing, pricing mechanisms.
_____________________________________________________________________________________
Acknowledgements. The authors wish to thank Baba Prasad, Eric Clemons, Rajiv Dewan, Yu-Ming Wang and Andrew Whinston, as well as five anonymous referees from the HICSS-34 and IJEC reviewing processes, for helpful suggestions and comments. Special thanks also are due to the participants in the “Economics, Information Systems and Electronic Commerce Doctoral Seminar,” held at the Carlson School of Management of the University of Minnesota during Spring 2000, for comments on an earlier version of this research. We also appreciated the assistance of Mark Melville and Becky Porter at MobShop.com in San Francisco with interviews and data collection. An earlier version of this paper appeared in Proceedings of the 34th Hawaii Conference on Systems Science, Maui, HI, IEEE Computer Society Press, Los Alamitos, CA, 2001. All errors of fact or interpretation are the sole responsibility of the authors.

2
INTRODUCTION
Recent years have witnessed exceptional growth in the number of online retailers and total consumer
expenditures on the Internet. According to Forrester Research, a Cambridge, Massachusetts-based
marketing research firm, U.S. consumer online spending will increase to $71 billion this year, a 64%
increase from the $45 billion of 2000 (Scheraga, 2001). And, even though online retail sales still only
accounted for 1% of the total in 1999, more than $184 billion will be spent by 49 million U.S. households
who shop online, increasing the online portion to 7% of total retail expenditure by 2004 (Corral, 1999).
Clearly, the market is poised for tremendous growth, and the stage is set for electronic commerce on the
World Wide Web to play an even greater role in the overall retail economy.
According to Bakos (1998), the main function of a market is to facilitate transactions between buyers
and sellers based on its institutional infrastructure. Among the various functions of market
intermediaries, Spulber (1996) argues that pricing to match buyers and sellers is perhaps the most
important one. In the traditional retail world, posted prices have been the dominant strategy, leaving
buyers with only a take-it-or-leave-it choice. However, this widely used pricing mechanism is not
necessarily the optimal one. For example, Wang (1993) compares posted-price selling with auctions.
Under the independent private valuation assumption, Wang finds auctions to be optimal when auction
selling costs are zero or when the seller’s marginal revenue curve is steep. As a result, even if auctions
were costly, as long as there is a wide dispersion of buyer valuations, auctions will still outperform
posted-price selling.
The above example shows the advantage of dynamic pricing mechanisms, in which buyers and sellers
actively engage in the price discovery process. Because of electronic marketplaces’ ability to attract a
large numbers of buyers and sellers from different geographical areas and their lower operation costs,
dynamic pricing mechanisms such as auctions are being used in an ever-broader fashion. Today,
traditional dynamic pricing mechanisms serve as the core business models for many Internet-based
electronic markets. They include eBay, Amazon.com and Ubid.com, among many others. Indicative of
its attractiveness to consumers in the Internet marketplace, the registered users of eBay increased to 22
million by the end of 2000, and almost 265 million items were listed on their site that year with about
$5.4 billion worth of completed transactions (eBay, 2000). Other new approaches are also attracting
consumers, however. They include dynamic pricing mechanisms such as the name-your-own-price
approach of Priceline.com and bid solicitation from LiquidPrice.com. Another source predicts that the
number of dynamic pricing-enabled transactions will approach 561 billion in 2004, accounting for about
40% of all Internet transactions, up from 14.5% in 1999 (Andrews, 1999). Clearly, this increase in
consumer participation in the price-setting process is a bellwether of the future of Internet-based
transaction-making (Bakos, 1998; Kauffman and Riggins, 1998).
3
Recently, two online retailers – first Mercata.com in September 1998, and then Accompany.com
(now MobShop.com) in October 1998 – began to employ a new type of dynamic pricing model called
group-buying discounts. With this approach, consumers can pool their purchase volume together --
without any specific efforts made to coordinate their bids -- to get a lower price, assisted by the market-
making efforts of the online retailer itself. Mercata and MobShop’s innovative business models not only
received favorable press reviews (Andrews, 1999; Mara, 2000), but also once stimulated entry into the
group-buying market by AOL and Yahoo! (Mara, 2000). By spring 2000, the number of group-buying
Web sites worldwide had increased to twelve (Kauffman and Wang, 2002). However, starting from
summer 2000, group-buying companies began to struggle for survival, and many ultimately would fail.
The combined forces of competition from other online and offline retailers, declining market interest on
the part of consumers, a slowing digital economy, and venture capitalists who were reluctant to invest
more funds forced four group-buying firms out of the market and another three to change their strategic
focus to software licensing.
Since the group-buying discount-pricing mechanism is still a new phenomenon on the Internet, there
have been no studies that have examined the performance of this market microstructure, and the nature of
the bidder behavior that can be observed as the market operates. Research on consumer behavior under
the group-buying market structure can help both academic researchers and industrial practitioners better
understand this new kind of market intermediary, and the efficacy of the market mechanism that it
provides to market participants.
The overall purpose of this paper is to study the operation of the group-buying discount market
microstructure, and to understand its performance characteristics, in the broader context of declining
market interest. We will examine consumers’ aggregate bidding behavior on the MobShop Web site,
with reference to a conceptual model for expected bidder behaviors that is motivated by theoretical
perspectives from the study of auctions, consumer behavior, and network externality analysis.
Our primary research questions are:
q Can we build a model with which consumers’ aggregate bidding behavior can be predicted?
q How might the theory on network externalities inform us in our understanding of consumer
behavior under the group-buying discount market structure? Specifically, how will the number of
new orders placed be influenced by the number of existing orders?
q How can the concept of a “price threshold” and consumers’ expectations about future price help
us to more accurately model the “price drop effect” that is observed on MobShop?
q As a business model that failed in many cases, how should we understand the efficacy of group-
buying discounts? What were the factors behind the failure of the group-buying business model?
There are four primary findings that emerged from our empirical analysis using an econometric

4
model of bidding arrivals, and our qualitative assessment of the group-buying business models. First,
there is a positive participation externality effect in the group-buying discount market microstructure: the
number of existing orders has a significant and positive effect on the number of new orders placed during
pre-defined periods of equal duration. Second, we find evidence for an expected price drop effect when
the total number of orders approaches the required quantity of the next price tier. This is indicated by
more new orders being placed during those periods. Third, our results also reveal a significant market
ending effect, as is commonly observed in various auction market settings. In the case of MobShop, more
orders appear to be placed during the final time period of the auction cycle. Fourth, we found that the
frailty of the group-buying business models are relatively easily identified in terms of their lack of the key
elements for sustainable competitive advantage.
LITERATURE
Four research streams are useful in informing our exploration of the group-buying discount approach
to dynamic pricing on the Internet, and laying the foundation for our theoretical treatment of this new
market microstructure. We will first discuss prior work on auction, primarily from the Economics
literature, and then we will turn to a discussion of relevant research from consumer behavior in Marketing
Science. Next, we consider the role that participation externalities may play in influencing bidder
behavior, motivated by recent research in Information Systems (IS) and Economics. We round out our
coverage of the literature by examining impact of sustainable competitive advantage on company
performance.
Auction Theory
Economists have extensively studied auctions to understand their properties as a dynamic pricing
market structure (e.g., McAfee and McMillan, 1987; Milgrom and Weber, 1982; Vickrey, 1961). This
work has involved both analytical modeling and empirical testing approaches. The different auction
mechanisms studied include the English auction (or ascending-bid auction), the Dutch auction
(descending-bid auction), the first-price sealed-bid auction, and the Vickrey auction (second-price sealed-
bid auction).
The rapid adoption in the Internet marketplace of online auctions has attracted IS researchers to the
study of the application of various kinds of market microstructures, such as these auction formats we
have just described, in the new context of the Internet. Among the problems and issues that have been
examined, developing a better understanding of bidder strategies and bidder behavior has become an
especially important issue for study. For example, Bapna, Goes and Gupta (2000) analyzed the strategies
of online auction bidders and found there are different types of bidders, not all of whom always exhibit
rational behavior in value maximization terms. The authors divided bidders into three categories:

5
evaluators, participators and opportunists. Evaluators are those who know clearly their true valuation of
the good and submit high bids at the early stages of the auctions. Participators are bidders who follow the
bidding closely and place ascending bids. Opportunists are driven by thoughts of getting bargains; they
usually place the lowest possible bids toward the end of an auction. Their research clearly indicates the
existence of bargain hunters in the electronic marketplace, which ties closely to the target market of
group-buying business models and relates to the failure of many group-buying sites, as we will explain
later in our assessment of group-buying business models.
Vakrat and Seidmann (2000) found that the number of bidders – or bid density -- in an auction is
closely related to a number of factors. These include the duration of the auction, the minimum bid
increment required, the quantity of items available and the average closing price. Their results suggest
that information provided to bidders in online auctions is critical in their decision-making processes. In
other research on coin auctions at eBay, Bajari and Hortacsu (2000) find higher bidding intensities toward
the end of the auctions. In addition, they measure the extent of the winner’s curse and find a 3.2%
decrease in a bidder’s expected profits with each additional expected bidder. Their results also suggest
bidders only enter those auctions that they are likely to win, and they make their decisions to participate
based on an expected profit of $3.20 or higher.
Consumer Behavior
A second area of relevant research is consumer behavior in the Marketing Science literature. There,
we find useful theories that enable us to better understand how bidders and potential buyers view price
changes, how their expectations about future prices develop, and what their attitudes toward risk affect
their behavior.
Bidder and buyer reactions to prices are especially worthwhile to consider in the context of group-
buying discount electronic markets. When exposed to a physical stimulus from the external world, a
person may not be able to detect it all the time. Just as the weight of a feather falling on the hand of a
person may not be felt, price changes can also act as stimuli that may or may not be responded to by
potential buyers because they are too small. Even though Drakopoulos (1992) does not use the term
explicitly, he explains the main idea of price indifference thresholds, which refer to the minimum price
changes required for consumers to detect the differences. By incorporating a threshold into a demand
curve, he proposes that when a price change is smaller than some critical threshold, consumers will not
detect the price change. As a result, there will be no impact on demand, though a price change has
occurred. Change in demand will only occur when the price change is above the threshold. In our
research, we will refer to the rela ted term, price threshold , to indicate proximity in order quantity terms to
the quantity-price combination that reflects a drop in price to the lower-tier.
6
Research on consumer behavior has shown that other than the current price, consumers’ expectations
about future price can also influence their purchasing behavior. Winer (1985) incorporated expected
future prices into a household durable purchasing probability model and found that it was significant for
the purchasing decisions of color televisions. Krishna (1994) conducted an experiment to test the impacts
of consumer knowledge about future low price purchase opportunities. He found that consumers who
receive announcements about near term discount sales for large ticket item purchases are more likely to
hold off their purchases until the better prices appear than they would be otherwise.
In research on consumer attitudes related to risk-taking, prospect theory (Tversky and Kahneman,
1992) emphasizes the context-dependencies associated with human risk profiles. In general, individuals’
attitudes toward risk appear to vary considerably across different situations in which buyer behavior can
be observed. However, in their study of individual risk preferences, Dyer and Sarin (1982) argue that
individuals have a relative risk attitude that remains comparatively stable across different settings.
According to this measure of individual risk preference, risk attitudes can be quantified along a
continuum from risk-averse to risk-seeking. By suggesting a relatively stable risk preference ordering
across different settings, the authors differentiate two key factors that help to explain what we observe:
preference for the outcome and attitude toward risk . Specifically, when facing an uncertain outcome, a
person makes a decision based on her tradeoff between the value of the outcome and the risk associated
with it, and this decision will be influenced by the individual’s attitude toward risk (Sarin and Weber,
1993).
Demand Externalities
The final relevant thread from the literature that will enable us to gain insights into the performance
and mechanics of group-buying discounts is the network externalities literature. Network externalities
occur when the utility of using a technology increases as the network of adopters expands. They are often
observed as being important drivers of observed adoption behavior, as well as expectations in the market
about future adoption, in studies of the diffusion of new technologies (Katz and Sharpio, 1985; Shy,
1996). Economides (1996) distinguishes two types of networks. Two-way networks include telephone
systems, fax machines and e-mail, where it is possible to distinguish a “direction” of flow in a network,
and where users on both ends of a connection can share in the benefits. In these instances, the
externalities are direct and users enjoy a broader communication base as more and more people join a
given network or adopt a specific technology. One-way networks occur when network components come
together to form composite goods. Examples of one-way networks include paging networks and radio
broadcasting. The components are the broadcast node and the receiver, in each case, and consumers
exhibit demand only for the composite good. With this latter kind of network, consumers usually cannot

7
be identified with specific network nodes and the externalities are indirect, even though they are clearly
perceived in the marketplace. We argue later in the paper that group-buying electronic markets are one-
way networks.
In both cases, network users derive higher utility from networks with positive externalities.
Moreover, network externalities are known to increase an adopter’s willingness-to-pay. The overall effect
is that the demand curve for a good or a service will shift, resulting in what are called demand
externalities. However, demand externalities are not the same as price change-induced demand. Demand
will increase in the presence of lower prices. Demand externalities take effect through the upward shift of
demand curves, and the key driver for the increased demand is the higher utility a potential adopter
perceives due to the large network size, which in turn results in higher willingness-to-pay. For demand
increases due to price decreases, the result is just a simple movement along a demand curve.
Economists have developed a number of analytical models that lead us to an important conclusion for
the present research. They typically state the finding in terms of installed base of users, i.e., the number
of users of product, a service, a software or hardware platform, a technical standard, and so on. Network
externalities in the form of current installed base and expected installed base are important factors
influencing a potential adopter’s decision to select a product (Dybvig and Spatt, 1983). Results from
empirical testing of network externalities in a variety of applied contexts are generally supportive of this
installed base theory.
For example, using hedonic price regression models for computer spreadsheet market, Gandal (1994)
finds that software packages that were compatible with the Lotus platform at that time were associated
with higher levels of consumers’ willingness-to-pay. The author interpreted this result as being indicative
of the presence of network externalities. In another study of the spreadsheet software market,
Brynjolfsson and Kemerer (1996) use a hedonic value model and find that the prices of packaged
software “suites” in the mid-1990s were positively related to their installed base of users. In a similar
vein, Economides and Himmelberg (1995) report that network externalities sped up adoption in the
market for fax machines early in the 1990s. Kauffman, McAndrews and Wang (2000) also test network
externality theory in electronic banking. Using a model that characterizes expected durations of firm
adoption of a network, the authors found that banking firms that have a higher expected effective network
size tended to be earlier adopters.
Taken together, the perspective that emerges from this literature can inform our understanding of the
performance of Web sites that provide group-buying discount auction markets. This is because the
essence of the perceived success of such a market by participants who wish to buy the goods it sells is the
installed base of bidding participants. Without their participation, there would be no critical mass of

8
interest that would serve to drive prices to lower and lower levels, benefiting all participants in the
process.
Sustainable Competitive Advantage
The strategic management literature has long recognized the importance of competitive advantage on
firm performance (e.g., Barney, 1991; Porter, 1985). Competitive advantage, which results from a firm’s
unique capabilities and resources according to Wernerfelt (1984), enables it to deliver superior value to its
customers at lower costs than do its competitors. In order to obtain long-term profitability, however,
competitive advantage has to be sustainable (Porter, 1985). Barney (1991) identifies four necessary
conditions for a capability or resource to be a source of sustainable competitive advantage.
q First, is has to be valuable.
q Second, it has to be rare among a firm’s competitors.
q Third, it has to be imperfectly imitable, which presents to a firm’s competitors with barriers to
entry.
q Fourth, there should not be any strategically-equivalent substitutes available for this capability or
resource.
Since competition based only upon price frequently lead to price wars and lower profitability, strategists
such as Porter (2001) and Slater (1996) tend to emphasize a firm’s ability extracting price premiums by
providing superior value to customers.
With intensified competition, lower barriers to entry, and higher buyer bargaining power, the Internet
marketplace poses companies great challenges, according to Porter (2001). He argues that many
DotComs targeted investors’ initial “blind faith” and lack of investing savvy to extract capital from the
financial markets. The “gold rush” was on, and many naïve stock prospectors were drawn into the
euphoria of a yet-to-burst financial market bubble, expecting the halo effect of the DotCom marketplace
to buoy the value of their e-commerce company investments. With the subsequent failure of many
DotComs and a discernible diminution in the attractiveness of Internet-only business models, however,
the focus has now shifted to long-term profitability and how these firms can achieve sustainable
competitive advantage. Porter (2001) posits that, instead of competing only on the price, the most
successful DotComs should now begin to charge higher prices for the enhanced value they create for their
customers. For Internet-based retailers, a loyal customer base and sustainable competitive advantage that
can lead to long-term profitability become even more important, since switching costs are low on the Web
and customer loyalty is somewhat diminished (Reichheld, 2000).

9
We now turn to a more in-depth discussion of the mechanics of group-buying discounts on the World
Wide Web. As we reveal the features of a representative Internet-based group-buying Web site and
discuss their implications relative to the four literatures that we have discussed, the bases for a conceptual
model that can characterize observed bidder behavior and the performance of the market as a whole will
become apparent.
RESEARCH CONTEXT
In this section, we first will review the overall development of group-buying business models from
1998 to 2001, then we will focus our discussion on the specifics of MobShop’s version of group-buying.
This will effectively set the context for the empirical modeling and econometric analysis that will follow.
The Rise and Fall of Group-Buying Business Models on the Internet
Volume discounts have been used widely in many offline buying clubs, such as CostCo and Sam’s
Club. But bringing volume discounts to the Internet is a fairly recent phenomenon. The two DotCom
pioneers of group-buying on the Internet – Mercata.com and MobShop.com – combined volume
discounts with a popular and readily understood dynamic pricing mechanism, and launched group-buying
Web sites in May 1999 and March 1999, respectively. By allowing retail buyers to aggregate their
purchases and to obtain lower prices, the firms pioneering the group-buying business models tried to
deliver “savings in numbers” to their customers.
Group-buying has been shown to be appealing to retail buyers in two respects. First, it is possible
(though never certain) that the final price paid will be lower than the purchase price for the same items at
other posted-price retailers, resulting in savings for the consumer. Second, group-buying gives buyers a
“sneak peak” at the internals of volume discounting, and the feel that they are actually haggling with
suppliers and wielding the power of aggregate purchasing (McHugh, 1999). Because of the lower price
buyers can obtain as the size of the buyer group grows larger, consumers have the incentive to recruit
other consumers, resulting in relatively lower customer acquisition cost for the retailer. While other
retailers emphasize the facilitation of searching for best prices and sale items that offer the right features,
the group-buying Web sites provide tools for their customers to seek out other new customers, to add to
the power-buying pools.
In their early stage of development, Mercata and MobShop were able to attract a significant market
following. Mara (2000), for example, reported that Mercata’s largest buying groups had more than
10,000 participants. MobShop, meanwhile, registered significant early successes; for example, we
observed MobShop accumulating 1000 orders for the Palm V PDA in just one-and-a-half days in spring
2000 using our data collection agent. Mercata and MobShop’s initial success also motivated the entry of
10
other group-buying firms into the electronic marketplace.
The twelve group-buying firms that were in operation by early 2000 were primarily based in the U.S.;
just a couple operated in Europe. They included Mercata.com, Accompany.com (which later changed it
name to MobShop.com, www.mobshop.com), actBIG.com (now Etrana.com, www.etrana.com), C-
Tribe.com, DemandLine.com (www.demandline.com), OnlineChoice.com, PointSpeed.com,
SHOP2gether (www.shop2gether.com), VolumeBuy.com (www.volumebuy.com), Zwirl.com
(www.zwirl.com), and Let’s Buy It (www.letsbuyit.com) and CoShopper.com (www.coshopper.com) in
Europe (Kauffman and Wang, 2002). The products and services offered on these Web sites range from
the sale of computer hardware, electronics, and office supplies, to offline retail gift certificates, vacation
packages, telephone services and electricity. Their customers included consumers, businesses, education
market and even government agencies.
Starting from summer 2000 and paralleling the slowing digital economy, group-buying firms started
to experience fierce competition, declining market interest, lower margins because of higher prices from
their suppliers, and increasingly reluctant venture capitalists. Four companies -- Mercata, C-Tribe,
OnlineChoice, and PointSpeed -- were forced out of the market, and another three -- MobShop, actBIG,
and Zwirl -- changed their strategic emphasis to software licensing. Those that are still in existence are
struggling to survive. For example, Europe based Let’s Buy It filed for bankruptcy in December 2000,
and was able to resume its operation in February 2001 after an additional round of successful funding
(LetsBuyIt.com, 2001). However, the limited number of orders on their site reveals that the company
faces a daunting task to ever achieve profitability.
MobShop.com
When MobShop launched its beta Web site in March 1999, its founders were motivated by the idea of
being a unique intermediary between consumers and businesses that could accumulate “collective
bargaining power” for consumers. The basic business model, then, was to create an “e-shopping club.”
Even though MobShop’s business model was widely touted as being “innovative and pioneering,” a
number of analysts also pointed out that the company faced the problem of consumer acceptance and
achieving critical mass in buyer participation (Kerstetter, 1999).
To answer the research questions we initially laid out in this article, it is appropriate for us to look
closely at some of the details of this company’s group-buying market mechanism. We also need to
identify the salient aspects that are likely to require special consideration in the development of a model
that predicts bidder behavior. Before a product is put up for sale on MobShop’s Web site, fixed starting
and ending times must be determined for the selling process. This is similar to what occurs in a call
11
market microstructure in the financial markets (Economides and Schwartz, 1995). The period during
which consumers can purchase the product on MobShop’s Web site is called an auction cycle . As the
number of units sold in a MobShop auction cycle increases, the price of the product will drop according
to a pre-determined dynamic pricing strategy.
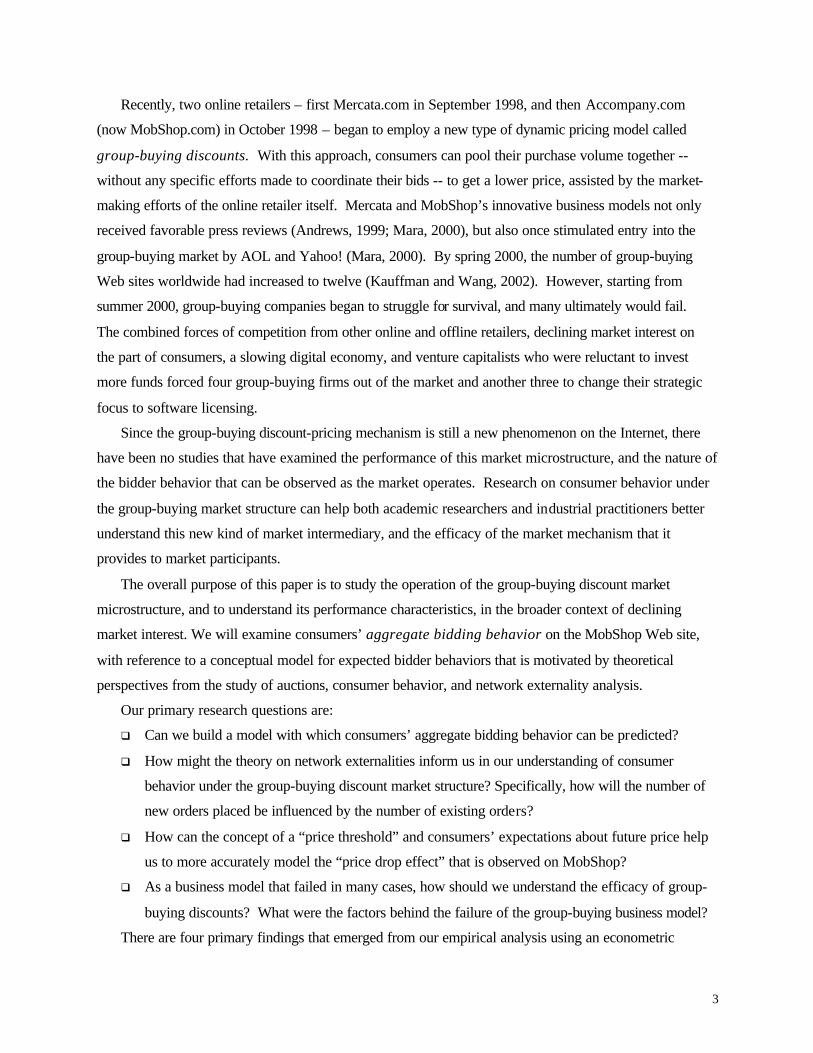
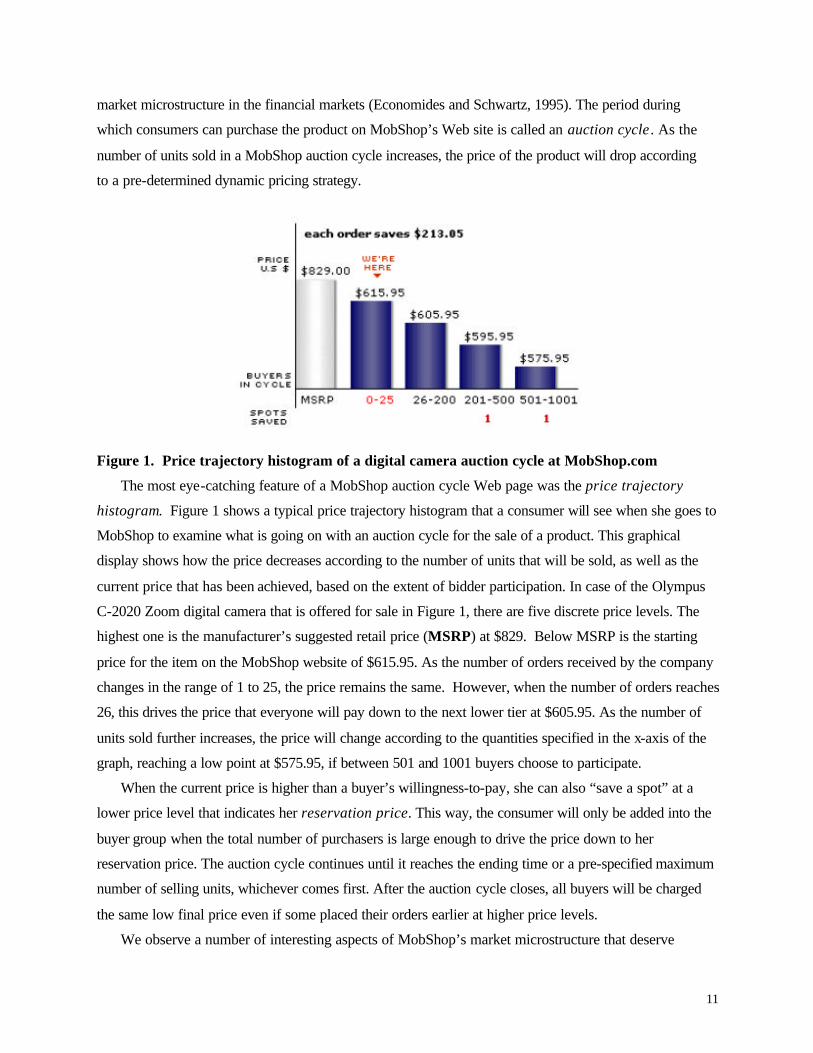
Figure 1. Price trajectory histogram of a digital camera auction cycle at MobShop.com
The most eye-catching feature of a MobShop auction cycle Web page was the price trajectory
histogram. Figure 1 shows a typical price trajectory histogram that a consumer will see when she goes to
MobShop to examine what is going on with an auction cycle for the sale of a product. This graphical
display shows how the price decreases according to the number of units that will be sold, as well as the
current price that has been achieved, based on the extent of bidder participation. In case of the Olympus
C-2020 Zoom digital camera that is offered for sale in Figure 1, there are five discrete price levels. The
highest one is the manufacturer’s suggested retail price (MSRP) at $829. Below MSRP is the starting
price for the item on the MobShop website of $615.95. As the number of orders received by the company
changes in the range of 1 to 25, the price remains the same. However, when the number of orders reaches
26, this drives the price that everyone will pay down to the next lower tier at $605.95. As the number of
units sold further increases, the price will change according to the quantities specified in the x-axis of the
graph, reaching a low point at $575.95, if between 501 and 1001 buyers choose to participate.
When the current price is higher than a buyer’s willingness-to-pay, she can also “save a spot” at a
lower price level that indicates her reservation price. This way, the consumer will only be added into the
buyer group when the total number of purchasers is large enough to drive the price down to her
reservation price. The auction cycle continues until it reaches the ending time or a pre-specified maximum
number of selling units, whichever comes first. After the auction cycle closes, all buyers will be charged
the same low final price even if some placed their orders earlier at higher price levels.
We observe a number of interesting aspects of MobShop’s market microstructure that deserve
12
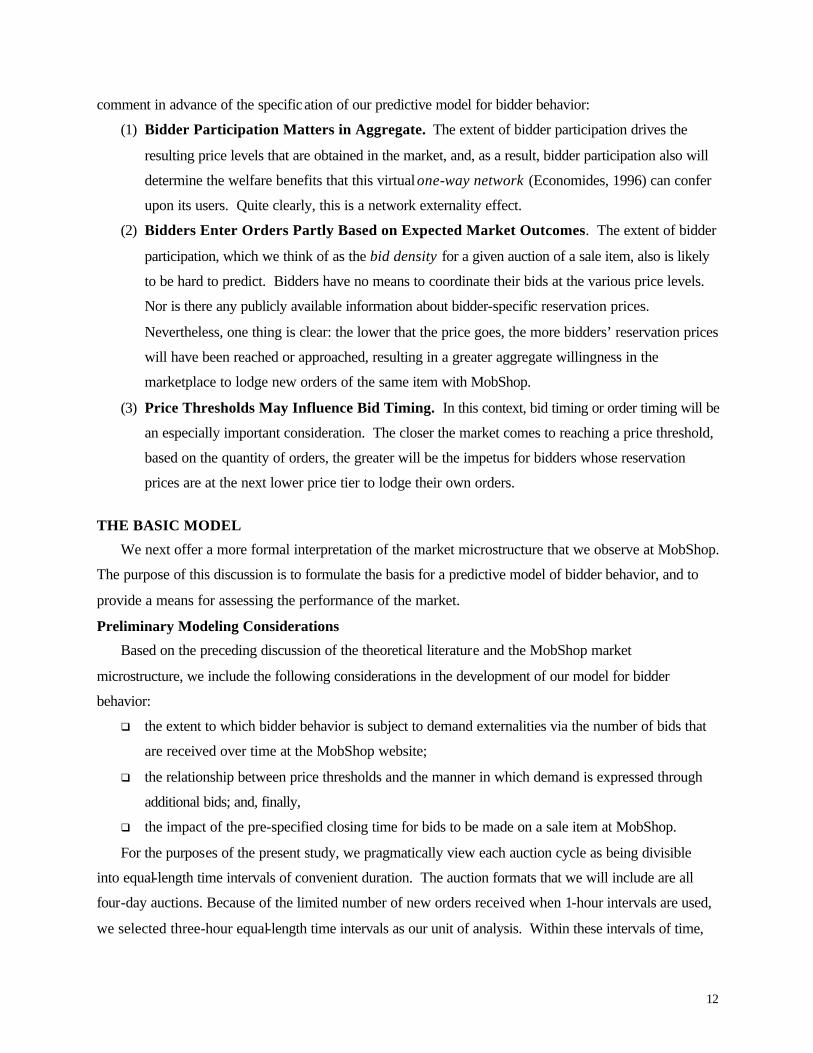
comment in advance of the specification of our predictive model for bidder behavior:
(1) Bidder Participation Matters in Aggregate. The extent of bidder participation drives the
resulting price levels that are obtained in the market, and, as a result, bidder participation also will
determine the welfare benefits that this virtual one-way network (Economides, 1996) can confer
upon its users. Quite clearly, this is a network externality effect.
(2) Bidders Enter Orders Partly Based on Expected Market Outcomes. The extent of bidder
participation, which we think of as the bid density for a given auction of a sale item, also is likely
to be hard to predict. Bidders have no means to coordinate their bids at the various price levels.
Nor is there any publicly available information about bidder-specific reservation prices.
Nevertheless, one thing is clear: the lower that the price goes, the more bidders’ reservation prices
will have been reached or approached, resulting in a greater aggregate willingness in the
marketplace to lodge new orders of the same item with MobShop.
(3) Price Thresholds May Influence Bid Timing. In this context, bid timing or order timing will be
an especially important consideration. The closer the market comes to reaching a price threshold,
based on the quantity of orders, the greater will be the impetus for bidders whose reservation
prices are at the next lower price tier to lodge their own orders.
THE BASIC MODEL
We next offer a more formal interpretation of the market microstructure that we observe at MobShop.
The purpose of this discussion is to formulate the basis for a predictive model of bidder behavior, and to
provide a means for assessing the performance of the market.
Preliminary Modeling Considerations
Based on the preceding discussion of the theoretical literature and the MobShop market
microstructure, we include the following considerations in the development of our model for bidder
behavior:
q the extent to which bidder behavior is subject to demand externalities via the number of bids that
are received over time at the MobShop website;
q the relationship between price thresholds and the manner in which demand is expressed through
additional bids; and, finally,
q the impact of the pre-specified closing time for bids to be made on a sale item at MobShop.
For the purposes of the present study, we pragmatically view each auction cycle as being divisible
into equal-length time intervals of convenient duration. The auction formats that we will include are all
four-day auctions. Because of the limited number of new orders received when 1-hour intervals are used,
we selected three-hour equal-length time intervals as our unit of analysis. Within these intervals of time,
13
we can observe the number of new orders that are placed. In the discussion that follows, we will propose
a model with which new orders that occur at a given point in time can be predicted. We now turn to
those elements of a theory that can make such prediction possible in the context of group-buying
electronic markets.
Demand Externalities
Based on Economides’ (1996) classification, the group-buying marketplace that MobShop offers on
the Internet can be thought of as a one-way virtual network . Why is this the case? Because buyers in the
group do not benefit directly from others in the same group. Instead they benefit indirectly due to
MobShop’s pricing policy: the participation of more buyers drives down the price for any buyer at the
close of the market. Based on prior research on network externalities that we discussed earlier in this
paper, we thus expect that the current group size, operationalized by the number of orders, will influence
the purchasing decision of a potential buyer. However, unlike previously studied networks that had no
specific time frames, the current group-buying network only exists within the length of the auction cycles.
As the end of the auction cycle approaches and potential buyers realize the limited possibility of network
expansion, the influence of the current group size on their purchasing decisions may become limited. As a
result, we expect to observe a non-linear relationship between the current group size and the number of
new orders placed. We can use the natural logarithm of the sum of the total units sold until period t-1and
1 to model this relationship.
Price
The relationship between demand and price has been long recognized in the microeconomics
literature. Even though different functional forms have been proposed for the demand-price relationship,
there is a consensus that at the aggregate level demand for a product or brand decreases as the price
increases under both monopoly and competitive settings (Simon, 1989). As a result, we expect that there
will be a higher demand when the price drops in the group-buying context. However, we remind the
reader that this demand curve effect differs from demand externalities. The former is a movement along a
single demand curve. The latter emphasizes the role of expectations in decision-making and exists by the
construction of the group-buying market microstructure. Demand externalities are realized through the
upward shift of the demand curve due to potential adopters’ higher willingness-to-pay. As a result, in the
context of group-buying, a price effect is reflected in an increase in orders due to a price drop, while
demand externalities are associated with the current group size. Thus, when the current group size
increases, demand externalities capture the fact that potential buyers are more likely to place an order due
to the expected larger final group size, even though the current price remains the same.
Price Level Effect
In the group-buying situation, as the number of units sold increases within the same price-tier, the

14
point of a price drop comes ever closer. However, consumers may not form the expectation of a price
change until the number of orders needed to reach the next lower price level is smaller than some
threshold. Moreover, as the price level span (i.e., distance in minimum required number of orders from
one price-tier to the next) increases, this threshold may also increase.
For example, let us look at Figure 1 again. (See Figure 1 earlier in the paper.) At price level $605.95,
where the total number of units sold can range from 26 to 200, a consumer may start to form the
perception that a price drop is very likely to occur when just 25 orders are needed to reach 201. At the
$595.95 level, however, where this price ranges over 300 orders (i.e., from 201 to 500 orders), the
threshold for the same consumer to begin to form the expectation that a price drop will occur may be
larger than 25. Obviously, there are fairly complex cognitive and perceptual aspects associated with this
kind of market microstructure that deserve closer scrutiny.
Under group-buying, when a buyer develops an expectation that the price will drop in the near future,
we expect that her likelihood of purchasing the product will increase. However, her expectation of a price
change itself will not be sufficient for the buyer to make the purchasing decision. Instead, her reservation
price and attitude toward risk also will play important roles.
In the short run, because the price will only drop to the next lower price-tier, a consumer will only be
motivated to make a purchase when her reservation price is less than the current price but greater than or
equal to the next lower one. (We note that consumers having reservation prices higher than or equal to
the current price are expected to have placed their orders already.) In this case, when the price drops to
the next level, which is no greater than her reservation price, she will get a non-negative surplus from this
purchase. In the group-buying setting, when an individual perceives that the price is likely to drop to her
reservation price or lower -- and her purchase action can facilitate this process -- she is more likely to
place the order if she is risk-seeking. On the contrary, a risk-averse person may wait until the price
actually changes to make the purchase, even if she expected that the price would change.
As a result, we expect more orders to be placed right before and right after the price drop point. This
may occur due to the purchases made by risk-seeking consumers before the price change and by risk-
averse buyers after the price change. Figure 2 shows the expected result of one price level. (See Figure
2.)

15
# New Qi Price Qi+1 Price
Orders Threshold Threshold
Qi Qi+1 Time
Note: Qi and Qi+1 are the starting and ending total order quantities for price-tier i. We expect more new orders right before and after price changes at Qi and Qi+1 and fewer new orders in other periods.
Figure 2. Expected price level effect
Cycle Ending Effect
There are two sources of the cycle ending effect. First, because buyers are able to place conditional
bids at MobShop, it is possible that there will be a surge in the number of new orders if the price happens
to decrease during this last auction period. This is essentially a “limit order” effect, where transactions
will only be carried out conditional on some pre-set criteria (Handa and Schwartz, 1996). These newly
revealed orders would be added into the final buying group and result in a significantly higher number of
orders placed during the last period than might otherwise be expected if no conditional orders were
permitted.
A second alternative explanation for the auction cycle ending effect is also worthy of discussion.
When there is a time constraint imposed in a trading market, the market participants’ behavior may be
influenced both by the start time and by the end time of the trading session. In fact, it is possible that the
auction ending effect may be even more apparent in online auctions, where bidders bid more frequently
near the end in order to win the auction, often paying too high a price. The empirical results of Bapna et
al. (2000) show that opportunists in auctions often select the strategy of bidding the lowest possible prices
at the end of auctions. In addition, Bajari and Hortacsu’s (2001) empirical test of eBay coin auctions also
suggests higher bidding intensities at the end of the digital auctions. In the group-buying setting, when an
auction cycle approaches its end, the ending price will become easier for participants to predict and
consumers’ uncertainty should concomitantly decrease. Potential buyers who have been waiting for the
final price to become clearer may make their purchase decision at that time. Moreover, MobShop’s email
reminder service, which notifies a potential buyer of the approaching end of an auction cycle, further
creates the possibility of additional orders flowing in during the last auction period, since existing bidders
who hope to acquire a sale item at a lower cost will have an increased monetary incentive to seek out

16
other buying partners. As a result, we expect more new orders to occur when an auction cycle approaches
its end.
The Dependent Variables
The same set of independent variables is used to predict two different dependent variables. The first
one is NewOrderst, which is the number of new orders arriving during period t. However, many new
orders placed just before a price drop occurs may be the result of previously-submitted limit orders that
have accumulated. So using NewOrderst as the dependent variable may artificially amplify the before-
price drop effect. To correct for this problem, we use a second dependent variable NewOrderslt, which
eliminates the number of new orders due to conditional bidding using the “Save-a-Spot” feature. This
gives us a more conservative estimate of the before-price drop effect.
The Base Models
Based on our analysis in Sections 2 and 3, we specify our base model of bidder participation in terms
of new orders received by MobShop in period t as:
NewOrderst = ƒ [ln(Orderst-1+1), Pricet-1, BeforeDropt-1,AfterDropt-1, Endt ,TimeofDayControls]
and our base model of bidder participation in terms of new orders received by MobShop in period t after
eliminating limit orders as:
NewOrderslt = ƒ [ln(Orderst-1+1), Pricet-1, BeforeDropt-1,AfterDropt-1, Endt ,TimeofDayControls]
The variables that are used in our empirical model are defined in Table 1. (See Table 1.) We will
comment more fully on the specification of the Time-of-Day Controls dummy variables in the next
section.

17
VARIABLE DEFINITION
Dependent Variables
q NewOrderst Number of new orders placed in period t
q NewOrdersli Number of new orders placed in period t after eliminating limit orders
Independent Variables
q ln(Orderst-1+1) Natural logarithm of the total number orders placed up to the end of
period t-1 plus 1
q Pricet-1 Price at the end of period t-1
q BeforeDropt-1 1, if percentage of orders needed to the next price tier at the end of period t-1 ≤ 25%, 0 otherwise
q AfterDropt-1 1, if percentage of orders needed to the next price tier at the end of period t-1 ≥ 75%, 0 otherwise
q Endt 1, if current period is the last one for the auction cycle, 0 otherwise
q TimeofDay
Control
Dummy
Variables
(T1, …., T7)
The variables are as follows:
q T1 = 1, 12:00-3:00 am
q T2 = 1, 6:00-9:00 am
q T3 = 1, 9:00 am-12:00 pm
q T4 = 1,12:00-3:00 pm
q T5 = 1, 3:00-6:00 pm
q T6 = 1, 6:00-9:00 pm
q T7 = 1, 9:00 pm-12:00 am
and 0 otherwise for all dummies. The time period 3:00-6:00am is the
base case, when the least bidding activity occurs.
Table 1. Definitions of model variables
DATA ISSUES AND MODEL REFINEMENTS
We next discuss data collection from MobShop, and a number of data issues that led us to make
refinements to our basic model.
Data Collection from MobShop
A data-collecting agent, similar to the Electronic Data Retrieval Intelligent LexicaL Agent (eDRILL),
proposed and tested by Kauffman, March and Wood (2000), was used to collect data from MobShop in
18
March and April 2000. Automated data collection techniques of this sort make it possible to conduct
research and develop research designs that were hitherto impossible to implement, either due to costs, the
availability of human data collection agents, or the overall volume of data to be collected (Kauffman and
Wood, 2001). The function of our data-collecting agent was primarily to monitor the MobShop Web site
on an hourly basis, and to record the arrival of bids and other related auction cycle information for the
sale of Olympus C-2020 Zoom Digital Cameras. Each auction cycle length was four days long and data
were collected on an exploratory basis for seven different auction cycles. Table 2 summarizes the
descriptive statistics for our data. (See Table 2.)
DESCRIPTIVE CATEGORY MIN MAX MEAN STANDARD
DEVIATION
Total number of orders, each cycle 96 324 170.4 81.0
Number new orders, 3-hr periods 0 79 5.7 8.5
Number of new orders per hour 0 38 1.9 3.3
Table 2. Descriptive statistics for the bidding data
The starting time for the first period in each auction was the middle of the afternoon. Our data set
contains 207 observations from the auction cycles in a three-hour period format (aggregating hourly
observations), and 626 observations in the one-hour format. The data-collecting agent used in this study
failed to collect order number information from MobShop Web site for several time periods, so the
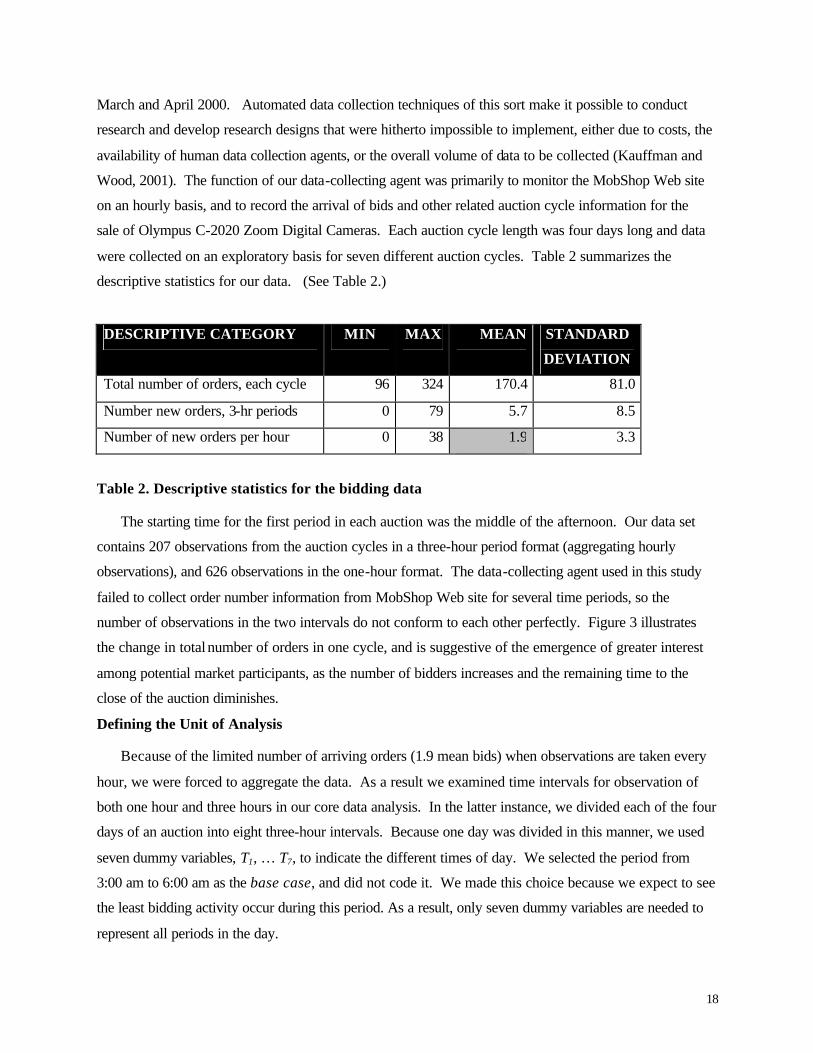
number of observations in the two intervals do not conform to each other perfectly. Figure 3 illustrates
the change in total number of orders in one cycle, and is suggestive of the emergence of greater interest
among potential market participants, as the number of bidders increases and the remaining time to the
close of the auction diminishes.
Defining the Unit of Analysis
Because of the limited number of arriving orders (1.9 mean bids) when observations are taken every
hour, we were forced to aggregate the data. As a result we examined time intervals for observation of
both one hour and three hours in our core data analysis. In the latter instance, we divided each of the four
days of an auction into eight three-hour intervals. Because one day was divided in this manner, we used
seven dummy variables, T1, … T7, to indicate the different times of day. We selected the period from
3:00 am to 6:00 am as the base case, and did not code it. We made this choice because we expect to see
the least bidding activity occur during this period. As a result, only seven dummy variables are needed to
represent all periods in the day.
19
0
40
80
120
160
1 6 11 16 21 26 31
Period
To
tal N
um
ber
of
Ord
ers
Figure 3. Order accumulation in an auction cycle (3-hour interval, 4 days)
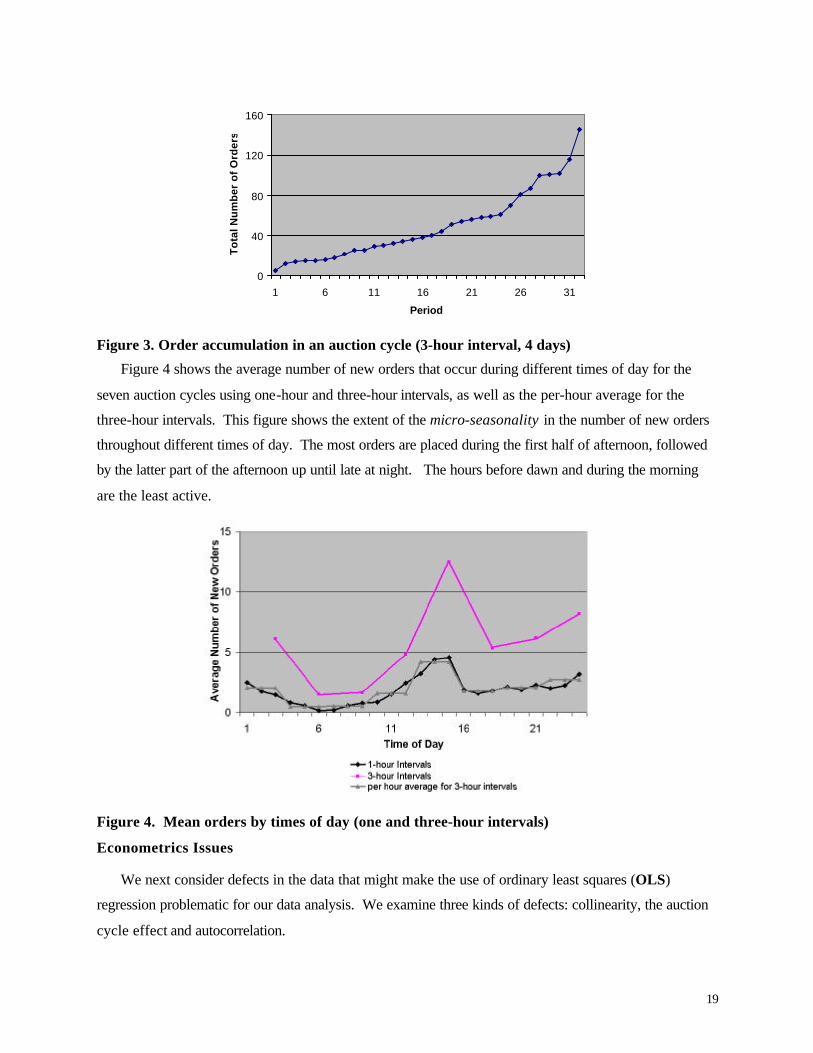
Figure 4 shows the average number of new orders that occur during different times of day for the
seven auction cycles using one-hour and three-hour intervals, as well as the per-hour average for the
three-hour intervals. This figure shows the extent of the micro-seasonality in the number of new orders
throughout different times of day. The most orders are placed during the first half of afternoon, followed
by the latter part of the afternoon up until late at night. The hours before dawn and during the morning
are the least active.
Figure 4. Mean orders by times of day (one and three-hour intervals)
Econometrics Issues
We next consider defects in the data that might make the use of ordinary least squares (OLS)
regression problematic for our data analysis. We examine three kinds of defects: collinearity, the auction
cycle effect and autocorrelation.
20
Collinearity. Correlations between the independent variables exhibit no correlations in excess of .60,
with the exception of Pricet-1 and Orderst-1, which have a high negative correlation of -0.72. This high
correlation is due to the pricing strategies employed by MobShop, where price is determined by number
of orders. As a result, in order to eliminate this collinearity problem, we eliminated the variable, Pricet-1,
from our analysis.
Auction Cycle Effect. Because the data used in the current study consist of time-series observations
from different auction cycles, they are panel data in nature. Since the auction cycles from which data for
the current study were collected are just a sample of the ongoing auctions at Mobshop, we use a random
effects model for panel data, where ui is the random disturbance for auction cycle i, E[ui]=0, E[ui2]= σu
2
and E[ui uj]=0 if i≠j (Greene, 2000).
Autocorrelation. A final consideration is the autocorrelation problem, which is apparent with the
structure of our research setting. The first-order autoregressive disturbance is used to correct for the
autocorrelation problem in the data set. Applying an AR(1) process for the error term, we obtain ε i,t =
ρε i, t -1 + ?i,t, where E[?i,t] = 0, E[?i,t 2] = σ?
2 and Cov[?i,t, ?i,s] = 0, if t≠s (Greene, 2000). Because the
software agent failed to collect order accumulation information for about one-third of the length of one
auction cycle, this created gap in the time series. Thus, the observations from this auction cycle were
deleted from further data analysis. A total of four observations were missing from the other six auction
cycles. Using broadly accepted methods for handling missing data (discussed in Weisberg, 1985), we
created a small number of observations for these periods by averaging the total number of orders before
and after the missing periods. This approach is further justified by the fact that only 1 or 2 new orders
were placed during the periods when the agent failed to collect order number information. As a result, the
final data contains observations from 6 auction cycles with 190 observations in the three-hour format.
The Revised Model for Estimation
Beginning with our base model, and then applying the various considerations (including dropping a
variable due to collinearity) and transformations (for a random effects panel data model and
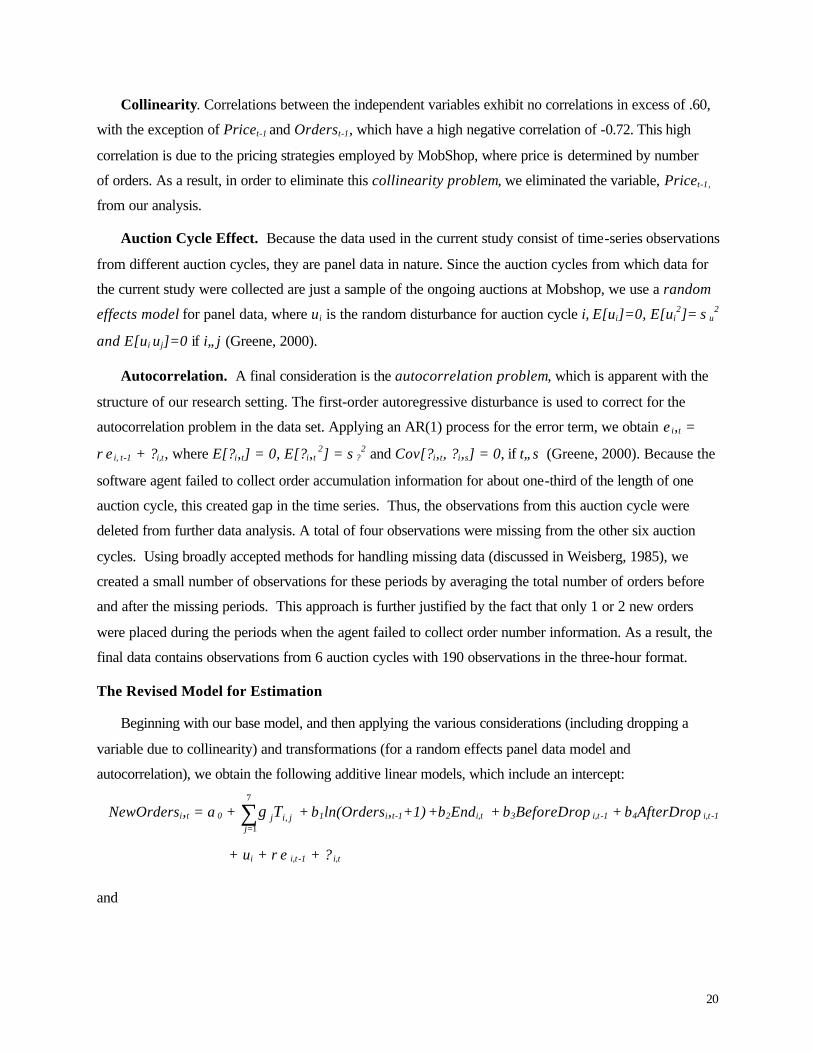
autocorrelation), we obtain the following additive linear models, which include an intercept:
NewOrdersi,t = α0 + jij
jT ,
7
1∑
=
γ + β1ln(Ordersi,t-1+1) +β2Endi,t + β3BeforeDrop i,t -1 + β4AfterDrop i,t -1
+ ui + ρε i,t -1 + ? i,t
and

21
NewOrdersli,t = αl
0 + jij
ljT ,
7
1∑
=
γ + l1β ln(Ordersi,t-1+1) + l
2β Endi,t + l3β BeforeDrop i,t -1
+ l4β AfterDrop i,t -1 + ul
i + ρ lε li,t -1 + ?
li,t
In this expression, the subscript i = {1,…,6} denotes the six auction cycles and j = {1,…,7} is a counter
for the time-of-day control dummy variables, and the β’s are the model parameters to be estimated.
RESULTS
Table 3 summarizes the model results, including coefficient estimates, significance levels and
standard errors. Overall, our model has an R2 of 50.3% and an adjusted-R2 of 47.1% for NewOrdersi,t,
and an R2 of 50.1% and an adjusted-R2 of 46.9% for NewOrdersli,t. (See Table 3.)
Main Effects
Let us first consider the main effects in our model. The coefficient estimates for ln(Orderst-1+1) and
Endt are significant at the .001 level for both dependent variables, indicating the presence of significant
bidding participation externalities and an auction ending effect. For new orders placed during period t,
the coefficient estimate for ln(Orderst-1+1) is 2.227 with a standard deviation of 0.603 (and 2.121 with a
standard deviation of 0.576 for new orders excluding limit orders). The coefficient estimate for the ending
effect variable is 24.224 with a standard deviation of 2.350 (and 24.398 with a standard deviation of 2.297
for new orders excluding limit orders). This means that on average 24.224 (or 24.398) more orders were
placed during the last time period than the previous ones. This is a huge increase since the average ending
number of orders for the six cycles was 174.5 and the average number of orders for each 3-hour period
was just 5.7.
The coefficient estimate for BeforeDropt-1 is significant at .01 level for NewOrdersi,t, indicating
bidders were more willing to bid when they perceived the price would drop shortly. When the new orders
due to conditional biddings are excluded, the coefficient estimate for BeforeDropt-1 is significant at .05
level, which is a conservative estimate of the before-price change effect. Our estimates suggest that the
number of orders placed right before the price change occurs results in an average increase in new orders
of between 2.961 and 4.264 more than those placed in periods that were neither right before nor right after
the price decrease. This is a big increase since the average number of orders placed in each period is just
5.7. Contrary to our hypothesis, however, the number of orders placed after a price drop is not
significantly different from those placed in periods that occurred neither right before nor right after a price
change.

22
VARIABLE NewOrders i,t NewOrders li,t
Coef Estimate
Std Dev
T-Ratio (Signif.)
Coef Estimate
Std Dev
T-Ratio (Signif.)
Main Effects Variables
α0 -7.551 2.972 -2.540** -7.066 2.889 -2.445**
ln(Orderst-1+1) 2.227 0.603 3.695*** 2.121 0.576 3.681***
Endt 24.224 2.350 10.307*** 24.398 2.297 10.623***
BeforeDropt-1 4.264 1.421 2.897*** 2.961 1.377 2.151**
AfterDropt-1 0.232 0.911 0.254 0.315 0.879 0.358
Time-of-Day Control Dummy Variables
T1 4.851 1.329 3.651*** 4.661 1.308 3.564***
T2 0.033 1.325 0.025 0.035 1.304 0.027
T3 2.139 1.430 1.495 2.140 1.398 1.530
T4 3.323 1.557 2.134** 3.484 1.519 2.293**
T5 3.658 1.574 2.324** 3.426 1.535 2.231**
T6 5.153 1.477 4.294*** 4.629 1.441 3.214***
T7 6.170 1.437 4.682*** 6.056 1.404 4.313***
Transformed Error Term
ρ 0.160 -- -- 0.144 -- --
R2 50.3% -- -- 50.1% -- --
Adjusted-R2 47.1% -- -- 46.9% -- --
Significance levels: * = p<.10; ** = p<.05; *** = p<.01
Table 3. Results of model testing
Control Variable Effects
Our coefficient estimates for the time-of-day control dummy variables are consistent for the
regressions using either dependent variable and are of similar magnitude. Three of the time-of-day
control dummy variables are significant at the .01 level and two are significant at .05 level, indicating
significant micro-seasonality effects. The time periods from 6:00 am to 9:00 am, and from 9:00 am to
12:00 pm are not significantly different from the base case from 3:00 - 6:00 am. On average, MobShop
received the highest number of orders from 9:00 pm to 12:00 am, about 6 more than those received during

23
the 3:00 am to 6:00 am period. Two afternoon periods (12:00 pm to 3:00 pm, and 3:00 pm to 6:00 pm), as
well as a midnight period (12:00 am to 3:00 am) received 3 more orders than the base period. The early
evening period received about 5 more orders than the base.
Transformed Error Term
Recall that our revised regression models included an error term decomposition, ρ, to eliminate
problems with autocorrelation. The coefficient estimate for ρ is .160 for the regression of new orders
placed during each period, and is .144 when limit orders are excluded. The positive sign of the parameter
estimate conforms to the usually observed positive correlation between adjacent error terms in economic
data (Greene, 2000). It indicates that the error term at time t will be influenced by all the error terms in
previous periods, with the most recent one having a direct marginal effect of .160 and .144, respectively.
DISCUSSION
The overall results generally confirm our primary contention in this research: that new bidders’
arrivals are positively influenced by the number of orders already placed under the group-buying discount
market structure. This is evidence of a positive network externality in this virtual marketplace.
Specifically, as the natural logarithm of the number of total orders plus 1 increases by 1, the number of
new orders placed during each period increases by 2.227 (or 2.121 if limit orders are excluded). Our
results also indicate the existence of a non-linear relationship between the current group size and the
number of new orders placed in the group-buying network with a time frame. As the buyer group size
increases, potential bidders perceive a larger expected network size and are more willing to bid for the
product, as a result. However, as the end of the auction cycles approaches, potential buyers realized the
limited possibility of network expansion and their willingness to bid increases at a decreasing rate.
We also observe a significant before-price drop effect in the current study. When the percentage of
orders needed to reach the next price drop is 25% or less, there is an average of 4.264 more orders per
three-hour time period (or 2.961 if limit orders are excluded). This result lends support to our hypothesis
that when the numbers of orders needed are small enough to be within a potential buyer’s perceived price
threshold, the person will be more likely to act upon the expectation that the price will drop in the near
future. This causes the buyer to be more willing to order. In our model, we use 25% as the cutoff point
for the before-price drop dummy variable. This percentage is selected based on our consideration that a
too large or too small cutoff point may not accurately capture the region that bidders generate the price
drop expectations and hence mask the before-price drop effect.
The reader should note that we did not find a significant after-price drop effect, at least with the
exploring data set that we acquired from the MobShop Web site in March and April 2000. Before we
24
conclude there is no after-price drop effect, however, we think that additional consideration should be
given to our data collection and coding methods. In the current study, the data were collected at
MobShop every hour, and then coded for the purposes of the econometrics into three-hour intervals. It is
possible, for example, that some price drops may have occurred within these three-hour periods, and that
some orders placed after the price drop were mixed with orders placed before the price change. As a
result, we may have counted them as orders placed before the price change occurred, when they actually
occurred afterwards. So, a significant after-price drop effect may exist, but may be mixed with the before
price change effect. Even though it is possible that smaller time intervals might have been used in our
data collection to obtain a higher degree of separation of orders placed before and after price drops, this
approach is questionable for two reasons.
q First, when the time interval gets very small and the number of orders arriving during each period
approaches zero, it becomes very difficult, if not impossible, to test the existence of significant
differences in order arrival during each period. This data collection granularity issue becomes a
matter of practicality in our research design.
q Second, we were concerned that too-frequent data collection from MobShop’s Web site might
result in their blocking our access to their site. For example, during spring 2000 when we were
testing the power of our data-collecting agent by iterating the data collection monitoring process
every five minutes, MobShop actually blocked our agent twice. However, at the time we chose
not to communicate with the firm’s management to request permission to continue. Our view
was that MobShop was publishing publicly-available data, and that so long as our agent
conducted its investigation with a “responsible price following” demeanor, and did not create an
operational burden on the firm’s server operations, we felt that it would be acceptable. (After all,
we were not capturing data to assist a competing firm or to try to do material harm to MobShop’s
server operations. Our purpose was simply to better understand the inner workings of group-
buying dynamic pricing markets.)
We also obtained results from our analysis that show a significant auction ending effect, with an
average of about 20 more orders placed during the last period than in previous periods. Previously we
identified two possible sources for this ending effect – accumulated limit orders, and buyers’ reduced
price uncertainty or bidding strategy. In our regression using the new orders that exclude limit orders, we
find that the ending effect is still significant with a coefficient estimate of 24.398. Since the limit order
effect has been excluded in this regression, the only possible explanation is the reduced uncertainty and
buyer strategy. This perspective can be further supported by an examination of the last bidding periods of
the auction cycles. Specifically, there was no price drop during the last period in any of the seven auction

25
cycles, indicating limit orders not a possibility for the resulted ending effect. When there is still enough
time left for the auction cycle, some potential buyers may choose to wait. They will postpone placing an
order until they know what the final price is likely to be. As the cycle approaches its end, potential buyers
who do not want to miss this opportunity will decide to make a purchase, resulting in a significant ending
effect.
LIMITATIONS
As an exploratory study to understand the dynamics of group-buying business models, the current
research still has many limitations. In addition to the variables included in our model, the following
factors may also influence new order arrivals at MobShop, but are not included in our model:
q First, the price drops differ in magnitude and this may have impact on number of new orders
placed.
q Second, because of the design of group-buying business models, the current price is inherently
correlated with group size. Hence, we removed current price from our empirical models. Some
cautions are in order in interpreting the results that pertain to demand externalities, as a result,
since the effect of lower prices, which is different from demand externalities, may be woven in.
q Third, competing posted prices on other related Web sites can also influence the traffic flow and
orders placed at MobShop. When the price at MobShop decreased to a lower tier than those that
buyers could find at other sites, the new orders placed might be due to this lower comparative
price, instead of the internal market dynamics of group-buying.
To further explore the potential limitations associate competing posted prices, we use price
history information from three sources to estimate the possible omitted variable bias in our empirical
models. Popular Photography, a monthly magazine that specializes cameras, photographic equipment
and techniques, also publishes national advertisements for cameras, lenses and other photography
paraphernalia for hobbyists and professionals. In addition, we obtained assistance from staff members at
Best Buy, a nationwide posted-price discounter which is headquartered in the Twin Cities of Minnesota,
for acquiring data from weekly catalogs and newspaper inserts with price history data for cameras.
Finally, we acquired additional indicative price history information from the DotCom reverse auction
Web site of Nextag.com (www.nextag.com). This firm supports the sale of both new and used products
using a dynamic pricing online marketplace.
What kind of data did we collect to determine the strength of a possible omitted variable bias?
We searched the advertisements in the March 2000 through June 2000 issues of Popular Photography for

26
relevant sales price information on the Olympus C2020 Zoom digital camera. We then recorded the
maximum, minimum, average, and standard deviation of the prices in dollars found for each month. We
report them in Table 4.
MONTHS IN 2000
ADS LISTING PRICE
MAXIMUM PRICE
MINIMUM PRICE
MEAN PRICE
STANDARD DEVIATION OF PRICE
March 4 $799.95 $737.00 $753.98 $30.67
April 5 $799.95 $707.00 $751.17 $46.25
May 3 $799.95 $649.95 $702.30 $84.64
June 4 $699.99 $647.00 $678.99 $25.46
Table 4. Advertised prices of Olympus C2020 Zoom digital camera in Popular Photography
Our search of the weekly catalogues of Best Buy during March 2000 and April 2000 showed that
during the two weeks from April 2 to April 8 and from April 16 to April 22, the same Olympus C2020
Zoom digital camera was advertised at $699.99. In addition, Nextag.com provided a price history of the
same Olympus digital camera sold through their Web site. (See Figure 5.) Compared to these three
sources of pricing information, MobShop’s starting price of $615.95 in the seven auction cycles during
the period of March and April 2000 was either much lower than the posted prices we found, or toward the
lower end of the prices that Nextag.com reported. As a result, we believe the impact of competitive
prices on the order arrival of the Olympus digital camera at MobShop was minimal during the period our
observations were taken, even though we had guessed all along that posted-prices elsewhere might be
lower. This apparently turned out not to be the case, based on the evidence that we have assembled.

27
Figure 5. Price history of Olympus C2020 Zoom digital camera (Nextag.com, 2001,
www.nextag.com/buyer/PriceHistory.jsp?product=7000668& channel=main&category=null)
Two additional concerns must also be noted:
q Fourth, the limited observations from seven auctions and one single product constrains the
generalizability of our results. Our results would have been more robust had we designed the
research to include longer observation period, as well as products from different categories and of
high and low prices. However, the declining market for group-buying Web sites that began in
summer 2000 actually forced MobShop to change its price levels and quantity cutoff points. This
ultimately prevented us from obtaining more observations that would permit a comparison with
prior period bidder behavior for the same group-buying setup.
q Fifth, the “Save a Spot” feature implemented by MobShop deserves discussion. Consider the
situation in which two individuals whose reservation prices are both less than the current price but
no less than the next lower level price. Suppose that when they both bid they can drive the price
down to the next level, but no change in price occurs if only one of them bids. Under this
situation, [Bid, Bid] and [No Bid, No Bid] result in a Nash equilibrium (Fudenberg and Tirole,
1991). When no coordination or information sharing is possible between the two, however, they

28
will not always arrive at the Nash [Bid, Bid] decisions due to the risk of getting a negative payoff.
The “Save a Spot” feature serves as a coordination mechanism in which the bidder can indicate
her preferred action without the risk of getting a negative payoff. As a result, the effectiveness of
the market is improved.
As we mentioned earlier, group-buying business models motivate participating buyers to recruit
others, which results in lower customer acquisition costs for the seller. MobShop did that, and it designed
its Web site to implement conditional bidding to further improve market performance. And based on our
price comparison results (for cameras, at least), MobShop seemed to be doing well in offering its
customers lower prices than its competitors. But still, the DotCom marketplace still seemed to catch up
with MobShop. Why couldn’t MobShop avoid the declining market interest, if their fundamentals were
fairly good, and they enjoyed some advantage of being early to market? Why were they forced to
redefine their business model to emphasize their new role as a software licensing vendor? We now turn to
an assessment of group-buying business models to attempt to put the answers to these questions in proper
perspective.
A BROADER ASSESSMENT OF GROUP-BUYING BUSINESS MODELS IN E-COMMERCE
Let’s first consider the “bigger picture” in the group-buying DotCom market. In Table 5, we briefly
chronicle the separate paths to success and failure that the various group-buying sites on the Internet have
experienced. (For a more in-depth discussion of these mini-cases, the interested reader should see
Kauffman and Wang, 2002.)

29
WEB SITE EVENTS DESCRIBING THE FIRMS’ PATH TO SUCCESS AND FAILURE
C-Tribe q Unique online group-buying of offline retail gift certificates q Redesigned Web site in June 2000 to allow for access through multiple channels
such as Internet, telephone, and mobile devices q Loyalty program gave frequent buyers cash-back rewards q Closed sometime in late 2000
Let’s Buy It q A highly visible Web site in Europe q Filed for bankruptcy in December 2000 due to financial constraints q Resumed operation in February 2001 after the infusion of additional funding q Currently facing the problem of lack of critical mass market interest
Mercata q High profile startup backed by Microsoft co-founder Paul Allen q One of two early market leaders in group-buying q Early involvement in retail and wholesale demand aggregation q Ceased operation in January 2001 due to a shortage of funding
MobShop q Increasing market interest during first half of 2000 q The second of two early innovators in group-buying q Started to experience declining market following summer 2000 q Changed strategic focus to demand aggregation software licensing in January 2001
OnlineChoice q Uniquely positioned through offering of group-buying services for electricity, natural gas, telephone service, etc.
q Advertised a customer base of 460,000 consumers and businesses in March 2001 q Folded by late April 2001 though
SHOP2gether q Group-buying services for small businesses on office furniture and equipment, travel, employee benefits and corporate gifts
q Redirected its demand aggregation services toward education market in April 2000 VolumeBuy q Acted as a group-buying software vendor, in addition to providing a demand
aggregation marketplace for consumers q Three types of buying pools give buyers the flexibility of choosing format q But requires buyer cognitive effort to understand benefits of participating in the
different buying pools Table 5. The success and failure of group-buying Web sites on the Internet
We identify four reasons as possible explanations for the initial growth and subsequent difficulties
that many of these group-buying Web sites have experienced.
q First, many group-buying sites failed to achieve the critical mass that was necessary for
them to compete with bricks-and-mortar and Internet-based discount retailers such as
Walmart, Kmart, and Buy.com. Without enough buyers, group-buying Web sites simply
will not be able to offer sufficiently low prices, like the posted-price market leaders. So even
though group-buying sites claimed they could provide savings to their customers, the reality
was probably quite different. The limited volume of transactions that materialized on these
sites prevented them from securing lower prices from their suppliers than could the
nationwide discount posted-price retailers, which in turn prevents them from passing the

30
savings on to their customers.
q Second, there were low barriers to entry in the group-buying market, and this
negatively impacted sustainable competitive advantage. After Mercata and MobShop
established the first two group-buying sites on the Internet, the number of group-buying firms
rapidly swelled to twelve during by early spring 2000. This reflected the presence of low
barriers to entry due to a high propensity for imitation in the group-buying market. And this
had the added negative effect of forcing the group-buying firms to compete not only with the
traditional posted-pricing retailers, but also among themselves. As these firms learned, it
would be very difficult to fight a head-on, winning battle with the largest and most powerful
firms that have ever existed in the U.S. retail sales market.
q Third, similar to Priceline.com, the group-buying firms were targeting the most price-
sensitive consumers, who were poised to switch to other sellers with very little
provocation. Because most of the group-buying Web sites tended to focus on a single
dimension -- price -- instead of delivering a truly unique value proposition to their customers,
their target market, by default, was bargain hunting-consumers. From prior research, bargain
hunters are known to be less loyal than a retailer might desire. As a result, it was difficult for
group-buying sites to build a loyal customer base. This put their potential for long-term
profitability in jeopardy. Moreover, they were more easily squeezed when stronger players or
new and inexperienced firms entered the market and made price the focal point of the
competition.
q Fourth, group-buying Web sites were subject to a structural “death spiral” of declining
participation and viability, once the right circumstanced occurred. Even the slightest
shocks to the participation of members in a group-buying Web sites marketplace can have an
adverse effect, as Clemons, Croson and Weber (1996) have shown can occur in other market
settings. The intuition goes like this: Once a number of participants depart (for whatever
reason, e.g., failure of the group-buying market to deliver sale items to customers in a timely
manner, indications that the best prices are being offered at the site, other buying innovations
that are occurring in the market at the same time), the extent of the critical mass of a group-
buying marketplace will be diminished. This can only have the effect of reducing the
willingness of the marginal market participant to stay in the market. Ultimately, the
departure of some buyers will be evidenced by lower participation rates and bidding
densities, leading to the departure of other marginal buyers in the buying pool, and ultimately
leading to a “death spiral” that causes the group-buying model to cease being an effective

31
mechanism to achieve sales. As the initial appeal of group-buying to buyers wears off and
they learn more about the limited cost savings (if any) associated with group-buying, buyers
will naturally turn their interest elsewhere.
The examples of group-buying business models that we have discussed illustrate the importance
of examining electronic commerce initiatives in a broader context. Indeed, even though many observers
have focused on the “revolution” associated with DotCom business models and the transformation of
traditional business due to the emergence of the Internet, the real interest is now developing around the
“evolution” of business strategy on the Internet. As we have seen in this article, the group-buying firms
of the Internet are no exception. Webmergers.com (2001) reports that more than 400 DotCom firms
folded from January 2000 to April 2001. Webmergers’ president, Tim Miller, observes that for DotComs
now it’s not a matter of how well these firms do what they have been doing, but how fast they can
“morph” and begin to do something else that will enable them to achieve sustainable competitive
advantage.1 If we consider the group-buying context, such as we have in this article, it is clear that this
interpretation is dead on target, in spite of the interesting innovations that we have seen to date.
CONCLUSIONS
Using data collected from MobShop, the current study tested a model that predicts bidder
participation and order arrivals in an electronic market that uses an innovative group-buying discount
market microstructure, and provided an evaluation of group-buying business models. This research offers
four contributions to what we know about the use of dynamic pricing market microstructures in sales
auctions on the World Wide Web. They include:
q First, through this research, we now have a better understanding of the manner in which buyer
bidding behavior occurs under a market microstructure with group-buying discounts like
MobShop’s.
q Second, we have obtained a better understanding of the complexities that are inherent in modeling
even a simple phenomenon like bidder arrivals. We learned, for example, about the structure of
the data, and the necessity of making various adjustments to support the estimation of a
meaningful empirical model in this context.
q Third, we obtained preliminary evidence for the impact of participation externalities in an
Internet-based electronic market. Although our results require refinement and expansion with
more auctions and data to achieve broader generalizability, we nevertheless have shown the
relevance of new theoretical perspectives from consumer behavior and Marketing Science, as

32
well as from Economics, in this context.
q Finally, we identified the sources that might have led to the failures of the business models of
many group-buying sites.
IS and e-commerce researchers have been trying to explore the variety of business models in Internet-
based selling (Kauffman and Walden, 2001). As we attempted to understand the market dynamics and
efficacy of group-buying business models, the current exploratory study illustrated one approach that can
be taken to examine a specific type of business model. But it also became clear as we performed this
research that the inner workings of the market microstructure of group-buying Web sites did not represent
the keystone for their success or failure. In order to gain a more in-depth understanding of the recent
developments in this area of the digital economy, and to relate it to other developments in e-commerce
leading to the failure, acquisition or merger of Internet companies, future research should take a more
systematic approach to examine the evolution of DotCom strategies. We look forward to pursuing such
issues in future research that is motivated by the present work.
REFERENCES
1. Andrews, W. The new laws of dynamic pricing. Internet World, 5, 35 (December 15, 1999), 27-34. 2. Bajari, P.L., and Hortacsu, A. Winner’s curse, reserve price, and endogenous entry: Empirical
insights from eBay auctions. Working Paper No. 00-004, Department of Economics, Stanford University (2000).
3. Bapna, R., Goes, P., and Gupta, A. A theoretical and empirical investigation of multi-item on-line
auctions. Information Technology and Management, 1, 1-2 (2000), 1-23. 4. Bakos, Y. The emerging role of electronic marketplaces on the Internet. Communications of the ACM,
41, 8 (August 1998), 35-42. 5. Barney, J.B. Firm resources and sustained competitive advantage. Journal of Management, 17, 1
(March 1991), 99-120. 6. Brynjolfsson, E. and Kemerer, C.F. Network externalities in microcomputer software: An
econometric analysis of the spreadsheet market. Management Science, 42, 12 (December 1996), 1627-1647.
7. Clemons, E.K., Croson, D.C., and Weber, B.W. Market dominance as a precursor of a firm's failure:
Emerging technologies and the competitive advantage of new entrants. Journal of Management Information Systems, 13, 2 (Fall 1996), 59-68.
8. Corral, C.B. Clicks and mortar: Category leaders in cyberretailing. Discount Store News, 38, 23
(December 13, 1999), 10-13.
1 From a field study interview by the authors with Tim Miller, San Francisco, CA, April 23, 2001.

33
9. Drakopoulos, S.A. Psychological thresholds, demand and price rigidity. The Manchester School of
Economic and Social Studies, 60, 2 (June 1992), 152-168. 10. Dybvig, P.H., and Spatt, C. Adoption externalities as public goods. Journal of Public Economics, 20,
(March 1983), 231-247. 11. eBay.com. Annual report. (2000) (www.shareholder.com/ebay/annual/2000_annual_10K.pdf). 12. Dyer, J.S. and Sarin, R.K. Relative risk aversion. Management Science, 28, 8 (August 1982), 875-886. 13. Economides, N. The economics of networks. International Journal of Industrial Organization, 14, 6
(October 1996), 673-699. 14. Economides, N., and Himmelberg, C. Critical mass and network size with application to the U.S. fax
market. Discussion Paper No. EC-95-11, Stern School of Business, New York University, 1995. 15. Economides, N. and Schwartz, R.A. Electronic call market trading. Journal of Portfolio Management,
21, 3 (Spring 1995), 10-18. 16. Gandal, N. Hedonic price indexes for spreadsheets and an empirical test for network externalities.
Rand Journal of Economics, 25, 1 (Spring 1994), 160-170. 17. Greene, W.H. Econometric Analysis (4th Edition). Upper Saddle River, NJ: Prentice Hall, 2000. 18. Handa, P., and Scheartz, R.A. Limit order trading. The Journal of Finance, 51, 5 (December 1996),
1835-1861. 19. Katz, M., and Shapiro, C. Network externalities, competition, and compatibility. American Economic
Review, 75, 3 (June 1985), 424-440. 20. Kauffman, R.J., March, S. T., and Wood, C.A. Design principles for long-lived Internet agents.
International Journal of Intelligent Systems in Accounting, Finance and Management, 9, 12 (December 2000), 217-236.
21. Kauffman, R.J., McAndrews, J.J., and Wang, Y.M. Opening the black box of network externalities in
network adoption. Information Systems Research, 11, 1 (March 2000), 61-82. 22. Kauffman, R.J., and Riggins, F.J. Information systems and economics. Communications of the ACM,
41, 8 (August 1998), 32-34. 23. Kauffman, R.J., and Walden, E.A. Economics and electronic commerce: Survey and directions for
research. International Journal of Electronic Commerce, 4, 5 (Summer 2001), 4-115. 24. Kauffman, R.J., and Wang, B. Bid together, buy together: On the efficacy of group-buying business
models in Internet-based selling. In P.B. Lowry, J.O. Cherrington, and R.R. Watson (editors), Handbook of Electronic Commerce in Business and Society , Boca Raton, FL: CRC Press, 2002.
25. Kauffman, R. J., and Wood, C.A. Data-collecting agents: Evaluating a research approach for the age
of the Internet. Working paper, MIS Research Center, Carlson School of Management, University of Minnesota, Minneapolis, MN, May 2001.

34
26. Kerstetter, J. Accompany has high hopes for a new business model. PC Week, 16, 17 (April 26, 1999),
22. 27. Krishna, A. The effect of deal knowledge on consumer purchase behavior. Journal of Marketing
Research, 31, 1 (February 1994), 76-91. 28. LetsBuyIt.com. LetsBuyIt.com back in control. Corporate press release, February 21, 2001
(investor.letsbuyit.com/investor/en/news/press/00180/).
29. McAfee, R.P., and McMillan, J. Auctions and bidding. Journal of Economic Literature, 25, 2 (June 1987), 699-738.
30. Mara, J. Good buys. Adweek, 41, 10 (March 6, 2000), 58-64. 31. McHugh, J. Consumer collusion! Forbes, 164, 5 (September 6, 1999), 222-223. 32. Milgrom, P., and Weber, R.J. A theory of auctions and competitive bidding. Econometrica, 50, 5
(September 1982), 1089-1122. 33. Miller, T. Creative reconstruction: How DotComs are adapting to new market realities. Research
report, Webmergers.com (June 2001). 34. Nextag.com. Olympus C-2020 zoom 1600x1200 8MB JPEG/TIFF digital camera 225130. (May 25,
2001 (www.nextag.com/buyer/PriceHistory.jsp?product=7000668& channel=main&category=null). 35. O’Brien, J. Cooperative commerce: Group-buying engines promise consumers strength in numbers.
Computer Shopper, (May 2000), 78. Also dated April 10, 2000 (www.zdnet.com/computershopper/stories/reviews/0,7171,2487711,00.html).
36. Porter, M.E. Competitive Advantage: Creating and Sustaining Superiod Performance. New York,
NY: The Free Press, 1985. 37. Porter, M.E. Strategy and the Internet. Harvard Business Review, 79, 3 (March 2001), 63-78. 38. Reichheld, F.F., Markey, R.G. Jr., and Hopton, C. The loyalty effect: the relationship between loyalty
and profits. European Business Journal, 12, 3 (Autumn 2000), 134-139. 39. Sarin, R.K., and Weber, M. Risk-value models. European Journal of Operational Research, 70, 2
(October 1993), 135-149. 40. Scheraga, D. A sales odyssey. Chain Store Age, 77, 1 (January 2001), 96-106. 41. Shy, O. Technology revolutions in the presence of network externalities. International Journal of
Industrial Organization, 14, 6 (October 1996), 785-800. 42. Simon, H. Price Management. Amsterdam, Netherlands: North-Holland, 1989. 43. Slater, S.F. The challenge of sustaining competitive advantage. Industrial Marketing Management,
25, 1 (January 1996), 79-86.

35
44. Spulber, D.F. Market microstructure and intermediation. Journal of Economic Perspectives, 10, 3 (Summer 1996), 135-152.
45. Tversky, A., and Kahneman, D. Advances in Prospect Theory: Cumulative representation of
uncertainty. Journal of Risk and Uncertainty , 5, 4 (October 1992), 297-323. 46. Vakrat, Y., and Seidmann, A. Implications of the bidders’ process on the design of online auctions. In
Proceedings of the 33rd Hawaii International Conference on System Sciences, R. Sprague (ed.), Los Alamitos, CA: IEEE Computer Society Press, CD-ROM, 2000.
47. Vickrey, W. Counterspeculation, auctions, and competitive sealed tenders. Journal of Finance, 16, 1
(March 1961), 8-37. 48. Wang, R. Auctions versus posted-price selling. American Economic Review, 83, 4 (September 1993),
838-851. 49. WebMergers.com. Shutdowns surge, M&A slumps in April. (May 26, 2001)
(www.webmergers.com/editorial/article.php?id=17). 50. Weisberg, S. Applied Linear Regression (2nd ed.). New York: John Wiley and Sons, 1985. 51. Wernerfelt, B. A resource-based view of the firm. Strategic Management Journal, 5, 2 (April/June
1984), 171-180. 52. Winer, R.S. A price vector model of demand for consumer durables: Preliminary developments.
Marketing Science, 4, 1 (Winter 1985), 74-90.