
NEW BUSINESS DEVELOPMENT - The International Hotel School
60
Joint Defra/EA Flood and Coastal Erosion Risk Management R&D Programme National evaluation of the costs of meeting coastal environmental requirements R&D Technical Report FD2017/TR Produced: April 2006 Authors: Risk & Policy Analysts Ltd Royal Haskoning UK Ltd ABP Marine Environmental Research Ltd
Transcript of NEW BUSINESS DEVELOPMENT - The International Hotel School

Joint Defra/EA Flood and Coastal ErosionRisk Management R&D Programme
National evaluation of the costs ofmeeting coastal environmentalrequirements R&D Technical Report FD2017/TR
PB11207-CVR.qxd 1/9/05 11:42 AM Page 1

Joint Defra/EA Flood and Coastal Erosion Risk Management R&D Programme
National evaluation of the costs of meeting coastal environmental requirements R&D Technical Report FD2017/TR Produced: April 2006 Authors: Risk & Policy Analysts Ltd Royal Haskoning UK Ltd ABP Marine Environmental Research Ltd
ii
Statement of use This report supports the FD2019 spreadsheet, which is designed for use in providing a high-level estimate of the costs of protecting Natura 2000/SSSI/Ramsar sites from flooding over the next 100 years to inform the Government’s spending review. Dissemination status Internal: Released internally External: Released to Public Domain Keywords: Coastal flooding, sea defences, costs, habitat recreation Research contractor: Risk & Policy Analysts Limited, 1 Beccles Road, Loddon, Norfolk, NR14 6LT, [email protected] Royal Haskoning UK Limited, Rightwell House, Peterborough, PE3 8DW ABP Marine Environment Research Ltd, Waterside House, Town Quay, Southampton, SO14 2AQ Defra project officer: Paul Murby, Foss House, Kings Pool, 1-2 Peasholme Green, York, YO1 2PX. Publishing organisation Department for Environment, Food and Rural Affairs Flood Management Division, Ergon House, Horseferry Road London SW1P 2AL
Tel: 020 7238 3000 Fax: 020 7238 6187
www.defra.gov.uk/environ/fcd
© Crown copyright (Defra); 2007 Copyright in the typographical arrangement and design rests with the Crown. This publication (excluding the logo) may be reproduced free of charge in any format or medium provided that it is reproduced accurately and not used in a misleading context. The material must be acknowledged as Crown copyright with the title and source of the publication specified. The views expressed in this document are not necessarily those of Defra or the Environment Agency. Its officers, servants or agents accept no liability whatsoever for any loss or damage arising from the interpretation or use of the information, or reliance on views contained herein. Published by the Department for Environment, Food and Rural Affairs (March 2007). Printed on material that contains a minimum of 100% recycled fibre for uncoated paper and 75% recycled fibre for coated paper. PB Number: 12527 / 2

Executive summary iii
Executive summary 1. Background/need The Government’s aim for flood and coastal erosion risk management is to manage risks by employing an integrated portfolio of approaches, which reflect both national and local priorities, so as to: • reduce the threat to people and their property; and • deliver the greatest environmental, social and economic benefit, consistent
with the Government’s sustainable development principles. An important aspect of sustainable development involves meeting the key coastal requirements of the European Birds and Habitats Directives and Ramsar sites, and Defra’s public service agreement target of bringing 95% of SSSIs into favourable condition by 2010. 2. Main objectives/aims The aim of the study is to gain a clearer understanding at a national level of the costs of flood management work that may be needed over the next 100 years to meet the key coastal environmental requirements and to inform the Government Spending Review. To do this, the study is to: • assess the costs of maintaining the defences protecting vulnerable fresh
water and brackish Natura 2000/SSSI/Ramsar sites in England for three standards of defence (existing, 1 in 5 and 1 in 20 standard)1;
• estimate the potential costs of replacing the sites that are protected by flood management works in more sustainable locations; and
• estimate the potential costs of creating replacement saltmarsh habitat to maintain the extent of saltmarsh in each designated estuary.
3. Results A total of 192 discrete lengths/types of defence, with a total length of 455 km, were identified that are protecting 32,000 ha of vulnerable Natura 2000/SSSI/ Ramsar sites in England. The main defence type identified is ‘earth embankments’ (with/without revetment and crest wall), accounting for 78% of identified defence types. A total of 98% of the sites are currently protected to a standard of 1 in 5 or greater, with 69% protected to a standard of 1 in 20 or more. Around 90% of the defences (by length) are managed by the Environment Agency, with 5% privately owned, 4% owned by the MoD and 2% managed by Local Authorities.
1 Where the existing standard results from the historical legacy of past agricultural land use rather than a standard selected/constructed to meet nature conservation needs and the 1:5 and 1:20 standards are based on English Nature’s advice to Defra on indicative standards for environmental assets.

Executive Summary iv
Costs of protecting fresh and brackish water Natura 2000/SSSI/ Ramsar sites The costs of protecting fresh and brackish water Natura 2000/SSSI/Ramsar sites where there are currently defences are estimated at: • cash costs (undiscounted totals over 100 years):
o maintaining existing standard: £3,300 million ±60%; o 1 in 5 standard: £1,800 million ±60%; and o 1 in 20 standard: £2,900 million ±60%.
• discounted (present value) costs (using the Treasury discount rate of 3.5% (reducing)): o maintaining existing standard: £870 million ±60%); o 1 in 5 standard: £430 million ±60%); and o 1 in 20 standard: £870 million ±60%).
• equivalent annual costs (i.e. the constant annual cost which has the same present value, when the discounted values are summed over 100 years, as the actual costs): o maintaining existing standard: £14 million per year; o 1 in 5 standard: £14 million per year; and o 1 in 20 standard: £29 million per year.
These cost estimates appear large when first considered. However, they can be compared with current expenditure of flood risk management of around £500 million per year in England and Wales. Over 100 years, this is equivalent to total costs of £50,000 million (undiscounted) or around £15,000 million (discounted). This means that the costs of protecting the Natura 2000/SSSI/Ramsar sites would account for 6% of total expenditure over the next 100 years to continue to provide the existing standard of defence or a 1 in 20 year standard, and 4% of total expenditure to provide a 1 in 5 year standard. Cost of replacing vulnerable fresh and brackish water sites The costs of replacing fresh and brackish water sites in more sustainable locations are £510 million (cash costs) and £150 million (discounted, with equivalent annual costs of £5.2 million per year). Many of the assumptions made in estimating the per hectare replacement costs are likely to result in an under-estimate of the total costs. As a result, uncertainty within the replacement costs is likely to be at least equal to uncertainty in the defence costs. If it is assumed that the estimated replacement costs may under-estimate potential costs by 60%, the cash costs would increase to £820 million and the discounted costs to £240 million.
Costs of re-creating saltmarsh habitat The costs of replacing saltmarsh lost due to coastal squeeze in England are estimated using two different scenarios: • costs of re-creating intertidal habitat (i.e. the same area that is lost needs to
be re-created) at £500 million to re-create 4,400 ha of intertidal habitat (equivalent annual cost of £16 million per year); and

Executive summary v
• costs of re-creating the same area of saltmarsh habitat (i.e. double the area
of saltmarsh lost needs to be re-created assuming 50 per cent mudflat will form) at £1,000 million to re-create around 8,800 ha of saltmarsh (equivalent annual cost of £33 million per year).
There is likely to be considerable uncertainty in these figures due to the use of linear interpolation of the rate of saltmarsh loss from historical data. 4. Conclusions/recommendations The outputs of the study are supported by a spreadsheet. This provides full details of all calculations undertaken when estimating the costs of protecting the Natura 2000/SSSI/Ramsar sites. It also allows some of the base assumptions to be changed and new information to be included as it becomes available such that the costs can be recalculated. Thus, the cost estimates presented here could be refined by collection of additional data. This is likely to be particularly important in terms of (i) current condition of defences and, hence, the time before they are likely to require replacing and (ii) the current standard that is being provided. Better data on these two factors should help to reduce uncertainty in both the costs of protecting fresh and brackish water Natura 2000/SSSI/Ramsar sites and their replacement costs.

vi
Contents Executive summary...................................................................... iii 1. Introduction................................................................................ 1 1.1 Background to the project ............................................................ 1 1.2 Objectives .................................................................................... 1 1.3 Organisation of the report ............................................................ 2
2. Summary of approach ............................................................... 3 2.1 Overview...................................................................................... 3 2.2 Identifying coastal sites................................................................ 3 2.3 Identifying vulnerable sites........................................................... 5 2.4 Identifying defence information .................................................... 7 2.5 Assessing defence costs ............................................................. 10 2.6 Assessing fresh and brackish water replacement costs............... 14 2.7 Assessing saltmarsh re-creation costs......................................... 17
3. Cost estimates ........................................................................... 23 3.1 Costs of protecting fresh and brackish water Natura 2000/
SSSI/Ramsar sites.......................................................................23
3.2 Replacement costs for fresh and brackish water sites ................. 26 3.3 Costs of re-creating saltmarsh habitat ......................................... 26
4. Problems encountered and difficulties addressed ................. 31 4.1 Problems and difficulties associated with estimating the costs of
protecting fresh and brackish water Natura 2000/SSSI/ Ramsar sites .............................................................................................
31
4.2 Problems and difficulties associated with estimating replacement costs for fresh and brackish water sites .......................................
32
4.3 Problems and difficulties associated with estimating the costs of re-creating saltmarsh habitat........................................................
32
vii
List of Figures
Figure 2.1 Location of the Natura 2000/SSSI/Ramsar sites considered further ..........................................................
6
Figure 2.2 Profile of capital and maintenance costs (cash costs).... 10
Figure 3.1 Standards of protection currently provided to Natura 2000/SSSI/Ramsar units/sites .......................................
25
List of Tables Table 2.1 Defence types for which generic costs have been
estimated........................................................................8
Table 2.2 Approaches to identifying defence type and standard.... 10 Table 2.3 Correlation of habitat types in spreadsheet with
replacement cost categories ..........................................16
Table 2.4 Area of each habitat type predicted to need replacing ... 17 Table 2.5 Estimated change in saltmarsh areas (ha) to 2105 ........ 18 Table 2.6 Costs of re-creating saltmarsh per 60ha managed
realignment site in different regions of England..............21
Table 3.1 Costs of protecting fresh and brackish water Natura 2000/SSSI/Ramsar sites ................................................
24
Table 3.2 Costs of replacing Nature 2000/SSSIs currently protected by defences ....................................................
26
Table 3.3 Intertidal habitat re-creation costs (re-creation of the same area that is lost) ....................................................
28
Table 3.4 Saltmarsh re-creation costs (re-creation of the double the area that is lost)........................................................
29
Appendices Appendix 1 Approach to assessing coastal vulnerability Appendix 2 Estimate of saltmarsh loss from SPAs/SSSIs by 2015


Section 1: Introduction 1
1. Introduction 1.1 Background to the project The Government’s aim for flood and coastal erosion risk management is to manage risks by employing an integrated portfolio of approaches, which reflect both national and local priorities, so as to: • reduce the threat to people and their property; and • deliver the greatest environmental, social and economic benefit, consistent
with the Government’s sustainable development principles. An important aspect of sustainable development involves meeting requirements associated with the European Birds and Habitats Directives and Ramsar sites. In addition, Defra has a public service agreement target of bringing 95 per cent of SSSIs into favourable condition by 2010. While some measures to comply with the requirements of the Birds and Habitats Directives will be achievable at modest cost, in other cases the cost could be considerable. The cost of meeting these requirements has been assessed to some extent. For example, the costs associated with adjustments to drainage regimes (through Water Level Management Plan activity) have been assessed at the broad level. Costs associated with measures to address coastal squeeze, however, remain uncertain. Some work has been completed, for example, the National Assessment of Defence Needs and Costs (NADNAC) provides an initial identification of where compensatory habitat may be required. This study is to build upon and improve this assessment as well as undertaking initial high level cost assessments of maintaining sea walls that protect freshwater and brackish water Natura 2000/SSSI/Ramsar sites and of replacing these habitats in more sustainable locations. 1.2 Objectives The aim of the study is to gain a clearer understanding at a national level of the costs of flood management work that may be needed to meet key coastal environmental requirements and objectives to inform the Government Spending Review. To do this, the study is: • to assess the costs of maintaining the defences protecting each of the fresh
water and brackish Natura 2000/SSSI/Ramsar sites in England over 100 years. The costs for three standards of defence have been assessed to provide an indication of the range of costs that could be incurred1:
1 Where the existing standard results from the historical legacy of past agricultural land use rather than a standard selected/constructed to meet nature conservation needs and the 1:5 and 1:20 standards are based on English Nature’s advice to Defra on indicative standards for environmental assets.

2 Section 1: Introduction
o existing standard; o 1 in 5 year standard; and o 1 in 20 year standard.
• to estimate the potential costs of replacing any Natura 2000 habitats that are protected by flood management works in more sustainable locations using a 100 year time horizon; and
• to estimate the potential costs of creating replacement saltmarsh habitat to
maintain the extent of saltmarsh for 100 years in each designated estuary. 1.3 Organisation of the report The remainder of this Interim Report is organised as follows: • Section 2 summarises the approach used to:
o identify Natura 2000/SSSI/Ramsar sites at risk from coastal and estuarine flooding;
o estimate the potential costs of providing defences to protect the Natura 2000/SSSI/Ramsar sites;
o assess potential replacement costs for the freshwater and brackish water sites; and
o estimate potential re-creation costs for saltmarsh lost due to coastal squeeze.
• Section 3 presents the cost estimated based on the approach set out in
Section 2; and • Section 4 sets out problems and difficulties encountered during the project
and how these were addressed. The outputs of the study are supported by a spreadsheet. This provides full details of all calculations undertaken when estimating the costs of protecting the Natura 2000/SSSI/Ramsar sites. It also allows some of the base assumptions to be changed and the costs recalculated. Basic information on each site for which costs have been estimated can also be changed, for example, should better information become available on the standard provided by the defences.

Section 2: Summary of approach 3
2. Summary of approach 2.1 Overview This Section provides a summary of the approach used to identifying Natura 2000/SSSI/Ramsar sites on the coast and estuaries that are vulnerable to flooding and which are protected by defences. Also provided are the steps followed to estimate the potential costs of providing defences to these sites to three different standards (1 in 5, 1 in 20 and existing) and to re-creating the sites. The final part of this Section sets out how the potential costs of re-creating saltmarsh that may be lost through coastal squeeze have been estimated. It is important to emphasise that the approach used is at a high-level, requiring generic assumptions to be made. The approach is supported by a spreadsheet, where the information is stored and the calculations undertaken. The spreadsheet has been designed so it can be updated as new information becomes available and also allows changes to be made to some of the key assumptions and input data. The spreadsheet is organised so that the user can drill down into the cost data to investigate costs for individual sites and consider sensitivities to changes in any of the parameters. 2.2 Identifying coastal sites The location of relevant SSSI units was determined by using a combination of GIS and local knowledge about the areas from the project team. The starting point was an Excel database of all SSSI units within England, which was provided by English Nature. This database lists the name, number and condition of each SSSI unit as well as the habitats which the unit contains, results of condition assessment and other information such as English Nature officer. The database was then filtered using GIS to select all SSSI units within 10km of the coast. The next stage of screening involved filtering out all SSSI units which are designated for features that are either in front of defences or contain features, such as earth heritage, which are not relevant to the project. For example, units containing only the following features/habitats were not included (other units within the same site that are vulnerable habitats were included): earth heritage, inland rock, littoral rock, littoral sediment, saltmarsh and supralittoral rock. The resultant list was then refined using local knowledge about the sites to produce a list of SSSI units which contain habitats that are protected by defences. This reduced the number of entries in the spreadsheet from 3361 to 1662. The following habitat types are those included in the filtered database: • acid grassland – lowland; • bogs; • coastal lagoons; • fen, marsh and swamp; • improved grassland;

4 Section 2: Summary of approach
• neutral grassland – lowland; • rivers and streams; and • standing open water.
Next, the NFCCD database was interrogated to identify all of the defences that were considered coastal. The specification refers to coastal defence structure and this has been interpreted as defences either on the coastal frontage or in estuaries. In cases where there are tidal rivers not associated with estuaries (e.g. Norfolk and Suffolk Broads), they have not been included. This is because only those sites that are directly protected by coastal defences have been included. Thus, the Upper Thurne Broads and Marshes have been included as they are directly protected by coastal defences, but the wider Norfolk and Suffolk Broads are not. The following search parameters were used to undertake this search:
• "BANK" = ‘coastal’; • "PROT_TYPE" = ‘coastal’, ‘tidal' or ‘fluvial / tidal'; • "ASSET_TYPE" contained the words ‘coastal’, ‘sea’ or ‘tidal’; • "DESCRIPTIO" contained the words ‘coastal’, ‘sea’ or ‘tidal’; and • "LOCATION" contained the words ‘coastal’, ‘sea’ or ‘tidal.’
The resulting dataset contained a number of anomalies which had to be removed from the dataset. These included:
• inaccuracies, i.e. many of the defence structures are drawn as straight lines
as opposed to following the shape of the coastline; and • data entry issues including co-ordinates and classification errors, incomplete
or inaccurate asset descriptions.
Where obvious, these anomalies were removed from the dataset to create a refined database of coastal defence features. The defences were then further subdivided into natural and manmade features according to the following categories:
• man-made:
o culverted channel; o flood defence structure; o maintained channel; o non-flood defence structure; o other; o raised coastal defence (man-made); and o raised defence (man-made).
• natural: o raised defence (natural); o natural channel; and o raised coastal defence (natural).
The SSSI database was merged with the flood defence dataset (based on NFCDD) to provide information on the type of defence that was potentially protecting each SSSI. This was completed within a GIS framework using
Section 2: Summary of approach 5
ArcMap version 9.1. This included a statement of the type and condition of each defence within each SSSI, the actual distance between the SSSI and any defences and the associated habitat information for each SSSI. This resulted in those SSSI units that are protected by coastal defences being identified for further consideration. Where there is more than one unit within the same SSSI that is of the same habitat type, they have been combined. This is because the re-creation costs consider only the area that is to be recreated not the pattern of habitats. Units have been combined where they have the same feature code. This reduced the number of entries from 1662 to 319. The total area within these 319 entries was estimated as almost 40,000 ha. To reflect the aggregated nature of some database entries, each individual entry (which will reflect one or more units within a Natura 2000/SSSI/Ramsar site) is henceforth referred to as a record.
The results of filters applied to the database form the basis for the cost estimation spreadsheet, such that the 319 records were then assessed for vulnerability and defence information. Figure 2.1, overleaf, shows the location of the Natura 2000/SSSI/Ramsar sites that have been assessed further. 2.3 Identifying vulnerable sites Once the records had been identified, the next stage was to consider whether the units they represent are all vulnerable to flooding. Two filters were applied at this point: • identification of those records whose units are above the 1:200 still water
level – these sites would not be affected by coastal flooding and, hence, are screened out; and
• identification of those records whose units are at or below the 1:200 still water level but which may not be significantly affected by coastal flooding over the next 100 years (vulnerability).
Following application of the first filter, it became apparent that there was a need to separate some of the records into individual or smaller groups of units, as the units are not always in adjacent locations and are not, therefore, protected by the same length of defence. This increased the number of records from 319 to 429. Of these 429 records, 139 (or 32 per cent) were screened out as being above the 1:200 still water level.
6 Section 2: Summary of approach
Figure 2.1 Location of the Natura 2000/SSSI/Ramsar sites considered further

Section 2: Summary of approach 7
The second filter involved development of a vulnerability index. This is based on the approach developed by the United States Geological Survey (USGS) and considers sea level rise, mean tidal range, mean wave height and coastal changes (accretion or erosion). Full details of the approach used are given in Annex 1. The approach was calibrated through discussions with English Nature, with particular focus on the North Norfolk Coast SSSI. The approach appears to give realistic answers in terms of those sites that are likely to be vulnerable. When applied to the remaining 290 records (i.e. those at or below the 1:200 year still water level), 22 (or 8 per cent) were identified as being ‘possibly vulnerable’ while 268 (92 per cent) were considered to be ‘probably vulnerable’. 2.4 Identifying defence information The approach to identifying defence information is based on a wide range of different sources: • the Environment Agency’s National Flood and Coastal Defence Database
(NFCDD); • English Nature’s Internet Site and SSSI database, including ‘Nature on the
Map’3; • Shoreline Management Plans and Project Appraisal Reports; • Internet-based mapping (Multimap, Streetmap); and • other Internet sites providing local information and photographs (notably
Geograph and the BBC). Information on the type of defence, standard, condition and length of defence was identified for each record in turn. A total of 17 different types of defence (and combinations) have been identified. The different defence types and combinations are given in Table 2.1, overleaf. The standard currently provided was identified as: • 1 in 1 years; • 1 in 5 years; • 1 in 10 years; • 1 in 20 years; • 1 in 50 years; • 1 in 100 years; or • 1 in 100+ years (assumed to be 1 in 200 years for the purposes of the
calculations). The existing standard is required so that the costs of maintaining the current standard can be estimated and also to allow the timing of works to be estimated for each of the other standards that are to be costed (i.e. 1 in 5 and 1 in 20).
3 http://www.english-nature.gov.uk/Special/sssi/search.cfm.
8 Section 2: Summary of approach
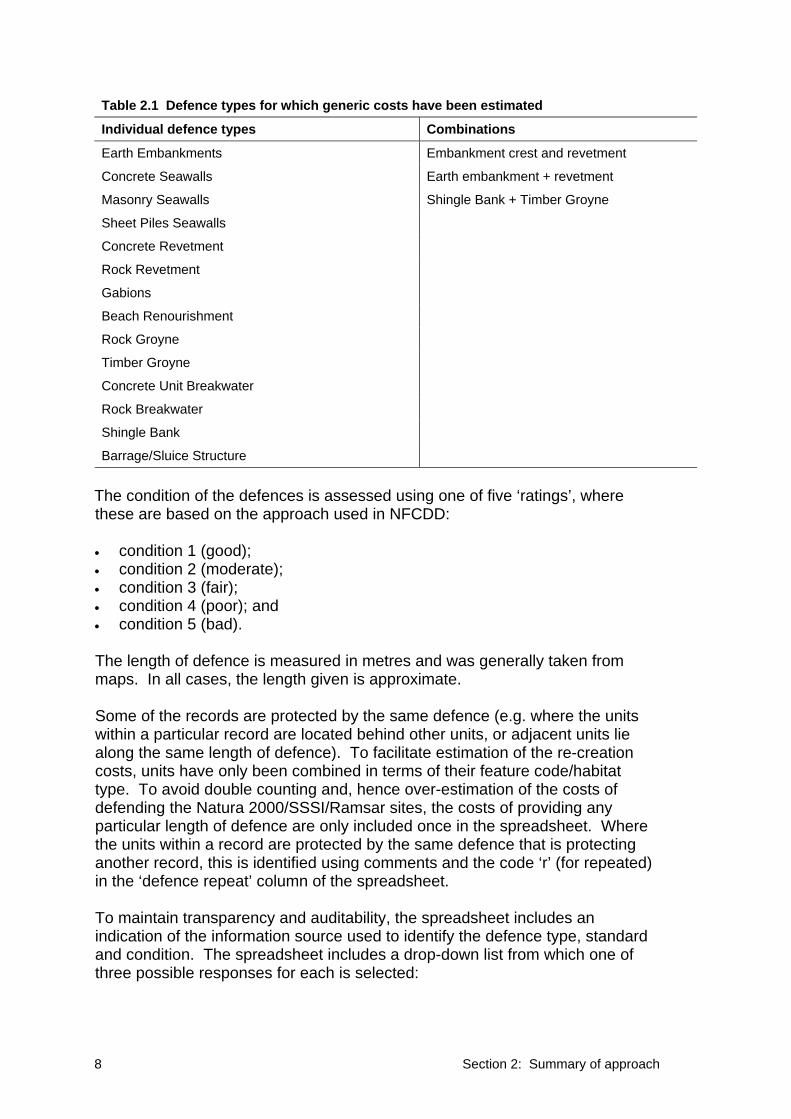
Table 2.1 Defence types for which generic costs have been estimated
Individual defence types Combinations
Earth Embankments Embankment crest and revetment
Concrete Seawalls Earth embankment + revetment
Masonry Seawalls Shingle Bank + Timber Groyne
Sheet Piles Seawalls
Concrete Revetment
Rock Revetment
Gabions
Beach Renourishment
Rock Groyne
Timber Groyne
Concrete Unit Breakwater
Rock Breakwater
Shingle Bank
Barrage/Sluice Structure
The condition of the defences is assessed using one of five ‘ratings’, where these are based on the approach used in NFCDD: • condition 1 (good); • condition 2 (moderate); • condition 3 (fair); • condition 4 (poor); and • condition 5 (bad).
The length of defence is measured in metres and was generally taken from maps. In all cases, the length given is approximate.
Some of the records are protected by the same defence (e.g. where the units within a particular record are located behind other units, or adjacent units lie along the same length of defence). To facilitate estimation of the re-creation costs, units have only been combined in terms of their feature code/habitat type. To avoid double counting and, hence over-estimation of the costs of defending the Natura 2000/SSSI/Ramsar sites, the costs of providing any particular length of defence are only included once in the spreadsheet. Where the units within a record are protected by the same defence that is protecting another record, this is identified using comments and the code ‘r’ (for repeated) in the ‘defence repeat’ column of the spreadsheet.
To maintain transparency and auditability, the spreadsheet includes an indication of the information source used to identify the defence type, standard and condition. The spreadsheet includes a drop-down list from which one of three possible responses for each is selected:

Section 2: Summary of approach 9
• assessment of standard: o recorded: taken from a document, consultation, etc.; o land type: based on the type of assets protected; and o expert opinion: based on knowledge of the standards that are common
for that area or other information that was available. • assessment of defence:
o record: taken from a document, consultation, etc.; o visual: taken from a photograph of the defences or knowledge of the
area; and o expert opinion: based on readily available information, including aerial
photographs, etc. • assessment of condition:
o record: taken from NFCDD; o expert opinion: based on knowledge of the site or a site visit; and o default: where the condition is assigned as 3-fair.
This information also helps identify the level of uncertainty in the cost estimates and is used later to assess low and high cost estimates. Summary of results Using this approach, a total of 192 discrete lengths/types of defence have been identified that are protecting vulnerable Natura 2000/SSSI/Ramsar sites in England (a further 92 records are protected by the same defences). The total length of defences protecting 32,000 ha of vulnerable Natura 2000/SSSI/Ramsar sites is estimated to be 455km. The main defence type identified is ‘earth embankments’, accounting for 78 per cent of identified defence types (with/without revetment and crest wall). Shingle banks (with/without groynes) make up a further 10 per cent, with concrete seawalls and barrage/sluice structures both at 5 per cent. The only other defence types identified are concrete revetment (2 records) and sheet pile seawalls, gabions, rock breakwater and rock revetment (each with 1 record).
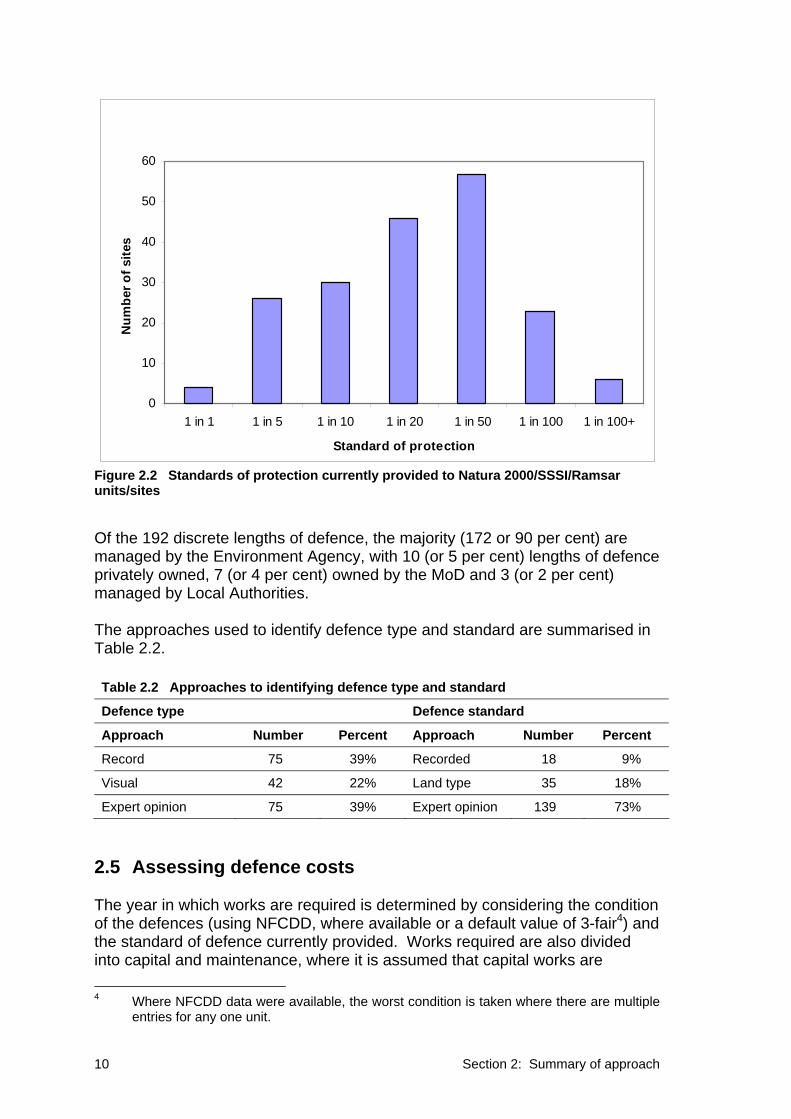
Figure 2.2 shows the variation in standard of protection provided by the 192 discrete lengths of defences. The Figure shows that the most common standard (for 57 sites or 30 per cent) is 1 in 50, with 47 per cent of all sites protected to a standard of 1 in 50 or greater. A total of 98 per cent of the sites are currently protected to a standard of 1 in 5 or greater, with 69 per cent protected to a standard of 1 in 20 or more. NFCDD gave information on condition of defences for 71 records within the spreadsheet (or 38 per cent of the total). The remaining records were assigned a default condition of 3 (fair). Of the 71 records using information from NFCDD, 43 (61 per cent) were assigned to category 3 (fair), with 14 records (20 per cent) given as 2-moderate and 11 (15 per cent) as 4-poor. Only very low numbers are assigned to 1-good (2 records, or 3 per cent) and 5-bad (1 record, 1 per cent).
10 Section 2: Summary of approach
0
10
20
30
40
50
60
1 in 1 1 in 5 1 in 10 1 in 20 1 in 50 1 in 100 1 in 100+
Standard of protection
Num
ber o
f site
s
Figure 2.2 Standards of protection currently provided to Natura 2000/SSSI/Ramsar units/sites Of the 192 discrete lengths of defence, the majority (172 or 90 per cent) are managed by the Environment Agency, with 10 (or 5 per cent) lengths of defence privately owned, 7 (or 4 per cent) owned by the MoD and 3 (or 2 per cent) managed by Local Authorities. The approaches used to identify defence type and standard are summarised in Table 2.2. Table 2.2 Approaches to identifying defence type and standard
Defence type Defence standard
Approach Number Percent Approach Number Percent
Record 75 39% Recorded 18 9%
Visual 42 22% Land type 35 18%
Expert opinion 75 39% Expert opinion 139 73%
2.5 Assessing defence costs The year in which works are required is determined by considering the condition of the defences (using NFCDD, where available or a default value of 3-fair4) and the standard of defence currently provided. Works required are also divided into capital and maintenance, where it is assumed that capital works are 4 Where NFCDD data were available, the worst condition is taken where there are multiple
entries for any one unit.
Section 2: Summary of approach 11
undertaken to raise the standard of defences or to ensure the defences are in a reasonable condition. Maintenance works are used to ensure that the existing defences are maintained at the same standard.
Where the current standard is less than the standard being costed, it is assumed that capital and maintenance works are both required in year zero. When the existing standard is greater than the standard being costed, a decay in the standard of 1 year every year (i.e. a standard of 1 in 100 would decline to 1 in 99 in year 1, then to 1 in 98 in year 2, etc.) is assumed. This allows the year to be determined in which the standard decays to the standard being costed. This is then taken as the year in which maintenance works must begin. The condition of the defences is used to determine when replacement capital works would be required. The following assumptions are used: • condition 1 (good): year 60; • condition 2 (moderate): year 40; • condition 3 (fair): year 25; • condition 4 (poor): year 15; and • condition 5 (bad): year 5.
Hence, a defence whose condition is currently good is predicted to not require any new capital works until year 60, while a defence in bad condition would require capital works in year 5. The year when capital works would be required is then compared with the year in which maintenance works need to begin when based only on standard (and change in standard) provided. If the year when capital works have to begin is sooner (i.e. closer to year 0) than that estimated for maintenance works, it is assumed that maintenance works would begin in the same year as when the capital works are undertaken (i.e. maintenance works have to be undertaken sooner than if the condition of the defences was better). The year in which works are to be undertaken is important when considering the discounted cost estimates. Maintenance works are estimated at 1 per cent of the capital costs per year. The annual maintenance costs are estimated by multiplying the capital costs appropriate to the type of defence by the length of defence and by 1 per cent. For the cash costs, the annual costs are multiplied by the number of years over which maintenance is required. For the discounted costs, the annual maintenance works are multiplied by the sum of the discount factors for the years over which maintenance is required5.
5 Thus, if maintenance is required from years 25 to 99, discount factors are calculated for
year 25, 26 … 99 and summed. For years 25 to 99, the sum of the discount factors is 12.754. This is then multiplied by the annual maintenance costs. An indication of the impact of discounting can be seen when considering that the estimated cash costs are calculated by multiplying the annual maintenance costs by the number of years between year 25 and 99, i.e. 75.

12 Section 2: Summary of approach
Capital works are assumed to have a life expectancy of 60 years. Therefore, where capital works are required in years 0 to 39, it will be necessary to undertake further capital works in years 60 to 99. For the cash costs, the capital costs are estimated by multiplying the capital costs appropriate to the type of defence by the length of defence, and the number of times replacement defences will be required. For the discounted costs, the capital costs are estimated by multiplying the capital costs appropriate to the type of defence by the length of defence, and the number of times replacement defences will be required, and the discount factor for the year(s) in which capital costs are required. Defence costs have been identified in terms of the defence type, with alternative cost estimates based on low, mid and high exposure to tides and waves. Thus, those defences in areas with higher tidal range and mean wave height are estimated to have higher costs than those where the tidal range and/or wave heights are lower. The information used to determine whether higher or lower costs are more appropriate is the same as was used in determining vulnerability (mean tidal range, mean wave height), thus, there is consistency within the overall approach. A macro is used in the spreadsheet to identify the per metre cost data by defence type, and for the appropriate tidal range/wave height. A macro is required as the costs for each defence type are included on a separate worksheet. This is considered to make it easier to update the cost figures, if required, in the appropriate worksheets. The macro can then be re-run to use the updated defence cost figures when estimating the costs of providing defences to the Natura 2000/SSSI/Ramsar sites. The defence cost figures have been estimated for a 1 in 100 year standard defence, therefore, it is necessary to reduce them for the lower standard defences. This is done by assuming that providing lower standards of defence would incur only a percentage of the costs of providing a 1 in 100 year standard. Thus, a 1 in 5 standard is assumed to cost 50 per cent of the costs of providing a 1 in 100 year standard. For the 1 in 20 standard, the factor is 80 per cent. The spreadsheet allows these percentages to be changed, if required. The cost estimates used have been generated by reference to the Environment Agency’s Unit Cost database6, cost databases held by Royal Haskoning and RPA and the experience of the project team of costing flood defence projects. The resulting estimates have been validated by verifying that the resulting overall estimate for a number of sites within the spreadsheet are in accordance with actual/predicted cost estimates. All of the cost estimates are included in the spreadsheet and can be updated, as necessary. The total capital and maintenance costs are then calculated as the sum of all the records protected by discrete lengths of defence, as both cash and discounted costs, for the three standards being assessed (i.e. 1 in 5, 1 in 20 and existing). The spreadsheet allows the 1 in 5 and/or 1 in 20 year standard of defence to be changed, if required, to allow costs for other standards to be estimated.
6 Environment Agency (2005): EA Unit Cost Database, prepared by Arup, July 2005.
Section 2: Summary of approach 13
Uncertainty is incorporated into the cost estimates in two ways. Firstly, all estimates are presented to two significant figures. This is to reflect the number of significant figures used in the input data (defence length and estimated per metre costs for each defence type). Presenting the overall cost estimates to a perceived ‘accuracy’ of greater than two significant figures would be to introduce a spurious level of detail. Secondly, the reliability of the source used to identify defence type, standard and condition is considered to give an indication of the likely uncertainty that is introduced. Uncertainty is expected to be lower when information is taken from records and higher when expert opinion or default values are used. Uncertainty bands are applied to reflect the difference in the level of reliability of input data: • assessment of standard:
o recorded: ±5%; o land type: ±15%; and o expert opinion: ±25%.
• assessment of defence: o record: ±5%; o visual: ±15%; and o expert opinion: ±25%.
• assessment of condition: o record: ±5%; o expert opinion: ±15%; and o default: ±25%.
It is assumed that these uncertainty bands are additive. Thus, the minimum uncertainty is ±15 per cent. This may over-estimate total uncertainty unless there is systematic bias in the way that defence type, standard and condition have been identified7. As there are other uncertainties that are not explicitly reflected in the uncertainty bands (e.g. defence length), it is considered that an additive approach is appropriate for the high level estimates being made in this study. Uncertainty is assigned on a record-by-record basis. This means that each record has its own overall level of uncertainty depending on the information used when assessing the defence type, standard and condition. Overall uncertainty is calculated by summing the low and high cost estimates across all of the sites, and for both cash and discounted cost estimates.
7 Since most of the defences have been identified by the same people in the same way,
there is potential that systematic bias may have been introduced. Some calibration of the records has been undertaken, however, (e.g. by comparing defence lengths identified through expert opinion with those included in NFCDD or SMPs) such that systematic bias should be minimised.

14 Section 2: Summary of approach
2.6 Assessing fresh and brackish water replacement costs Habitat replacement costs The main assumptions used when identifying habitat replacement costs were: • no costs for ongoing management or monitoring were included as it was
assumed that these costs are already paid for by nature conservation agencies as part of existing management and monitoring of designated sites and that the existing budgets would be transferred to the newly created sites;
• it was assumed that all land for habitat creation would be purchased rather
than rented or entered into a management agreement with the existing landowner. In order to estimate land purchase costs, Defra statistics on “Agricultural land sales and prices in England” have been used (dated 14th September 2005). The average land value for England for 2004 has been used, which is £6,174 per hectare. It was assumed that the market value of the land would be paid (i.e. it would not be necessary to pay a premium);
• it was assumed that 100 per cent of the site purchased would be converted
to the required habitat; • it was assumed that there is sufficient land area available to create the area
of habitats that will be lost; and • it was assumed that neither public inquiry, compulsory purchase nor
environmental impact assessment would be required for any of the schemes.
There are also a number of assumptions specific to the different habitat types:
• Inland water bodies and lagoons:
o the costs for creation of inland water bodies have been developed based on the scenario that the average size of site created is five hectares. A sensitivity analysis was carried out to determine the sensitivity of costs to the size of site. If a 5ha site is created the cost was estimated to be ~£23,000/ha. In contrast, if the size of the site is doubled (i.e. 10ha) the costs per hectare decrease by ~40 per cent (for a 10ha site the cost per hectare is ~£14,600/hectare). This indicates that for this habitat the costs per hectare are sensitive to the size of the site because of the small size of the site and the one-off costs associated with the development of each site, such as the hydrological assessment; and
o Costs for a hydrological assessment and topographical survey were
included. Costs were also included for construction of water control structures or excavation.

Section 2: Summary of approach 15
• Wet grassland: o costs for the creation of wet grassland were based on the assumption
that agricultural land would be converted to wet grassland;
o it was assumed that a hydrological assessment, a water level management plan and a topographical survey would be required;
o it was assumed that water level management would be needed to ensure
all areas receive adequate water and water levels are maintained preventing both water logging and drying out, e.g. through drainage channels, ditch creation and/or periodic flooding using sluice systems. If the field used for wet grassland creation does not have the varied topography (required to create the mosaic of wet and dry areas), some contouring may be required; costs for the creation of water control structures and/or the digging of ditches are included;
o it was assumed that a sufficient seedbank would not be available and
therefore costs for manual seeding were included at £1,000/hectare; and
o costs per hectare have been based on the assumption that the average size of site created would be 20ha. A sensitivity analysis was carried out to determine the sensitivity of costs to the size of site. If a 20ha site is created the cost is estimated to be ~£16,000/ha. In contrast, if the size of the site is doubled (i.e. 40ha) the costs per hectare decreases by ~20 per cent (for a 40ha site the cost per hectare is ~£13,000/hectare). This indicates that for this habitat the costs per hectare are reasonably sensitive to the size of the site because of the one-off costs associated with the development of each site, such as the hydrological assessment.
• Drier grassland:
o for drier grassland it is assumed that the only treatment that would be required is manual seeding and then appropriate cutting/grazing regime. It is assumed that the land purchased is already suitable in terms of ground conditions and pH and that no treatment is required prior to seeding; and
o costs for creation of this habitat increase in direct proportion with the size
of the site. The costs per hectare do not therefore vary with the size of the site.
• Bogs, marshes and fens:
o costs were developed on the scenario that of the average size of site created is 20 hectare;
o it is assumed that a hydrological assessment, water level management
plan and topographical survey would be required;
o costs have also been included for ditch excavation and construction of water control structures;

16 Section 2: Summary of approach
o costs have been included for removal of scrub/trees and removal of mud/silt or peat in order to create suitable conditions. It is assumed that that mud or silt is not contaminated and therefore would not require special disposal methods; and
o it was assumed that some vegetation management would be required in
order to allow establishment, e. g: prevent grazing by wildfowl, esp. geese through perimeter fencing or floating barriers (to prevent open water landing/take-off).
Identifying habitats to be re-created The approach to identifying those Natura 2000/SSSI/Ramsar sites that may be vulnerable to coastal and estuarine flooding above is assumed to also indicate those sites that may need to be re-created in a more sustainable location. The spreadsheet is organised such that both the replacement costs and defence costs can be calculated without the need to duplicate information. The 290 sites identified as being possibly or probably vulnerable are assumed to be those that will need to be replaced. However, the habitat types for which replacement costs can be identified differ slightly from those included in English Nature’s database. Table 2.3 sets out how the habitat types from English Nature’s database have been correlated with the habitat types for which replacement costs could be found. It is assumed that the site would continue to be protected by defences until the condition of the defences reduces such that capital works need to be undertaken. However, it is also assumed that habitat replacement needs to be undertaken in advance of failure of the defences such that the habitat replacement costs are incurred five years before failure of the defences is predicted. Table 2.3 Correlation of habitat types in spreadsheet with replacement cost categories
Replacement cost categories English Nature habitat types
Inland water bodies and lagoons Coastal lagoons
Rivers and streams
Standing open water and canals
Wet grassland1 Acid grassland: lowland
Neutral grassland: lowland
Drier grassland2 Improved grassland
Bogs, marshes and fens Bogs
Fen, marsh and swamp
Notes: 1, 2 In reality, whether grassland within a particular unit is classified as ‘wet’ or ‘drier’ grassland would have to be assessed on a site-by-site basis. This has not been possible here due to the large number of units to consider, hence, the above simplifying assumption is used.

Section 2: Summary of approach 17
Table 2.4 gives the estimated area, by habitat type that is predicted to need replacing. All figures are given to a maximum of two significant figures.
Table 2.4 Area of each habitat type predicted to need replacing
Replacement cost categories Area (hectares)
Inland water bodies and lagoons 2,400
Wet grassland 15,000
Drier grassland 700
Bogs, marshes and fens 14,000
Total 32,300
2.7 Assessing saltmarsh re-creation costs Predicting change in saltmarsh area The simplest method to provide a prediction of likely change in saltmarsh extent is direct extrapolation of historic trends. If good data are available to indicate that trends in saltmarsh change are ongoing and relatively consistent, direct extrapolation offers a simple method of assessing likely future change at a national scale. However, due to uncertainty in the processes driving future saltmarsh erosion and accretion, particularly sea-level change and sediment supply, these estimates should not be quoted out of context. A simple linear extrapolation into the future will not take into consideration the complex nature of natural coastal systems where future conditions may differ from the past. Future conditions are likely to be better understood using one or more of the predictive methods currently available, including regime methods and expert geomorphological assessment. In particular, the response of estuaries to sea level change may involve significant morphological change which may affect saltmarsh accretion/erosion rates, meaning that extrapolation of historic data is not accurate. Therefore, care needs to be taken with respect to the use of the predicted losses (and gains) of saltmarsh based on linear extrapolation of historic rates. In most of the SPAs studied, the total area of saltmarsh has decreased over the period of record. In most of the SPAs (apart from Deben Estuary, Colne Estuary and Dengie), a linear extrapolation indicates that saltmarsh would be completely lost from the SPA area within the next 100 years. The Swale, Humber Flats, Marshes and Coast, The Wash and Severn Estuary (southern shore only) SPAs were the only areas examined where saltmarsh extent has historically increased. However, some other SPAs which were not included in the study are also understood to be accreting such as Morecambe Bay8. In some locations, no data was available to support comparative analysis and
8 Morecambe Bay was not included within the list of SPAs examined because it was
already known to be accreting and therefore was not relevant to the study.

18 Section 2: Summary of approach
calculation of saltmarsh change (Foulness, Isle of Wight). The overall change is presented in Table 2.5. Table 2.5 Estimated change in saltmarsh areas (ha) to 2105
SPA name Year Saltmarsh area (ha)
Rate of loss/ gain (ha/year)
Predicted area (ha) in 2105
Deben Estuary 1998 227.6 -1.71 44.6 (0.8)
Thames Estuary and Marshes
2000 30.5 -0.52 0 (0)
The Swale 2000 279.4 +1.51 438.0 (413.8)
Langstone Harbour 2001 71.0 -4.06 0 (0)
Eling to Marchwood 2001 18.7 -0.60 0 (0)
Beaulieu River 2001 54.5 -2.43 0 (0)
Keyhaven and Lymington 2000 202.0 -6.07 0 (0)
Calshot 2001 146.4 -2.49 0 (0)
The Wash 2002 4485.8 +22.24 6776.5 (8651.1)
Notes: Based on linear extrapolation over the whole period of data time series
Bracketed numbers are rates based on latest two datasets The English Nature database was used to select the units that were considered, such that only those descried as ‘coastland: saltmarsh’ were included. This was to avoid large areas of mudflat. This means that some estuary sites (such as the Alde/Ore) were excluded. In several instances a different extrapolation rate can be applied to the historic data because a longer time series of historic data is available (Deben Estuary, Thames Estuary and Marshes, The Swale, Langstone Harbour, most Solent and Southampton Water sub-areas and The Wash. The differences in outcome are shown in Table 2.5. The Table shows that only three predicted areas change significantly if a different (and no less valid) extrapolation rate is applied. The final 2105 areas in the Deben Estuary SPA and the Swale SPA both increase, by 43.8 ha and 24.2 ha, respectively. The final outcome for The Wash SPA would be a decrease in the 2105 area of 1874.6 ha. A full description of the approach used to estimate the predicted gains/losses of saltmarsh by 2105 is provided in Annex 2. Costs of re-creating saltmarsh habitat The cost estimates for re-creating saltmarsh were based on the following assumptions and draw on CIRIA (2004)9:
9 CIRIA (2004): Coastal and Estuarine Managed Realignment – Design Issues, CIRIA
report C628, London.

Section 2: Summary of approach 19
• all the saltmarsh lost would be created by managed realignment rather than other habitat creation techniques, because although in some locations it might be possible to extend the saltmarsh by going seawards, it was assumed that these opportunities are generally limited;
• it was assumed that the average size of site would be 60ha. This is the
average size of managed realignment schemes undertaken to date (data taken from Royal Haskoning, 2004 and CIRIA, 2004), excluding several trial pilot sites and rounded to the nearest 10 to make consistent with the other data in this report. In order to determine the sensitivity of costs to the size of the site, an analysis was undertaken for the costs of different sizes of sites. If the size of the site increases by 50 per cent (i.e. the average size of site is 90ha) the costs per hectare decrease by ~17 per cent. This demonstrates that the costs are relatively insensitive to the size of the site because the majority of the costs are made up by land purchase and construction of embankments;
• it was assumed that saltmarsh would be created as close as possible to the
location where it is lost from, i.e. if it is lost in the southeast it would be recreated in the southeast; and there is sufficient land area available to create the area of saltmarsh that will be lost;
• no costs for monitoring were included as it was assumed that these costs
are already paid for by nature conservation agencies as part of statutory monitoring of designated sites and that this existing monitoring would be transferred to the new managed retreat sites;
• all land for managed realignment would be purchased rather than rented or
entered into a management agreement with the existing landowner. In order to estimate land purchase costs, Defra statistics on “Agricultural land sales and prices in England” have been used (dated 14 September 2005). To take account of regional variation in land prices, the average price per ha for land (including land with buildings) in each region has been used. The most recent average land price in each region has been used, which is data for 2004. It was assumed that because limited locations are available for managed realignment it would be necessary to pay more than the market value in order to purchase the land. It was assumed that 50 per cent more than the market value would need to be paid;
• for the purposes of this estimation, all saltmarsh lost would be re-created as
saltmarsh (rather than just intertidal). It was also assumed that each managed realignment site would not be 100 per cent saltmarsh, because for technical reasons managed realignment sites normally comprise a percentage of mudflats. For the purposes of costings, it has been assumed that each managed retreat site would comprise 50 per cent mudflat and 50 per cent saltmarsh. Therefore in order to create 1 ha of saltmarsh, 2 ha of managed retreat would be needed. In the event that it was decided that mudflat would be acceptable in the place of saltmarsh, the overall costs for managed realignment would decrease by 50 per cent, as only half the area of managed realignment would be required;

20 Section 2: Summary of approach
• it was assumed that none of the land will require treatment to raise or lower
the level of the land behind the existing defence. No costs for such treatment have been included;
• the size of the site is dependent on the area of the land available. Due to
the shape of many estuaries, it is probable that in most cases these would comprise a series of parcels, rather than one very large site;
• it was assumed that no scheme would require compulsory purchase or
public inquiry; • the shape of the managed realignment site and the presence of rising
ground strongly influence costs of each site because they affect the length of new embankment required. For each estuary the percentage of sites which are square or long and thin have been defined. The percentage of sites which are likely to rise to higher ground has also been estimated. On square sites with no higher ground it has been assumed that new embankment would be required on three sides. On sites with higher ground it is assumed that embankments would be required along two sides, between the seawall and the higher ground; and
• £3000 per linear metre for construction of embankments has been allowed.
This is the figure that was given for earth embankments, with no crest wall or revetment in locations of medium tidal range and medium levels of wave exposure. It should be noted that the costs for construction of embankments make up the greatest proportion of the managed realignment costs and therefore the costs are very sensitive to changes in construction cost.
The cost data used in this study are as follows;
• land purchase costs:
o south east of England: £15,172.5 per hectare; o east of England: £ 9,675 per hectare; and o south west of England: £13,746 per hectare.
• pre-construction costs: o topographic survey: £5,000 each; o water level data: £5,000; o niche modelling: £20,000; o other design costs (outline design, detailed design, etc.): £50,000; and o Environmental Impact Assessment: £50,000.
• construction costs: o construction of earthbank (including breach and
mobilisation/demobilisation): £3,000 per linear metre. These assumptions result in different costs, per (60ha) managed realignment site, across England, as given in Table 2.6, overleaf, depending on the shape of the site.

Section 2: Summary of approach 21
Table 2.6 Costs of re-creating saltmarsh per 60ha managed realignment site in different regions of England
Region Long and thin site with no
rising ground
Long and thin site with rising
ground
Square site with rising
ground
Square site with no rising
ground
East of England £7,300,000 £3,700,000 £5,400,000 £7,700,000
South East £7,600,000 £4,000,000 £5,700,000 £8,000,000
South West £7,600,000 £4,000,000 £5,600,000 £7,900,000
22 Section 2: Summary of approach

Section 3: Cost estimates 23
3. Cost estimates 3.1 Costs of protecting fresh and brackish water Natura 2000/
SSSI/Ramsar sites The costs of protecting fresh and brackish water Natura 2000/SSSI/Ramsar sites where there are currently defences are set out in Table 3.1, overleaf. The Table shows the capital and maintenance costs for three different standards (1 in 5, 1 in 20 and maintenance of the existing standard). Two sets of costs are given: one representing ‘cash’ costs, i.e. undiscounted totals over 100 years, and one representing ‘discounted’ costs (which have been estimated using the Treasury discount rate of 3.5 per cent (reducing)). Table 3.1 shows that the costs are estimated as: • cash costs:
o maintaining existing standard: £1,300 million to £5,200 million with a mid estimate of £3,200 million (equivalent to uncertainty of £3,300 million ±60%10);
o 1 in 5 standard: £760 million to £2,900 million with a mid estimate of £1,800 million (equivalent to uncertainty of £1,800 million ±60%10); and
o 1 in 20 standard: £1,200 million to £4,600 million with a mid estimate of £2,900 million (equivalent to uncertainty of £2,900 million ±60%10).
• discounted costs: o maintaining existing standard: £350 million to £1,400 million with a mid
estimate of £870 million (equivalent to uncertainty of £870 million ±60%11);
o 1 in 5 standard: £190 million to £680 million with a mid estimate of £430 million (equivalent to uncertainty of £430 million ±60%11); and
o 1 in 20 standard: £360 million to £1,400 million with a mid estimate of £860 million (equivalent to uncertainty of £870 million ±60%11).
The existing standard, if taken as the average of standard provided across all sites is approximately 1 in 40 years. Therefore, it would be expected to have the highest costs. When comparing the discounted costs, it is interesting that the 1 in 20 year standard and existing standard have very similar costs, reflecting the greater influence of timing on the discounted costs over the amount/extent of capital works that are required. The equivalent annual cost estimates (i.e. the constant annual cost which, when summed, has the same present value as the actual costs) are (based on the mid bound cost estimates): 10 Uncertainty is actually -60% and +58% for maintaining the existing standard, -58% and
+58% for the 1 in 5 standard, and -57% and +59% for the 1 in 20 standard, ±60% is given here as an approximate indication of uncertainty.
11 Uncertainty is actually -60% and +59% for maintaining the existing standard, -57% and
+58% for the 1 in 5 standard, and -59% and +56% for the 1 in 20 standard, ±60% is given here as an approximate indication of uncertainty.

24 Section 3: Cost estimates
Tabl
e 3.
1 C
osts
of p
rote
ctin
g fr
esh
and
brac
kish
wat
er N
atur
a 20
00/S
SSI/R
amsa
r site
s
Cas
h co
sts
Dis
coun
ted
cost
s S
tand
ard
Low
M
id
Hig
h Lo
w
Mid
H
igh
Exis
ting:
mai
nten
ance
£520
,000
,000
£1,3
00,0
00,0
00
£2
,000
,000
,000
£150
,000
,000
£370
,000
,000
£590
,000
,000
Exis
ting:
cap
ital
£8
10,0
00,0
00
£2
,000
,000
,000
£3,2
00,0
00,0
00
£2
00,0
00,0
00
£5
00,0
00,0
00
£7
90,0
00,0
00
Exis
ting:
tot
al
£1
,330
,000
,000
£3,3
00,0
00,0
00
£5
,200
,000
,000
£350
,000
,000
£870
,000
,000
£1,3
80,0
00,0
00
1 in
5:
mai
nten
ance
£260
,000
,000
£620
,000
,000
£980
,000
,000
£56,
000,
000
£1
30,0
00,0
00
£2
00,0
00,0
00
1 in
5:
capi
tal
£5
00,0
00,0
00
£1
,200
,000
,000
£1,9
00,0
00,0
00
£1
30,0
00,0
00
£3
00,0
00,0
00
£4
80,0
00,0
00
1 in
5:
tota
l
£760
,000
,000
£1,8
20,0
00,0
00
£2
,880
,000
,000
£186
,000
,000
£430
,000
,000
£680
,000
,000
1 in
20:
mai
nten
ance
£440
,000
,000
£1,0
00,0
00,0
00
£1
,600
,000
,000
£100
,000
,000
£250
,000
,000
£390
,000
,000
1 in
20:
cap
ital
£8
00,0
00,0
00
£1
,900
,000
,000
£3,0
00,0
00,0
00
£2
60,0
00,0
00
£6
20,0
00,0
00
£9
70,0
00,0
00
1 in
20:
tot
al
£1
,240
,000
,000
£2,9
00,0
00,0
00
£4
,600
,000
,000
£360
,000
,000
£870
,000
,000
£1,3
60,0
00,0
00

Section 3: Cost estimates 25
• maintaining existing standard: £29 million per year; • 1 in 5 standard: £14 million per year; and • 1 in 20 standard: £29 million per year. Figure 3.1 provides a cost profile showing when both the capital and maintenance costs would be incurred. The capital costs have been averaged over a ten year period to indicate the amount required each year to provide the defence standard being considered. This is considered a more realistic pattern of likely expenditure than if all of the costs were assumed to be incurred in one year.
£0
£10,000,000
£20,000,000
£30,000,000
£40,000,000
£50,000,000
£60,000,000
£70,000,000
0 5 10 15 20 25 30 35 40 45 50 55 60 65 70 75 80 85 90 95 100
Year
Cap
ital c
ost (
£ pe
r ann
um)
£0
£2,000,000
£4,000,000
£6,000,000
£8,000,000
£10,000,000
£12,000,000
£14,000,000
Mai
nten
ance
cos
t (£
per a
nnum
)
Maintenance at existing standard
Maintenance at 1:20 standard
Maintenance at 1:5 standard
Capital costs: existing standard
Capital costs: 1:20 standard
Capital costs: 1:5 standard
Figure 3.1 Profile of capital and maintenance costs averaged over 10 years (cash costs)
These cost estimates appear large when first considered. However, they can be compared with current expenditure of flood risk management of around £500 million per year in England and Wales. Over 100 years (undiscounted), this is equivalent to total costs of £50,000 million or around £15,000 million (discounted). This means that the costs of protecting the Natura 2000/SSSI/Ramsar sites would account for 6 per cent of total expenditure over the next 100 years (to continue to provide the existing standard of defence or a 1 in 20 year standard) and 4 per cent of total expenditure to provide a 1 in 5 year standard. The total area protected is estimated to be 32,000 ha. Therefore, the costs of protecting the sites is equivalent to £1,000 per hectare per year (existing standard), £560 per hectare per year to provide a 1 in 5 year standard and £910 per hectare per year to provide a 1 in 20 year standard.
26 Section 3: Cost Estimates
3.2 Replacement costs for fresh and brackish water sites The costs of replacing fresh and brackish water sites in more sustainable locations are given in Table 3.2. The Table also shows the total area to be replaced and the costs of replacing four different types of habitat. Cash (i.e. undiscounted) and discounted costs (using the Treasury rate of 3.5 per cent reducing) are also given. Table 3.2 Costs of replacing Nature 2000/SSSIs currently protected by defences
Total area to be replaced: 32,300 ha
No. sites Cash costs Discounted costs
Total replacement costs 290 £510,000,000 £150,000,000
Inland water bodies and lagoons 66 £56,000,000 £14,000,000
Wet grassland 151 £240,000,000 £67,000,000
Drier grasslands 13 £11,000,000 £3,800,000
Bogs, marshes, fens 60 £210,000,000 £70,000,000
The Table shows that the total estimated costs are £510 million. These reduce to £150 million when discounted. This is due to the large proportion of sites where the condition of the defences is such that capital work is not required until year 25. The equivalent annual cost estimates for replacement of Natura 2000/SSSI/Ramsar sites are £5.2 million per year. The largest replacement costs are associated with ‘wet grassland’ and ‘bogs, marshes and fens’. The cost associated with replacing ‘bogs, marshes and fens’ are much higher per site when compared with ‘inland water bodies and lagoons’ (where a similar number of sites are to be replaced, 66 compared with 60, but the replacement costs are much lower, £56 million compared with £210 million). Many of the assumptions made in estimating the per hectare replacement costs are likely to result in an under-estimate of the total costs. Furthermore, the requirement to replace more than 32,000 ha of land is likely to result in an increase in land price. As a result, uncertainty within the replacement costs is likely to be at least equal to uncertainty in the defence costs. If it is assumed that the estimated replacement costs may under-estimate potential costs by 60 per cent, the cash costs would increase to £820 million and the discounted costs to £240 million.
3.3 Costs of re-creating saltmarsh habitat The total costs across England of replacing saltmarsh lost due to coastal squeeze are presented in Table 3.3. The costs for each Estuary/SPA are given to two significant figures to reflect uncertainty. The Table also shows the area of managed retreat required, by Estuary/SPA, the proportion of retreat sites that

Section 3: Cost estimates 27
are long and thin or square and which are with/without rising ground and the estimated costs for each Estuary/SPA, and for two different scenarios: • costs of re-creating intertidal habitat (i.e. the same area that is lost needs to
be re-created); and • costs of re-creating the same area of saltmarsh habitat (i.e. double the area
of saltmarsh lost needs to be re-created assuming 50 per cent mudflat will form).
As can be seen from Table 3.3, the estimated costs are around £500 million to re-create 4,400 ha of intertidal habitat and, from Table 3.4, almost £1,000 million to re-create around 8,800 ha of saltmarsh lost due to coastal squeeze in England. The equivalent annual cost estimates are £16 million per year for re-creation of intertidal habitats and £33 million per year for re-creation of saltmarsh. As noted above, there is likely to be considerable uncertainty in these figures due to the use of linear interpolation of the rate of saltmarsh loss from historical data. It is difficult to identify what this uncertainty may be due to the large number of unknowns, but there are three sites where it was possible to estimate alternative estimates of losses (Deben Estuary, The Swale and The Wash, see Table 2.3). Of these sites only the Deben results in a loss of saltmarsh, while The Swale and The Wash would gain saltmarsh by 2105. Using these alternative estimates of losses/gains in saltmarsh allows potential uncertainty within the total cost estimates to be estimated as follows: • Deben Estuary:
o estimate of saltmarsh lost: 183 ha (227.6 – 44.6) o alternative estimate of saltmarsh lost: 226.8 ha (227.6 – 0.8) o change in area lost: 20 per cent more lost under alternative estimate
(i.e. costs may be under-estimated by 20 per cent). • The Swale:
o estimate of saltmarsh gain: 158.6 ha (438.0 – 279.4) o alternative estimate of saltmarsh gain: 134.4 ha (413.8 – 279.4) o change in area gained: 9 per cent less gained under alternative scenario
(i.e. costs may be under-estimated by 9 per cent). • The Wash:
o estimate of saltmarsh: 2290.7 ha gain(6776.5 – 4485.8) o alternative estimate of saltmarsh gain: 4165.3 ha (8651.1 – 4485.8) o change in area gained: 42 per cent more gained under alternative
scenario (i.e. costs may be over-estimated by 42 per cent). The above calculations indicate that the cost estimates could be 42 per cent less to 20 per cent more, i.e. range from £290 million to £590 million for re-creation of intertidal habitat and from £570 million to £1,200 million for re-creation of all saltmarsh lost due to coastal squeeze. It should be remembered that uncertainty is based on three alternative estimates that may not adequately reflect uncertainty in other sites. However, without further data it is not possible to estimate uncertainty in other estuaries/SPAs.

28 Section 3: Cost estimates
Tabl
e 3.
3 I
nter
tidal
hab
itat r
e-cr
eatio
n co
sts
(re-
crea
tion
of th
e sa
me
area
that
is lo
st)
Estu
ary/
SPA
A
rea
of m
anag
ed
retr
eat r
equi
red
(ha)
R
egio
n %
Lon
g an
d th
in
site
s w
ith n
o ris
ing
grou
nd
% L
ong
and
thin
site
s w
ith
risin
g gr
ound
% s
quar
e si
tes
with
ris
ing
grou
nd
% s
quar
e si
tes
with
no
risin
g gr
ound
No.
of
sche
mes
re
quire
d
Cos
t per
es
tuar
y/SP
A
Deb
en E
stua
ry
23
0 Ea
st
50
%
50
%
4
£2
1,00
0,00
0 S
tour
and
Orw
ell E
stua
ries
16
0 Ea
st
50
%
50
%
3
£1
5,00
0,00
0 H
amfo
rd W
ater
610
East
10
0%
10
£79,
000,
000
Col
ne E
stua
ry
60
0 Ea
st
10
%
40
%
10
%
40
%
10
£58,
000,
000
Bla
ckw
ater
Est
uary
670
East
40%
40%
10%
10%
11
£6
4,00
0,00
0 D
engi
e
290
East
10
0%
5
£3
7,00
0,00
0 C
rouc
h an
d R
oach
Est
uarie
s
390
East
10
0%
6
£5
0,00
0,00
0 Fo
ulne
ss
0
East
10
0%
0
£0
B
enfle
et a
nd S
outh
end
Mar
shes
140
East
50%
50%
2
£15,
000,
000
Tham
es E
stua
ry a
nd M
arsh
es
31
S
outh
Eas
t
10
0%
1
£4
,000
,000
Th
e S
wal
e
0 S
outh
Eas
t
0
£0
Chi
ches
ter H
arbo
ur
38
0 S
outh
Eas
t
24%
56%
6%
14
%
6
£3
6,00
0,00
0 La
ngst
one
Har
bour
71
Sou
th E
ast
100%
1
£9,5
00,0
00
Por
tsm
outh
Har
bour
53
Sou
th E
ast
100%
1
£7,0
00,0
00
Sol
ent a
nd S
outh
ampt
on W
ater
0 S
outh
Eas
t
0
£0
Elin
g to
Mar
chw
ood
19
S
outh
Eas
t
10
0%
0.3
£2
,500
,000
B
eaul
ieu
Riv
er
55
S
outh
Eas
t
25%
75%
1
£4,5
00,0
00
Key
have
n an
d Ly
min
gton
200
Sou
th E
ast
10
0%
3
£26,
000,
000
Cal
shot
150
Sou
th E
ast
100%
2
£20,
000,
000
Riv
er H
ambl
e
27
Sou
th E
ast
100%
0.
4
£1,8
00,0
00
Hum
ber F
lats
, Mar
shes
and
C
oast
0 N
/R
0
Th
e W
ash
0
N/R
0
Sev
ern
Estu
ary
(sou
th s
hore
on
ly)
35
0 S
outh
Wes
t
10
0%
6
£4
6,00
0,00
0 TO
TAL
CO
ST F
OR
EN
GLA
ND
4,40
0
£49
0,00
0,00
0

Section 3: Cost estimates 29
Tabl
e 3.
4 S
altm
arsh
re-c
reat
ion
cost
s (r
e-cr
eatio
n of
the
doub
le th
e ar
ea th
at is
lost
)
Estu
ary/
SPA
A
rea
of m
anag
ed
retr
eat r
equi
red
(ha)
R
egio
n %
long
and
thin
si
tes
with
no
risin
g gr
ound
% lo
ng a
nd
thin
site
s w
ith
risin
g gr
ound
% s
quar
e si
tes
with
ris
ing
grou
nd
% s
quar
e si
tes
with
no
risin
g gr
ound
No.
of
sche
mes
re
quire
d
Cos
t per
es
tuar
y/SP
A
Deb
en E
stua
ry
45
0 Ea
st
50
%
50
%
8
£4
2,00
0,00
0 S
tour
and
Orw
ell E
stua
ries
32
0 Ea
st
50
%
50
%
5
£3
0,00
0,00
0 H
amfo
rd W
ater
1200
Ea
st
100%
20
£16
0,00
0,00
0 C
olne
Est
uary
1200
Ea
st
10
%
40
%
10
%
40
%
20
£
120,
000,
000
Bla
ckw
ater
Est
uary
1300
Ea
st
40
%
40
%
10
%
10
%
22
£
130,
000,
000
Den
gie
58
0 Ea
st
100%
10
£7
4,00
0,00
0 C
rouc
h an
d R
oach
Est
uarie
s
780
East
10
0%
13
£
100,
000,
000
Foul
ness
0 Ea
st
100%
0
£0
Ben
fleet
and
Sou
then
d M
arsh
es
27
0 Ea
st
50
%
50
%
4
£2
9,00
0,00
0 Th
ames
Est
uary
and
Mar
shes
60
Sou
th E
ast
100%
1
£8,1
00,0
00
The
Sw
ale
0
Sou
th E
ast
0
£0
C
hich
este
r Har
bour
770
Sou
th E
ast
24
%
56
%
6%
14%
13
£7
1,00
0,00
0 La
ngst
one
Har
bour
140
Sou
th E
ast
100%
2
£19,
000,
000
Por
tsm
outh
Har
bour
110
Sou
th E
ast
100%
2
£14,
000,
000
Sol
ent a
nd S
outh
ampt
on W
ater
0 S
outh
Eas
t
0
£0
Elin
g to
Mar
chw
ood
38
S
outh
Eas
t
10
0%
1
£5
,000
,000
B
eaul
ieu
Riv
er
11
0 S
outh
Eas
t
25%
75%
2
£9,0
00,0
00
Key
have
n an
d Ly
min
gton
400
Sou
th E
ast
10
0%
7
£51,
000,
000
Cal
shot
290
Sou
th E
ast
100%
5
£39,
000,
000
Riv
er H
ambl
e
53
Sou
th E
ast
100%
1
£3,6
00,0
00
Hum
ber F
lats
, Mar
shes
and
C
oast
0 N
/R
0
£
0 Th
e W
ash
0
N/R
0
£0
Sev
ern
Estu
ary
(sou
th s
hore
on
ly)
69
0 S
outh
Wes
t
10
0%
12
£92,
000,
000
TOTA
L C
OST
FO
R E
NG
LAN
D
8,
800
£99
0,00
0,00
0

30 Section 4: Problems encountered and difficulties addressed

Section 4: Problems encountered and difficulties addressed 31
4. Problems encountered and difficulties addressed
4.1 Problems and difficulties associated with estimating the
costs of protecting fresh and brackish water Natura 2000/ SSSI/Ramsar sites
The starting point was to take all Natura 2000/SSSI/Ramsar sites within 10km of the coast. This seemed to capture the majority of sites that were likely to be vulnerable to coastal flooding. However, areas that are not directly protected by coastal defences (such as the Norfolk and Suffolk Broads, or those that are along tidal rivers) were not included in the costing exercise. It may be necessary to consider further the implications of tidal flooding for sites up to the tidal limits of rivers and that are indirectly protected by coastal defences to ensure that the costs of meeting coastal environmental requirements are not significantly under-estimated. The degree to which excluding these sites from the cost estimates is not known and is difficult to estimate without considerable investigation into the number and extent of sites that are indirectly affected by coastal defences or protected by tidal defences. The study attempted to make use of existing databases, Shoreline Management Plans, strategies, etc. to inform the identification of Natura 2000/SSSI/Ramsar sites around the coast. The usefulness of these varied: • the English Nature Internet site (Nature on the Map) was very useful as it
provided maps that could be used to identify where the relevant SSSI units are located, which units are protected by coastal defences and where more than one unit is protected by the same defences. However, the need to look at each unit individually made this a time consuming exercise;
• the Environment Agency’s NFCDD was useful where data were included in
the database, but in most cases records were incomplete and there seemed to be a lot of missing data. However, it was possible to use the limited information in NFCDD to validate estimates of defence length and type taken from maps and photographs;
• the Environment Agency’s Unit Cost Database was of limited use as the
costs were not given in units that could be used within this study; and • Shoreline Management Plans provided useful information on defence type
and standard, with lengths measurable from maps. One of the most difficult pieces of information to obtain was the condition of the defence and, hence, its residual life. In almost all cases, this was based on expert opinion of the project team, through their knowledge of the defences themselves or more general engineering expertise. This is an important factor in determining when works may be required to replace or upgrade the defences.

32 Section 4: Problems encountered and difficulties addressed
All of the above factors can be updated in the cost calculation spreadsheet that accompanies this report as new information becomes available. In this way, uncertainties introduced due to the above difficulties can be reduced and the cost estimates refined. 4.2 Problems and difficulties associated with estimating
replacement costs for fresh and brackish water sites The resilience of different habitats to saline flooding has been taken into consideration to some extent in the costing exercise, for example, habitats which would clearly not be affected by flooding were not included. However, some of the habitats which were included have varying sensitivities to saline flooding. It is recommended that further study is carried out into the resilience of these habitats to saline intrusion. This would help refine the cost estimates and may help prioritise sites on which action should be taken. It is unlikely that replacement sites of the same area would provide the same level of biodiversity as the existing fresh and brackish water Natura 2000/SSSI/Ramsar units. Thus, the conservation value of the replacement sites may be less than that of the original sites, particularly in the short term. This is an important consideration when comparing the costs of protecting sites in-situ versus re-creating them elsewhere. There is some concern over which habitats should be identified as ‘wet grassland’ and which as ‘drier grassland’. The current classification of acid grassland-lowland and neutral grassland-lowland as wet grassland, with improved grassland as drier grassland is assumed to give the ‘best’ indication of habitat types as it agrees more closely with work undertaken by Lee12. In this case, it is wet grassland that forms the large majority of grassland habitat that may need to be re-created. It may be necessary to consider each site in more detail, for example, using the citation. Such a detailed investigation for each site was outside of the remit of this study, but could be used to improve the robustness of the habitat re-creation cost estimates. 4.3 Problems and difficulties associated with estimating the
costs of re-creating saltmarsh habitat Predictions of saltmarsh loss are based on linear extrapolation of historic trends. There are a number of limitations with this method which could not be overcome within the constraints of this project. However, it would be possible investigate the estimates further with expert geomorphological assessment of the sites.
12 Lee EM (2000): The Implications of Future Managed Retreat on Protected Habitats
in England and Wales, report for English Nature, March 2000.

Section 4: Problems encountered and difficulties addressed 33
Simplifications are introduced through the use of ‘typical’ site sizes and shapes. However, the use of two different site shapes (long and thin, and square) gives a range of costs that highlights some of the uncertainty within the estimates.
34 Section 4: Problems encountered and difficulties addressed
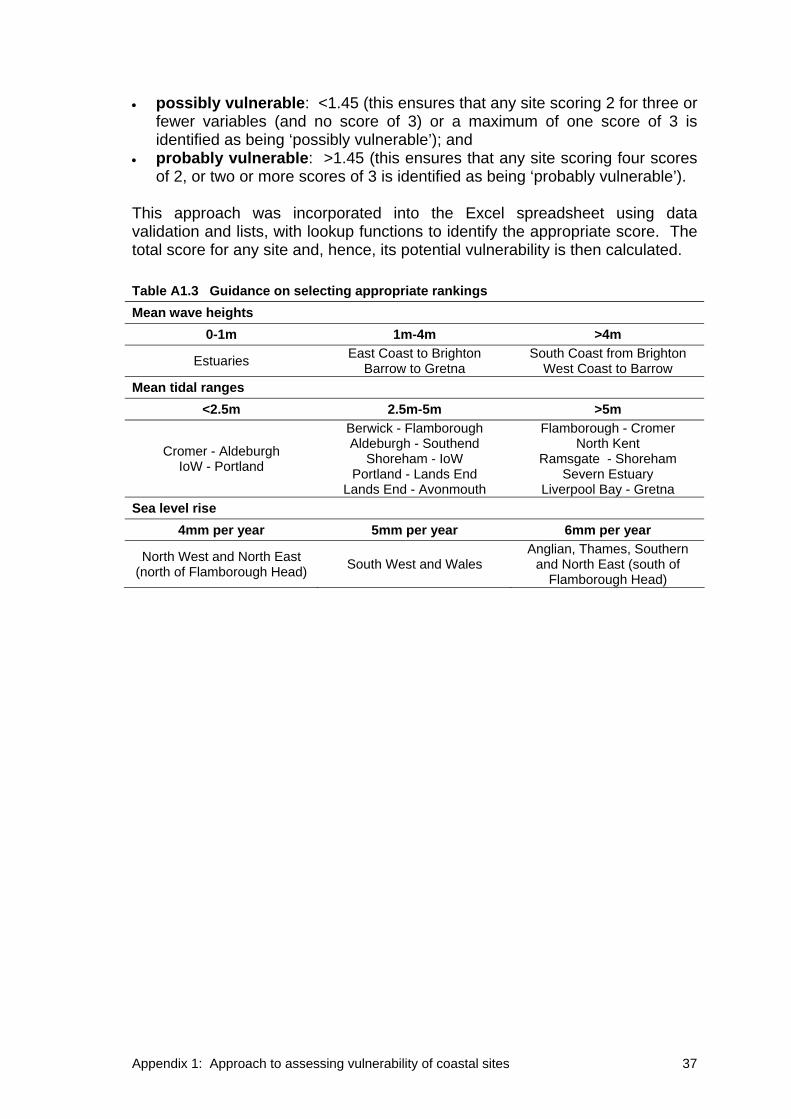
Appendix 1: Approach to assessing vulnerability of coastal sites 35
Appendix A1: Approach to assessing vulnerability of coastal sites A1.1 The US Coastal Vulnerability Index The United States Geological Survey (USGS) has developed a Coastal Vulnerability Index (CVI) to assess the relative vulnerability of coastal habitats to climate change and sea level rise. The CVI is based on six variables, each of which is assigned a score from 1 to 5. The table of variables and rankings for the Atlantic coast is reproduced as Table A1.1. Table A1.1 Ranking of Coastal Vulnerability Index variables
Ranking
Very low Low Moderate High Very high
Variable 1 2 3 4 5
a Geomorphology Rocky, cliffed coastsFiords, fiards
Medium cliffsIndented
cliffs
Low cliffs Glacial drift
Alluvial plains
Cobble beaches Estuary Lagoon
Coral reefs Mangrove
Barrier beaches
Sand beaches Mud flats Saltmarsh
Deltas
b Coastal slope (%)
>0.115 0.115 - 0.055
0.055 - 0.035
0.035 - 0.022
<0.022
c Relative sea level change (mm/yr)
<1.8 1.8 - 2.5 2.5 - 3.0 3.0 - 3.4 >3.4
d Shoreline erosion/ accretion (m/yr)
>2.0 (accretion)
2.0 - 1.0 (accretion)
-1.0 to +1.0 (stable)
-1.1 to -0.20 (erosion)
<-2.0 (erosion)
e Mean tide range (m)
>6.0 4.1 - 6.0 2.0 - 4.0 1.0 - 1.9 <1.0
f Mean wave height (m)
<0.55 0.55 - 0.85 0.85 - 1.05 1.05 - 1.25 >1.25
The results of the ranking are combined using the following formula, which calculates the CVI as the square root of the product of the ranked variables divided by the number of variables:
)6/)(( fedcbaCVI ×××××= This formula was identified as having the lowest sensitivity to a change in one of the rankings, thus, providing more consistent results were there is uncertainty in one or more of the variables.

36 Appendix 1: Approach to assessing vulnerability of coastal sites
A1.2 Using the principles of the CVI to assess vulnerability of coastal sites
Similar principles as are applied in the CVI could be used to assess the likely vulnerability of coastal sites in England: • geomorphology is not relevant as all of the sites are currently located behind
defences. Thus, a key variable could be whether the coast is likely to erode, is stable or accreting (thus combining two of the variables used in the CVI); this could be identified from the Futurecoast study;
• coastal slope would be difficult to include in here as the variables need to be readily identifiable. Coastal slope is also unlikely to be relevant for the same reason as geomorphology, i.e. the presence of defences;
• relative sea level change is also an important variable for England and the values given in FCDPAG3 could be used with lookup values in the Excel spreadsheet;
• mean tide range (m) should be readily available and could be linked to the nearest tidal gauging station such that lookup values could be used in the Excel spreadsheet; and
• mean wave height (m), this is more difficult than mean tide range but may be important.
This would give five variables for use in the coastal costs study. Table A1.2 presents an initial indication of the rankings that could be applied. Table A1.2 Ranking of variables for England Vulnerability Index Variable 1 2 3 a Relative sea level change 4mm/yr 5mm/yr 6mm/yr b Mean tide range (m) <1m 1-4m >4m c Mean wave height (m) <2.5m 2.5-5m >5m d Eroding/accreting Accreting Stable Eroding
Table A1.3, overleaf, sets out how these ranges apply to different locations around the coast of England. Information on whether the coastline is eroding or accreting is taken from Futurecoast. The results are presented as one of three categories, to reflect the need to determine if a site is ‘not vulnerable’, ‘possibly vulnerable’ or ‘probably vulnerable’. The vulnerability score is calculated in the same way as the CVI, but using fewer variables:
)4/)((ln dcbaerabilityVu ×××= At present, a site is considered to fall into each class if it scores: • not vulnerable: <0.86 (this ensures that sites scoring no more than 2 for
any three variables is identified as being ‘not vulnerable’);

Appendix 1: Approach to assessing vulnerability of coastal sites 37
• possibly vulnerable: <1.45 (this ensures that any site scoring 2 for three or fewer variables (and no score of 3) or a maximum of one score of 3 is identified as being ‘possibly vulnerable’); and
• probably vulnerable: >1.45 (this ensures that any site scoring four scores of 2, or two or more scores of 3 is identified as being ‘probably vulnerable’).
This approach was incorporated into the Excel spreadsheet using data validation and lists, with lookup functions to identify the appropriate score. The total score for any site and, hence, its potential vulnerability is then calculated. Table A1.3 Guidance on selecting appropriate rankings Mean wave heights
0-1m 1m-4m >4m
Estuaries East Coast to Brighton Barrow to Gretna
South Coast from Brighton West Coast to Barrow
Mean tidal ranges <2.5m 2.5m-5m >5m
Cromer - Aldeburgh IoW - Portland
Berwick - Flamborough Aldeburgh - Southend
Shoreham - IoW Portland - Lands End
Lands End - Avonmouth
Flamborough - Cromer North Kent
Ramsgate - Shoreham Severn Estuary
Liverpool Bay - Gretna Sea level rise
4mm per year 5mm per year 6mm per year
North West and North East (north of Flamborough Head) South West and Wales
Anglian, Thames, Southern and North East (south of
Flamborough Head)
38 Appendix 1: Approach to assessing vulnerability of coastal sites

Appendix 2: Estimate of saltmarsh loss from SPA/SSSIs by 2015 39
Appendix 2: Estimate of saltmarsh loss from SPAs/SSSIs by 2105 A2.1 Introduction In many coastal and estuarine environments, flood and coastal defences constrain the ability of intertidal habitats (notably saltmarsh) to naturally move landward in response to sea-level rise. This effect results in intertidal habitat loss, and is commonly termed ‘coastal squeeze’. This study uses work undertaken in previous studies to evaluate habitat losses within SPAs/SSSIs and assist in addressing the scale of the impact of ‘coastal squeeze’ in each SPA/SSSI. The objective of the study is to analyse available data to provide a prediction the area of saltmarsh that will be lost (or gained) in the next 100 years in a number of in SSSIs/SPAs in England (to the year 2015). The study considered selected SSSIs/SPAs which contain saltmarshes which are considered to be in unfavourable condition due to coastal squeeze or erosion (as cited by English Nature in the SSSI condition assessment) (Table 1.1). It was assumed that all saltmarsh in favourable condition is not at risk of coastal squeeze and therefore was not included in the study (such as the Blyth estuary). For the purpose of simplicity, SSSIs were grouped together at the SPA level. There is a risk associated with this assumption. However, it was beyond the scope of this project to undertake original work to investigate the rates of erosion at each of these additional sites. Table 1.1 Study areas investigated in this study Study area / SPA Name
Deben Estuary
Stour and Orwell Estuaries
Hamford Water
Colne Estuary
Blackwater Estuary
Dengie
Crouch and Roach Estuaries
Foulness
Benfleet and Southend Marshes
Thames Estuary and Marshes
The Swale
Chichester and Langstone Harbours
Portsmouth Harbour
Solent and Southampton Water
Humber Flats, Marshes and Coast
The Wash
Severn Estuary
Exe Estuary
Inner Thames Marshes SSSI
The method used for the prediction has been linear extrapolation using historic data. The method and data has been based upon a study previously undertaken for the Environment Agency and English Nature by Royal Haskoning in 2004. The historic datasets used in the current study (apart from the Exe Estuary and Inner Thames Marshes) and their limitations are described in Royal Haskoning (2004a) and are not repeated here.

40 Appendix 2: Estimate of saltmarsh loss from SPA/SSSIs by 2015
In most SPAs, the only form of prediction for saltmarsh change over the next 100 years, without any new predictive analysis, is direct linear extrapolation of historic trends. However, it is unlikely that saltmarsh will continue to change at the historic rates in the long term, particularly because of the uncertainty and dynamic nature of the factors influencing erosion and accretion. The linear extrapolations presented in this study are therefore only a broad estimate of the possible future change in saltmarsh area, and a low level of confidence needs to be attached to them. The extrapolation rates are derived from the average loss or gain of saltmarsh of the period represented by the two latest sets of data. A2.2 Results This section provides estimates of historic saltmarsh loss or gain at the year 2105 for each SPA listed in Table 1.1, and are based on an expansion of the methods described in Royal Haskoning (2004a). A2.2.1 Suffolk Deben Estuary SPA The results for the Deben Estuary SPA are shown in Tables 2.1 and 2.2. The 1986-1998 rate of loss has been used to estimate the extent of saltmarsh in 2105. If the saltmarsh erosion rate of 2.12 ha yr-1 is applied then the estimated saltmarsh extent in 2105 would be 0.8 ha. These values equate to a loss of 226.8 ha since 1998. Table 2.1 Areas (ha) of saltmarsh in the Deben Estuary SPA in 1971, 1986 and 1998
Year Saltmarsh area inside SPA
1971 273.9
1986 253.0
1998 227.6
2105 0.8
Table 2.2 Saltmarsh loss in the Deben Estuary SPA between 1971, 1986 and 1998
Years Saltmarsh loss (ha) Loss rate (ha yr-1)
1971-1986 20.9 1.39
1986-1998 25.4 2.12
1971-1998 46.3 1.71
A2.2.2 Essex Stour and Orwell Estuaries SPA The results for the Stour and Orwell Estuaries SPA are shown in Tables 2.3 and 2.4. If the 1988 to 1997 saltmarsh erosion rate of 6.29 ha yr-1 is applied then

Appendix 2: Estimate of saltmarsh loss from SPA/SSSIs by 2015 41
the estimated saltmarsh extent in 2105 would be 0 ha. These values equate to a total loss of saltmarsh since 1997. Table 2.3 Areas (ha) of saltmarsh in the Stour and Orwell Estuaries SPA in 1988 and 1997
Year Saltmarsh area inside SPA
1988 217.7
1997 161.1
2105 0 Table 2.4 Saltmarsh loss in the Stour and Orwell Estuaries SPA between 1988 and 1997.
Years Saltmarsh loss (ha) Loss rate (hayr-1)
1988-1997 56.6 6.29 Hamford Water SPA The results for Hamford Water SPA are shown in Tables 2.5 and 2.6. If a saltmarsh erosion rate of 14.42 hayr-1 is applied then the estimated saltmarsh extent in 2105 would be 0 ha. These values equate to a total loss of saltmarsh since 1998. Table 2.5 Areas (ha) of saltmarsh in Hamford Water SPA in 1973, 1988 and 1998
Year Saltmarsh area inside SPA
1988 758.5
1998 614.3
2105 0 Table 2.6 Saltmarsh loss in Hamford Water SPA between 1988 and 1998
Years Saltmarsh loss (ha) Loss rate (ha yr-1)
1988-1998 144.2 14.42 Colne Estuary SPA The results for the Colne Estuary SPA are shown in Tables 2.7 and 2.8. If a saltmarsh erosion rate of 5.63 hayr-1 is applied then the estimated saltmarsh extent in 2105 would be 67.3 ha. These values equate to a loss of 602.4 ha since 1998. Table 2.7 Areas (ha) of saltmarsh in the Colne Estuary SPA in 1973, 1988 and 1998
Year Saltmarsh area inside SPA
1988 726.0
1998 669.7
2105 67.3 Table 2.8 Saltmarsh loss in the Colne Estuary SPA between 1988 and 1998
Years Saltmarsh loss (ha) Loss rate (ha yr-1)
1988-1998 56.3 5.63

42 Appendix 2: Estimate of saltmarsh loss from SPA/SSSIs by 2015
Blackwater Estuary SPA The results for the Blackwater Estuary SPA are shown in Tables 2.9 and 2.10. If a saltmarsh erosion rate of 7.01 hayr-1 is applied then the estimated saltmarsh extent in 2105 would be 0 ha. These values equate to a total loss of saltmarsh since 1997. Table 2.9 Areas (ha) of saltmarsh in the Blackwater Estuary SPA in 1973, 1988 and 1997
Year Saltmarsh area inside SPA
1988 733.3
1997 670.2
2105 0 Table 2.10 Saltmarsh loss in the Blackwater Estuary SPA between 1988 and 1997
Years Saltmarsh loss (ha) Loss rate (ha yr-1)
1988-1997 63.1 7.01
Dengie SPA The results for the Dengie SPA are shown in Tables 2.11 and 2.12. If a saltmarsh erosion rate of 2.69 hayr-1 is applied then the estimated saltmarsh extent in 2105 would be 121.4 ha. This equates to a loss of 287.8 ha since 1998. Table 2.11 Areas (ha) of saltmarsh in the Dengie SPA in 1973, 1988 and 1998
Year Saltmarsh area inside SPA
1988 436.1
1998 409.2
2105 121.4 Table 2.12 Saltmarsh loss in the Dengie SPA between 1988 and 1998
Years Saltmarsh loss (ha) Loss rate (hayr-1)
1988-1998 26.9 2.69 Crouch and Roach Estuaries SPA The results for the Crouch and Roach Estuaries SPA are shown in Tables 2.13 and 2.14. If a saltmarsh erosion rate of 11.05 hayr-1 is applied then the estimated saltmarsh extent in 2105 would be 0 ha. These values equate to a total loss of saltmarsh since 2000. Table 2.13 Areas (ha) of saltmarsh in the Crouch and Roach Estuaries SPA in 1998 and 2000
Year Saltmarsh area inside SPA
1998 410.9
2000 388.8
2105 0
Appendix 2: Estimate of saltmarsh loss from SPA/SSSIs by 2015 43
Table 2.14 Saltmarsh loss in the Crouch and Roach Estuaries SPA between 1998 and 2000
Years Saltmarsh loss (ha) Loss rate (ha yr-1)
1998-2000 22.1 11.05
Foulness SPA There is a paucity of historical change data for the Foulness SPA, and therefore no saltmarsh change information is provided as part of this study. Benfleet and Southend Marshes SPA The results for the Benfleet and Southend Marshes Estuary SPA are shown in Tables 2.15 and 2.16. If a saltmarsh erosion rate of 1.38 hayr-1 is applied then the estimated saltmarsh extent in 2105 would be 0 ha. These values equate to a total loss of saltmarsh since 1998. Table 2.15 Areas (ha) of saltmarsh in the Benfleet and Southend Marshes SPA in 1988 and 1998
Year Saltmarsh area inside SPA
1988 148.5
1998 134.7
2105 0 Table 2.16 Saltmarsh loss in the Benfleet and Southend Marshes SPA between 1988 and 1998
Years Saltmarsh loss (ha) Loss rate (hayr-1)
1988-1998 13.8 1.38 A2.2.3 North Kent Thames Estuary and Marshes SPA The results for the Thames Estuary and Marshes SPA are shown in Tables 2.17 and 2.18. The 1988-2000 rate of loss has been used to estimate the extent of saltmarsh in 2105. If the saltmarsh erosion rate of 0.68 hayr-1 is applied then the estimated saltmarsh extent in 2105 would be 0 ha. These values equate to a total loss of saltmarsh since 2000. Table 2.17 Areas (ha) of saltmarsh in the Thames Estuary and Marshes SPA in 1961, 1972, 1988 and 2000
Year Saltmarsh area inside SPA
1961 50.6
1972 38.8
1988 38.7
2000 30.5
2105 0
44 Appendix 2: Estimate of saltmarsh loss from SPA/SSSIs by 2015
Table 2.18 Saltmarsh loss in the Thames Estuary and Marshes SPA between 1961, 1972, 1998 and 2000
Years Saltmarsh loss (ha) Loss rate (ha yr-1)
1961-1972 11.8 1.07
1972-1988 0.1 0.01
1988-2000 8.2 0.68
1961-2000 20.1 0.52 The Swale SPA The results for The Swale SPA are shown in Tables 2.19 and 2.20. Change in saltmarsh area in The Swale SPA is different to the other SPAs studied in Suffolk, Essex and north Kent, in that there has been a consistent accretion of saltmarsh between 1961 and 2000. The area does not appear to be suffering coastal squeeze. The 1988-2000 rate of gain has been used to estimate the extent of saltmarsh in 2105. If the saltmarsh accretion rate of 1.28 ha yr-1 is applied then the estimated saltmarsh extent in 2105 would be 413.8 ha. This equates to a saltmarsh gain of 134.4 ha since 2000. Table 2.19 Areas (ha) of saltmarsh in The Swale SPA in 1961, 1972, 1988 and 2000
Year Saltmarsh area inside SPA
1961 220.5
1972 237.5
1988 264.0
2000 279.4
2105 413.8 Table 2.20 Saltmarsh gain in The Swale SPA between 1961, 1972, 1998 and 2000
Years Saltmarsh gain (ha) Gain rate (ha yr-1)
1961-1972 17.0 1.55
1972-1988 26.5 1.66
1988-2000 15.4 1.28
1961-2000 58.9 1.51 A2.2.4 West Sussex and Hampshire Chichester and Langstone Harbours SPA - Chichester Harbour The results for Chichester Harbour are shown in Tables 2.21 and 2.22. If a saltmarsh erosion rate of 6.15 hayr-1 is applied to Chichester Harbour then the estimated saltmarsh extent in 2105 would be 0 ha. These values equate to a total loss of saltmarsh since 2001.

Appendix 2: Estimate of saltmarsh loss from SPA/SSSIs by 2015 45
Table 2.21 Areas (ha) of saltmarsh in Chichester Harbour in 1976 and 2001 Year Saltmarsh area inside SPA
1976 537.9
2001 384.1
2105 0 Table 2.22 Saltmarsh loss in Chichester Harbour between 1976 and 2001.
Years Saltmarsh loss (ha) Loss rate (ha yr-1)
1976-2001 153.8 6.15 Chichester and Langstone Harbours SPA - Langstone Harbour The results for Langstone Harbour are shown in Tables 2.23 and 2.24. If the 1971 to 2001 saltmarsh erosion rate of 1.60 hayr-1 is applied then the estimated saltmarsh extent in 2105 would be 0 ha. These values equate to a total loss of saltmarsh since 2001. Table 2.23 Areas (ha) of saltmarsh in Langstone Harbour in 1956, 1971 and 2001
Year Saltmarsh area inside SPA
1956 253.5
1971 119.0
2001 71.0
2105 0 Table 2.24 Saltmarsh loss in Langstone Harbour between 1956, 1971 and 2001
Years Saltmarsh loss (ha) Loss rate (hayr-1)
1956-1971 134.5 8.97
1971-2001 48.0 1.60
1956-2001 182.5 4.06 Combining the data for both harbours provides an estimate of the total saltmarsh extent in the SPA in 2105; all the saltmarsh is predicted to be lost. Portsmouth Harbour SPA The results for Portsmouth Harbour are shown in Tables 2.25 and 2.26. If a saltmarsh erosion rate of 2.93 ha yr-1 is applied then the estimated saltmarsh extent in 2105 would be 0 ha. These values equate to a total loss of saltmarsh since 2001. Table 2.25 Areas (ha) of saltmarsh in the Portsmouth Harbour SPA in 1971 and 2001.
Year Saltmarsh area within SPA
1971 140.8
2001 52.8
2105 0

46 Appendix 2: Estimate of saltmarsh loss from SPA/SSSIs by 2015
Table 2.26 Saltmarsh loss in the Portsmouth Harbour SPA between 1971 and 2001 Years Saltmarsh loss (ha) Loss rate (ha yr-1)
1971-2001 88.0 2.93 Solent and Southampton Water SPA The data available for this study in the Solent and Southampton Water SPA is incomplete in two ways (Royal Haskoning, 2004a). First, no data is available for saltmarsh extents on the Isle of Wight, which covers a large proportion of the SPA. Second, some of the data for the south coast of England part of the SPA does not cover the entire area of saltmarsh. This is because the different years of available aerial photographic coverage varies and the comparison of saltmarsh extent had to be based on the smallest area covered by all photographs in the collection. Some areas of saltmarsh that fall within the SPA are therefore not included in the calculations. So the saltmarsh values for the Eling to Marchwood, River Hamble and River Beaulieu parts of the SPA are underestimates of the actual areas of saltmarsh within the SPA. However, these values do provide a useful insight into overall trends. The data is compiled separately for different areas of the Solent and Southampton Water SPA (Table 2.27). The saltmarsh erosion rates from Table 2.28 are extrapolated to provide estimates of saltmarsh extents for parts of the SPA in 2105 (Table 2.29). Table 2.27 Areas (ha) of saltmarsh in 1971, 1984 and 2000/2001 for parts of the Solent and Southampton Water SPA, excluding the Isle of Wight. The locations marked with (PL) indicate that mapping was restricted by incomplete aerial photograph coverage
Location Year Saltmarsh area
Eling to Marchwood (PL) 1971
1984
2001
36.7
27.8
18.7
Beaulieu River (PL) 1971
1984
2001
127.4
100.0
54.5
Keyhaven and Lymington 1971
1984
2000
378.0
300.9
202.0
Calshot 1971
1984
2001
221.1
184.1
146.4
River Hamble (PL) 1971
1984
36.9
26.6
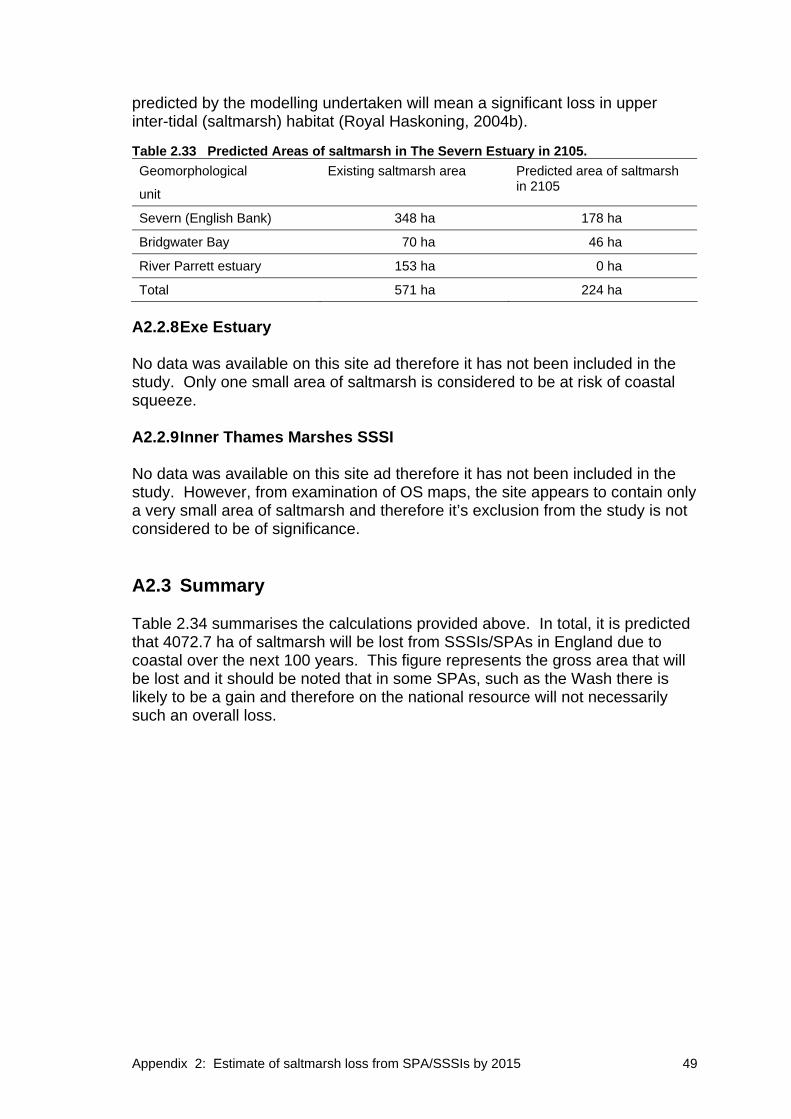
Appendix 2: Estimate of saltmarsh loss from SPA/SSSIs by 2015 47
Table 2.29 Saltmarsh loss for parts of the Solent and Southampton Water SPA, excluding the Isle of Wight, between 1971, 1984 and 2000/2001
Location Year Saltmarsh loss (ha) Loss rate (ha yr-1)
Eling to Marchwood (PL) 1971-1984
1984-2001
1971-2001
8.9
9.1
18
0.68
0.54
0.60
Beaulieu River (PL) 1971-1984
1984-2001
1971-2001
27.4
45.5
72.9
2.11
2.68
2.43
Keyhaven and Lymington 1971-1984
1984-2000
1971-2000
77.1
98.9
176
5.93
6.18
6.07
Calshot 1971-1984
1984-2001
1971-2001
37.0
37.7
74.7
2.85
2.22
2.49
River Hamble (PL) 1971-1984 10.3 0.79 Table 2.29 Estimated saltmarsh areas (ha) for parts of the Solent and Southampton Water SPA in 2105. All erosion rates are from 1984-2000/2001 except for the River Hamble, for which only 1971-1984 data is available
Location Saltmarsh erosion rate (ha yr-1) Saltmarsh area 2105
Eling to Marchwood (PL) 0.54 0
Beaulieu River (PL) 2.68 0
Keyhaven and Lymington 6.18 0
Calshot 2.22 0
River Hamble (PL) 0.79 0
Isle of Wight No data No data
Total 0 The values provided in Table 2.29 indicate total loss of saltmarsh in the Solent and Southampton Water SPA by 2105; all the saltmarsh is predicted to be lost. A2.2.5 Humber Flats, Marshes and Coast SPA The results for Humber Flats, Marshes and Coast SPA are shown in Tables 2.30 and 2.31. If a saltmarsh accretion rate of 1.95 ha yr-1 is applied then the estimated saltmarsh extent in 2105 would be 840.5 ha. This equates to a gain of 214.5 ha since 1995.

48 Appendix 2: Estimate of saltmarsh loss from SPA/SSSIs by 2015
Table 2.30 Areas (ha) of saltmarsh in the Humber Flats, Marshes and Coast SPA in 1976 and 1995
Year Saltmarsh area
1976 589
1995 626
2105 840.5 Table 2.31 Saltmarsh gain in the Humber Flats, Marshes and Coast SPA between 1976 and 1995
Years Saltmarsh gain (ha) Gain rate (hayr-1)
1976-1995 37.0 1.95 A2.2.6 The Wash SPA The results for The Wash are shown in Table 2.32. Between 1982/1985 and 2001/2002, the total saltmarsh area increased by 728 ha, equating to an average gain rate of 40.44 hayr-1. This rate has been used to calculate the likely extent of saltmarsh in 2105. A total of 400.2 ha of the saltmarsh recorded in the 2001/2002 survey lies outside the SPA area, so the rate of change is applied to the 2001/2002 clipped area of saltmarsh to provide estimates for saltmarsh area in 2105. This equates to a gain of 4165.3 ha at 2105 making the total salt marsh area 8651.1 ha. Table 2.32 Areas of saltmarsh sub-features (ha) in The Wash in 1971/1974, 1982/1985 and 2001/2002
Sub-feature Saltmarsh area
1971/74
Saltmarsh area
1982/85
Saltmarsh area
2001/2002
Area inside SPA
2001/2002
Area inside SPA 2105
Pioneer 378 213 969
Pioneer/Cordgrass Not Used 81 282
Cordgrass 207 97 21
Cordgrass/Atlantic 7 287 53
Atlantic 3224 2804 3049
Mediterranean 0 0 4
Other 361 676 508
Total 4241 4158 4886 4485.8 8651.1 A2.2.7 Severn Estuary SPA The results for the Severn Estuary are shown in Table 2.33. The data for the Severn Estuary is based on estimates given in the Severn Estuary proto-CHaMP (Royal Haskoning, 2004b). This study concluded that future changes are predicted to be relatively large (36% over 50 years) compared to the existing resource but relatively modest in absolute terms (206ha). This contrast is due to the extremely low proportion of saltmarsh to inter-tidal area in the Severn Estuary, which has a lower ratio of saltmarsh to inter-tidal mudflat than most other estuaries in the UK. Thus the modest decrease in saltmarsh area

Appendix 2: Estimate of saltmarsh loss from SPA/SSSIs by 2015 49
predicted by the modelling undertaken will mean a significant loss in upper inter-tidal (saltmarsh) habitat (Royal Haskoning, 2004b). Table 2.33 Predicted Areas of saltmarsh in The Severn Estuary in 2105. Geomorphological
unit
Existing saltmarsh area Predicted area of saltmarsh in 2105
Severn (English Bank) 348 ha 178 ha
Bridgwater Bay 70 ha 46 ha
River Parrett estuary 153 ha 0 ha
Total 571 ha 224 ha A2.2.8 Exe Estuary No data was available on this site ad therefore it has not been included in the study. Only one small area of saltmarsh is considered to be at risk of coastal squeeze. A2.2.9 Inner Thames Marshes SSSI No data was available on this site ad therefore it has not been included in the study. However, from examination of OS maps, the site appears to contain only a very small area of saltmarsh and therefore it’s exclusion from the study is not considered to be of significance. A2.3 Summary Table 2.34 summarises the calculations provided above. In total, it is predicted that 4072.7 ha of saltmarsh will be lost from SSSIs/SPAs in England due to coastal over the next 100 years. This figure represents the gross area that will be lost and it should be noted that in some SPAs, such as the Wash there is likely to be a gain and therefore on the national resource will not necessarily such an overall loss.
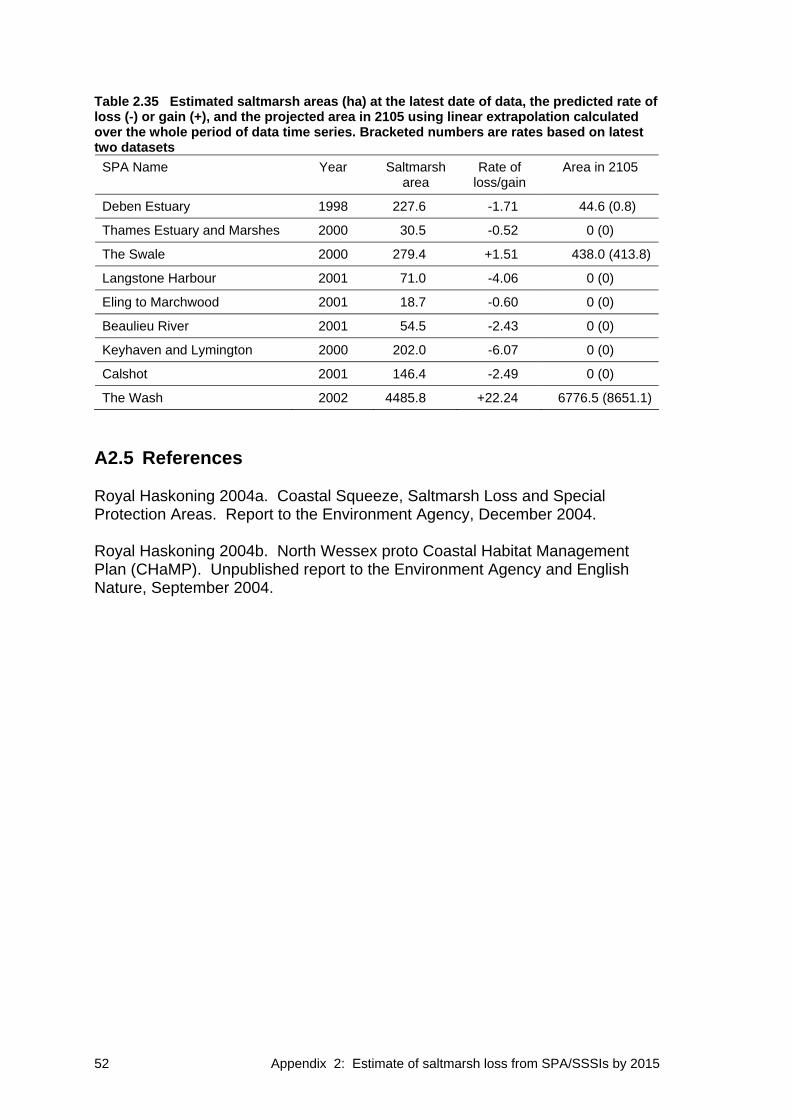
50 Appendix 2: Estimate of saltmarsh loss from SPA/SSSIs by 2015
Table 2.34 Estimated saltmarsh areas (ha) at the latest date of data, the predicted rate of loss (-) or gain (+), and the projected area in 2105 using linear extrapolation calculated from the two latest datasets
SPA Name Year Saltmarsh area
Annual Rate of
loss/gain
Area in 2105
Area lost
Deben Estuary 1998 227.6 -2.12 0.8 226.8
Stour and Orwell Estuaries 1997 161.1 -6.29 0 161.1
Hamford Water 1998 614.3 -14.42 0 614.3
Colne Estuary 1998 669.7 -5.63 67.3 602.4
Blackwater Estuary 1997 670.2 -7.01 0 670.2
Dengie 1998 409.2 -2.69 121.4 287.8
Crouch and Roach Estuaries 2000 388.8 -11.05 0 388.8
Foulness No data No data No data No data No data
Benfleet and Southend Marshes 1998 134.7 -1.38 0 134.7
Thames Estuary and Marshes 2000 30.5 -0.68 0 30.5
The Swale 2000 279.4 +1.28 413.8
Chichester and Langstone Harbours
Chichester Harbour 2001 384.1 -6.15 0 384.1
Langstone Harbour 2001 71.0 -1.60 0 71
Portsmouth Harbour 2001 52.8 -2.93 0 52.8
Solent and Southampton Water
Eling to Marchwood 2001 18.7 -0.54 0 18.7
Beaulieu River 2001 54.5 -2.68 0 54.5
Keyhaven and Lymington 2000 202.0 -6.18 0 202
Calshot 2001 146.4 -2.22 0 146.4
River Hamble 1984 26.6 -0.79 0 26.6
Humber Flats, Marshes and Coast 1995 626.0 +1.95 840.5
The Wash 2002 4485.8 +40.44 8651.1
Severn Estuary (south shore only) 2000 571 -3.47 224 347
A2.4 Discussion The simplest method to provide a prediction of likely change in saltmarsh extent is direct extrapolation of historic trends. If good data is available to indicate that trends in saltmarsh change are ongoing and relatively consistent, direct extrapolation is an effective method of prediction. However, the broad range of drivers for change in saltmarsh habitat extent and the associated variability in trends makes the accuracy of this method limited in practice. Typical influences that interfere with direct extrapolation of historical change rates are potential accelerated sea-level rise and major and periodic changes such as land-claim or channel stabilisation.

Appendix 2: Estimate of saltmarsh loss from SPA/SSSIs by 2015 51
Therefore, care needs to be taken with respect to the use of the predicted losses (and gains) of saltmarsh based on linear extrapolation of historic rates. Due to uncertainty in the processes driving future saltmarsh erosion and accretion, particularly sea-level change and sediment supply, the estimates of loss should not be quoted out of context. A simple linear extrapolation into the future will not take into consideration the complex nature of natural coastal systems where future conditions may differ from the past. Future conditions are likely to be better understood using one or more of the predictive methods currently available, including regime methods and expert geomorphological assessment. In particular, the response of estuaries to sea level change may involve significant morphological change which may affect saltmarsh accretion / erosion rates, meaning that extrapolation of historic data is not accurate. It is therefore important that the results of future geomorphological monitoring are reviewed in the context of estimates of saltmarsh loss. It is recommended that further study is undertaken in the form of a geomorphological assessment to assess where geomorphological changes are likely to happen which will influence saltmarsh change, such as areas where offshore banks and chenier ridges may form. In most of the SPAs, the total area of saltmarsh has decreased over the period of record. In most of the SPAs (apart from Deben Estuary, Colne Estuary and Dengie), a linear extrapolation indicates that saltmarsh would be completely lost from the SPA area within the next 100 years. The Swale, Humber Flats, Marshes and Coast, The Wash and Severn Estuary (southern shore only) SPAs were the only areas examined where saltmarsh extent has historically increased. In some locations, no data was available to support comparative analysis and calculation of saltmarsh change (Foulness, Isle of Wight). In several instances a different extrapolation rate can be applied to the historic data because a longer time series of historic data is available (Deben Estuary, Thames Estuary and Marshes, The Swale, Langstone Harbour, most Solent and Southampton Water sub-areas and The Wash. The differences in outcome are shown in Table 2.35. The table shows that only three predicted areas change significantly if a different (and no less valid) extrapolation rate is applied. The final 2105 areas in the Deben Estuary SPA and The Swale SPA both increase, by 43.8 ha and 24.2 ha, respectively. The final outcome for The Wash SPA would be a decrease in the 2105 area of 1874.6 ha.

52 Appendix 2: Estimate of saltmarsh loss from SPA/SSSIs by 2015
Table 2.35 Estimated saltmarsh areas (ha) at the latest date of data, the predicted rate of loss (-) or gain (+), and the projected area in 2105 using linear extrapolation calculated over the whole period of data time series. Bracketed numbers are rates based on latest two datasets
SPA Name Year Saltmarsh area
Rate of loss/gain
Area in 2105
Deben Estuary 1998 227.6 -1.71 44.6 (0.8)
Thames Estuary and Marshes 2000 30.5 -0.52 0 (0)
The Swale 2000 279.4 +1.51 438.0 (413.8)
Langstone Harbour 2001 71.0 -4.06 0 (0)
Eling to Marchwood 2001 18.7 -0.60 0 (0)
Beaulieu River 2001 54.5 -2.43 0 (0)
Keyhaven and Lymington 2000 202.0 -6.07 0 (0)
Calshot 2001 146.4 -2.49 0 (0)
The Wash 2002 4485.8 +22.24 6776.5 (8651.1) A2.5 References Royal Haskoning 2004a. Coastal Squeeze, Saltmarsh Loss and Special Protection Areas. Report to the Environment Agency, December 2004. Royal Haskoning 2004b. North Wessex proto Coastal Habitat Management Plan (CHaMP). Unpublished report to the Environment Agency and English Nature, September 2004.


PB12527 / 2
Nobel House17 Smith SquareLondon SW1P 3JR
www.defra.gov.uk
PB11207-CVR.qxd 1/9/05 11:42 AM Page 2
m126208
Rectangle