
New, Brian (2006) Controls of copper and gold distribution ... · MFTB = Mamberamo fold and thrust...
47
This file is part of the following reference: New, Brian (2006) Controls of copper and gold distribution in the Kucing Liar deposit, Ertsberg mining district, West Papua, Indonesia. PhD thesis, James Cook University. Access to this file is available from: http://eprints.jcu.edu.au/2083
Transcript of New, Brian (2006) Controls of copper and gold distribution ... · MFTB = Mamberamo fold and thrust...

This file is part of the following reference:
New, Brian (2006) Controls of copper and gold distribution in the Kucing Liar deposit, Ertsberg mining district, West Papua, Indonesia.
PhD thesis, James Cook University.
Access to this file is available from:
http://eprints.jcu.edu.au/2083

1
1 Introduction
This thesis presents the results of a research program aimed at identifying the major controls of
the porphyry-related Kucing Liar Cu-Au mineralised system. Porphyry-related mineralisation
provided over 50% of the world’s Cu production in the 20th century (Hedenquist and Richards,
1998) and these types of deposits are among the largest reservoirs of gold in the upper crust
(Kesler, et al., 2002). Economic Cu ± Mo ± Au deposits associated with porphyry magmas are
concentrated at the margins of the Pacific Rim, occurring in North and South America, while in
the southwest Pacific they are concentrated in Philippines, New Guinea and Indonesia (Figure 1-
1). Due to the economic importance of porphyry mineralisation there is a large body of literature
concerning this class of deposit. There is a wide variety of mineralisation styles associated with
porphyritic intrusions including porphyry, skarn, epithermal and mantos that are enriched to
varying degrees with Mo, Cu, Au, Ag, Pb and Zn (Figure 1-2).
Figure 1-1 Distribution of porphyry Cu±Mo±Au deposits in the circum-Pacific region
Reproduced from Tosdal and Richards (2001)

2 Kucing Liar, Ertsberg Mining District _____________________________________________________________________________
Figure 1-2 Ore deposit environments related to porphyritic intrusions
Schematic diagram showing the various forms of alteration associated with porphyry-related hydrothermal
systems (figure 2 of Tosdal and Richards, 2001).
Kucing Liar is a Cu-Au mineralised system forming part of the Ertsberg Mining District, which is
situated in the easternmost Indonesian province of Irian Jaya, now increasingly referred to as
West Papua (Figure 1-3). PT Freeport Indonesia has been operating in the Ertsberg Mining
District since 1967. Irian Jaya is part of the tectonic entity of New Guinea which includes a
number of islands to the east which make up the Melanesian Volcanic Arc (Figure 1-4). New
Guinea itself is dominated by a mountain range that extends the length of the island, commonly
reaching elevations above 4,000m, referred to as the Papuan Fold Belt, which has a characteristic
sigmoid shape from east to west and is noticeably wider in the middle of the island in the vicinity
of the Papua New Guinea Highlands.

3 Research topic, significance and setting _____________________________________________________________________________
Figure 1-3 Location of the Ertsberg Mining District
Shaded area of map indicates areas above 1,000m elevation. Figure supplied by PT Freeport Indonesia.
The Ertsberg Mining District possesses the world’s largest currently exploited gold resource and
third largest copper resource, with the largest contribution being the Grasberg deposit. The
Grasberg copper budget is of similar scale to the giant porphyry deposits of the southwest USA
and Chile (Cooke et al., 2005). The well-studied Bingham Canyon deposit in Utah has a similar
copper inventory to Grasberg but significantly lower gold content. The deposits associated with
the New Guinea tectonic system host the largest amount of copper and gold in the western Pacific
(Garwin et al., 2005). Papua New Guinea contains a large number of gold ± copper deposits that
are notably more gold-dominant than the Ertsberg mining district. At the time of data collection
for this research (1998-2000), the Kucing Liar system was estimated to include 321Mt or ore
containing 1.41% Cu and 1.41g/t Au. However, continued resource definition drilling has
confirmed a larger resource of 478Mt of ore containing 1.29%Cu and 1.14g/tAu at Kucing Liar

4 Kucing Liar, Ertsberg Mining District _____________________________________________________________________________
(PT Freeport Indonesia, 2002 annual report). Within the district, nine major copper and/or gold
occurrences have been delineated (Table 1-1), including gold-only resources (Wanagon) as well
as copper-only resources (Lembah Tembaga) as well as other resources with variable grades and
Cu:Au ratios. While Kucing Liar is much smaller than Grasberg, at ~540t of contained gold, it
rates in the top 10 gold deposits of the world. The high copper and gold grades in such large
quantities as well as the relationship to a richly gold-endowed island arc makes Grasberg and its
related deposits unique amongst world-class porphyry copper deposits and so of particular interest
in understanding their genesis. The different deposits found in the district display distinct and
unique characteristics. Macdonald and Arnold (1994), Hefton et al., (1995), and Pollard and
Taylor (2002) have described the geology, alteration and mineralisation of the Grasberg Igneous
Complex, while Mertig et al. (1994), Meinert et al. (1997) and Prendergast et al. (2005) have
described the occurrences of sedimentary-hosted mineralisation in the district.
Table 1-1 Copper and/or gold resources of the Ertsberg Mining District
Deposit Ore (t) Cu (%) Au (g/t) Copper (t) Gold (oz)
Grasberg 2,150,000,000 1.14 1.19 24,510,000 82,258,946
Kucing Liar 478,000,000 1.29 1.14 5,449,200 17,519,583
Ertsberg East Skarn System 185,000,000 1.58 0.71 2,923,000 4,223,065
Lembah Tembaga 90,000,000 1.50 na 1,350,000 Na
Big Gossan 37,349,000 2.69 1.02 1,004,688 1,224,833
Ertsberg 32,600,000 2.30 0.80 749,800 838,504
Dom 30,892,000 1.67 0.42 515,896 417,151
Wanagon 24,500,000 na 2.68 na 2,111,050
Wanagon (skarn) 2,400,000 1.94 0.95 46,560 73,305
TOTAL 3,030,741,000 36,549,144 108,666,437
Values from Harrison (2000). na=grade not available, assumed to be negligible. Note that Kucing Liar
constitutes the second largest concentration of copper and gold in the district. There are currently no other
economically viable resources in Irian Jaya outside the Ertsberg Mining District. Regional exploration
followed by intensive delineation activities conducted by PT Freeport Indonesia has identified 8Moz of gold
in the Wabu deposit associated with the Wabu Pluton, 35km to the northwest of the Ertsberg mining district
(Sunyoto, 2000) that is currently considered subeconomic.

5 Research topic, significance and setting _____________________________________________________________________________
1.1 REGIONAL AND LOCAL SETTING
1.1.1 Geology of New Guinea and the Southern Central Ranges
New Guinea lies immediately to the north of Australia and includes a number of distinct
topographic and tectonic zones. The main island is defined by a prominent mountain belt which
extends the length of the island and possesses a number of peaks with elevations over 4,000m.
The island of New Britain lies east of the New Guinea mainland while the Melanesian Volcanic
Arc lies outboard of New Britain and includes New Ireland, Buka-Bougainville and Solomon
Islands, and broadly parallels the Papuan Fold Belt (Figure 1-4). Deep sea trenches lying to the
south of New Britain and to the west of Bougainville reach depths >8,000m. A shallower trench,
3,000-4,000m deep lies outboard of the Melanesian Volcanic Arc.
Figure 1-4 Physiography of Irian Jaya and Papua New Guinea
This digital elevation image shows New Guinea’s extreme topography both above and below sea level. The
Papuan Fold Belt is shown in orange and red colours of >1,000 and reaches >4000 in many locations,
while the dark blue New Britain deep sea trench reaches depths of >8,000m. The locations of major
porphyry-related deposits are indicated (image is a partial reproduction of picture acquired from website
http://www.ngdc.noaa.gov/mgg/image/2minsurface/1350/00N135E.jpg, annotations added by author).

6 Kucing Liar, Ertsberg Mining District _____________________________________________________________________________
Tectonic evolution of New Guinea
The Papuan Fold Belt is the result of collision between the Australian continental plate and the
Caroline and Pacific oceanic plates, which involved accretion of an island arc and ophiolite
emplacement (Quarles van Ufford, 1996; Sapiie et al., 1999; Warren, 2000; Hill et al., 2002). The
Jurassic age Irian Jaya ophiolite was emplaced along the northern margin of the Papuan Fold Belt
(Figure 1-5). In Irian Jaya, the Derewo Metamorphic Belt separates accreted terranes from the
sedimentary sequence of the Central Range. While the metamorphism of the Irian Ophiolite
occurred during the Eocene (55-34Ma), metamorphism of the Derewo belt was initiated ~15Ma
later in the late Oligocene (34-24Ma) to early Miocene (24-5Ma) (Weiland, 1999). Inclusion of
metamorphic fragments in sediments of the Central Range indicates the Miocene development
and denudation of a metamorphic fold belt (Weiland, 1999), which is indicated on Figure 1-5 by
the development of a metamorphic core complex. South-directed subduction of the Caroline Plate
ended in the Miocene (Solomon, 1990) and reversal to a north dipping subducting slab (Solomon
Plate) beneath the easternmost remnants of the Caroline Island Arc (New Britain) occurred in the
Pliocene (Figure 1-5). The Marumuni Arc developed in response to collision and accretion of the
Caroline Island Arc along the northern margin of proto-New Guinea. The Pliocene magmatic arc
on the New Guinea mainland developed in conjunction with the formation of the New Guinean
Orogenic Belt (Papuan Fold Belt) (Figure 1-5). The current tectonic structure of the island
changes in character and orientation from west to east. Irian Jaya is dominated by transcurrent
faulting and stalled subduction, the middle part by transcurrent faults and slow convergence, and
the eastern part by spreading ridges and active subduction (Figure 1-6a). Current tectonic activity
is expressed by seismic activity and reveals a pattern of epicentres in which the deepest events are
concentrated in belts that parallels plate contacts, particularly the New Britain subduction
trenches, with decreasing depths westward. Only the shallowest earthquakes occur in Irian Jaya
(Sapiie et al., 1999). Porphyritic intrusions have been emplaced along the axis of the Papuan Fold
Belt (Figure 1-6b). Two temporally distinct igneous suites on the mainland were intruded during
Miocene (20-7Ma) and Plio-Pleistocene (<7Ma) times into the evolving collision environment

7 Research topic, significance and setting _____________________________________________________________________________
and form curvilinear arcs parallel to the elongation of the island and the tectonic plate boundaries
(Figure 1-6b) (McDowell et al., 1996). The older magmatic system is referred to as the Maramuni
Arc while the younger is simply referred to as the Pliocene Arc. Both are areally restricted but
more widespread in Papua New Guinea than in Irian Jaya (Figure 1-6b). Significant copper-gold
mineralisation is restricted to the Pliocene Arc. Intrusions related to mineralisation in Papua New
Guinea are both younger (e.g. Ok Tedi) and older (e.g. Porgera) than the age of intrusions in the
Ertsberg Mining District (Figure 1-6b). Pliocene volcanoes are dotted about the mainland and
adjacent island chains, including New Britain, Bougainville, and the Tabar-Feni chain outboard of
New Ireland. On the mainland, volcanoes are noticeably clustered about the central Highlands as
well as in lowland locations on the Papuan peninsula. Active vulcanism continues to the present
data in the islands off eastern New Guinea as evidenced by the explosion and extensive ash
deposition from volcanoes near Rabaul in 1996.
Figure 1-5 Palimspastic reconstruction of the evolution of New Guinea
A series of sketches illustrates the most significant events in the development of New Guinea and the age at
which each event occurred. Reproduced from Figure 2 of Hill et al., (2002).

8 Kucing Liar, Ertsberg Mining District _____________________________________________________________________________
Figure 1-6 Tectonics and igneous intrusions of New Guinea (reproduced from McDowell et al., 1996)
(a) Current convergence of the Pacific Plate is in west-southwest direction and subduction is restricted to
eastern island arcs in the vicinity of New Britain and Bouganville. BTFZ = Bewani-Torricelli fault zone;
MFTB = Mamberamo fold and thrust belt; NBT = New Britain trench; RMFZ = Ramu-Markham fault
zone; SYFZ = Sorong-Yapen fault zone; TT = Trobriand Trough. (b) The Ertsberg mining district is
indicated by the K-Ar age determination samples labelled “Ertsberg”.

9 Research topic, significance and setting _____________________________________________________________________________
Stratigraphy and structure of the Southern Central Ranges
Collision tectonics in Irian Jaya have produced kilometre-scale folds and bedding-parallel sinistral
strike-slip faults in the Ertsberg Mining District (Parris, 1994; Quarles van Ufford, 1996). In the
vicinity of the Ertsberg Mining District, the sedimentary strata that comprise the mountain range
are folded into a broad central syncline along the axis of the ranges. The stratigraphic sequence of
the southern half of the Central Range now tilted and exposed along the road from Timika to
Tembagapura (Pennington, 1995) reveals a sedimentary pile that was laid down discontinuously
from Cambrian to Recent times (Figure 1-7). Thicknesses of stratigraphic units are consistent
along strike (east-west) but vary across the axis (north-south) of the fold belt (Figure 1-7).
Regionally, sedimentary strata are continuous along strike for hundreds of kilometres (Figure 1-
8). The stratigraphic sequence here correlates with similar units in Papua New Guinea (Hill et al.,
2002). The strata in the Southern Ranges of Irian Jaya include thick sequences of mudstone,
sandstone, limestone and dolostone ranging in age from Cambrian to Tertiary (Figure 1-7).
Proterozoic pillow basalts at the base of the tectonic section are metamorphosed to lower
greenschist facies and are strongly foliated in places. Mesozoic strata in the Ertsberg Mining
District have equivalents in Papua New Guinea, but there are no Palaeozoic strata exposed in
Papua New Guinea, where Mesozoic strata are underlain by granitoids and metamorphic rocks
(Hill et al., 2002).
In Irian Jaya, the mountain range associated with the Papuan Fold Belt is referred to as the Central
Range, and the mountain-forming event is named the Central Range Orogeny (Quarles van
Ufford, 1996). The Central Range fold and thrust belt is marked at its southern margin by a thrust
fault named the Mapenduma Thrust and to the north by the Derewo Metamorphic Belt (Figure 1-
8). The southern Central Ranges is an area of tilted and folded Australian continental margin
sediments lying between two thrust faults which separate the Papuan Fold Belt from the Derewo
Metamorphic Belt to the north and flat-lying margin sediments to the south. A sharp change in
topography marks the location of the Mapenduma thrust. The Central Range between the
Mapenduma Thrust and the Derewo Metamorphic Belt is dissected by oblique faults, which

10 Kucing Liar, Ertsberg Mining District _____________________________________________________________________________
visibly offset stratigraphy with a left-lateral sense of displacement (Figure 1-8). These arc-oblique
faults are traceable for long distances on the map and connect between the Derewo and
Mapenduma Faults (Figure 1-8). They are accompanied by faults with much shorter lengths that
are subperpendicular to the fold belt and have a left-lateral sense of displacement. A third set of
faults strikes east-northeast but is not as well defined by stratigraphic offsets as the arc-oblique
and arc-normal faults. The Ertsberg Mining District is associated with arc-oblique faults though
less clearly associated with arc-normal faults (Figure 1-8). Igneous intrusions and volcanic fields
are also related to east-northeast striking faults as demonstrated by the Ilaga Volcanic Field lying
to the east of the Ertsberg Mining District (Figure 1-8). Mineralised intrusive bodies are also
associated with thrust faults as demonstrated by the relationship of the Wabu Pluton with the
Derewo Fault (Sunyoto, 2000), within the Derewo Fault (Figure 1-8).
Figure 1-7 Sedimentary record of the Timika-Tembagapura region (reproduced from Parris, 1994a).
The section indicates lateral continuity from east to west along the continental margin but variable
thicknesses from north to south, perpendicular to the margin.

11 Research topic, significance and setting _____________________________________________________________________________
Figure 1-8 Geology of southern flanks of the Central Range
Black box = CoW A (Contract of Work, block A). Map modified from Parris (1994b).

12 Kucing Liar, Ertsberg Mining District _____________________________________________________________________________
1.1.2 Geology of the Ertsberg Mining District
The geology of the Ertsberg Mining District has become well understood due to local, district and
regional research programs on tectonostratigraphy (Quarles van Ufford, 1996; Weiland, 1996),
structural controls (Sapiie, 2001), intrusive bodies (McMahon, 1996), and individual deposits
(Macdonald and Arnold, 1994; Mertig et al., 1998; Meinert et al., 1998; Widodo et al., 1998;
Pollard and Taylor, 2002; Prendergast, 2004). Units in the mine district have experienced ~5km of
uplift associated with 100km-scale-shortening manifest in large-amplitude folds and high angle
reverse faults (Quarles van Ufford, 1996). The district includes the axial zone and southern limb
of the regional-scale Yellow Valley Syncline (YVS) that is cross cut by arc-parallel, -oblique and
-normal faults. The Yellow Valley Syncline trends parallel to the Central Range and plunges
shallowly northwest (Figure 1-9). The northern and southern limbs have been disrupted by steeply
dipping bedding parallel faults that have displaced the core of the syncline upwards relative to the
limbs.
Tectonostratigraphic data for Irian Jaya (Quarles van Ufford, 1996; Sapiie et al., 1999) record a
history of folding and reverse faulting from 12-4Ma followed by left lateral fault movement
between 4-2Ma. Symmetric and asymmetric repetition of stratigraphic marker horizons such as
the Sirga sandstone and the Tk2 layer within the Kais Limestone (Figure 1-9) indicate that both
folding and thrusting has occurred. Major thrust displacement is apparent along the Wanagon
Fault. In addition to thrust faulting, left lateral movement is documented for the large faults in the
Ertsberg Mining District that trend subparallel to stratigraphy (Sapiie, 2000; Sapiie and Cloos,
2004). These strike-slip faults (Wanagon, Idenberg Nos 1 & 2, Ertsberg Nos 1, 2 & 3) have
reported displacements of 1,500m (Figure 1-9). Other faults are visible and strike northeast to
east-northeast. This set of faults has smaller apparent left-lateral displacements and includes the
New Zealand Pass Fault and the Grasberg Fault, which intersects the Yellow Valley Syncline in
the vicinity of the Grasberg Igneous Complex (Figure 1-9).

13 Research topic, significance and setting _____________________________________________________________________________
Igneous units in the Ertsberg Mining District have been intruded as columnar and elongate bodies
into the axis and limbs of the Yellow Valley Syncline in the form of the Grasberg Igneous
Complex and the Ertsberg Intrusive Suite (previously described as undifferentiated Ertsberg
porphyry). The Grasberg, Kay and Lembah Tembaga intrusive complexes have near circular
outcrop pattern (though the latter occurs beneath Lake Wanagon), while the Ertsberg and
Wanagon intrusions are elongate parallel to the main strike (see Figure 1-9). The Grasberg
Igneous Complex (GIC) occupies the axis of the Yellow Valley Syncline where it is intersected
by the high angle Grasberg Fault. The Ertsberg Intrusion is controlled by the Ertsberg No1, No2
& No3 faults to the east and the Idenberg No1 & No2 faults to the west (Figure 1-9). Similarly,
the Wanagon Sill appears to be related to the position of the Wanagon Fault. The Kali dykes are
the youngest intrusive phases and appear to have intruded into the centre of the Grasberg Igneous
Complex parallel to the axis of the Yellow Valley Syncline. These intrusions were emplaced at
≤2km, and sourced from depleted mantle with small contributions from an ancient, enriched
mantle reservoir (McMahon, 1994b; Housh and McMahon, 2000). They are divided into a high-K
group (latites, trachydacites and trachytes) and a low-K group (medium to high-K andesite and
dacite); the high-K group includes the Grasberg Igneous Complex and Ertsberg Intrusive Suite
(McMahon, 1994a; McMahon, 1994b).

14 Kucing Liar, Ertsberg Mining District _____________________________________________________________________________
Figure 1-9 Geological map of the Ertsberg Mining District (supplied by PT Freeport Indonesia)
Cretaceous units are shown in green colours and Tertiary units in brown; intrusions are red to pink
coloured. Kucing Liar is adjacent to the Grasberg Igneous Complex, and along strike from the Ertsberg
Intrusive Suite to the east and the Lembah Tembaga (beneath Lake Wanagon) porphyry intrusion to the
west.

15 Research topic, significance and setting _____________________________________________________________________________
1.2 ACCESS AND METHODS
1.2.1 Physiography of the mining district
Kucing Liar is situated within the Erstberg Mining Distict near the watershed of the Central
Ranges of West Papua. The Ertsberg Mining District was originally centred on the Ertsberg
deposit, and occupies roughly 100km2 of the deeply incised south flank of the Central Ranges of
Irian Jaya. The mine site lies at, and above the vegetation line. Ice accumulations fringe mountain
peaks just 5km from the mine site, that in the past were true glaciers flowing directly past the
present mine site, just 4°S of the equator (Quarles van Ufford and Sedgwick, 1998). The district
boundary, originally square, was altered to exclude icefields which are now part of the adjacent
Lorentz nature reserve, which covers a large area from the middle of the Central Range to the
low-lying areas adjacent to the ocean. Topography in the mine district is severe (Plate 1-1) with
elevation ranging from 2,000m to 4,880m. The northern boundary of the district is in the highest
elevations of the Central Ranges mountain belt which reaches its maximum of ~4,884m at the
nearby peak of Puncak Jaya. Mining in the district was originally concentrated on the Ertsberg
deposit before moving to the Ertsberg East Skarn System (EESS), which continues to supplement
the current primary mining activity at Grasberg. Both Ertsberg and Grasberg are open pit mines
while the EESS is mined via large-scale underground block caving methods. Grasberg
mineralisation is centred on the Grasberg Igneous Complex while four deposits are situated at the
periphery of the Ertsberg Intrusion hosted by sedimentary rocks, namely the Ertsberg, Ertsberg
East, Dom and Big Gossan skarn systems.
16 Kucing Liar, Ertsberg Mining District _____________________________________________________________________________
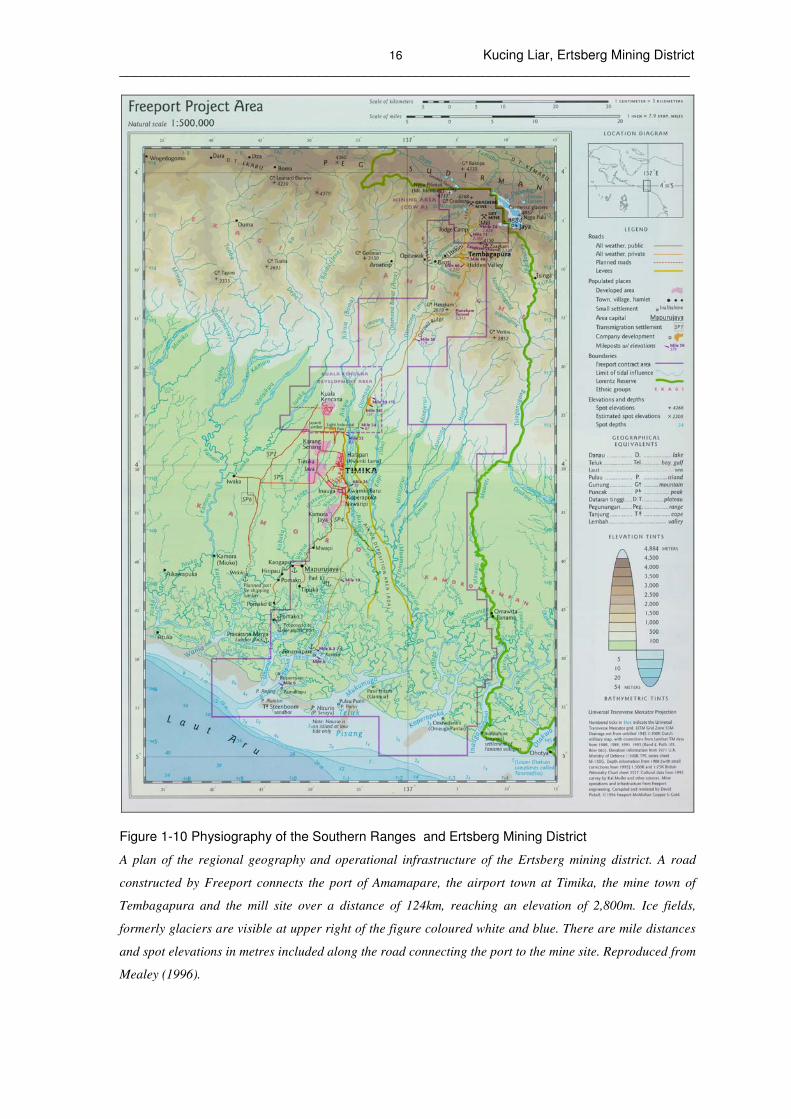
Figure 1-10 Physiography of the Southern Ranges and Ertsberg Mining District
A plan of the regional geography and operational infrastructure of the Ertsberg mining district. A road
constructed by Freeport connects the port of Amamapare, the airport town at Timika, the mine town of
Tembagapura and the mill site over a distance of 124km, reaching an elevation of 2,800m. Ice fields,
formerly glaciers are visible at upper right of the figure coloured white and blue. There are mile distances
and spot elevations in metres included along the road connecting the port to the mine site. Reproduced from
Mealey (1996).

17 Research topic, significance and setting _____________________________________________________________________________
Plate 1-1 Relief of the Ertsberg Mining District and access routes
(a) View looking south from the Ertsberg Mining District between the 4,150m Mt Zaagkam and the 2,820m
Mt Hanekam. The collection of buildings visible at lower centre is Hidden Valley, perched at the top of the
steep-sided valley where Tembagapura is located. The access road connecting Timika, Tembagapura and
the mill site is visible tracking along ridge tops between Mt Zaagkam and Mt Hannekam. (b) A view looking
east toward Puncak Jaya, the highest mountain in Southeast Asia. The Grasberg open pit mine operations
are to the left of view. The Heavy Equipment Access Trail (HEAT), which provides access to the mine, is
visible in foreground. The Kucing Liar deposit occurs at depth below the north-south trending ridge in the
middle of picture, with the Big Gossan skarn deposit located further to the south (right). Power pylons are
perched on smaller ridges in the foreground of this ridge.
Mt. Zaagkam
(4,150m)
Mt. Hanekam
(2,820m) ocean shoreline
Puncak Jaya
(~4,880m)

18 Kucing Liar, Ertsberg Mining District _____________________________________________________________________________
1.2.2 Sources of data
A detailed history of exploration and mining in the Ertsberg Mining District, including initial
exploration for Kucing Liar is included in the book Grasberg (Mealey, 1996). Kucing Liar,
meaning “wild cat” in the Indonesian language, was actively explored for in favourable
sedimentary units adjacent to the Grasberg Igneous Complex following discovery of mineralised
country rock fragments at the margin of the Grasberg Igneous Complex in 1992 and high-grade
intersections during deep exploration in 1994 (Macdonald, pers. comm.). The Grasberg Igneous
Complex is a wineglass shaped body composed of multiple igneous bodies in its stem and of
heavily fragmented zones overlain by layered pyroclastic rocks in the flared upper zone. A tunnel
driven at 3000mRL into the Grasberg Igneous Complex from the mill to control water influx into
the Grasberg open pit intersected significant mineralisation associated with a fault and was given
the name Amole, meaning, “welcome” in the local Amungme language. A second level driven
northwest subparallel to the dominant strike of stratigraphy provided a platform for delineation of
this zone by diamond drilling (Figure 1-11). Drill stations spaced evenly along strike confirmed
that the Amole mineralised zone was contiguous with Kucing Liar (“wild cat”) intersections some
800m further west on the access trail to Grasberg. Excavations spaced at 50m intervals along this
drive were completed for drilling stations, of which 16 were originally completed spaced 100m
apart covering 1,500 metres of regional stratigraphic strike (Figure 1-12). Later infill drilling was
conducted in the centre of deposit to confirm continuity of the resource at a distance of 50m, the
core from these holes have been inspected but not included in the dataset for the current research
project. Drilling was conducted in radial patterns on azimuths of 39 or 219° (Figure 1-12),
perpendicular to the regional strike (Figure 1-13). Collar positions and downhole survey
orientations for all drilling are recorded in Appendix 1.

19 Research topic, significance and setting _____________________________________________________________________________
Figure 1-11 Position of Kucing Liar mineralisation relative to Grasberg Igenous Complex
Plan and perspective views illustrate the location of Kucing Liar with reference to Grasberg as well as
dewatering and delineation tunnels. The outer perimeter of the Grasberg Igneous Complex (supplied by
Peter Manning of PT Freeport Indonesia) is coloured red while the Kucing Liar mineralised zone is
represented by three surfaces representing major internal stratigraphic contacts that are coloured brown,
dark green and light green. Underground access levels are shown in light blue. The perspective view has no
vertical exaggeration.
~1km
Amole drift (3,000mRL)
Kucing Liar drill drift (3,050mRL)
Grasberg Igneous Complex perimeter
Grasberg Igneous Complex perimeter
Amole dewatering drift (3,000mRL)
Kucing Liar drill drift (3,050mRL)
Extents of Kucing Liar
mineralisation
PLAN VIEW
PERSPECTIVE VIEW

20 Kucing Liar, Ertsberg Mining District _____________________________________________________________________________
Figure 1-12 Plan view of all Kucing Liar drill traces logged for this research program
Plan view of drilling including all holes sampled and measured for this research program. The traces of
drilling are projected in plan view and many overlie each other. The filled circles represent the location of
the collars and the drill station position. Compare with Figure 1-11. The drill stations are labelled with the
prefix KL, followed by the station number and a number exclusive to each hole (eg. KL16-03, KL32-04).
KL26-11, KL28-9 and KL30-9 were collared from the Amole dewatering drift. The dip and azimuth of each
drill hole have been surveyed every 3m on average and this data has been used to position each interval.
Holes were nominally divided into 3m lengths by PT Freeport Indonesia geologists for assaying
but shortened if a change in geology was identified. A short length of drill core (10-20cm) was
removed from each assayed interval and retained, producing an archive of “skeleton” core. All of
the drill holes in Figure 1-12 and Figure 1-13 were logged using these samples on two separate
occasions from Sept.-Nov. 1997 and June-Sept. 1999. The second period of logging revisited
many of the drill holes logged on the first occasion. Due to the location and the extreme elevation
(Plate 1-1), no field mapping was conducted for this research project, though one visit was made
to a baseline stratigraphic section that was considered equivalent to the Kucing Liar host rocks.

21 Research topic, significance and setting _____________________________________________________________________________
Figure 1-13 Layout of all holes in each drill station logged for this research program

22 Kucing Liar, Ertsberg Mining District _____________________________________________________________________________
Figure 1-13 Layout of all holes in each drill station logged for this research program (cont.)

23
2 Host rocks
This section documents the wall rocks hosting Kucing Liar in terms of their composition and
stratigraphical sequence. Each unit of the stratigraphic sequence is described in terms of lithology
and internal sequence. The division of stratigraphy followed here is in line with that currently
used within the mine environment by PT Freeport Indonesia. The rocks found in relatively
unaltered sequences were compared to distinctive samples from the main mineralised zone in
order to determine the reliability of textures observed in mineralised specimens for interpreting
the stratigraphic position of individual samples (Chapter 4).

24 Host rocks _____________________________________________________________________________
2.1 PREVIOUS WORK AND SOURCES OF DATA
2.1.1 Regional stratigraphic sequence
The stratigraphic sequence in the Ertsberg Mining District represents a continental margin
including tidal, inner and outer shelf, plus deep marine sediments (Table 2-1). The Kembelangan
Group is the lowermost stratigraphic package and comprises thick monotonous accumulations of
shale and sandstone deposited in dominantly marine conditions from middle Jurassic to late
Cretaceous times (Pennington, 1995; Quarles van Ufford, 1996). Contacts with both the
underlying terrestrial to shallow marine Tipuma Formation and the overlying marine New Guinea
Limestone Group are described as conformable (Pennington, 1995; Quarles van Ufford, 1996).
The overall thickness of the Kembelangan Group is cited as 4,600m ± 1000 (Quarles van Ufford,
1996), while Pennington (1995) indicates that although the exposed thickness along the road
exceeds 3,400m, the actual thickness is only 1,900m. The discrepancy is thought to be the result
of tectonic thickening. The Kembelangan Group is subdivided into four formations, namely, the
Kopai Formation, Woniwogi Sandstone, Pinya Mudstone and Ekmai Sandstone. Internal contacts
have been described as conformable to disconformable by Quarles van Ufford (1996) but as
conformable by Pennington (1995). In this study only the uppermost unit of this group, the Ekmai
Sandstone, is significant. It is ~600m thick and is constrained by fossil evidence to a middle-upper
Cretaceous age though it may possibly extend into the Palaeocene (Pennington, 1995; Quarles van
Ufford, 1996). The upper Ekmai Sandstone is a 120m thick carbonaceous limestone referred to by
mine geologists as the Ekmai Limestone, which includes an uppermost layer referred to as the
Ekmai shale. Neither of these units was differentiated by Pennington (1995) or Quarles van
Ufford (1996) but they are included on local geological maps (Parris, 1994).
The New Guinea Limestone Group conformably overlies the Kembelangan Group, is
unconformably overlain by Quaternary glacial sediments and is documented as being 1,600-
1,800m thick (Pennington, 1995: Quarles van Ufford, 1996). The sequence defines a regressive-
transgressive-regressive sequence indicated by lower and upper platform carbonates separated by

25 Kucing Liar, Ertsberg mining district _____________________________________________________________________________
fluvial and tidal facies sediments. The New Guinea Limestone group is subdivided into the
Waripi Limestone, Faumai Limestone, Sirga Sandstone and Kais Limestone which were
deposited on a stable carbonate platform marine over a ~50Ma period from latest Cretaceous to
middle Miocene times (Quarles van Ufford, 1996). The Waripi Limestone is described as being
250-300m thick and is assigned a Palaeocene to early Eocene age (Pennington, 1995). The
presence of anhydrite nodules within this unit indicates emergent conditions and supratidal
environments. The upper contact with the overlying Faumai Limestone is described as
conformable and gradational while the lower contact with the Ekmai Limestone may be
disconformable (Pennington, 1995). The Faumai Limestone is distinguished from the Waripi
Limestone by the presence of foraminifera and by the lack of sandstone (Table 2-1). The lower
contact is conformable with the Waripi Limestone while the upper contact with the Sirga
Sandstone is unconformable (Pennington, 1995), though evidence of prolonged exposure of the
unit was not found (Quarles van Ufford, 1996). The Sirga Sandstone is a transgressive sequence
of fluvial or near-shore sandstones including some organic-rich beds. The uppermost Kais
Limestone is further subdivided into separate members, referred to by mine geologists as Tk1,
Tk2, Tk3 and Tk4 (Parris, 1994). Although the top of the Kais Limestone is not exposed, the unit
is at least 1,100m thick (Quarles van Ufford, 1996). It is distinct in the district as having a unique
texture derived from tightly packed, large and elongate foraminifera. The lower contact with the
Sirga Sandstone is conformable, while the upper contact is an erosional unconformity.

26 Host rocks _____________________________________________________________________________
Table 2-1 Descriptions of stratigraphy in the Ertsberg Mining District
Formation Lithology Depositional environment
Kais Limestone
(Tngk)
1,100 – 1,300m
Red algal, benthic foraminiferal limestone to packstone at the base, well developed bedding but internally massive. Massive, fossiliferous marls layers in lower sections.
Restricted shallow-marine carbonate platform sheltered from open marine currents
Sirga Sandstone
(Tngs)
40m
Fining-upwards trough and tabular cross stratified quartz arenite, reworked foraminifera, coal and plant-rich seams.
Transgressive from terrestrial to shallow-marine and subaerial exposure, fluvial or nearshore unidirectional depositional current
Faumai Limestone
(Tngf)
200 – 300m
Benthic foraminiferal limestone and packstone, 10m thick sandstone in lower and middle sections, occasional dolomite.
Shallow marine carbonate platform, restricted medium-energy
Waripi Limestone
(Tngw)
250 – 400m
Sucrosic dolostone, quartz arenite sandstone and 2m thick nodular anhydrite-bearing beds.
Transitional from siliciclastic to carbonate, high energy shallow-marine shelf
Ekmai Sandstone
(Kkes)
650m / 600m
Variably grain-sized quartz arenite with trough and tabular cross-bedding, upper 90m is mudstone and limestone.
Shallow shelf, nearshore to possible beach facies, the upper limestone is outer-shelf to slope
Pinya Mudstone
(Kp)
1550m / 600m
Laminated massive mud and siltstone interbedded with 20cm thick well-sorted and fine-grained sandstone.
Shelf margin and slope during transgression, storm generated sands and fair weather mud.
Woniwogi Sandstone
(Kw)
1000m / ~300m
Poorly-sorted coarse-gained to granule sandstone overlain by well-sorted fine to medium-grained sandstone, sporadic cross-bedding but generally massive; belemnites.
Shallow marine and slope from sand-rich shelf, basal section is either beach or debris flows
Kopai Formation
(Kkp)
1400m / 300m
sandstone, siltstone/mudstone and subordinate limestone; crinoids, echinoderm and ammonite.
Transitional fluvial to nearshore marine, shallow shelf, distal shelf or slope. Lower sections are transgressive, upper sections are regressive
Source: Pennington (1995) and Quarles van Ufford (1996). The numbers below the unit names refer to
their thicknesses. There is a consistent discrepancy between local and district studies where larger values
are reported from regional studies.

27 Kucing Liar, Ertsberg mining district _____________________________________________________________________________
2.1.2 District outcrop and deep drilling
There are numerous spectacular large-scale exposures of the Kucing Liar host stratigraphy in the
district (e.g. Plate 2-1). The most visible differences in the stratigraphic units are the relative
thicknesses of beds and the effects of erosion (Plate 2-1). The Ekmai Sandstone situated at the
base of the mineralised sequence is very thickly bedded at a scale of tens of metres. By contrast,
the overlying Waripi and Faumai Limestone units are very thinly bedded. A major topographic
break occurs at the upper contact of the Ekmai Sandstone, which is suspected to be due to
mechanical contrasts between the thick sandstone and thinner limestone, possibly exacerbated by
the presence of the carbonaceous Ekmai Limestone. The contact of this unit with the underlying
sandstone is very deeply eroded relative to overlying and underlying units in the walls of the
Aghawagon Valley (Plate 2-1). Topographic breaks in the stratigraphic pile are consistent across
the district and are situated at changes from sandstone to limestone or shale (Plate 2-1). These
breaks have been used as marker horizons during district-scale geological mapping in defining the
position of stratigraphic contacts (P. Manning, pers comm.). The extremely rugged nature of
outcrop in the Ertsberg Mining District makes it logistically difficult to investigate. Consequently,
analysis of strata intersected by exploration drilling at the margins of the Grasberg Igneous
Complex (Figure 2-1) has provided details of the composition, texture and sequence of the
Kucing Liar host sequence.

28 Host rocks _____________________________________________________________________________
Plate 2-1 Large-scale exposure of host stratigraphy
(a) View west from north of Wanagon along strike showing a continuous section of stratigraphy. Breaks in
topography are related to lithology, the most prominent occurring at the transition from Ekmai Sandstone
(Kkes) to Ekmai Limestone (Kkel). Topographic breaks reflect visible changes in the bedding scale, which
is small for the Waripi (Tngw), Faumai (Tngf) and Kais (Tngk) limestone units and much larger for the
Ekmai Sandstone. The different dip of Kais Limestone to the right is probably due to faulting. (b) A view of
the east wall in a valley where the mill is situated illustrates deep weathering of the Ekmai Limestone and a
close up view of the thinly bedded Waripi Limestone.
~350m
Kkes Kkel
Tngw
Tngf
Tngk
(a)
(b)
Kkes Kkel
100m
fault contact

29 Kucing Liar, Ertsberg mining district _____________________________________________________________________________
Drilling conducted on the north and northwest margins of the Grasberg Igneous Complex
intersected reasonably coherent stratigraphy equivalent to the host rocks at Kucing Liar. Mine
staff identified the major stratigraphic packages and the contact characteristics prior to this study.
Two drill holes, KLS1-1 (total depth 2199m) and KLS3-1 (total depth 2235m) completed in the
course of district exploration intersected less altered equivalents of the Kucing Liar sequence,
respectively northeast (northern limb of Yellow Valley Syncline) and northwest (axis of Yellow
Valley Syncline) of the Grasberg Intrusive Complex (Figure 2-1). Drill hole KLS3-1 is near
vertical and is expected to record true thicknesses of stratigraphic units as the stratigraphic
layering should be near horizontal in the axis of the syncline. These two drill holes intersect the
least altered host rocks available but nevertheless contain locally significant alteration. Although
KLS3-1 was collared in the Grasberg Igneous Complex it intersected sedimentary units at 200m
depth due to the flaring outwards of the igneous-sediment contact. No igneous bodies were
intersected at depth in either of these drill holes. Drill hole KLS1-1 ended some 200m into the
Ekmai Sandstone, while KLS3-1 intersected only the top 75m of the unit. KLS1-1 and KLS3-1
were both sampled for this study from the base of the Kais Limestone to the top of the Ekmai
Sandstone at roughly 10m intervals, or less where significant changes in lithology were observed.
Samples were collected from these two drill holes for petrographic examination and
characterisation. Stained thin sections were produced to determine carbonate compositions of
each sample. Details of the procedure are recorded in Appendix II. Carbonate composition is
revealed in the colour imposed on the grains and matrix by staining. Dolomite is colourless to
blue, while calcite is pink to purple. In each case, the darker colours are due to the presence of
iron. Discrimination of calcite, dolomite, ferroan dolomite and ferroan calcite is possible from this
technique. Thin sections were used to collect information specifically relating to:
• grain composition , size and abundance,
• matrix composition, grainsize and abundance, and
• carbonate composition.

30 Host rocks _____________________________________________________________________________
Identification of foraminifera for the of the Faumai, Sirga and Kais units was facilitated by a
report completed by the Palaeontology and Stratigraphy Division of the Geological Research and
Development Centre, Directorate General of Geology and Mineral Resources, Department of
Mines and Energy in Bandung, West Java (GRDC, 1999). Stratigraphic columns for each of the
drill holes were created from the data recorded in thin section descriptions, allowing correlation of
the major stratigraphic features (Figure 2-2).
Figure 2-1 Plan projection showing collar locations for stratigraphical drillholes
Positions of KLS1-1 and KLS3-1 with reference to the location of Grasberg and Kucing Liar. KLS3-1 is
vertical to the end of hole; KLS1-1 is vertical to 600m, then dips -60° toward southwest then is near vertical
again from 900m. The section of KLS1-1 sampled for this study (870-2,200m) is oriented at -60° toward
213°. Grid spacing is 500m.
KLS3-1 Elev: 4199.2m
Depth: 2235.7m
KLS1-1 Elev: 3978.6m Depth: 2199m
Shaded surface representing outer perimeter of Grasberg Igneous Complex from 2,000-3,000mRL.
The extent of major stratigraphic planes defines the position of the Kucing Liar system
Kucing Liar drifts (3,050mRL)
Amole drifts from mill site (3,000mRL)
N

31 Kucing Liar, Ertsberg mining district _____________________________________________________________________________
2.2 RESULTS
866.5
933.1
984.0
1012.9
1045.0
1077.8
1091.21104.21110.2
1128.5
1175.31180.8
1245.5
1277.2
1297.6
1345.3
1394.8
1419.5
1436.51447.41455.61465.01474.11484.7
1509.71517.01520.01524.2
1532.41535.31547.31550.3
1573.0
1605.5
1657.0
1705.0
1734.4
1765.6
1787.81796.7
1825.6
1854.7
1894.61895.81914.61920.51923.2 1925.6
1947.0
1964.31971.4
1993.22000.0
2016.82019.62023.7
2044.82049.82063.12068.2
2095.3
1120.01132.0
1173.01182.01186.01189.01190.01195.71198.5 1201.21205.0 1207.51215.0
1255.7
1278.81282.3
1311.6
1327.81337.51340.91345.6
1370.2
1387.3
1402.31412.81420.21426.5
1456.2
1477.71485.71497.9
1516.6
1535.4
1551.41556.3 1559.01569.0
1582.51591.81599.01606.41612.41616.2 1623.81628.91636.21638.81649.81661.71669.91676.31678.01688.8
1719.0
1744.81755.41767.01778.51791.31798.3
1818.51828.0
1843.91855.8
1869.8
1888.41891.7
1974.51979.5 1983.01986.91999.1
2013.92018.3 2020.5
2027.82029.02031.0
2051.72052.32063.22075.1
2120.0
2156.02161.3 2163.8
2175.02186.62192.3
2198.4 2200.82206.82215.9
2230.1Total depth 2235.7m
Total depth 2199m
clay
v.
fin
e si
lt
med
ium
sil
tcoar
se s
ilt
v.
fin
e sa
nd
fin
e sa
nd
med
ium
sand
coar
se s
and
fin
e si
lt
cla
yv
. fi
ne
silt
med
ium
sil
tco
ars
e si
ltv
. fi
ne
sand
fin
e sa
nd
med
ium
san
dco
ars
e sa
nd
fin
e si
lt
KLS1-1 KLS3-1
0% 100%
0%100%
0% 100%
0%100%
0 m
100
200
300
400
500
600
700
800
900
1000
1100
1200
100
200
PA
LA
EO
CE
NE
EO
CE
NE
OLIG
OC
EN
EC
RE
TA
CE
OU
S
New
Gu
inea L
imesto
ne G
roup
Kem
bela
ngan G
roup
peloid limestone
sandstone
shale / mudstone
texture retentivedolomitisation
texture destructivedolomitisation
skarn
E
km
ai
limesto
ne
Wa
r ip
i lim
esto
ne
Fau
ma
i lim
esto
ne
Ekm
ai san
dsto
ne
quartz grains
calcite
dolomite
pyroxene, garnet, feldsparamphibole, talc, epidote
foraminifera limestone(nummilites fichteli)
foraminifera limestone(lacazinella wichmanni)
foraminifera limestone(lepidocyclina sp.)
sam
ple
site (
m) sam
ple
site (
m)
rock type composition
rock type composition
E
km
ai
limesto
ne
Wa
rip
i lim
esto
ne
Fau
ma
i lim
esto
ne
Ekm
ai san
dsto
ne
Ka
is lim
esto
ne
SC
AL
E (
m)
Figure 2-2 Lithology and composition of unmineralised stratigraphy
Sample locations from KLS1-1 and KLS3-1 for lithology descriptions are shown on the left of each column
and marked by a tick and the depth. Different apparent thickness of the Faumai Limestone is due to
variable intersection angles. Ages from Pennington (1995) and Quarles van Ufford (1996). Hatch symbols
indicate presence of anhydrite nodules.
#
#
#
#

32 Host rocks _____________________________________________________________________________
2.2.1 Descriptions of local unaltered lithological sequences
Kembelangan Group – Ekmai Sandstone (Kkes)
The Ekmai Sandstone is the lowermost unit intersected in Kucing Liar drilling. Its base was not
intersected in either drill hole KLS1-1, which penetrated 170m, or in KLS3-1, which penetrated
only 75m (Figure 2-2). The unit is largely homogeneous and consists of 80-90% very well sorted,
angular to subangular quartz grains of 0.3mm grainsize and rare complete foraminifer (Plate 2-
2a). However, there are also minor layers of red sandstone and coarse-grained bioclast-bearing
sandstone (Plate 2-2b). The Ekmai Sandstone is thickly bedded (~50-100m) and bedding planes
that are visible in large-scale exposures (Plate 2-1) are not recognisable in drill core. The
overlying contact with the Ekmai Limestone is defined by disappearance of quartz grains (Figure
2-2).
Kembelangan Group – Ekmai Limestone (Kkel)
The Ekmai Limestone is 120m thick in KLS3-1 where it is almost pristine, while the intersection
in KLS1-1 is altered to pyroxene-feldspar-garnet-epidote. The predominant lithology is very fine-
grained black micritic limestone with a significant shale component containing up to 20% quartz
and bioclasts. The base of the unit contains apparent bioturbation textures (Plate 2-2c). The
limestone changes from massive and shaly in the lower sections, to fissile in the middle (Plate 2-
2d), and bioclastic near the top (Plate 2-2e). A distinct layer (~5m) of black shale at the top of the
Ekmai Limestone is locally referred to as the Ekmai shale.

33 Kucing Liar, Ertsberg mining district _____________________________________________________________________________
Plate 2-2 Examples of Ekmai Sandstone and limestone
(a) Photomicrograph of typical Ekmai Sandstone at the top of the unit, stained for carbonate composition.
A grain (right) stained blue (ferroan dolomite) and pink (calcite) is a foraminifer. Plane light (b) Coarse-
grained sand and carbonate layer (<5m) near top of Ekmai Sandstone. (c) Pale grey patches of sand grains
in shale/limestone from the lower Ekmai Limestone that may be burrows. (d) Fissile shale from the middle
of the Ekmai Limestone. (e) Coarse-grained texture of sand and bioclasts in a shale matrix of the upper
Ekmai Limestone. Plane light image of a stained section.
(e) KLS3-1 2052.0m
1mm
(d) KLS3-1 2120.0m (c) KLS3-1 2156.0m
1cm 1cm
(a) KLS3-1 2163.8m (b) KLS3-1 2200.8m
2mm 1cm

34 Host rocks _____________________________________________________________________________
New Guinea Limestone Group – Waripi Limestone (Tngw)
The Waripi Limestone is approximately 430m thick in KLS3-1, which is significantly more than
the ~250m indicated by district studies (Pennington, 1995; Quarles van Ufford, 1996). It is
dominated by peloid limestone but contains significant layers of sandstone, plus subordinate
foraminiferal limestone and shale. The unit has been extensively dolomitised in both KLS1-1 and
KLS3-1, although some samples containing primary calcite were collected. Exposed sections of
the Waripi Limestone have very well defined sub-metre scale bedding structures (Plate 2-3).
Plate 2-3 Outcrop of the Waripi Limestone
Layers of dolomite in outcrop of the section measured by mine staff near the Waripi Limestone-Faumai
Limestone contact to the north of the Wanagon sill outcrop.
Grey peloid limestone/dolostone (Plate 2-4a) forms sections up to 180 thick in the Waripi
Limestone (Figure 2-2). Peloid grains are spherical, micritic, possess no internal structure and
constitute 60-80% of the rock. Peloid grainsize varies from 0.1 to 0.6mm but averages 0.3mm.
Where peloid limestone is not dolomitised, the grains and matrix are composed of micritic calcite.
There are three sandstone members within the Waripi Limestone that are used as marker horizons.
A 10-30m layer in the middle Waripi Limestone separates two thick sequences of peloid
1m

35 Kucing Liar, Ertsberg mining district _____________________________________________________________________________
limestone/dolostone (Figure 2-2). The grains in this member are well sorted, angular to
subangular, vary from 20-80% total content and average 0.3mm in size. A 50m (plus subordinate
dolostone/limestone) member near the top of the Waripi Limestone is composed of 60-90%
moderately sorted, angular to subangular quartz grains of 0.2mm average grainsize, increasing to
0.4-0.6mm at the base of the member. A third 5m-thick laminated sandstone member with well
sorted, angular to sub-angular, 30-80% sand grains of 0.1mm average size, has been used to mark
the upper contact of the Waripi Limestone (Figure 2-2, Plate 2-4e). In all cases the matrix is
composed of micritic calcite or dolomite spar. Talc, tremolite and pyroxene are commonly present
in the matrix of sandstones in both KLS1-1 and KLS3-1 and impart on what is normally grey
sandstone a pasty white appearance (Plate 2-4b). A shale horizon approximately 5m thick was
identified and sampled in KLS3-1 in the upper Waripi Limestone at the top of the upper sandstone
layer (Figure 2-2). This layer was not identified in KLS1-1. Another shale layer was identified in
drill hole KLS1-1 within the middle sandstone layers (Figure 2-2). A 60-80m horizon of
limestone containing elongate to rounded foraminifera is present in the upper Waripi Limestone,
bound top and bottom by sandstone (Figure 2-2). The foraminifera vary from 1-5mm in size, and
constitute 50-80% of the rock (Plate 2-4d). Dolomite, anhydrite and native sulphur have replaced
foraminifer grains in places where dolomitisation is prevalent in the matrix (Plate 2-8). These
foraminifera are similar in size and shape to vughs in dolostone of the lower and middle Faumai
Limestone that are usually infilled with dolomite quartz, anhydrite and native sulphur. Anhydrite
nodules occur at three specific levels in the Waripi Limestone in KLS3-1, namely at the top
between two sandstones, in the middle of the unit associated with sandstone and shale, and in a
narrow band (~20m) near the base of the unit. They vary in shape from spherical to lenticular and
are roughly elongate in direction of bedding (Plate 2-4c). Nodule size varies from <5mm to
50mm. The nodules at the base are the more spherical type.

36 Host rocks _____________________________________________________________________________
Plate 2-4 Examples of Waripi Limestone visible textures
(a) Medium grey peloid dolostone typical of the majority of the Waripi Limestone. The lines are fractures
associated with lighter grey dolomite alteration. (b) Sandstone matrix that is normally dark grey is changed
to white due to presence of amphibole-pyroxene-talc. (c) An anhydrite nodule from the upper Waripi
Limestone oriented subparallel to sedimentary layering. (d) Foraminifera from the upper Waripi Limestone
which resembles texture in the middle Faumai Limestone where leached holes have been infilled with
coarse-grained carbonate. (e) Finely laminated sandstone that marks the upper contact of the Waripi
Limestone.
New Guinea Limestone Group – Faumai Limestone (Tngf)
The Faumai Limestone is 350m thick in KLS3-1. The lower half of the Faumai Limestone is
extensively dolomitised in both KLS1-1 & KLS3-1 and the only unaffected parts occur at the top
of the unit (Figure 2-2). Identifiable Faumai Limestone in KLS1-1 and KLS3-1 consists of
fossiliferous calcite limestone, dolomitised limestone and dolostone. Distinctive round
foraminifer lacazinella wichmanni (Plate 2-5a and Plate 2-5c) dominate the uppermost limestones
that are composed of uniform packstone, in which the foraminifer grains range from 1-2mm in
(a) KLS3-1 1744.0m
1cm 1cm
(b) KLS3-1 1661.0m
(c) KLS3-1 1559.0m (d) KLS3-1 1582.8m (e) KLS3-1 1556.0m
1cm 1cm 1cm

37 Kucing Liar, Ertsberg mining district _____________________________________________________________________________
diameter. A micritic calcite matrix supports the foraminifer grains that constitute up to 80% of the
rock. This member is approximately 70m thick in KLS3-1. Below this in KLS1-1, there is another
preserved limestone member containing a variety of carbonate grains. In this member the elongate
foraminifer lepidocyclina sp. is common (Plate 2-5b). Also included in these upper layers are
subordinate grains of echinoderms, bryozoa and coralline algae.
New Guinea Limestone Group – Sirga Sandstone (Tngs)
The thickness of the Sirga Sandstone intersected in drill hole KLS3-1 is approximately 20m. It
unconformably overlies the Faumai Limestone and consists of a series of interbedded sandstones
and fossiliferous carbonate rocks (Plate 2-6). The dominant carbonate is calcite, although
dolomite is present in minor quantities. There are ~5m beds in the Sirga Sandstone with very high
organic contents. The Kais-Sirga contact appears conformable, as a section at the top of the Sirga
Sandstone contains 50% quartz grains and 50% foraminiferal grains of same species present in
overlying limestone.
New Guinea Limestone Group – Kais Limestone (Tngk)
The original thickness of the Kais Limestone is not known as the top of the unit has an
unconformable contact with Quaternary sediments. Only the lower part of the Kais Limestone has
been examined in this study as upper sections do not host Kucing Liar mineralisation. The base is
typified by limestone with packed elongate foraminifera up to 10mm long (Plate 2-7). These are
dominantly nummulite fichteli plus minor amounts of operculina sp., and operculinella. Minor
dolomite and scattered quartz grains are present in samples collected from the lower Kais
Limestone.

38 Host rocks _____________________________________________________________________________
Plate 2-5 Examples of Faumai Limestone visible and micro-textures
(a) Distinctive round foraminifera (lacazinella wichmanni) from the upper Faumai Limestone (b) Grains of
Lacazinella wichmanni are calcite while the intervening matrix has been converted to dolomite. Plane light
image of a stained section.
(a) KLS3-1 1255.0m
(b) KLS3-1 1278.0m
1cm
1mm

39 Kucing Liar, Ertsberg mining district _____________________________________________________________________________
Plate 2-6 Example of Sirga Sandstone
Photomicrograph illustrating large nummulites fichteli identical to those in the overlying Kais Limestone
mixed with coarse sand grains. Pink and purple colours indicate calcite while blue indicates dolomite.
Plane light image of a stained section.
Plate 2-7 Example of Kais Limestone
Photomicrograph illustrating nummulites fichteli that dominate the lower Kais Limestone. Much smaller
spiral-shaped operculina sp. is also present. Foraminifera are (pink) calcite while some have ferroan
dolomite (blue) in the centre. The matrix between grains has been altered to dolomite (yellowish). The large
white grains are quartz. Plane light image of a stained section.
KLS3-1 1189.0m
1mm
1mm
KLS3-1 1190.0m

40 Host rocks _____________________________________________________________________________
2.2.2 Textures developed in low-intensity distal alteration
Dolomitisation
Samples from KLS1-1 and KLS3-1 indicate variable effects of dolomitisation (Plate 2-8) most
common as well as calc-silicate alteration. The number of dolomitisation events and their extents
are unknown, and their precise relationships to the mineralizing hydrothermal systems are also not
clear. The effects of dolomitisation vary from minor alteration of grains and matrix resulting in
the preservation of the original texture (Plate 2-9), to the complete replacement of original calcite
by dolomite spar, resulting in the destruction of the original sedimentary texture. All textures
between these two endmembers are represented. Complete replacement of calcite by dolomite
occurs over very short distances as seen in composition columns for samples in KLS1-1 and
KLS3-1 (Figure 2-2). The scale of replacement is less than the sample spacing of 10m as the
change in carbonate is complete between two samples. Figure 2-2 also illustrates that calcite
limestone is preserved near sandstone horizons at the top and bottom of the Faumai and Waripi
Limestone units. A spatial association between texturally destructive dolomitisation and
sandstone layers is apparent in KLS3-1. Contacts between unaltered limestone and texturally
destructive dolostone range from gradational to sharp and a complete loss of sedimentary texture
occurs over a 4m interval in KLS3-1 between 1278.8m and 1282.3m. Layers are discretely altered
to equigranular dolomite sparite and are intercalated with dolostone where the original texture can
be identified. Dolomitisation is most intensely developed in the limestone-only packages of these
two units between sandstone horizons. Dolostone is grey in the Waripi Limestone (Plate 2-8a) and
brownish-beige in the Faumai Limestone (Plate 2-8f). Spherical to elongate pores filled with
anhydrite and dolomite (Plate 2-10) in the middle and lower parts of the Faumai Limestone are
very similar in size, shape and abundance to similar features in foraminiferal limestone of the
upper Waripi Limestone. The matrix in these rocks consists of subhedral to euhedral dolomite
grains and the pores are filled to varying degrees with varying amounts of calcite, dolomite or
native sulphur (Plate 2-8c, d & e).

41 Kucing Liar, Ertsberg mining district _____________________________________________________________________________
Plate 2-8 Examples of dolomitisation textures
(a) Fine-grained dolomitised peloid limestone such as is common in the Waripi Limestone. (b) An
unidentified bioclast composed of original calcite is surrounded by a matrix of yellowish dolomite from the
lower Waripi Limestone. The grey-white area in the view is a cavity. Plane light image of a stained section.
(c) White anhydrite and dolomite infilling cavities that are shaped like foraminiferal grains from uppermost
Waripi Limestone. (d) An example of the same limestone layer depicted in (c), though here the foraminifer-
like voids are infilled with native sulphur (e) A sample from the lower Faumai Limestone believed to have
been foraminiferal limestone where the fossil grains have been dissolved. The vughs are lined with quartz
and/or dolomite. Note similarity with (c) above. (f) Intense dolomitisation results in complete destruction of
clastic sedimentary textures in this dolomite sparite, although some semblance of the layering appears to be
preserved as darker zones of dolomite in this sample from the middle Faumai Limestone.
(f) KLS3-1 1412.0m
1cm 1cm
(e) KLS3-1 1456.0m
(d) KLS1-1 1465.0m
1cm 1mm
(a) KLS3-1 1984.0m
(c) KLS3-1 1569.0m
1cm
(b) KLS3-1 2013.0m
1cm

42 Host rocks _____________________________________________________________________________
Plate 2-9 Examples of dolomitisation micro-textures in peloid limestone
(a) Yellowish dolomite surrounds reddish micritic calcite peloid grains and voids (white patches). Plane
light image of a stained section (b) Micritic calcite peloid limestone replaced by two generations of
dolomite. A yellowish-coloured type replaces the peloid grains at right and bottom, while a paler variety of
dolomite preferentially affects matrix rather than the micritic grains and surrounds pores (white). Plane
light image of a stained thin section.
(a) KLS3-1 1744.0m
1mm
(b) KLS3-1 1984.0m
1mm

43 Kucing Liar, Ertsberg mining district _____________________________________________________________________________
Plate 2-10 Examples of dolomitisation micro-textures in foraminiferal limestone
(a) Foraminifer grains composed of primary calcite surrounded by very fine-grained dolomite spar. Plane
light image of a stained thin section. (b) Dolomite (high birefringence, twinned) and anhydrite (moderate
birefringence, polycrystalline) infilling cavities that are of similar shape though much smaller than
foraminifera illustrated in plate (a). Cross polarised light image of a stained thin section.
(a) KLS3-1 1582.8m
(b) KLS3-1 1569.0m
1mm
1mm

44 Host rocks _____________________________________________________________________________
Distal silicate alteration
Distinctly hydrothermal alteration is also present in both KLS1-1 and KLS3-1 as represented by
plagioclase, pyroxene, garnet, epidote, amphibole and talc. As with dolomitisation, this alteration
is preserved as a continuum of textural and mineralogical changes that, while subtle, are
identifiable in hand specimen samples. Changes were identified using comparison of rock
samples from the same stratigraphic positions in different locations. These changes are described
and illustrated in the following section with reference to rock sample photography. The variability
of the characteristic compositions and sedimentary textures present within the host rock types
(Plate 2-11a & d) are preserved despite hydrothermal alteration. In KLS1-1, the Ekmai Limestone
has a very fine-grained glassy texture, coloured white and green, locally containing pods of
coarser-grained red garnet, while the overlying Waripi Limestone has the same fine-grained grey
dolomite appearance to that observed in KLS3-1. Petrographically this alteration appears as
equigranular plagioclase interspersed with coarser grains of pyroxene. Clumps of epidote and
garnet were also identified in alteration style. The upper Ekmai Limestone is characterised by
isolated quartz grains whereas the middle Ekmai Limestone is devoid of quartz, providing
distinction of position within the stratigraphic unit (Figure 2-2). The heterogeneous nature of the
Ekmai Limestone is preserved in pyroxene-feldspar and garnet alteration (Plate 2-11a-c).
Sandstone has a grainy texture, and although the Ekmai Sandstone is fine-grained it is easily
distinguished from limestone or shale. Quartz grains commonly persist in intensely altered zones
and grey sand grains are easy to recognise in a matrix of white to pale green pyroxene (Plate 2-
11d-f). However, some samples of altered sandstone demonstrate that sand grains have been
eroded during calc-silicate alteration (Plate 2-12).

45 Kucing Liar, Ertsberg mining district _____________________________________________________________________________
Plate 2-11 Examples of distal hydrothermal alteration
Photographs of samples taken from KLS1-1 and KLS3-1 demonstrating the effects of hydrothermal
alteration. (a) Unaltered shale from the upper Ekmai Limestone illustrates the heterogeneous texture
created by clusters of organic clasts and sand grains. (b) Green pyroxene and red garnet in altered shale
from KLS1-1 displaying excellent preservation of original sedimentary texture as compared to (a). (c) Grey
calcite-magnetite/white feldspar/red garnet altered Ekmai Limestone. (d) Unaltered sandstone with the
organic material still visible as dark matrix near the top of the photograph. (e) A sample taken from KLS3-
1 to illustrate calcite-talc-amphibole alteration of sandstone. (f) An example of clinopyroxene altered
sandstone taken from the lowermost part of the mineralised zone in Kucing Liar.
(e) KLS3-1 1888.0m (d) KLS3-1 2200.0m
1cm 1cm
(f) KL38-5 732.5m
1cm
(a) KLS3-1 1569.0m
1cm
(b) KLS1-1 1964.0m
1cm
(c) KLS1-1 2000.0m
1cm

46 Host rocks _____________________________________________________________________________
Plate 2-12 An axample of hydrothermal micro-textures in sandstone
A photomicrograph of altered sandstone illustrates the progression of hydrothermal alteration. Dissolution
of quartz grains (black holes) is associated with replacement of the matrix by amphibole and talc (yellow-
brown). Crossed polarised light.
KLS3-1 1661.0m
1mm


![[Year] · [Year] Kepulauan Yapen PA [TYPE THE DOCUMENT TITLE] [Type the abstract of the document here. The abstract is typically a short summary of the contents of the document.](https://static.fdocuments.in/doc/165x107/607c310fde8d006eea67df90/year-year-kepulauan-yapen-pa-type-the-document-title-type-the-abstract-of.jpg)


![[Year] - pa-serui.go.idpa-serui.go.id/wp-content/uploads/2019/03/LAPORAN-TAHUNAN-PA-SERUI-2018.pdf[Year] Kepulauan Yapen PA [TYPE THE DOCUMENT TITLE] [Type the abstract of the document](https://static.fdocuments.in/doc/165x107/5d1d714a88c993d2288de4f5/year-pa-seruigoidpa-seruigoidwp-contentuploads201903laporan-tahunan-pa-serui-2018pdfyear.jpg)