New Approach to well design, completion, surveillance and ... · 1 Discover more RESMAN: THE...
24
1 RESMAN: THE RESERVOIR SURVEILLANCE PEOPLE Discover more • www.resman.no Confidential – Property of RESMAN New Approach to well design, completion, surveillance and modelling UK North Sea Operator Edurne Elguezabal Sr Well Technology Engineer 24 th of January 2017
Transcript of New Approach to well design, completion, surveillance and ... · 1 Discover more RESMAN: THE...

1 RESMAN: THE RESERVOIR SURVEILLANCE PEOPLEDiscover more • www.resman.no
Con
fiden
tial –
Pro
pert
y of
RE
SM
AN
New Approach to well design, completion, surveillance and modelling
UK North Sea Operator
Edurne ElguezabalSr Well Technology Engineer
24th of January 2017

2 RESMAN: THE RESERVOIR SURVEILLANCE PEOPLE
• First passive ICD field trial for UK operator– Verify claims from vendor
• Balance inflow• Delays water breakthrough
• Using interventionless PLT information– Heel to toe performance (Transient/Steady-State)– Model calibration
• Developed new ICD monitoring workflow
Passive ICD Field Application • Introduction

3 RESMAN: THE RESERVOIR SURVEILLANCE PEOPLE
Molecule ReleaseConstant release rate
(Flow rate independent)
FLUID CONTACT DETECTION
Oil or Water
Tracer SystemsUp to 160 (80 RES•Oil + 80 RES•H20)
unique intelligent molecule IDs
Unique tracer molecule
EngineeredPolymer Matrix
Integration into well completion
How it Works • Inflow Tracer Systems

4 RESMAN: THE RESERVOIR SURVEILLANCE PEOPLE
Design and manufacturing
System integration
Well completion
SamplingLab analysis & interpretation
Polymer Matrix80 oil
& 80 waterunique
signatures
RESMAN Project Management procedure is based upon Project Management Methodology set out in the ANSI standard PMBOK® (Project Management Body of Knowledge) created by PMI (Project Management Institute).
How it Works • Acquisition & Interpretation Process

5 RESMAN: THE RESERVOIR SURVEILLANCE PEOPLE
Quantification • Creating a Transient
• RESMAN integrated into completion
Completion RIH
• Static flow periods:
Intelligent molecule’s concentration builds up(release is ‘’rate independent’’)
• Start up = concentration is Flushed Out
11
2 2
3
3

6 RESMAN: THE RESERVOIR SURVEILLANCE PEOPLE
Shut-in generates locally high concentration tracer shot
• Displacing tracer shot during re-start; flush out
• Steep decay curve = high production rate
• Model matching by tuning flow dependent parameter k
• Patent granted in 2013
Quantification • Flush Out Model

7 RESMAN: THE RESERVOIR SURVEILLANCE PEOPLE
Quantification• Flow Loop Verification
8 RESMAN: THE RESERVOIR SURVEILLANCE PEOPLE
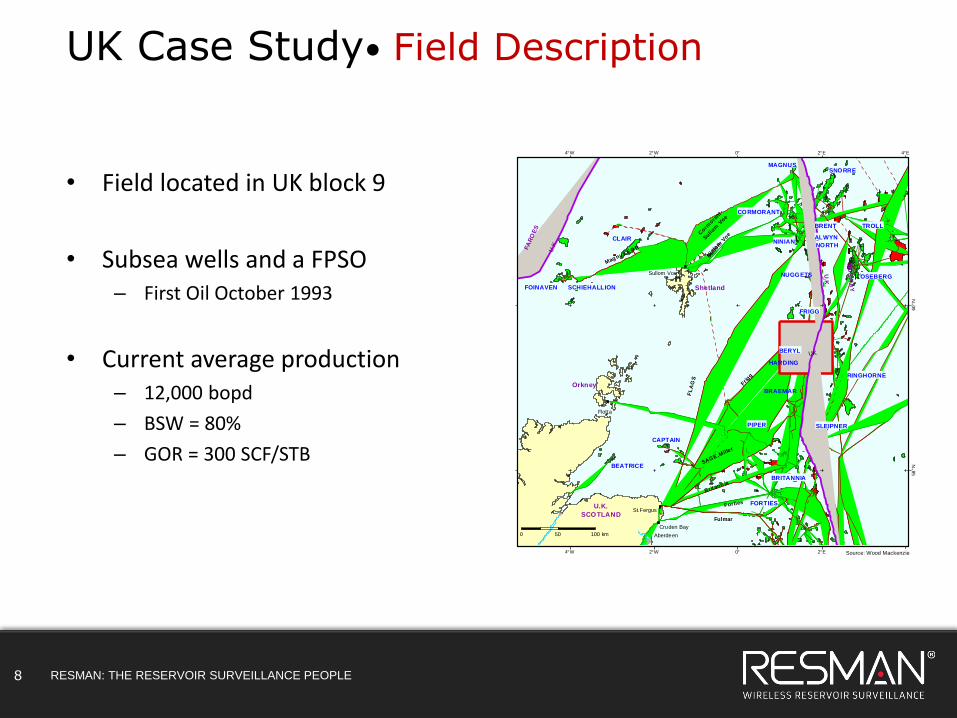
• Field located in UK block 9
• Subsea wells and a FPSO– First Oil October 1993
• Current average production– 12,000 bopd
– BSW = 80%
– GOR = 300 SCF/STB
Yen
ise
i
Lena
Amga
Aldan
Uch
ur
Yen
isei
Ang
ara
Aldan
Riv er Ob
Riv
er
Irty
sh
Riv
er
I rty
sh
Riv
er
To
bo
l
River Irt ysh
River Irtysh
Riv er
O b
Riv er Vak h
River O
b
Ob
Riv er
Chulym
Riv
er
Ob
Pe
ch
or
a R
ive
r
Lena R
iver
Lake Ladoga
Vo lga
UK
BRAEMAR
HARDING
NUGGETS
4°E
4°E
2°E
2°E
0°
0°
2°W
2°W
4°W
4°W
60
°N
60
°N
58
°N
58
°N
Orkney
U.K.
SCOTLAND
U.K
.
CLAIR
SCHIEHALLION
TROLL
SLEIPNER
FORTIES
PIPER
BERYL
BRENT
SNORRE
RINGHORNE
FRIGG
Fulmar
0 50 100 km
Forties
Shetland
SAGE,Mille
r
Britann ia
Frigg
FL
AG
S
Mag nus EOR
Corm
ora
nt-
Sullo
m V
oe
Nin
ian-
Sullom
Voe
FOINAVEN
MAGNUS
NINIAN
CAPTAIN
BEATRICE
St.Fergus
Aberdeen
Cruden Bay
Flotta
Sullom VoeOSEBERG
FA
RO
ES
U.K
.
BRITANNIA
ALWYN
NORTH
CORMORANT
NO
RW
AY
Source: Wood Mackenzie
UK Case Study• Field Description

9 RESMAN: THE RESERVOIR SURVEILLANCE PEOPLE
Challenge
• Very mature field• Narrow window of success for new in fill wells
• Remaining reserves located in injectite type reservoir sections.
• Production from the toe is key to guarantee an economical success from thiswell.
• Subsea development, PLT prohibited expensive and operationally risky.
Solution
• Pilot new technologies• Passive inflow control devices to delay water breakthrough and balance inflow
• Inflow tracers for downhole surveillance from heel to toe
• Near wellbore modelling software
|
UK Case Study• Challenge & New Technologies
10 RESMAN: THE RESERVOIR SURVEILLANCE PEOPLE
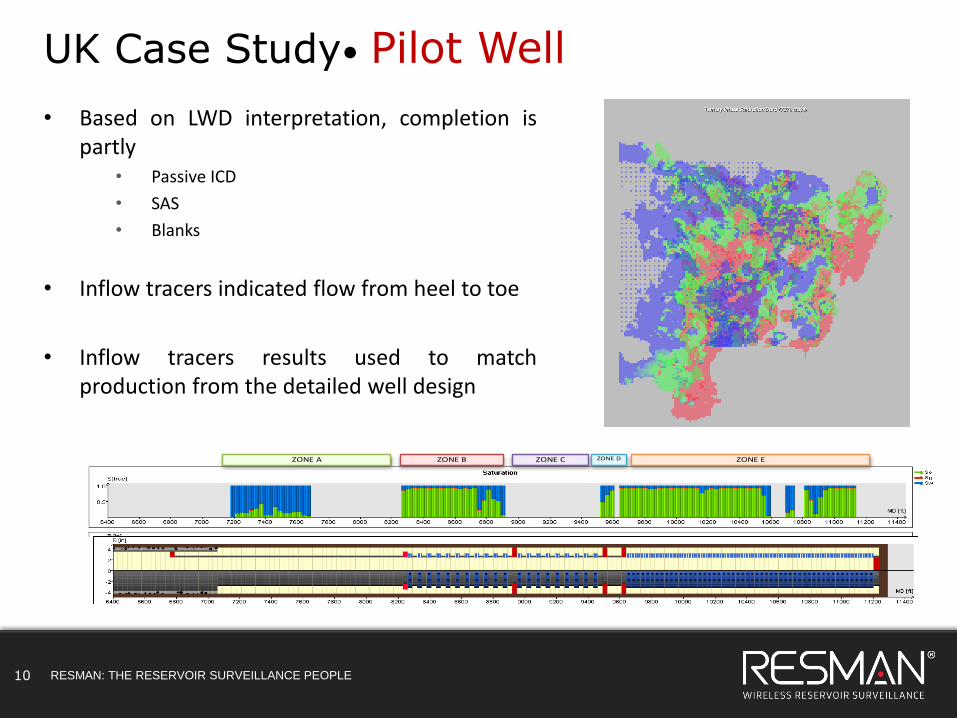
ZONE A ZONE B ZONE C ZONE D ZONE E
UK Case Study• Pilot Well
• Based on LWD interpretation, completion ispartly
• Passive ICD
• SAS
• Blanks
• Inflow tracers indicated flow from heel to toe
• Inflow tracers results used to matchproduction from the detailed well design

11 RESMAN: THE RESERVOIR SURVEILLANCE PEOPLE
• ECLIPSE unable to forecast ICD production accurately• First water breakthrough predicted ~5 month
• After 8 months of actual production • No water breakthrough and REVEAL matched this behaviour
0
500
1000
1500
2000
2500
3000
3500
4000Liquid production
History
REVEAL
UK Case Study• History Match

12 RESMAN: THE RESERVOIR SURVEILLANCE PEOPLE
• Samples captured to obtain Chemical PLT ®well restart in December 2013– Dry well at the time
UK Case Study• History Match
Only well in production during main transients of the re-start
13 RESMAN: THE RESERVOIR SURVEILLANCE PEOPLE
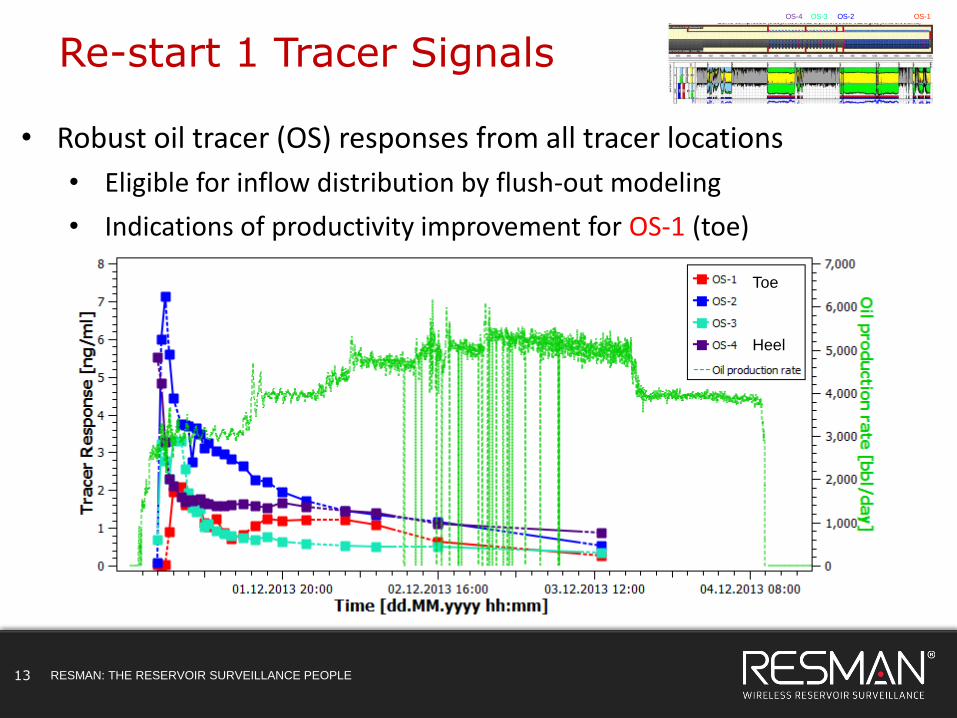
Re-start 1 Tracer Signals
• Robust oil tracer (OS) responses from all tracer locations
• Eligible for inflow distribution by flush-out modeling
• Indications of productivity improvement for OS-1 (toe)
Toe
Heel
OS-4 OS-1OS-3 OS-2

14 RESMAN: THE RESERVOIR SURVEILLANCE PEOPLE
• Strong response from OS-4, OS-3 and OS-2
• Ongoing clean-up / improvement in lower zone (OS-2 & OS-1)
• Increased tracer response indicates different lift-off pressures
Qualitative Interpretation
Packer
Packer
Packer
Packer
Heel
Toe
OS-4 OS-1OS-3 OS-2

15 RESMAN: THE RESERVOIR SURVEILLANCE PEOPLE
• Dominating heel (OS-4). On-going clean-up in lower zone (OS-1 & OS-2)
RE1 Flush-out Interpretation
Packer
Packer
Packer
Packer
Heel
Toe
k = 0.17k = 1.00
k = 0.40(improving)
k = 0.25(improving)
OS-4 OS-1OS-3 OS-2
16 RESMAN: THE RESERVOIR SURVEILLANCE PEOPLE
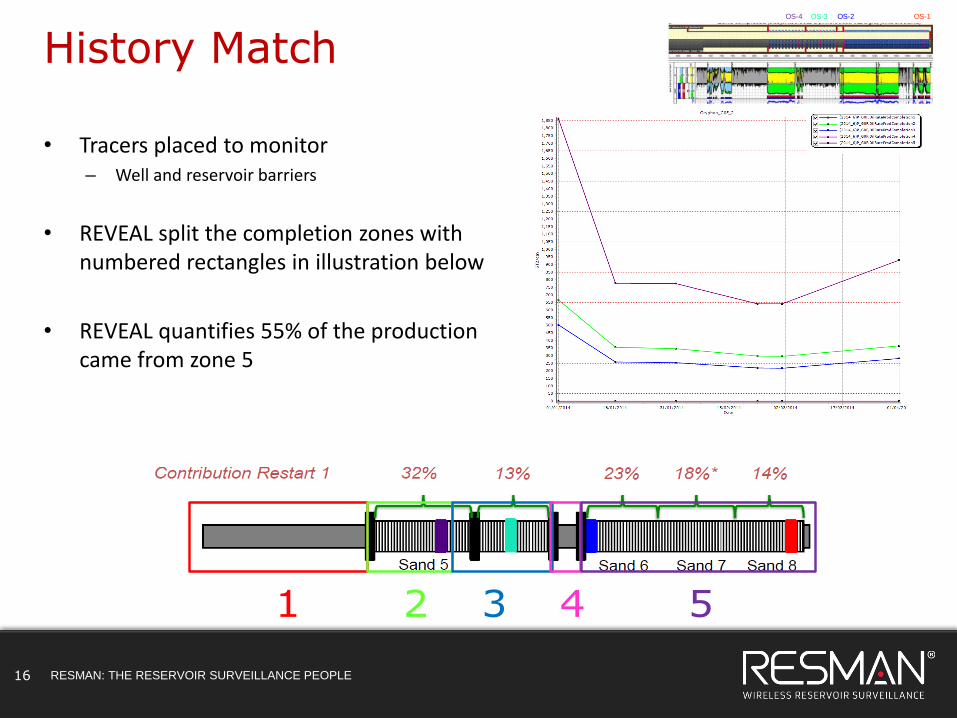
• Tracers placed to monitor – Well and reservoir barriers
• REVEAL split the completion zones with numbered rectangles in illustration below
• REVEAL quantifies 55% of the production came from zone 5
1 2 3 4 5
History MatchOS-4 OS-1OS-3 OS-2

17 RESMAN: THE RESERVOIR SURVEILLANCE PEOPLE
• May 2014 first water breakthrough observed and stabilising in June 2014
• Large increase in August-September• Water cut > 70%
Water Breakthrough OS-4 OS-1OS-3 OS-2

18 RESMAN: THE RESERVOIR SURVEILLANCE PEOPLE
RES●H2O Flux 1 Steady State 2014-15
• All systems respond across WBT
• Main water production from around 9,641’ MD (2) and heel (4)
• Toe (WS-1) with least water production, dropping out from OCT 2014
• Mid (WS-3) water loading response, dropping out in SEP 2014
OS-4 OS-1OS-3 OS-2
19 RESMAN: THE RESERVOIR SURVEILLANCE PEOPLE
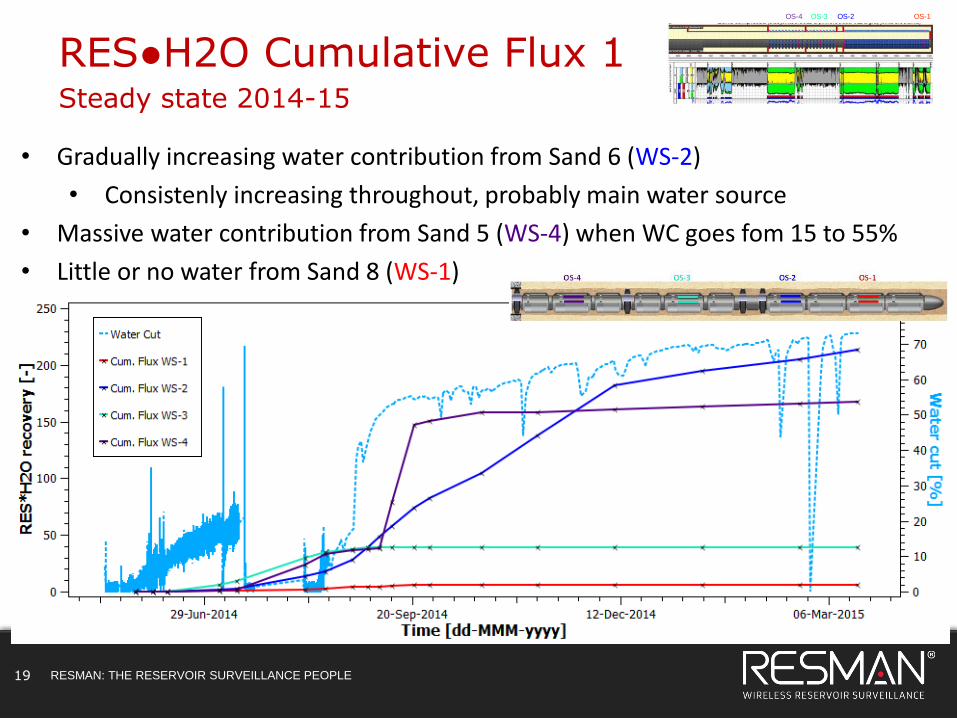
RES●H2O Cumulative Flux 1 Steady state 2014-15
• Gradually increasing water contribution from Sand 6 (WS-2)
• Consistenly increasing throughout, probably main water source
• Massive water contribution from Sand 5 (WS-4) when WC goes fom 15 to 55%
• Little or no water from Sand 8 (WS-1)
OS-4 OS-1OS-3 OS-2

20 RESMAN: THE RESERVOIR SURVEILLANCE PEOPLE
UK Case Study• Water breakthrough Monitoring

21 RESMAN: THE RESERVOIR SURVEILLANCE PEOPLE
UK Case Study• Conclusion
• Applying appropriate modelling tools and incorporating inflow tracer data can improve the well construction process from design to forecasting
• The operator used ECLIPSE without Multi-Segmented Well option– Matched bulk well rates only with pressure and near wellbore saturations,– Friction not modelled– ICD not modelled– No zonal isolation
• REVEAL modelled the ICD/SAS completion with zonal isolation– Forecast predicted water breakthrough was imminent
• Inflow tracers results allocate voidage per sand in model– successfully forecasting water breakthrough
• The voidage per sand was extrapolated to offset wells and utilized as new input for new well location and completion design

22 RESMAN: THE RESERVOIR SURVEILLANCE PEOPLEDiscover more • www.resman.no
Con
fiden
tial –
Pro
pert
y of
RE
SM
AN
23 RESMAN: THE RESERVOIR SURVEILLANCE PEOPLE
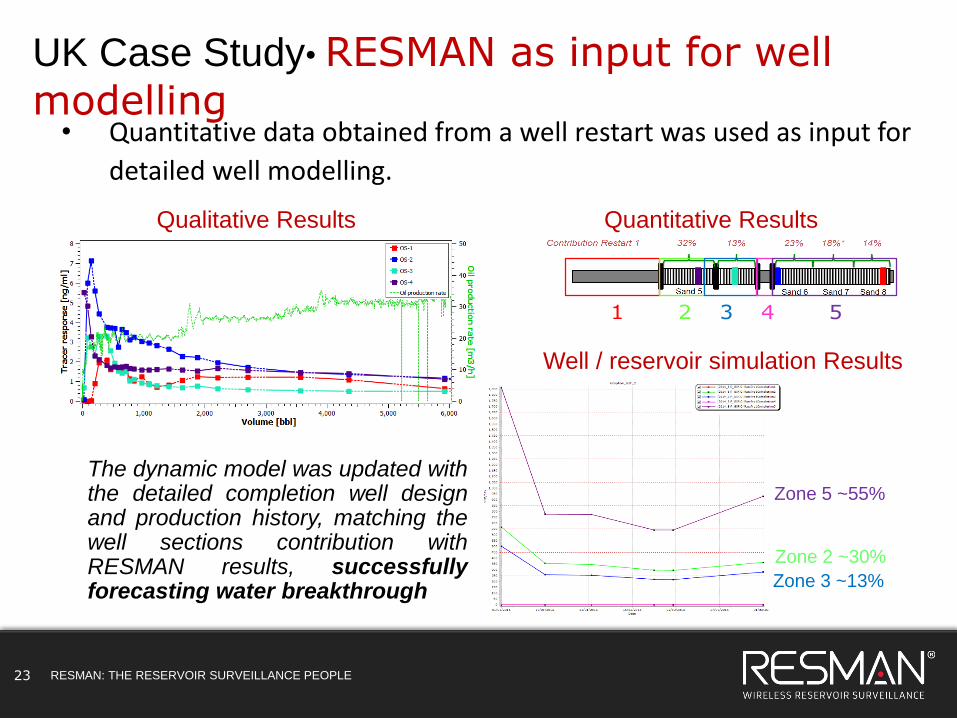
• Quantitative data obtained from a well restart was used as input for
detailed well modelling.
UK Case Study• RESMAN as input for well
modelling
1 2 3 4 5
Qualitative Results Quantitative Results
Well / reservoir simulation Results
Zone 5 ~55%
Zone 2 ~30%
Zone 3 ~13%
The dynamic model was updated withthe detailed completion well designand production history, matching thewell sections contribution withRESMAN results, successfullyforecasting water breakthrough

24 RESMAN: THE RESERVOIR SURVEILLANCE PEOPLE
UK Case Study• Water breakthrough monitoring
Cumulative tracer flux was plotted against water cut
Combining tracer results with completion and reservoir information, it was possibly to identify two WBT events that happens during the Steady State monitoring.