New advances in imaging osteoporosis and its complications
13
REVIEW New advances in imaging osteoporosis and its complications James F. Griffith • Harry K. Genant Received: 7 February 2012 / Accepted: 30 April 2012 / Published online: 23 May 2012 Ó Springer Science+Business Media, LLC 2012 Abstract Tremendous advances have been made over the past several decades in assessing osteoporosis and its complications. High resolution imaging combined with sophisticated computational techniques now provide a detailed analysis of bone structure and a much more accurate prediction of bone strength. These techniques have shown how different mechanisms of age-related bone weakening exist in males and females. Limitations peculiar to these more advanced imaging techniques currently hin- der their adoption into mainstream clinical practice. As such, the ultimate quest remains a readily available, safe, high resolution technique capable of fully predicting bone strength, capable of showing how bone strength is faltering and precisely monitoring treatment effect. Whether this technique will be based on acquisition of spine/hip data or data obtained at peripheral sites reflective of changes happening in the spine and hip regions is still not clear. In the meantime, mainstream imaging will continue to improve the detection of osteoporosis related insufficiency fracture in the clinical setting. We, as clinicians, should aim to increase awareness of this fracture type both as a frequent and varied source of pain in patients with osteo- porosis and as the ultimate marker of severely impaired bone strength. Keywords Osteoporosis Á Fracture Á Imaging Á DXA Á Computed tomography Á Magnetic resonance imaging Introduction It is fortuitous that as the prevalence of osteoporosis has increased over the past 30 years, there has been a par- allel increase in the range and capability of imaging modalities used to evaluate osteoporosis and its compli- cations. These advances in medical imaging and data processing have improved understanding of the osteo- porotic process as well as bone anatomy, physiology, and pathology in a broader sense. Much has been learnt regarding the diagnosis and assessment of osteoporosis as well as limitations of current evaluation methods. Current techniques based on density measurement, in many respects, diagnose osteoporosis too late with bone strength being significantly weakened before density criteria are met. Even with appropriate treatment at this stage, bone strength will not return to normal. Although practical limitations such as machine cost, clinical usage, and radiation issues limit adoption of these newer imaging applications into everyday clinical practice, they are nevertheless very much at the forefront with regard to bone quality research and the assessment of new osteoporotic treatments [1, 2]. The same practical limitations do not apply to evaluat- ing the main complication of osteoporosis, namely insuf- ficiency fracture. Modern imaging modalities have enabled recognition and evaluation of insufficiency fracture to a high level of accuracy significantly impacting day-to-day clinical practice and improving patient wellbeing. This review addresses recent imaging advances in the diagnosis and assessment of osteoporosis focusing primarily on new information gaining regarding the pathogenesis of osteo- porotic insufficiency fracture. Second, we discuss advances in imaging with regard to recognition and characterization of insufficiency fracture. J. F. Griffith (&) Department of Imaging and Interventional Radiology, The Chinese University of Hong Kong, Shatin, Hong Kong e-mail: griffi[email protected] H. K. Genant University of California, San Francisco, CA, USA 123 Endocrine (2012) 42:39–51 DOI 10.1007/s12020-012-9691-2
Transcript of New advances in imaging osteoporosis and its complications

REVIEW
New advances in imaging osteoporosis and its complications
James F. Griffith • Harry K. Genant
Received: 7 February 2012 / Accepted: 30 April 2012 / Published online: 23 May 2012
� Springer Science+Business Media, LLC 2012
Abstract Tremendous advances have been made over the
past several decades in assessing osteoporosis and its
complications. High resolution imaging combined with
sophisticated computational techniques now provide a
detailed analysis of bone structure and a much more
accurate prediction of bone strength. These techniques
have shown how different mechanisms of age-related bone
weakening exist in males and females. Limitations peculiar
to these more advanced imaging techniques currently hin-
der their adoption into mainstream clinical practice. As
such, the ultimate quest remains a readily available, safe,
high resolution technique capable of fully predicting bone
strength, capable of showing how bone strength is faltering
and precisely monitoring treatment effect. Whether this
technique will be based on acquisition of spine/hip data or
data obtained at peripheral sites reflective of changes
happening in the spine and hip regions is still not clear. In
the meantime, mainstream imaging will continue to
improve the detection of osteoporosis related insufficiency
fracture in the clinical setting. We, as clinicians, should
aim to increase awareness of this fracture type both as a
frequent and varied source of pain in patients with osteo-
porosis and as the ultimate marker of severely impaired
bone strength.
Keywords Osteoporosis � Fracture � Imaging � DXA �Computed tomography � Magnetic resonance imaging
Introduction
It is fortuitous that as the prevalence of osteoporosis has
increased over the past 30 years, there has been a par-
allel increase in the range and capability of imaging
modalities used to evaluate osteoporosis and its compli-
cations. These advances in medical imaging and data
processing have improved understanding of the osteo-
porotic process as well as bone anatomy, physiology, and
pathology in a broader sense. Much has been learnt
regarding the diagnosis and assessment of osteoporosis
as well as limitations of current evaluation methods.
Current techniques based on density measurement, in
many respects, diagnose osteoporosis too late with bone
strength being significantly weakened before density
criteria are met. Even with appropriate treatment at this
stage, bone strength will not return to normal. Although
practical limitations such as machine cost, clinical usage,
and radiation issues limit adoption of these newer
imaging applications into everyday clinical practice, they
are nevertheless very much at the forefront with regard
to bone quality research and the assessment of new
osteoporotic treatments [1, 2].
The same practical limitations do not apply to evaluat-
ing the main complication of osteoporosis, namely insuf-
ficiency fracture. Modern imaging modalities have enabled
recognition and evaluation of insufficiency fracture to a
high level of accuracy significantly impacting day-to-day
clinical practice and improving patient wellbeing. This
review addresses recent imaging advances in the diagnosis
and assessment of osteoporosis focusing primarily on new
information gaining regarding the pathogenesis of osteo-
porotic insufficiency fracture. Second, we discuss advances
in imaging with regard to recognition and characterization
of insufficiency fracture.
J. F. Griffith (&)
Department of Imaging and Interventional Radiology, The
Chinese University of Hong Kong, Shatin, Hong Kong
e-mail: [email protected]
H. K. Genant
University of California, San Francisco, CA, USA
123
Endocrine (2012) 42:39–51
DOI 10.1007/s12020-012-9691-2

Advances in imaging osteoporosis
Dual X-ray absorptiometry (DXA)
Since DXA first came into clinical practice in the mid-
1980s, it has become widely applied as a means to diag-
nose and monitor osteoporosis. In 1994, the WHO rec-
ommended DXA-based thresholds for normal bone density
(T-score [1.0), osteopenia (T-score \1.0 and [2.5), and
osteoporosis (T-score [2.5) [3]. DXA examination mea-
sures areal bone mineral density (BMD) in g/cm2. Areal
densitometry has limitations particularly in the spine. For
example, vertebral body depth is not taken into account
such that larger (i.e., deeper) vertebrae in men or growing
children appear spuriously more dense than smaller (i.e.,
less deep) vertebrae. Similarly, areal projectional tech-
niques cannot separate cortical and trabecular bone density
and cannot compensate for features such as scoliosis,
marginal osteophytosis, facet joint arthrosis or vascular
calcification all of which tend to erroneously increase
densitometric measurement. As a result of these and other
confounding factors, lumbar spine BMD tends to remain
static or even increase in post-menopausal women [4]. On
the other hand, increased body fat as well as increased
marrow fat may spuriously decrease DXA lumbar spine
and hip measurements more so than other densitometry
techniques [5, 6]. Nevertheless, despite these limitations,
BMD measurement by DXA is the best available surrogate
marker of osteoporosis. The lower the BMD, the greater
the risk of sustaining an insufficiency fracture [7] with
fracture risk increasing approximately 1.5-fold for every
SD (i.e., T-score) age-adjusted reduction in BMD. Simi-
larly, the lower the BMD, the more likely the patient is to
benefit from osteoporotic medication [8].
However, osteoporosis is not solely a disease of reduced
BMD as exemplified in the WHO position which defines
osteoporosis as a skeletal disease characterized not just by
‘‘low bone mass’’ but also by ‘‘micro-architectural deteri-
oration of bone’’ [WHO 1995]. A more encompassing
consideration is to think of osteoporosis as a disease of
reduced bone strength [9]. Bone strength is the ability of
bone to resist fracture and depends on bone quality as well
as bone density. Bone qualify represents all aspects of bone
strength other than bone density and incorporates such
wide ranging features as bone macrostructure, micro-
structure, mineralization, microdamage, and collagen sta-
tus. The limitation of using BMD as the sole determinant of
bone strength has been borne out by many studies. For
example, nearly half of all post-menopausal women who
sustained an insufficiency fracture over a 9-year period,
had a baseline BMD in the osteopenic range while one-
tenth had normal baseline BMD [10]. In another study,
nearly half of all non-vertebral fractures occurred in
women who did not have osteoporosis based on DXA
examination [11]. A similar discrepancy was seen in
patients treated with anti-resorptive therapy, in that the
5–8 % improvement in BMD did not explain the observed
50–60 % decrease in fracture incidence [12, 13]. This latter
discrepancy reflects the positive effect that osteoporotic
medication has on bone quality to improve bone strength
over and above the effect of increasing BMD. It would
clearly be advantageous if DXA could provide additional
information on bone quality in addition to BMD. With this
in mind, the potential of standard DXA examination have
been enhanced by simultaneous vertebral fracture assess-
ment (VFA) by DXA as well as incorporating geometric
elements based on additional analysis of two- or three-
dimensional DXA images.
DXA systems equipped with in-built fan beam tech-
nology and supportive software can acquire diagnostic
quality images of the lower thoracic and lumbar spines
enabling VFA of the T7 to L4 vertebrae. VFA by DXA can
be performed at the same time as bone densitometry with
obvious cost and practical advantages over spinal radiog-
raphy. Although image resolution is modest compared to
radiography, it is still adequate to detect most vertebral
fractures [14]. VFA has high sensitivity for diagnosing
moderate to severe vertebral fractures and moderate sen-
sitivity for mild vertebral fractures (Fig. 1). VFA, in
allowing recognition of unsuspected vertebral fracture,
provides bone strength information over and above BMD.
This additional information can be incorporated into the
fracture risk assessment (FRAX) model along with clinical
risk factors to improve 10-year prediction of major osteo-
porotic fracture [15].
For the hip region, advances in DXA software allows
automatic calculation of several proximal femoral struc-
tural parameters (such as hip axis length, cross-sectional
moment of inertia, femoral neck shaft angle, and femoral
neck width) along with areal BMD. These structural
parameters can be combined with body size to calculate
composite femoral strength indices for different failure
modes (compression, bending, and impact) [16, 17] sig-
nificantly improving hip fracture risk prediction compared
to T-score alone [18]. For example, despite having higher
femoral neck BMD, diabetic women were found to have
lower composite femoral strength indices consistent with
their known higher hip fracture risk [19]. Similarly, Chi-
nese subjects, even though their lower femoral neck BMD
was lower, were found to have a higher femoral com-
pressive strength index than Caucasians which helps
explain their lower incidence of hip fractures [17].
Geometric data are best obtained from volumetric three-
dimensional data, rather than the two-dimensional DXA
data and with this in mind, the feasibility of volumetric
X-ray absorptiometry (VXA) has been studied [20].
40 Endocrine (2012) 42:39–51
123

Combining areal BMD with VXA-derived 3D geometric
parameters (such as femoral head diameter and mid-fem-
oral neck cross-sectional area) improves failure load pre-
diction over BMD measurement [21]. VXA shows
excellent correlation with volumetric quantitative CT
(vQCT) structural (femoral neck axis length, cross-sec-
tional area) and density parameters [22]. Although VXA
cannot currently distinguish between the cortical and tra-
becular bone components and cannot determine cortical
thickness, it shows promise as a low cost, low radiation,
clinically applicable technique predictive of proximal
femoral strength. However, its ability to improve predic-
tion of proximal femoral fracture in clinical studies has not
yet been reported.
Advances in DXA hardware and analytical techniques
now enable DXA to measure even relatively small changes
in body composition and aortic calcification [23, 24]. The
amount of fat (g), lean mass (g), and % fat for the arm,
trunk, leg or total body can be measured with good pre-
cision [23]. This is clearly useful if studying the relation-
ship between osteoporosis and associated conditions such
as sacropenia, aging, obesity, thinness, anorexia, metabolic
syndrome, diabetes, and cardiovascular disease. [23].
Modern DXA scanners also compare favorably with radi-
ography in detecting and grading aortic calcification, a
known associate of osteoporosis and significant cardio-
vascular risk factor [24, 25].
Computed tomography (CT)
Many of the limitations of areal DXA measurement can be
overcome by multidetector CT which allows higher spatial
resolution, improved delineation of bone architecture, and
acquisition of near isotropic vQCT datasets [26]. Volu-
metric QCT data correlate highly (r = 0.92, p \ 0.0001)
with reference standards for bone volume fraction (BV/TV)
and trabecular spacing though, as expected, fares less well
with trabecular thickness and number, as the spatial reso-
lution of multidetector (500 lm) is larger than average
trabecular thickness of 50–150 lm and more comparable
to average trabecular spacing of 200–2,000 lm [26] Bone
is an architecturally adaptive tissue which responds to
mechanical load and use. Gender differences in fracture
rates are not explained by differences in areal BMD [27].
Males have larger bones than females, which are also
substantially more heavily loaded [28]. QCT-based studies
have demonstrated how aging Caucasian men loose similar
amounts of bone to Caucasian women from the endosteal
cortical surface. However, net bone loss is less in men as
endosteal bone loss is offset by increased bone deposition
on the periosteal surface. The greater propensity of men
over women to deposit bone in the periosteal areas helps
them increase bone cross-sectional area, maintain bone
strength, and reduce vertebral fracture risk compared to
women [29, 30].
A vertebral fracture occurs when the loading applied to a
vertebral body exceed its strength. Functional loading of the
spine is primarily compressive. Most vertebral fractures
occur in the mid-thoracic and thoracolumbar regions, often
in incremental or stepwise fashion with severity varying
from a minor endplate fracture to a complete vertebral body
fracture. [31]. Compressive loading is accentuated in the
mid-thoracic spine during flexion and in the thoracolumbar
region between the relatively fixed thoracic and more
mobile lumbar spine. The weakest parts of the vertebral
body seem to be the central areas of the endplates and the
anterosuperior aspect of the vertebral body where lower
bone mass is not compensated by higher structural strength
[32]. Fracture of a single vertebral body, particularly of
anterior wedge type, shifts compressive forces toward the
anterior aspects of the vertebral bodies to the extent that a
‘‘vertebral fracture cascade’’ may ensue, with fractures in
adjacent vertebrae occurring in quite rapid succession [33].
Micro-CT, combined with finite element analysis
(FEA), have shown that major load pathways through the
Fig. 1 Lateral (a) and frontal (b) VFA by DXA showing moderate
fracture of L1 vertebral body (arrows)
Endocrine (2012) 42:39–51 41
123

vertebral body seem to parallel the vertical trabeculae. The
cortical shell and the horizontal trabeculae, although
important in bracing vertical trabeculae against buckling,
seem to have only a modest role in resisting compressive
forces [34]. Although all trabeculae reduce in number and
tend to become more rod-like than plate-like with
increasing age, only the horizontal trabeculae reduce in
thickness [35, 36], possibly due to horizontal trabeculae
being reabsorbed preferentially as the result of ‘‘adaptive
strain resorption,’’ while vertical trabeculae are reabsorbed
as a result of microdamage [37].
While density and geometric parameters enable predic-
tion of vertebral strength, a more direct measurement of
bone strength is provided by combining QCT with FEA.
Mechanical properties are assigned to each finite element
of high resolution CT (or MRI) model following segmen-
tation and decomposition to provide information on
parameters such as stiffness, estimated load failure, and
stress distribution [38]. One can simulate physiological
loading patterns with compressive loading being applied
for the spine and lateral loading simulating a sideways fall
for the hip (Fig. 2). FEA of vQCT data has shown how
vertebral body strength decreases with age twice as much
in women than men and that this sex difference is primarily
due to a greater decline in cortical bone strength in women
over and above the decline in trabecular bone strength
which is similar for both sexes [39].
While vertebral fracture are usually the first osteoporotic
fracture to occur and the source of considerable pain,
immobility and poor self image, the impact of proximal
femoral insufficiency fracture with regard to morbidity,
mortality and cost is greater. About two-thirds of hip
fractures occur in females. Age-related bone loss results in
proximal femoral cortical thickness in elderly females
being only about one-half that of middle-aged women
while trabecular volumetric BMD is only about one-third
[40]. In addition to progressive bones loss which is not that
dissimilar for both sexes, women are at increased risk of
femoral neck fracture by having smaller femoral necks;
tending to loose trabecular number and connectivity (as
opposed to men who sustain trabecular thinning); and have
a lower propensity than men for bone deposition on the
periosteal side of the cortex. Although females have
slightly thicker anteroinferior femoral cortices than males,
males have a higher femoral neck bending strength making
them less susceptible to fracture [41]. Similar differences in
proximal femoral bone architecture help account for
observed inter-racial differences in hip fracture risk [40].
FEA studies of the proximal femur provide more insight.
In an age-stratified cohort of over 600 men and women,
FEA of QCT data showed how lifetime reduction in
proximal femoral strength (; 65 % women, ; 39 % men)
was much greater than reduction in femoral neck areal
BMD (; 26 % women, ; 21 % men). This decline in bone
strength starts about 10 years earlier (i.e., in the mid-
1940s) in women than men. This early onset had a greater
effect on the eventual decline in femoral strength than peak
bone mass or annual rates of bone loss. For FEA, a prox-
imal femoral strength of \3,000 N has been suggested as
being representative of ‘‘low femoral strength.’’ And this
\3,000 N threshold is also that most predictive of insuf-
ficiency fractures outside the hip [42]. ‘‘Low femoral
strength’’ is seen to more common in the elderly than tra-
ditional DXA-based measures of osteoporosis [43].
Structural parameters obtained by MDCT provide a
better discriminator of treatment change than DXA and
may be evident as early as 12 months post-baseline. For
example, in post-menopausal women teriparatide increased
Fig. 2 a Volumetric QCT of lumbar spine with automated anatom-
ical coordinates outlining b the periosteal, endosteal, and juxta-
endosteal (‘‘peeled’’) contours of the vertebral body. Several different
VOI’s can be evaluated such as the total VOI, trabecular VOI, peeled,
elliptical, and Pacman VOIs in the axial plane as well as c the
superior, mid-vertebral, and inferior VOI’s in the sagittal plane.
(Courtesy of Klaus Engelke)
42 Endocrine (2012) 42:39–51
123

vertebral apparent bone volume fraction (app. BV/TV) by
30.6 ± 4.4 % (mean ± SE), and apparent trabecular
number (app. Tb.N.) by 19.0 ± 3.2 % compared to a
6.4 ± 0.7 % increase in DXA-derived areal BMD with
significant changes in these variables detectable by QCT at
6 months post-baseline [44]. Improvement in bone strength
with medication is related to both the location of structural
change as well as the degree of structural change. Auto-
mated anatomical coordinate systems, such as medical
image analysis framework (MIAF), allow one to appreciate
how geometric parameters and treatment affect trabecular
and cortical bone and the contribution to bone strength [45,
46]. For example, 1 year of ibandronate treatment led to
increased volumetric density in the subcortical and exten-
ded trabecular areas of the proximal femur as well as the
extended cortical and superior/inferior trabecular regions
of the vertebral body (Fig. 3), all of which are mechani-
cally significant areas [47].
High resolution peripheral quantitative CT (HR-pQCT)
The main limitations of volumetric CT are cost, clinical
accessibility, and radiation dose. It would be helpful if a
more dedicated peripheral CT unit could provide images of
high resolution at lower cost and lower radiation dose,
particularly if these peripheral parameters of bone quality
were shown to mirror those occurring more centrally in the
vertebrae or proximal femora. Such a HR-pQCT (Xtreme
CT, Scanco Medical AG, Basserdorf, Switzerland) has
become available allowing much higher resolution images
than standard peripheral QCT systems. HR-pQCT can
examine the distal radius or distal tibia in 2.8 min acquir-
ing a tack of 110 images over a 9 mm length with a
nominal isotropic voxel size of *90 lm (Fig. 4). Struc-
tural parameters acquired are trabecular number, thickness,
separation, structure model index, connectivity, anisotropy,
and cortical thickness with all structural parameters derived
from density measurements assuming a fixed mineraliza-
tion of 1,200 mg HA/cm3. Limitations of HR-pQCT are
movement artifact, particularly of the radius, and confine-
ment of imaging to the ultradistal radius or tibia. Although
Fig. 3 Volumetric QCT provides a basis for FEA of the proximal
femur. Note how stress distribution in the proximal femur as related to
color coding is greatest along the inferomedial aspect of the femoral
neck and proximal shaft (Courtesy of Klaus Engelke)
Fig. 4 High resolution peripheral CT (Xtreme CT) of distal tibia in
subject with a normal BMD and b severe osteoporosis. The
deterioration in trabecular architecture with reduced trabecular
number, trabecular thinning, increased trabecular spacing as well as
generalized cortical thinning and increased cortical porosity is readily
appreciable in the osteoporotic subject
Endocrine (2012) 42:39–51 43
123

the analysis programs for structural data are density-based,
and as such will strongly correlate with vBMD, the struc-
tural parameters obtained by HR-pQCT compare well with
those obtained by microCT. Good correlation
(r = 0.50–0.78) was also found between density and
stiffness parameters obtained peripherally by HR-pQCT
and centrally by vQCT [48].
Cross-sectional high resolution pQCT study has shown
how men have thicker trabeculae and tend to undergo
trabecular thinning rather than loss at the distal radius with
aging as opposed to women who tend to lose trabeculae
with an increase in trabecular spacing [49]. This enhances
information from standard peripheral QCT-based studies
showing how both sexes start to loss appendicular trabec-
ular bone in early adulthood with cortical bone loss
occurring later though considerably earlier in females than
males [50]. As decrease in trabecular number impacts bone
strength more than a decrease in thickness and as the distal
radial strength is quite cortical dependent, these studies can
help explain the higher distal radial fracture rate in elderly
females.
HR-pQCT techniques can be used to discriminate the
treatment effect of anti-resorptive agents with different
mechanisms of action [51]. For example, in a double blind
study, denosumab, a fully human monoclonal antibody to
Rank ligand (RANKL), prevented expected decline cortical
and trabecular BMD at the distal radius and tibia more than
alendronate (p \ 0.024) and led to a greater improvement
in polar moment of inertia [51].
Magnetic resonance imaging (MRI)
MRI has several advantages over CT in assessing bone
quality. It does not use ionizing radiation; it can obtain
image data directly in any orthogonal plane and has the
ability to investigate physiological aspects of bone such as
marrow fat content, marrow diffusion, marrow perfusion,
and water content. Its disadvantages, however, include
cost, resolution issues, considerable time requirement, and
more technically demanding data acquisition and analysis.
High resolution MR imaging of the central skeleton is
limited by signal to noise ratio (SNR) and resolution issues
aggravated by the persistence of hematopoietic marrow in
the axial skeleton as this contrasts less well with adjacent
trabeculae than marrow fat. Therefore, most in vivo MR
studies have addressed relatively superficial peripheral
sites such as the distal radius, distal tibia, and calcaneus as
these trabecular-rich areas are accessible to small high
resolution coils. Nearly all MR-derived structural param-
eters of the distal radius are better than DXA at differen-
tiating women with and without vertebral fracture [52].
However, with pulse sequence and coil optimization, the
proximal femur can be accessible for bone quality analysis
with high resolution images of the proximal femur
achievable with an in-plane resolution of 254 lm and a
minimal slice thickness of 500 lm [53, 54]. MRI of the
distal radius and inter-trochanteric proximal femoral tra-
becular structure revealed significant preservation of
apparent BV/TV, apparent trabecular number, and apparent
trabecular spacing in post-menopausal women treated with
calcitonin compared to a placebo group at 2 years [55].
Over the same time, no significant change in DXA BMD
was observed helping to explain an earlier study showing
substantial reduction in fracture risk with calcitonin despite
only a small increase in BMD [55, 56].
As well as analyzing the trabecular component of bone,
MR imaging has also been applied to the study of the bone
cortex. The amount of trabecular or cortical bone varies
considerably with cortical bone only accounting for 10 %
of vertebral body bone though 75 % of femoral neck bone
and 50 % of femoral inter-trochanteric bone [57]. As the
cortex looses bone, it becomes thinner and more porous.
Cortical porosity is a challenging parameter to measure in
vivo [58]. However, MRI allows a different approach in
that ultrashort echo-time imaging can quantify cortical
bone water content and one may be able to use cortical
water content as a surrogate marker of cortical porosity
[59]. Tibial cortical water content in patients with end-
stage chronic renal failure was found to be 135 % higher
than in pre-menopausal women and 43 % higher than in
post-menopausal women although no difference in cortical
BMD was found between the three groups indicating how
cortical water content may prove to be a better indicator of
cortical bone loss and cortical porosity than cortical BMD
[59].
MR also has the capability of assessing marrow fat
content, molecular diffusion, and marrow perfusion.
Although an inverse relationship between increasing mar-
row fat and trabecular bone loss in senile osteoporosis has
been long recognized, several recent findings have changed
the perception that marrow fat was simply a metabolically
inactive tissue filling the void vacated by trabecular bone
[60, 61]. First, marrow fat, haematopoetic marrow, and
trabecular bone mass are inextricably linked through dif-
ferentiation of a pluripotent mesenchymal stem cell which
has the ability to differentiate along adipocytic, haemato-
poetic, and osteocytic cell lines [62]. Second, marrow
adipocytes have been shown to be both potentially self-
promotive and metabolically active with existing adipo-
cytes inducing differentiation of further adipocytes while
actively suppressing osteoblastogenesis [63–66]. It is con-
ceivable, therefore, that marrow fat may be, at least in part,
driving bone loss and contributing to osteoporosis [65, 66].
Marrow fat content increases sharply in female subjects
between 55 and 65 years of age, while male subjects
continue to increase marrow fat at a more gradual steady
44 Endocrine (2012) 42:39–51
123
rate. This increased deposition in marrow fat concurs with
recognized changes in extraosseous fat distribution in post-
menopausal females [67, 68].
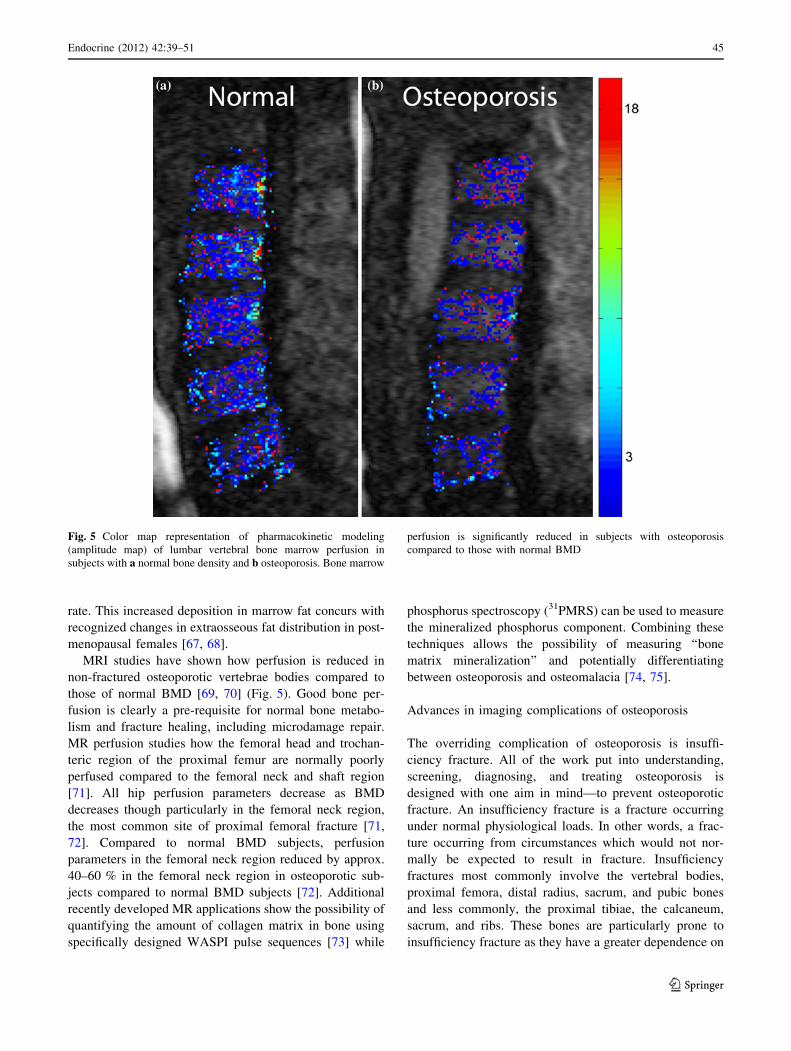
MRI studies have shown how perfusion is reduced in
non-fractured osteoporotic vertebrae bodies compared to
those of normal BMD [69, 70] (Fig. 5). Good bone per-
fusion is clearly a pre-requisite for normal bone metabo-
lism and fracture healing, including microdamage repair.
MR perfusion studies how the femoral head and trochan-
teric region of the proximal femur are normally poorly
perfused compared to the femoral neck and shaft region
[71]. All hip perfusion parameters decrease as BMD
decreases though particularly in the femoral neck region,
the most common site of proximal femoral fracture [71,
72]. Compared to normal BMD subjects, perfusion
parameters in the femoral neck region reduced by approx.
40–60 % in the femoral neck region in osteoporotic sub-
jects compared to normal BMD subjects [72]. Additional
recently developed MR applications show the possibility of
quantifying the amount of collagen matrix in bone using
specifically designed WASPI pulse sequences [73] while
phosphorus spectroscopy (31PMRS) can be used to measure
the mineralized phosphorus component. Combining these
techniques allows the possibility of measuring ‘‘bone
matrix mineralization’’ and potentially differentiating
between osteoporosis and osteomalacia [74, 75].
Advances in imaging complications of osteoporosis
The overriding complication of osteoporosis is insuffi-
ciency fracture. All of the work put into understanding,
screening, diagnosing, and treating osteoporosis is
designed with one aim in mind—to prevent osteoporotic
fracture. An insufficiency fracture is a fracture occurring
under normal physiological loads. In other words, a frac-
ture occurring from circumstances which would not nor-
mally be expected to result in fracture. Insufficiency
fractures most commonly involve the vertebral bodies,
proximal femora, distal radius, sacrum, and pubic bones
and less commonly, the proximal tibiae, the calcaneum,
sacrum, and ribs. These bones are particularly prone to
insufficiency fracture as they have a greater dependence on
Fig. 5 Color map representation of pharmacokinetic modeling
(amplitude map) of lumbar vertebral bone marrow perfusion in
subjects with a normal bone density and b osteoporosis. Bone marrow
perfusion is significantly reduced in subjects with osteoporosis
compared to those with normal BMD
Endocrine (2012) 42:39–51 45
123

trabecular bone for their strength (such as the vertebral
body) or they are located in areas where physical stress is
concentrated (‘‘stress riser’’). Insufficiency fractures differ
from standard traumatic fractures in that they are often
incremental in nature progressing over weeks or months
rather than occurring as a one-off, all or nothing, event.
Insufficiency fractures are important to recognize since
they provide indisputable evidence of reduced bone
strength. The easily applicable DXA T-score criteria for
diagnosing osteoporosis have become so entrenched into
clinical practice that the significance of insufficiency
fracture has been somewhat undervalued [76]. The pres-
ence of an insufficiency fracture overrides any information
from DXA examination with regard to the presence of
osteoporosis. For example, it is not correct to say that, in
the absence of other bone disorder, that a patient with an
insufficiency fracture does not have osteoporosis ‘‘as the
DXA T-score is [-2.5’’. For this reason, the National
Osteoporosis Foundation has recommended that patients
aged over 50 years with non-traumatic new vertebral
fracture receive appropriate bone protective/bone enhanc-
ing therapy, irrespective of DXA T-score [77]. One should,
however, not have to wait for an insufficiency fracture to
occur before diagnosing osteoporosis and hence the
ongoing quest to identify the osteoporotic process before
insufficiency fracture occurs.
Most insufficiency fractures are readily visible radio-
graphically at the time of clinical presentation. However,
since these fractures may primarily involve trabecular bone
and since trabecular bone is not easily assessed on radio-
graphs or CT, particularly when rarefied in osteoporosis,
insufficiency fractures may not always be visible radio-
graphically [78]. MRI has revolutionized clinical practice
regarding the recognition and characterization of
Fig. 6 a Radiograph and b CT of proximal femur show osteopenia
but no fracture in elderly patient with clinically suspected proximal
femoral fracture. c T1-weighted and d T2-weighted fat-suppressed
image clearly shows a fracture line extending along most the inter-
trochanteric area. This was successfully treated with screw fixation
46 Endocrine (2012) 42:39–51
123

insufficiency fractures leading to increased awareness of
this entity among health care professionals. The hallmarks
of an insufficiency fracture on MRI are localized bone
marrow edema usually, though not invariably, accompa-
nied by a hypointense linear fracture line.
The vast majority of vertebral fractures are detected
with radiography though increasingly these fractures are
being identified using VXA by DXA and on CT examin-
ations performed for thoraco-abdominal indications [79].
MRI allows detection of vertebral or other insufficiency
fracture at a very early stage, enables determination of
fracture age, and distinction between osteoporotic and
neoplastic fracture with greater sensitivity than other
imaging techniques [80]. Conversely, a normal MRI fully
excludes the presence of an insufficiency fracture. MR-
based perfusion parameters are reduced in osteoporotic
vertebral fractures compared to adjacent non-fractured
vertebrae [81]. The smaller the enhancement area within an
acutely fractured vertebral body, the more likely it will lose
height on subsequent follow-up [82]. MRI may also have
the potential to predict non-union which occurs in about
10 % of osteoporotic vertebral fractures and is associated
with more severe back pain than united fractures [83]. It is
feasible that these particular types of fracture may benefit
from pro-active fracture treatment such as vertebroplasty.
About 10 % of osteoporotic neck of femur fractures are
radiographically occult [84]. Similarly, other fractures
around the pelvis (acetabulum, pubic rami, sacrum), joint
pathology or soft tissue injury can masquerade clinically as
a proximal femoral fracture. MRI will consistently dem-
onstrate fractures in approx. 40 % of those patients with
clinically suspected neck of femur fracture though no
fracture visible on radiographs [85] and is more sensitive
than CT or bone scintigraphy is this respect [86] (Fig. 6).
The MR protocol used is straightforward making it rela-
tively easy to schedule these examinations within 24 h of
admission [87]. Previously, these patients would have been
discharged from hospital only to return in 1–2 weeks with
a displaced neck of femur fracture [84]. In those cases in
whom MRI does not reveal a neck of femur fracture, MRI
Fig. 7 a T2-weighted fat-
suppressed oblique coronal MR
images in elderly patient with
recent onset of hip pain show
subchondral fracture of femoral
head (arrow) and b diffuse
marrow edema of proximal
femur (asterisk). Radiograph
(not shown) revealed osteopenia
but no fracture. c T1-weighted
and d fat-suppressed MR
oblique coronal MR image after
6 weeks of limited weight
bearing show persistence of
subchondral fracture (arrows)
though resolution of marrow
edema consistent with healing
response
Endocrine (2012) 42:39–51 47
123

will usually demonstrate other pelvic fractures (acetabular,
pubic rami or sacrum) or injury (such as osteonecrosis,
hematoma, muscle or tendon injury) to account for symp-
toms [85, 87]. MRI is also beneficial in patients whom
fractures seem confined to the greater trochanter on
radiographs as the majority will be seen on MRI to have
inter-trochanteric fracture extension necessitating surgical
fixation [88].
A less frequently seen complication of osteoporosis is
subchondral insufficiency fracture of the femoral head or
proximal tibia [89]. These fractures are usually radio-
graphically occult though can be readily seen on MRI as a
serpiginous thin T1-hypointense line convex to the femoral
head articular surface [90] (Fig. 7). This line represents the
fracture line surrounded by granulation tissue and marrow
edema and will enhance on MRI [91]. Early recognition of
these fractures by MRI is important since non-weight
bearing can lead to alleviation of symptoms. Conversely,
failure to recognize and treat these subchondral insuffi-
ciency fractures may result in them progressing to rapid
dissolution of the femoral head or tibial condyle [92].
Sacral insufficiency fractures are a quite common cause
of debilitating back pain in the elderly, often associated
with a delay in diagnosis since symptoms mimic those of
degenerative disk disease or radiculopathy. Most are not
visible radiographically [93, 94] though bone scintigraphy,
CT or MRI can detect and classify these fracture with high
specificity [86, 94] (Fig. 8). Fracture line orientation,
which is typically vertical along the sacral ala with an
occasional horizontal component is best depicted by CT.
CT can also determine fracture healing and, in the research
setting, FEA assessment [94] (Fig. 9). Sacroplasty with
injection of bone cement into the fracture line under image
guidance has recently been introduced as a means to treat
sacral insufficiency fracture, though is probably best
reserved for those fractures not responding to conservative
treatment. One problem with sacroplasty, which also
Fig. 8 Axial CT showing insufficiency fracture of both sacral ala
(arrows) on background of osteoporotic bone
Fig. 9 Finite element model of hemisacrum constructed from
cadaveric CT data in patient with a normal sacrum and b fractured
sacrum. The arrow in Fig. 9b represents the fracture propagation line.
c After simulated application of a 35 kg load, the stress (kPa)
concentration around the fracture line, especially distally can be
appreciated (open arrows). (Courtesy of Pearse Morris)
48 Endocrine (2012) 42:39–51
123

applies to vertebroplasty, is that these processes interfere
with normal fracture healing.
In conclusion, one can appreciate the tremendous
advances made over the past two decades in assessing
osteoporosis and its complications. High resolution imag-
ing combined with sophisticated computational techniques
can now directly predict bone strength and provide a
detailed analysis of bone structure. Yet limitations peculiar
to each of these techniques currently hinder adoption into
mainstream clinical practice. The ultimate quest for bone
quality imaging remains an available, safe, high resolution
technique capable of fully predicting bone strength, capa-
ble of showing how bone strength is faltering and precisely
monitoring treatment effect. Whether this technique will be
based on acquisition of spine/hip data or reflective
peripheral data is still not clear. When such a technique
evolves, alongside the possibility of mechanistic-specific
treatment options, the occurrence of debilitating insuffi-
ciency fracture in the middle-aged and elderly will con-
siderably lessen. In the meantime, mainstream imaging will
continue to enhance the detection of insufficiency fracture,
though until then, we should all be aiming to improve
general awareness of this fracture type as a marker of
severely impaired bone strength.
References
1. G. Mazziotti, J. Bilezikian, E. Canalis, D. Cocchi, A. Giustina,
New understanding and treatments for osteoporosis. Endocrine
41, 58–69 (2012)
2. J. Compston, The use of combination therapy in the treatment of
postmenopausal osteoporosis. Endocrine 41, 11–18 (2012)
3. World Health Organisation, Assessment of fracture risk and its
implication to screening for postmenopausal osteoporosis. World
Health Organ. Tech. Rep. Ser. 843, 1–129 (1994)
4. H.S. Lynn, E.M. Lau, B. Au, P.C. Leung, Bone mineral density
reference norms for Hong Kong Chinese. Osteoporos. Int. 16,
1663–1668 (2005)
5. E.W. Yu, B.J. Thomas, J.K. Brown, J.S. Finkelstein, Simulated
increases in body fat and errors in bone mineral density mea-
surements by DXA and QCT. J. Bone Miner. Res. (2011). doi:
10.1002/jbmr.506
6. G.M. Blake, J.F. Griffith, D.K. Yeung, P.C. Leung, I. Fogelman,
Effect of increasing vertebral marrow fat content on BMD
measurement, T-score status and fracture risk prediction by DXA.
Bone 44, 495–501 (2009)
7. D. Marshall, O. Johnell, H. Wedel, Meta-analysis of how well
measures of bone mineral density predict occurrence of osteo-
porotic fractures. BMJ 312, 1254–1259 (1996)
8. J.A. Kanis, An update on the diagnosis of osteoporosis. Curr.
Rheumatol. Rep. 2, 62–66 (2000)
9. NIH Consensus Development Panel on Osteoporosis Prevention,
Diagnosis, and Therapy, Osteoporosis prevention, diagnosis, and
therapy. JAMA 285, 785–795 (2001)
10. E. Sornay-Rendu, F. Munoz, P. Garnero, F. Duboeuf, P.D. Del-
mas, Identification of osteopenic women at high risk of fracture:
the OFELY study. J. Bone Miner. Res. 20, 1813–1819 (2005)
11. S.C. Schuit, M. van der Klift, A.E. Weel, C.E. de Laet, H. Burger,
E. Seeman, A. Hofman, A.G. Uitterlinden, J.P. van Leeuwen,
H.A. Pols, Fracture incidence and association with bone mineral
density in elderly men and women: the Rotterdam Study. Bone
38, 603 (2006)
12. S.R. Cummings, D.B. Karpf, F. Harris, H.K. Genant, K. Ensrud,
A.Z. LaCroix, D.M. Black, Improvement in spine bone density
and reduction in risk of vertebral fractures during treatment with
antiresorptive drugs. Am. J. Med. 112, 281–289 (2002)
13. P.D. Delmas, Z. Li, C. Cooper, Relationship between changes in
bone mineral density and fracture risk reduction with antire-
sorptive drugs: some issues with meta-analyses. J. Bone Miner.
Res. 19, 330–337 (2004)
14. J.T. Schousboe, T. Vokes, S.B. Broy, L. Ferrar, F. McKiernan, C.
Roux, N. Binkley, Vertebral fracture assessment: the 2007 ISCD
official positions. J. Clin. Densitom. 11, 92–108 (2008)
15. J.A. Kanis, O. Johnell, A. Oden, H. Johansson, E. McCloskey,
FRAX and the assessment of fracture probability in men and
women from the UK. Osteoporos. Int. 19, 385–397 (2008)
16. A.S. Karlamangla, E. Barrett-Connor, J. Young, G.A. Greendale,
Hip fracture risk assessment using composite indices of femoral
neck strength: the Rancho Bernardo study. Osteoporos. Int. 15,
62–70 (2004)
17. N. Yu, Y.J. Liu, Y. Pei, L. Zhang, S. Lei, N.R. Kothari, D.Y. Li,
C.J. Papasian, J. Hamilton, J.Q. Cai, H.W. Deng, Evaluation of
compressive strength index of the femoral neck in Caucasians and
Chinese. Calcif. Tissue Int. 87, 324–332 (2010)
18. K.G. Faulkner, W.K. Wacker, H.S. Barden, C. Simonelli, P.K.
Burke, S. Ragi, L. Del Rio, Femur strength index predicts hip
fracture independent of bone density and hip axis length. Os-
teoporos. Int. 17, 593–599 (2006)
19. S. Ishii, J.A. Cauley, C.J. Crandall, P. Srikanthan, G.A. Green-
dale, M.H. Huang, M.E. Danielson, A.S. Karlamangla, Diabetes
and femoral neck strength: findings from the hip strength across
the menopausal transition study. J. Clin. Endocrinol. Metab. 97,
190–197 (2012)
20. S. Kolta, A. Le Bras, D. Mitton, V. Bousson, J.A. de Guise, J.
Fechtenbaum, J.D. Laredo, C. Roux, W. Skalli, Three-dimen-
sional X-ray absorptiometry (3D-XA): a method for reconstruc-
tion of human bones using a dual X-ray absorptiometry device.
Osteoporos. Int. 16, 969–976 (2005)
21. A. Le Bras, S. Kolta, P. Soubrane, W. Skalli, C. Roux, D. Mitton,
Assessment of femoral neck strength by 3-dimensional X-ray
absorptiometry. J. Clin. Densitom. 9, 425–430 (2006)
22. O. Ahmad, K. Ramamurthi, K.E. Wilson, K. Engelke, R.L.
Prince, R.H. Taylor, Volumetric DXA (VXA): a new method to
extract 3D information from multiple in vivo DXA images.
J. Bone Miner. Res. 25, 2744–2751 (2011). Erratum in: J. Bone
Miner. Res. 26, 439 (2011)
23. A. Andreoli, A. De Lorenzo, F. Cadeddu, L. Iacopino, M.
Grande, New trends in nutritional status assessment of cancer
patients. Eur. Rev. Med. Pharmacol. Sci. 15, 469–480 (2011)
24. Bazzocchi A, Ciccarese F, Diano D, Spinnato P, Albisinni U,
Rossi C, Guglielmi G. Dual-Energy X-ray Absorptiometry in the
Evaluation of Abdominal Aortic Calcifications J. Clin. Densitom.
15, 198–204 (2012)
25. J.F. Griffith, S.M. Kumta, Y. Huang, Hard arteries, weak bones.
Skeletal Radiol. 40, 517–521 (2011)
26. H.K. Genant, K. Engelke, S. Prevrhal, Advanced CT bone
imaging in osteoporosis. Rheumatology (Oxford) 47, iv9–16
(2008)
27. E. Seeman, The structural basis of bone fragility in men. Bone 25,
143–147 (1999)
28. Y. Duan, X.F. Wang, A. Evans, E. Seeman, Structural and bio-
mechanical basis of racial and sex differences in vertebral fra-
gility in Chinese and Caucasians. Bone 36, 987–998 (2005)
Endocrine (2012) 42:39–51 49
123

29. M.L. Bouxsein, E. Seeman, Quantifying the material and struc-
tural determinants of bone strength. Best Pract. Res. Clin.
Rheumatol. 23, 741–753 (2009)
30. B.L. Riggs, L.J. Melton 3rd, R.A. Robb, J.J. Camp, E.J. Atkinson,
J.M. Peterson, P.A. Rouleau, C.H. McCollough, M.L. Bouxsein,
S. Khosla, Population-based study of age and sex differences in
bone volumetric density, size, geometry, and structure at different
skeletal sites. J. Bone Miner. Res. 19, 1945–1954 (2004)
31. H.K. Genant, M. Jergas, L. Palermo, M. Nevitt, R.S. Valentin, D.
Black, S.R. Cummings, Comparison of semiquantitative visual
and quantitative morphornetric assessment of prevalent and
incident vertebral fractures in osteoporosis The Study of Osteo-
porotic Fractures Research Group. J. Bone Miner. Res. 11,
984–996 (1996)
32. X. Banse, J.P. Devogelaer, M. Grynpas, Patient-specific mic-
roarchitecture of vertebral cancellous bone: a peripheral quanti-
tative computed tomographic and histological study. Bone 30,
829–835 (2002)
33. B.A. Christiansen, M.L. Bouxsein, Biomechanics of vertebral
fractures and the vertebral fracture cascade. Curr. Osteoporos.
Rep. 8, 198–204 (2010)
34. A.J. Fields, G.L. Lee, X.S. Liu, M.G. Jekir, X.E. Guo, T.M.
Keaveny, Influence of vertical trabeculae on the compressive
strength of the human vertebra. J. Bone Miner. Res. 26, 263–269
(2011)
35. J.S. Thomsen, E.N. Ebbesen, L.I. Mosekilde, Age-related dif-
ferences between thinning of horizontal and vertical trabeculae in
human lumbar bone as assessed by a new computerized method.
Bone 31, 136–142 (2002)
36. X. Shi, X.S. Liu, X. Wang, X.E. Guo, G.L. Niebur, Effects of
trabecular type and orientation on microdamage susceptibility in
trabecular bone. Bone 46, 1260–1266 (2010)
37. P. Mc Donnell, N. Harrison, M.A. Liebschner, P.E. Mc Hugh,
Simulation of vertebral trabecular bone loss using voxel finite
element analysis. J. Biomech. 42, 2789–2796 (2009)
38. T.M. Keaveny, Biomechanical computed tomography—nonin-
vasive bone strength analysis using clinical computed tomogra-
phy scans. Ann. N. Y. Acad. Sci. 1192, 57–65 (2010)
39. B.A. Christiansen, D.L. Kopperdahl, D.P. Kiel, T.M. Keaveny,
M.L. Bouxsein, Mechanical contributions of the cortical and
trabecular compartments contribute to differences in age-related
changes in vertebral body strength in men and women assessed
by QCT-based finite element analysis. J. Bone Miner. Res. 26,
974–983 (2011)
40. K.M. Kim, J.K. Brown, K.J. Kim, H.S. Choi, H.N. Kim, Y. Rhee,
S.K. Lim, Differences in femoral neck geometry associated with
age and ethnicity. Osteoporos. Int. 22, 2165–2174 (2011)
41. R.D. Carpenter, S. Sigurdsson, S. Zhao, Y. Lu, G. Eiriksdottir, G.
Sigurdsson, B.Y. Jonsson, S. Prevrhal, T.B. Harris, K. Siggeirs-
dottir, V. Guðnason, T.F. Lang, Effects of age and sex on the
strength and cortical thickness of the femoral neck. Bone 48,
741–747 (2011)
42. S. Amin, D.L. Kopperdhal, L.J. Melton 3rd, S.J. Achenbach,
T.M. Therneau, B.L. Riggs, T.M. Keaveny, S. Khosla, Associa-
tion of hip strength estimates by finite-element analysis with
fractures in women and men. J. Bone Miner. Res. 26, 1593–1600
(2011)
43. T.M. Keaveny, D.L. Kopperdahl, L.J. Melton 3rd, P.F. Hoff-
mann, S. Amin, B.L. Riggs, S. Khosla, Age-dependence of
femoral strength in white women and men. J. Bone Miner. Res.
25, 994–1001 (2010)
44. C. Graeff, Y. Chevalier, M. Charlebois, P. Varga, D. Pahr, T.N.
Nickelsen, M.M. Morlock, C.C. Gluer, P.K. Zysset, Improve-
ments in vertebral body strength under teriparatide treatment
assessed in vivo by finite element analysis: results from the
EUROFORS study. J. Bone Miner. Res. 24, 1672–1680 (2009)
45. Y. Kang, K. Engelke, C. Fuchs, W.A. Kalender, An anatomic
coordinate system of the femoral neck for highly reproducible
BMD measurements using 3D QCT. Comput. Med. Imaging
Graph 29, 533–541 (2005)
46. K. Engelke, A. Mastmeyer, V. Bousson, T. Fuerst, J.D. Laredo,
W.A. Kalender, Reanalysis precision of 3D quantitative com-
puted tomography (QCT) of the spine. Bone 44, 566–572 (2009)
47. K. Engelke, T. Fuerst, G. Dasic, R.Y. Davies, H.K. Genant,
Regional distribution of spine and hip QCT BMD responses after
one year of once-monthly ibandronate in postmenopausal osteo-
porosis. Bone 46, 1626–1632 (2010)
48. X.S. Liu, A. Cohen, E. Shane, P.T. Yin, E.M. Stein, H. Rogers,
S.L. Kokolus, D.J. McMahon, J.M. Lappe, R.R. Recker, T. Lang,
X.E. Guo, Bone density, geometry, microstructure, and stiffness:
Relationships between peripheral and central skeletal sites
assessed by DXA, HR-pQCT, and cQCT in premenopausal
women. J. Bone Miner. Res. 25, 2229–2238 (2010)
49. S. Khosla, B.L. Riggs, E.J. Atkinson, A.L. Oberg, L.J. McDaniel,
M. Holets, J.M. Peterson, L.J. Melton 3rd, Effects of sex and age
on bone microstructure at the ultradistal radius: a population-
based noninvasive in vivo assessment. J. Bone Miner. Res. 21,
124–131 (2006)
50. B.L. Riggs, L.J. Melton, R.A. Robb, J.J. Camp, E.J. Atkinson, L.
McDaniel, S. Amin, P.A. Rouleau, S. Khosla, A population-based
assessment of rates of bone loss at multiple skeletal sites: evi-
dence for substantial trabecular bone loss in young adult women
and men. J. Bone Miner. Res. 23, 205–214 (2008)
51. E. Seeman, P.D. Delmas, D.A. Hanley, D. Sellmeyer, A.M.
Cheung, E. Shane, A. Kearns, T. Thomas, S.K. Boyd, S. Boutroy,
C. Bogado, S. Majumdar, M. Fan, C. Libanati, J. Zanchetta,
Microarchitectural deterioration of cortical and trabecular bone:
differing effects of denosumab and alendronate. J. Bone Miner.
Res. 25, 1886–1894 (2010)
52. R. Krug, J. Carballido-Gamio, A.J. Burghardt, G. Kazakia, B.H.
Hyun, B. Jobke, S. Banerjee, M. Huber, T.M. Link, S. Majumdar,
Assessment of trabecular bone structure comparing magnetic
resonance imaging at 3 Tesla with high-resolution peripheral
quantitative computed tomography ex vivo and in vivo. Osteo-
poros. Int. 19, 653–661 (2008)
53. F.W. Wehrli, M.B. Leonard, P.K. Saha, B.R. Gomberg, Quanti-
tative high-resolution magnetic resonance imaging reveals
structural implications of renal osteodystrophy on trabecular and
cortical bone. J. Magn. Reson. Imaging 20, 83–89 (2004)
54. R. Krug, S. Banerjee, E.T. Han, D.C. Newitt, T.M. Link, S.
Majumdar, Feasibility of in vivo structural analysis of high-res-
olution magnetic resonance images of the proximal femur. Os-
teoporos. Int. 16, 1307–1314 (2005). Erratum in: Osteoporos. Int.
17, 1705 (2006)
55. C.H. Chesnut 3rd, S. Majumdar, D.C. Newitt, A. Shields, J. Van
Pelt, E. Laschansky, M. Azria, A. Kriegman, M. Olson, E.F.
Eriksen, L. Mindeholm, Effects of salmon calcitonin on trabec-
ular microarchitecture as determined by magnetic resonance
imaging: results from the QUEST study. J. Bone Miner. Res. 20,
1548–1561 (2005)
56. C.H. Chesnut 3rd, S. Silverman, K. Andriano, H. Genant, A.
Gimona, S. Harris, D. Kiel, M. LeBoff, M. Maricic, P. Miller, C.
Moniz, M. Peacock, P. Richardson, N. Watts, D. Baylink, A
randomized trial of nasal spray salmon calcitonin in postmeno-
pausal women with established osteoporosis: the prevent recur-
rence of osteoporotic fractures study. PROOF Study Group. Am.
J. Med. 109, 267–276 (2000)
57. R. Krug, A.J. Burghardt, S. Majumdar, T.M. Link, High-resolu-
tion imaging techniques for the assessment of osteoporosis.
Radiol. Clin. North Am. 48, 601–621 (2010)
58. V. Bousson, C. Bergot, A. Meunier, F. Barbot, C. Parlier-Cuau,
A.M. Laval-Jeantet, J.D. Laredo, CT of the middiaphyseal femur:
50 Endocrine (2012) 42:39–51
123

cortical bone mineral density and relation to porosity. Radiology
217, 179–187 (2000)
59. A. Techawiboonwong, H.K. Song, M.B. Leonard, F.W. Wehrli,
Cortical bone water: in vivo quantification with ultrashort echo-
time MR imaging. Radiology 248, 824–833 (2008)
60. P. Meunier, J. Aaron, C. Edouard, G. Vignon, Osteoporosis and
the replacement of cell populations of the marrow by adipose
tissue. A quantitative study of 84 iliac bone biopsies. Clin. Ort-
hop. Relat. Res. 80, 147–154 (1971)
61. J.M. Gimble, C.E. Robinson, X. Wu, K.A. Kelly, The function of
adipocytes in the bone marrow stroma: an update. Bone 19,
421–428 (1996)
62. M.F. Pittenger, A.M. Mackay, S.C. Beck, R.K. Jaiswal, R.
Douglas, J.D. Mosca, M.A. Moorman, D.W. Simonetti, S. Craig,
D.R. Marshak, Multilineage potential of adult human mesen-
chymal stem cells. Science 284, 143–147 (1999)
63. B. Lecka-Czernik, E.J. Moerman, D.F. Grant, J.M. Lehmann,
S.C. Manolagas, R.L. Jilka, Divergent effects of selective per-
oxisome proliferator-activated receptor-gamma 2 ligands on
adipocyte versus osteoblast differentiation. Endocrinology 143,
2376–2384 (2002)
64. J.M. Gimble, M.E. Nuttall, Bone and fat: old questions, new
insights. Endocrine 23, 183–188 (2004)
65. G. Duque, Bone and fat connection in aging bone. Curr. Opin.
Rheumatol. 20, 429–434 (2008)
66. C.J. Rosen, C. Ackert-Bicknell, J.P. Rodriguez, A.M. Pino,
Marrow fat and the bone microenvironment: developmental,
functional, and pathological implications. Crit. Rev. Eukaryot.
Gene Expr. 19, 109–124 (2009)
67. M.J. Toth, A. Tchernof, C.K. Sites, E.T. Poehlman, Menopause-
related changes in body fat distribution. Ann. N. Y. Acad. Sci.
904, 502–506 (2000)
68. K. Blouin, A. Boivin, A. Tchernof, Androgens and body fat
distribution. J. Steroid Biochem. Mol. Biol. 108, 272–280 (2008)
69. J.F. Griffith, D.K. Yeung, G.E. Antonio, F.K. Lee, A.W. Hong,
S.Y. Wong, E.M. Lau, P.C. Leung, Vertebral bone mineral
density, marrow perfusion, and fat content in healthy men and
men with osteoporosis: dynamic contrast-enhanced MR imaging
and MR spectroscopy. Radiology 236, 945–951 (2005)
70. J.F. Griffith, D.K. Yeung, G.E. Antonio, S.Y. Wong, T.C. Kwok,
J. Woo, P.C. Leung, Vertebral marrow fat content and diffusion
and perfusion indexes in women with varying bone density: MR
evaluation. Radiology 241, 831–838 (2006)
71. J.F. Griffith, D.K. Yeung, P.H. Tsang, K.C. Choi, T.C. Kwok,
A.T. Ahuja, K.S. Leung, P.C. Leung, Compromised bone marrow
perfusion in osteoporosis. J. Bone Miner. Res. 23, 1068–1075
(2008)
72. Y.X. Wang, J.F. Griffith, A.W. Kwok, J.C. Leung, D.K. Yeung,
A.T. Ahuja, P.C. Leun, Reduced bone perfusion in proximal
femur of subjects with decreased bone mineral density prefer-
entially affects the femoral neck. Bone 45, 711–715 (2009)
73. H. Cao, J.L. Ackerman, M.I. Hrovat, L. Graham, M.J. Glimcher,
Y. Wu, Quantitative bone matrix density measurement by water-
and fat-suppressed proton projection MRI (WASPI) with polymer
calibration phantoms. Magn. Reson. Med. 60, 1433–1443 (2008)
74. H. Cao, A. Nazarian, J.L. Ackerman, B.D. Snyder, A.E. Rosen-
berg, R.M. Nazarian, M.I. Hrovat, G. Dai, D. Mintzopoulos, Y.
Wu, Quantitative (31)P NMR spectroscopy and (1)H MRI mea-
surements of bone mineral and matrix density differentiate met-
abolic bone diseases in rat models. Bone 46, 1582–1590 (2010)
75. Y. Wu, M.I. Hrovat, J.L. Ackerman, T.G. Reese, H. Cao, K. Ec-
klund, M.J. Glimcher, Bone matrix imaged in vivo by water- and
fat-suppressed proton projection MRI (WASPI) of animal and
human subjects. J. Magn. Reson. Imaging 31, 954–963 (2010)
76. P.D. Delmas, L. van de Langerijt, N.B. Watts, R. Eastell, H.
Genant, A. Grauer, D.L. Cahall, IMPACT Study Group,
underdiagnosis of vertebral fractures is a worldwide problem: the
IMPACT study. J. Bone Miner. Res. 20, 557–563 (2005)
77. National Osteoporosis Foundation, The Clinician’s Guide to
Prevention and Treatment of Osteoporosis. National Osteoporosis
Foundation. Washington, DC, USA. (2010) [http://www.nof.org/
sites/default/files/pdfs/NOF_ClinicianGuide2009_v7.pdf]
78. C.R. Krestan, U. Nemec, S. Nemec, Imaging of insufficiency
fractures. Semin. Musculoskelet. Radiol. 15, 198–207 (2011)
79. A.L. Williams, A. Al-Busaidi, P.J. Sparrow, J.E. Adams, R.W.
Whitehouse, Under-reporting of osteoporotic vertebral fractures
on computed tomography. Eur. J. Radiol. 69, 179–183 (2009)
80. J.F. Griffith, G. Guglielmi, Vertebral fracture. Radiol. Clin. North
Am. 48, 519–529 (2010)
81. A. Biffar, G.P. Schmidt, S. Sourbron, M. D’Anastasi, O. Dietrich, M.
Notohamiprodjo, M.F. Reiser, A. Baur-Melnyk, Quantitative anal-
ysis of vertebral bone marrow perfusion using dynamic contrast-
enhanced MRI: initial results in osteoporotic patients with acute
vertebral fracture. J. Magn. Reson. Imaging 33, 676–683 (2011)
82. T. Kanchiku, T. Taguchi, K. Toyoda, K. Fujii, S. Kawai,
Dynamic contrast-enhanced magnetic resonance imaging of
osteoporotic vertebral fracture. Spine 28, 2522–2526 (2003)
83. T. Tsujio, H. Nakamura, H. Terai, M. Hoshino, T. Namikawa, A.
Matsumura, M. Kato, A. Suzuki, K. Takayama, W. Fukushima,
K. Kondo, Y. Hirota, K. Takaoka, Characteristic radiographic or
magnetic resonance images of fresh osteoporotic vertebral frac-
tures predicting potential risk for nonunion: a prospective mul-
ticenter study. Spine 36, 1229–1235 (2011)
84. G. Pathak, M.J. Parker, G.A. Pryor, Delayed diagnosis of femoral
neck fractures. Injury 28, 299–301 (1997)
85. H.A. Chatha, S. Ullah, Z.Z. Cheema, Review article: Magnetic
resonance imaging and computed tomography in the diagnosis of
occult proximal femur fractures. J. Orthop. Surg. (Hong Kong)
19, 99–103 (2011)
86. M.C. Cabarrus, A. Ambekar, Y. Lu, T.M. Link, MRI and CT of
insufficiency fractures of the pelvis and the proximal femur. AJR
Am. J. Roentgenol. 191, 995–1001 (2008)
87. Y.P. Lee, J.F. Griffith, G.E. Antonio, N. Tang, K.S. Leung, Early
magnetic resonance imaging of radiographically occult osteopo-
rotic fractures of the femoral neck. Hong Kong Med. J. 10,
271–275 (2004)
88. J.G. Craig, B.R. Moed, W.R. Eyler, M. van Holsbeeck, Fractures
of the greater trochanter: intertrochanteric extension shown by
MR imaging. Skeletal Radiol. 29, 572–576 (2000)
89. T. Yamamoto, Y. Iwamoto, R. Schneider, P.G. Bullough, His-
topathological prevalence of subchondral insufficiency fracture of
the femoral head. Ann. Rheum. Dis. 67, 150–153 (2008)
90. G. Zhao, T. Yamamoto, S. Ikemura, Y. Nakashima, T. Mawatari,
G. Motomura, Y. Iwamoto, A histopathological evaluation of a
concave-shaped low-intensity band on T1-weighted MR images
in a subchondral insufficiency fracture of the femoral head.
Skeletal Radiol. 39, 185–188 (2010)
91. K. Miyanishi, T. Hara, S. Kaminomachi, H. Maeda, H. Watanabe,
T. Torisu, Contrast-enhanced MR imaging of subchondral
insufficiency fracture of the femoral head: a preliminary com-
parison with that of osteonecrosis of the femoral head. Arch.
Orthop. Trauma Surg. 129, 583–589 (2009)
92. T. Yamamoto, K. Takabatake, Y. Iwamoto, Subchondral insuf-
ficiency fracture of the femoral head resulting in rapid destruction
of the hip joint: a sequential radiographic study. AJR Am.
J. Roentgenol. 178, 435–437 (2002)
93. R. Schneider, J. Yacovone, B. Ghelman, Unsuspected sacral
fractures: detection by radionuclide bone scanning. AJR Am.
J. Roentgenol. 144, 337–341 (1985)
94. E.M. Lyders, C.T. Whitlow, M.D. Baker, P.P. Morris, Imaging
and treatment of sacral insufficiency fractures. AJNR Am.
J. Neuroradiol. 31, 201–210 (2010)
Endocrine (2012) 42:39–51 51
123


![Review Articledownloads.hindawi.com/journals/jl/2012/365798.pdf · Others menopause-associated complications include in-creased cardiovascular risk (see below), osteoporosis [11]](https://static.fdocuments.in/doc/165x107/5fd8ace6d8adf740195098b7/review-others-menopause-associated-complications-include-in-creased-cardiovascular.jpg)