
New 3D Model of Capel and Faust basins released · The Capel and Faust 3D geological model is...
4
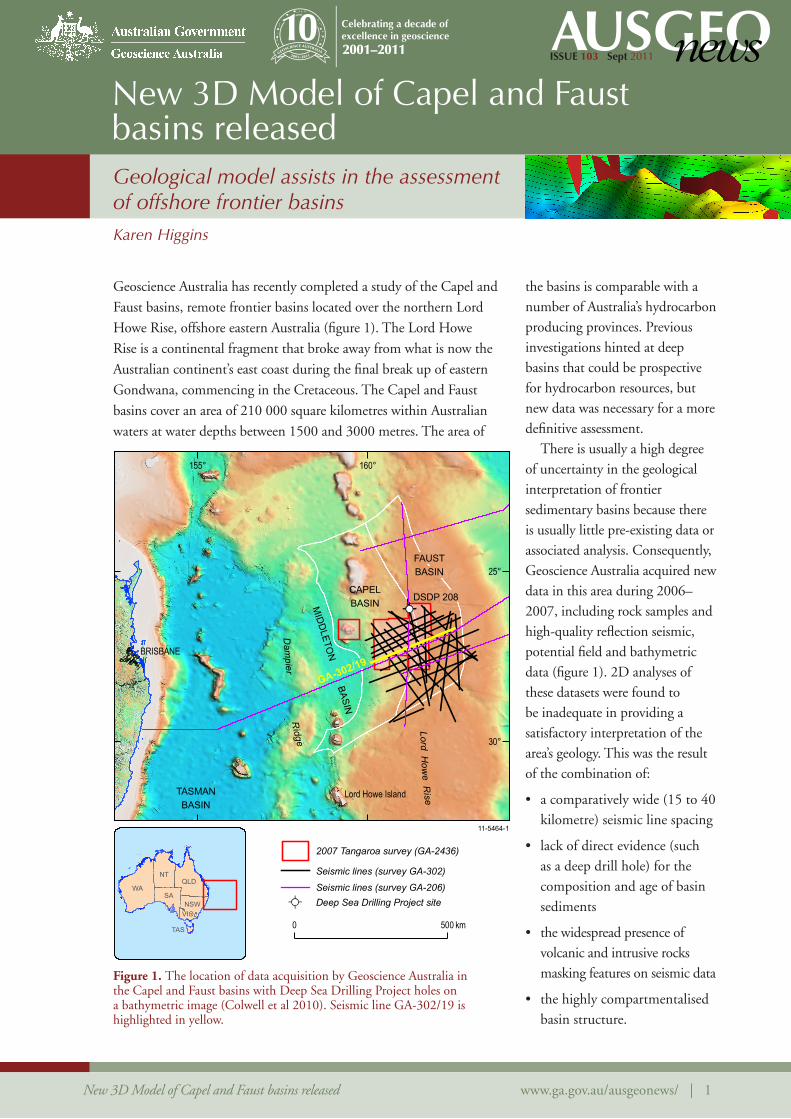
ISSUE 103 Sept 2011 New 3D Model of Capel and Faust basins released www.ga.gov.au/ausgeonews/ | 1 New 3D Model of Capel and Faust basins released Karen Higgins Geological model assists in the assessment of offshore frontier basins Geoscience Australia has recently completed a study of the Capel and Faust basins, remote frontier basins located over the northern Lord Howe Rise, offshore eastern Australia (figure 1). The Lord Howe Rise is a continental fragment that broke away from what is now the Australian continent’s east coast during the final break up of eastern Gondwana, commencing in the Cretaceous. The Capel and Faust basins cover an area of 210 000 square kilometres within Australian waters at water depths between 1500 and 3000 metres. The area of the basins is comparable with a number of Australia’s hydrocarbon producing provinces. Previous investigations hinted at deep basins that could be prospective for hydrocarbon resources, but new data was necessary for a more definitive assessment. There is usually a high degree of uncertainty in the geological interpretation of frontier sedimentary basins because there is usually little pre-existing data or associated analysis. Consequently, Geoscience Australia acquired new data in this area during 2006– 2007, including rock samples and high-quality reflection seismic, potential field and bathymetric data (figure 1). 2D analyses of these datasets were found to be inadequate in providing a satisfactory interpretation of the area’s geology. This was the result of the combination of: • a comparatively wide (15 to 40 kilometre) seismic line spacing • lack of direct evidence (such as a deep drill hole) for the composition and age of basin sediments • the widespread presence of volcanic and intrusive rocks masking features on seismic data • the highly compartmentalised basin structure. Figure 1. The location of data acquisition by Geoscience Australia in the Capel and Faust basins with Deep Sea Drilling Project holes on a bathymetric image (Colwell et al 2010). Seismic line GA-302/19 is highlighted in yellow. DSDP 208 CAPEL BASIN FAUST BASIN L o r d H o w e R i s e D a m p i e r R i dg e BRISBANE GA-302/19 Lord Howe Island TASMAN BASIN M I DD L ETO N B A S IN 160° 155° 25° 30° 11-5464-1 0 500 km SA WA QLD NSW TAS VIC NT Seismic lines (survey GA-206) Seismic lines (survey GA-302) 2007 Tangaroa survey (GA-2436) Deep Sea Drilling Project site
Transcript of New 3D Model of Capel and Faust basins released · The Capel and Faust 3D geological model is...
ISSUE 103 Sept 2011
New 3D Model of Capel and Faust basins released www.ga.gov.au/ausgeonews/ | 1
New 3D Model of Capel and Faust basins released
Karen Higgins
Geological model assists in the assessment of offshore frontier basins
Geoscience Australia has recently completed a study of the Capel and
Faust basins, remote frontier basins located over the northern Lord
Howe Rise, offshore eastern Australia (figure 1). The Lord Howe
Rise is a continental fragment that broke away from what is now the
Australian continent’s east coast during the final break up of eastern
Gondwana, commencing in the Cretaceous. The Capel and Faust
basins cover an area of 210 000 square kilometres within Australian
waters at water depths between 1500 and 3000 metres. The area of
the basins is comparable with a number of Australia’s hydrocarbon producing provinces. Previous investigations hinted at deep basins that could be prospective for hydrocarbon resources, but new data was necessary for a more definitive assessment.
There is usually a high degree of uncertainty in the geological interpretation of frontier sedimentary basins because there is usually little pre-existing data or associated analysis. Consequently, Geoscience Australia acquired new data in this area during 2006–2007, including rock samples and high-quality reflection seismic, potential field and bathymetric data (figure 1). 2D analyses of these datasets were found to be inadequate in providing a satisfactory interpretation of the area’s geology. This was the result of the combination of:
• a comparatively wide (15 to 40 kilometre) seismic line spacing
• lack of direct evidence (such as a deep drill hole) for the composition and age of basin sediments
• the widespread presence of volcanic and intrusive rocks masking features on seismic data
• the highly compartmentalised basin structure.
Figure 1. The location of data acquisition by Geoscience Australia in the Capel and Faust basins with Deep Sea Drilling Project holes on a bathymetric image (Colwell et al 2010). Seismic line GA-302/19 is highlighted in yellow.
DSDP 208CAPELBASIN
FAUSTBASIN
Lo rd How
e Rise
Dam
pier Ridge
BRISBANE
GA-302/19
Lord Howe IslandTASMANBASIN
MID
DLETO
N BASIN
160°155°
25°
30°
11-5464-1
0 500 km
SAWA
QLD
NSW
TAS
VIC
NT
Seismic lines (survey GA-206)
Seismic lines (survey GA-302)
2007 Tangaroa survey (GA-2436)
Deep Sea Drilling Project site

ISSUE 103 Sept 2011
New 3D Model of Capel and Faust basins released www.ga.gov.au/ausgeonews/ | 2
3D modelling and petroleum exploration
Because of these challenges, effective data integration and analysis
methods were essential. By using the 3D visualisation and modelling
environment provided by GOCAD™, the diverse datasets were
captured, processed and interpreted to create an integrated 3D
geological model. This model enabled key geological and petroleum
prospectivity questions to be answered. 3D geological analysis of
offshore Australian areas at a basin-wide scale is a relatively new field
of study. Usually petroleum exploration companies analyse basins
at the scale of exploration prospects when undertaking detailed 3D
mapping of hydrocarbon accumulations and modelling of fluid flow.
Geoscience Australia previously used basin-scale 3D geological
modelling in a study of the Bremer Basin, located on the southern
margin of Australia (Bradshaw 2005). However for this study
the model was produced at the end of the project to allow 3D visualisation of key interpretations and datasets. In the Capel and Faust basins study, the 3D visualisation environment was proactively used during the analytical workflow, as a workspace for data integration and testing of geological interpretations. This integrated 3D methodology is increasingly being used for petroleum prospectivity assessment at a basin scale.
Figure 2. 3D visualisation of selected GA-302 seismic lines and grid of marine gravity data. The strong correlation between basement topography (revealed by seismic data) and gravity anomalies allowed gravity data to be used to interpolate structures between seismic lines.

ISSUE 103 Sept 2011
New 3D Model of Capel and Faust basins released www.ga.gov.au/ausgeonews/ | 3
Building an integrated 3D model
The Capel and Faust 3D geological model is composed of two
fundamental components: horizon surfaces and fault surfaces.
A number of horizon surfaces, based on 2D seismic interpretation,
define key depositional and erosional events in the evolution of the
basins (Colwell et al 2010). These surfaces bound major sedimentary
units, which may source, host or trap petroleum accumulations.
Seven key horizon surfaces were selected for the 3D geological model.
Ages were assigned to most of the horizons by inference from major
regional tectonic events (Colwell et al 2010). Fault surfaces represent
fractures formed largely through tectonic movements that cut through
the basin sediments or form
basin margins. Faults may also
facilitate the trapping, migration
and leakage of hydrocarbons
potentially generated within the
basin (figure 3). Two fault types
were interpreted in the seismic
datasets: major basin-bounding
or basement offsetting faults, and
minor intra-basin faults.
The seismic data was the
primary dataset used for model
Figure 3. 3D basement architecture and faults (in red) of the Capel and Faust basins study area. The purple and blue colours delineate the base of the depocentres which have been filled with sediments. The green, yellow and orange colours represent the basement highs which border the depocentres.

ISSUE 103 Sept 2011
New 3D Model of Capel and Faust basins released www.ga.gov.au/ausgeonews/ | 4
building, but the comparatively wide spacing of the seismic lines required integration of other datasets to enable 3D surfaces to be generated (figure 1). Interpreted trends in gravity, magnetics and bathymetry datasets, which have a three kilometre line spacing in some areas, assisted in filling in the gaps in seismic coverage. The bathymetry data indicated many of the basin edges, particularly where fault movement is ongoing and has influenced the seafloor morphology. The gravity and magnetic data highlighted the location of basins and how they trend between seismic lines (figure 2). Areas of steep gradients in the gravity and magnetic data (Hackney 2010, Petkovic 2010, Petkovic et al 2011) were extracted as ‘worms’ and by upward continuation to highlight significant subsurface structures, their continuity and the regional structural trends. Maximising information extracted from the available datasets in this way, and their integration in 3D, allowed a robust geological model to be built.
Assessing petroleum prospectivityThe 3D horizon and fault surfaces were iteratively tested and modified as geologic interpretations evolved during the project lifecycle. The final horizon and fault surfaces were then seamlessly integrated to produce a complete 3D geological model (figure 3). This produced a series of horizon surfaces cut by fault surfaces, facilitating the display of the magnitude and sense of fault movement. The geometry of fault surfaces also revealed how the faults evolved over time; for example, faults exhibiting alternating segments of large and small displacement probably formed through the joining of multiple, but initially separate, short faults.
The end product is a 3D geological model that has vastly advanced our knowledge of hitherto poorly understood frontier basins. This model can be used to answer key petroleum prospectivity questions, such as the location of deepest depocentres, the likely location and type of hydrocarbon traps, and the nature of exploration risks. The model and the associated geological interpretations are now available from the Geoscience Australia Sales Centre as Record 2011/01 together with a range of other recently released Records and data products on the Capel and Faust basins (see below).
ReferencesBradshaw BE (Comp). 2005. Geology and Petroleum Potential of the Bremer Sub-basin, offshore southwestern Australia. Geoscience Australia Record 2005/21. Available at: https://www.ga.gov.au/products/servlet/controller?event=GEOCAT_DETAILS&catno=63730
Colwell JB, Hashimoto T, Rollet N, Higgins K, Bernardel G & McGiveron S. 2010. Interpretation of Seismic Data, Capel and Faust Basins, Australia’s Remote Offshore Eastern Frontier. Geoscience Australia Record 2010/06. Available at: https://www.ga.gov.au/products/servlet/
controller?event=GEOCAT_DETAILS&catno=69190
Hackney R. 2010. Potential-field data covering the Capel and Faust Basins, Australia’s Remote Offshore Eastern Frontier. Geoscience Australia Record 2010/34. Available at: https://www.ga.gov.au/products/servlet/controller?event=GEOCAT_DETAILS&catno=70711
Higgins KL, Hashimoto T, Hackney R, Petkovic P & Milligan P. 2011. Building a 3D GOCADTM Model in offshore frontier basins for prospectivity assessment: Capel/Faust Basins, Lord Howe Rise. Geoscience Australia Record 2011/01. Available at: https://www.ga.gov.au/products/servlet/controller?event=GEOCAT_DETAILS&catno=70174
Petkovic P. 2010. Seismic velocity models of the sediment and upper crust of the Capel and Faust Basins, Lord Howe Rise. Geoscience Australia Record 2010/03. Available at: https://www.ga.gov.au/products/servlet/controller?event=GEOCAT_DETAILS&catno=69470
Petkovic P, Lane R & Rollet N. 2011. 3D gravity models of the Capel and Faust Basins, Lord Howe Rise. Geoscience Australia Record 2011/13. Available at: https://www.ga.gov.au/products/servlet/controller?event=GEOCAT_DETAILS&catno=70618
For more information
email [email protected]
Related websites/articles
AusGeo News 99: Integrated assessment of the Capel and Faust basins, offshore eastern Australia
www.ga.gov.au/ausgeonews/ausgeonews201009/capel.jsp
AusGeo News 89: Survey of remote eastern frontier basins completed
www.ga.gov.au/ausgeonews/ausgeonews200803/survey.jsp


![[Bill Faust, Michael Faust] Pitch Yourself Stando(BookFi.org)](https://static.fdocuments.in/doc/165x107/55cf8f5d550346703b9b9f46/bill-faust-michael-faust-pitch-yourself-standobookfiorg.jpg)