Nevron Diagram for · This step-by-step guide will help you create your first simple WinForm...
26
Complete Diagramming solution Unmatched Extensibility options Fully Interactive diagrams Advanced Diagram Automatic Layouts Measurement Units Support Behavior and Interactivity Customization Custom Shapes and Graphs creation Fully Integrated with Visual Studio Windows Forms and Web Forms deployment N N e e v v r r o o n n D D i i a a g g r r a a m m f f o o r r . . N N E E T T Enhance your .NET desktop or Web-based applications - Add intuitive, user-friendly and interactive diagrams. Extend the Diagram to provide sophisticated graphs for your specific business needs. www.nevron.com [email protected] 888-201-6088
Transcript of Nevron Diagram for · This step-by-step guide will help you create your first simple WinForm...
CCoommpplleettee DDiiaaggrraammmmiinngg ssoolluuttiioonn
UUnnmmaattcchheedd EExxtteennssiibbiilliittyy ooppttiioonnss
FFuullllyy IInntteerraaccttiivvee ddiiaaggrraammss
AAddvvaanncceedd DDiiaaggrraamm AAuuttoommaattiicc LLaayyoouuttss
MMeeaassuurreemmeenntt UUnniittss SSuuppppoorrtt
BBeehhaavviioorr aanndd IInntteerraaccttiivviittyy CCuussttoommiizzaattiioonn
CCuussttoomm SShhaappeess aanndd GGrraapphhss ccrreeaattiioonn
FFuullllyy IInntteeggrraatteedd wwiitthh VViissuuaall SSttuuddiioo
WWiinnddoowwss FFoorrmmss aanndd WWeebb FFoorrmmss ddeeppllooyymmeenntt
NNeevvrroonn DDiiaaggrraamm ffoorr ..NNEETT
EEnnhhaannccee yyoouurr ..NNEETT ddeesskkttoopp oorr WWeebb--bbaasseedd aapppplliiccaattiioonnss -- AAdddd iinnttuuiittiivvee,, uusseerr--ffrriieennddllyy aanndd iinntteerraaccttiivvee ddiiaaggrraammss.. EExxtteenndd tthhee DDiiaaggrraamm ttoo pprroovviiddee ssoopphhiissttiiccaatteedd ggrraapphhss ffoorr yyoouurr ssppeecciiffiicc bbuussiinneessss nneeeeddss.. wwwwww..nneevvrroonn..ccoomm ssaalleess@@nneevvrroonn..ccoomm 888888--220011--66008888
Nevron Diagram for .NET – Quick Start Guide
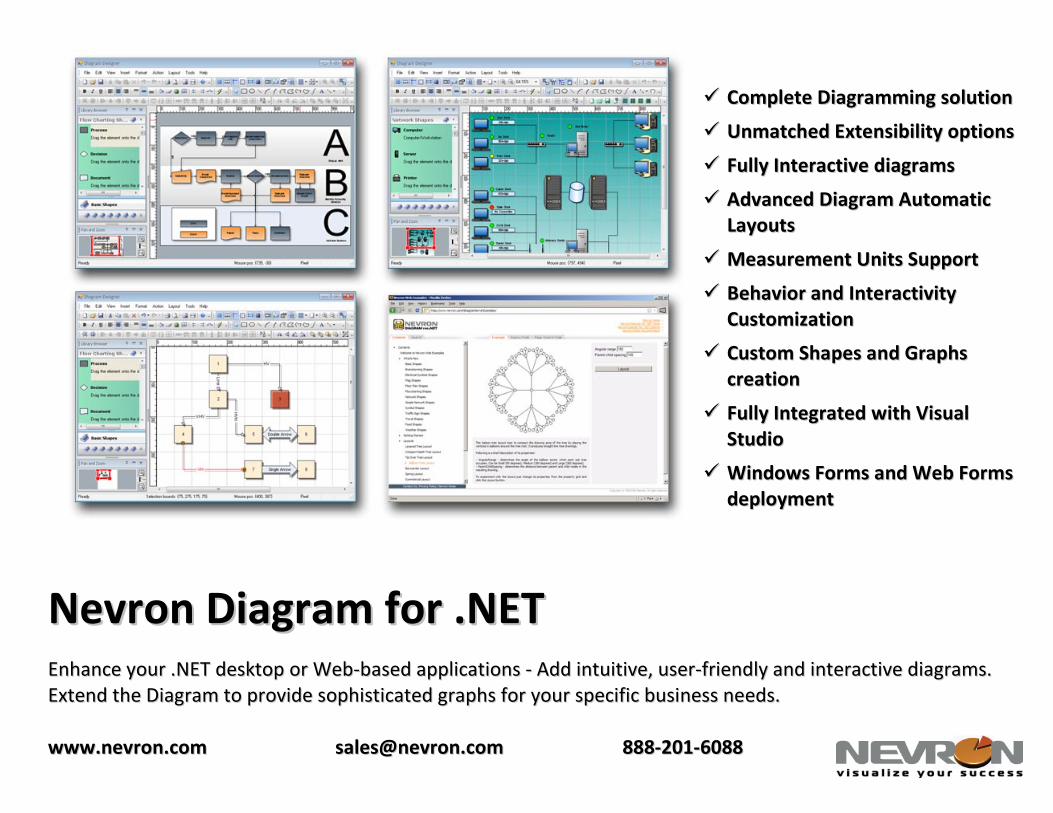
Table of Contents About this Guide 3 Nevron Diagram for .NET Overview 3 Installation and Integration into Visual Studio 4 Creating Your First Diagram – Step-by-step guide 5-8 Nevron Diagram Designer – Overview 9-10 Diagram Document Object Model 11 Elements 11
Documents 11 Styling 11 Shapes and Groups 11 Data Structures 12 Routing 12 Bridges (hops) 12 Print Manager 12 Image Exporter 13 SVG Exporter 13 Undo and Redo 13 Batches 13 Event Handling 13
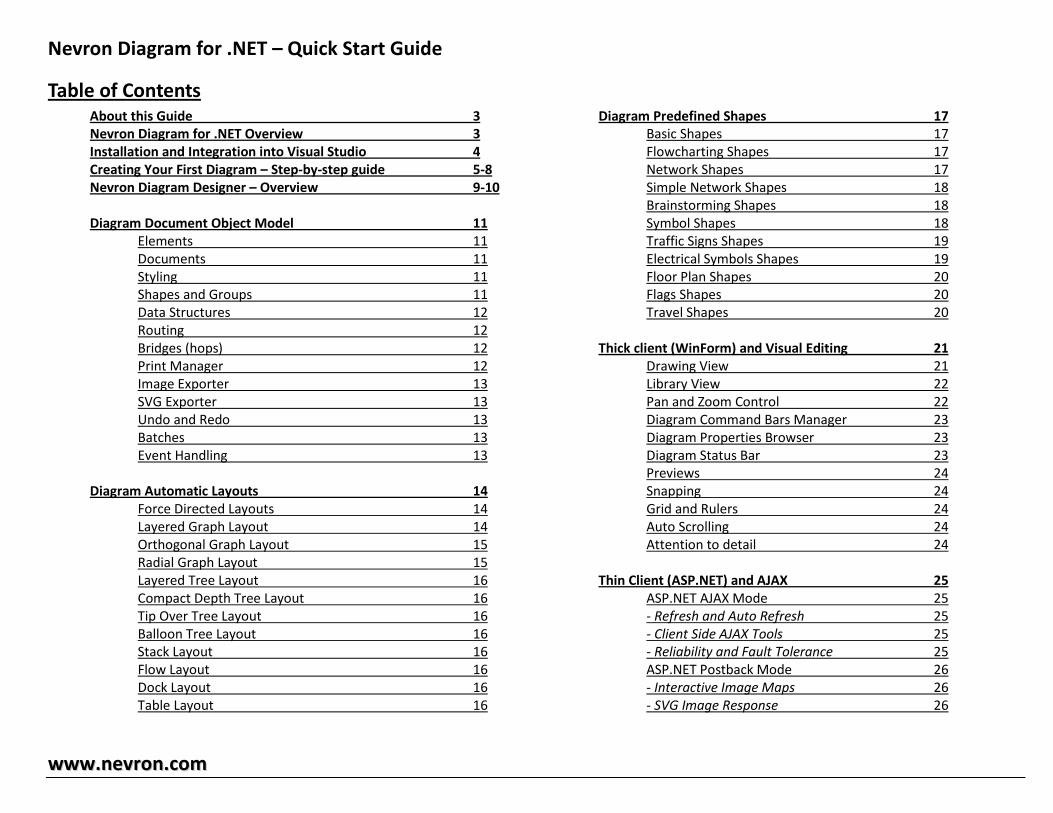
Diagram Automatic Layouts 14
Force Directed Layouts 14 Layered Graph Layout 14 Orthogonal Graph Layout 15 Radial Graph Layout 15 Layered Tree Layout 16 Compact Depth Tree Layout 16 Tip Over Tree Layout 16 Balloon Tree Layout 16 Stack Layout 16 Flow Layout 16 Dock Layout 16 Table Layout 16
Diagram Predefined Shapes 17 Basic Shapes 17
Flowcharting Shapes 17 Network Shapes 17 Simple Network Shapes 18 Brainstorming Shapes 18 Symbol Shapes 18 Traffic Signs Shapes 19 Electrical Symbols Shapes 19 Floor Plan Shapes 20 Flags Shapes 20 Travel Shapes 20
Thick client (WinForm) and Visual Editing 21
Drawing View 21 Library View 22 Pan and Zoom Control 22 Diagram Command Bars Manager 23 Diagram Properties Browser 23 Diagram Status Bar 23 Previews 24 Snapping 24 Grid and Rulers 24 Auto Scrolling 24 Attention to detail 24
Thin Client (ASP.NET) and AJAX 25
ASP.NET AJAX Mode 25 - Refresh and Auto Refresh 25 - Client Side AJAX Tools 25 - Reliability and Fault Tolerance 25 ASP.NET Postback Mode 26 - Interactive Image Maps 26 - SVG Image Response 26
wwwwww..nneevvrroonn..ccoomm
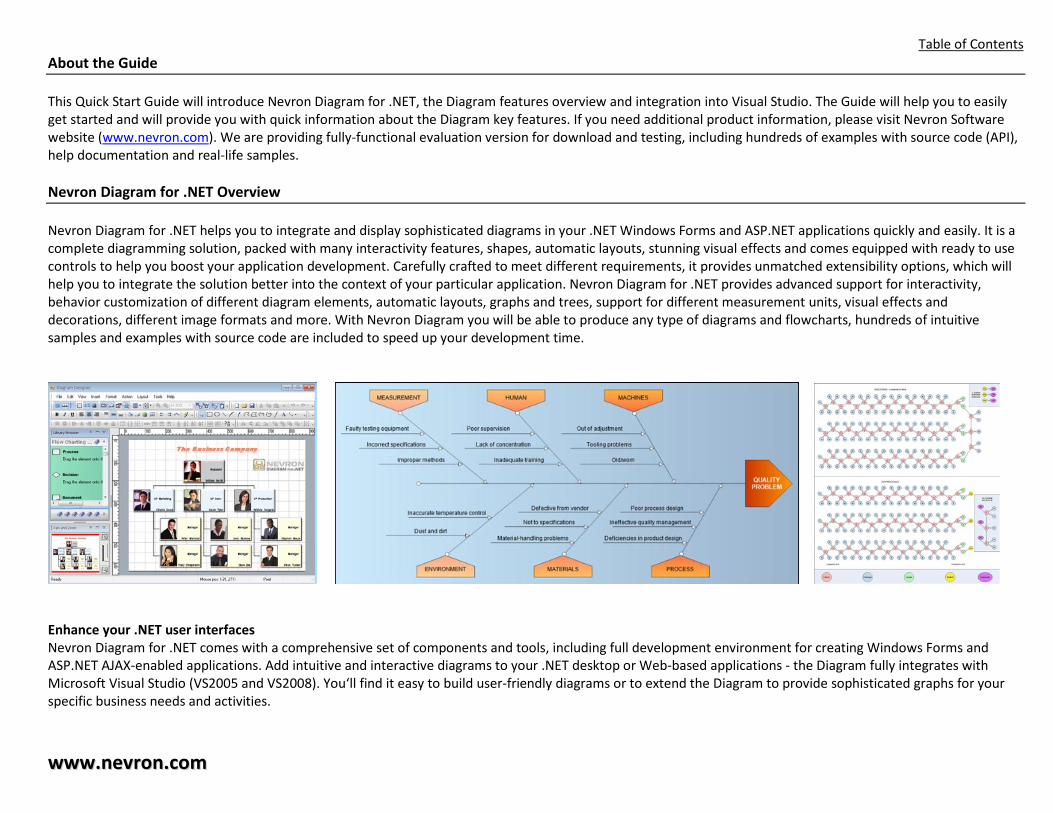
Table of Contents About the Guide This Quick Start Guide will introduce Nevron Diagram for .NET, the Diagram features overview and integration into Visual Studio. The Guide will help you to easily get started and will provide you with quick information about the Diagram key features. If you need additional product information, please visit Nevron Software website (www.nevron.com). We are providing fully-functional evaluation version for download and testing, including hundreds of examples with source code (API), help documentation and real-life samples. Nevron Diagram for .NET Overview Nevron Diagram for .NET helps you to integrate and display sophisticated diagrams in your .NET Windows Forms and ASP.NET applications quickly and easily. It is a complete diagramming solution, packed with many interactivity features, shapes, automatic layouts, stunning visual effects and comes equipped with ready to use controls to help you boost your application development. Carefully crafted to meet different requirements, it provides unmatched extensibility options, which will help you to integrate the solution better into the context of your particular application. Nevron Diagram for .NET provides advanced support for interactivity, behavior customization of different diagram elements, automatic layouts, graphs and trees, support for different measurement units, visual effects and decorations, different image formats and more. With Nevron Diagram you will be able to produce any type of diagrams and flowcharts, hundreds of intuitive samples and examples with source code are included to speed up your development time.
Enhance your .NET user interfaces Nevron Diagram for .NET comes with a comprehensive set of components and tools, including full development environment for creating Windows Forms and ASP.NET AJAX-enabled applications. Add intuitive and interactive diagrams to your .NET desktop or Web-based applications - the Diagram fully integrates with Microsoft Visual Studio (VS2005 and VS2008). You‘ll find it easy to build user-friendly diagrams or to extend the Diagram to provide sophisticated graphs for your specific business needs and activities.
wwwwww..nneevvrroonn..ccoomm
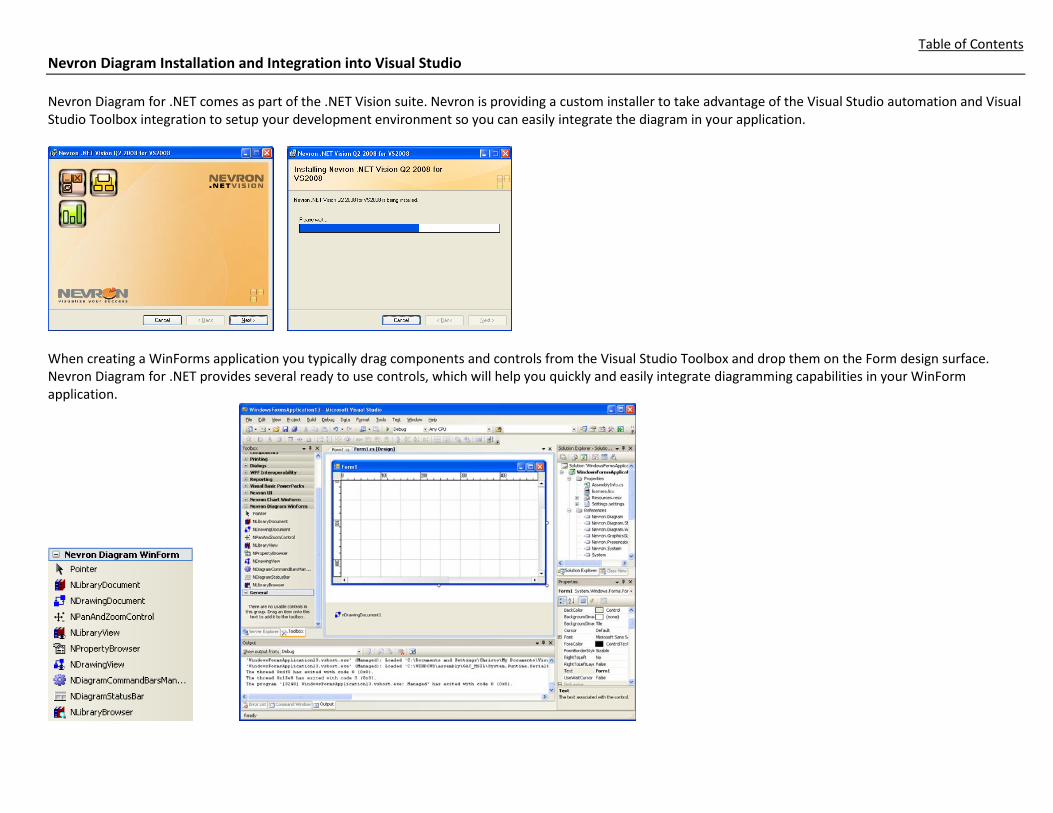
Table of Contents Nevron Diagram Installation and Integration into Visual Studio Nevron Diagram for .NET comes as part of the .NET Vision suite. Nevron is providing a custom installer to take advantage of the Visual Studio automation and Visual Studio Toolbox integration to setup your development environment so you can easily integrate the diagram in your application.
When creating a WinForms application you typically drag components and controls from the Visual Studio Toolbox and drop them on the Form design surface. Nevron Diagram for .NET provides several ready to use controls, which will help you quickly and easily integrate diagramming capabilities in your WinForm application.

Table of Contents Creating Your First Diagram – Step-by-step guide This step-by-step guide will help you create your first simple WinForm diagram application with Visual Studio. This will be an interactive diagram which includes several simple shapes and connectors.
1. Start Visual Studio and create new WindowsForms Application. For this example we are using Visual C# but you can also use VB.NET 2. Open the solution explorer and add reference to the following assemblies: Nevron.Diagram.dll, Nevron.Diagram.WinForm.dll, Nevron.Diagram.Shapes.dll, Nevron.Presentation.dll and Nevron.System.dll. The assemblies are located in the .NET Vision installation directory, Bin folder. 3. From the VS Toolbox, drag and drop the NDrawingDocument to the form - it should appear in the component tray, since it is a component. Drag and drop the NDrawingView to the form and resize it as you see fit. You can also Dock the NDrawingView from the Properties Window. To display the document in the view, from the nDrawingView1 Properties/Data/Docuemtn, you have to select nDrawingDocument1 (this has been done automatically in the code example below).

Table of Contents 4. Double click on Form1 to generate the Form1_Load method. The following code will produce the desired diagram: using Nevron.Diagram; using Nevron.Diagram.WinForm; using Nevron.GraphicsCore; using Nevron.Diagram.Shapes; ... private void Form1_Load(object sender, EventArgs e) { // begin view init nDrawingView1.BeginInit(); // display the document in the view nDrawingView1.Document = nDrawingDocument1; // do not show ports nDrawingView1.GlobalVisibility.ShowPorts = false; // hide the grid nDrawingView1.Grid.Visible = false; // fit the document in the viewport nDrawingView1.ViewLayout = ViewLayout.Fit; // apply padding to the document bounds nDrawingView1.DocumentPadding = new Nevron.Diagram.NMargins(10); // init document nDrawingDocument1.BeginInit(); // create the flowcharting shapes factory NFlowChartingShapesFactory factory = new NFlowChartingShapesFactory(nDrawingDocument1); // modify the connectors style sheet NStyleSheet styleSheet = (nDrawingDocument1.StyleSheets.GetChildByName(NDR.NameConnectorsStyleSheet, -1) as NStyleSheet); NTextStyle textStyle = new NTextStyle(); textStyle.BackplaneStyle.Visible = true; textStyle.BackplaneStyle.StandardFrameStyle.InnerBorderWidth = new NLength(0); styleSheet.Style.TextStyle = textStyle; styleSheet.Style.StrokeStyle = new NStrokeStyle(1, Color.Black); styleSheet.Style.StartArrowheadStyle.StrokeStyle = new NStrokeStyle(1, Color.Black); styleSheet.Style.EndArrowheadStyle.StrokeStyle = new NStrokeStyle(1, Color.Black); // create the begin shape NShape begin = factory.CreateShape(FlowChartingShapes.Termination); begin.Bounds = new NRectangleF(100, 100, 100, 100); begin.Text = "BEGIN"; nDrawingDocument1.ActiveLayer.AddChild(begin); // create the step1 shape NShape step1 = factory.CreateShape(FlowChartingShapes.Process); step1.Bounds = new NRectangleF(100, 400, 100, 100); step1.Text = "STEP1"; nDrawingDocument1.ActiveLayer.AddChild(step1); // connect begin and step1 with bezier link NBezierCurveShape bezier = new NBezierCurveShape();
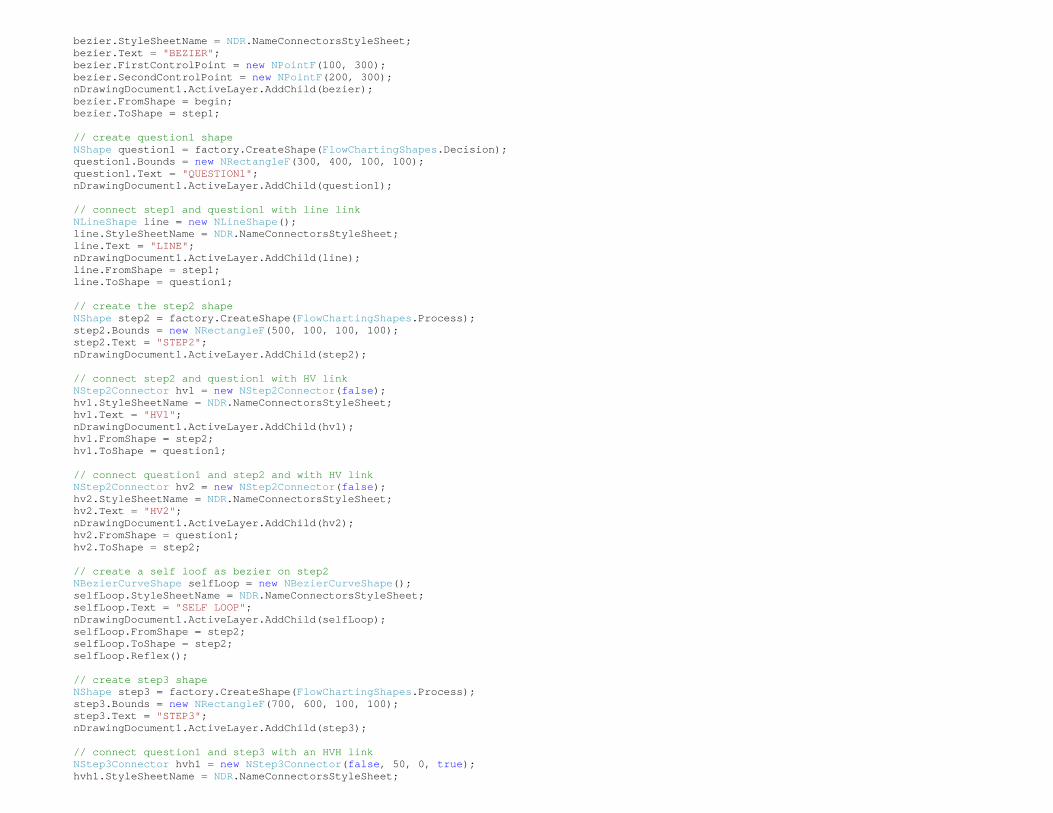
bezier.StyleSheetName = NDR.NameConnectorsStyleSheet; bezier.Text = "BEZIER"; bezier.FirstControlPoint = new NPointF(100, 300); bezier.SecondControlPoint = new NPointF(200, 300); nDrawingDocument1.ActiveLayer.AddChild(bezier); bezier.FromShape = begin; bezier.ToShape = step1; // create question1 shape NShape question1 = factory.CreateShape(FlowChartingShapes.Decision); question1.Bounds = new NRectangleF(300, 400, 100, 100); question1.Text = "QUESTION1"; nDrawingDocument1.ActiveLayer.AddChild(question1); // connect step1 and question1 with line link NLineShape line = new NLineShape(); line.StyleSheetName = NDR.NameConnectorsStyleSheet; line.Text = "LINE"; nDrawingDocument1.ActiveLayer.AddChild(line); line.FromShape = step1; line.ToShape = question1; // create the step2 shape NShape step2 = factory.CreateShape(FlowChartingShapes.Process); step2.Bounds = new NRectangleF(500, 100, 100, 100); step2.Text = "STEP2"; nDrawingDocument1.ActiveLayer.AddChild(step2); // connect step2 and question1 with HV link NStep2Connector hv1 = new NStep2Connector(false); hv1.StyleSheetName = NDR.NameConnectorsStyleSheet; hv1.Text = "HV1"; nDrawingDocument1.ActiveLayer.AddChild(hv1); hv1.FromShape = step2; hv1.ToShape = question1; // connect question1 and step2 and with HV link NStep2Connector hv2 = new NStep2Connector(false); hv2.StyleSheetName = NDR.NameConnectorsStyleSheet; hv2.Text = "HV2"; nDrawingDocument1.ActiveLayer.AddChild(hv2); hv2.FromShape = question1; hv2.ToShape = step2; // create a self loof as bezier on step2 NBezierCurveShape selfLoop = new NBezierCurveShape(); selfLoop.StyleSheetName = NDR.NameConnectorsStyleSheet; selfLoop.Text = "SELF LOOP"; nDrawingDocument1.ActiveLayer.AddChild(selfLoop); selfLoop.FromShape = step2; selfLoop.ToShape = step2; selfLoop.Reflex(); // create step3 shape NShape step3 = factory.CreateShape(FlowChartingShapes.Process); step3.Bounds = new NRectangleF(700, 600, 100, 100); step3.Text = "STEP3"; nDrawingDocument1.ActiveLayer.AddChild(step3); // connect question1 and step3 with an HVH link NStep3Connector hvh1 = new NStep3Connector(false, 50, 0, true); hvh1.StyleSheetName = NDR.NameConnectorsStyleSheet;
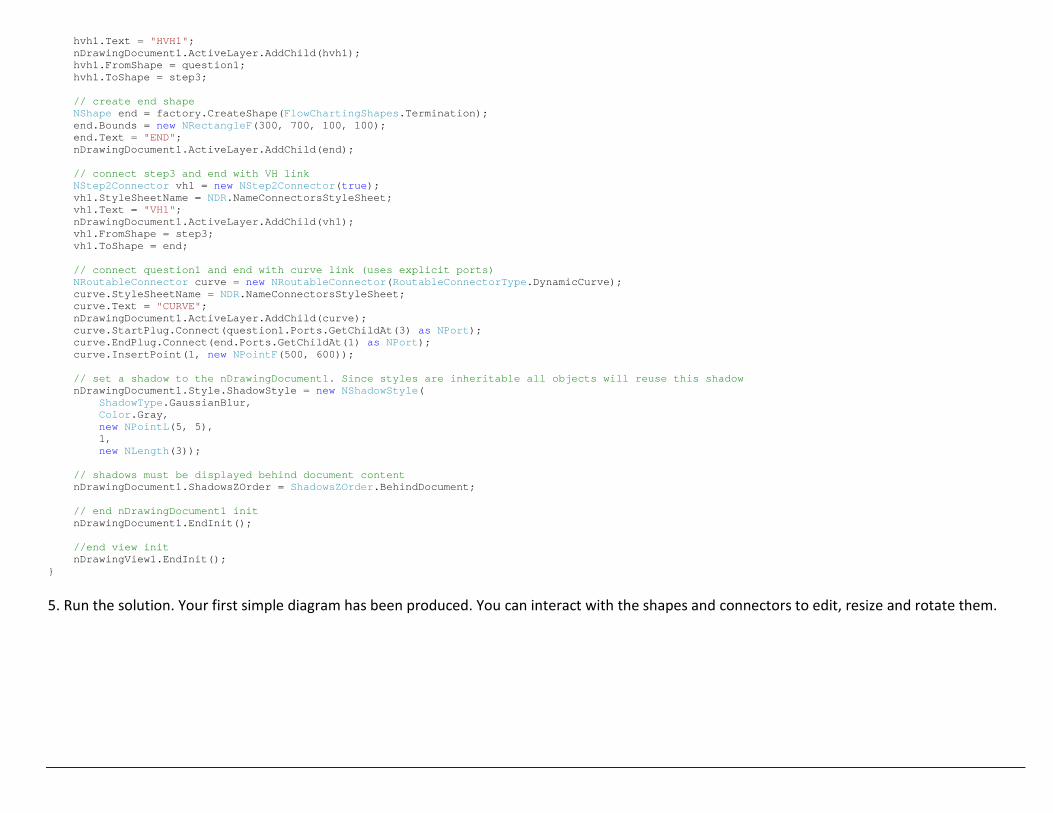
hvh1.Text = "HVH1"; nDrawingDocument1.ActiveLayer.AddChild(hvh1); hvh1.FromShape = question1; hvh1.ToShape = step3; // create end shape NShape end = factory.CreateShape(FlowChartingShapes.Termination); end.Bounds = new NRectangleF(300, 700, 100, 100); end.Text = "END"; nDrawingDocument1.ActiveLayer.AddChild(end); // connect step3 and end with VH link NStep2Connector vh1 = new NStep2Connector(true); vh1.StyleSheetName = NDR.NameConnectorsStyleSheet; vh1.Text = "VH1"; nDrawingDocument1.ActiveLayer.AddChild(vh1); vh1.FromShape = step3; vh1.ToShape = end; // connect question1 and end with curve link (uses explicit ports) NRoutableConnector curve = new NRoutableConnector(RoutableConnectorType.DynamicCurve); curve.StyleSheetName = NDR.NameConnectorsStyleSheet; curve.Text = "CURVE"; nDrawingDocument1.ActiveLayer.AddChild(curve); curve.StartPlug.Connect(question1.Ports.GetChildAt(3) as NPort); curve.EndPlug.Connect(end.Ports.GetChildAt(1) as NPort); curve.InsertPoint(1, new NPointF(500, 600)); // set a shadow to the nDrawingDocument1. Since styles are inheritable all objects will reuse this shadow nDrawingDocument1.Style.ShadowStyle = new NShadowStyle( ShadowType.GaussianBlur, Color.Gray, new NPointL(5, 5), 1, new NLength(3)); // shadows must be displayed behind document content nDrawingDocument1.ShadowsZOrder = ShadowsZOrder.BehindDocument; // end nDrawingDocument1 init nDrawingDocument1.EndInit(); //end view init nDrawingView1.EndInit(); }
5. Run the solution. Your first simple diagram has been produced. You can interact with the shapes and connectors to edit, resize and rotate them.

Table of Contents Nevron Diagram Designer Nevron Diagram comes with ready-to-use Diagram Designer application - The Diagram for .NET implements a complete set of components which can help you create a feature rich diagram designer in minutes. Nevron Diagram Designer is a diagramming editor powered by Nevron Diagram for .NET controls. It is suitable for creating various kinds of diagrams and performing different layout algorithms on them. The Diagram Designer also can make you familiar with the features provided by Nevron Diagram.
Besides the Diagram Designer itself, we have included in the install package some sample applications utilizing the Nevron Diagram components – Pipeline Editor and Seat Reservation demo. These simple applications can give you a simple understanding on what the Diagram for .NET can do for you and your highly specific and complex projects.

Table of Contents Nevron Diagram Designer can also be used for custom shapes creation by composing or grouping drawing primitives and simple shapes. You can create new Shape Libraries in the Library Views, drag and drop your custom shapes to create new masters and shape stencils.
You can save and load your own different libraries. All types of shapes can be grouped to create groups. Groups can also be 1D or 2D as you specify. Groups act as if they are a single shape, but are in fact composed from other shapes. Groups can also be used for the creation of custom shapes.
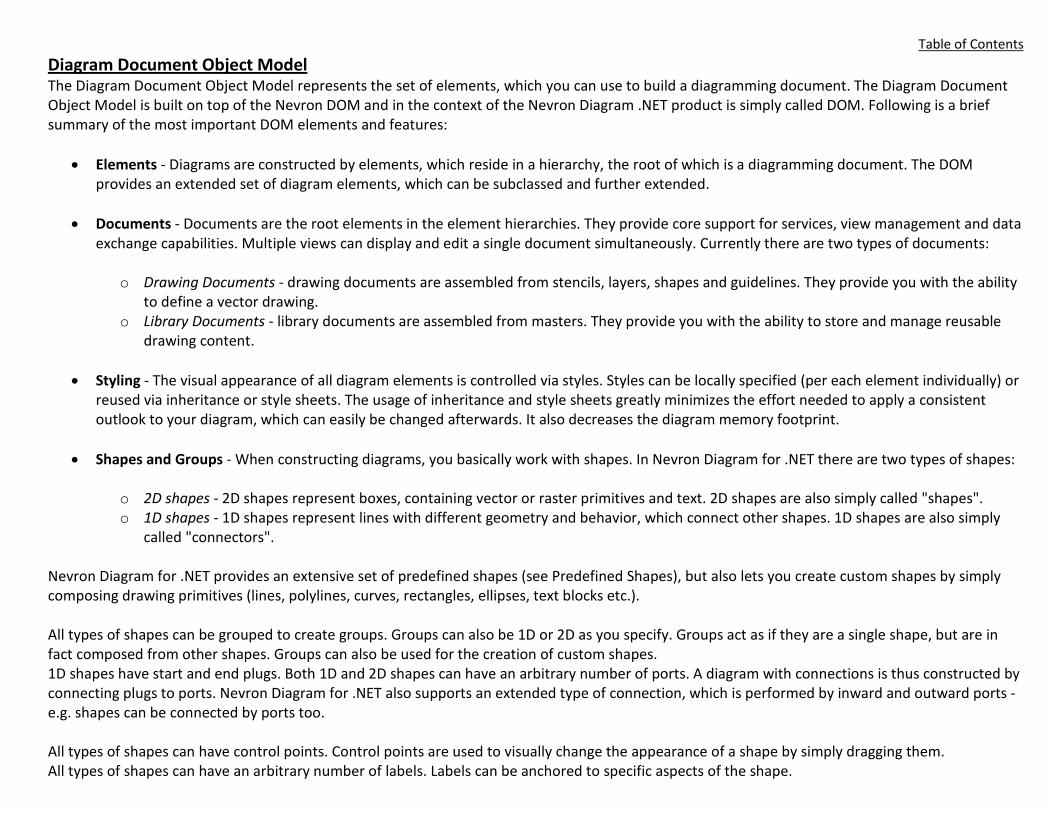
Table of Contents
Diagram Document Object Model The Diagram Document Object Model represents the set of elements, which you can use to build a diagramming document. The Diagram Document Object Model is built on top of the Nevron DOM and in the context of the Nevron Diagram .NET product is simply called DOM. Following is a brief summary of the most important DOM elements and features:
• Elements - Diagrams are constructed by elements, which reside in a hierarchy, the root of which is a diagramming document. The DOM provides an extended set of diagram elements, which can be subclassed and further extended.
• Documents - Documents are the root elements in the element hierarchies. They provide core support for services, view management and data exchange capabilities. Multiple views can display and edit a single document simultaneously. Currently there are two types of documents:
o Drawing Documents - drawing documents are assembled from stencils, layers, shapes and guidelines. They provide you with the ability to define a vector drawing.
o Library Documents - library documents are assembled from masters. They provide you with the ability to store and manage reusable drawing content.
• Styling - The visual appearance of all diagram elements is controlled via styles. Styles can be locally specified (per each element individually) or
reused via inheritance or style sheets. The usage of inheritance and style sheets greatly minimizes the effort needed to apply a consistent outlook to your diagram, which can easily be changed afterwards. It also decreases the diagram memory footprint.
• Shapes and Groups - When constructing diagrams, you basically work with shapes. In Nevron Diagram for .NET there are two types of shapes:
o 2D shapes - 2D shapes represent boxes, containing vector or raster primitives and text. 2D shapes are also simply called "shapes". o 1D shapes - 1D shapes represent lines with different geometry and behavior, which connect other shapes. 1D shapes are also simply
called "connectors". Nevron Diagram for .NET provides an extensive set of predefined shapes (see Predefined Shapes), but also lets you create custom shapes by simply composing drawing primitives (lines, polylines, curves, rectangles, ellipses, text blocks etc.). All types of shapes can be grouped to create groups. Groups can also be 1D or 2D as you specify. Groups act as if they are a single shape, but are in fact composed from other shapes. Groups can also be used for the creation of custom shapes. 1D shapes have start and end plugs. Both 1D and 2D shapes can have an arbitrary number of ports. A diagram with connections is thus constructed by connecting plugs to ports. Nevron Diagram for .NET also supports an extended type of connection, which is performed by inward and outward ports - e.g. shapes can be connected by ports too. All types of shapes can have control points. Control points are used to visually change the appearance of a shape by simply dragging them. All types of shapes can have an arbitrary number of labels. Labels can be anchored to specific aspects of the shape.
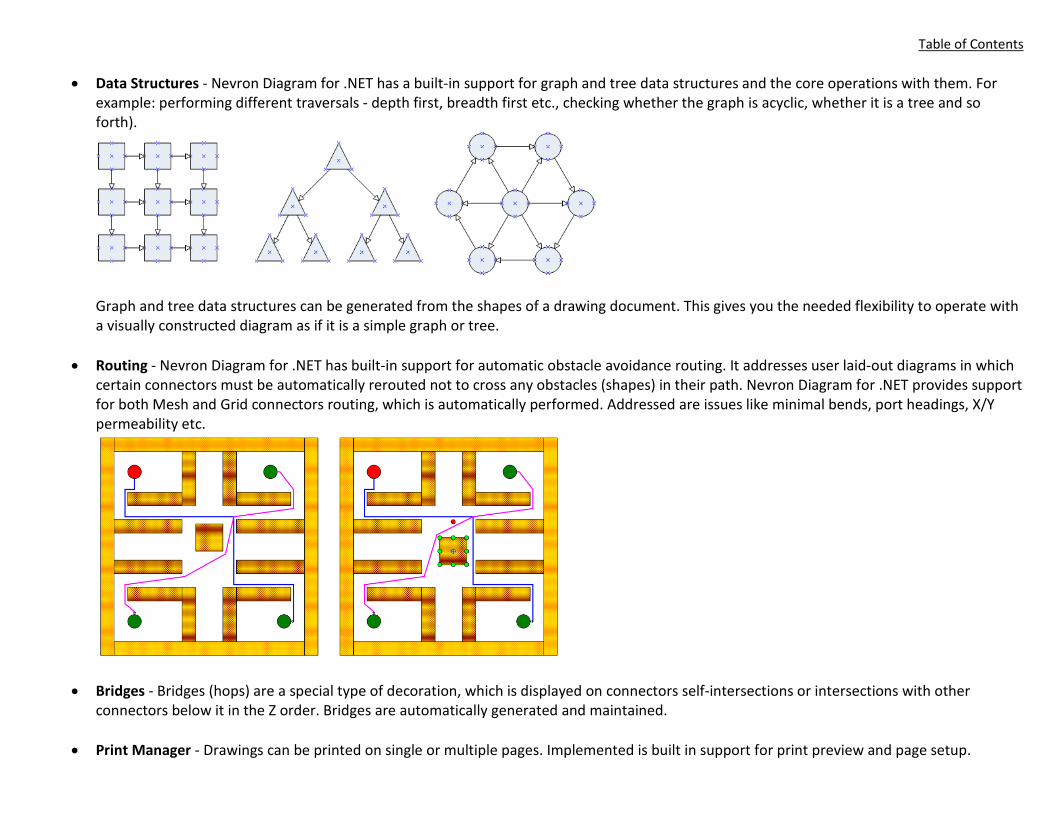
Table of Contents
• Data Structures - Nevron Diagram for .NET has a built-in support for graph and tree data structures and the core operations with them. For example: performing different traversals - depth first, breadth first etc., checking whether the graph is acyclic, whether it is a tree and so forth).
Graph and tree data structures can be generated from the shapes of a drawing document. This gives you the needed flexibility to operate with a visually constructed diagram as if it is a simple graph or tree.
• Routing - Nevron Diagram for .NET has built-in support for automatic obstacle avoidance routing. It addresses user laid-out diagrams in which
certain connectors must be automatically rerouted not to cross any obstacles (shapes) in their path. Nevron Diagram for .NET provides support for both Mesh and Grid connectors routing, which is automatically performed. Addressed are issues like minimal bends, port headings, X/Y permeability etc.
• Bridges - Bridges (hops) are a special type of decoration, which is displayed on connectors self-intersections or intersections with other connectors below it in the Z order. Bridges are automatically generated and maintained.
• Print Manager - Drawings can be printed on single or multiple pages. Implemented is built in support for print preview and page setup.
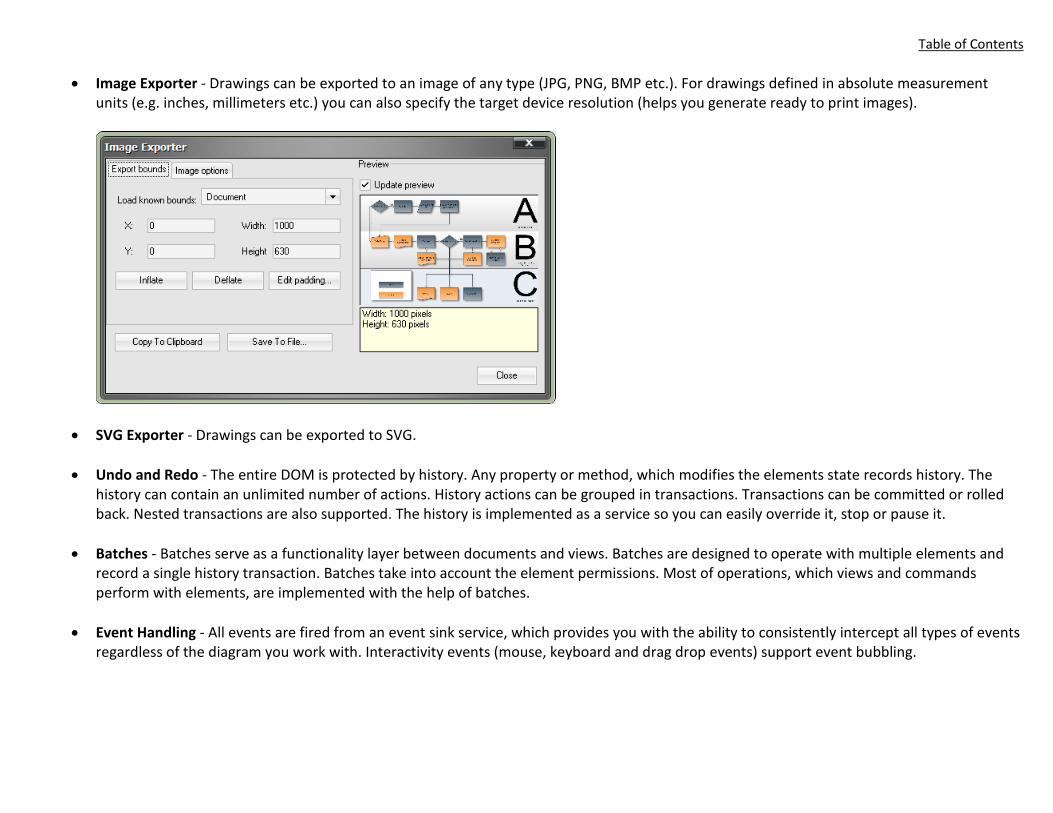
Table of Contents
• Image Exporter - Drawings can be exported to an image of any type (JPG, PNG, BMP etc.). For drawings defined in absolute measurement units (e.g. inches, millimeters etc.) you can also specify the target device resolution (helps you generate ready to print images).
• SVG Exporter - Drawings can be exported to SVG.
• Undo and Redo - The entire DOM is protected by history. Any property or method, which modifies the elements state records history. The history can contain an unlimited number of actions. History actions can be grouped in transactions. Transactions can be committed or rolled back. Nested transactions are also supported. The history is implemented as a service so you can easily override it, stop or pause it.
• Batches - Batches serve as a functionality layer between documents and views. Batches are designed to operate with multiple elements and record a single history transaction. Batches take into account the element permissions. Most of operations, which views and commands perform with elements, are implemented with the help of batches.
• Event Handling - All events are fired from an event sink service, which provides you with the ability to consistently intercept all types of events regardless of the diagram you work with. Interactivity events (mouse, keyboard and drag drop events) support event bubbling.
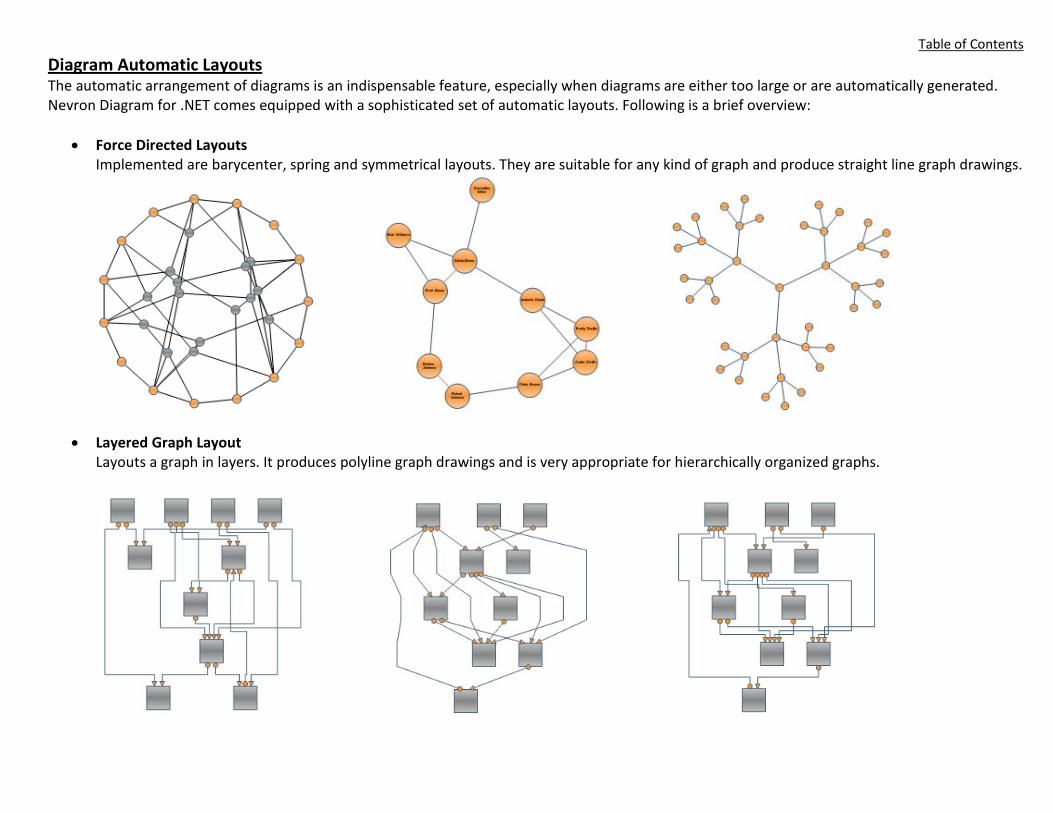
Table of Contents Diagram Automatic Layouts The automatic arrangement of diagrams is an indispensable feature, especially when diagrams are either too large or are automatically generated. Nevron Diagram for .NET comes equipped with a sophisticated set of automatic layouts. Following is a brief overview:
• Force Directed Layouts Implemented are barycenter, spring and symmetrical layouts. They are suitable for any kind of graph and produce straight line graph drawings.
• Layered Graph Layout Layouts a graph in layers. It produces polyline graph drawings and is very appropriate for hierarchically organized graphs.
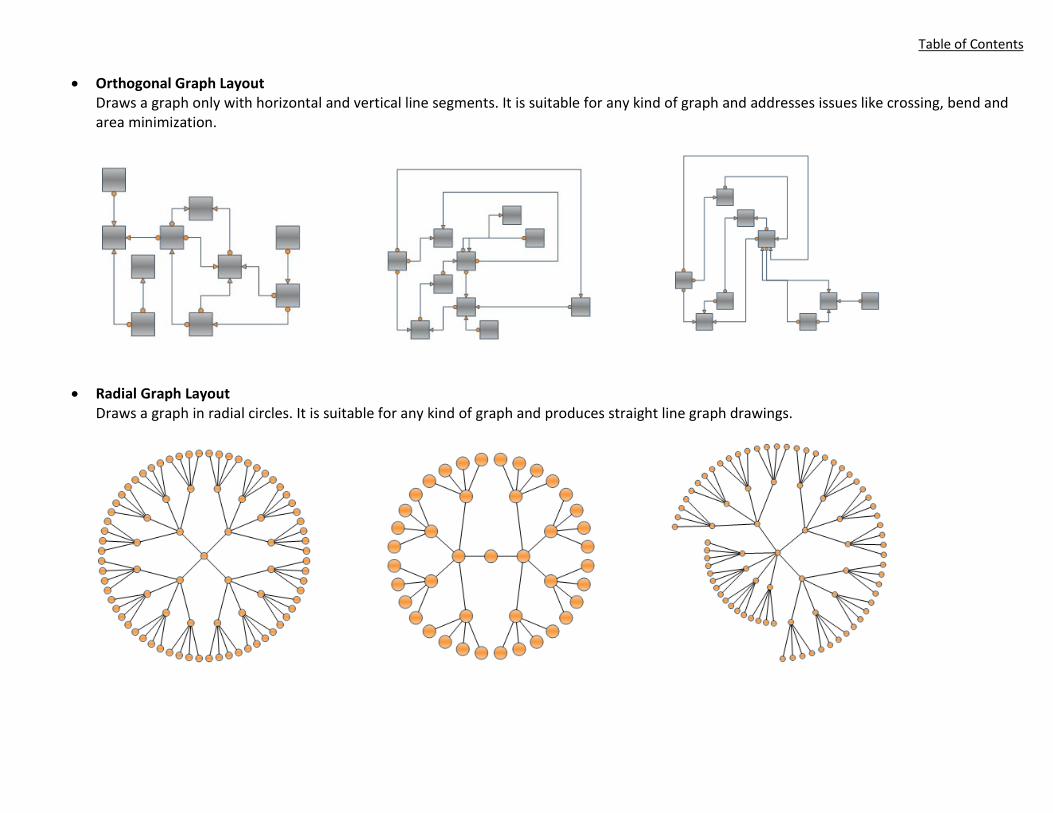
Table of Contents
• Orthogonal Graph Layout Draws a graph only with horizontal and vertical line segments. It is suitable for any kind of graph and addresses issues like crossing, bend and area minimization.
• Radial Graph Layout Draws a graph in radial circles. It is suitable for any kind of graph and produces straight line graph drawings.
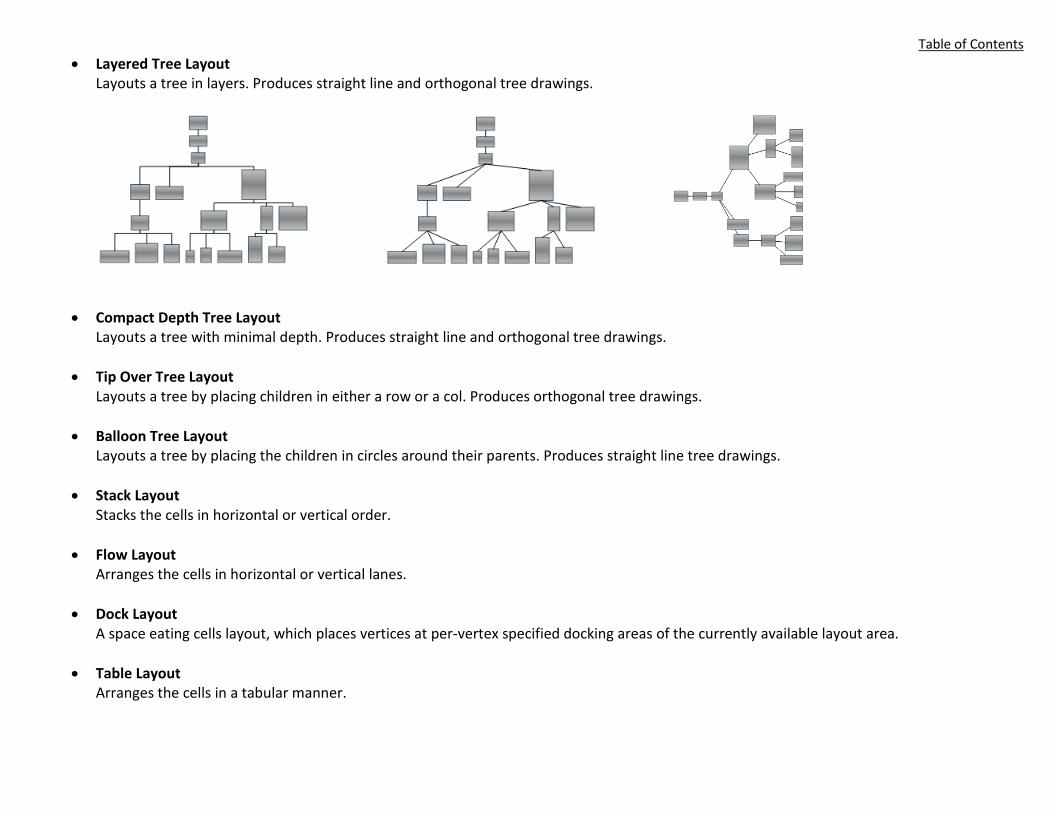
Table of Contents • Layered Tree Layout
Layouts a tree in layers. Produces straight line and orthogonal tree drawings.
• Compact Depth Tree Layout Layouts a tree with minimal depth. Produces straight line and orthogonal tree drawings.
• Tip Over Tree Layout Layouts a tree by placing children in either a row or a col. Produces orthogonal tree drawings.
• Balloon Tree Layout Layouts a tree by placing the children in circles around their parents. Produces straight line tree drawings.
• Stack Layout Stacks the cells in horizontal or vertical order.
• Flow Layout Arranges the cells in horizontal or vertical lanes.
• Dock Layout A space eating cells layout, which places vertices at per-vertex specified docking areas of the currently available layout area.
• Table Layout Arranges the cells in a tabular manner.
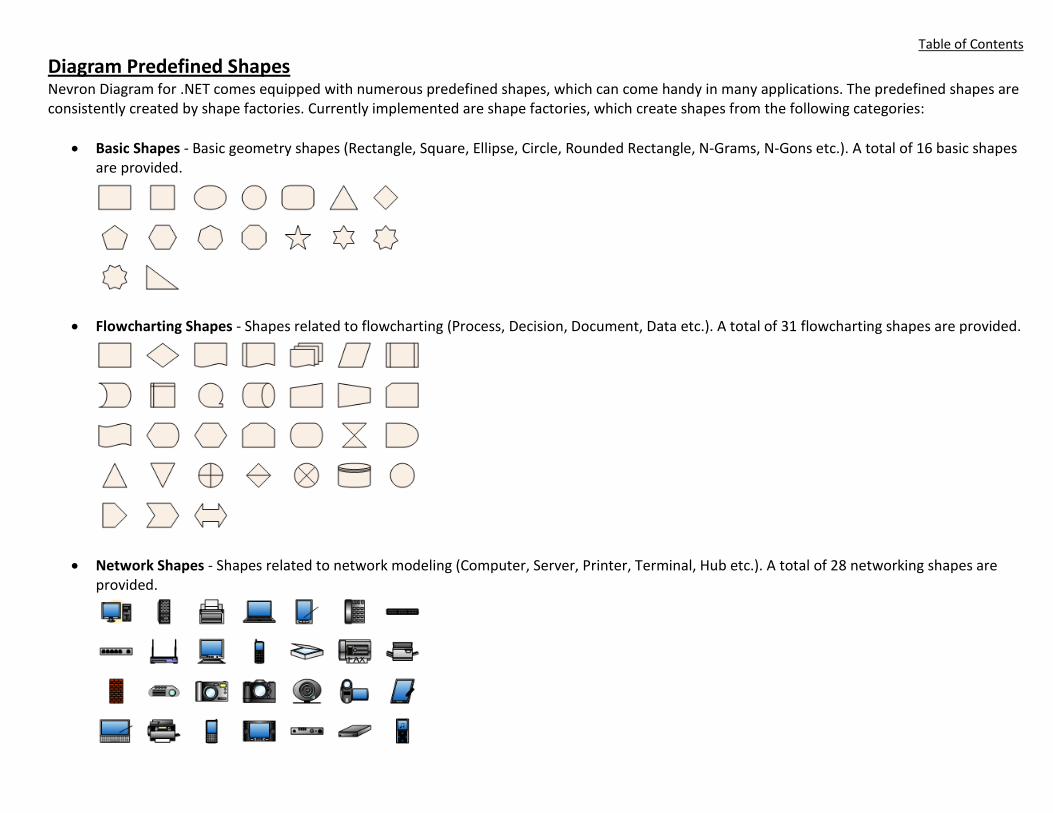
Table of Contents
Diagram Predefined Shapes Nevron Diagram for .NET comes equipped with numerous predefined shapes, which can come handy in many applications. The predefined shapes are consistently created by shape factories. Currently implemented are shape factories, which create shapes from the following categories:
• Basic Shapes - Basic geometry shapes (Rectangle, Square, Ellipse, Circle, Rounded Rectangle, N-Grams, N-Gons etc.). A total of 16 basic shapes are provided.
• Flowcharting Shapes - Shapes related to flowcharting (Process, Decision, Document, Data etc.). A total of 31 flowcharting shapes are provided.
• Network Shapes - Shapes related to network modeling (Computer, Server, Printer, Terminal, Hub etc.). A total of 28 networking shapes are provided.
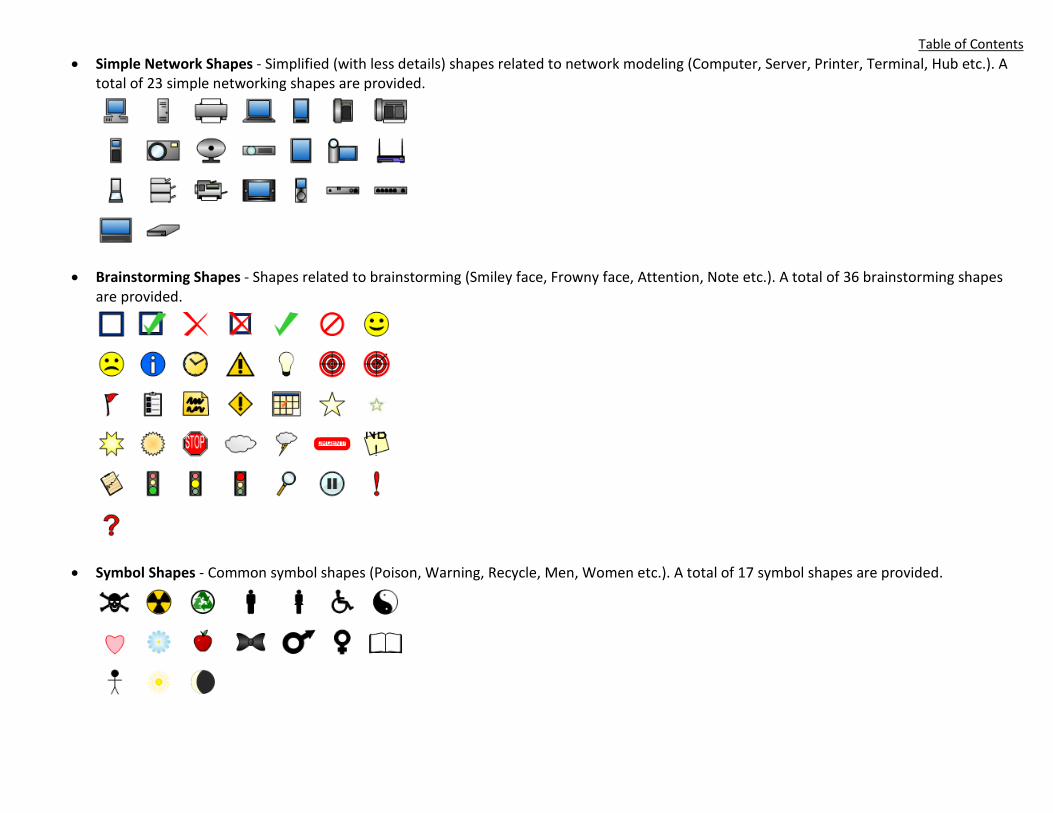
Table of Contents • Simple Network Shapes - Simplified (with less details) shapes related to network modeling (Computer, Server, Printer, Terminal, Hub etc.). A
total of 23 simple networking shapes are provided.
• Brainstorming Shapes - Shapes related to brainstorming (Smiley face, Frowny face, Attention, Note etc.). A total of 36 brainstorming shapes are provided.
• Symbol Shapes - Common symbol shapes (Poison, Warning, Recycle, Men, Women etc.). A total of 17 symbol shapes are provided.
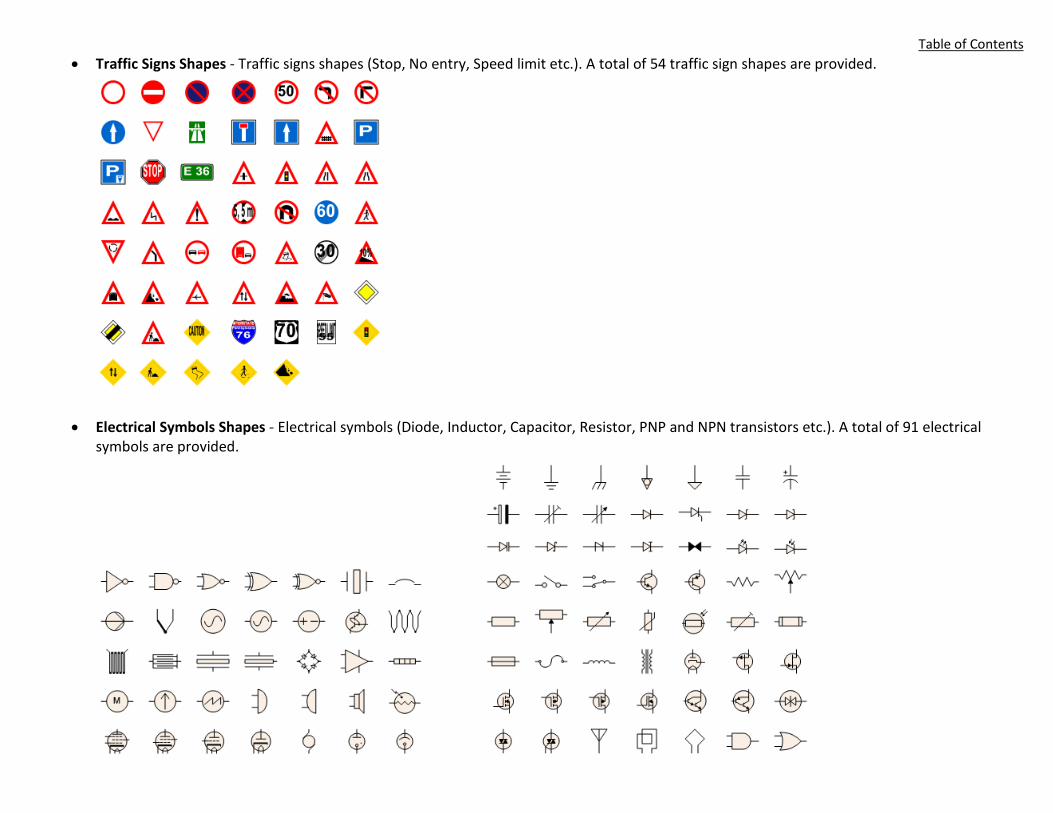
Table of Contents • Traffic Signs Shapes - Traffic signs shapes (Stop, No entry, Speed limit etc.). A total of 54 traffic sign shapes are provided.
• Electrical Symbols Shapes - Electrical symbols (Diode, Inductor, Capacitor, Resistor, PNP and NPN transistors etc.). A total of 91 electrical symbols are provided.
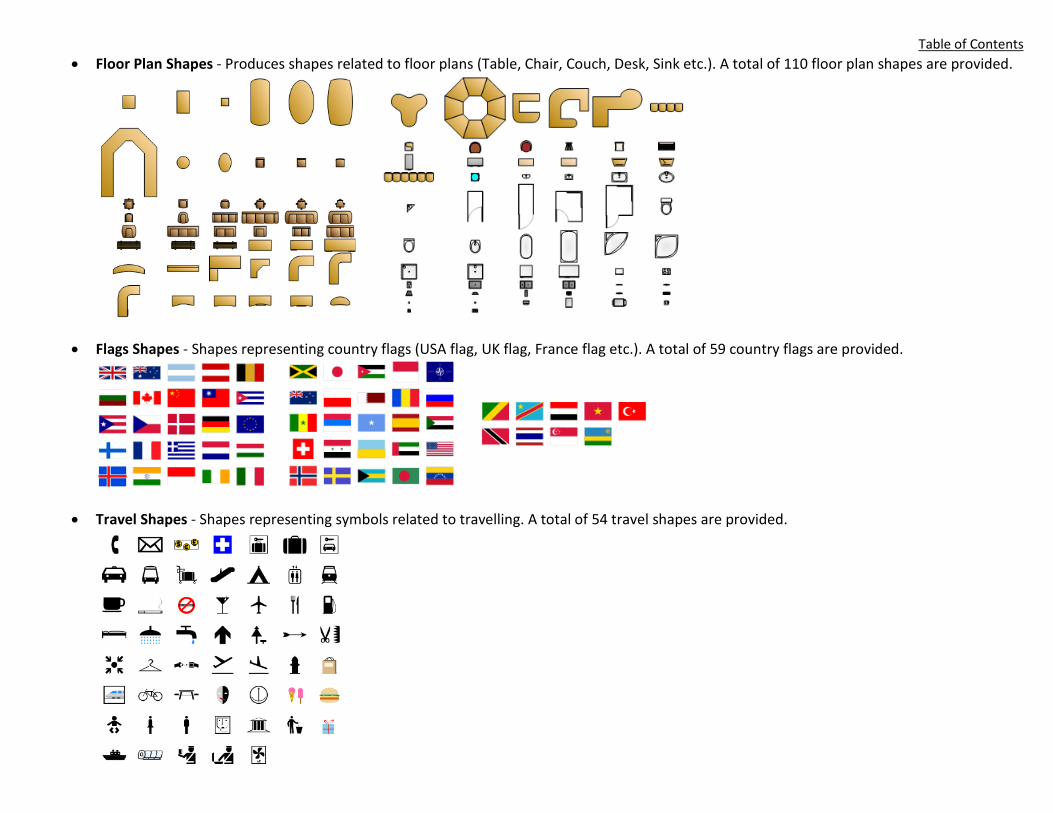
Table of Contents • Floor Plan Shapes - Produces shapes related to floor plans (Table, Chair, Couch, Desk, Sink etc.). A total of 110 floor plan shapes are provided.
• Flags Shapes - Shapes representing country flags (USA flag, UK flag, France flag etc.). A total of 59 country flags are provided.
• Travel Shapes - Shapes representing symbols related to travelling. A total of 54 travel shapes are provided.
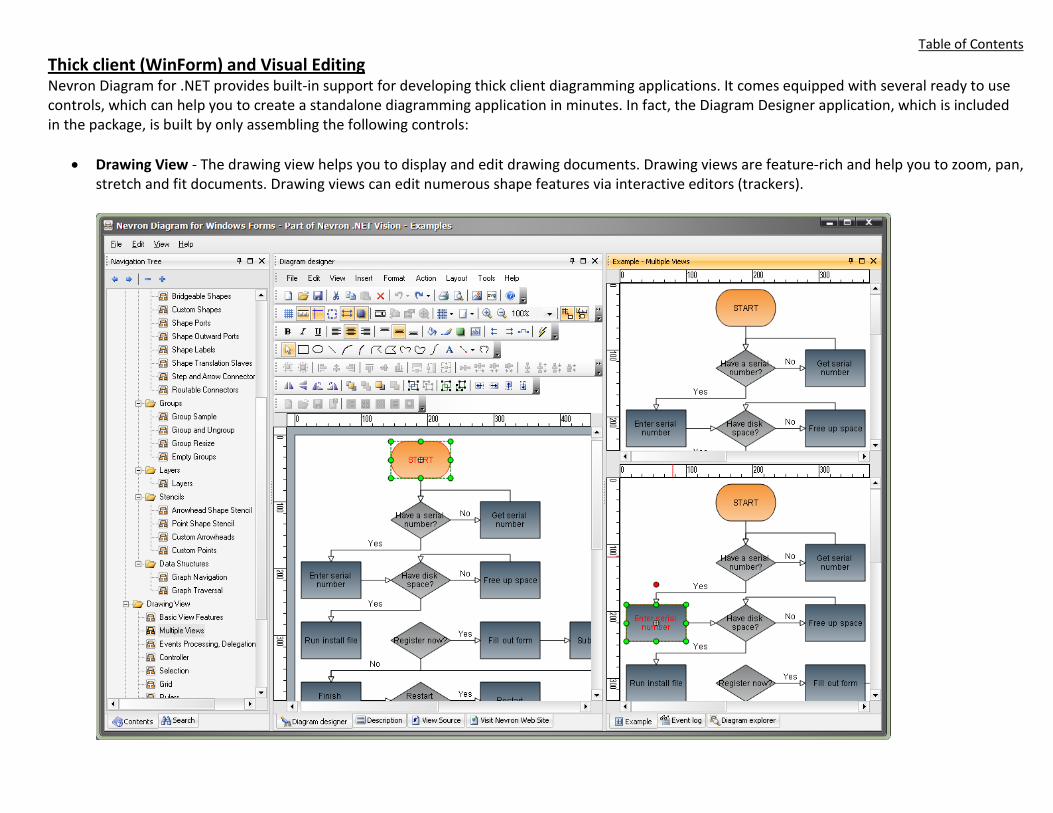
Table of Contents Thick client (WinForm) and Visual Editing Nevron Diagram for .NET provides built-in support for developing thick client diagramming applications. It comes equipped with several ready to use controls, which can help you to create a standalone diagramming application in minutes. In fact, the Diagram Designer application, which is included in the package, is built by only assembling the following controls:
• Drawing View - The drawing view helps you to display and edit drawing documents. Drawing views are feature-rich and help you to zoom, pan, stretch and fit documents. Drawing views can edit numerous shape features via interactive editors (trackers).
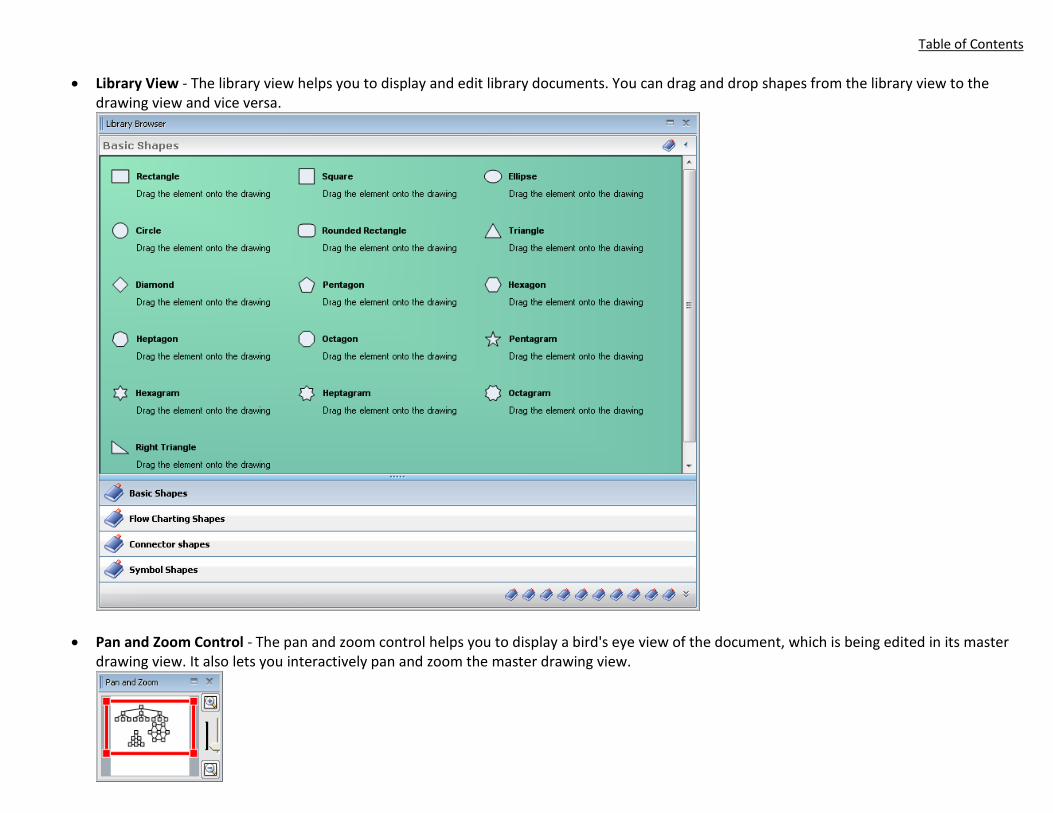
Table of Contents
• Library View - The library view helps you to display and edit library documents. You can drag and drop shapes from the library view to the drawing view and vice versa.
• Pan and Zoom Control - The pan and zoom control helps you to display a bird's eye view of the document, which is being edited in its master drawing view. It also lets you interactively pan and zoom the master drawing view.

Table of Contents • Diagram Command Bars Manager - The diagram command bars manager helps you to visualize and execute the set of predefined commands,
which can be performed on drawing and library views.
• Diagram Properties Browser - The diagram, properties browser helps you to instantly edit the properties of the document, the active layer, the selected element or the view.
• Diagram Status Bar - The diagram status bar displays important information about the current state of a drawing view (size of the selected element, keyboard state, measurement unit etc.).
Nevron Diagram for .NET takes a radical approach towards processing the user gestures in both drawing and library views. All UI events are processed via tools, which are maintained by a controller, assigned to each view. This helps you to easily configure the way, in which the user interacts with your diagram, which is achieved by simply enabling/disabling certain tools. If the myriad of predefined tools does not fit in your particular integration case, you can enrich your application by implementing custom tools.
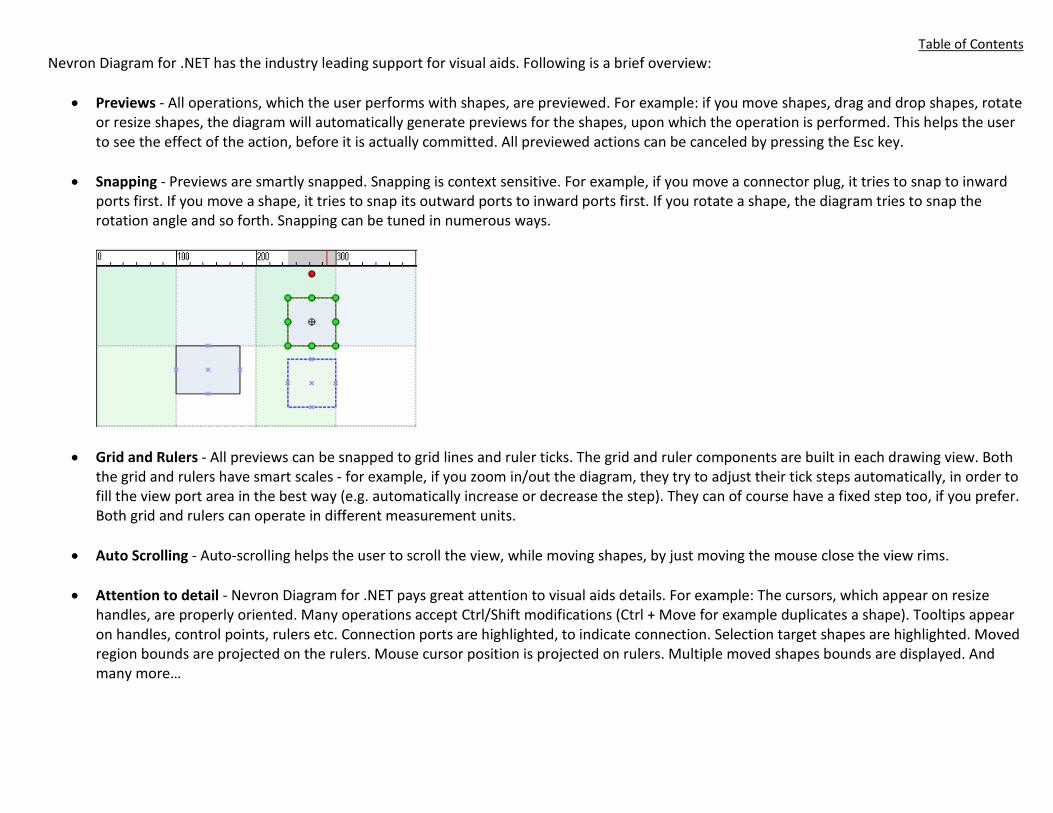
Table of Contents Nevron Diagram for .NET has the industry leading support for visual aids. Following is a brief overview:
• Previews - All operations, which the user performs with shapes, are previewed. For example: if you move shapes, drag and drop shapes, rotate or resize shapes, the diagram will automatically generate previews for the shapes, upon which the operation is performed. This helps the user to see the effect of the action, before it is actually committed. All previewed actions can be canceled by pressing the Esc key.
• Snapping - Previews are smartly snapped. Snapping is context sensitive. For example, if you move a connector plug, it tries to snap to inward ports first. If you move a shape, it tries to snap its outward ports to inward ports first. If you rotate a shape, the diagram tries to snap the rotation angle and so forth. Snapping can be tuned in numerous ways.
• Grid and Rulers - All previews can be snapped to grid lines and ruler ticks. The grid and ruler components are built in each drawing view. Both the grid and rulers have smart scales - for example, if you zoom in/out the diagram, they try to adjust their tick steps automatically, in order to fill the view port area in the best way (e.g. automatically increase or decrease the step). They can of course have a fixed step too, if you prefer. Both grid and rulers can operate in different measurement units.
• Auto Scrolling - Auto-scrolling helps the user to scroll the view, while moving shapes, by just moving the mouse close the view rims.
• Attention to detail - Nevron Diagram for .NET pays great attention to visual aids details. For example: The cursors, which appear on resize handles, are properly oriented. Many operations accept Ctrl/Shift modifications (Ctrl + Move for example duplicates a shape). Tooltips appear on handles, control points, rulers etc. Connection ports are highlighted, to indicate connection. Selection target shapes are highlighted. Moved region bounds are projected on the rulers. Mouse cursor position is projected on rulers. Multiple moved shapes bounds are displayed. And many more…
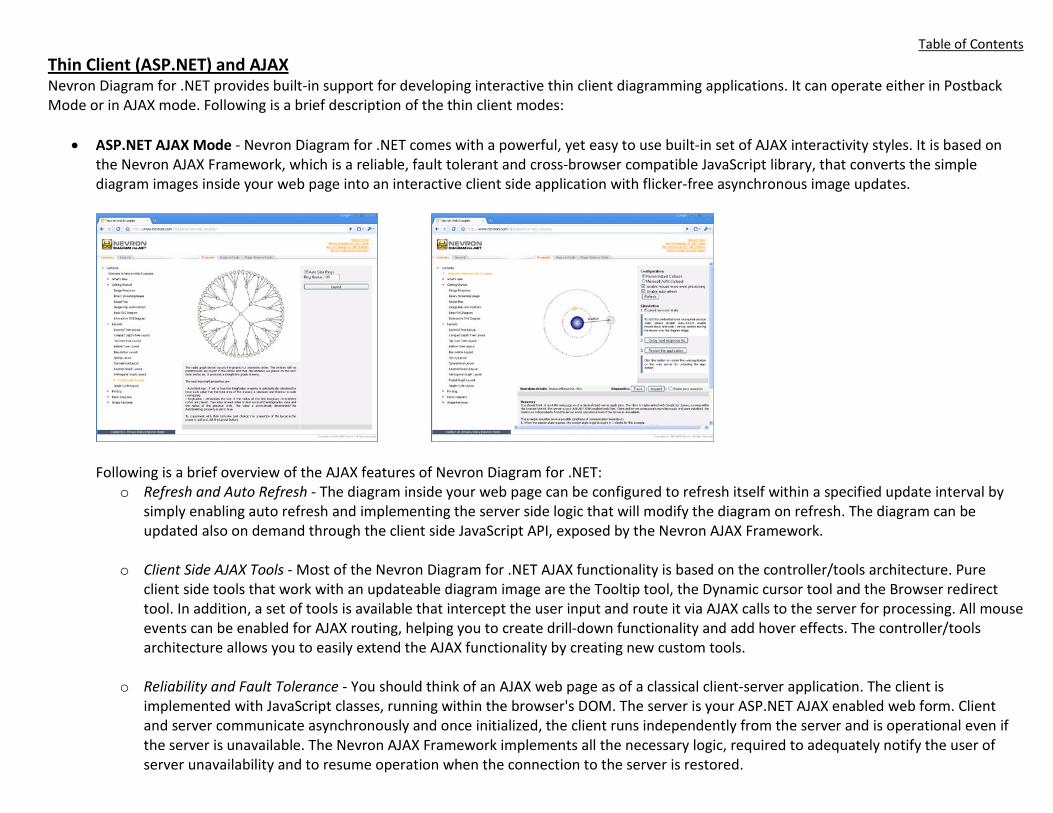
Table of Contents Thin Client (ASP.NET) and AJAX Nevron Diagram for .NET provides built-in support for developing interactive thin client diagramming applications. It can operate either in Postback Mode or in AJAX mode. Following is a brief description of the thin client modes:
• ASP.NET AJAX Mode - Nevron Diagram for .NET comes with a powerful, yet easy to use built-in set of AJAX interactivity styles. It is based on the Nevron AJAX Framework, which is a reliable, fault tolerant and cross-browser compatible JavaScript library, that converts the simple diagram images inside your web page into an interactive client side application with flicker-free asynchronous image updates.
Following is a brief overview of the AJAX features of Nevron Diagram for .NET:
o Refresh and Auto Refresh - The diagram inside your web page can be configured to refresh itself within a specified update interval by simply enabling auto refresh and implementing the server side logic that will modify the diagram on refresh. The diagram can be updated also on demand through the client side JavaScript API, exposed by the Nevron AJAX Framework.
o Client Side AJAX Tools - Most of the Nevron Diagram for .NET AJAX functionality is based on the controller/tools architecture. Pure client side tools that work with an updateable diagram image are the Tooltip tool, the Dynamic cursor tool and the Browser redirect tool. In addition, a set of tools is available that intercept the user input and route it via AJAX calls to the server for processing. All mouse events can be enabled for AJAX routing, helping you to create drill-down functionality and add hover effects. The controller/tools architecture allows you to easily extend the AJAX functionality by creating new custom tools.
o Reliability and Fault Tolerance - You should think of an AJAX web page as of a classical client-server application. The client is
implemented with JavaScript classes, running within the browser's DOM. The server is your ASP.NET AJAX enabled web form. Client and server communicate asynchronously and once initialized, the client runs independently from the server and is operational even if the server is unavailable. The Nevron AJAX Framework implements all the necessary logic, required to adequately notify the user of server unavailability and to resume operation when the connection to the server is restored.
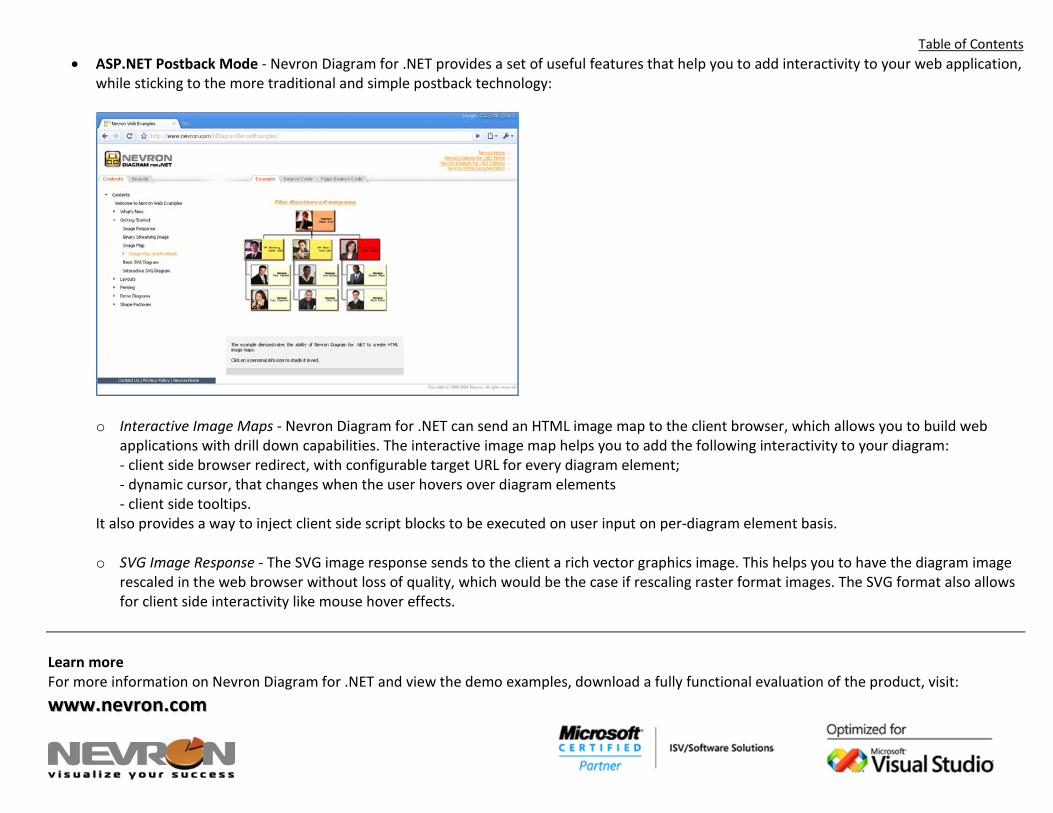
Table of Contents • ASP.NET Postback Mode - Nevron Diagram for .NET provides a set of useful features that help you to add interactivity to your web application,
while sticking to the more traditional and simple postback technology:
o Interactive Image Maps - Nevron Diagram for .NET can send an HTML image map to the client browser, which allows you to build web
applications with drill down capabilities. The interactive image map helps you to add the following interactivity to your diagram: - client side browser redirect, with configurable target URL for every diagram element; - dynamic cursor, that changes when the user hovers over diagram elements - client side tooltips.
It also provides a way to inject client side script blocks to be executed on user input on per-diagram element basis.
o SVG Image Response - The SVG image response sends to the client a rich vector graphics image. This helps you to have the diagram image rescaled in the web browser without loss of quality, which would be the case if rescaling raster format images. The SVG format also allows for client side interactivity like mouse hover effects.
Learn more For more information on Nevron Diagram for .NET and view the demo examples, download a fully functional evaluation of the product, visit:
wwwwww..nneevvrroonn..ccoomm