NEVADA GAMING ABSTRACT 2013
240
NEVADA GAMING ABSTCT 2013 State Gaming Control Board
Transcript of NEVADA GAMING ABSTRACT 2013

NEVADA
GAMING ABSTRACT
2013
State Gaming Control Board

NEVADA
GAMING ABSTRACT
2013
A report of combined financial information reported by nonrestricted Nevada gaming licensees grossing $1 million or more in gaming revenue for the fiscal year ended June 30, 2013.

INTRODUCTION
The 2013 NEVADA GAMING ABSTRACT is presented in the same format as the 2012 Abstract.
Information is presented in the following sequence throughout this report.
Combined Balance Sheet Combined Income Statement - Summary Combined Income Statement- Detail
Casino Department Rooms Department Food Department Beverage Department Other Income
Average Number of Employees Rate of Room Occupancy Per Room Per Day Statistics Gaming Revenue Per Square Foot Ratios
Section 1 features casinos grossing $1,000,000 and over in gaming revenue during the year, with aggregate totals shown Statewide, and for Clark County, Douglas County - South Shore Lake Tahoe, Elko County, Carson Valley, Washoe County, and the Balance of Counties.
Section 2 stratifies certain geographical areas into smaller groups based on gross gaming revenue which includes:
Clark County - Las Vegas Strip, Downtown Las Vegas, Laughlin, Boulder Strip, and Balance of Clark County.
Elko County - Wendover
Washoe County - Reno/Sparks and Balance of Washoe County
Section 3 features Statewide Casinos with Rooms Facilities; and Statewide Publicly Owned Casinos with reported gross gaming revenue of $12,000,000 and over for the year.

PUBLICLY OWNED CASINO OPERATIONS
The following nineteen publicly held corporations, including those with public debt only, own sixty-six casinos grossing $12 million or more from gaming:
AFFINITY GAMING Buffalo Bill's Resort & Casino Primm Valley Resort & Casino Sands Regency, The Terrible's Hotel and Casino Terrible's Rail City Casino Whiskey Pete's Hotel & Casino
ALST CASINO HOLDCO, LLC Aliante Station Casino + Hotel
AMERICAN CASINO & ENTERTAINMENT PROPERTIES, LLC Aquarius Casino Resort Arizona Charlie's Boulder Arizona Charlie's Decatur Stratosphere Tower, Hotel & Casino
AMERISTAR CASINOS, INC. Cactus Petes Resort Casino
BOYD GAMING CORPORATION California Hotel and Casino Fremont Hotel and Casino Gold Coast Hotel and Casino Main Street Station Hotel, Casino and Brewery Orleans Hotel and Casino Sam's Town Hotel & Gambling Hall Suncoast Hotel and Casino
CAESARS ENTERTAINMENT CORPORATION Bally's Las Vegas Bill's Gamblin' Hall & Saloon Caesars Palace Flamingo Las Vegas/O'Sheas Harrah's Casino Hotel Las Vegas Harrah's Casino Hotel Laughlin Harrah's Casino Hotel Reno Harvey's Resort Hotel/Casino and Harrah's Casino Hotel Lake Tahoe Paris Las Vegas Planet Hollywood Resort & Casino Quad Resort and Casino, The Rio Suite Hotel & Casino
PUBLICLY OWNED CASINO OPERATIONS (CONTINUED)
FULL HOUSE RESORTS, INC. Grand Lodge Casino
JACOBS ENTERTAINMENT, INC. Gold Dust West
LAS VEGAS SANDS CORP. Venetian Resort Hotel Casino/Palazzo Resort Hotel Casino
MGM RESORTS INTERNATIONAL Aria Resort & Casino Bellagio Circus Circus Hotel & Casino Circus Circus Hotel/Casino - Reno Excalibur Hotel and Casino Luxor Hotel and Casino Mandalay Bay Resort & Casino MGM Grand Hotel/Casino Mirage, The Monte Carlo Resort & Casino New York - New York Hotel & Casino Silver Legacy Resort Casino
MONARCH CASINO & RESORT, INC. Atlantis Casino Resort
NEVADA PROPERTY 1 LLC Cosmopolitan of Las Vegas, The
NGA HOLDCO, LLC Casablanca Resort & Casino Virgin River Hotel & Casino
PENN NATIONAL GAMING, INC. M Resort Spa and Casino, The
RIVIERA HOLDINGS CORPORATION Riviera Hotel & Casino

PUBLICLY OWNED CASINO OPERATIONS (CONTINUED)
STATION CASINOS LLC Boulder Station Hotel & Casino Fiesta Casino Hotel Fiesta Henderson Casino Hotel Green Valley Ranch Station Casino Palace Station Hotel & Casino Red Rock Casino Resort Spa Santa Fe Station Hotel & Casino Sunset Station Hotel & Casino Texas Station Gambling Hall & Hotel
TROPICANA ENTERTAINMENT, INC. Montbleu River Palms Resort Casino Tropicana Express Hotel & Casino
TROPICANA LAS VEGAS HOTEL AND CASINO, INC. Tropicana Las Vegas
WYNN RESORTS, LIMITED Wynn Las Vegas
Of the 263 casinos included in this report, these sixty-six publicly owned casinos grossed 76.6% of the total reported gaming revenue for the fiscal year ended June 30, 2013.
SPECIAL NOTES:
• THROUGHOUT THE ABSTRACT COLUMN TOTALS MAY NOT BALANCE
WITH LISTED DETAIL DUE TO ROUNDING.
• INFORMATION PRESENTED IN THIS REPORT COMES FROM
UNAUDITED STANDARD FINANCIAL STATEMENTS REQUIRED TO BE
FILED BY ALL NONRESTRICTED LICENSEES WHOSE GROSS GAMING
REVENUE IS $1 MILLION OR MORE FOR COMMON FISCAL YEARS
ENDED JUNE 30.
• NO OTHER INFORMATIONAL BREAKDOWN IS AVAILABLE OTHER
THAN THAT PRESENTED IN THIS REPORT. NAMES OF CASINOS IN
THE VARIOUS GROUPINGS, OTHER THAN THOSE SHOWN FOR
PUBLICLY OWNED CASINOS, ARE NOT AVAILABLE TO USERS OF THIS
REPORT.

SECTION 1 STATEWIDE- SELECTED COUNTIES - BALANCE OF COUNTIES
STATEWIDE
Combined Balance Sheet Combined Income Statement - Summary Combined Income Statement - Detail:
Casino Department Rooms Department Food Department Beverage Department Other Income
Average Number of Employees Rate of Room Occupancy Per Room Per Day Statistics Gaming Revenue per Square Foot Ratios
CLARK COUNTY
Combined Balance Sheet Combined Income Statement - Summary Combined Income Statement - Detail:
Casino Department Rooms Department Food Department Beverage Department Other Income
Average Number ofEmployees Rate of Room Occupancy Per Room Per Day Statistics Gaming Revenue per Square Foot Ratios
INDEX
DOUGLASCOUNTY-SOUTH SHORELAKETAHOE
Combined Balance Sheet Combined Income Statement - Summary Combined Income Statement - Detail:
Casino Department Rooms Department Food Department Beverage Department Other Income
Average Number of Employees Rate of Room Occupancy Per Room Per Day Statistics Gaming Revenue per Square Foot Ratios
Page
1-1 1-2
1-3 1-3 1-4 1-4 1-5 1-5 1-6 1-6 1-7 1-7
1-9 1-10
1-11 1-11 1-12 1-12 1-13 1-13 1-14 1-14 1-15 1-15
1-17 1-18
1-19 1-19 1-20 1-20 1-21 1-21 1-22 1-22 1-23 1-23

SECTION 1 - CONTINUED
STATEWIDE- SELECTED COUNTIES- BALANCE OF COUNTIES
ELKOCOUNTY
Combined Balance Sheet Combined Income Statement - Summary Combined Income Statement - Detail:
Casino Department Rooms Department Food Department
Beverage Department
Other Income
Average Number ofEmployees Rate of Room Occupancy
Per Room Per Day Statistics
Gaming Revenue per Square Foot Ratios
INDEX
CARSON VALLEY (Carson City & Balance of Douglas County)
Combined Balance Sheet
Combined Income Statement - Summary Combined Income Statement - Detail:
Casino Department Rooms Department Food Department Beverage Department Other Income
Average Number of Employees Rate of Room Occupancy Per Room Per Day Statistics Gaming Revenue per Square Foot Ratios
WASHOE COUNTY
Combined Balance Sheet Combined Income Statement - Summary Combined Income Statement - Detail:
Casino Department Rooms Department Food Department Beverage Department Other Income
Average Number of Employees
Rate of Room Occupancy Per Room Per Day Statistics Gaming Revenue per Square Foot Ratios
Page
1-25 1-26
1-27 1-27 1-28 1-28 1-29 1-29 1-30 1-30 1-31 1-31
1-33 1-34
1-35 1-35 1-36 1-36 1-37 1-37 1-38 1-38 1-39 1-39
1-41 1-42
1-43 1-43 1-44 1-44 1-45 1-45 1-46 1-46 1-47 1-47

SECTION 1 - CONTINUED
STATEWIDE - SELECTED COUNTIES - BALANCE OF COUNTIES
BALANCE OF COUNTIES
Combined Balance Sheet Combined Income Statement - Summary Combined Income Statement - Detail:
Casino Department Rooms Department Food Department Beverage Department Other Income
Average Number of Employees Rate of Room Occupancy Per Room Per Day Statistics Gaming Revenue per Square Foot Ratios
INDEX
Page
1-49 1-50
1-51 1-51 1-52 1-52 1-53 1-53 1-54 1-54 1-55 1-55

Fiscal Year 2 0 13 Statewide Casinos
COMBINED BALANCE SHEET
With Gaming Revenue of $ 1 , 0 0 0 , 0 0 0 and over
Amounts Represent 2 6 3 Locations .
ASSETS CURRENT ASSETS
Cash . . . . . . . . . . . . . . . . . . . . . . . . . . . . . . . . . . . . . . . . . . . . . . . . . . . .
Receivables TOTAL ALLOWANCE Casino Trade Sundry Notes
1 , 2 2 4 , 174 , 24 0 6 15 , 9 0 2 , 73 9
7 , 18 9 , 2 8 9 , 9 9 1 1 0 8 , 66 3 , 6 8 3
5 14 , 0 95 , 2 0 8 2 4 , 15 3 , 0 5 7
7 2 1 , 2 04 1 9 , 8 0 0
Prepaid Expenses . . . . . . . . . . . . . . . . . . . . . . . . . . . . . . . . . . . . . . . .
Other Current Assets . . . . . . . . . . . . . . . . . . . . . . . . . . . . . . . . . . . .
TOTAL CURRENT ASSETS . . . . . . . . . . . . . . . . . . . . . . . . . . . . . . . . . . . . . .
FIXED ASSETS COST DEPRECIATION Land 14 , 93 8 , 6 8 5 , 6 5 7 . . . . . . . . . . .
Land Improvements 1 , 4 6 1 , 0 8 1 , 3 4 5 5 0 3 , 4 4 1 , 9 5 3 Buildings & Improvements 3 2 , 1 0 7 , 2 7 5 , 3 6 9 7 , 7 19 , 42 0 , 3 0 8 Furniture & Equipment 11 , 2 3 9 , 4 7 0 , 2 6 0 7 , 2 1 9 , 9 3 2 , 5 8 7 Lease Improvements 2 17 , 4 4 7 , 5 5 5 8 8 , 6 0 3 , 4 8 8 Construction i n Progress 7 8 1 , 5 9 8 , 0 0 7 . . . . . . . . . . .
TOTAL FIXED ASSETS . . . . . . . . . . . . . . . . . . . . . . . . . . . . . . . . . . . . . . . .
OTHER ASSETS
TOTAL ASSETS
LIABILITIES AND CAPITAL CURRENT LIABILITIES
Accounts Payable - Trade . . . . . . . . . . . . . . . . . . . . . . . . . . . . . . . . Accounts Payable - Other . . . . . . . . . . . . . . . . . . . . . . . . . . . . . . . .
Current Portion of Long-Term Debt . . . . . . . . . . . . . . . . . . . . . . . Accrued Expenses . . . . . . . . . . . . . . . . . . . . . . . . . . . . . . . . . . . . . . . .
Other Current Liabil ities . . . . . . . . . . . . . . . . . . . . . . . . . . . . . . . TOTAL CURRENT LIABILITIES . . . . . . . . . . . . . . . . . . . . . . . . . . . . . . . . .
LONG-TERM DEBT TOTAL OWING CURRENT PORTION Mortgages 1 0 , 6 3 8 , 1 8 7 , 1 2 1 8 2 , 9 94 , 2 5 7 Debentures & Bonds 2 , 9 0 3 , 2 1 9 , 4 3 0 1 , 0 55 , 3 4 8 , 4 9 8 Notes 3 , 3 5 0 , 0 92 , 2 5 4 4 7 1 , 3 85 , 15 7 Contracts 1 9 , 3 3 0 , 7 5 1 9 , 6 5 8 , 0 6 1 Other 9 , 3 6 3 , 0 16 , 7 1 6 8 0 , 8 12 , 6 3 0
TOTAL LONG-TERM DEBT 2 6 , 2 73 , 8 4 6 , 2 7 2 1 , 7 0 0 , 198 , 6 0 3 OTHER LIABILITIES . . . . . . . . . . . . . . . . . . . . . . . . . . . . . . . . . . . . . . . . .
TOTAL LIABILITIES
CAPITAL Owners Capital Accounts . . . . . . . . . . . . . . . . . . . . . . . . . . . . . . . . . Capital Stock & Other Capital . . . . . . . . . . . . . . . . . . . . . . . . . . .
Retained Earnings . . . . . . . . . . . . . . . . . . . . . . . . . . . . . . . . . . . . . . . TOTAL CAPITAL . . . . . . . . . . . . . . . . . . . . . . . . . . . . . . . . . . . . . . . . . . . . .
TOTAL LIABILITIES AND CAPITAL . . . . . . . . . . . . . . . . . . . . . . . . . . . . . .
Average Assets 2 5 6 , 0 8 8 , 3 0 8
Upper Quartile 7 1 , 5 7 5 , 2 1 9
Median 1 0 , 78 5 , 674
1 - 1
DOLLARS PERCENT 2 , 4 2 5 , 3 6 0 , 2 0 1
7 1 0 , 0 7 9 , 0 3 2 5 9 1 , 74 9 , 6 8 2
7 , 18 8 , 5 6 8 , 7 8 7 1 0 8 , 64 3 , 8 8 3 4 3 1 , 54 7 , 8 8 8
4 , 2 6 9 , 884 , 02 6 15 , 72 5 , 8 3 3 , 4 99
14 , 93 8 , 6 8 5 , 6 5 7 9 5 7 , 63 9 , 3 92
2 4 , 3 8 7 , 8 5 5 , 0 6 1 4 , 0 19 , 5 3 7 , 6 7 3
128 , 84 4 , 0 6 7 7 8 1 , 5 9 8 , 0 0 7
4 5,2 14 , 15 9 , 8 5 7
6 ! 4 1 1 ! 2 3 1 ! 5 8 7
6 7 , 3 5 1 , 2 2 4 ! 94 3
3 78 , 917 , 9 7 3 2 , 7 8 7 , 117 , 9 94 1 , 7 0 0 , 19 8 , 6 0 3 1 , 0 6 6 , 68 6 , 9 3 7 4 , 6 2 4 , 52 5 , 9 4 7
1 0 , 55 7 , 44 7 , 4 5 4
1 0 , 55 5 , 192 , 8 6 4 1 , 84 7 , 8 7 0 , 9 3 2 2 , 8 7 8 , 7 0 7 , 0 97
9 , 6 7 2 , 6 9 0 9 , 2 8 2 , 2 0 4 , 0 8 6
2 4 , 5 7 3 , 64 7 , 6 6 9 1 0 , 4 3 7 , 44 6 , 5 3 1 4 5 ! 5 6 8 , 54 1 , 6 5 4
- 2 , 74 5 , 9 3 8 , 195 22 , 3 0 3 , 55 0 , 6 2 2
2 , 2 2 5 , 0 7 0 , 8 6 2 2 1 ! 7 8 2 ! 6 8 3 , 2 8 9
6 7 ! 3 5 1 , 2 2 4 , 9 4 3
Lower Quartile 2 , 14 8 , 8 2 0
3 . 6 %
1 . 1% 0 . 9 %
10 . 7 % 0 . 2 % 0 . 6% 6 . 3 %
2 3 . 3 %
22 . 2 % 1 . 4 %
3 6 . 2 % 6 . 0 % 0 . 2 % 1 . 2 %
67 . 1%
9 . 5 %
1 0 0 . 0 %
0 . 6% 4 . 1% 2 . 5 % 1 . 6 % 6 . 9 %
15 . 7 %
15 . 7 % 2 . 7 % 4 . 3 % 0 . 0 %
13 . 8 % 3 6 . 5 % 15 . 5% 67 . 7 %
-4 . 1% 3 3 . 1%
3 . 3 % 32 . 3 %
1 0 0 . 0 %

1 - 2
Fiscal Year 2 0 1 3 Statewide Casinos
COMBINED INCOME STATEMENT - SUMMARY
With Gaming Revenue of $ 1 , 0 0 0 , 0 0 0 and over
Amount s Represent 2 6 3 Locations .
REVENUE Gaming . . . . . . . . . . . . . . . . . . . . . . . . . . . . . . . . . . . . . . . . . . . . . . . . . .
Rooms . . . . . . . . . . . . . . . . . . . . . . . . . . . . . . . . . . . . . . . . . . . . . . . . . . .
Food . . . . . . . . . . . . . . . . . . . . . . . . . . . . . . . . . . . . . . . . . . . . . . . . . . . .
Beverage . . . . . . . . . . . . . . . . . . . . . . . . . . . . . . . . . . . . . . . . . . . . . . . . Other . . . . . . . . . . . . . . . . . . . . . . . . . . . . . . . . . . . . . . . . . . . . . . . . . . .
TOTAL REVENUE . . . . . . . . . . . . . . . . . . . . . . . . . . . . . . . . . . . . . . . . . . . . .
COST OF SALES
GROSS MARGIN
DEPARTMENTAL EXPENSES . . . . . . . . . . . . . . . . . . . . . . . . . . . . . . . . . . . . .
DOLLARS 10 , 3 9 5 , 6 64 , 3 7 7
4 , 7 8 8 , 2 3 7 , 6 6 1 3 , 4 54 , 3 5 1 , 6 2 7 1 , 6 6 0 , 0 3 6 , 952 2 , 7 7 7 , 5 0 9 , 8 7 5
2 3 , 0 7 5 , 8 0 0 , 4 92
1 , 8 2 0 , 164 , 92 3
2 1 , 2 5 5 , 6 3 5 , 5 6 9
12 , 02 2 , 13 8 , 64 1
9 , 2 3 3 , 4 9 6 , 92 8 DEPARTMENTAL INCOME ( LOSS ) . . . . . . . . . . . . . . . . . . . . . . . . . · · · · · · ·
--
�������
GENERAL AND ADMINISTRATIVE EXPENSES Adverti sing and Promotion . . . . . . . . . . . . . . . . . . . . . . . . . . . . . . .
Bad Debt Expense . . . . . . . . . . . . . . . . . . . . . . . . . . . . . . . . . . . . . . . .
Complimentary Expense ( not reported in departments ) . . . . . .
Depreciation - Buildings . . . . . . . . . . . . . . . . . . . . . . . . . . . . . . . .
Depreciation and Amortization - Other . . . . . . . . . . . . . . . . . . .
Energy Expense ( electricity, gas , etc . ) . . . . . . . . . . . . . . . . .
Equipment Rental or Lease . . . . . . . . . . . . . . . . . . . . . . . . . . . . . . .
Interest Expense . . . . . . . . . . . . . . . . . . . . . . . . . . . . . . . . . . . . . . . .
Music and Entertainment . . . . . . . . . . . . . . . . . . . . . . . . . . . . . . . . .
Payroll Taxes . . . . . . . . . . . . . . . . . . . . . . . . . . . . . . . . . . . . . . . . . . .
Payroll - Employee Benefits . . . . . . . . . . . . . . . . . . . . . . . . . . . . .
Payroll - Officers . . . . . . . . . . . . . . . . . . . . . . . . . . . . . . . . . . . . . .
Payroll - Other Employees . . . . . . . . . . . . . . . . . . . . . . . . . . . . . . .
Rent of Premi ses . . . . . . . . . . . . . . . . . . . . . . . . . . . . . . . . . . . . . . . .
Taxes - Real Estate . . . . . . . . . . . . . . . . . . . . . . . . . . . . . . . . . . . . .
Taxes and Licenses - Other . . . . . . . . . . . . . . . . . . . . . . . . . . . . . .
Ut ilities ( Other than Energy Expense ) . . . . . . . . . . . . . . . . . . .
Other General and Admini strative Expenses . . . . . . . . . . . . . . .
TOTAL GENERAL AND ADMINISTRATIVE EXPENSES . . . . . . . . . . . . . . . · · -=�������
NET INCOME ( LOSS ) BEFORE FEDERAL INCOME TAXES AND EXTRAORDINARY ITEMS . . . . . . . . . . . . . . . . . . . . . . . . . . . . . . . . . . . . - 1 , 3 4 8,992 , 93 7
Average Revenue 8 7 , 74 0 , 686
Upper Quartile 6 9 , 0 2 0 , 94 0
Median 1 1 , 8 7 4 , 0 7 4
Lower Quartile 3 , 12 5 , 6 5 1
PERCENT 4 5 . 1 % 2 0 . 8 % 15 . 0 %
7 . 2 % 12 . 0 %
1 0 0 . 0 %
7 . 9 %
92 . 1%
52 . 1%
4 0 . 0 %
- 5 . 8 %

COMBINED INCOME STATEMENT - DETAIL Fiscal Year 2 0 1 3 Statewide Casinos With Gaming Revenue of $ 1 , 0 0 0 , 0 0 0 and over
Amounts Represent 2 6 3 Locations .
CASINO DEPARTMENT
REVENUE Pit Revenue ( Includes Keno and Bingo) . . . . . . . . . . . . . . . . . . . Coin Operated Devices . . . . . . . . . . . . . . . . . . . . . . . . . . . . . . . . . . . Poker and Pan . . . . . . . . . . . . . . . . . . . . . . . . . . . . . . . . . . . . . . . . . . . Race Book . . . . . . . . . . . . . . . . . . . . . . . . . . . . . . . . . . . . . . . . . . . . . . . Sports Pool . . . . . . . . . . . . . . . . . . . . . . . . . . . . . . . . . . . . . . . . . . . . .
TOTAL REVENUE . . . . . . . . . . . . . . . . . . . . . . . . . . . . . . . . . . . . . . . . . . . . .
DEPARTMENTAL EXPENSES Bad Debt Expense . . . . . . . . . . . . . . . . . . . . . . . . . . . . . . . . . . . . . . . . Commissions . . . . . . . . . . . . . . . . . . . . . . . . . . . . . . . . . . . . . . . . . . . . . Complimentary Expense . . . . . . . . . . . . . . . . . . . . . . . . . . . . . . . . . . . Gaming Taxes and Licenses . . . . . . . . . . . . . . . . . . . . . . . . . . . . . . . Preferred Guest Expenses (no complimentaries) . . . . . . . . . . . Payrol l Taxes . . . . . . . . . . . . . . . . . . . . . . . . . . . . . . . . . . . . . . . . . . . Payroll - Employee Benefits . . . . . . . . . . . . . . . . . . . . . . . . . . . . . Payrol l - Officers . . . . . . . . . . . . . . . . . . . . . . . . . . . . . . . . . . . . . . Payroll - Other Employees . . . . . . . . . . . . . . . . . . . . . . . . . . . . . . . Race Wire Fees . . . . . . . . . . . . . . . . . . . . . . . . . . . . . . . . . . . . . . . . . . Other Departmental Expenses . . . . . . . . . . . . . . . . . . . . . . . . . . . . .
TOTAL DEPARTMENTAL EXPENSES . . . . . . . . . . . . . . . . . . . . . . . . . . . . . . .
DEPARTMENTAL INCOME (LOSS ) . . . . . . . . . . . . . . . . . . . . . . . . . . . . . . . . .
ROOMS DEPARTMENT
REVENUE
Room Sales . . . . . . . . . . . . . . . . . . . . . . . . . . . . . . . . . . . . . . . . . . . . . . Complimentary Rooms . . . . . . . . . . . . . . . . . . . . . . . . . . . . . . . . . . . . .
TOTAL REVENUE . . . . . . . . . . . . . . . . . . . . . . . . . . . . . . . . . . . . . . . . . . . . .
DEPARTMENTAL EXPENSES Bad Debt Expense . . . . . . . . . . . . . . . . . . . . . . . . . . . . . . . . . . . . . . . . Complimentary Expense . . . . . . . . . . . . . . . . . . . . . . . . . . . . . . . . . . . Payroll - Taxes . . . . . . . . . . . . . . . . . . . . . . . . . . . . . . . . . . . . . . . . . Payroll - Employee Benefits . . . . . . . . . . . . . . . . . . . . . . . . . . . . . Payroll - Officers . . . . . . . . . . . . . . . . . . . . . . . . . . . . . . . . . . . . . . Payroll - Other Employees . . . . . . . . . . . . . . . . . . . . . . . . . . . . . . . Other Departmental Expenses . . . . . . . . . . . . . . . . . . . . . . . . . . . . .
TOTAL DEPARTMENTAL EXPENSES . . . . . . . . . . . . . . . . . . . . . . . . . . . . . . .
DEPARTMENTAL INCOME (LOSS ) . . . . . . . . . . . . . . . . . . . . . . . . . . . . . . . . .
DOLLARS 3 , 2 9 1 , 4 7 2 , 4 7 9 6 , 7 5 1 , 2 65 , 2 2 6
152 , 74 6 , 6 8 8 6 3 , 3 5 3 , 2 0 6
1 3 6 , 82 6 , 7 7 8 10 , 3 9 5 , 664 , 3 7 7
144 , 3 0 8 , 5 0 8 72 , 15 3 , 0 5 8
2 , 16 5 , 2 3 9 , 6 5 1 8 04 , 0 6 9 , 575 2 3 7 , 4 7 5 , 0 1 0 1 77 , 84 5 , 2 0 7 3 0 0 , 934 , 94 0
2 1 , 175 , 2 17 1 , 2 04 , 5 18 , 32 8
13 , 944 , 14 8 8 94 , 14 1 , 0 4 9
6 , 0 3 5 , 8 0 4 , 6 9 1
4 , 3 5 9 , 8 5 9!686
DOLLARS 3 , 8 1 0 , 82 2 , 6 1 9
9 7 7 , 4 1 5 , 042 4 , 7 8 8 , 2 3 7 ! 66 1
1 5 , 4 3 5 , 0 5 8 1 3 4 , 77 3 , 155
9 8 , 8 9 6 , 624 2 6 9 , 8 1 7 , 5 7 7
7 , 117 , 94 0 9 3 3 , 18 0 , 8 2 4 5 9 9 , 3 8 7 , 2 8 4
2 , 0 5 8 , 6 0 8 , 4 62
2 , 72 9 , 6 2 9!199
1 - 3
PERCENT 3 1 . 7% 6 4 . 9%
1 . 5% 0 . 6% 1 . 3 %
1 0 0 . 0 %
1 . 4 % 0 . 7 %
2 0 . 8 % 7 . 7% 2 . 3 % 1 . 7 % 2 . 9% 0 . 2 %
11 . 6 % 0 . 1% 8 . 6%
5 8 . 1%
4 1 . 9%
PERCENT 7 9 . 6 % 2 0 . 4 %
1 0 0 . 0 %
0 . 3 % 2 . 8 % 2 . 0 % 5 . 6 % 0 . 1%
1 9 . 5% 12 . 5 % 4 3 . 0 %
5 7 . 0 %

1 - 4 COMBINED INCOME STATEMENT - DETAIL ( CONTINUED)
Fiscal Year 2 0 13 Statewide Casinos With Gaming Revenue of $1 , 0 0 0 , 0 0 0 and over
Amounts Represent 2 6 3 Locations .
FOOD DEPARTMENT REVENUE
Food Sales . . . . . . . . . . . . . . . . . . . . . . . . . . . . . . . . . . . . . . . . . . . . . .
Compl imentary Food Sales . . . . . . . . . . . . . . . . . . . . . . . . . . . . . . . .
TOTAL REVENUE . . . . . . . . . . . . . . . . . . . . . . . . . . . . . . . . . . . . . . . . . . . . .
COST OF SALES
GROSS MARGIN
DEPARTMENTAL EXPENSES Bad Debt Expense . . . . . . . . . . . . . . . . . . . . . . . . . . . . . . . . . . . . . . . .
Complimentary Expense . . . . . . . . . . . . . . . . . . . . . . . . . . . . . . . . . . .
Payroll - Taxes . . . . . . . . . . . . . . . . . . . . . . . . . . . . . . . . . . . . . . . . .
Payroll - Employee Benefits . . . . . . . . . . . . . . . . . . . . . . . . . . . . . Payroll - Officers . . . . . . . . . . . . . . . . . . . . . . . . . . . . . . . . . . . . . .
Payroll - Other Employees . . . . . . . . . . . . . . . . . . . . . . . . . . . . . . . Other Departmental Expenses . . . . . . . . . . . . . . . . . . . . . . . . . . . . .
TOTAL DEPARTMENTAL EXPENSES . . . . . . . . . . . . . . . . . . . . . . . . . . . . . . .
DEPARTMENTAL INCOME (LOSS ) . . . . . . . . . . . . . . . . . . . . . . . . . . . . . . . . .
BEVERAGE DEPARTMENT REVENUE
Beverage Sales . . . . . . . . . . . . . . . . . . . . . . . . . . . . . . . . . . . . . . . . . .
Complimentary Beverage Sales . . . . . . . . . . . . . . . . . . . . . . . . . . . . TOTAL REVENUE . . . . . . . . . . . . . . . . . . . . . . . . . . . . . . . . . . . . . . . . . . . . .
COST OF SALES
GROSS MARGIN . . . . . . . . . . . . . . . . . . . . . . . . . . . . . . . . . . . . . . . . . . . . . .
DEPARTMENTAL EXPENSES Bad Debt Expense . . . . . . . . . . . . . . . . . . . . . . . . . . . . . . . . . . . . . . . .
Complimentary Expense . . . . . . . . . . . . . . . . . . . . . . . . . . . . . . . . . . . Payroll - Taxes . . . . . . . . . . . . . . . . . . . . . . . . . . . . . . . . . . . . . . . . .
Payroll - Employee Benefits . . . . . . . . . . . . . . . . . . . . . . . . . . . . .
Payroll - Officers . . . . . . . . . . . . . . . . . . . . . . . . . . . . . . . . . . . . . .
Payroll - Other Employees . . . . . . . . . . . . . . . . . . . . . . . . . . . . . . . Other Departmental Expenses . . . . . . . . . . . . . . . . . . . . . . . . . . . . .
TOTAL DEPARTMENTAL EXPENSES . . . . . . . . . . . . . . . . . . . . . . . . . . . . . . .
DEPARTMENTAL INCOME ( LOSS) . . . . . . . . . . . . . . . . . . . . . . . . . . . . . . . . .
DOLLARS 2 , 7 84 , 62 9 , 6 4 5
6 6 9 , 72 1 , 982 3 , 4 54 , 3 5 1 , 62 7
1 , 1 12 , 2 2 0 , 3 8 7
2 , 34 2 , 1 3 1 , 2 4 0
3 , 0 3 0 , 5 74 3 3 , 7 8 7 , 3 73
15 6 , 2 9 9 , 5 0 1 3 5 6 , 54 6 , 8 8 0
3 2 , 4 0 6 , 622 1 , 2 5 2 , 6 8 5 , 8 5 0
2 12 , 5 5 9 , 3 3 8 2 , 0 4 7 , 3 1 6 , 1 3 8
2 94 , 8 1 5 , 102
DOLLARS 1 , 0 12 , 7 3 3 , 0 64
64 7 , 3 0 3 , 8 8 8 1 , 6 6 0 , 0 3 6 , 952
3 2 7 , 55 3 , 6 2 1
1 , 3 3 2 , 4 8 3 , 3 3 1
4 1 7 , 8 6 7 3 3 , 0 5 4 , 8 2 3 4 1 , 3 14 , 7 8 8 8 9 , 1 6 9 , 9 3 3
1 , 7 7 4 , 0 12 2 9 0 , 2 3 8 , 3 8 2 2 4 9 , 14 0 , 444 7 0 5 , 11 0 , 2 4 9
6 2 7 , 3 7 3 , 0 8 2
PERCENT 8 0 . 6 % 1 9 . 4 %
1 0 0 . 0 %
3 2 . 2 %
6 7 . 8 %
0 . 1% 1 . 0 % 4 . 5 %
1 0 . 3 % 0 . 9%
3 6 . 3 % 6 . 2 %
5 9 . 3 %
8 . 5 %
PERCENT 6 1 . 0 % 3 9 . 0 %
1 0 0 . 0 %
1 9 . 7 %
8 0 . 3 %
0 . 0 % 2 . 0 % 2 . 5 % 5 . 4 % 0 . 1%
1 7 . 5 % 15 . 0 % 4 2 . 5 %
3 7 . 8 %

COMBINED INCOME STATEMENT - DETAIL { CONTINUED)
Fiscal Year 2 0 13 Statewide Casinos With Gaming Revenue of $ 1 , 0 0 0 , 0 0 0 and over
Amounts Represent 2 6 3 Locations .
OTHER INCOME REVENUE
Other Operating and Non-operating Income . . . . . . . . . . . . . . . .
Other Complimentary Items . . . . . . . . . . . . . . . . . . . . . . . . . . . . . . .
TOT,AL REVENUE . . . . . . . . . . . . . . . . . . . . . . . . . . . . . . . . . . . . . . • . . . . . .
COST OF SALES . . . . . . . . . . . . . . . . . . . . . . . . . . . . . . . . . . . . . . . . . . . . .
GROSS MARGIN . . . . . . . . . . . . . . . . . . . . . . . . . . . . . . . . . . . . . . . . . . . . . .
DEPARTMENTAL EXPENSES Bad Debt Expense . . . . . . . . . . . . . . . . . . . . . . . . . . . . . . . . . . . . . . . .
Complimentary Expense . . . . . . . . . . . . . . . . . . . . . . . . . . . . . . . . . . .
Payroll - Taxes . . . . . . . . . . . . . . . . . . . . . . . . . . . . . . . . . . . . . . . . .
Payrol l - Employee Benefits . . . . . . . . . . . . . . . . . . . . . . . . . . . . . Payrol l - Officers . . . . . . . . . . . . . . . . . . . . . . . . . . . . . . . . . . . . . .
Payrol l - Other Employees . . . . . . . . . . . . . . . . . . . . . . . . . . . . . . .
Other Departmental Expenses . . . . . . . . . . . . . . . . . . . . . . . . . . . . . TOTAL DEPARTMENTAL EXPENSES . . . . . . . . . . . . . . . . . . . . . . . . . . . . . . .
DEPARTMENTAL INCOME {LOSS ) . . . . . . . . . . . . . . . . . . . . . . . . . . . . . . . . .
AVERAGE NUMBER OF EMPLOYEES FOR THE YEAR
CASINO DEPARTMENT . . . . . . . . . . . . . . . . . . . . .
ROOMS DEPARTMENT . . . . . . . . . . . . . . . . . . . . . .
FOOD DEPARTMENT . . . . . . . . . . . . . . . . . . . . . . .
BEVERAGE DEPARTMENT . . . . . . . . . . . . . . . . . . .
G & A DEPARTMENT . . . . . . . . . . . . . . . . . . . . .
OTHER DEPARTMENTS . . . . . . . . . . . . . . . . . . . . .
TOTAL
DOLLARS 2 , 63 8 , 8 12 , 4 0 8
1 3 8 , 6 9 7 , 4 6 7 2 , 7 7 7 , 5 0 9 , 8 7 5
3 8 0 , 3 9 0 , 915
2 , 3 97 , 11 8 , 9 6 0
4 , 190 , 2 4 2 4 1 , 0 8 4 , 0 9 3 44 , 94 8 , 6 2 5 7 8 , 94 7 , 3 1 8
3 , 7 2 4 , 16 9 4 3 6 , 8 0 3 , 06 7 5 65 , 6 0 1 , 5 8 7
1 , 1 75 , 2 9 9,10 1
1 , 2 2 1 , 8 1 9 , 8 5 9
4 2 , 3 5 7 2 9 , 8 7 6 4 3 , 6 14 1 1 , 6 9 2 2 9 , 3 3 2 13 , 0 3 7
169 , 90 8
1 - 5
PERCENT 95 . 0 %
5 . 0 % 1 0 0 . 0 %
13 . 7%
8 6 . 3 %
0 . 2 % 1 . 5% 1 . 6% 2 . 8 % 0 . 1%
15 . 7 % 2 0 . 4 % 4 2 . 3 %
4 4 . 0 %

1 - 6 ROOM OCCUPANCY AND PER ROOM PER DAY ANALYSIS
Fiscal Year 2 0 1 3 Statewide Cas inos With Gaming Revenue of $ 1 , 0 0 0 , 0 0 0 and over
Amounts Represent 2 6 3 Locations .
MONTH JULY . . . . . . . . . . AUGUST . . . . . . . . SEPTEMBER . . . . . OCTOBER . . . . . . . NOVEMBER . . . . . . DECEMBER . . . . . . JANUARY . . . . . . . FEBRUARY . . . . . . MARCH . . . . . . . . . APRIL . . . . . . . . . MAY . . . . . . . . . . . JUNE . . . . . . . . . .
TOTAL . . . . . . . . .
Average Pit Revenue Per Room Per Day
Average Slot Revenue Per Room Per Day
Average Food Sales Per Room Per Day
RATE OF ROOM OCCUPANCY
AVAILABLE ROOMS ROOMS OCCUPIED
4 , 4 5 6 , 8 4 2 3 , 8 6 6 , 112 4 , 4 3 3 , 7 3 2 3 , 7 0 7 , 5 2 8 4 , 3 11 , 4 0 1 3 , 65 6 , 3 3 3 4 , 4 3 4 , 7 4 1 3 , 7 8 9 , 2 1 6 4 , 2 5 1 , 5 2 7 3 , 24 8 , 8 2 9 4 , 3 7 2 , 6 1 8 3 , 2 15 , 94 9 4 , 4 3 1 , 3 1 9 3 , 3 8 4 , 2 5 8 4 , 0 04 , 72 0 3 , 2 6 5 , 0 2 8 4 , 4 8 2 , 4 52 3 , 8 6 1 , 0 6 8 4 , 3 13 , 02 8 3 , 6 8 2 , 1 6 7 4 , 4 3 1 , 8 3 5 3 , 7 6 1 , 2 3 8 4 , 3 12 , 92 9 3 , 7 6 7 , 0 7 5
5 2 , 2 3 7 , 144 4 3 , 2 04 , 8 0 1
PER ROOM PER DAY STATISTICS
7 6 . 1 8
1 5 6 . 2 6
7 9 . 95
Average Beverage Sales Per Room Per Day
Average Rooms Department Payrol l Per Room Per Day
Average Room Rate Per Day
% OF OCCUPANCY
( COMPUTED) 8 6 . 7 5 % 8 3 . 62 % 84 . 8 1 % 8 5 . 4 4 % 7 6 . 4 2 % 7 3 . 5 5% 7 6 . 3 7 % 8 1 . 5 3 % 8 6 . 14 % 8 5 . 3 7 % 84 . 8 7 % 8 7 . 3 4 %
8 2 . 7 1%
3 8 . 4 2
3 0 . 3 0
110 . 8 3

PER SQUARE FOOT ANALYSIS AND RATIOS 1 - 7 Fiscal Year 2 0 1 3 Statewide Casinos With Gaming Revenue of $ 1 , 0 0 0 , 0 0 0 and over
Amounts Represent 2 6 3 Locations .
GAMING REVENUE PER SQUARE FOOT OF FLOOR SPACE
NO . OF CASINOS AVERAGE AREA GAMING REVENUE AREA OPERATING IN SQUARE FEET PER SQUARE FOOT
Pit ( Includes Bingo and Keno ) 1 5 0 9 , 2 4 7 Coin Operated Devices 2 52 2 5 , 8 1 8 Poker and Pan 9 1 1 , 9 1 9 Race and Sports 9 0 4 , 6 1 3
TOTAL CASINO 2 6 3 3 2 , 2 5 5
RATIOS
TOTAL_CURRENT ASSETS TO TOTAL CURRENT LIABILITIES . . . . . . . . .
TOTAL CAPITAL TO TOTAL LIABILITIES . . . . . . . . . . . . . . . . . . . . . . . .
TOTAL CAPITAL TO TOTAL CURRENT LIABILITIES . . . . . . . . . . . . . . . .
TOTAL CURRENT LIABILITIES TO TOTAL LIABILITIES . . . . . . . . . . . .
TOTAL COMPLIMENTARY EXPENSE TO GAMING REVENUE . . . . . . . . . . . . .
MUSIC AND ENTERTAINMENT EXPENSES TO GAMING REVENUE . . . . . . . .
TOTAL REVENUE TO AVERAGE TOTAL ASSETS . . . . . . . . . . . . . . . . . . . . .
TOTAL REVENUE LESS COMP SALES TO AVERAGE TOTAL ASSETS . . . . .
RETURN ON INVESTED CAPITAL* . . . . . . . . . . . . . . . . . . . . . . . . . . . . . . .
RETURN ON AVERAGE ASSETS* . . . . . . . . . . . . . . . . . . . . . . . . . . . . . . . . .
* - FORMULAS
Return on Invested Capital is equal to the total of net income (before federal income taxes and extraordinary items ) and interest expense divided by the total of average total assets less average current liabilities .
2 , 3 6 3 1 , 0 3 8
8 7 1 4 8 0
1 , 2 2 5
PERCENT 1 4 9 . 0%
4 7 . 8 %
2 0 6.3 %
2 3 . 2 %
2 5 . 0 %
3 . 0 %
3 1 . 8%
2 8 . 4 %
2 . 9 %
2 . 2 %
Return on Average Assets is equal to the total of net income (before federal income taxes and extraordinary items ) and interest expense divided by the average total assets .
1 - 8
THIS PAGE LEFT INTENTIONALLY BLANK

Fiscal Year 2 0 13 Clark County
COMBINED BALANCE SHEET
With Gaming Revenue of $ 1 , 0 0 0 , 0 0 0 and over
Amounts Represent 150 Locations .
ASSETS CURRENT ASSETS
Cash . . . . . . . . . . . . . . . . . . . . . . . . . . . . . . . . . . . . . . . . . . . . . . . . . . . . Receivables TOTAL ALLOWANCE
Casino 1 , 185 , 19 7 , 2 8 6 4 96 , 22 1 , 2 3 6 Trade 5 0 1 , 97 7 , 5 4 8 22 , 65 6 , 4 2 6 Sundry 7 , 15 9 , 117 , 165 6 94 , 0 54 Notes 7 , 4 8 2 , 2 1 2 0
Prepaid Expenses . . . . . . . . . . . . . . . . . . . . . . . . . . . . . . . . . . . . . . . . Other Current Assets . . . . . . . . . . . . . . . . . . . . . . . . . . . . . . . . . . . .
TOTAL CURRENT ASSETS . . . . . . . . . . . . . . . . . . . . . . . . . . . . . . . . . . . . . .
FIXED ASSETS COST DEPRECIATION Land 14 , 63 7 , 7 0 8 , 2 7 5 . . . . . . . . . . . Land Improvements 1 , 4 3 2 , 0 6 0 , 0 1 5 4 8 8 , 0 7 6 , 3 15 Buildings & Improvements 2 9 , 9 3 1 , 3 0 0 , 44 4 6 , 910 , 2 92 , 6 12 Furniture & Equipment 9 , 7 7 3 , 3 7 9 , 4 8 8 6 , 04 0 , 18 9 , 7 6 8 Lease Improvements 1 3 9 , 4 7 9 , 5 2 3 54 , 6 6 9 , 9 8 3 Construction in Progress 7 4 8 , 08 0 , 6 3 6 . . . . . . . . . . .
TOTAL FIXED ASSETS . . . . . . . . . . . . . . . . . . . . . . . . . . . . . . . . . . . . . . . .
OTHER ASSETS
TOTAL ASSETS
LIABILITIES AND CAPITAL CURRENT LIABILITIES
Accounts Payable - Trade . . . . . . . . . . . . . . . . . . . . . . . . . . . . . . . . Accounts Payable - Other . . . . . . . . . . . . . . . . . . . . . . . . . . . . . . . . Current Portion of Long-Term Debt . . . . . . . . . . . . . . . . . . . . . . . Accrued Expenses . . . . . . . . . . . . . . . . . . . . . . . . . . . . . . . . . . . . . . . . Other Current Liabilities . . . . . . . . . . . . . . . . . . . . . . . . . . . . . . .
TOTAL CURRENT LIABILITIES . . . . . . . . . . . . . . . . . . . . . . . . . . . . . . . . .
LONG-TERM DEBT Mortgages Debentures & Bonds Notes Contracts Other
TOTAL LONG-TERM DEBT OTHER LIABILITIES TOTAL LIABILITIES
CAPITAL
TOTAL OWING 1 0 , 4 9 6 , 99 1 , 3 6 9
2 , 6 90 , 5 7 3 , 3 7 8 3 , 0 9 3 , 0 0 4 , 4 4 4
11 , 4 8 6 , 0 5 3 8 , 42 6 , 2 92 , 7 9 0
24 , 7 18 , 3 4 8 , 0 3 4
CURRENT PORTION 4 5 , 914 , 144
1 , 0 55 , 34 8 , 4 9 8 4 55 , 2 8 6 , 7 1 8
5 , 7 04 , 6 12 7 8 , 5 5 1 , 8 0 9
1 , 6 4 0 , 8 0 5 , 7 8 1
Owners Capital Accounts . . . . . . . . . . . . . . . . . . . . . . . . . . . . . . . . . Capital Stock & Other Capital . . . . . . . . . . . . . . . . . . . . . . . . . . . Retained Earnings . . . . . . . . . . . . . . . . . . . . . . . . . . . . . . . . . . . . . . .
TOTAL CAPITAL . . . . . . . . . . . . . . . . . . . . . . . . . . . . . . . . . . . . . . . . . . . . .
TOTAL LIABILITIES AND CAPITAL . . . . . . . . . . . . . . . . . . . . . . . . . . . . . .
Average Assets 4 2 8 , 174 , 1 3 8
Upper Quartile 2 8 7 , 5 3 8 , 2 0 7
Median 2 6 , 7 8 8 , 8 8 6
1 - 9
DOLLARS PERCENT 2 , 16 7 , 176 , 7 2 6
6 8 8 , 9 7 6 , 0 5 0 4 7 9 , 3 2 1 , 1 2 2
7 , 15 8 , 4 2 3 , 1 1 1 7 , 4 82 , 2 12
3 7 8 , 941 , 92 8 4 , 1 9 6 , 53 8 , 0 6 6
15 , 0 7 6 , 85 9 , 2 1 5
14 , 6 3 7 , 7 0 8 , 2 7 5 9 4 3 , 98 3 , 7 0 0
2 3 , 0 2 1 , 0 0 7 , 8 3 2 3 , 7 3 3 , 18 9 , 7 2 0
8 4 , 8 0 9 , 54 0 7 4 8 , 0 8 0 , 6 3 6
4 3 , 16 8 , 7 7 9 , 7 0 3
5 ! 98 014 8 1 , 74 8
6412 2 6112 0 , 6 6 6
3 32 , 44 8 , 2 5 8 2 , 84 0 , 0 0 3 , 10 8 1 , 64 0 , 8 0 5 , 7 8 1
9 6 0 , 10 0 , 3 3 0 4 , 5 6 9 , 8 94 , 7 6 3
10134 3 , 2 52 , 24 0
1 0 , 4 5 1 , 0 7 7 , 2 2 5 1 , 6 3 5 , 224 , 8 8 0 2 , 6 3 7 , 7 17 , 7 2 6
5 , 7 8 1 , 4 4 1 8 , 3 4 7 , 74 0 , 9 8 1
2 3 , 0 7 7 , 54 2 , 2 5 3 10 , 2 5 5 , 744 , 2 8 1 4 3 , 6 7 6 ! 5 3 8 , 7 7 4
- 3 , 8 9 0 , 17 1 , 0 7 7 22 , 3 7 2 , 82 1 , 7 4 7
2 , 0 6 6 , 93 1 , 2 2 2 2 0!54 915 8 1 ! 8 92
6412 2 6 , 12 0 , 6 6 6
Lower Quartile 3 , 4 3 6 , 6 1 7
3 . 4 %
1 . 1% 0 . 7%
11 . 1% 0 . 0 % 0 . 6 % 6 . 5 %
2 3 . 5 %
22 . 8 % 1 . 5%
3 5 . 8 % 5 . 8 % 0 . 1% 1 . 2 %
6 7 . 2 %
9 . 3 %
1 0 0 . 0 %
0 . 5 % 4 . 4 % 2 . 6 % 1 . 5 % 7 . 1%
16 . 1%
16 . 3 % 2 . 5% 4 . 1% 0 . 0 %
13 . 0 % 3 5 . 9% 16 . 0 % 6 8 . 0 %
- 6 . 1% 3 4 . 8 %
3 . 2 % 3 2 . 0 %
1 0 0 . 0 %

1 - 1 0
Fiscal Year 2 0 13 Clark County
COMBINED INCOME STATEMENT - SUMMARY
With Gaming Revenue of $1 , 0 0 0 , 0 0 0 and over
Amounts Represent 1 5 0 Locations .
REVENUE Gaming . . . . . . . . . . . . . . . . . . . . . . . . . . . . . . . . . . . . . . . . . . . . . . . . . .
Rooms . . . . . . . . . . . . . . . . . . . . . . . . . . . . . . . . . . . . . . . . . . . . . . . . . . .
Food . . . . . . . . . . . . . . . . . . . . . . . . . . . . . . . . . . . . . . . . . . . . . . . . . . . .
Beverage . . . . . . . . . . . . . . . . . . . . . . . . . . . . . . . . . . . . . . . . . . . . . . . .
Other . . . . . . . . . . . . . . . . . . . . . . . . . . . . . . . . . . . . . . . . . . . . . . . . . . .
TOTAL REVENUE . . . . . . . . . . . . . . . . . . . . . . . . . . . . . . . . . . . . . . . . . . . . .
COST OF SALES
GROSS MARGIN
DEPARTMENTAL EXPENSES . . . . . . . . . . . . . . . . . . . . . . . . . . . . . . . . . . . . .
DOLLARS 8 , 9 7 5 , 8 12 , 4 2 2 4 , 4 4 2 , 656 , 1 8 5 3 , 0 8 7 , 0 6 0 , 9 3 4 1 , 4 8 5 , 5 7 3 , 8 6 3 2 , 5 9 1 , 9 9 7 , 1 0 9
2 0 , 5 8 3 , 1 0 0 , 5 1 3
1 , 5 3 6 , 4 54 , 8 6 6
1 9 , 04 6 , 645 , 64 7
1 0 , 8 0 1 , 0 13 , 8 5 0
8 , 24 5 , 6 3 1 , 7 9 7 DEPARTMENTAL INCOME (LOSS ) . . . . . . . . . . . . . . . . . . . . . . . . . . · · · · · · --������
GENERAL AND ADMINISTRATIVE EXPENSES Advertis ing and Promotion . . . . . . . . . . . . . . . . . . . . . . . . . . . . . . .
Bad Debt Expense . . . . . . . . . . . . . . . . . . . . . . . . . . . . . . . . . . . . . . . .
Comp limentary Expense (not reported in departments ) . . . . . .
Depreciation - Bui ldings . . . . . . . . . . . . . . . . . . . . . . . . . . . . . . . .
Depreciation and Amorti zation - Other . . . . . . . . . . . . . . . . . . .
Energy Expense (electricity, gas , etc . ) . . . . . . . . . . . . . . . . .
Equipment Rental or Lease . . . . . . . . . . . . . . . . . . . . . . . . . . . . . . .
Interest Expense . . . . . . . . . . . . . . . . . . . . . . . . . . . . . . . . . . . . . . . .
Music and Entertainment . . . . . . . . . . . . . . . . . . . . . . . . . . . . . . . . .
Payrol l Taxes . . . . . . . . . . . . . . . . . . . . . . . . . . . . . . . . . . . . . . . . . . .
Payrol l - Employee Benefits . . . . . . . . . . . . . . . . . . . . . . . . . . . . .
Payrol l - Officers . . . . . . . . . . . . . . . . . . . . . . . . . . . . . . . . . . . . . .
Payrol l - Other Employees . . . . . . . . . . . . . . . . . . . . . . . . . . . . . . .
Rent of Premises . . . . . . . . . . . . . . . . . . . . . . . . . . . . . . . . . . . . . . . .
Taxes - Real Estate . . . . . . . . . . . . . . . . . . . . . . . . . . . . . . . . . . . . .
Taxes and Licenses - Other . . . . . . . . . . . . . . . . . . . . . . . . . . . . . .
Uti li ties (Other than Energy Expense) . . . . . . . . . . . . . . . . . . .
Other General and Administrative Expenses . . . . . . . . . . . . . . . TOTAL GENERAL AND ADMIN ISTRATIVE EXPENSES . . . . . . . . . . . . · · · · · --�������
NET INCOME (LOSS ) BEFORE FEDERAL INCOME TAXES AND EXTRAORDINARY ITEMS . . . . . . . . . . . . . . . . . . . . . . . . . . . . . . . . . . . . - 1 , 3 3 7 , 1 0 6 , 3 4 0
Average Revenue 1 3 7 , 2 2 0 , 6 7 0
Upper Quartile 12 9 , 4 57 , 9 8 9
Median 4 1 , 3 12 , 54 7
Lower Quart ile 4 , 2 5 3 , 052
PERCENT 4 3 . 6 % 2 1 . 6 % 15 . 0 %
7 . 2 % 12 . 6 %
1 0 0 . 0 %
7 . 5 %
92 . 5 %
52 . 5 %
4 0 . 1%
- 6 . 5 %
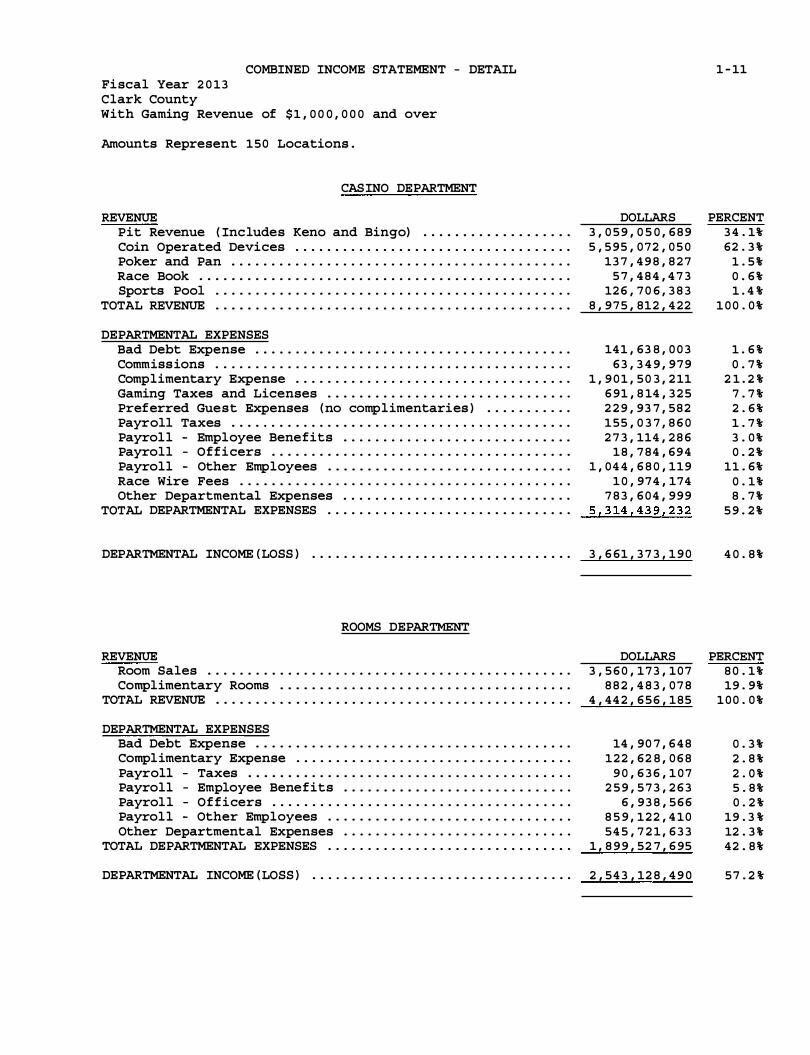
COMBINED INCOME STATEMENT - DETAIL Fiscal Year 2 0 13 Clark County With Gaming Revenue of $ 1 , 0 0 0 , 0 0 0 and over
Amounts Represent 150 Locations .
CASINO DEPARTMENT
REVENUE
Pit Revenue ( Includes Keno and Bingo) . . . . . . . . . . . . . . . . . . . Coin Operated Devices . . . . . . . . . . . . . . . . . . . . . . . . . . . . . . . . . . . Poker and Pan . . . . . . . . . . . . . . . . . . . . . . . . . . . . . . . . . . . . . . . . . . . Race Book . . . . . . . . . . . . . . . . . . . . . . . . . . . . . . . . . . . . . . . . . . . . . . . Sports Pool . . . . . . . . . . . . . . . . . . . . . . . . . . . . . . . . . . . . . . . . . . . . .
TOTAL REVENUE . . . . . . . . . . . . . . . . . . . . . . . . . . . . . . . . . . . . . . . . . . . . .
DEPARTMENTAL EXPENSES Bad Debt Expense . . . . . . . . . . . . . . . . . . . . . . . . . . . . . . . . . . . . . . . . Commissions . . . . . . . . . . . . . . . . . . . . . . . . . . . . . . . . . . . . . . . . . . . . .
Complimentary Expense . . . . . . . . . . . . . . . . . . . . . . . . . . . . . . . . . . . Gaming Taxes and Licenses . . . . . . . . . . . . . . . . . . . . . . . . . . . . . . . Preferred Guest Expenses (no complimentaries ) . . . . . . . . . . . Payroll Taxes . . . . . . . . . . . . . . . . . . . . . . . . . . . . . . . . . . . . . . . . . . . Payroll - Employee Benefits . . . . . . . . . . . . . . . . . . . . . . . . . . . . . Payroll - Officers . . . . . . . . . . . . . . . . . . . . . . . . . . . . . . . . . . . . . . Payroll - Other Employees . . . . . . . . . . . . . . . . . . . . . . . . . . . . . . . Race Wire Fees . . . . . . . . . . . . . . . . . . . . . . . . . . . . . . . . . . . . . . . . . . Other Departmental Expenses . . . . . . . . . . . . . . . . . . . . . . . . . . . . .
TOTAL DEPARTMENTAL EXPENSES . . . . . . . . . . . . . . . . . . . . . . . . . . . . . . .
DEPARTMENTAL INCOME (LOSS ) . . . . . . . . . . . . . . . . . . . . . . . . . . . . . . . . .
ROOMS DEPARTMENT
REVENUE
Room Sales . . . . . . . . . . . . . . . . . . . . . . . . . . . . . . . . . . . . . . . . . . . . . . Complimentary Rooms . . . . . . . . . . . . . . . . . . . . . . . . . . . . . . . . . . . . .
TOTAL REVENUE . . . . . . . . . . . . . . . . . . . . . . . . . . . . . . . . . . . . . . . . . . . . .
DEPARTMENTAL EXPENSES Bad Debt Expense . . . . . . . . . . . . . . . . . . . . . . . . . . . . . . . . . . . . . . . . Complimentary Expense . . . . . . . . . . . . . . . . . . . . . . . . . . . . . . . . . . . Payroll - Taxes . . . . . . . . . . . . . . . . . . . . . . . . . . . . . . . . . . . . . . . . . Payroll - Employee Benefits . . . . . . . . . . . . . . . . . . . . . . . . . . . . . Payroll - Officers . . . . . . . . . . . . . . . . . . . . . . . . . . . . . . . . . . . . . . Payroll - Other Employees . . . . . . . . . . . . . . . . . . . . . . . . . . . . . . . Other Departmental Expenses . . . . . . . . . . . . . . . . . . . . . . . . . . . . .
TOTAL DEPARTMENTAL EXPENSES . . . . . . . . . . . . . . . . . . . . . . . . . . . . . . .
DEPARTMENTAL INCOME (LOSS ) . . . . . . . . . . . . . . . . . . . . . . . . . . . . . . . . .
DOLLARS 3 , 0 5 9 , 0 5 0 , 6 8 9 5 , 5 95 , 0 72 , 0 5 0
13 7 , 4 9 8 , 8 2 7 5 7 , 4 8 4 , 4 7 3
12 6 , 7 0 6 , 3 8 3 8 , 9 7 5 , 812 , 4 22
14 1 , 63 8 , 0 0 3 6 3 , 3 4 9 , 9 7 9
1 , 9 0 1 , 5 0 3 , 2 11 6 91 , 8 14 , 3 2 5 2 2 9 , 93 7 , 582 1 55 , 0 3 7 , 8 6 0 2 7 3 , 114 , 2 8 6
1 8 , 7 84 , 6 9 4 1 , 04 4 , 6 8 0 , 119
1 0 , 974 , 174 7 8 3 , 6 0 4 , 999
5 , 3 14 , 4 3 9 , 2 3 2
3 , 6 61 , 3 7 3 , 1 9 0
DOLLARS 3 , 5 6 0 , 1 7 3 , 10 7
8 8 2 , 4 8 3 , 0 7 8 4 , 44 2 , 6 5 6 , 185
14 , 90 7 , 6 4 8 122 , 62 8 , 0 6 8
9 0 , 6 3 6 , 1 0 7 2 5 9 , 5 7 3 , 2 6 3
6 , 9 3 8 , 5 6 6 8 5 9 , 122 , 4 10 54 5 , 7 2 1 , 6 3 3
1 , 8 9 9 , 52 7 , 6 95
2 , 54 3 , 12 8 , 4 9 0
1 - 11
PERCENT 3 4 . 1% 62 . 3 %
1 . 5 % 0 . 6 % 1 . 4 %
1 0 0 . 0 %
1 . 6 % 0 . 7 %
2 1 . 2 % 7 . 7 % 2 . 6 % 1 . 7 % 3 . 0 % 0 . 2 %
11 . 6% 0 . 1% 8 . 7 %
5 9 . 2 %
4 0 . 8 %
PERCENT
8 0 . 1% 19 . 9%
1 0 0 . 0 %
0 . 3 % 2 . 8 % 2 . 0 % 5 . 8 % 0 . 2 %
19 . 3 % 12 . 3 % 42 . 8 %
5 7 . 2 %

1 - 12 COMBINED INCOME STATEMENT - DETAIL { CONTINUED )
Fiscal Year 2 0 13 Clark County With Gaming Revenue of $ 1 , 0 0 0 , 0 0 0 and over
Amounts Represent 1 5 0 Locations .
FOOD DEPARTMENT REVENUE
Food Sales Complimentary Food Sales . . . . . . . . . . . . . . . . . . . . . . . . . . . . . . . .
TOTAL REVENUE . . . . . . . . . . . . . . . . . . . . . . . . . . . . . . . . . . . . . . . . . . . . .
COST OF SALES
GROSS MARGIN
DEPARTMENTAL EXPENSES Bad Debt Expense . . . . . . . . . . . . . . . . . . . . . . . . . . . . . . . . . . . . . . . .
Compl imentary Expense . . . . . . . . . . . . . . . . . . . . . . . . . . . . . . . . . . .
Payroll - Taxes . . . . . . . . . . . . . . . . . . . . . . . . . . . . . . . . . . . . . . . . .
Payroll - Employee Benefits . . . . . . . . . . . . . . . . . . . . . . . . . . . . .
Payroll - Off icers . . . . . . . . . . . . . . . . . . . . . . . . . . . . . . . . . . . . . .
Payrol l - Other Employees . . . . . . . . . . . . . . . . . . . . . . . . . . . . . . .
Other Departmental Expenses . . . . . . . . . . . . . . . . . . . . . . . . . . . . .
TOTAL DEPARTMENTAL EXPENSES . . . . . . . . . . . . . . . . . . . . . . . . . . . . . . .
DEPARTMENTAL INCOME { LOSS) . . . . . . . . . . . . . . . . . . . . . . . . . . . . . . . . .
BEVERAGE DEPARTMENT REVENUE
Beverage Sales . . . . . . . . . . . . . . . . . . . . . . . . . . . . . . . . . . . . . . . . . .
Complimentary Beverage Sales . . . . . . . . . . . . . . . . . . . . . . . . . . . .
TOTAL REVENUE . . . . . . . . . . . . . . . . . . . . . . . . . . . . . . . . . . . . . . . . . . . . .
COST OF SALES
GROSS MARGIN . . . . . . . . . . . . . . . . . . . . . . . . . . . . . . . . . . . . . . . . . . . . . .
DEPARTMENTAL EXPENSES Bad Debt Expense . . . . . . . . . . . . . . . . . . . . . . . . . . . . . . . . . . . . . . . .
Compl imentary Expense . . . . . . . . . . . . . . . . . . . . . . . . . . . . . . . . . . .
Payroll - Taxes . . . . . . . . . . . . . . . . . . . . . . . . . . . . . . . . . . . . . . . . .
Payroll - Employee Benefits . . . . . . . . . . . . . . . . . . . . . . . . . . . . . Payroll - Officers . . . . . . . . . . . . . . . . . . . . . . . . . . . . . . . . . . . . . . Payroll - Other Employees . . . . . . . . . . . . . . . . . . . . . . . . . . . . . . .
Other Departmental Expenses . . . . . . . . . . . . . . . . . . . . . . . . . . . . .
TOTAL DEPARTMENTAL EXPENSES . . . . . . . . . . . . . . . . . . . . . . . . . . . . . . .
DEPARTMENTAL INCOME { LOSS ) . . . . . . . . . . . . . . . . . . . . . . . . . . . . . . . . .
DOLLARS 2 , 5 1 8 , 94 8 , 5 0 4
5 6 8 , 112 , 4 3 0 3 , 0 8 7 , 0 6 0 , 9 3 4
9 5 6 , 9 1 3 , 5 5 1
2 , 13 0 , 14 7 , 3 8 3
3 , 0 2 3 , 7 8 6 2 8 , 6 7 2 , 4 6 8
1 3 8 , 2 2 5 , 8 5 9 3 3 6 , 7 8 8 , 7 7 7
3 1 , 6 6 6 , 652 1 , 1 0 7 , 5 0 5 , 8 8 4
18 7 , 6 2 3 , 4 3 5 1 , 8 3 3 , 5 0 6 , 8 6 1
2 9 6 , 64 0 , 5 2 2
DOLLARS 944 , 6 0 8 , 7 4 2 54 0 , 9 6 5 , 12 1
1 , 4 8 5 , 5 7 3 , 8 6 3
2 7 6 , 042 , 0 0 7
1 , 2 0 9 , 5 3 1 , 8 5 6
4 13 , 5 7 5 3 0 , 1 6 0 , 0 5 6 3 6 , 7 74 , 4 8 3 8 3 , 3 65 , 8 9 0
1 , 6 0 7 , 2 2 1 2 6 0 , 3 95 , 0 0 0 2 3 9 , 3 4 4 , 8 6 8 6 52 , 0 6 1 , 0 9 3
5 5 7 , 4 7 0 , 7 6 3
PERCENT 8 1 . 6 % 18 . 4 %
1 0 0 . 0 %
3 1 . 0 %
6 9 . 0 %
0 . 1% 0 . 9 % 4 . 5 %
1 0 . 9 % 1 . 0 %
3 5 . 9% 6 . 1%
5 9 . 4 %
9 . 6 %
PERCENT 6 3 . 6 % 3 6 . 4 %
1 0 0 . 0 %
18 . 6 %
8 1 . 4 %
0 . 0 % 2 . 0 % 2 . 5 % 5 . 6 % 0 . 1 %
1 7 . 5 % 16 . 1 % 4 3 . 9 %
3 7 . 5 %

COMBINED INCOME STATEMENT - DETAIL ( CONTINUED)
Fiscal Year 2 0 1 3 Clark County With Gaming Revenue of $ 1 , 00 0 , 0 0 0 and over
Amounts Represent 150 Locations .
OTHER INCOME REVENUE
Other Operating and Non-operating Income . . . . . . . . . . . . . . . .
Other Complimentary Items . . . . . . . . . . . . . . . . . . . . . . . . . . . . . . .
TOTAL REVENUE . . . . . . . . . . . . . . . . . . . . . . . . . . . . . . . . . . . . . . . . . . . . .
COST OF SALES . . . . . . . . . . . . . . . . . . . . . . . . . . . . . . . . . . . . . . . . . . . . .
GROSS MARGIN . . . . . . . . . . . . . . . . . . . . . . . . . . . . . . . . . . . . . . . . . . . . . .
DEPARTMENTAL EXPENSES Bad Debt Expense . . . . . . . . . . . . . . . . . . . . . . . . . . . . . . . . . . . . . . . .
Complimentary Expense . . . . . . . . . . . . . . . . . . . . . . . . . . . . . . . . . . .
Payroll - Taxes . . . . . . . . . . . . . . . . . . . . . . . . . . . . . . . . . . . . . . . . .
Payroll - Employee Benefits . . . . . . . . . . . . . . . . . . . . . . . . . . . . .
Payroll - Officers . . . . . . . . . . . . . . . . . . . . . . . . . . . . . . . . . . . . . .
Payroll - Other Employees . . . . . . . . . . . . . . . . . . . . . . . . . . . . . . .
Other Departmental Expenses . . . . . . . . . . . . . . . . . . . . . . . . . . . . .
TOTAL DEPARTMENTAL EXPENSES . . . . . . . . . . . . . . . . . . . . . . . . . . . . . . .
DEPARTMENTAL INCOME (LOSS) . . . . . . . . . . . . . . . . . . . . . . . . . . . . . . . . .
AVERAGE NUMBER OF EMPLOYEES FOR THE YEAR
CASINO DEPARTMENT . . . . . . . . . . . . . . . . . . . . .
ROOMS DEPARTMENT . . . . . . . . . . . . . . . . . . . . . .
FOOD DEPARTMENT . . . . . . . . . . . . . . . . . . . . . . .
BEVERAGE DEPARTMENT . . . . . . . . . . . . . . . . . . .
G & A DEPARTMENT . . . . . . . . . . . . . . . . . . . . .
OTHER DEPARTMENTS . . . . . . . . . . . . . . . . . . . . .
TOTAL
DOLLARS 2 , 4 75 , 5 8 3 , 64 7
1 16 , 4 1 3 , 4 6 2 2 , 5 91 , 9 97 , 1 0 9
3 0 3 , 4 99 , 3 0 8
2 , 2 8 8 , 4 9 7 , 8 0 1
3 , 94 7 , 8 3 5 3 6 , 9 3 2 , 64 7 4 1 , 1 8 9 , 34 1 74 , 3 64 , 52 8
3 , 54 0 , 7 2 7 4 0 4 , 9 7 9 , 3 4 2 5 3 6 , 52 4 , 5 4 9
1 , 1 0 1 , 4 7 8 , 96 9
1 , 18 7 , 0 18 , 8 3 2
3 5 , 0 3 6 2 6 , 22 8 3 5 , 958
9 , 6 0 6 2 4 , 7 4 5 11 , 7 3 9
14 3 , 3 12
1 - 13
PERCENT 95 . 5 %-
4 . 5 %-1 0 0 . 0 %-
11 . 7%-
8 8 . 3 %-
0 . 2 %-1 . 4 %-1 . 6 % 2 . 9%-0 . 1%-
15 . 6 %-2 0 . 7 %-42 . 5 %-
4 5 . 8 %-

1 - 14 ROOM OCCUPANCY AND PER ROOM PER DAY ANALYSIS
Fiscal Year 2 0 13 Clark County With Gaming Revenue of $ 1 , 0 0 0 , 0 0 0 and over
Amounts Represent 150 Locations .
MONTH JULY . . . . . . . . . . AUGUST . . . . . . . . SEPTEMBER . . . . . OCTOBER . . . . . . . NOVEMBER . . . . . . DECEMBER . . . . . . JANUARY . . . . . . . FEBRUARY . . . .. .. . MARCH .. . . . . . .. . . APRIL . . . . . . . . . MAY . . . . . . . . . . . JUNE . . . . . . . . . .
TOTAL . . . . . . . . .
Average Pit Revenue Per Room Per Day
Average Slot Revenue Per Room Per Day
Average Food Sales Per Room Per Day
RATE OF ROOM OCCUPANCY
AVAILABLE ROOMS ROOMS OCCUPIED
3 , 84 9 , 5 1 6 3 , 4 0 3 , 2 2 5 3 , 8 2 7 , 8 4 3 3 , 2 3 7 , 3 7 4 3 , 6 9 9 , 6 9 3 3 , 1 9 6 , 7 2 7 3 , 8 3 9 , 0 1 0 3 , 4 02 , 5 6 0 3 , 6 7 5 , 6 7 4 2 , 93 2 , 3 5 9 3 , 7 5 3 , 5 9 0 2 , 8 6 5 , 3 8 8 3 , 8 3 2 , 3 8 3 3 , 04 3 , 3 14 3 , 4 5 1 , 72 9 2 , 924 , 3 99 3 , 8 5 9 , 0 2 1 3 , 4 5 3 , 762 3 , 7 3 2 , 6 3 7 3 , 2 9 8 , 116 3 , 8 3 2 , 4 2 5 3 , 3 4 2 , 95 1 3 , 7 17 , 53 0 3 , 3 0 9 , 8 1 0
4 5 , 0 7 1 , 0 5 1 3 8 , 4 0 9 , 9 8 5
PER ROOM PER DAY STATISTICS
7 9 . 64
14 5 . 6 7
8 0 . 3 7
Average Beverage Sales Per Room Per Day
Average Rooms Department Payrol l Per Room Per Day
Average Room Rate Per Day
% OF OCCUPANCY
( COMPUTED) 8 8 . 4 1% 84 . 5 7 % 8 6 . 4 1 % 8 8 . 6 3 % 7 9 . 7 8 % 7 6 . 3 4 % 7 9 . 4 1 % 84 . 7 2 % 8 9 . 5 0 % 8 8 . 3 6 % 8 7 . 2 3 % 8 9 . 0 3 %
8 5 . 2 2 %
3 8 . 6 8
3 1 . 6 7
115 . 6 6

Fi scal Year 2 0 13 Clark County
PER SQUARE FOOT ANALYSIS AND RATIOS
With Gaming Revenue of $ 1 , 0 0 0 , 0 0 0 and over
Amounts Represent 150 Locations .
GAMING REVENUE PER SQUARE FOOT OF FLOOR SPACE
1 - 15
NO . OF CASINOS AVERAGE AREA GAMING REVENUE AREA
Pit ( Includes Bingo and Coin Operated Devices Poker and Pan Race and Sports
TOTAL CASINO
OPERATING
Keno)
RATIOS
IN SQUARE FEET
9 7 1 1 , 7 3 7 1 4 1 3 5 , 1 0 6
5 6 2 , 4 92 7 3 5 , 14 5
1 5 0 4 4 , 0 2 3
TOTAL CURRENT ASSETS TO TOTAL CURRENT LIABILITIES . . . . . . . . .
TOTAL CAPITAL TO TOTAL LIABILITIES . . . . . . . . . . . . . . . . . . . . . . . .
TOTAL CAPITAL TO TOTAL CURRENT LIABILITIES . . . . . . . . . . . . . . . .
TOTAL CURRENT LIABILITIES TO TOTAL LIABILITIES . . . . . . . . . . . .
TOTAL COMPLIMENTARY EXPENSE TO GAMING REVENUE . . . . . . . . . . . . .
MUSIC AND ENTERTAINMENT EXPENSES TO GAMING REVENUE . . . . . . . .
TOTAL REVENUE TO AVERAGE TOTAL ASSETS . . . . . . . . . . . . . . . . . . . . .
TOTAL REVENUE LESS COMP SALES TO AVERAGE TOTAL ASSETS . . . . .
RETURN ON INVESTED CAPITAL* . . . . . . . . . . . . . . . . . . . . . . . . . . . . . . .
RETURN ON AVERAGE ASSETS* . . . . . . . . . . . . . . . . . . . . . . . . . . . . . . . . .
* - FORMULAS
PER
Return on Invested Capital is equal to the total of net income (before federal income taxes and extraordinary items ) and interest
expense divided by the total of average total assets less average current l iabi lities .
SQUARE FOOT
2 , 6 7 8 1 , 13 0
9 8 1 4 8 8
1 , 3 5 9
PERCENT 14 5 . 8%
4 7 . 0 %
198 . 7%'
2 3 . 7 %
2 5.2%
3 . 3 %'
2 9 . 6%
2 6 . 6 %'
2 . 9%
2 .1%'
Return on Average Assets is equal to the total of net income (before federal income taxes and extraordinary items ) and interest expense divided by the average total assets .

1 - 16
THIS PAGE LEFT INTENTIONALLY BLANK

COMBINED BALANCE SHEET Fiscal Year 2 0 13 Douglas County - South Shore Lake Tahoe Area With Gaming Revenue of $ 1 , 0 0 0 , 0 0 0 and over
Amounts Represent 5 Locations .
ASSETS CURRENT ASSETS
Cash . . . . . . . . . . . . . . . . . . . . . . . . . . . . . . . . . . . . . . . . . . . . . . . . . . . .
Receivables TOTAL ALLOWANCE Casino 2 1 , 54 7 , 3 3 2 1 1 , 4 12 , 6 5 8 Trade 1 , 9 3 5 , 902 4 6 , 8 18 Sundry 3 , 74 8 , 3 5 8 0 Notes o o
Prepaid Expenses . . . . . . . . . . . . . . . . . . . . . . . . . . . . . . . . . . . . . . . . Other Current Assets . . . . . . . . . . . . . . . . . . . . . . . . . . . . . . . . . . . .
TOTAL CURRENT ASSETS . . . . . . . . . . . . . . . . . . . . . . . . . . . . . . . . . . . . . .
FIXED ASSETS COST DEPRECIATION Land 4 6 , 998 , 2 64 . . . . . . . . . . . Land Improvements 5 8 7 , 0 5 0 2 4 8 , 2 8 3 Buildings & Improvements 192 , 3 7 4 , 3 4 0 3 3 , 2 6 5 , 0 02 Furniture & Equipment 9 1 , 9 73 , 0 8 4 7 7 , 2 5 2 , 6 3 0 Lease Improvements 2 6 , 3 7 8 , 8 6 4 7 , 94 9 , 6 6 9 Construction i n Progress 92 9 , 5 5 1 . . . . . . . . . . .
TOTAL FIXED ASSETS . . . . . . . . . . . . . . . . . . . . . . . . . . . . . . . . . . . . . . . .
OTHER ASSETS
TOTAL ASSETS
LIABILITIES AND CAPITAL CURRENT LIABILITIES
Accounts Payable - Trade . . . . . . . . . . . . . . . . . . . . . . . . . . . . . . . .
Accounts Payable - Other . . . . . . . . . . . . . . . . . . . . . . . . . . . . . . . . Current Portion of Long-Term Debt . . . . . . . . . . . . . . . . . . . . . . .
Accrued Expenses . . . . . . . . . . . . . . . . . . . . . . . . . . . . . . . . . . . . . . . . Other Current Liabilities ............. �-- .............. .
TOTAL CURRENT LIABILITIES . . . . . . . . . . . . . . . . . . . . . . . . . . . . . . . . .
LONG-TERM DEBT Mortgages Debentures & Bonds Notes Contracts Other
TOTAL LONG-TERM DEBT OTHER LIABILITIES TOTAL LIABILITIES
CAPITAL
TOTAL OWING CURRENT PORTION 5 , 672 , 998 2 2 6 , 2 15
0 0 4 0 0 , 0 0 0 4 0 0 , 0 0 0 6 6 7 , 7 8 8 3 3 4 , 4 62
2 5 7 , 2 7 8 , 8 2 7 1 , 7 3 6 , 3 16 2 64 , 0 1 9 , 6 1 3 2 , 6 9 6 , 993
Owners Capital Accounts . . . . . . . . . . . . . . . . . . . . . . . . . . . . . . . . . Capital Stock & Other Capital . . . . . . . . . . . . . . . . . . . . . . . . . . .
Retained Earnings . . . . . . . . . . . . . . . . . . . . . . . . . . . . . . . . . . . . . . .
TOTAL CAPITAL . . . . . . . . . . . . . . . . . . . . . . . . . . . . . . . . . . . . . . . . . . . . .
TOTAL LIABILITIES AND CAPITAL . . . . . . . . . . . . . . . . . . . . . . . . . . . . . .
Average Assets 9 5 , 7 4 1 , 0 5 2
Upper Quartile Median 95 , 74 1 , 0 5 1
1 - 17
DOLLARS PERCENT 22 , 6 0 0 , 4 7 0 4 . 7 %
1 0 , 13 4 , 6 74 2 . 1% 1 , 8 8 9 , 0 8 4 0 . 4 % 3 , 74 8 , 3 5 8 0 . 8 %
0 0 . 0% 5 , 44 6 , 04 0 1 . 1% 6 , 4 5 3 , 34 5 1 . 3 %
5 0 , 2 7 1 , 9 7 1 1 0 . 5 %
4 6 , 998 , 2 6 4 9 . 8 % 3 3 8 , 7 6 7 0 . 1%
15 9 , 10 9 , 3 3 8 3 3 . 2 % 14 , 72 0 , 4 54 3 . 1% 18 , 42 9 , 1 9 5 3 . 8 %
92 9 , 5 5 1 0 . 2 % 24 0 , 525 , 5 6 9 5 0 . 2 %
1 8 7 , 90 7 , 7 1 8 3 9 . 3 %
4 7 8 , 7 0 5 , 2 5 8 1 0 0 . 0 %
4 , 6 6 6 , 0 4 4 1 . 0 % 7 , 15 0 , 2 6 4 1 . 5 % 2 , 6 9 6 , 9 9 3 0 . 6 %
15 , 22 6 , 7 8 3 3 . 2 % 2 , 9 91 , 7 3 5 0 . 6 %
3 2 , 7 3 1 , 8 1 9 6 . 8 %
5 , 44 6 , 7 8 3 1 . 1% 0 0 . 0 % 0 0 . 0 %
3 3 3 , 3 2 6 0 . 1% 2 55 , 54 2 , 5 1 1 5 3 . 4 % 2 6 1 , 3 2 2 , 6 2 0 54 . 6 %
74 , 7 7 0 , 954 15 . 6 % 3 6 8 , 8 2 5 , 3 9 3 7 7 . 0 %
542 , 8 3 1 , 7 2 3 113 . 4 % - 2 0 0 , 62 1 , 7 7 4 - 4 1 . 9% - 2 3 2 , 3 3 0 , 0 8 4 - 4 8 . 5 %
1 0 9 , 8 7 9 , 8 6 5 2 3 . 0 %
4 7 8 , 7 0 5 , 2 5 8 10 0 . 0%
Lower Quartile

1 - 1 8 COMBINED INCOME STATEMENT - SUMMARY
Fiscal Year 2 0 13 Douglas County - South Shore Lake Tahoe Area With Gaming Revenue of $ 1 , 0 0 0 , 0 0 0 and over
Amounts Represent 5 Locations .
REVENUE Gaming . . . . . . . . . . . . . . . . . . . . . . . . . . . . . . . . . . . . . . . . . . . . . . . . . . Rooms . . . . . . . . . . . . . . . . . . . . . . . . . . . . . . . . . . . . . . . . . . . . . . . . . . . Food . . . . . . . . . . . . . . . . . . . . . . . . . . . . . . . . . . . . . . . . . . . . . . . . . . . .
Beverage . . . . . . . . . . . . . . . . . . . . . . . . . . . . . . . . . . . . . . . . . . . . . . . . Other . . . . . . . . . . . . . . . . . . . . . . . . . . . . . . . . . . . . . . . . . . . . . . . . . . .
DOLLARS 1 96 , 5 9 7 , 6 0 9
5 7 , 5 13 , 4 6 5 3 9 , 2 6 1 , 9 0 5 3 2 , 4 13 , 3 0 8 2 3 , 9 1 9 , 3 2 8
3 4 9 , 7 0 5 , 6 15 TOTAL REVENUE . . . . . . . . . . . . . . . . . . . . . . . . . . . . . . . . . . . . . . . . · · · · · ----������
COST OF SALES 2 5 , 7 95 , 8 8 5
GROSS MARGIN 3 2 3 , 9 0 9 , 7 3 0
DEPARTMENTAL EXPENSES . . . . . . . . . . . . . . . . . . . . . . . . . . . . . . . . . . . . . 2 0 5 , 2 92 , 752
DEPARTMENTAL INCOME ( LOSS) 1 18 , 6 1 6 , 9 7 8 • • • • • • • • • • • • • • • • • • • • • • • • • • • • • • • • ----=-=...!....::...=-=...!..=-...:....::.
GENERAL AND ADMINISTRATIVE EXPENSES Advertising and Promot ion . . . . . . . . . . . . . . . . . . . . . . . . . . . . . . . 4 , 1 0 3 , 2 7 6 Bad Debt Expense . . . . . . . . . . . . . . . . . . . . . . . . . . . . . . . . . . . . . . . . 0 Complimentary Expense ( not reported in departments ) . . . . . . 8 15 , 0 2 7 Depreciation - Buildings . . . . . . . . . . . . . . . . . . . . . . . . . . . . . . . . 5 , 4 5 9 , 12 7 Depreciation and Amorti zation - Other . . . . . . . . . . . . . . . . . . . 1 3 , 9 0 0 , 4 3 1 Energy Expense ( electricity , gas , etc . ) . . . . . . . . . . . . . . . . . 7 , 9 6 6 , 9 5 7 Equipment Rental or Lease . . . . . . . . . . . . . . . . . . . . . . . . . . . . . . . 3 4 9 , 3 4 0 Interest Expense . . . . . . . . . . . . . . . . . . . . . . . . . . . . . . . . . . . . . . . . 3 1 , 4 6 9 , 6 0 1 Music and Entertainment . . . . . . . . . . . . . . . . . . . . . . . . . . . . . . . . . 4 6 , 2 2 2 Payrol l Taxes . . . . . . . . . . . . . . . . . . . . . . . . . . . . . . . . . . . . . . . . . . . 1 , 2 4 9 , 54 8 Payrol l - Employee Benefits . . . . . . . . . . . . . . . . . . . . . . . . . . . . . 3 , 8 12 , 6 8 9 Payroll - Officers . . . . . . . . . . . . . . . . . . . . . . . . . . . . . . . . . . . . . . 3 3 9 , 9 8 3 Payroll - Other Employees . . . . . . . . . . . . . . . . . . . . . . . . . . . . . . . 1 3 , 1 5 1 , 3 6 3 Rent of Premises . . . . . . . . . . . . . . . . . . . . . . . . . . . . . . . . . . . . . . . . 12 , 2 5 2 , 612 Taxes - Real Estate . . . . . . . . . . . . . . . . . . . . . . . . . . . . . . . . . . . . . 4 , 55 0 , 3 4 6 Taxes and Licenses - Other . . . . . . . . . . . . . . . . . . . . . . . . . . . . . . - 75 8 , 5 13 Uti l ities ( Other than Energy Expense ) . . . . . . . . . . . . . . . . . . . 1 , 9 0 8 , 4 1 0 Other General and Administrative Expenses . . . . . . . . . . . . . . . 1 0 8 , 2 3 2 , 4 7 5
2 0 8 , 84 8 , 8 9 4 TOTAL GENERAL AND ADMIN ISTRATIVE EXPENSES . . . . . . . . . . . . . . . . · ----=-=-..::.L�..::.L�..::.
NET INCOME ( LOSS ) BEFORE FEDERAL INCOME TAXES AND EXTRAORDINARY ITEMS . . . . . . . . . . . . . . . . . . . . . . . . . . . . . . . . . . . .
Average Revenue 6 9 , 94 1 , 123
Upper Quartile Median 6 9 , 94 1 , 1 2 3
- 9 0 , 2 3 1 , 916
Lower Quartile
PERCENT 5 6 . 2 % 1 6 . 4 % 1 1 . 2 %
9 . 3 % 6 . 8 %
1 0 0 . 0 %
7 . 4 %
92 . 6 %
58 . 7%
3 3 . 9 %
1 . 2 % 0 . 0 % 0 . 2 % 1 . 6 % 4 . 0 % 2 . 3 % 0 . 1% 9 . 0 % 0 . 0 % 0 . 4 % 1 . 1% 0 . 1% 3 . 8 % 3 . 5 % 1 . 3 %
-0 . 2 % 0 . 5%
3 0 . 9% 5 9 . 7 %
- 2 5 . 8 %

COMBINED INCOME STATEMENT - DETAIL Fi scal Year 2 0 13 Douglas County - South Shore Lake Tahoe Area With Gaming Revenue of $ 1 , 0 0 0 , 0 0 0 and over
Amounts Represent 5 Locations .
CASINO DEPARTMENT
REVENUE Pit Revenue ( Includes Keno and Bingo) . . . . . . . . . . . . . . . . . . .
Coin Operated Devices . . . . . . . . . . . . . . . . . . . . . . . . . . . . . . . . . . .
Poker and Pan . . . . . . . . . . . . . . . . . . . . . . . . . . . . . . . . . . . . . . . . . . .
Race Book . . . . . . . . . . . . . . . . . . . . . . . . . . . . . . . . . . . . . . . . . . . . . . .
Sports Pool . . . . . . . . . . . . . . . . . . . . . . . . . . . . . . . . . . . . . . . . . . . . .
TOTAL REVENUE . . . . . . . . . . . . . . . . . . . . . . . . . . . . . . . . . . . . . . . . . . . . .
DEPARTMENTAL EXPENSES Bad Debt Expense . . . . . . . . . . . . . . . . . . . . . . . . . . . . . . . . . . . . . . . .
Commissions . . . . . . . . . . . . . . . . . . . . . . . . . . . . . . . . . . . . . . . . . . . . .
Complimentary Expense . . . . . . . . . . . . . . . . . . . . . . . . . . . . . . . . . . .
Gaming Taxes and Licenses . . . . . . . . . . . . . . . . . . . . . . . . . . . . . . .
Preferred Guest Expenses (no complimentaries ) . . . . . . . . . . .
Payroll Taxes . . . . . . . . . . . . . . . . . . . . . . . . . . . . . . . . . . . . . . . . . . .
Payroll - Employee Benefits . . . . . . . . . . . . . . . . . . . . . . . . . . . . .
Payroll - Officers . . . . . . . . . . . . . . . . . . . . . . . . . . . . . . . . . . . . . .
Payroll - Other Employees . . . . . . . . . . . . . . . . . . . . . . . . . . . . . . .
Race Wire Fees . . . . . . . . . . . . . . . . . . . . . . . . . . . . . . . . . . . . . . . . . .
Other Departmental Expenses . . . . . . . . . . . . . . . . . . . . . . . . . . . . .
TOTAL DEPARTMENTAL EXPENSES . . . . . . . . . . . . . . . . . . . . . . . . . . . . . . .
DEPARTMENTAL INCOME (LOSS ) . . . . . . . . . . . . . . . . . . . . . . . . . . . . . . . . .
ROOMS DEPARTMENT
REVENUE Room Sales . . . . . . . . . . . . . . . . . . . . . . . . . . . . . . . . . . . . . . . . . . . . . .
Complimentary Rooms . . . . . . . . . . . . . . . . . . . . . . . . . . . . . . . . . . . . .
TOTAL REVENUE . . . . . . . . . . . . . . . . . . . . . . . . . . . . . . . . . . . . . . . . . . . . .
DEPARTMENTAL EXPENSES Bad Debt Expense . . . . . . . . . . . . . . . . . . . . . . . . . . . . . . . . . . . . . . . .
Complimentary Expense . . . . . . . . . . . . . . . . . . . . . . . . . . . . . . . . . . .
Payroll - Taxes . . . . . . . . . . . . . . . . . . . . . . . . . . . . . . . . . . . . . . . . . Payroll - Employee Benefits . . . . . . . . . . . . . . . . . . . . . . . . . . . . .
Payroll - Officers . . . . . . . . . . . . . . . . . . . . . . . . . . . . . . . . . . . . . .
Payroll - Other Employees . . . . . . . . . . . . . . . . . . . . . . . . . . . . . . .
Other Departmental Expenses . . . . . . . . . . . . . . . . . . . . . . . . . . . . .
TOTAL DEPARTMENTAL EXPENSES . . . . . . . . . . . . . . . . . . . . . . . . . . . . . . .
DEPARTMENTAL INCOME (LOSS ) . . . . . . . . . . . . . . . . . . . . . . . . . . . . . . . . .
1 - 19
DOLLARS PERCENT 5 6 , 67 9 , 2 3 3 2 8 . 8 %
1 3 3 , 88 9 , 9 0 8 6 8 . 1% 2 , 4 7 9 , 1 0 2 1 . 3 % 1 , 5 72 , 4 0 9 0 . 8 % 1 , 976 , 95 7 1 . 0 %
196 , 5 9 7 , 6 0 9 1 0 0 . 0 %
2 , 2 3 1 , 7 0 7 1 . 1%' 3 24 , 22 7 0 . 2 %
5 7 , 8 7 1 , 113 2 9 . 4 % 13 , 7 8 5 , 5 9 0 7 . 0 %
184 , 9 9 6 0 . 1%' 4 , 6 14 , 2 3 3 2 . 3 % 9 , 8 8 8 , 2 14 5 . 0 %
0 0 . 0 % 2 8 , 4 11 , 0 5 1 14 . 5 %
3 54 , 6 6 9 0 . 2 % 1 7 , 99 0 , 3 7 9 9 . 2 %
1 3 5 , 65 6 , 1 7 9 6 9 . 0 %
6 0 , 94 1 , 4 3 0 3 1 . 0 %
DOLLARS PERCENT 3 4 , 44 1 , 8 2 7 5 9 . 9% 2 3 , 0 7 1 , 6 3 8 4 0 . 1% 5 7 , 513 , 4 6 5 1 0 0 . 0 %
4 3 , 4 0 6 0 . 1% 3 3 5 , 5 9 5 0 . 6 % 7 5 3 , 6 94 1 . 3 %
1 , 4 3 2 , 7 0 2 2 . 4 % 0 0 . 0 %
6 , 10 8 , 5 2 7 1 0 . 6 %' 1 0 , 72 7 , 7 9 8 18 . 7 % 1 9 , 4 0 1 , 7 2 2 3 3 . 7%
3 8 , 111 , 7 4 3 6 6 . 3 %
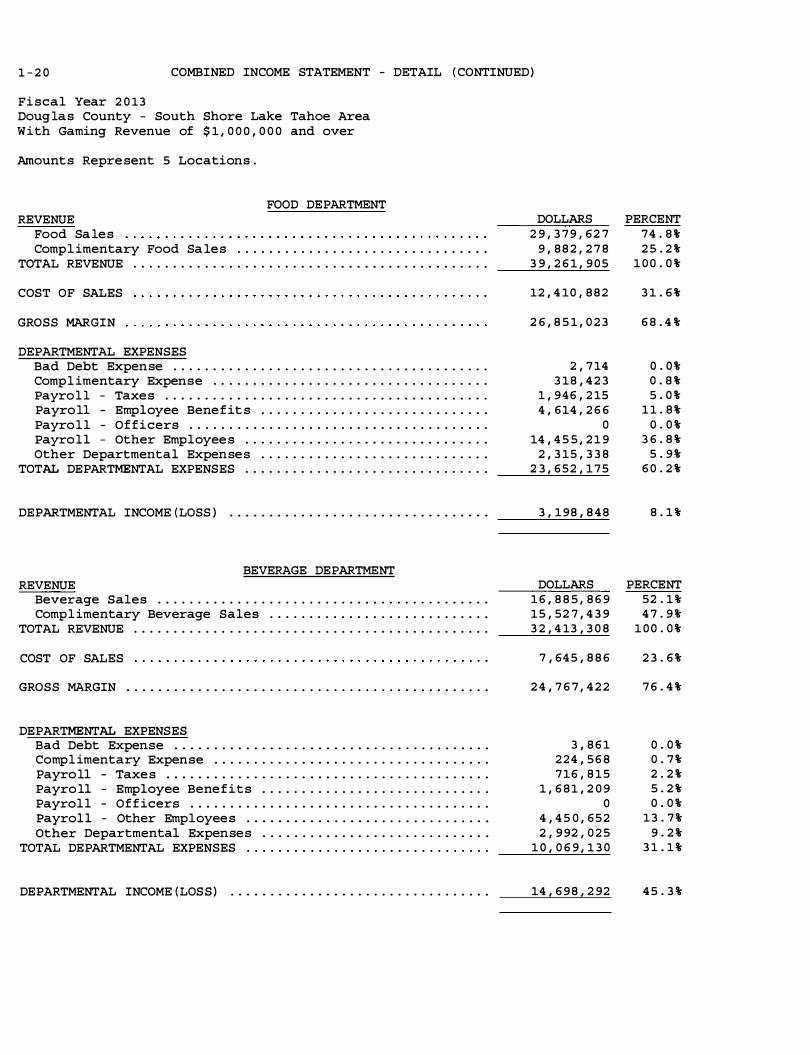
1 - 2 0 COMBINED INCOME STATEMENT - DETAIL (CONTINUED)
F iscal Year 2 0 13 Douglas County - South Shore Lake Tahoe Area With Gaming Revenue of $ 1 , 0 0 0 , 0 0 0 and over
Amounts Represent 5 Locations .
FOOD DEPARTMENT REVENUE
Food Sales Compl imentary Food Sales . . . . . . . . . . . . . . . . . . . . . . . . . . . . . . . .
TOTAL REVENUE . . . . . . . . . . . . . . . . . . . . . . . . . . . . . . . . . . . . . . . . . . . . .
COST OF SALES
GROSS MARGIN
DEPARTMENTAL EXPENSES Bad Debt Expense . . . . . . . . . . . . . . . . . . . . . . . . . . . . . . . . . . . . . . . .
Compl imentary Expense . . . . . . . . . . . . . . . . . . . . . . . . . . . . . . . . . . .
Payroll - Taxes . . . . . . . . . . . . . . . . . . . . . . . . . . . . . . . . . . . . . . . . .
Payroll - Employee Benefits . . . . . . . . . . . . . . . . . . . . . . . . . . . . .
Payroll - Officers . . . . . . . . . . . . . . . . . . . . . . . . . . . . . . . . . . . . . .
Payroll - Other Employees . . . . . . . . . . . . . . . . . . . . . . . . . . . . . . .
Other Departmental Expenses . . . . . . . . . . . . . . . . . . . . . . . . . . . . .
TOTAL DEPARTMENTAL EXPENSES . . . . . . . . . . . . . . . . . . . . . . . . . . . . . . .
DEPARTMENTAL INCOME (LOSS ) . . . . . . . . . . . . . . . . . . . . . . . . . . . . . . . . .
BEVERAGE DEPARTMENT REVENUE
Beverage Sales . . . . . . . . . . . . . . . . . . . . . . . . . . . . . . . . . . . . . . . . . . Compl imentary Beverage Sales . . . . . . . . . . . . . . . . . . . . . . . . . . . .
TOTAL REVENUE . . . . . . . . . . . . . . . . . . . . . . . . . . . . . . . . . . . . . . . . . . . . .
COST OF SALES
GROSS MARGIN . . . . . . . . . . . . . . . . . . . . . . . . . . . . . . . . . . . . . . . . . . . . . .
DEPARTMENTAL EXPENSES Bad Debt Expense . . . . . . . . . . . . . . . . . . . . . . . . . . . . . . . . . . . . . . . .
Compl imentary Expense . . . . . . . . . . . . . . . . . . . . . . . . . . . . . . . . . . .
Payroll - Taxes . . . . . . . . . . . . . . . . . . . . . . . . . . . . . . . . . . . . . . . . .
Payroll - Employee Benefits . . . . . . . . . . . . . . . . . . . . . . . . . . . . .
Payroll - Officers . . . . . . . . . . . . . . . . . . . . . . . . . . . . . . . . . . . . . .
Payroll - Other Employees . . . . . . . . . . . . . . . . . . . . . . . . . . . . . . .
Other Departmental Expenses . . . . . . . . . . . . . . . . . . . . . . . . . . . . .
TOTAL DEPARTMENTAL EXPENSES . . . . . . . . . . . . . . . . . . . . . . . . . . . . . . .
DEPARTMENTAL INCOME (LOSS) . . . . . . . . . . . . . . . . . . . . . . . . . . . . . . . . .
DOLLARS 2 9 , 3 7 9 , 62 7
9 , 8 8 2 , 2 7 8 3 9 , 2 6 1 , 9 0 5
12 , 4 10 , 8 8 2
2 6 , 8 5 1 , 0 2 3
2 , 7 14 3 18 , 4 2 3
1 , 946 , 2 15 4 , 6 14 , 2 6 6
0 14 , 4 5 5 , 2 1 9
2 , 3 15 , 3 3 8 2 3 , 652 , 1 7 5
3 , 1 98 , 8 4 8
DOLLARS 1 6 , 8 8 5 , 8 6 9 15 , 52 7 , 4 3 9 3 2 , 4 13 , 3 0 8
7 , 64 5 , 8 8 6
2 4 , 7 6 7 , 4 2 2
3 , 8 6 1 224 , 5 6 8 7 16 , 8 15
1 , 6 8 1 , 2 0 9 0
4 , 4 5 0 , 652 2 , 9 92 , 0 2 5
1 0 , 0 6 9 , 1 3 0
14 , 6 9 8 , 2 92
PERCENT 74 . 8 % 2 5 . 2 %
1 0 0 . 0 %
3 1 . 6 %
6 8 . 4 %
0 . 0 % 0 . 8 % 5 . 0 %
1 1 . 8 % 0 . 0 %
3 6 . 8 % 5 . 9 %
6 0 . 2 %
8 . 1 %
PERCENT 52 . 1 % 4 7 . 9 %
1 0 0 . 0 %
2 3 . 6 %
7 6 . 4 %
0 . 0 % 0 . 7 % 2 . 2 % 5 . 2 % 0 . 0 %
1 3 . 7 % 9 . 2 %
3 1 . 1 %
4 5 . 3 %
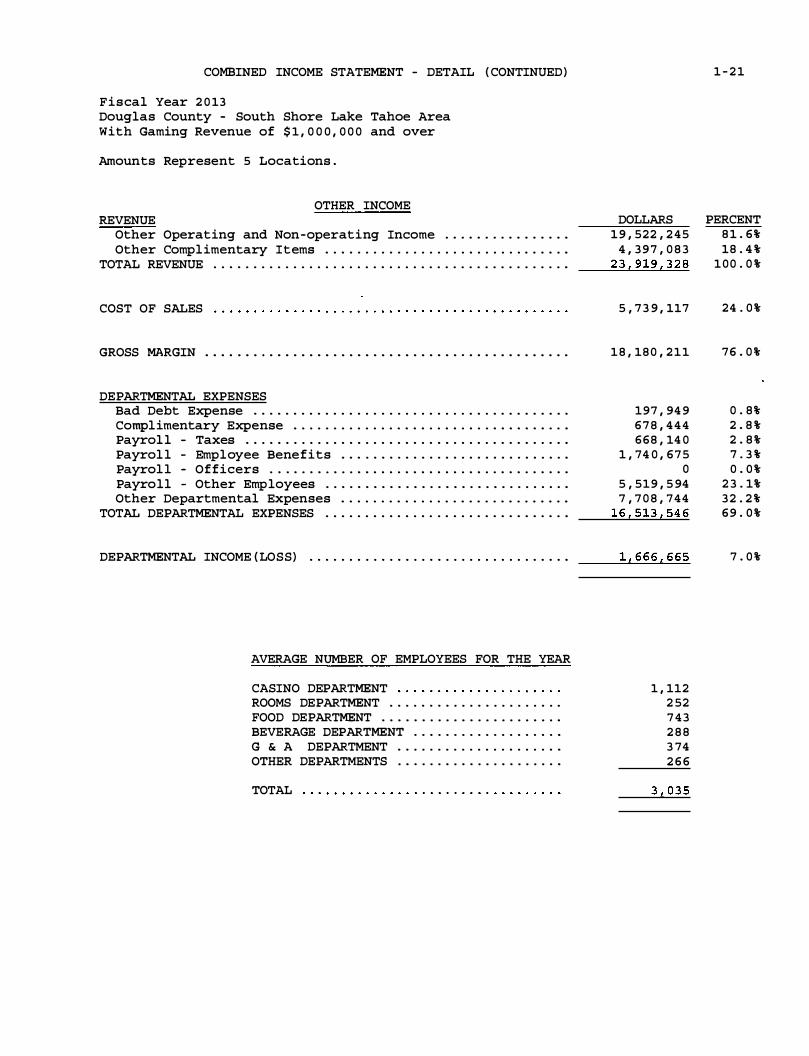
COMBINED INCOME STATEMENT - DETAIL ( CONTINUED)
Fiscal Year 2 0 13 Douglas County - South Shore Lake Tahoe Area With Gaming Revenue of $ 1 , 0 0 0 , 0 0 0 and over
Amounts Represent 5 Locations .
OTHER INCOME REVENUE
Other Operating and Non-operating Income . . . . . . . . . . . . . . . .
Other Complimentary Items . . . . . . . . . . . . . . . . . . . . . . . . . . . . . . .
TOTAL REVENUE . . . . . . . . . . . . . . . . . . . . . . . . . . . . . . . . . . . . . . . . . . . . .
COST OF SALES
GROSS MARGIN . . . . . . . . . . . . . . . . . . . . . . . . . . . . . . . . . . . . . . . . . . . . . .
DEPARTMENTAL EXPENSES Bad Debt Expense . . . . . . . . . . . . . . . . . . . . . . . . . . . . . . . . . . . . . . . . Complimentary Expense . . . . . . . . . . . . . . . . . . . . . . . . . . . . . . . . . . .
Payrol l - Taxes . . . . . . . . . . . . . . . . . . . . . . . . . . . . . . . . . . . . . . . . .
Payrol l - Employee Benefits . . . . . . . . . . . . . . . . . . . . . . . . . . . . .
Payrol l - Officers . . . . . . . . . . . . . . . . . . . . . . . . . . . . . . . . . . . . . .
Payroll - Other Employees . . . . . . . . . . . . . . . . . . . . . . . . . . . . . . .
Other Departmental Expenses . . . . . . . . . . . . . . . . . . . . . . . . . . . . .
TOTAL DEPARTMENTAL EXPENSES . . . . . . . . . . . . . . . . . . . . . . . . . . . . . . .
DEPARTMENTAL INCOME ( LOSS) . . . . . . . . . . . . . . . . . . . . . . . . . . . . . . . . .
AVERAGE NUMBER OF EMPLOYEES FOR THE YEAR
CASINO DEPARTMENT ROOMS DEPARTMENT . . . . . . . . . . . . . . . . . . . . . . FOOD DEPARTMENT . . . . . . . . . . . . . . . . . . . . . . .
BEVERAGE DEPARTMENT . . . . . . . . . . . . . . . . . . .
G & A DEPARTMENT . . . . . . . . . . . . . . . . . . . . .
OTHER DEPARTMENTS . . . . . . . . . . . . . . . . . . . . .
TOTAL
DOLLARS 1 9 , 522 , 2 4 5
4 , 3 9 7 , 0 8 3 2 3 , 91 9 , 3 2 8
5 , 7 3 9 , 117
1 8 , 18 0 , 2 1 1
197 , 94 9 6 7 8 , 4 4 4 668 , 14 0
1 , 74 0 , 6 7 5 0
5 , 519 , 5 94 7 , 7 0 8 , 744
16 , 5 13 , 54 6
1 , 6 6 6 , 6 6 5
1 , 112 2 52 7 4 3 2 8 8 3 74 2 6 6
3 , 0 3 5
1 - 2 1
PERCENT 8 1 . 6% 18 . 4 %
1 0 0 . 0 %
24 . 0 %
76 . 0 %
0 . 8% 2 . 8 % 2 . 8 % 7 . 3 % 0 . 0 %
2 3 . 1% 3 2 . 2 % 6 9 . 0 %
7 . 0 %

1 - 2 2 ROOM OCCUPANCY AND PER ROOM PER DAY ANALYSIS
Fiscal Year 2 0 13 Douglas County - South Shore Lake Tahoe Area With Gaming Revenue of $ 1 , 0 0 0 , 0 0 0 and over
Amounts Represent 5 Locat ions .
RATE OF ROOM OCCUPANCY
MONTH JULY . . . . . . . . . ..
AUGUST . . . . . .. . .
SEPTEMBER .. . . . . OCTOBER . . . . . . . NOVEMBER . . . . . . DECEMBER . . . . . . JANUARY . . . . . . . FEBRUARY . . . . . . MARCH . . . . . . . . . APRIL . . . . . . . . . MAY . . . . . . . . . . .
JUNE .. . . . . . . . . .
TOTAL . . . . . . . . .
Average Pit Revenue Per Room Per Day
Average Slot Revenue Per Room Per Day
Average Food Sales Per Room Per Day
AVAILABLE ROOMS ROOMS OCCUPIED
7 2 , 8 64 5 7 , 744 7 2 , 7 5 0 5 6 , 0 6 0 6 9 , 64 7 4 8 , 954 65 , 3 0 2 3 7 , 5 1 7 6 1 , 7 1 5 3 4 , 2 2 3 6 7 , 9 9 5 4 6 , 1 0 8 6 7 , 8 4 7 4 5 , 6 2 8 62 , 9 1 9 4 3 , 1 0 0 6 8 , 3 5 2 44 1 5 7 2 6 1 , 3 2 1 3 7 , 4 7 0 6 5 , 8 1 9 4 0 , 5 8 2 54 , 1 2 6 3 4 , 7 9 6
7 9 0 , 6 5 7 526 , 754
PER ROOM PER DAY STATISTICS
1 0 7 . 6 0
2 5 4 . 18
74 . 54
Average Beverage Sales Per Room Per Day
Average Rooms Department Payrol l Per Room Per Day
Average Room Rate Per Day
% OF OCCUPANCY
(COMPUTED ) 7 9 . 2 5 % 7 7 . 0 6 % 7 0 . 2 9 % 5 7 . 4 5 % 55 . 4 5 % 6 7 . 8 1 % 6 7 . 2 5 % 6 8 . 5 0 % 6 5 . 2 1 % 6 1 . 1 0 % 6 1 . 6 6 % 64 . 2 9 %
6 6 . 6 2 %
6 1 . 5 3
15 . 7 5
1 0 9 . 18

PER SQUARE FOOT ANALYSIS AND RATIOS Fiscal Year 2 0 13 Douglas County - South Shore Lake Tahoe Area With Gaming Revenue of $ 1 , 0 0 0 , 0 0 0 and over
Amounts Represent 5 Locations .
GAMING REVENUE PER SQUARE FOOT OF FLOOR SPACE
1 - 2 3
NO. OF CASINOS AVERAGE AREA GAMING REVENUE AREA OPERATING IN SQUARE FEET PER
Pit ( Includes Bingo and Keno) 3 1 3 , 0 1 5 Coin Operated Devices 5 2 8 , 0 8 5 Poker and Pan 3 1 , 4 1 7 Race and Sports 2 2 , 2 84
TOTAL CASINO 5 3 7 , 6 5 7
RATIOS
TOTAL CURRENT ASSETS TO TOTAL CURRENT LIABILITIES . . . . . . . . .
TOTAL CAPITAL TO TOTAL LIABILITIES . . . . . . . . . . . . . . . . . . . . . . . .
TOTAL CAPITAL TO TOTAL CURRENT LIABILITIES . . . . . . . . . . . . . . . .
TOTAL CURRENT LIABILITIES TO TOTAL LIABILITIES . . . . . . . . . . . .
TOTAL COMPLIMENTARY EXPENSE TO GAMING REVENUE . . . . . . . . . . . . .
MUSIC AND ENTERTAINMENT EXPENSES TO GAMING REVENUE . . . . . . . .
TOTAL REVENUE TO AVERAGE TOTAL ASSETS . . . . . . . . . . . . . . . . . . . . .
TOTAL REVENUE LESS COMP SALES TO AVERAGE TOTAL ASSETS . . . . .
RETURN ON INVESTED CAPITAL* . . . . . . . . . . . . . . . . . . . . . . . . . . . . . . .
RETURN ON AVERAGE ASSETS* . . . . . . . . . . . . . . . . . . . . . . . . . . . . . . . . .
* - FORMULAS
Return on Invested Capital is equal to the total of net income ( be fore federal income taxes and extraordinary items ) and interest expense divided by the total of average total assets less average current liabilities .
SQUARE FOOT
1 , 4 5 2 9 5 3 5 8 3 7 7 7
1 , 0 4 4
PERCENT 1 5 3 . 6 %'
2 9 . 8 %'
3 3 5 . 7%'
8 . 9%'
3 0 . 6%'
0 . 0 %'
6 7 . 6%
5 7 . 4 %
- 12 . 6%
- 1 1 . 4 %
Return on Average Assets is equal to the total of net income (before federal income taxes and extraordinary items ) and interest expense divided by the average total assets .
1 - 2 4
THIS PAGE LEFT INTENTIONALLY BLANK

Fiscal Year 2 0 13 Elko County
COMBINED BALANCE SHEET
With Gaming Revenue of $ 1 1 0 0 0 1 0 0 0 and over
Amounts Represent 1 8 Locations .
ASSETS CURRENT ASSETS
Cash . . . . . . . . . . . . . . . . . . . . . . . . . . . . . . . . . . . . . . . . . . . . . . . . . . . .
Receivables TOTAL ALLOWANCE Casino 2 1 2 3 2 1 14 1 6 5 1 9 14 Trade 5 1 8 6 6 1 4 7 6 1 0 0 1 156 Sundry 1 9 1 5 3 2 1 8 1 9 0 Notes 9 3 1 3 0 6 1 5 8 0 o
Prepaid Expenses . . . . . . . . . . . . . . . . . . . . . . . . . . . . . . . . . . . . . . . .
Other Current Assets . . . . . . . . . . . . . . . . . . . . . . . . . . . . . . . . . . . .
TOTAL CURRENT ASSETS . . . . . . . . . . . . . . . . . . . . . . . . . . . . . . . . . . . . . .
FIXED ASSETS COST DEPRECIATION Land 2 1 1 8 5 3 1 2 4 7 . . . . . . . . . . .
Land Improvements 10 1 6 12 1 6 8 3 6 1 5 6 1 1 84 5 Buildings & Improvements 3 5 1 1 9 5 0 1 6 0 0 13 0 1 5 7 6 1 9 3 8 Furniture & Equipment 2 8 2 1 154 1 12 9 2 3 2 1 63 1 1 5 3 5 Lease Improvements 1 0 1 0 0 7 1 054 3 1 2 0 8 1 3 7 1 Construction in Progres s 9 1 74 0 1 44 6 . . . . . . . . . . .
TOTAL FIXED ASSETS . . . . . . . . . . . . . . . . . . . . . . . . . . . . . . . . . . . . . . . .
OTHER ASSETS
TOTAL ASSETS
LIABILITIES AND CAPITAL CURRENT LIABILITIES
Accounts Payable - Trade . . . . . . . . . . . . . . . . . . . . . . . . . . . . . . . .
Accounts Payable - Other . . . . . . . . . . . . . . . . . . . . . . . . . . . . . . . . Current Portion of Long- Term Debt . . . . . . . . . . . . . . . . . . . . . . .
Accrued Expenses . . . . . . . . . . . . . . . . . . . . . . . . . . . . . . . . . . . . . . . .
Other Current Liabilities . . . . . . . . . . . . . . . . . . . . . . . . . . . . . . .
TOTAL CURRENT LIABILITIES . . . . . . . . . . . . . . . . . . . . . . . . . . . . . . . . .
LONG-TERM DEBT Mortgages Debentures & Bonds Notes Contracts Other
TOTAL LONG-TERM DEBT OTHER LIABILITIES TOTAL LIABILITIES
CAPITAL
TOTAL OWING CURRENT PORTION 2 1 0 0 6 1 5 4 8 0
1 8 1 92 0 1 625 0 4 4 1 8 0 1 1 3 6 3 222 1 4 8 8
5 1 0 1 64 8 4 7 3 1 3 4 8 1 0 9 1 184 1 4 2 1 3 5 1 110 1 7 5 1 4 2 3 1 6 0 5 7 3 0 1 9 4 6
Owners Capital Accounts . . . . . . . . . . . . . . . . . . . . . . . . . . . . . . . . .
Capital Stock & Other Capital . . . . . . . . . . . . . . . . . . . . . . . . . . .
Retained Earnings . . . . . . . . . . . . . . . . . . . . . . . . . . . . . . . . . . . . . . .
TOTAL CAPITAL . . . . . . . . . . . . . . . . . . . . . . . . . . . . . . . . . . . . . . . . . . . . .
TOTAL LIABILITIES AND CAPITAL . . . . . . . . . . . . . . . . . . . . . . . . . . . . . .
Average Assets 2 7 1 7 6 5 1 5 1 0
Upper Quartile 4 2 1 544 1 0 7 0
Median 5 1 6 8 5 1 5 5 1
1 - 2 5
DOLLARS PERCENT 4 1 1 4 7 3 1 854
2 1 16 6 1 2 2 7 5 1 7 6 6 1 32 0
19 1 5 3 2 1 8 1 9 93 1 3 0 6 1 5 8 0 10 1 8 3 2 1 4 8 1
9 1 10 2 1 7 9 0 182 1 18 1 1 0 7 1
2 1 1 8 5 3 1 2 4 7 4 1 0 5 0 1 8 3 8
22 1 1 3 7 3 1 6 6 2 4 9 1 52 2 1 594
6 1 7 98 1 6 8 3 . 9 1 74 0 1 4 4 6
3 13 1 3 3 9 1 4 7 0
4 1 2 5 8 1 6 3 6
4 9 9 1 7 7 9 1 1 7 7
4 1 0 7 6 1 7 2 8 2 0 1 0 0 5 1 5 2 7
7 3 0 1 9 4 6 17 1 3 10 1 44 8 12 1 6 7 8 1 0 3 1 54 1 8 0 1 1 6 8 0
2 1 0 0 6 1 54 8 18 1 92 0 1 6 2 5 4 4 1 5 7 8 1 8 7 5
3 7 1 3 0 0 1 0 9 1 14 9 1 3 1 1 1 74 1 692 1 65 9
2 8 1 6 3 5 1 3 0 5 2 5 8 1 12 9 1 644
1 0 9 1 6 9 9 104 1 4 6 6 1 5 1 8 1 3 7 1 0 7 3 1 3 16 2 4 1 1 64 9 1 5 3 3
4 99 1 7 7 9 1 17 7
Lower Quartile 98 7 1 5 8 6
8 . 3 %
0 . 4 % 1 . 2 % 3 . 9%
18 . 7% 2 . 2 % 1 . 8%
3 6 . 5 %
4 . 4 % 0 . 8 %
4 4 . 3 % 9 . 9% 1 . 4 % 1 . 9%
6 2 . 7 %
0 . 9%
1 0 0 . 0 %
0 . 8 % 4 . 0 % 0 . 1% 3 . 5% 2 . 5 %
11 . 0 %
0 . 4 % 3 . 8 % 8 . 9 % 0 . 0 %
2 1 . 8 % 3 5 . 0 %
5 . 7% 5 1 . 6 %
0 . 0 % 2 0 . 9% 2 7 . 4 % 4 8 . 4 %
1 0 0 . 0 %

1 - 2 6
Fiscal Year 2 0 1 3 Elko County
COMBINED INCOME STATEMENT - SUMMARY
With Gaming Revenue of $ 1 , 0 0 0 , 0 0 0 and over
Amounts Represent 18 Locat ions .
REVENUE Gaming . . . . . . . . . . . . . . . . . . . . . . . . . . . . . . . . . . . . . . . . . . . . . . . . . .
Rooms . . . . . . . . . . . . . . . . . . . . . . . . . . . . . . . . . . . . . . . . . . . . . . . . . . .
Food . . . . . . . . . . . . . . . . . . . . . . . . . . . . . . . . . . . . . . . . . . . . . . . . . . . .
Beverage . . . . . . . . . . . . . . . . . . . . . . . . . . . . . . . . . . . . . . . . . . . . . . . .
Other . . . . . . . . . . . . . . . . . . . . . . . . . . . . . . . . . . . . . . . . . . . . . . . . . . .
DOLLARS 2 5 6 , 5 3 0 , 9 3 3
3 2 , 9 0 5 , 956 4 8 , 9 9 2 , 4 3 8 2 1 , 7 12 1 924 3 0 , 2 6 1 , 6 2 7
3 9 0 , 4 0 3 , 8 7 8 TOTAL REVENUE . . . . . . . . . . . . . . . . . . . . . . . . . . . . . . . . . . . . . · · · · · · · · ----������
COST OF SALES 4 1 , 4 5 6 , 4 8 7
GROSS MARGIN 3 4 8 , 94 7 , 3 9 1
DEPARTMENTAL EXPENSES . . . . . . . . . . . . . . . . . . . . . . . . . . . . . . . . . . . . . 15 5 , 2 04 , 9 6 7
DEPARTMENTAL INCOME ( LOSS } 1 9 3 , 74 2 , 4 2 4 • • • • • • • • • • • • • • • • • • • • • • • • • • • • • • • • ----��...:.....::..:::..!.....::..::::-=.
GENERAL AND ADMINISTRATIVE EXPENSES Advert ising and Promotion . . . . . . . . . . . . . . . . . . . . . . . . . . . . . . . 2 0 , 8 2 6 , 3 6 1 Bad Debt Expense . . . . . . . . . . . . . . . . . . . . . . . . . . . . . . . . . . . . . . . . 6 5 , 4 7 7 Compl imentary Expense ( not reported in departments } . . . . . . 1 1 , 2 3 5 , 8 0 4 Depreciation - Buildings . . . . . . . . . . . . . . . . . . . . . . . . . . . . . . . . 12 , 1 84 , 4 9 9 Depreciation and Amortization - Other . . . . . . . . . . . . . . . . . . . 1 6 , 4 4 0 , 3 7 8 Energy Expense ( electricity, gas , etc . } . . . . . . . . . . . . . . . . . 8 , 64 9 , 8 4 3 Equipment Rental o r Lease . . . . . . . . . . . . . . . . . . . . . . . . . . . . . . . 2 9 9 , 5 6 9 Interest Expense . . . . . . . . . . . . . . . . . . . . . . . . . . . . . . . . . . . . . . . . 6 , 7 16 , 44 0 Mus ic and Entertainment . . . . . . . . . . . . . . . . . . . . . . . . . . . . . . . . . 6 , 8 6 8 , 0 6 9 Payroll Taxes . . . . . . . . . . . . . . . . . . . . . . . . . . . . . . . . . . . . . . . . . . . 2 , 52 0 , 5 6 0 Payroll - Employee Benefits . . . . . . . . . . . . . . . . . . . . . . . . . . . . . 5 , 2 2 6 , 9 4 0 Payroll - Officers . . . . . . . . . . . . . . . . . . . . . . . . . . . . . . . . . . . . . . 3 , 0 3 0 , 5 5 6 Payroll - Other Employees . . . . . . . . . . . . . . . . . . . . . . . . . . . . . . . 2 4 , 7 9 6 , 5 0 8 Rent o f Premises . . . . . . . . . . . . . . . . . . . . . . . . . . . . . . . . . . . . . . . . 4 , 4 2 5 , 6 1 9 Taxes - Real Estate . . . . . . . . . . . . . . . . . . . . . . . . . . . . . . . . . . . . . 3 , 2 0 7 , 5 7 8 Taxes and Licenses - Other . . . . . . . . . . . . . . . . . . . . . . . . . . . . . . 1 , 4 6 6 , 3 14 Ut ilities ( Other than Energy Expense} . . . . . . . . . . . . . . . . . . . 2 , 4 95 , 8 3 0 O ther General and Administrative Expenses . . . . . . . . . . . . . . . 2 0 , 5 0 1 , 8 4 3
1 5 0 , 95 8 , 188 TOTAL GENERAL AND ADMINISTRATIVE EXPENSES . . . . . . . . . · · · · · · · · ----������
NET INCOME ( LOSS } BEFORE FEDERAL INCOME TAXES AND EXTRAORDINARY ITEMS . . . . . . . . . . . . . . . . . . . . . . . . . . . . . . . . . . . .
Average Revenue 2 1 , 6 8 9 , 104
Upper Quartile 3 0 , 3 92 , 5 6 7
Median 1 0 , 158 , 8 7 1
4 2 , 7 8 4 , 2 3 6
Lower Quartile 2 , 8 5 1 , 6 6 6
PERCENT 6 5 . 7 %
8 . 4 % 12 . 5 %
5 . 6 % 7 . 8 %
1 0 0 . 0 %
1 0 . 6 %
8 9 . 4 %
3 9 . 8 %
4 9 . 6 %
5 . 3 % 0 . 0 % 2 . 9 % 3 . 1% 4 . 2 % 2 . 2 % 0 . 1% 1 . 7% 1 . 8% 0 . 6 % 1 . 3 % 0 . 8 % 6 . 4 % 1 . 1% 0 . 8 % 0 . 4 % 0 . 6 % 5 . 3 %
3 8 . 7 %
1 1 . 0 %

COMBINED INCOME STATEMENT - DETAIL Fi s cal Year 2 0 13 Elko County With Gaming Revenue of $ 1 , 0 0 0 , 0 0 0 and over
Amounts Represent 1 8 Locations .
CASINO DEPARTMENT
REVENUE Pit Revenue ( Includes Keno and Bingo) . . . . . . . . . . . . . . . . . . .
Coin Operated Devices . . . . . . . . . . . . . . . . . . . . . . . . . . . . . . . . . . .
Poker and Pan . . . . . . . . . . . . . . . . . . . . . . . . . . . . . . . . . . . . . . . . . . .
Race Book . . . . . . . . . . . . . . . . . . . . . . . . . . . . . . . . . . . . . . . . . . . . . . .
Sports Pool . . . . . . . . . . . . . . . . . . . . . . . . . . . . . . . . . . . . . . . . . . . . .
TOTAL REVENUE . . . . . . . . . . . . . . . . . . . . . . . . . . . . . . . . . . . . . . . . . . . . .
DEPARTMENTAL EXPENSES Bad Debt Expense . . . . . . . . . . . . . . . . . . . . . . . . . . . . . . . . . . . . . . . .
Commis sions . . . . . . . . . . . . . . . . . . . . . . . . . . . . . . . . . . . . . . . . . . . . .
Complimentary Expense . . . . . . . . . . . . . . . . . . . . . . . . . . . . . . . . . . .
Gaming Taxes and Licenses . . . . . . . . . . . . . . . . . . . . . . . . . . . . . . .
Preferred Guest Expenses (no compl imentarie s ) . . . . . . . . . . .
Payroll Taxes . . . . . . . . . . . . . . . . . . . . . . . . . . . . . . . . . . . . . . . . . . .
Payroll - Employee Benefits . . . . . . . . . . . . . . . . . . . . . . . . . . . . .
Payrol l - Officers . . . . . . . . . . . . . . . . . . . . . . . . . . . . . . . . . . . . . .
Payrol l - Other Employees . . . . . . . . . . . . . . . . . . . . . . . . . . . . . . .
Race Wire Fees . . . . . . . . . . . . . . . . . . . . . . . . . . . . . . . . . . . . . . . . . .
Other Departmental Expenses . . . . . . . . . . . . . . . . . . . . . . . . . . . . .
TOTAL DEPARTMENTAL EXPENSES . . . . . . . . . . . . . . . . . . . . . . . . . . . . . . .
DEPARTMENTAL INCOME ( LOS S ) . . . . . . . . . . . . . . . . . . . . . . . . . . . . . . . . .
ROOMS DEPARTMENT
REVENUE Room Sales . . . . . . . . . . . . . . . . . . . . . . . . . . . . . . . . . . . . . . . . . . . . . .
Complimentary Rooms . . . . . . . . . . . . . . . . . . . . . . . . . . . . . . . . . . . . .
TOTAL REVENUE . . . . . . . . . . . . . . . . . . . . . . . . . . . . . . . . . . . . . . . . . . . . .
DEPARTMENTAL EXPENSES Bad Debt Expense . . . . . . . . . . . . . . . . . . . . . . . . . . . . . . . . . . . . . . . .
Complimentary Expense . . . . . . . . . . . . . . . . . . . . . . . . . . . . . . . . . . . Payroll - Taxes . . . . . . . . . . . . . . . . . . . . . . . . . . . . . . . . . . . . . . . . .
Payroll - Employee Benefits . . . . . . . . . . . . . . . . . . . . . . . . . . . . .
Payrol l - Officers . . . . . . . . . . . . . . . . . . . . . . . . . . . . . . . . . . . . . .
Payrol l - Other Employees . . . . . . . . . . . . . . . . . . . . . . . . . . . . . . .
Other Departmental Expenses . . . . . . . . . . . . . . . . . . . . . . . . . . . . .
TOTAL DEPARTMENTAL EXPENSES . . . . . . . . . . . . . . . . . . . . . . . . . . . . . . .
DEPARTMENTAL INCOME ( LOSS ) . . . . . . . . . . . . . . . . . . . . . . . . . . . . . . . . .
1 - 2 7
DOLLARS PERCENT 4 3 , 8 6 1 , 2 3 3 1 7 . 1%
2 0 7 , 8 18 , 4 62 8 1 . 0% 3 , 3 12 , 13 3 1 . 3 %
2 99 , 2 3 3 0 . 1% 1 , 2 3 9 , 8 7 2 0 . 5 %
2 5 6 , 5 3 0 , 9 3 3 1 0 0 . 0%
6 8 , 7 7 5 0 . 0 % 14 8 , 2 9 0 0 . 1%
3 5 , 0 8 1 , 8 6 4 13 . 7 % 2 0 , 6 02 , 3 0 6 8 . 0 %
5 , 5 0 7 , 8 3 5 2 . 1% 3 , 2 54 , 9 5 5 1 . 3 % 2 , 6 9 9 , 8 2 3 1 . 1% 1 , 5 3 8 , 22 1 0 . 6%
1 9 , 3 7 9 , 8 5 9 7 . 6% 8 0 , 8 2 2 0 . 0%
8 , 3 93 , 19 9 3 . 3 % 9 6 , 7 5 5 , 9 4 9 3 7 . 7%
15 9 , 7 7 4 , 9 8 4 6 2 . 3 %
DOLLARS PERCENT 24 , 2 6 9 , 6 7 9 7 3 . 8 %
8 , 63 6 , 2 7 7 2 6 . 2 % 3 2 , 9 0 5,956 1 0 0 . 0 %
0 0 . 0% 2 9 6 , 7 8 9 0 . 9%
1 , 0 8 5 , 0 5 6 3 . 2 % 74 1 , 8 73 2 . 2 % 1 7 9 , 3 74 0 . 5%
10 , 9 6 0 , 2 6 6 3 3 . 3 % 5 , 99 7 , 6 7 8 1 8 . 2 %
19 , 2 6 1 , 0 3 6 5 8 . 5%
13 , 644 , 92 0 4 1 . 5 %

1 - 2 8 COMBINED INCOME STATEMENT - DETAIL ( CONTINUED )
Fiscal Year 2 0 1 3 Elko County
'
With Gaming Revenue of $ 1 , 0 0 0 , 0 0 0 and over
Amounts Represent 18 Locations .
FOOD DEPARTMENT REVENUE DOLLARS PERCENT
Food Sales 3 1 , 5 6 3 , 7 3 4 64 . 4 % Complimentary Food Sales . . . . . . . . . . . . . . . . . . . . . . . . . . . . . . . . 17 , 4 2 8 , 7 0 4 3 5 . 6 %
TOTAL REVENUE . . . . . . . . . . . . . . . . . . . . . . . . . . . . . . . . . . . . . . . . . . . . . 4 8 , 9 92 , 4 3 8 1 0 0 . 0 %
COST OF SALES 22 , 4 7 9 , 9 4 5 4 5 . 9 %
GROSS MARGIN 2 6 , 5 12 , 4 93 54 . 1%
DEPARTMENTAL EXPENSES Bad Debt Expense . . . . . . . . . . . . . . . . . . . . . . . . . . . . . . . . . . . . . . . . 0 0 . 0 % Compl imentary Expense . . . . . . . . . . . . . . . . . . . . . . . . . . . . . . . . . . . 1 , 42 7 , 3 52 2 . 9 % Payrol l - Taxes . . . . . . . . . . . . . . . . . . . . . . . . . . . . . . . . . . . . . . . . . 2 , 1 7 1 , 5 8 0 4 . 4 % Payrol l - Employee Benefits . . . . . . . . . . . . . . . . . . . . . . . . . . . . . 1 , 5 19 , 4 9 7 3 . 1% Payrol l - Officers . . . . . . . . . . . . . . . . . . . . . . . . . . . . . . . . . . . . . . 6 8 7 , 5 5 0 1 . 4 % Payrol l - Other Employees . . . . . . . . . . . . . . . . . . . . . . . . . . . . . . . 1 8 , 2 4 5 , 4 3 0 3 7 . 2 % Other Departmental Expenses . . . . . . . . . . . . . . . . . . . . . . . . . . . . . 3 , 0 7 2 , 0 5 2 6 . 3 %
TOTAL DEPARTMENTAL EXPENSES . . . . . . . . . . . . . . . . . . . . . . . . . . . . . . . 2 7 , 12 3 , 4 6 1 55 . 4 %
DEPARTMENTAL INCOME ( LOSS) . . . . . . . . . . . . . . . . . . . . . . . . . . . . . . . . . - 6 1 0 , 96 8 - 1 . 2 %
BEVERAGE DEPARTMENT REVENUE DOLLARS PERCENT
Beverage Sales . . . . . . . . . . . . . . . . . . . . . . . . . . . . . . . . . . . . . . . . . . 5 , 92 3 , 3 12 2 7 . 3 % Complimentary Beverage Sales . . . . . . . . . . . . . . . . . . . . . . . . . . . . 15 , 7 8 9 , 6 12 72 . 7 %
TOTAL REVENUE . . . . . . . . . . . . . . . . . . . . . . . . . . . . . . . . . . . . . . . . . . . . . 2 1 , 7 12 , 9 2 4 1 0 0 . 0 %
COST OF SALES 6 , 8 3 7 , 4 93 3 1 . 5 %
GROSS MARGIN . . . . . . . . . . . . . . . . . . . . . . . . . . . . . . . . . . . . . . . . . . . . . . 14 , 8 7 5 , 4 3 1 6 8 . 5 %
DEPARTMENTAL EXPENSES Bad Debt Expense . . . . . . . . . . . . . . . . . . . . . . . . . . . . . . . . . . . . . . . . 0 0 . 0 % Complimentary Expense . . . . . . . . . . . . . . . . . . . . . . . . . . . . . . . . . . . 2 6 , 1 7 5 0 . 1% Payrol l - Taxes . . . . . . . . . . . . . . . . . . . . . . . . . . . . . . . . . . . . . . . . . 5 7 0 , 2 6 8 2 . 6 % Payroll - Employee Benefits . . . . . . . . . . . . . . . . . . . . . . . . . . . . . 6 0 7 , 3 2 8 2 . 8 % Payroll - Officers . . . . . . . . . . . . . . . . . . . . . . . . . . . . . . . . . . . . . . 114 , 3 7 1 0 . 5 % Payroll - Other Employees . . . . . . . . . . . . . . . . . . . . . . . . . . . . . . . 3 , 5 3 0 , 5 12 16 . 3 % Other Departmental Expenses . . . . . . . . . . . . . . . . . . . . . . . . . . . . . 6 6 0 , 2 3 4 3 . 0 %
TOTAL DEPARTMENTAL EXPENSES . . . . . . . . . . . . . . . . . . . . . . . . . . . . . . . 5 , 5 0 8 , 8 8 8 2 5 . 4 %
DEPARTMENTAL INCOME ( LOSS ) . . . . . . . . . . . . . . . . . . . . . . . . . . . . . . . . . 9 , 3 6 6 , 54 3 4 3 . 1 %

COMBINED INCOME STATEMENT - DETAIL ( CONTINUED )
Fiscal Year 2 0 13 Elko County With Gaming Revenue of $ 1 , 0 0 0 , 0 0 0 and over
Amounts Represent 18 Locations .
OTHER INCOME REVENUE
Other Operating and Non- operating Income . . . . . . . . . . . . . . . .
Other Complimentary Items . . . . . . . . . . . . . . . . . . . . . . . . . . . . . . .
TOTAL REVENUE . . . . . . . . . . . . . . . . . . . . . . . . . . . . . . . . . . . . . . . . . . . . .
COST OF SALES . . . . . . . . . . . . . . . . . . . . . . . . . . . . . . . . . . . . . . . . . . . . .
GROSS MARGIN . . . . . . . . . . . . . . . . . . . . . . . . . . . . . . . . . . . . . . . . . . . . . .
DEPARTMENTAL EXPENSES Bad Debt Expense . . . . . . . . . . . . . . . . . . . . . . . . . . . . . . . . . . . . . . . .
Complimentary Expense . . . . . . . . . . . . . . . . . . . . . . . . . . . . . . . . . . .
Payrol l - Taxes . . . . . . . . . . . . . . . . . . . . . . . . . . . . . . . . . . . . . . . . .
Payrol l - Employee Benefits . . . . . . . . . . . . . . . . . . . . . . . . . . . . .
Payrol l - Officers . . . . . . . . . . . . . . . . . . . . . . . . . . . . . . . . . . . . . . Payrol l - Other Employees . . . . . . . . . . . . . . . . . . . . . . . . . . . . . . . Other Departmental Expenses . . . . . . . . . . . . . . . . . . . . . . . . . . . . .
TOTAL DEPARTMENTAL EXPENSES . . . . . . . . . . . . . . . . . . . . . . . . . . . . . . .
DEPARTMENTAL INCOME ( LOSS ) . . . . . . . . . . . . . . . . . . . . . . . . . . . . . . . . .
AVERAGE NUMBER OF EMPLOYEES FOR THE YEAR
CASINO DEPARTMENT ROOMS DEPARTMENT . . . . . . . . . . . . . . . . . . . . . .
FOOD DEPARTMENT . . . . . . . . . . . . . . . . . . . . . . . BEVERAGE DEPARTMENT . . . . . . . . . . . . . . . . . . .
G & A DEPARTMENT . . . . . . . . . . . . . . . . . . . . . OTHER DEPARTMENTS . . . . . . . . . . . . . . . . . . . . .
TOTAL
DOLLARS 2 5 , 692 , 1 6 6
4 , 56 9 , 4 6 1 3 0 , 2 6 1 , 6 2 7
12 , 13 9 , 0 4 9
18 , 12 2 , 5 7 8
0 98 7 , 8 9 8 244 , 17 9 175 , 2 3 0 15 7 , 4 4 2
2 , 212 , 129 2 , 77 8 , 7 5 5 6 , 55 5 , 6 3 3
11 , 56 6 , 945
1 , 1 0 5 5 3 8 9 9 6 2 5 6 8 78 114
3 , 8 8 7
1 - 2 9
PERCENT 8 4 . 9 % 15 . 1%
1 0 0 . 0 %
4 0 . 1%
5 9 . 9%
0 . 0 % 3 . 3 % 0 . 8 %-0 . 6%-0 . 5%-7 . 3 %-9 . 2 %
2 1 . 7 %
3 8 . 2 %

1 - 3 0 ROOM OCCUPANCY AND PER ROOM PER DAY ANALYSIS
Fiscal Year 2 0 13 E lko County With Gaming Revenue of $ 1 , 0 0 0 , 0 0 0 and over
Amounts Represent 18 Locations .
MONTH JULY .. . . . . . . . . .
AUGUST . . . . . . . .
SEPTEMBER . . . . .
OCTOBER . . . . . . . NOVEMBER . . . . . . DECEMBER . . . . . . JANUARY . . . .. . . . FEBRUARY . . . . . . MARCH . . . . . . . . . APRIL . . . . . . . . . MAY . . . . . . . . . .. . JUNE . . . . . . . . . .
TOTAL . . . . . . . . .
Average Pit Revenue Per Room Per Day
Average Slot Revenue Per Room Per Day
Average Food Sales Per Room Per Day
RATE OF ROOM OCCUPANCY
AVAILABLE ROOMS ROOMS OCCUPIED
8 6 , 0 4 7 7 0 , 943 8 6 , 4 0 5 7 1 , 7 7 5 93 , 6 7 6 74 , 4 8 9 8 5 , 7 7 8 6 6 , 6 5 9 84 , 3 0 5 5 8 , 6 4 1 94 , 7 0 5 5 7 , 6 5 8 8 5 , 3 6 0 54 , 3 62 8 1 , 0 1 3 5 7 , 2 9 8 95 , 3 8 1 7 1 , 3 9 5 84 , 6 94 6 0 , 3 3 7 8 6 , 0 2 2 6 3 , 4 0 5 9 3 , 4 7 0 7 2 , 0 7 5
1 , 0 5 6 , 8 5 6 7 7 9 , 0 3 7
PER ROOM PER DAY STATISTICS
5 6 . 3 0
2 6 6 . 76
62 . 8 9
Average Beverage Sales Per Room Per Day
Average Rooms Department Payrol l Per Room Per Day
Average Room Rate Per Day
% OF OCCUPANCY
(COMPUTED) 8 2 . 4 5 % 8 3 . 0 7 % 7 9 . 52 % 7 7 . 7 1 % 6 9 . 5 6 % 6 0 . 8 8 % 6 3 . 6 9 % 7 0 . 7 3 % 74 . 8 5 % 7 1 . 24 % 7 3 . 7 1 % 7 7 . 11%
7 3 . 7 1 %
2 7 . 8 7
16 . 64
4 2 . 24

PER SQUARE FOOT ANALYSIS AND RATIOS 1 - 3 1 Fiscal Year 2 0 1 3 Elko County With Gaming Revenue of $ 1 , 0 0 0 , 0 0 0 and over
Amounts Represent 18 Locations .
GAMING REVENUE PER SQUARE FOOT OF FLOOR SPACE
NO . OF CASINOS AVERAGE AREA GAMING REVENUE AREA OPERATING IN SQUARE FEET PER SQUARE FOOT
Pit ( Includes Bingo and Keno) 10 4 , 34 5 Coin Operated Devices 1 8 1 3 , 5 9 7 Poker and Pan 5 1 , 4 3 7 Race and Sports 3 1 , 3 1 8
TOTAL CASINO 18 1 6 , 63 0
RATIOS
TOTAL CURRENT ASSETS TO TOTAL CURRENT LIABILITIES . . . . . . . . .
TOTAL CAPITAL TO TOTAL LIABILITIES . . . . . . . . . . . . . . . . . . . . . . . .
TOTAL CAPITAL TO TOTAL CURRENT LIABILITIES . . . . . . . . . . . . . . . .
TOTAL CURRENT LIABILITIES TO TOTAL LIABILITIES . . . . . . . . . . . .
TOTAL COMPLIMENTARY EXPENSE TO GAMING REVENUE . . . . . . . . . . . . .
MUSIC AND ENTERTAINMENT EXPENSES TO GAMING REVENUE . . . . . . . .
TOTAL REVENUE TO AVERAGE TOTAL ASSETS . . . . . . . . . . . . . . . . . . . . .
TOTAL REVENUE LESS COMP SALES TO AVERAGE TOTAL ASSETS . . . . .
RETURN ON INVESTED CAPITAL* . . . . . . . . . . . . . . . . . . . . . . . . . . . . . . .
RETURN ON AVERAGE ASSETS* . . . . . . . . . . . . . . . . . . . . . . . . . . . . . . . . .
* - FORMULAS
Return on Invested Capital i s equal to the total of net income ( before federal income taxes and extraordinary items ) and interest
expense divided by the total of average total assets less average current liabil ities .
PERCENT 3 3 2 . 4%-
93 . 6 %
4 4 1 . 0 %
2 1 . 2 %
1 9 . 1%
2 . 7%
8 0 . 6 %
7 1 . 0 %
12 . 4 %
10 . 2 %
Return on Average Assets is equal to the total of net income (before federal income taxes and extraordinary items ) and interest expense divided by the average total assets .
9 6 4 8 4 9 4 6 1 3 8 9
8 5 7

1 - 3 2
THIS PAGE LEFT INTENTIONALLY BLANK

COMBINED BALANCE SHEET Fiscal Year 2 0 13 Carson Valley Area With Gaming Revenue of $ 1 , 0 0 0 , 0 0 0 and over
Amounts Represent 15 Locations .
ASSETS CURRENT ASSETS
Cash . . . . . . . . . . . . . . . . . . . . . . . . . . . . . . . . . . . . . . . . . . . . . . . . . . . .
Receivables TOTAL ALLOWANCE Casino 4 0 7 , 3 8 9 2 12 , 0 5 9 Trade 5 4 0 , 6 9 9 o
Sundry 3 19 , 5 1 6 2 0 , 6 5 0 Notes 2 , 90 0 2 , 8 0 0
Prepaid Expenses . . . . . . . . . . . . . . . . . . . . . . . . . . . . . . . . . . . . . . . . Other Current Assets . . . . . . . . . . . . . . . . . . . . . . . . . . . . . . . . . . . .
TOTAL CURRENT ASSETS . . . . . . . . . . . . . . . . . . . . . . . . . . . . . . . . . . . . . .
FIXED ASSETS COST DEPRECIATION Land 1 0 , 6 3 2 , 7 8 4 . . . . . . . . . . .
Land Improvements 2 , 0 8 0 , 3 13 2 2 6 , 4 84 Buildings & Improvements 4 4 , 5 6 8 , 6 7 0 1 5 , 3 52 , 3 8 2 Furniture & Equipment 9 9 , 1 4 3 , 5 2 1 8 1 , 0 14 , 7 4 9 Lease Improvements 8 , 7 6 9 , 9 9 1 4 , 66 0 , 8 0 6 Construction in Progress 1 , 3 97 , 6 9 3 . . . . . . . . . . .
TOTAL FIXED ASSETS . . . . . . . . . . . . . . . . . . . . . . . . . . . . . . . . . . . . . . . .
OTHER ASSETS
TOTAL ASSETS
LIABILITIES AND CAPITAL CURRENT LIABILITIES
Accounts Payabl e - Trade . . . . . . . . . . . . . . . . . . . . . . . . . . . . . . . . Accounts Payable - Other . . . . . . . . . . . . . . . . . . . . . . . . . . . . . . . .
Current Portion of Long- Term Debt . . . . . . . . . . . . . . . . . . . . . . .
Accrued Expenses . . . . . . . . . . . . . . . . . . . . . . . . . . . . . . . . . . . . . . . . Other Current Liabilities . . . . . . . . . . . . . . . . . . . . . . . . . . . . . . .
TOTAL CURRENT LIABILITIES . . . . . . . . . . . . . . . . . . . . . . . . . . . . . . . . .
LONG- TERM DEBT Mortgages Debentures & Bonds
TOTAL OWING 1 8 , 3 2 9 , 7 3 8
0
CURRENT PORTION 4 0 7 , 9 6 6
0 Note s 2 3 , 4 6 7 , 1 8 2 8 0 0 , 7 3 8 Contracts 1 , 0 97 , 0 3 7 4 04 , 74 1 Other 1 8 , 7 6 4 , 2 8 5 0
TOTAL LONG- TERM DEBT 6 1 , 6 5 8 , 2 4 2 1 , 6 1 3 , 44 5 OTHER LIABILITIES . . . . . . . . . . . . . . . . . . . . . . . . . . . . . . . . . . . . . . . . .
TOTAL LIABILITIES
CAPITAL Owners Capital Accounts . . . . . . . . . . . . . . . . . . . . . . . . . . . . . . . . . Capital Stock & Other Capital . . . . . . . . . . . . . . . . . . . . . . . . . . .
Retained Earnings . . . . . . . . . . . . . . . . . . . . . . . . . . . . . . . . . . . . . . .
TOTAL CAPITAL . . . . . . . . . . . . . . . . . . . . . . . . . . . . . . . . . . . . . . . . . . . . .
TOTAL LIABILITIES AND CAPITAL . . . . . . . . . . . . . . . . . . . . . . . . . . . . . .
Average Assets 6 , 6 6 7 , 8 6 1
Upper Quartile 9 , 1 19 , 54 0
Median 2 , 72 6 , 32 7
1 - 3 3
DOLLARS PERCENT 16 , 54 9 , 0 9 8 1 6 . 5 %-
195 , 3 3 0 0 . 2 %-54 0 , 6 9 9 0 . 5 %-2 98 , 8 6 6 0 . 3 %-
1 0 0 0 . 0 %-3 , 8 7 5 , 115 3 . 9% 4 , 8 0 4 , 6 7 3 4 . 8 %
2 6 , 2 6 3 , 8 8 1 2 6 . 3 %
10 , 63 2 , 7 8 4 1 0 . 6% 1 , 8 5 3 , 8 2 9 1 . 9%
2 9 , 2 1 6 , 2 8 8 2 9 . 2 % 18 , 12 8 , 7 7 2 1 8 . 1%
4 , 10 9 , 1 8 5 4 . 1% 1 , 3 9 7 , 6 9 3 1 . 4 %
6 5 , 3 3 8 , 5 5 1 6 5 . 3 %-
8 , 4 15 , 4 8 0 8 . 4 %
1 0 0 , 0 1 7 , 912 1 0 0.0%
3 , 65 9 , 3 3 1 3 . 7 %-3 15 , 5 0 5 0 . 3 %
1 , 6 1 3 , 44 5 1 . 6 %-7 , 6 84 , 6 3 6 7 . 7 %-1 , 166 , 4 13 1 . 2 %
14 , 4 3 9 , 3 3 0 14 . 4 %
1 7 , 92 1 , 7 7 2 1 7 . 9% 0 0 . 0 %
22 , 6 6 6 , 4 4 4 22 . 7 % 692 , 2 9 6 0 . 7 %
18 , 7 6 4 , 2 8 5 1 8 . 8 % 6 0 , 044 , 7 9 7 6 0 . 0 %
919 , 55 9 0 . 9% 7 5 , 4 0 3 , 6 8 6 7 5 . 4 %
4 2 , 7 8 7 , 7 7 0 4 2 . 8 % 1 0 , 3 7 7 , 04 7 1 0 . 4 %
- 2 8 , 5 5 0 , 5 9 1 - 2 8 . 5 %-2 4 , 6 14 , 22 6 2 4 . 6 %
1 0 0 , 0 1 7 , 912 1 0 0 . 0 %-
Lower Quarti le 1 , 2 3 3 , 8 3 8

1 - 3 4
Fiscal Year 2 0 13 Carson Valley Area
COMBINED INCOME STATEMENT - SUMMARY
With Gaming Revenue of $ 1 , 0 0 0 , 0 0 0 and over
Amounts Represent 15 Locations .
REVENUE Gaming . . . . . . . . . . . . . . . . . . . . . . . . . . . . . . . . . . . . . . . . . . . . . . . . . . Rooms . . . . . . . . . . . . . . . . . . . . . . . . . . . . . . . . . . . . . . . . . . . . . . . . . . . Food . . . . . . . . . . . . . . . . . . . . . . . . . . . . . . . . . . . . . . . . . . . . . . . . . . . .
B everage . . . . . . . . . . . . . . . . . . . . . . . . . . . . . . . . . . . . . . . . . . . . . . . .
Other . . . . . . . . . . . . . . . . . . . . . . . . . . . . . . . . . . . . . . . . . . . . . . . . . . .
DOLLARS 95 , 8 0 3 , 6 3 5
8 , 2 3 9 , 9 5 0 2 1 , 8 3 0 , 7 7 0
9 , 6 6 2 , 3 5 6 1 3 , 0 8 3 , 4 6 8
148 , 62 0 , 1 7 9 TOTAL REVENUE . . . . . . . . . . . . . . . . . . . . . . . . . . . . . . . . . . . . . . . . · · · · ·
----
������
COST OF SALES 2 3 , 1 5 3 , 2 3 9
GROSS MARGIN 12 5 , 4 6 6 , 9 4 0
DEPARTMENTAL EXPENSES . . . . . . . . . . . . . . . . . . . . . . . . . . . . . . . . . . . . . 6 5 , 9 8 8 , 5 3 6
5 9 , 4 7 8 , 4 04 DEPARTMENTAL INCOME ( LOSS ) . . . . . . . . . . . . . . . . . . . . . . . . . · · · · · · · ----�����
GENERAL AND ADMINISTRATIVE EXPENSES Advertising and Promotion . . . . . . . . . . . . . . . . . . . . . . . . . . . . . . . 4 , 0 92 , 054 Bad Debt Expense . . . . . . . . . . . . . . . . . . . . . . . . . . . . . . . . . . . . . . . . 4 2 , 6 9 5 Complimentary Expense (not reported i n departments ) . . . . . . 2 , 3 4 2 , 5 8 6 Depreciation - Buildings . . . . . . . . . . . · . . . . . . . . . . . . . . . . . . . . . 1 , 0 0 8 , 2 8 2 Depreciation and Amorti zation - Other . . . . . . . . . . . . . . . . . . . 7 , 6 3 5 , 3 5 0 Energy Expense ( electricity , gas , etc . ) . . . . . . . . . . . . . . . . . 3 , 4 0 2 , 64 3 E quipment Rental or Lease . . . . . . . . . . . . . . . . . . . . . . . . . . . . . . . 5 3 3 , 2 0 3 Interest Expense . . . . . . . . . . . . . . . . . . . . . . . . . . . . . . . . . . . . . . . . 3 , 2 9 6 , 1 8 5 Music and Entertainment . . . . . . . . . . . . . . . . . . . . . . . . . . . . . . . . . 4 2 1 , 9 1 3 Payroll Taxes . . . . . . . . . . . . . . . . . . . . . . . . . . . . . . . . . . . . . . . . . . . 1 , 3 5 1 , 6 9 7 Payroll - Employee Benefits . . . . . . . . . . . . . . . . . . . . . . . . . . . . . 1 , 6 2 1 , 4 17 Payroll - Officers . . . . . . . . . . . . . . . . . . . . . . . . . . . . . . . . . . . . . . 4 2 7 , 3 6 1 Payroll - Other Employees . . . . . . . . . . . . . . . . . . . . . . . . . . . . . . . 1 1 , 7 7 8 , 953 Rent of Premises . . . . . . . . . . . . . . . . . . . . . . . . . . . . . . . . . . . . . . . . 3 , 24 0 , 3 11 Taxes - Real Estate . . . . . . . . . . . . . . . . . . . . . . . . . . . . . . . . . . . . . 5 2 1 , 0 9 7 Taxes and Licenses - Other . . . . . . . . . . . . . . . . . . . . . . . . . . . . . . 6 3 8 , 153 Utilities ( Other than Energy Expense) . . . . . . . . . . . . . . . . . . . 1 , 2 3 7 , 7 9 5 O ther General and Administrative Expenses . . . . . . . . . . . . . . . 8 , 7 92 , 4 0 5
5 2 , 3 84 , 1 0 0 TOTAL GENERAL AND ADMINISTRATIVE EXPENSES . . . . . . . . . . · · · · · · ·
----
������
NET INCOME ( LOSS ) BEFORE FEDERAL INCOME TAXES AND EXTRAORDINARY ITEMS . . . . . . . . . . . . . . . . . . . . . . . . . . . . . . . . . . . .
Average Revenue 9 , 9 0 8 , 0 12
Upper Quartile 14 , 3 0 7 , 0 8 3
Median 6 , 4 0 3 , 6 6 6
7 , 0 94 , 3 04
Lower Quartile 2 , 2 3 3 , 3 6 1
PERCENT 64 . 5 %-
5 . 5 %-14 . 7 %-
6 . 5 %-8 . 8 %-
1 0 0 . 0 %-
15 . 6 %-
84 . 4 %
44 . 4 %-
4 0 . 0 %-
2 . 8 %-0 . 0 %-1 . 6 %-0 . 7%-5 . 1%-2 . 3 %-0 . 4 %-2 . 2 %-0 . 3 %-0 . 9 %-1 . 1% 0 . 3 %-7 . 9 %-2 . 2 %-0 . 4 % 0 . 4%-0 . 8 %-5 . 9%-
3 5 . 2 %
4 . 8 %

COMBINED INCOME STATEMENT - DETAIL Fiscal Year 2 0 13 Carson Val ley Area With Gaming Revenue of $ 1 , 0 0 0 , 0 0 0 and over
Amounts Represent 15 Locations .
CASINO DEPARTMENT
REVENUE Pit Revenue { Includes Keno and Bingo) . . . . . . . . . . . . . . . . . . .
Coin Operated Devices . . . . . . . . . . . . . . . . . . . . . . . . . . . . . . . . . . . Poker and Pan . . . . . . . . . . . . . . . . . . . . . . . . . . . . . . . . . . . . . . . . . . .
Race Book . . . . . . . . . . . . . . . . . . . . . . . . . . . . . . . . . . . . . . . . . . . . . . .
Sports Pool . . . . . . . . . . . . . . . . . . . . . . . . . . . . . . . . . . . . . . . . . . . . .
TOTAL REVENUE . . . . . . . . . . . . . . . . . . . . . . . . . . . . . . . . . . . . . . . . . . . . .
DEPARTMENTAL EXPENSES Bad Debt Expense . . . . . . . . . . . . . . . . . . . . . . . . . . . . . . . . . . . . . . . .
Commis sions . . . . . . . . . . . . . . . . . . . . . . . . . . . . . . . . . . . . . . . . . . . . .
Compl imentary Expense . . . . . . . . . . . . . . . . . . . . . . . . . . . . . . . . . . . Gaming Taxes and Licenses . . . . . . . . . . . . . . . . . . . . . . . . . . . . . . .
Preferred Guest Expenses {no compl imentaries ) . . . . . . . . . . . Payroll Taxes . . . . . . . . . . . . . . . . . . . . . . . . . . . . . . . . . . . . . . . . . . .
Payroll - Employee Benefits . . . . . . . . . . . . . . . . . . . . . . . . . . . . .
Payroll - Officers . . . . . . . . . . . . . . . . . . . . . . . . . . . . . . . . . . . . . .
Payrol l - Other Employees . . . . . . . . . . . . . . . . . . . . . . . . . . . . . . .
Race Wire Fees . . . . . . . . . . . . . . . . . . . . . . . . . . . . . . . . . . . . . . . . . .
Other Departmental Expenses . . . . . . . . . . . . . . . . . . . . . . . . . . . . .
TOTAL DEPARTMENTAL EXPENSES . . . . . . . . . . . . . . . . . . . . . . . . . . . . . . .
DEPARTMENTAL INCOME { LOSS ) . . . . . . . . . . . . . . . . . . . . . . . . . . . . . . . . .
ROOMS DEPARTMENT
REVENUE Room Sales . . . . . . . . . . . . . . . . . . . . . . . . . . . . . . . . . . . . . . . . . . . . . .
Compl imentary Rooms . . . . . . . . . . . . . . . . . . . . . . . . . . . . . . . . . . . . .
TOTAL REVENUE . . . . . . . . . . . . . . . . . . . . . . . . . . . . . . . . . . . . . . . . . . . . .
DEPARTMENTAL EXPENSES Bad Debt Expense . . . . . . . . . . . . . . . . . . . . . . . . . . . . . . . . . . . . . . . .
Complimentary Expense . . . . . . . . . . . . . . . . . . . . . . . . . . . . . . . . . . .
Payrol l - Taxes . . . . . . . . . . . . . . . . . . . . . . . . . . . . . . . . . . . . . . . . .
Payrol l - Employee Benefits . . . . . . . . . . . . . . . . . . . . . . . . . . . . . Payrol l - Officers . . . . . . . . . . . . . . . . . . . . . . . . . . . . . . . . . . . . . .
Payroll - Other Employees . . . . . . . . . . . . . . . . . . . . . . . . . . . . . . .
Other Departmental Expenses . . . . . . . . . . . . . . . . . . . . . . . . . . . . .
TOTAL DEPARTMENTAL EXPENSES . . . . . . . . . . . . . . . . . . . . . . . . . . . . . . .
DEPARTMENTAL INCOME {LOSS ) . . . . . . . . . . . . . . . . . . . . . . . . . . . . . . . . .
1 - 3 5
DOLLARS PERCENT 6 , 3 65 , 3 2 1 6 . 6 %
8 8 , 0 1 6 , 7 9 0 9 1 . 9% 5 7 6 , 6 6 3 0 . 6% 6 1 1 , 8 6 4 0 . 6% 2 3 2 , 9 9 7 0 . 2 %
95 , 8 0 3 , 6 3 5 1 0 0 . 0%
8 , 0 1 7 0 . 0% 1 , 3 5 7 , 0 4 5 1 . 4 %
11 , 10 6 , 7 3 8 11 . 6% 8 , 0 6 3 , 7 7 5 8 . 4 %
4 74 , 0 7 9 0 . 5% 1 , 0 92 , 7 6 0 1 . 1% 1 , 0 8 6 , 8 4 8 1 . 1%
0 0 . 0 % 1 0 , 2 2 0 , 14 2 1 0 . 7%
2 3 8 , 8 1 9 0 . 2 % 8 , 0 1 0 , 0 6 2 8 . 4 %
4 1 , 6 5 8 , 2 8 5 4 3 . 5 %
54 , 14 5,3 5 0 5 6 . 5 %
DOLLARS PERCENT 7 , 0 7 9 , 6 3 5 8 5 . 9% 1 , 16 0 , 3 15 14 . 1% 8 , 2 3 9 , 95 0 1 0 0 . 0 %
129 0 . 0 % 2 1 7 , 2 9 0 2 . 6 % 24 8 , 6 0 5 3 . 0 % 190 , 522 2 . 3 %
0 0 . 0% 2 , 3 24 , 7 5 9 2 8 . 2 % 1 , 4 7 1 , 4 5 9 1 7 . 9% 4 , 4 52 , 7 6 4 54 . 0 %
3 , 7 8 7 , 1 8 6 4 6 . 0%

1 - 3 6 COMBINED INCOME STATEMENT - DETAIL ( CONTINUED)
Fiscal Year 2 0 13 Carson Valley Area With Gaming Revenue of $ 1 , 0 0 0 , 0 0 0 and over
Amounts Represent 15 Locations .
FOOD DEPARTMENT REVENUE
Food Sales Complimentary Food Sales . . . . . . . . . . . . . . . . . . . . . . . . . . . . . . . .
TOTAL REVENUE . . . . . . . . . . . . . . . . . . . . . . . . . . . . . . . . . . . . . . . . . . . . .
COST OF SALES
GROSS MARGIN
DEPARTMENTAL EXPENSES Bad Debt Expense . . . . . . . . . . . . . . . . . . . . . . . . . . . . . . . . . . . . . . . .
Complimentary Expense . . . . . . . . . . . . . . . . . . . . . . . . . . . . . . . . . . .
Payroll - Taxes . . . . . . . . . . . . . . . . . . . . . . . . . . . . . . . . . . . . . . . . .
Payrol l - Employee Benef its . . . . . . . . . . . . . . . . . . . . . . . . . . . . .
Payrol l - Officers . . . . . . . . . . . . . . . . . . . . . . . . . . . . . . . . . . . . . .
Payrol l - Other Employees . . . . . . . . . . . . . . . . . . . . . . . . . . . . . . .
Other Departmental Expenses . . . . . . . . . . . . . . . . . . . . . . . . . . . . .
TOTAL DEPARTMENTAL EXPENSES . . . . . . . . . . . . . . . . . . . . . . . . . . . . . . .
DEPARTMENTAL INCOME ( LOSS ) . . . . . . . . . . . . . . . . . . . . . . . . . . . . . . . . .
BEVERAGE DEPARTMENT REVENUE
Beverage Sales . . . . . . . . . . . . . . . . . . . . . . . . . . . . . . . . . . . . . . . . . .
Compl imentary Beverage Sales . . . . . . . . . . . . . . . . . . . . . . . . . . . .
TOTAL REVENUE . . . . . . . . . . . . . . . . . . . . . . . . . . . . . . . . . . . . . . . . . . . . .
COST OF SALES
GROSS MARGIN . . . . . . . . . . . . . . . . . . . . . . . . . . . . . . . . . . . . . . . . . . . . . .
DEPARTMENTAL EXPENSES Bad Debt Expense . . . . . . . . . . . . . . . . . . . . . . . . . . . . . . . . . . . . . . . . Compl imentary Expense . . . . . . . . . . . . . . . . . . . . . . . . . . . . . . . . . . .
Payrol l - Taxes . . . . . . . . . . . . . . . . . . . . . . . . . . . . . . . . . . . . . . . . .
Payrol l - Employee Benef its . . . . . . . . . . . . . . . . . . . . . . . . . . . . .
Payrol l - Officers . . . . . . . . . . . . . . . . . . . . . . . . . . . . . . . . . . . . . .
Payrol l - Other Employees . . . . . . . . . . . . . . . . . . . . . . . . . . . . . . .
Other Departmental Expenses . . . . . . . . . . . . . . . . . . . . . . . . . . . . .
TOTAL DEPARTMENTAL EXPENSES . . . . . . . . . . . . . . . . . . . . . . . . . . . . . . .
DEPARTMENTAL INCOME ( LOSS ) . . . . . . . . . . . . . . . . . . . . . . . . . . . . . . . . .
DOLLARS 16 , 7 3 1 , 5 9 1
5 , 0 9 9 , 1 7 9 2 1 , 8 3 0 , 7 7 0
1 0 , 0 7 2 , 2 8 2
1 1 , 7 5 8 , 4 8 8
0 2 8 3 , 6 3 8
1 , 2 8 0 , 8 1 8 9 8 7 , 3 2 4
0 1 0 , 8 2 8 , 6 7 3
2 , 0 2 5 , 7 8 8 15 , 4 0 6 , 2 4 1
- 3 , 64 7 , 7 5 3
DOLLARS 2 , 0 9 9 , 2 9 8 7 , 5 6 3 , 0 5 8 9 , 6 6 2 , 3 5 6
3 , 4 19 , 6 6 1
6 , 2 4 2 , 6 9 5
0 2 1 , 8 94
2 4 7 , 744 1 7 5 , 0 8 7
0 1 , 7 2 0 , 9 9 0
3 6 9 , 654 2 , 5 3 5 , 3 6 9
3 , 7 0 7 , 3 2 6
PERCENT 7 6 . 6 % 2 3 . 4 %
1 0 0 . 0 %
4 6 . 1%
5 3 . 9 %
0 . 0 % 1 . 3 % 5 . 9 % 4 . 5 % 0 . 0 %
4 9 . 6 % 9 . 3 %
7 0 . 6 %
- 1 6 . 7 %
PERCENT 2 1 . 7 % 7 8 . 3 %
1 0 0 . 0 %
3 5 . 4 %
64 . 6 %
0 . 0 % 0 . 2 % 2 . 6 % 1 . 8 % 0 . 0 %
1 7 . 8 % 3 . 8 %
2 6 . 2 %
3 8 . 4 %

COMBINED INCOME STATEMENT - DETAIL ( CONTINUED)
Fiscal Year 2 0 13 Carson Valley Area With Gaming Revenue of $ 1 , 0 0 0 , 0 0 0 and over
Amounts Represent 15 Locations .
OTHER INCOME REVENUE
Other Operating and Non- operating Income . . . . . . . . . . . . . . . .
Other Complimentary I tems . . . . . . . . . . . . . . . . . . . . . . . . . . . . . . .
TOTAL REVENUE . . . . . . . . . . . . . . . . . . . . . . . . . . . . . . . . . . . . . . . . . . . . .
COST OF SALES . . . . . . . . . . . . . . . . . . . . . . . . . . . . . . . . . . . . . . . . . . . . .
GROSS MARGIN . . . . . . . . . . . . . . . . . . . . . . . . . . . . . . . . . . . . . . . . . . . . . .
DEPARTMENTAL EXPENSES Bad Debt Expense . . . . . . . . . . . . . . . . . . . . . . . . . . . . . . . . . . . . . . . .
Complimentary Expense . . . . . . . . . . . . . . . . . . . . . . . . . . . . . . . . . . .
Payrol l - Taxes . . . . . . . . . . . . . . . . . . . . . . . . . . . . . . . . . . . . . . . . .
Payrol l - Employee Benefits . . . . . . . . . . . . . . . . . . . . . . . . . . . . .
Payrol l - Officers . . . . . . . . . . . . . . . . . . . . . . . . . . . . . . . . . . . . . .
Payroll - Other Employees . . . . . . . . . . . . . . . . . . . . . . . . . . . . . . .
Other Departmental Expenses . . . . . . . . . . . . . . . . . . . . . . . . . . . . . TOTAL DEPARTMENTAL EXPENSES . . . . . . . . . . . . . . . . . . . . . . . . . . . . . . .
DEPARTMENTAL INCOME ( LOSS ) . . . . . . . . . . . . . . . . . . . . . . . . . . . . . . . . .
AVERAGE NUMBER OF EMPLOYEES FOR THE YEAR
CASINO DEPARTMENT ROOMS DEPARTMENT . . . . . . . . . . . . . . . . . . . . . .
FOOD DEPARTMENT . . . . . . . . . . . . . . . . . . . . . . .
BEVERAGE DEPARTMENT . . . . . . . . . . . . . . . . . . .
G & A DEPARTMENT . . . . . . . . . . . . . . . . . . . . .
OTHER DEPARTMENTS . . . . . . . . . . . . . . . . . . . . .
TOTAL
DOLLARS 1 3 , 0 5 7 , 8 6 6
2 5 , 6 0 2 13 , 0 8 3 , 4 6 8
9 , 6 6 1 , 2 9 6
3 , 42 2 , 172
3 7 4 6 9 , 6 3 3 8 0 , 8 6 8 6 9 , 792
0 8 1 3 , 0 7 7 9 0 2 , 13 3
1 , 9 3 5 , 8 7 7
1 , 4 8 6 , 2 9 5
522 122 6 0 4 1 3 2 3 2 2
4 1
1 , 7 4 3
1 - 3 7
PERCENT 9 9 . 8 %-
0 . 2 %-1 0 0 . 0 %-
7 3 . 8 %-
2 6 . 2 %-
0 . 0 %" 0 . 5%-0 . 6 %" 0 . 5% 0 . 0 %" 6 . 2 %" 6 . 9%-
14 . 8 %"
11 . 4 %-

1 - 3 8 ROOM OCCUPANCY AND PER ROOM PER DAY ANALYSIS
Fiscal Year 2 0 13 Carson Val l ey Area With Gaming Revenue of $ 1 , 0 0 0 , 0 0 0 and over
Amounts Represent 15 Locations .
MONTH JULY . .. .. . . . . . .. ..
AUGUST . . . . . . . . SEPTEMBER .. . .. . . OCTOBER . .. . . . .. . NOVEMBER . . . .. . . DECEMBER . . . . . . JANUARY . . . . . . . FEBRUARY . . . . . . MARCH . . . .. . . . . . APRIL . . . . . . . . . MAY . . . . . . . .. .. . . JUNE . . . . .. . . . . .
TOTAL . .. . . . . . . .
Average Pit Revenue Per Room Per Day
Average S lot Revenue Per Room Per Day
Average Food Sales Per Room Per Day
RATE OF ROOM OCCUPANCY
AVAILABLE ROOMS ROOMS OCCUPIED
2 1 , 3 2 6 15 , 2 5 7 2 1 , 1 0 6 14 , 2 7 0 2 0 , 54 1 14 , 0 1 0 2 0 , 8 6 6 1 0 , 2 4 9 2 0 , 0 8 5 8 , 0 2 2 2 0 , 7 8 8 7 , 2 8 8 2 0 , 4 1 3 6 , 5 7 6 1 8 , 1 4 9 7 , 7 6 2 2 0 , 04 0 8 , 5 3 5 2 0 , 0 1 5 1 0 , 8 2 2 2 1 , 2 4 7 12 , 8 1 1 2 0 , 5 5 6 14 , 4 6 9
2 4 5 , 1 3 2 1 3 0 ; 0 7 1
PER ROOM PER DAY STATISTICS
4 8 . 94
6 7 6 . 6 8
1 6 7 . 84
Average Beverage Sales Per Room Per Day
Average Rooms Department Payroll Per Room Per Day
Average Room Rate Per Day
% OF OCCUPANCY
( COMPUTED) 7 1 . 5 4 % 6 7 . 6 1 % 6 8 . 2 1% 4 9 . 12 % 3 9 . 94 % 3 5 . 0 6 % 3 2 . 2 1% 4 2 . 7 7 % 4 2 . 5 9 % 54 . 0 7 % 6 0 . 3 0 % 7 0 . 3 9 %
5 3 . 0 6 %
74 . 2 9
2 1 . 2 5
6 3 . 3 5

PER SQUARE FOOT ANALYSIS AND RATIOS 1 - 3 9 Fiscal Year 2 0 13 Carson Valley Area With Gaming Revenue of $ 1 , 0 0 0 , 0 0 0 and over
Amounts Represent 15 Locations .
GAMING REVENUE PER SQUARE FOOT OF FLOOR SPACE
NO . OF CASINOS AVERAGE AREA GAMING REVENUE AREA OPERATING IN SQUARE FEET PER SQUARE FOOT
Pit ( Includes Bingo and Keno ) 6 1 , 83 0 Coin Operated Devices 1 5 12 , 14 6 Poker and Pan 5 5 4 6 Race and Sports 3 5 0 1
TOTAL CASINO 15 1 3 , 1 6 0
RATIOS
TOTAL CURRENT ASSETS TO TOTAL CURRENT LIABILITIES . . . . . . . . .
TOTAL CAPITAL TO TOTAL LIABILITIES . . . . . . . . . . . . . . . . . . . . . . . .
TOTAL CAPITAL TO TOTAL CURRENT LIABILITIES . . . . . . . . . . . . . . . .
TOTAL CURRENT LIABILITIES TO TOTAL LIABILITIES . . . . . . . . . . . .
TOTAL COMPLIMENTARY EXPENSE TO GAMING REVENUE . . . . . . . . . . . . .
MUSIC AND ENTERTAINMENT EXPENSES TO GAMING REVENUE . . . . . . . .
TOTAL REVENUE TO AVERAGE TOTAL ASSETS . . . . . . . . . . . . . . . . . . . . .
TOTAL REVENUE LESS COMP SALES TO AVERAGE TOTAL ASSETS . . . . .
RETURN ON INVESTED CAPITAL* . . . . . . . . . . . . . . . . . . . . . . . . . . . . . . .
RETURN ON AVERAGE ASSETS* . . . . . . . . . . . . . . . . . . . . . . . . . . . . . . . . .
* - FORMULAS
Return on Invested Capital is equal to the total o f net income (before federal income taxes and extraordinary items ) and interest
expense divided by the total of average total assets less average current liabi lities .
PERCENT 1 8 1 . 9%-
3 2 . 6 %-
1 7 0 . 5 %-
19 . 1%-
14 . 7 %-
0 . 4 %-
145 . 4%-
1 3 1 . 9%-
13 . 0 %
1 0 . 2 %
Return on Average Assets is equal to the total of net income (before federal income taxes and extraordinary items ) and interest expense divided by the average total asset s .
3 5 5 4 8 3 2 1 1 5 6 2
4 8 5

1 - 4 0
THIS PAGE LEFT INTENTIONALLY BLANK

Fiscal Year 2 0 13 Washoe County
COMBINED BALANCE SHEET
With Gaming Revenue of $ 1 1 0 0 0 1 0 0 0 and over
Amounts Represent 3 2 Locations .
ASSETS CURRENT ASSETS
Cash . . . . . . . . . . . . . . . . . . . . . . . . . . . . . . . . . . . . . . . . . . . . . . . . . . . .
Receivables TOTAL ALLOWANCE Casino 1 3 1 62 0 1 3 76 6 1 14 3 1 174 Trade 1 0 4 1 8 3 9 1 6 2 4 1 1 3 4 0 1 6 5 7 Sundry 6 1 4 6 5 1 3 2 5 0 Notes 1 1 1 11 1 4 3 3 0
Prepaid Expenses . . . . . . . . . . . . . . . . . . . . . . . . . . . . . . . . . . . . . . . . Other Current Assets . . . . . . . . . . . . . . . . . . . . . . . . . . . . . . . . . . . .
TOTAL CURRENT ASSETS . . . . . . . . . . . . . . . . . . . . . . . . . . . . . . . . . . . . . .
FIXED ASSETS COST DEPRECIATION Land 1 8 4 1 7 1 0 1 4 90 . . . . . . . . . . .
Land Improvements 1 1 1 53 2 1 2 3 7 6 1 2 54 1 1 7 0 Buildings & Improvements 1 1 4 8 9 1 93 2 1 3 94 5 85 1 94 8 1 9 6 0 Furniture & Equipment 8 64 1 92 0 1 44 5 6 96 1 03 4 1 6 8 3 Lease Improvements 2 5 1 6 7 6 1 4 2 6 15 1 22 1 1 134 Construction in Progress 1 9 1 0 6 5 1 2 7 7 . . . . . . . . . . .
TOTAL FIXED ASSETS . . . . . . . . . . . . . . . . . . . . . . . . . . . . . . . . . . . . . . . .
OTHER ASSETS
TOTAL ASSETS
LIABILITIES AND CAPITAL CURRENT LIABILITIES
Accounts Payable - Trade . . . . . . . . . . . . . . . . . . . . . . . . . . . . . . . .
Accounts Payable - Other . . . . . . . . . . . . . . . . . . . . . . . . . . . . . . . .
Current Portion of Long-Term Debt . . . . . . . . . . . . . . . . . . . . . . . Accrued Expenses . . . . . . . . . . . . . . . . . . . . . . . . . . . . . . . . . . . . . . . .
Other Current Liabilities . . . . . . . . . . . . . . . . . . . . . . . . . . . . . . . TOTAL CURRENT LIABILITIES . . . . . . . . . . . . . . . . . . . . . . . . . . . . . . . . .
LONG-TERM DEBT Mortgages Debentures & Bonds Notes Contracts Other
TOTAL LONG- TERM DEBT OTHER LIABILITIES TOTAL LIABILITIES
CAPITAL
TOTAL OWING CURRENT PORTION 92 1 1 8 4 1 60 3 3 5 1 12 2 1 3 92
1 9 3 1 72 5 1 4 2 7 0 1 7 0 1 7 9 9 1 0 0 5 13 1 7 7 4 1 515
1 1 7 9 7 1 2 8 5 1 1 3 2 1 1 3 2 8 5 5 1 1 17 3 1 1 0 8 44 8 1 3 3 1
1 1 0 0 9 1 6 7 9 1 42 8 5 0 1 6 6 6 1 5 6 6
Owners Capital Accounts . . . . . . . . . . . . . . . . . . . . . . . . . . . . . . . . .
Capital Stock & Other Capital . . . . . . . . . . . . . . . . . . . . . . . . . . .
Retained Earnings . . . . . . . . . . . . . . . . . . . . . . . . . . . . . . . . . . . . . . .
TOTAL CAPITAL . . . . . . . . . . . . . . . . . . . . . . . . . . . . . . . . . . . . . . . . . . . . .
TOTAL LIABILITIES AND CAPITAL . . . . . . . . . . . . . . . . . . . . . . . . . . . . . .
Average Assets 5 6 1 8 1 1 1 4 7 2
Upper Quartile 2 8 1 8 8 7 1 4 1 1
Median 13 1 8 14 1 63 1
1 - 4 1
DOLLARS PERCENT 13 7 1 8 8 7 1 2 8 4 7 . 6 %
7 1 4 7 7 1 2 0 2 0 . 4 % 1 0 3 1 4 9 8 1 9 6 7 5 . 7 %
6 1 4 65 1 3 2 5 0 . 4 % 1 1 11 1 1 4 3 3 0 . 1%
2 7 1 97 7 1 7 3 4 1 . 5% 3 5 1 74 7 1 3 3 2 2 . 0 %
3 2 0 1 165 1 2 7 7 17 . 6 %
184 1 7 10 1 4 9 0 1 0 . 2 % 5 1 2 7 8 1 0 6 7 0 . 3 %
9 0 3 1 98 3 1 4 3 4 4 9 . 7 % 168 1 8 8 5 1 762 9 . 3 %
1 0 1 4 5 5 1 2 9 2 0 . 6% 1 9 1 0 65 1 2 7 7 1 . 0 %
1 1 2 92 1 3 7 8 1 3 2 2 7 1 . 1%
2 0 5 1 4 2 3 1 4 94 11 . 3 %
1 1 8 17 ! 96 7 1 0 9 3 1 0 0 . 0 %
2 9 1 0 5 0 1 0 0 5 1 . 6% - 8 1 1 4 93 1 3 5 2 - 4 . 5%
5 0 1 6 6 6 1 5 6 6 2 . 8 % 6 0 1 0 9 3 1 3 2 5 3 . 3 % 3 3 1 8 9 7 1 6 1 8 1 . 9% 92 1 2 14 1 162 5 . 1%
5 7 1 0 6 2 1 2 11 3 . 1% 193 1 72 5 1 4 2 7 1 0 . 7% 1 5 7 1 024 1 4 90 8 . 6%
4 7 5 1 9 5 7 0 . 0% 5 5 0 1 72 4 1 7 7 7 3 0 . 3 % 959 1 0 12 1 8 6 2 52 . 8%
2 4 1 3 18 1 2 8 1 1 . 3 % 1 ! 0 7 5 ! 5 4 5 1 3 0 5 5 9 . 2 %
5 14 1 6 0 0 1 5 7 5 2 8 . 3 % 1 1 1 98 7 1 5 2 5 0 . 7%
2 15 1 8 3 3 1 6 8 8 11 . 9% 742 1 42 1 1 7 8 8 4 0 . 8 %
1 1 8 1 7 1 9 6 7 1 0 9 3 1 0 0 . 0 %
Lower Quartile 3 1 4 7 8 1 0 6 8

1 - 4 2
Fiscal Year 2 0 1 3 Washoe County
COMBINED INCOME STATEMENT - SUMMARY
With Gaming Revenue of $ 1 , 0 0 0 , 0 0 0 and over
Amounts Represent 3 2 Locat ions .
REVENUE DOLLARS PERCENT Gaming . . . . . . . . . . . . . . . . . . . . . . . . . . . . . . . . . . . . . . . . . . . . . . . . . . 7 2 7 , 654 , 114 Rooms . . . . . . . . . . . . . . . . . . . . . . . . . . . . . . . . . . . . . . . . . . . . . . . . . . . 2 3 2 , 04 0 , 0 7 7 Food . . . . . . . . . . . . . . . . . . . . . . . . . . . . . . . . . . . . . . . . . . . . . . . . . . . . 2 2 5 , 2 1 6 , 8 3 4 Beverage . . . . . . . . . . . . . . . . . . . . . . . . . . . . . . . . . . . . . . . . . . . . . . . . 9 7 , 3 2 7 , 0 1 0 Other . . . . . . . . . . . . . . . . . . . . . . . . . . . . . . . . . . . . . . . . . . . . . . . . . . . 1 0 4 , 5 3 2 , 2 72
1 , 3 8 6 , 7 7 0 , 3 0 7 TOTAL REVENUE . . . . . . . . . . . . . . . . . . . . . . . . . . . . . . . . . . . . . . . . . . · · ·--
�������
COST OF SALES 1 6 5 , 74 8 , 2 6 1
GROSS MARGIN 1 , 2 2 1 , 0 2 2 , 0 4 6
DEPARTMENTAL EXPENSES . . . . . . . . . . . . . . . . . . . . . . . . . . . . . . . . . . . . . 7 0 7 , 1 8 3 , 4 7 5
DEPARTMENTAL INCOME ( LOSS) 5 13 , 83 8 , 5 7 1 . . . . . . . . . . • • . . • . . . . . . . . . . . . . . . . . ---�::::..L..:::.:::.:::..L.:::....:... -=.
GENERAL AND ADMINISTRATIVE EXPENSES Advertising and Promotion . . . . . . . . . . . . . . . . . . . . . . . . . . . . . . . 4 0 , 4 3 2 , 3 0 8 Bad Debt Expense . . . . . . . . . . . . . . . . . . . . . . . . . . . . . . . . . . . . . . . . 9 8 , 0 0 9 Compl imentary Expense ( not reported i n departments ) . . . . . . 2 7 , 0 6 0 , 7 9 5 Depreciation - Buildings . . . . . . . . . . . . . . . . . . . . . . . . . . . . . . . . 4 2 , 6 3 8 , 7 9 6 Depreciation and Amorti zation - Other . . . . . . . . . . . . . . . . . . . 5 7 , 9 0 6 , 7 7 9 Energy Expense ( electricity , gas , etc . ) . . . . . . . . . . . . . . . . . 3 6 , 1 6 7 , 2 4 9 Equipment Rental o r Lease . . . . . . . . . . . . . . . . . . . . . . . . . . . . . . . 7 , 4 2 7 , 4 2 7 Interest Expense . . . . . . . . . . . . . . . . . . . . . . . . . . . . . . . . . . . . . . . . 6 3 , 14 0 , 1 3 9 Music and Entertainment . . . . . . . . . . . . . . . . . . . . . . . . . . . . . . . . . 7 , 9 1 9 , 8 7 7 Payrol l Taxes . . . . . . . . . . . . . . . . . . . . . . . . . . . . . . . . . . . . . . . . . . . 8 , 7 8 8 , 6 12 Payrol l - Employee Benefits . . . . . . . . . . . . . . . . . . . . . . . . . . . . . 14 , 14 3 , 4 6 4 Payroll - Officers . . . . . . . . . . . . . . . . . . . . . . . . . . . . . . . . . . . . . . 3 , 2 2 5 , 6 5 1 Payroll - Other Employees . . . . . . . . . . . . . . . . . . . . . . . . . . . . . . . 8 9 , 2 0 5 , 8 4 5 Rent of Premises . . . . . . . . . . . . . . . . . . . . . . . . . . . . . . . . . . . . . . . . 9 , 64 5 , 3 4 3 Taxes - Real Estate . . . . . . . . . . . . . . . . . . . . . . . . . . . . . . . . . . . . . 11 , 8 3 1 , 545 Taxes and Licenses - Other . . . . . . . . . . . . . . . . . . . . . . . . . . . . . . 3 , 2 8 0 , 9 8 7 Utilities ( Other than Energy Expense) . . . . . . . . . . . . . . . . . . . 1 0 , 515 , 0 2 9 Other General and Administrative Expenses . . . . . . . . . . . . . . . 7 9 , 6 9 1 , 2 96
5 1 3 , 1 1 9 , 151 TOTAL GENERAL AND ADMIN ISTRATIVE EXPENSES . . . · · · · · · · · · · · · · ·
---
�::::..L�::::..L�-=.
NET INCOME ( LOSS ) BEFORE FEDERAL INCOME TAXES AND EXTRAORDINARY ITEMS . . . . . . . . . . . . . . . . . . . . . . . . . . . . . . . . . . . .
Average Revenue 4 3 , 3 3 6 , 5 72
Upper Quartile 5 9 , 0 7 6 , 2 2 3
Median 1 9 , 7 2 7 , 954
7 19 , 4 2 0
Lower Quart ile 7 , 55 6 , 7 0 8
5 2 . 5 %" 16 . 7 %" 16 . 2%"
7 . 0 %" 7 . 5 %"
1 0 0 . 0 %"
12 . 0 %"
8 8 . 0 %"
5 1 . 0 %"
3 7 . 1%"
2 . 9%" 0 . 0 %" 2 . 0 %" 3 . 1%" 4 . 2 %" 2 . 6%"
0 . 5 %" 4 . 6 %" 0 . 6 %" 0 . 6 %" 1 . 0 % 0 . 2 % 6 . 4 % 0 . 7 % 0 . 9 % 0 . 2 % 0 . 8 % 5 . 7 %
3 7 . 0 %"
0 . 1%"

COMBINED INCOME STATEMENT - DETAIL Fiscal Year 2 0 13 Washoe County With Gaming Revenue of $ 1 , 0 0 0 , 0 0 0 and over
Amounts Represent 32 Locations .
CASINO DEPARTMENT
REVENUE Pit Revenue ( Includes Keno and Bingo) . . . . . . . . . . . . . . . . . . .
Coin Operated Devices . . . . . . . . . . . . . . . . . . . . . . . . . . . . . . . . . . .
Poker and Pan . . . . . . . . . . . . . . . . . . . . . . . . . . . . . . . . . . . . . . . . . . .
Race Book . . . . . . . . . . . . . . . . . . . . . . . . . . . . . . . . . . . . . . . . . . . . . . .
Sports Pool . . . . . . . . . . . . . . . . . . . . . . . . . . . . . . . . . . . . . . . . . . . . .
TOTAL REVENUE . . . . . . . . . . . . . . . . . . . . . . . . . . . . . . . . . . . . . . . . . . . . .
DEPARTMENTAL EXPENSES Bad Debt Expense . . . . . . . . . . . . . . . . . . . . . . . . . . . . . . . . . . . . . . . .
Commissions . . . . . . . . . . . . . . . . . . . . . . . . . . . . . . . . . . . . . . . . . . . . .
Complimentary Expense . . . . . . . . . . . . . . . . . . . . . . . . . . . . . . . . . . .
Gaming Taxes and Licenses . . . . . . . . . . . . . . . . . . . . . . . . . . . . . . .
Preferred Guest Expenses ( no compl imentaries ) . . . . . . . . . . .
Payrol l Taxes . . . . . . . . . . . . . . . . . . . . . . . . . . . . . . . . . . . . . . . . . . .
Payrol l - Employee Benefits . . . . . . . . . . . . . . . . . . . . . . . . . . . . . Payrol l - Officers . . . . . . . . . . . . . . . . . . . . . . . . . . . . . . . . . . . . . .
Payrol l - Other Employees . . . . . . . . . . . . . . . . . . . . . . . . . . . . . . .
Race Wire Fees . . . . . . . . . . . . . . . . . . . . . . . . . . . . . . . . . . . . . . . . . .
Other Departmental Expenses . . . . . . . . . . . . . . . . . . . . . . . . . . . . .
TOTAL DEPARTMENTAL EXPENSES . . . . . . . . . . . . . . . . . . . . . . . . . . . . . . .
DEPARTMENTAL INCOME ( LOSS) . . . . . . . . . . . . . . . . . . . . . . . . . . . . . . . . .
ROOMS DEPARTMENT
REVENUE Room Sales . . . . . . . . . . . . . . . . . . . . . . . . . . . . . . . . . . . . . . . . . . . . . .
Compl imentary Rooms . . . . . . . . . . . . . . . . . . . . . . . . . . . . . . . . . . . . .
TOTAL REVENUE . . . . . . . . . . . . . . . . . . . . . . . . . . . . . . . . . . . . . . . . . . . . .
DEPARTMENTAL EXPENSES Bad Debt Expense . . . . . . . . . . . . . . . . . . . . . . . . . . . . . . . . . . . . . . . .
Complimentary Expense . . . . . . . . . . . . . . . . . . . . . . . . . . . . . . . . . . .
Payrol l - Taxes . . . . . . . . . . . . . . . . . . . . . . . . . . . . . . . . . . . . . . . . .
Payrol l - Employee Benefits . . . . . . . . . . . . . . . . . . . . . . . . . . . . .
Payrol l - Officers . . . . . . . . . . . . . . . . . . . . . . . . . . . . . . . . . . . . . .
Payrol l - Other Employees . . . . . . . . . . . . . . . . . . . . . . . . . . . . . . .
Other Departmental Expenses . . . . . . . . . . . . . . . . . . . . . . . . . . . . .
TOTAL DEPARTMENTAL EXPENSES . . . . . . . . . . . . . . . . . . . . . . . . . . . . . . .
DEPARTMENTAL INCOME ( LOSS ) . . . . . . . . . . . . . . . . . . . . . . . . . . . . . . . . .
1 - 4 3
DOLLARS PERCENT 12 3 , 2 19 , 126 16 . 9%' 5 85 , 8 8 5 , 5 0 7 8 0 . 5 %'
8 , 4 9 3 , 6 8 5 1 . 2 %' 3 , 3 8 5 , 2 2 7 0 . 5% 6 , 6 7 0 , 5 6 9 0 . 9 %'
72 7 , 654 , 114 1 0 0 . 0 %
4 1 0 , 8 15 0 . 1% 5 , 4 1 5 , 85 0 0 . 7%
14 9 , 2 3 2 , 4 1 0 2 0 . 5 % 5 9 , 24 0 , 3 10 8 . 1%
842 1 7 14 0 . 1% 12 , 2 16 , 2 3 0 1 . 7 %' 13 , 3 55 , 0 5 4 1 . 8 %
525 , 22 9 0 . 1% 8 7 , 34 7 , 8 0 0 12 . 0 %
2 , 2 9 5 , 664 0 . 3 %' 6 2 , 959 , 6 9 8 8 . 7 %'
3 9 3 , 84 1 , 774 54 . 1%
3 3 3 , 8 12 , 34 0 4 5 . 9%
DOLLARS PERCENT 1 7 0 , 64 8 , 2 7 7 7 3 . 5%
6 1 , 3 91 , 8 0 0 2 6 . 5% 2 3 2 , 04 0 , 0 7 7 1 0 0 . 0 %
4 8 3 , 8 7 5 0 . 2 % 1 0 , 94 1 , 4 7 1 4 . 7 %
5 , 7 5 7 , 5 9 7 2 . 4 % 7 , 6 7 8 , 3 78 3 . 3 %'
0 0 . 0 %' 5 1 , 4 0 1 , 3 8 9 22 . 2 % 3 2 , 7 7 8 , 3 3 0 14 . 1%
1 0 9 , 04 1 , 0 4 0 4 7 . 0 %'
122 , 9 9 9 , 0 3 7 5 3 . 0 %

1 - 4 4 COMBINED INCOME STATEMENT - DETAIL (CONTINUED)
Fiscal Year 2 0 13 Washoe County With Gaming Revenue of $ 1,0 0 0,0 0 0 and over
Amounts Represent 32 Locations .
FOOD DEPARTMENT REVENUE
Food Sales Comp limentary Food Sales . . . . . . . . . . . . . . . . . . . . . . . . . . . . . . . .
TOTAL REVENUE . . . . . . . . . . . . . . . . . . . . . . . . . . . . . . . . . . . . . . . . . . . . .
COST OF SALES
GROSS MARGIN
DEPARTMENTAL EXPENSES Bad Debt Expense . . . . . . . . . . . . . . . . . . . . . . . . . . . . . . . . . . . . . . . .
Comp limentary Expense . . . . . . . . . . . . . . . . . . . . . . . . . . . . . . . . . . .
Payroll - Taxes . . . . . . . . . . . . . . . . . . . . . . . . . . . . . . . . . . . . . . . . .
Payrol l - Employee Benefits . . . . . . . . . . . . . . . . . . . . . . . . . . . . . Payrol l - Officers . . . . . . . . . . . . . . . . . . . . . . . . . . . . . . . . . . . . . .
Payrol l - Other Employees . . . . . . . . . . . . . . . . . . . . . . . . . . . . . . .
Other Departmental Expenses . . . . . . . . . . . . . . . . . . . . . . . . . . . . . TOTAL DEPARTMENTAL EXPENSES . . . . . . . . . . . . . . . . . . . . . . . . . . . . . . .
DEPARTMENTAL INCOME (LOS S ) . . . . . . . . . . . . . . . . . . . . . . . . . . . . . . . . .
BEVERAGE DEPARTMENT REVENUE
Beverage Sales . . . . . . . . . . . . . . . . . . . . . . . . . . . . . . . . . . . . . . . . . .
Complimentary Beverage Sales . . . . . . . . . . . . . . . . . . . . . . . . . . . .
TOTAL REVENUE . . . . . . . . . . . . . . . . . . . . . . . . . . . . . . . . . . . . . . . . . . . . .
COST OF SALES
GROSS MARGIN . . . . . . . . . . . . . . . . . . . . . . . . . . . . . . . . . . . . . . . . . . . . . .
DEPARTMENTAL EXPENSES Bad Debt Expense . . . . . . . . . . . . . . . . . . . . . . . . . . . . . . . . . . . . . . . .
Compl imentary Expense . . . . . . . . . . . . . . . . . . . . . . . . . . . . . . . . . . .
Payrol l - Taxes . . . . . . . . . . . . . . . . . . . . . . . . . . . . . . . . . . . . . . . . .
Payrol l - Employee Benefits . . . . . . . . . . . . . . . . . . . . . . . . . . . . .
Payroll - Officers . . . . . . . . . . . . . . . . . . . . . . . . . . . . . . . . . . . . . .
Payroll - Other Employees . . . . . . . . . . . . . . . . . . . . . . . . . . . . . . .
Other Departmental Expenses . . . . . . . . . . . . . . . . . . . . . . . . . . . . . TOTAL DEPARTMENTAL EXPENSES . . . . • . . . . . . . . . . . . . . . . . . . . . . . . . .
DEPARTMENTAL INCOME (LOSS)
DOLLARS 162,3 3 1, 6 9 9
62,8 85,135 2 2 5,2 16, 8 3 4
94, 0 1 1,4 92
13 1,2 0 5,3 4 2
4,074 2,72 8, 1 0 3
1 0,998,844 1 1,4 82,4 6 1
0 8 8,44 2 , 7 7 9 14,5 0 7, 9 0 4
1 2 8,164,165
3,041,177
DOLLARS 3 8,842,2 3 9 5 8,4 84, 7 7 1 9 7,3 2 7, 0 1 0
2 8,2 3 7, 9 0 3
6 9, 0 8 9, 1 0 7
4 3 1 1,2 98,7 0 0 2,685,5 96 3,194,2 4 7
0 1 7,6 3 6, 8 7 6
5,2 18,3 2 6 3 0,034,176
3 9,054,9 3 1
PERCENT 72 . 1% 2 7 . 9 %
1 0 0 . 0 %
4 1 . 7 %
5 8 . 3 %
0 . 0 % 1 . 2 % 4 . 9 % 5 . 1 % 0 . 0 %
3 9 . 3 % 6 . 4 %
5 6 . 9 %
1 . 4 %
PERCENT 3 9 . 9 % 6 0 . 1%
1 0 0 . 0 %
2 9 . 0 %
7 1 . 0 %
0 . 0 % 1 . 3 % 2 . 8 % 3 . 3 % 0 . 0 %
18 . 1 % 5 . 4 %
3 0 . 9%
4 0 . 1%

COMBINED INCOME STATEMENT - DETAIL ( CONTINUED)
Fiscal Year 2 0 13 Washoe County With Gaming Revenue of $ 1 , 0 0 0 , 0 0 0 and over
Amounts Represent 3 2 Locations .
OTHER INCOME REVENUE
Other Operating and Non - operating Income . . . . . . . . . . . . . . . .
Other Compl imentary Items . . . . . . . . . . . . . . . . . . . . . . . . . . . . . . .
TOTAL REVENUE . . . . . . . . . . . . . . . . . . . . . . . . . . . . . . . . . . . . . . . . . . . . .
COST OF SALES . . . . . . . . . . . . . . . . . . . . . . . . . . . . . . . . . . . . . . . . . . . . .
GROSS MARGIN . . . . . . . . . . . . . . . . . . . . . . . . . . . . . . . . . . . . . . . . . . . . . .
DEPARTMENTAL EXPENSES Bad Debt Expense . . . . . . . . . . . . . . . . . . . . . . . . . . . . . . . . . . . . . . . .
Complimentary Expense . . . . . . . . . . . . . . . . . . . . . . . . . . . . . . . . . . .
Payrol l - Taxes . . . . . . . . . . . . . . . . . . . . . . . . . . . . . . . . . . . . . . . . . Payroll - Employee Benefits . . . . . . . . . . . . . . . . . . . . . . . . . . . . . Payrol l - Officers . . . . . . . . . . . . . . . . . . . . . . . . . . . . . . . . . . . . . .
Payrol l - Other Employees . . . . . . . . . . . . . . . . . . . . . . . . . . . . . . . Other Departmental Expenses . . . . . . . . . . . . . . . . . . . . . . . . . . . . .
TOTAL DEPARTMENTAL EXPENSES . . . . . . . . . . . . . . . . . . . . . . . . . . . . . . .
DEPARTMENTAL INCOME ( LOS S ) . . . . . . . . . . . . . . . . . . . . . . . . . . . . . . . . .
AVERAGE NUMBER OF EMPLOYEES FOR THE YEAR
CASINO DEPARTMENT ROOMS DEPARTMENT . . . . . . . . . . . . . . . . . . . . . .
FOOD DEPARTMENT . . . . . . . . . . . . . . . . . . . . . . .
BEVERAGE DEPARTMENT . . . . . . . . . . . . . . . . . . .
G & A DEPARTMENT . . . . . . . . . . . . . . . . . . . . . OTHER DEPARTMENTS . . . . . . . . . . . . . . . . . . . . .
TOTAL
DOLLARS 9 1 , 4 8 2 , 8 12 1 3 , 0 4 9 , 4 6 0
1 04 , 5 3 2 , 2 7 2
4 3 , 4 9 8 , 8 6 6
6 1 , 0 3 3 , 4 0 6
3 2 , 2 2 1 2 , 3 9 1 , 152 2 , 62 3 , 92 9 2 , 512 , 6 9 5
0 2 1 , 995 , 95 7 16 , 54 6 , 3 6 6 4 6 , 10 2 , 3 2 0
14 , 93 1 , 0 8 6
3 , 7 8 1 2 , 53 3 4 , 52 3 1 , 1 9 7 2 , 6 11
7 8 2
15 , 42 7
1 - 4 5
PERCENT 8 7.5% 12 . 5%
1 0 0 . 0 %
4 1 . 6 %
5 8 . 4 %
0 . 0 % 2 . 3 % 2 . 5% 2 . 4 % 0 . 0 %
2 1 . 0 % 15 . 8 % 44 . 1%
14 . 3 %

1 - 4 6 ROOM OCCUPANCY AND PER ROOM PER DAY ANALYSIS
Fiscal Year 2 0 1 3 Washoe County With Gaming Revenue of $ 1 , 0 0 0 , 0 0 0 and over
Amounts Represent 32 Locations .
MONTH JULY . . . . . . . . . .
AUGUST . . . . . . . .
SEPTEMBER . . . . .
OCTOBER . . . . . . . NOVEMBER . . . . . .
DECEMBER . . . . . . JANUARY . . . . . . .
FEBRUARY . . . . . . MARCH . . . . . . . . .
APRIL . . . . . . . . .
MAY . . . . . . . . . . .
JUNE . . . . . . . . . .
TOTAL . . . . . . . . .
Average Pit Revenue Per Room Per Day
Average Slot Revenue Per Room Per Day
Average Food Sales Per Room Per Day
RATE OF ROOM OCCUPANCY
AVAILABLE ROOMS ROOMS OCCUPIED 3 96 , 9 8 9 2 9 7 , 6 7 9 3 95 , 74 3 3 0 5 , 6 3 0 3 96 , 9 0 8 2 9 9 , 7 6 3 3 92 , 6 8 8 2 5 1 , 2 4 0 3 7 8 , 8 3 5 1 98 , 0 0 6 4 0 3 , 9 3 9 2 2 4 , 84 8 3 9 3 , 2 2 5 2 1 9 , 7 6 5 3 6 1 , 54 3 2 1 7 , 3 2 7 4 0 6 , 8 3 7 2 6 1 , 4 9 1 3 8 2 , 5 4 1 2 5 3 , 7 5 3 3 93 , 7 2 0 2 8 0 , 2 5 4 3 9 6 , 0 2 4 3 14 , 3 9 0
4 , 6 9 8 , 9 9 2 3 , 124 , 1 4 6
PER ROOM PER DAY STATISTICS
3 9 . 44
1 8 7 . 5 3
72 . 0 9
Average Beverage Sales Per Room Per Day
Average Rooms Department Payrol l Per Room Per Day
Average Room Rate Per Day
% OF OCCUPANCY
( COMPUTED) 74 . 9 8 % 7 7 . 2 3 % 7 5 . 52 % 6 3 . 9 8 % 5 2 . 2 7 % 5 5 . 6 6 % 5 5 . 8 9 % 6 0 . 11% 64 . 2 7 % 6 6 . 3 3 % 7 1 . 1 8 % 7 9 . 3 9%
6 6 . 4 9%
3 1 . 15
2 0 . 75
74 . 2 7

PER SQUARE FOOT ANALYSIS AND RATIOS 1 - 4 7 Fiscal Year 2 0 1 3 Washoe County With Gaming Revenue of $ 1 , 0 0 0 , 0 0 0 and over
Amounts Represent 3 2 Locations .
GAMING REVENUE PER SQUARE FOOT OF FLOOR SPACE
NO . OF CASINOS AVERAGE AREA GAMING REVENUE AREA OPERATING IN SQUARE FEET PER SQUARE FOOT
Pit ( Includes Bingo and Coin Operated Devices Poker and Pan Race and Sports
TOTAL CASINO
Keno)
RATIOS
2 1 6 , 4 4 8 3 0 24 , 119 14 1 , 2 7 5
9 3 , 2 9 0
3 2 2 8 , 3 2 6
TOTAL CURRENT ASSETS TO TOTAL CURRENT LIABILITIES . . . . . . . . .
TOTAL CAPITAL TO TOTAL LIABILITIES . . . . . . . . . . . . . . . . . . . . . . . .
TOTAL CAPITAL TO TOTAL CURRENT LIABILITIES . . . . . . . . . . . . . . . .
TOTAL CURRENT LIABILITIES TO TOTAL LIABILITIES . . . . . . . . . . . .
TOTAL COMPLIMENTARY EXPENSE TO GAMING REVENUE . . . . . . . . . . . . .
MUSIC AND ENTERTAINMENT EXPENSES TO GAMING REVENUE . . . . . . . .
TOTAL REVENUE TO AVERAGE TOTAL ASSETS . . . . . . . . . . . . . . . . . . . . .
TOTAL REVENUE LESS COMP SALES TO AVERAGE TOTAL ASSETS . . . . .
RETURN ON INVESTED CAPITAL* . . . . . . . . . . . . . . . . . . . . . . . . . . . . . . .
RETURN ON AVERAGE ASSETS* . . . . . . . . . . . . . . . . . . . . . . . . . . . . . . . . .
* - FORMULAS
Return on Invested Capital is equal to the total of net income (before federal income taxes and extraordinary items ) and interest
expense divided by the total of average total assets less average current liabilities .
PERCENT 3 4 7 . 2 %'
6 9 . 0 %'
8 0 5 . 1%
8 . 6%'
2 6 . 6%'
1 . 1%
7 3 . 9%'
6 3 . 4 %'
3 . 8 %'
3 . 4 %'
Return on Average Assets i s equal t o the total of net income (before federal income taxes and extraordinary items ) and interest expense divided by the average total assets .
9 1 0 8 1 0 4 7 6 3 4 0
8 0 3

1 - 4 8
THIS PAGE LEFT INTENTIONALLY BLANK

COMBINED BALANCE SHEET Fiscal Year 2 0 1 3 Statewide - Balance of Counties With Gaming Revenue of $ 1 , 0 0 0 , 0 0 0 and over
Amounts Represent 4 3 Locations .
ASSETS CURRENT ASSETS
Cash . . . . . . . . . . . . . . . . . . . . . . . . . . . . . . . . . . . . . . . . . . . . . . . . . . . .
Receivables TOTAL ALLOWANCE Casino 1 , 1 6 9 , 7 1 6 4 0 , 167 Trade 7 4 2 , 4 9 0 9 , 0 0 0 Sundry 1 0 6 , 8 0 8 6 , 50 0 Notes 6 , 76 0 , 55 8 1 7 , 0 0 0
Prepaid Expenses . . . . . . . . . . . . . . . . . . . . . . . . . . . . . . . . . . . . . . . .
Other Current Assets . . . . . . . . . . . . . . . . . . . . . . . . . . . . . . . . . . . .
TOTAL CURRENT ASSETS . . . . . . . . . . . . . . . . . . . . . . . . . . . . . . . . . . . . . .
FIXED ASSETS COST DEPRECIATION Land 3 6 , 7 8 2 , 5 9 7 . . . . . . . . . . .
Land Improvements 4 , 2 0 9 , 0 4 7 2 , 0 7 4 , 8 5 6 Buildings & Improvements 9 7 , 14 8 , 9 2 1 4 3 , 984 , 4 14 Furniture & Equipment 1 2 7 , 8 9 9 , 5 9 3 92 , 8 0 9 , 222 Lease Improvements 7 , 1 3 5 , 6 9 7 2 , 8 9 3 , 52 5 Construction i n Progress 2 , 3 8 4 , 4 0 4 . . . . . . . . . . .
TOTAL FIXED ASSETS . . . . . . . . . . . . . . . . . . . . . . . . . . . . . . . . . . . . . . . .
OTHER ASSETS
TOTAL ASSETS
LIABILITIES AND CAPITAL CURRENT LIABILITIES
Accounts Payable - Trade . . . . . . . . . . . . . . . . . . . . . . . . . . . . . . . .
Accounts Payable - Other . . . . . . . . . . . . . . . . . . . . . . . . . . . . . . . .
Current Portion of Long-Term Debt . . . . . . . . . . . . . . . . . . . . . . .
Accrued Expenses . . . . . . . . . . . . . . . . . . . . . . . . . . . . . . . . . . . . . . . .
Other Current Liabil ities . . . . . . . . . . . . . . . . . . . . . . . . . . . . . . .
TOTAL CURRENT LIABILITIES . . . . . . . . . . . . . . . . . . . . . . . . . . . . . . . . .
LONG-:-TERM DEBT Mortgages Debentures & Bonds
TOTAL OWING 2 3 , 0 0 1 , 8 6 5
0
CURRENT PORTION 1 , 3 2 3 , 54 0
0 Notes 1 7 , 6 2 0 , 2 6 0 9 0 0 , 6 9 8 Contracts 3 , 7 7 1 , 9 4 0 1 , 4 1 9 , 5 7 0 Other 3 2 3 , 2 8 5 4 1 , 064
TOTAL LONG- TERM DEBT 4 4 , 7 1 7 , 3 5 0 3 , 6 84 , 8 72 OTHER LIABILITIES . . . . . . . . . . . . . . . . . . . . . . . . . . . . . . . . . . . . . . . . .
TOTAL LIABILITIES
CAPITAL Owners Capital Accounts . . . . . . . . . . . . . . . . . . . . . . . . . . . . . . . . .
Capital Stock & Other Capital . . . . . . . . . . . . . . . . . . . . . . . . . . .
Retained Earnings . . . . . . . . . . . . . . . . . . . . . . . . . . . . . . . . . . . . . . .
TOTAL CAPITAL . . . . . . . . . . . . . . . . . . . . . . . . . . . . . . . . . . . . . . . . . . . . .
TOTAL LIABILITIES AND CAPITAL . . . . . . . . . . . . . . . . . . . . . . . . . . . . . .
Average Assets 5 , 3 17 , 0 8 9
Upper Quartile 6 , 16 7 , 3 2 8
Median 3 , 15 9 , 7 7 6
1 - 4 9
DOLLARS PERCENT 3 9 , 6 72 , 7 6 9
1 , 129 , 54 9 7 3 3 , 4 9 0 1 0 0 , 3 0 8
6 , 74 3 , 5 5 8 4 , 4 74 , 5 9 0
1 7 , 2 3 7 , 8 2 0 7 0 , 0 92 , 0 8 4
3 6 , 7 8 2 , 5 9 7 2 , 134 , 19 1
5 3 , 16 4 , 50 7 3 5 , 0 9 0 , 3 7 1
4 , 24 2 , 1 7 2 2 , 3 8 4 , 4 04
1 3 3 , 7 9 8 , 2 4 2
2 4 , 7 4 4 , 5 1 1
2 2 8 , 6 3 4 , 8 3 7
5 , 0 17 , 6 0 7 1 , 13 6 , 942 3 , 68 4 , 8 7 2 6 , 2 7 1 , 4 1 5 3 , 8 97 , 3 8 7
2 0 , 0 0 8 , 2 2 3
2 1 , 6 7 8 , 3 2 5 0
1 6 , 7 1 9 , 5 6 2 2 , 3 52 , 3 7 0
2 8 2 , 22 1 4 1 , 0 3 2 , 4 7 8 5 3 , 0 5 8 , 1 5 1
114 , 0 9 8 , 8 5 2
4 3 , 9 0 3 , 115 4 , 5 1 9 , 5 5 9
6 6 , 1 1 3 , 3 11 1 14 , 5 3 5 , 9 8 5
2 2 8 , 63 4 , 8 3 7
Lower Quartile 1 , 7 8 5 , 0 5 3
1 7 . 4 %
0 . 5 % 0 . 3 % 0 . 0% 2 . 9%' 2 . 0 % 7 . 5 %'
3 0 . 7 %
16 . 1% 0 . 9%'
2 3 . 3 % 15 . 3 %
1 . 9% 1 . 0 %
5 8 . 5 %
1 0 . 8%
10 0 . 0 %
2 . 2 % 0 . 5%' 1 . 6% 2 . 7%'
1 . 7% 8 . 8 %'
9 . 5% 0 . 0 % 7 . 3 % 1 . 0 % 0 . 1%
17 . 9% 2 3 . 2 % 4 9 . 9%'
19 . 2 % 2 . 0 %
2 8 . 9% 5 0 . 1%
1 0 0 . 0 %
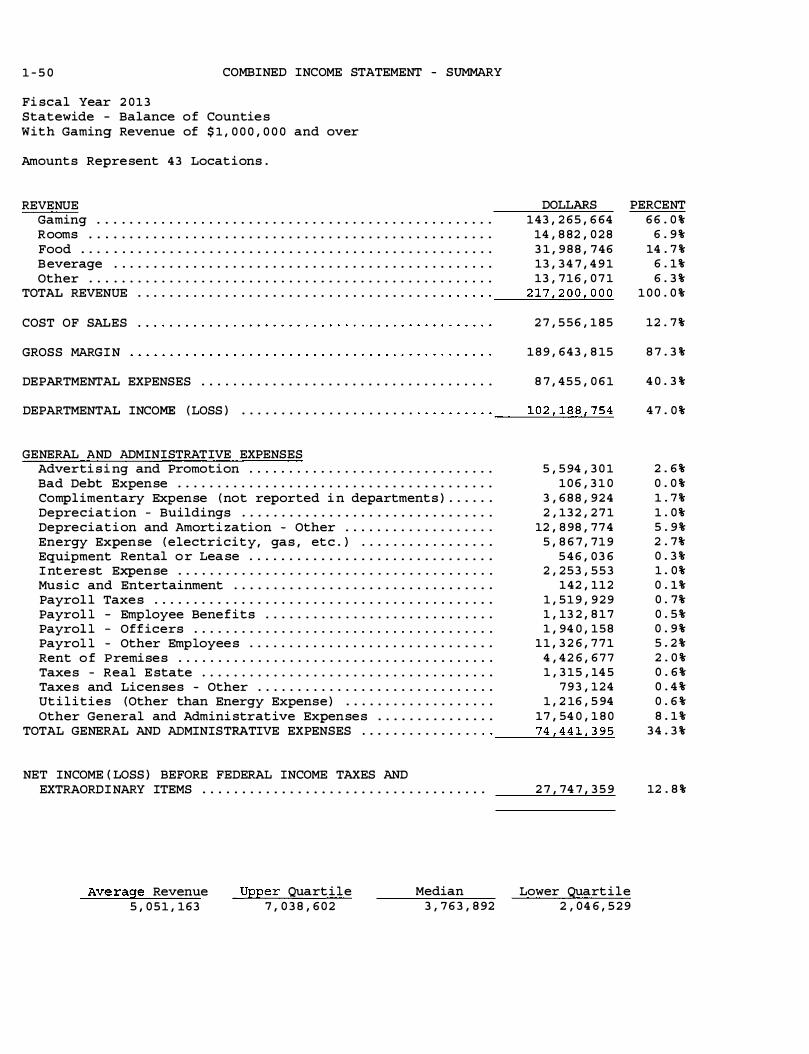
1 - 5 0 COMBINED INCOME STATEMENT - SUMMARY
Fiscal Year 2 0 1 3 Statewide - Balance o f Counties With Gaming Revenue of $ 1 , 0 0 0 , 0 0 0 and over
Amounts Represent 4 3 Locations .
REVENUE DOLLARS PERCENT Gaming . . . . . . . . . . . . . . . . . . . . . . . . . . . . . . . . . . . . . . . . . . . . . . . . . . 143 , 2 6 5 , 6 64 Rooms . . . . . . . . . . . . . . . . . . . . . . . . . . . . . . . . . . . . . . . . . . . . . . . . . . . 14 , 8 82 , 0 2 8 Food . . . . . . . . . . . . . . . . . . . . . . . . . . . . . . . . . . . . . . . . . . . . . . . . . . . . 3 1 , 9 8 8 , 7 4 6 B everage . . . . . . . . . . . . . . . . . . . . . . . . . . . . . . . . . . . . . . . . . . . . . . . . 13 , 3 4 7 , 4 9 1 Other . . . . . . . . . . . . . . . . . . . . . . . . . . . . . . . . . . . . . . . . . . . . . . . . . . . 13 , 7 16 , 0 7 1
2 17 , 2 0 0 , 0 0 0 TOTAL REVENUE . . . . . . . . . . . . . . . . . . . . . . . . . . . . . . . . . . . . . . . · · · · · ·
----������
COST OF SALES 2 7 , 5 5 6 , 1 8 5
GROSS MARGIN 1 8 9 , 64 3 , 8 15
DEPARTMENTAL EXPENSES . . . . . . . . . . . . . . . . . . . . . . . . . . . . . . . . . . . . . 8 7 , 4 5 5 , 0 6 1
102 , 18 8 , 754 DEPARTMENTAL INCOME ( LOSS ) . . . . . . . . . . . . . . . . . . . . . . · · · · · · · · · ·
----
�����
GENERAL AND ADMIN ISTRATIVE EXPENSES Advertisi ng and Promotion . . . . . . . . . . . . . . . . . . . . . . . . . . . . . . . 5 , 5 94 , 3 0 1 Bad Debt Expense . . . . . . . . . . . . . . . . . . . . . . . . . . . . . . . . . . . . . . . . 1 0 6 , 3 1 0 Complimentary Expense ( not reported i n departments ) . . . . . . 3 , 6 8 8 , 92 4 Depreciat ion - Buildings . . . . . . . . . . . . . . . . . . . . . . . . . . . . . . . . 2 , 13 2 , 2 7 1 Depreciation and Amorti zation - Other . . . . . . . . . . . . . . . . . . . 12 , 8 98 , 7 7 4 Energy Expense ( electricity, gas , etc . ) . . . . . . . . . . . . . . . . . 5 , 8 6 7 , 7 1 9 Equipment Rental o r Lease . . . . . . . . . . . . . . . . . . . . . . . . . . . . . . . 5 4 6 , 0 3 6 I nterest Expense . . . . . . . . . . . . . . . . . . . . . . . . . . . . . . . . . . . . . . . . 2 , 2 5 3 , 5 5 3 Music and Entertainment . . . . . . . . . . . . . . . . . . . . . . . . . . . . . . . . . 142 , 112 Payrol l Taxes . . . . . . . . . . . . . . . . . . . . . . . . . . . . . . . . . . . . . . . . . . . 1 , 5 1 9 , 9 2 9 Payrol l - Employee Benefits . . . . . . . . . . . . . . . . . . . . . . . . . . . . . 1 , 13 2 , 8 1 7 Payrol l - Officers . . . . . . . . . . . . . . . . . . . . . . . . . . . . . . . . . . . . . . 1 , 94 0 , 158 Payrol l - Other Employees . . . . . . . . . . . . . . . . . . . . . . . . . . . . . . . 1 1 , 3 2 6 , 7 7 1 Rent o f Premises . . . . . . . . . . . . . . . . . . . . . . . . . . . . . . . . . . . . . . . . 4 , 4 2 6 , 6 7 7 Taxes - Real Estate . . . . . . . . . . . . . . . . . . . . . . . . . . . . . . . . . . . . . 1 , 3 15 , 14 5 Taxes and Licenses - Other . . . . . . . . . . . . . . . . . . . . . . . . . . . . . . 7 9 3 , 124 Ut i l ities (Other than Energy Expense ) . . . . . . . . . . . . . . . . . . . 1 , 2 16 , 5 94 Other General and Administrative Expenses . . . . . . . . . . . . . . . 17 , 54 0 , 1 8 0
74 , 4 4 1 , 3 9 5 TOTAL GENERAL AND ADMINISTRATIVE EXPENSES . . . . . . . . . . . . . . . · ·
----
������
NET INCOME ( LOSS ) BEFORE FEDERAL INCOME TAXES AND EXTRAORDINARY ITEMS . . . . . . . . . . . . . . . . . . . . . . . . . . . . . . . . . . . .
Ave rage Revenue 5 , 0 5 1 , 163
Upper Quartile 7 , 0 3 8 , 6 0 2
Median 3 , 7 6 3 , 8 92
2 7 , 74 7 , 3 5 9
Lower Quartile 2 , 04 6 , 5 2 9
6 6 . 0 % 6 . 9 %
14 . 7 % 6 . 1% 6 . 3 %
1 0 0 . 0 %
12 . 7 %
8 7 . 3 %
4 0 . 3 %
4 7 . 0 %
2 . 6 % 0 . 0 % 1 . 7 % 1 . 0 % 5 . 9 % 2 . 7% 0 . 3 % 1 . 0 % 0 . 1% 0 . 7% 0 . 5 % 0 . 9 % 5 . 2 % 2 . 0 % 0 . 6 % 0 . 4 % 0 . 6 % 8 . 1 %
3 4 . 3 %
12 . 8 %

COMBINED INCOME STATEMENT - DETAIL 1 - 5 1 Fi scal Year 2 0 13 Statewide - Balance of Counties With Gaming Revenue of $ 1 , 0 0 0 , 0 0 0 and over
Amounts Represent 4 3 Locations .
CASINO DEPARTMENT
REVENUE DOLLARS PERCENT Pit Revenue ( Includes Keno and Bingo) . . . . . . . . . . . . . . . . . . . 2 , 2 96 , 8 7 7 1 . 6 % Coin Operated Devices . . . . . . . . . . . . . . . . . . . . . . . . . . . . . . . . . . . 14 0 , 5 82 , 5 0 9 98 . 1% Poker and Pan . . . . . . . . . . . . . . . . . . . . . . . . . . . . . . . . . . . . . . . . . . . 3 8 6 , 2 78 0 . 3 % Race Book . . . . . . . . . . . . . . . . . . . . . . . . . . . . . . . . . . . . . . . . . . . . . . . 0 0 . 0 % Sports Pool . . . . . . . . . . . . . . . . . . . . . . . . . . . . . . . . . . . . . . . . . . . . . 0 0 . 0 %
TOTAL REVENUE . . . . . . . . . . . . . . . . . . . . . . . . . . . . . . . . . . . . . . . . . . . . . 143 , 2 6 5 , 6 6 4 1 0 0 . 0 %
DEPARTMENTAL EXPENSES Bad Debt Expense . . . . . . . . . . . . . . . . . . . . . . . . . . . . . . . . . . . . . . . . - 4 8 , 8 0 9 0 . 0 % Commissions . . . . . . . . . . . . . . . . . . . . . . . . . . . . . . . . . . . . . . . . . . . . . 1 , 5 5 7 , 6 6 7 1 . 1% Complimentary Expense . . . . . . . . . . . . . . . . . . . . . . . . . . . . . . . . . . . 1 0 , 44 4 , 3 15 7 . 3 % Gaming Taxes and Licenses . . . . . . . . . . . . . . . . . . . . . . . . . . . . . . . 1 0 , 5 63 , 2 6 9 7 . 4 % Preferred Guest Expenses ( no complimentaries ) . . . . . . . . . . . 5 2 7 , 8 04 0 . 4 % Payroll Taxes . . . . . . . . . . . . . . . . . . . . . . . . . . . . . . . . . . . . . . . . . . . 1 , 6 2 9 , 1 6 9 1 . 1% Payroll - Employee Benefits . . . . . . . . . . . . . . . . . . . . . . . . . . . . . 7 9 0 , 715 0 . 6 % Payroll - Officers . . . . . . . . . . . . . . . . . . . . . . . . . . . . . . . . . . . . . . 3 2 7 , 0 7 3 0 . 2 % Payroll - Other Employees . . . . . . . . . . . . . . . . . . . . . . . . . . . . . . . 14 , 4 7 9 , 3 5 7 1 0 . 1% Race Wire Fees . . . . . . . . . . . . . . . . . . . . . . . . . . . . . . . . . . . . . . . . . . 0 0 . 0 % Other Departmental Expenses . . . . . . . . . . . . . . . . . . . . . . . . . . . . . 13 , 182 , 712 9 . 2 %
TOTAL DEPARTMENTAL EXPENSES . . . . . . . . . . . . . . . . . . . . . . . . . . . . . . . 5 3 , 4 5 3 , 2 7 2 3 7 . 3 %
DEPARTMENTAL INCOME ( LOSS ) . . . . . . . . . . . . . . . . . . . . . . . . . . . . . . . . . 8 9 , 812 , 3 92 6 2 . 7 %
ROOMS DEPARTMENT
REVENUE DOLLARS PERCENT Room Sales . . . . . . . . . . . . . . . . . . . . . . . . . . . . . . . . . . . . . . . . . . . . . . 14 , 2 10 , 0 94 95 . 5% Complimentary Rooms . . . . . . . . . . . . . . . . . . . . . . . . . . . . . . . . . . . . . 6 7 1 , 934 4 . 5 %
TOTAL REVENUE . . . . . . . . . . . . . . . . . . . . . . . . . . . . . . . . . . . . . . . . . . . . . 14 , 8 8 2 , 0 2 8 1 0 0 . 0 %
DEPARTMENTAL EXPENSES Bad Debt Expense . . . . . . . . . . . . . . . . . . . . . . . . . . . . . . . . . . . . . . . . 0 0 . 0 % Complimentary Expense . . . . . . . . . . . . . . . . . . . . . . . . . . . . . . . . . . . 353 , 942 2 . 4 % Payroll - Taxes . . . . . . . . . . . . . . . . . . . . . . . . . . . . . . . . . . . . . . . . . 4 15 , 5 6 5 2 . 7 % Payroll - Employee Benefits . . . . . . . . . . . . . . . . . . . . . . . . . . . . . 2 0 0 , 8 3 9 1 . 3 % Payroll - Officers . . . . . . . . . . . . . . . . . . . . . . . . . . . . . . . . . . . . . . 0 0 . 0 % Payroll - Other Employees . . . . . . . . . . . . . . . . . . . . . . . . . . . . . . . 3 , 2 63 , 4 7 3 2 1 . 9 % Other Departmental Expenses . . . . . . . . . . . . . . . . . . . . . . . . . . . . . 2 , 69 0 , 3 8 6 18 . 1%
TOTAL DEPARTMENTAL EXPENSES . . . . . . . . . . . . . . . . . . . . . . . . . . . . . . . 6 , 92 4 , 2 0 5 4 6 . 5 %
DEPARTMENTAL INCOME ( LOSS ) . . . . . . . . . . . . . . . . . . . . . . . . . . . . . . . . . 7 , 95 7 , 8 2 3 5 3 . 5%

1 - 5 2 COMBINED INCOME STATEMENT - DETAIL ( CONTINUED )
Fiscal Year 2 0 13 Statewide - Balance of Counties With Gaming Revenue of $ 1 , 0 0 0 , 0 0 0 and over
Amounts Represent 4 3 Locations .
FOOD DEPARTMENT REVENUE DOLLARS PERCENT
Food Sales 2 5 , 6 74 , 4 9 0 8 0 . 3 % Compl imentary Food Sales . . . . . . . . . . . . . . . . . . . . . . . . . . . . . . . . 6 , 3 14 , 2 5 6 1 9 . 7 %
TOTAL REVENUE . . . . . . . . . . . . . . . . . . . . . . . . . . . . . . . . . . . . . . . . . . . . . 3 1 , 9 8 8 , 7 4 6 1 0 0 . 0 %
COST OF SALES 1 6 , 3 3 2 , 2 3 5 5 1 . 1%
GROSS MARGIN 15 , 65 6 , 5 1 1 4 8 . 9 %
DEPARTMENTAL EXPENSES Bad Debt Expense . . . . . . . . . . . . . . . . . . . . . . . . . . . . . . . . . . . . . . . . 0 0 . 0 % Compl imentary Expense . . . . . . . . . . . . . . . . . . . . . . . . . . . . . . . . . . . 3 5 7 , 3 8 9 1 . 1 % Payroll - Taxes . . . . . . . . . . . . . . . . . . . . . . . . . . . . . . . . . . . . . . . . . 1 , 6 7 6 , 185 5 . 2 % Payrol l - Employee Benefits . . . . . . . . . . . . . . . . . . . . . . . . . . . . . 1 , 154 , 5 55 3 . 6 % Payroll - Off icers . . . . . . . . . . . . . . . . . . . . . . . . . . . . . . . . . . . . . . 52 , 4 2 0 0 . 2 % Payroll - Other Employees . . . . . . . . . . . . . . . . . . . . . . . . . . . . . . . 1 3 , 2 0 7 , 8 6 5 4 1 . 3 % Other Departmental Expenses . . . . . . . . . . . . . . . . . . . . . . . . . . . . . 3 , 0 14 , 8 2 1 9 . 4 %
TOTAL DEPARTMENTAL EXPENSES . . . . . . . . . . . . . . . . . . . . . . . . . . . . . . . 1 9 , 4 6 3 , 2 3 5 6 0 . 8 %
DEPARTMENTAL INCOME ( LOSS) . . . . . . . . . . . . . . . . . . . . . . . . . . . . . . . . . - 3 , 8 0 6 , 724 - 11 . 9 %
BEVERAGE DEPARTMENT REVENUE DOLLARS PERCENT
Beverage Sales . . . . . . . . . . . . . . . . . . . . . . . . . . . . . . . . . . . . . . . . . . 4 , 3 7 3 , 6 0 4 32 . 8 % Comp limentary Beverage Sales . . . . . . . . . . . . . . . . . . . . . . . . . . . . 8 , 9 7 3 , 8 8 7 6 7 . 2 %
TOTAL REVENUE . . . . . . . . . . . . . . . . . . . . . . . . . . . . . . . . . . . . . . . . . . . . . 1 3 , 3 4 7 , 4 9 1 1 0 0 . 0 %
COST OF SALES 5 , 3 7 0 , 6 7 1 4 0 . 2 %
GROSS MARGIN . . . . . . . . . . . . . . . . . . . . . . . . . . . . . . . . . . . . . . . . . . . . . . 7 , 9 7 6 , 8 2 0 5 9 . 8 %
DEPARTMENTAL EXPENSES Bad Debt Expense . . . . . . . . . . . . . . . . . . . . . . . . . . . . . . . . . . . . . . . . 0 0 . 0 % Complimentary Expense . . . . . . . . . . . . . . . . . . . . . . . . . . . . . . . . . . . 1 , 3 2 3 , 4 3 0 9 . 9 % Payroll - Taxes . . . . . . . . . . . . . . . . . . . . . . . . . . . . . . . . . . . . . . . . . 3 1 9 , 8 8 2 2 . 4 % Payrol l - Employee Benefits . . . . . . . . . . . . . . . . . . . . . . . . . . . . . 146 , 1 7 2 1 . 1% Payrol l - Officers . . . . . . . . . . . . . . . . . . . . . . . . . . . . . . . . . . . . . . 52 , 4 2 0 0 . 4 % Payrol l - Other Employees . . . . . . . . . . . . . . . . . . . . . . . . . . . . . . . 2 , 5 0 4 , 3 5 2 18 . 8 % Other Departmental Expenses . . . . . . . . . . . . . . . . . . . . . . . . . . . . . 55 5 , 3 3 7 4 . 2 %
TOTAL DEPARTMENTAL EXPENSES . . . . . . . . . . . . . . . . . . . . . . . . . . . . . . . 4 , 9 0 1 , 5 9 3 3 6 . 7 %
DEPARTMENTAL INCOME ( LOSS ) . . . . . . . . . . . . . . . . . . . . . . . . . . . . . . . . . 3 , 0 75 , 2 2 7 2 3 . 0 %

COMBINED INCOME STATEMENT - DETAIL ( CONTINUED)
F iscal Year 2 0 13 Statewide - Balance of Counties With Gaming Revenue of $ 1 , 0 0 0 , 0 0 0 and over
Amounts Represent 4 3 Locations .
OTHER INCOME REVENUE
Other Operating and Non- operating Income . . . . . . . . . . . . . . . .
Other Complimentary Items . . . . . . . . . . . . . . . . . . . . . . . . . . . . . . .
TOTAL REVENUE . . . . . . . . . . . . . . . . . . . . . . . . . . . . . . . . . . . . . . . . . . . . .
COST OF SALES
GROSS MARGIN . . . . . . . . . . . . . . . . . . . . . . . . . . . . . . . . . . . . . . . . . . . . . .
DEPARTMENTAL EXPENSES Bad Debt Expense . . . . . . . . . . . . . . . . . . . . . . . . . . . . . . . . . . . . . . . .
Complimentary Expense . . . . . . . . . . . . . : . . . . . . . . . . . . . . . . . . . . .
Payroll - Taxes . . . . . . . . . . . . . . . . . . . . . . . . . . . . . . . . . . . . . . . . .
Payroll - Employee Benefits . . . . . . . . . . . . . . . . . . . . . . . . . . . . .
Payroll - Officers . . . . . . . . . . . . . . . . . . . . . . . . . . . . . . . . . . . . . .
Payroll - Other Employees . . . . . . . . . . . . . . . . . . . . . . . . . . . . . . .
Other Departmental Expenses . . . . . . . . . . . . . . . . . . . . . . . . . . . . .
TOTAL DEPARTMENTAL EXPENSES . . . . . . . . . . . . . . . . . . . . . . . . . . . . . . .
DEPARTMENTAL INCOME ( LOS S ) . . . . . . . . . . . . . . . . . . . . . . . . . . . . . . . . .
AVERAGE NUMBER OF EMPLOYEES FOR THE YEAR
CASINO DEPARTMENT . . . . . . . . . . . . . . . . . . . . . ROOMS DEPARTMENT . . . . . . . . . . . . . . . . . . . . . .
FOOD DEPARTMENT . . . . . . . . . . . . . . . . . . . . . . .
BEVERAGE DEPARTMENT . . . . . . . . . . . . . . . . . . .
G & A DEPARTMENT . . . . . . . . . . . . . . . . . . . . .
OTHER DEPARTMENTS . . . . . . . . . . . . . . . . . . . . .
TOTAL . . . . . . . . . . . . . . . . . . . . . . . . . . . . . . . . .
DOLLARS 13 , 4 73 , 6 7 2
2 4 2 , 3 99 13 , 7 16 , 0 7 1
5 , 8 5 3 , 2 7 9
7 , 8 6 2 , 792
11 , 8 6 3 2 4 , 3 1 9
14 2 , 16 8 8 4 , 3 9 8 2 6 , 0 0 0
1 , 2 8 2 , 9 6 8 1 , 14 1 , 0 4 0 2 , 7 12 , 7 5 6
5 , 15 0 , 0 3 6
8 0 1 2 0 3 7 9 0 2 13 4 02
95
2 , 5 0 4
1 - 53
PERCENT 98 . 2 %
1 . 8 % 100 . 0 %
4 2 . 7 %
5 7 . 3 %
0 . 1% 0 . 2 % 1 . 0 % 0 . 6 % 0 . 2 % 9 . 4 % 8 . 3 %
19 . 8 %
3 7 . 5 %
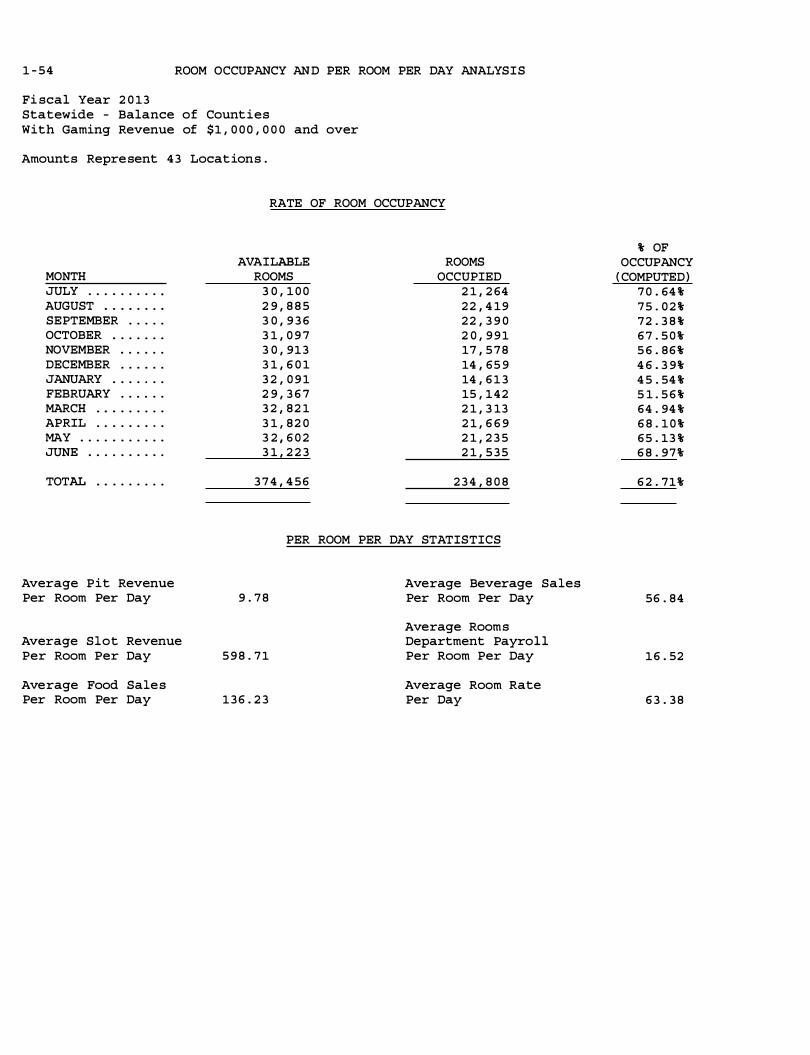
1 - 54 ROOM OCCUPANCY AND PER ROOM PER DAY ANALYSIS
Fiscal Year 2 0 13 Statewide - Balance of Counties With Gaming Revenue of $1 , 0 0 0 , 0 0 0 and over
Amounts Represent 4 3 Locations .
RATE OF ROOM OCCUPANCY
MONTH JULY . . . . . . . . . .
AUGUST . . . . . . . . SEPTEMBER . . . . . OCTOBER . . . . . . . NOVEMBER . . . . . . DECEMBER . . . . . . JANUARY . . . . . . . FEBRUARY . . . . . . MARCH . . . . . . . . .
APRIL . . . . . . . .. . MAY . . . . . . . . . . . JUNE . . . . . . . . . .
TOTAL . . . . . . . . .
Average Pit Revenue Per Room Per Day
Average Slot Revenue Per Room Per Day
Average Food Sales Per Room Per Day
AVAILABLE ROOMS ROOMS OCCUPIED
3 0 , 1 0 0 2 1 , 2 64 2 9 , 8 8 5 2 2 , 4 19 3 0 , 9 3 6 2 2 , 3 9 0 3 1 , 0 9 7 2 0 , 9 9 1 3 0 , 913 17 , 5 7 8 3 1 , 6 0 1 14 , 65 9 3 2 , 0 9 1 14 , 6 1 3 2 9 , 3 6 7 15 , 1 4 2 3 2 , 8 2 1 2 1 , 3 13 3 1 , 8 2 0 2 1 , 6 6 9 3 2 , 6 0 2 2 1 , 2 3 5 3 1 , 2 2 3 2 1 , 5 3 5
3 7 4 , 4 5 6 2 3 4 , 8 0 8
PER ROOM PER DAY STATISTICS
9 . 7 8
5 9 8 . 7 1
1 3 6 . 2 3
Average Beverage Sales Per Room Per Day
Average Rooms Department Payroll Per Room Per Day
Average Room Rate Per Day
% OF OCCUPANCY
( COMPUTED) 7 0 . 64 % 7 5 . 0 2 % 72 . 3 8 % 6 7 . 5 0 % 5 6 . 8 6 % 4 6 . 3 9% 4 5 . 54 % 5 1 . 5 6 % 64 . 94 % 6 8 . 1 0 % 6 5 . 13 % 6 8 . 97%
6 2 . 71%
56 . 84
1 6 . 52
6 3 . 3 8

PER SQUARE FOOT ANALYSIS AND RATIOS 1 - 5 5 Fiscal Year 2 0 13 Statewide - Balance of Counties With Gaming Revenue of $ 1 , 0 0 0 , 0 0 0 and over
Amounts Represent 4 3 Locations .
GAMING REVENUE PER SQUARE FOOT OF FLOOR SPACE
NO . OF CASINOS AVERAGE AREA GAMING REVENUE AREA OPERATING IN SQUARE FEET PER SQUARE
Pit ( Includes Bingo and Keno) 13 1 , 5 1 9 Coin Operated Devices 4 3 6 , 1 7 0 Poker and Pan 8 3 8 3 Race and Sports 0 0
TOTAL CASINO 4 3 6 , 70 1
RATIOS
TOTAL CURRENT ASSETS TO TOTAL CURRENT LIABILITIES . . . . . . . . .
TOTAL CAPITAL TO TOTAL LIABILITIES . . . . . . . . . . . . . . . . . . . . . . . .
TOTAL CAPITAL TO TOTAL CURRENT LIABILITIES . . . . . . . . . . . . . . . .
TOTAL CURRENT LIABILITIES TO TOTAL LIABILITIES . . . . . . . . . . . .
TOTAL COMPLIMENTARY EXPENSE TO GAMING REVENUE . . . . . . . . . . . . .
MUSIC AND ENTERTAINMENT EXPENSES TO GAMING REVENUE . . . . . . . .
TOTAL REVENUE TO AVERAGE TOTAL ASSETS . . . . . . . . . . . . . . . . . . . . .
TOTAL REVENUE LESS COMP SALES TO AVERAGE TOTAL ASSETS . . . . .
RETURN ON INVESTED CAPITAL* . . . . . . . . . . . . . . . . . . . . . . . . . . . . . . .
RETURN ON AVERAGE ASSETS* . . . . . . . . . . . . . . . . . . . . . . . . . . . . . . . . .
* - FORMULAS
Return on Invested Capital i s equal to the total of net income (before federal income taxes and extraordinary items ) and interest expense divided by the total of average total assets less average current liabilitie s .
PERCENT 3 5 0 . 3 %
1 0 0 . 4 %
572 . 4 %
17 . 5 %
11 . 3%'
0 . 1%
92 . 0 %
8 5 . 1%
14 . 6%
12 . 7 %
Return on Average Assets is equal to the total of net income (before federal income taxes and extraordinary items ) and interest expense divided by the average total assets .
FOOT
1 1 6 5 3 0 1 2 5
0
4 97

1 - 5 6
THIS PAGE LEFT INTENTIONALLY BLANK

SECTION 2
DETAIL OF SELECTED GROUPS
INDEX
CLARK COUNTY - LAS VEGAS STRIP AREA
With Gaming Revenue of $1,000.000 and Over
Combined Balance Sheet Combined Income Statement - Summary Combined Income Statement - Detail:
Casino Department Rooms Department Food Department Beverage Department Other Income
Average Number of Employees Rate of Room Occupancy Per Room Per Day Statistics Gaming Revenue per Square Foot Ratios
CLARK COUNTY - LAS VEGAS STRIP AREA With Gaming Revenue of $1,000.000 to $72,000,000
Combined Balance Sheet Combined Income Statement - Summary Combined Income Statement - Detail:
Casino Department Rooms Department Food Department Beverage Department Other Income
Average Number of Employees Rate of Room Occupancy Per Room Per Day Statistics Gaming Revenue per Square Foot Ratios
CLARK COUNTY - LAS VEGAS STRIP AREA With Gaming Revenue of $72,000,000 and Over
Combined Balance Sheet Combined Income Statement - Summary Combined Income Statement - Detail:
Casino Department Rooms Department Food Department Beverage Department Other Income
Average Number of Employees Rate of Room Occupancy Per Room Per Day Statistics Gaming Revenue per Square Foot Ratios
2-1 2-2
2-3 2-3 2-4 2-4 2-5 2-5 2-6 2-6 2-7 2-7
2-9 2-10
2-1 1 2-1 1 2-12 2-12 2-13 2-13 2-14 2-14 2-15 2-15
2-1 7 2-1 8
2-19 2-19 2-20 2-20 2-21 2-21 2-22 2-22 2-23 2-23

SECTION 2 - CONTINUED
DETAIL OF SELECTED GROUPS
INDEX
CLARK COUNTY - DOWNTOWN LAS VEGAS AREA With Gaming Revenue of $1,000,000 and Over
Combined Balance Sheet Combined Income Statement - Summary Combined Income Statement - Detail:
Casino Department
Rooms Department
Food Department
Beverage Department Other Income
Average Number of Employees
Rate of Room Occupancy Per Room Per Day Statistics Gaming Revenue per Square Foot Ratios
CLARK COUNTY - DOWNTOWN LAS VEGAS AREA With Gaming Revenue of $1,000,000 to $12,000,000
Combined Balance Sheet Combined Income Statement - Summary Combined Income Statement - Detail:
Casino Department
Rooms Department Food Department
Beverage Department Other Income
Average Number of Employees
Rate of Room Occupancy Per Room Per Day Statistics Gaming Revenue per Square Foot
Ratios
CLARK COUNTY - DOWNTOWN LAS VEGAS AREA With Gaming Revenue of $12,000,000 and Over
Combined Balance Sheet Combined Income Statement - Summary Combined Income Statement - Detail:
Casino Department Rooms Department Food Department Beverage Department Other Income
Average Number of Employees Rate of Room Occupancy
Per Room Per Day Statistics
Gaming Revenue per Square Foot
Ratios
2-25 2-26
2-27 2-27 2-28 2-28 2-29 2-29 2-30 2-30 2-3 1 2-3 1
2-33 2-34
2-35 2-35 2-36 2-36 2-37 2-37 2-38 2-38 2-39 2-39
2-4 1 2-42
2-43 2-43 2-44 2-44 2-45 2-45 2-46 2-46 2-47 2-47

SECTION 2 - CONTINUED
DETAIL OF SELECTED GROUPS
CLARK COUNTY - LAUGHLIN AREA With Gaming Revenue of $1.000.000 and Over
Combined Balance Sheet Combined Income Statement - Summary Combined Income Statement - Detail:
Casino Department Rooms Department Food Department Beverage Department Other Income
Average Number ofEmployees Rate ofRoom Occupancy Per Room Per Day Statistics Gaming Revenue per Square Foot Ratios
CLARK COUNTY - BOULDER STRIP AREA With Gaming Revenue of $1,000.000 and Over
Combined Balance Sheet Combined Income Statement - Summary Combined Income Statement - Detail:
Casino Department Rooms Department Food Department Beverage Department Other Income
Average Number of Employees Rate of Room Occupancy Per Room Per Day Statistics Gaming Revenue per Square Foot Ratios
CLARK COUNTY - BALANCE OF COUNTY
With Gaming Revenue of $1,000,000 and Over
Combined Balance Sheet Combined Income Statement - Summary Combined Income Statement - Detail:
Casino Department Rooms Department Food Department Beverage Department Other Income
Average Number ofEmployees Rate of Room Occupancy Per Room Per Day Statistics Gaming Revenue per Square Foot Ratios
INDEX
2-49 2-50
2-5 1 2-5 1 2-52 2-52 2-53 2-53 2-54 2-54 2-55 2-55
2-57 2-58
2-59 2-59 2-60 2-60 2-61 2-61 2-62 2-62 2-63 2-63
2-65 2-66
2-67 2-67 2-68 2-68 2-69 2-69 2-70 2-70 2-7 1 2-71

SECTION 2 - CONTINUED
DETAIL OF SELECTED GROUPS
ELKO COUNTY - WENDOVER AREA With Gaming Revenue of $1,000,000 and Over
Combined Balance Sheet Combined Income Statement - Summary Combined Income Statement - Detail:
Casino Department Rooms Department Food Department
Beverage Department
Other Income
Average Number of Employees Rate of Room Occupancy Per Room Per Day Statistics
Gaming Revenue per Square Foot Ratios
WASHOE COUNTY - RENO/SPARKS AREA With Gaming Revenue of $1,000,000 and Over
Combined Balance Sheet
Combined Income Statement - Summary
Combined Income Statement - Detail:
Casino Department Rooms Department Food Department Beverage Department Other Income
Average Number of Employees Rate of Room Occupancy Per Room Per Day Statistics Gaming Revenue per Square Foot Ratios
INDEX
WASHOE COUNTY - RENO/SPARKS AREA With Gaming Revenue of $1,000,000 to $12,000,000
Combined Balance Sheet Combined Income Statement - Summary Combined Income Statement - Detail :
Casino Department Rooms Department Food Department Beverage Department Other Income
Average Number of Employees
Rate of Room Occupancy
Per Room Per Day Statistics Gaming Revenue per Square Foot Ratios
2-73 2-74
2-75 2-75 2-76 2-76 2-77 2-77 2-78 2-78 2-79 2-79
2-8 1 2-82
2-83 2-83 2-84 2-84 2-85 2-85 2-86 2-86 2-87 2-87
2-89 2-90
2-9 1 2-9 1 2-92 2-92 2-93 2-93 2-94 2-94 2-95 2-95
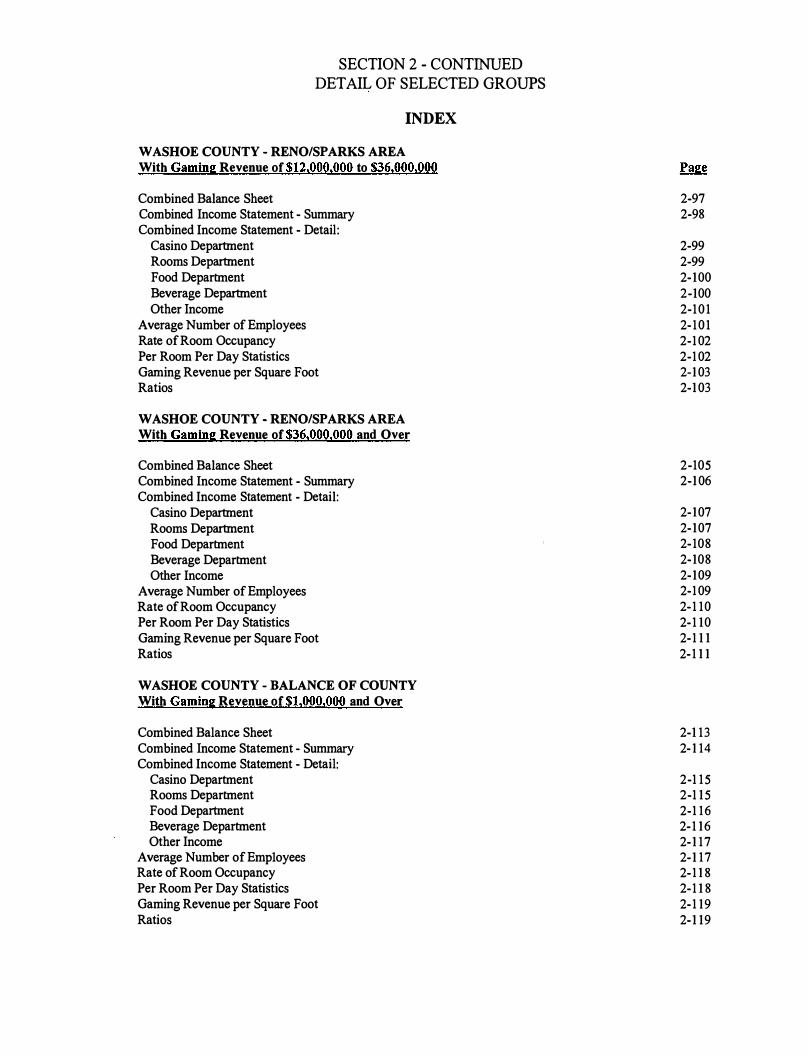
SECTION 2 - CONTINUED
DETAIL OF SELECTED GROUPS
INDEX
WASHOE COUNTY - RENO/SPARKS AREA With Gaming Revenue of $12.000,000 to $36.000,000
Combined Balance Sheet Combined Income Statement - Summary Combined Income Statement - Detail:
Casino Department Rooms Department Food Department Beverage Department Other Income
Average Number of Employees Rate ofRoom Occupancy Per Room Per Day Statistics Gaming Revenue per Square Foot Ratios
WASHOE COUNTY - RENO/SPARKS AREA With Gaming Revenue of $36,000,000 and Over
Combined Balance Sheet Combined Income Statement - Summary Combined Income Statement - Detail:
Casino Department Rooms Department Food Department Beverage Department Other Income
Average Number of Employees Rate of Room Occupancy Per Room Per Day Statistics Gaming Revenue per Square Foot Ratios
WASHOE COUNTY - BALANCE OF COUNTY With Gaming Revenue of $1,000,000 and Over
Combined Balance Sheet Combined Income Statement - Summary Combined Income Statement - Detail:
Casino Department Rooms Department Food Department Beverage Department Other Income
Average Number of Emp1oyees Rate of Room Occupancy Per Room Per Day Statistics Gaming Revenue per Square Foot Ratios
2-97 2-98
2-99 2-99 2- 1 00 2-100 2-1 0 1 2- 1 0 1 2-1 02 2-1 02 2-1 03 2-1 03
2-105 2-1 06
2- 1 07 2- 1 07 2- 108 2- 108 2- 1 09 2-1 09 2- 1 1 0 2- 1 1 0 2- 1 1 1 2- 1 1 1
2-1 1 3 2- 1 14
2-1 1 5 2-1 1 5 2-1 1 6 2- 1 1 6 2- 1 1 7 2- 1 1 7 2- 1 1 8 2- 1 1 8 2- 1 1 9 2- 1 1 9

COMBINED BALANCE SHEET -Fiscal Year 2 0 13 Clark County - Las Vegas Strip Area With Gaming Revenue of $ 1 , 0 0 0 , 0 0 0 and over
Amounts Represent 4 3 Locations .
ASSETS CURRENT ASSETS
Cash . . . . . . . . . . . . . . . . . . . . . . . . . . . . . . . . . . . . . . . . . . . . . . . . . . . .
Receivables TOTAL ALLOWANCE Casino 1 , 164 , 1 0 9 , 741 4 8 8 , 74 0 , 6 8 2 Trade 4 3 7 , 3 62 , 92 6 2 1 , 0 7 2 , 8 7 8 Sundry 7 , 0 8 8 , 5 0 8 , 974 6 6 0 , 2 4 4 Notes 2 1 1 , 752 o
Prepaid Expense s . . . . . . . . . . . . . . . . . . . . . . . . . . . . . . . . . . . . . . . .
Other Current Assets . . . . . . . . . . . . . . . . . . . . . . . . . . . . . . . . . . . .
TOTAL CURRENT ASSETS . . . . . . . . . . . . . . . . . . . . . . . . . . . . . . . . . . . . . .
FIXED ASSETS COST DEPRECIATION Land 13 , 2 17 , 2 5 5 , 0 3 8 . . . . . . . . . . . Land Improvements 1 , 2 93 , 5 8 2 , 0 7 1 4 17 , 7 64 , 8 0 8 Buildings & Improvements 2 4 , 4 5 6 , 2 2 6 , 3 2 8 5 , 76 0 , 5 0 1 , 5 8 7 Furniture & Equipment 8 , 0 64 , 5 0 8 , 92 8 4 , 72 0 , 4 2 1 , 2 8 2 Lease Improvements 4 9 , 0 1 0 , 995 1 9 , 3 5 8 , 894 Construction in Progres s 7 10 , 182 , 90 7 . . . . . . . . . . .
TOTAL FIXED ASSETS . . . . . . . . . . . . . . . . . . . . . . . . . . . . . . . . . . . . . . . .
OTHER ASSETS
TOTAL ASSETS
LIABILITIES AND CAPITAL CURRENT LIABILITIES
Accounts Payabl e - Trade . . . . . . . . . . . . . . . . . . . . . . . . . . . . . . . .
Accounts Payable - Other . . . . . . . . . . . . . . . . . . . . . . . . . . . . . . . .
Current Portion of Long-Term Debt . . . . . . . . . . . . . . . . . . . . . . .
Accrued Expenses . . . . . . . . . . . . . . . . . . . . . . . . . . . . . . . . . . . . . . . .
Other Current Liabilities . . . . . . . . . . . . . . . . . . . . . . . . . . . . . . .
TOTAL CURRENT LIABILITIES . . . . . . . . . . . . . . . . . . . . . . . . . . . . . . . . .
LONG- TERM DEBT TOTAL OWING CURRENT PORTION Mortgages 1 0 , 16 6 , 4 04 , 94 5 1 8 0 , 595 Debentures & Bonds 2 , 6 9 0 , 57 3 , 3 7 8 1 , 0 55 , 34 8 , 4 9 8 Notes 2 , 2 8 6 , 0 02 , 15 6 3 2 , 198 , 3 9 1 Contracts 7 , 8 2 6 , 1 8 5 4 , 0 04 , 3 1 9 Other 7 , 0 12 , 74 8 , 8 9 7 5 0 , 3 0 1 , 674
TOTAL LONG-TERM DEBT 2 2 , 163 , 55 5 , 5 6 1 1 , 14 2 , 0 3 3 , 4 77 OTHER LIABILITIES . . . . . . . . . . . . . . . . . . . . . . . . . . . . . . . . . . . . . . . . .
TOTAL LIABILITIES
CAPITAL Owners Capital Accounts . . . . . . . . . . . . . . . . . . . . . . . . . . . . . . . . .
Capital Stock & Other Capital . . . . . . . . . . . . . . . . . . . . . . . . . . .
Retained Earnings . . . . . . . . . . . . . . . . . . . . . . . . . . . . . . . . . . . . . . .
TOTAL CAPITAL . . . . . . . . . . . . . . . . . . . . . . . . . . . . . . . . . . . . . . . . . . . . .
TOTAL LIABILITIES AND CAPITAL . . . . . . . . . . . . . . . . . . . . . . . . . . . . . .
Average Assets 1 , 24 0 , 9 7 7 , 53 7
Upper Quartile 1 , 4 18 , 2 33 , 822
Median 6 13 , 7 5 1 , 3 6 2
2 - 1
DOLLARS PERCENT 1 , 6 6 6 , 8 1 0 , 6 3 5
6 7 5 , 3 6 9 , 0 5 9 4 1 6 , 2 9 0 , 0 4 8
7 , 0 8 7 , 84 8 , 7 3 0 2 1 1 , 752
2 0 9 , 0 6 9 , 6 0 8 3 , 5 3 2 , 2 8 6 , 9 6 5
13 , 5 8 7 , 8 8 6 , 7 9 7
13 , 2 1 7 , 2 5 5 , 0 3 8 8 75 , 8 1 7 , 2 63
1 8 , 6 95 , 72 4 , 74 1 3 , 34 4 , 0 8 7 , 64 6
2 9 , 6 5 2 , 1 0 1 7 10 , 18 2 , 9 0 7
3 6 , 8 7 2 , 7 19 , 6 9 6
2 , 9 0 1 , 42 7 , 6 18
5 3 , 3 6 2 , 0 3 4 , 111
2 6 4 , 74 7 , 7 9 0 2 , 4 6 6 , 174 , 44 6 1 , 14 2 , 0 3 3 , 4 7 7
7 4 6 , 3 0 6 , 117 4 , 2 2 2 , 3 1 3 , 0 4 8 8 , 8 4 1 , 5 7 4 , 8 7 8
1 0 , 1 6 6 , 22 4 , 3 5 0 1 , 6 3 5 , 22 4 , 8 8 0 2 , 2 5 3 , 8 0 3 , 7 6 5
3 , 8 2 1 , 8 6 6 6 , 962 , 44 7 , 2 2 3
2 1 , 0 2 1 , 52 2 , 0 84 10 , 17 9 , 4 5 7 , 8 2 6 4 0 , 0 4 2 , 55 4 , 7 8 8
- 6 , 8 5 3 , 3 3 5 , 2 97 1 9 , 14 3 , 28 0 , 693
1 , 0 2 9 , 5 3 3 , 9 2 7 13 , 3 1 9 , 4 7 9 , 3 2 3
5 3 , 3 6 2 , 0 3 4 , 111
Lower Quartile 2 7 , 8 5 9 , 932
3 . 1%
1 . 3 % 0 . 8 %
13 . 3 % 0 . 0 % 0 . 4 % 6 . 6 %
2 5 . 5 %
2 4 . 8 % 1 . 6 %
3 5 . 0 % 6 . 3 % 0 . 1% 1 . 3 %
6 9 . 1%
5 . 4 %
1 0 0 . 0 %
0 . 5 % 4 . 6 % 2 . 1% 1 . 4 % 7 . 9%
16 . 6%
1 9 . 1% 3 . 1% 4 . 2 % 0 . 0 %
13 . 0 % 3 9 . 4 % 19 . 1% 7 5 . 0 %
- 12 . 8 % 3 5 . 9%
1 . 9% 2 5 . 0 %
1 0 0 . 0 %
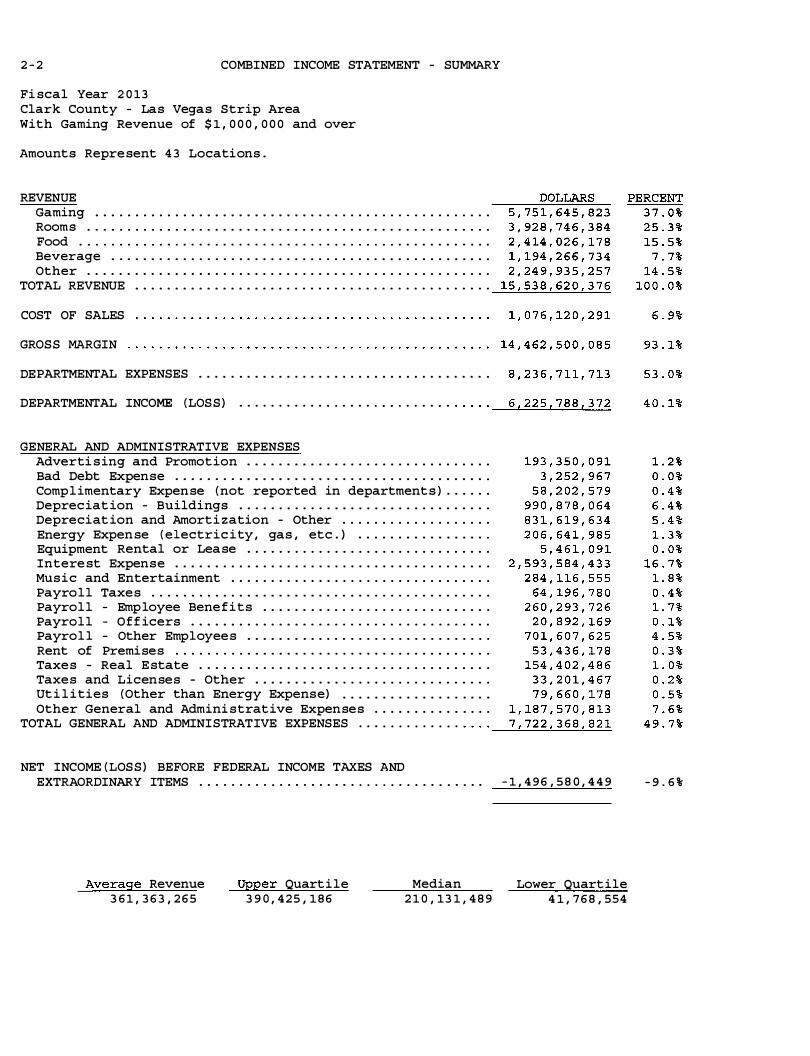
2 - 2 COMBINED INCOME STATEMENT - SUMMARY
Fiscal Year 2 0 13 Clark County - Las Vegas Strip Area With Gaming Revenue of $ 1 , 0 0 0 , 0 0 0 and over
Amounts Represent 4 3 Locations .
REVENUE Gaming . . . . . . . . . . . . . . . . . . . . . . . . . . . . . . . . . . . . . . . . . . . . . . . . . .
Rooms . . . . . . . . . . . . . . . . . . . . . . . . . . . . . . . . . . . . . . . . . . . . . . . . . . .
Food . . . . . . . . . . . . . . . . . . . . . . . . . . . . . . . . . . . . . . . . . . . . . . . . . . . .
Beverage . . . . . . . . . . . . . . . . . . . . . . . . . . . . . . . . . . . . . . . . . . . . . . . .
Other . . . . . . . . . . . . . . . . . . . . . . . . . . . . . . . . . . . . . . . . . . . . . . . . . . .
TOTAL REVENUE . . . . . . . . . . . . . . . . . . . . . . . . . . . . . . . . . . . . . . . . . . . . .
COST OF SALES
GROSS MARGIN
DEPARTMENTAL EXPENSES . . . . . . . . . . . . . . . . . . . . . . . . . . . . . . . . . . . . .
DEPARTMENTAL INCOME (LOSS) • • • • • • • • • • • • • • • • • • • • • • • • • • • • · · · · -.=....!...==-.t......:....::.=-.t.....::.....:..=.
GENERAL AND ADMINISTRATIVE EXPENSES Advertising and Promotion . . . . . . . . . . . . . . . . . . . . . . . . . . . . . . .
Bad Debt Expense . . . . . . . . . . . . . . . . . . . . . . . . . . . . . . . . . . . . . . . .
Compl imentary Expense (not reported in departments ) . . . . . .
Depreciat ion - Buildings . . . . . . . . . . . . . . . . . . . . . . . . . . . . . . . .
Depreciat ion and Amorti zation - Other . . . . . . . . . . . . . . . . . . .
Energy Expense (electric ity , gas , etc . ) . . . . . . . . . . . . . . . . .
Equipment Rental or Lease . . . . . . . . . . . . . . . . . . . . . . . . . . . . . . .
Interest Expense . . . . . . . . . . . . . . . . . . . . . . . . . . . . . . . . . . . . . . . .
Music and Entertainment . . . . . . . . . . . . . . . . . . . . . . . . . . . . . . . . .
Payroll Taxes . . . . . . . . . . . . . . . . . . . . . . . . . . . . . . . . . . . . . . . . . . .
Payroll - Employee Benefits . . . . . . . . . . . . . . . . . . . . . . . . . . . . .
Payroll - Off icers . . . . . . . . . . . . . . . . . . . . . . . . . . . . . . . . . . . . . .
Payrol l - Other Employees . . . . . . . . . . . . . . . . . . . . . . . . . . . . . . .
Rent of Premises . . . . . . . . . . . . . . . . . . . . . . . . . . . . . . . . . . . . . . . .
Taxes - Real Estate . . . . . . . . . . . . . . . . . . . . . . . . . . . . . . . . . . . . .
Taxes and Licenses - Other . . . . . . . . . . . . . . . . . . . . . . . . . . . . . .
Ut i l ities (Other than Energy Expense) . . . . . . . . . . . . . . . . . . . Other General and Administrative Expenses . . . . . . . . . . . . . . .
TOTAL GENERAL AND ADMINISTRATIVE EXPENSES . . . . . . . . . . . . . · · · · -�..:....::.=.L�.=....!...�=
NET INCOME (LOSS) BEFORE FEDERAL INCOME TAXES AND EXTRAORDINARY ITEMS . . . . . . . . . . . . . . . . . . . . . . . . . . . . . . . . . . . . - 1 , 4 9 6 , 5 8 0 , 4 4 9
Average Revenue 3 6 1 , 3 6 3 , 2 6 5
Upper Quartile 3 9 0 , 4 2 5 , 1 8 6
Median 2 1 0 , 13 1 , 4 8 9
Lower Quartile 4 1 , 7 6 8 , 554
- 9 . 6%"

COMBINED INCOME STATEMENT - DETAIL Fiscal Year 2 0 1 3 Clark County - Las Vegas Strip Area With Gaming Revenue of $ 1 , 0 0 0 , 0 0 0 and over
Amounts Represent 4 3 Locations .
CASINO DEPARTMENT
REVENUE
Pit Revenue ( Inc ludes Keno and Bingo) . . . . . . . . . . . . . . . . . . . Coin Operated Devices . . . . . . . . . . . . . . . . . . . . . . . . . . . . . . . . . . . Poker and Pan . . . . . . . . . . . . . . . . . . . . . . . . . . . . . . . . . . . . . . . . . . . Race Book . . . . . . . . . . . . . . . . . . . . . . . . . . . . . . . . . . . . . . . . . . . . . . . Sports Pool . . . . . . . . . . . . . . . . . . . . . . . . . . . . . . . . . . . . . . . . . . . . .
TOTAL REVENUE . . . . . . . . . . . . . . . . . . . . . . . . . . . . . . . . . . . . . . . . . . . . .
DEPARTMENTAL EXPENSES Bad Debt Expense . . . . . . . . . . . . . . . . . . . . . . . . . . . . . . . . . . . . . . . . Commissions . . . . . . . . . . . . . . . . . . . . . . . . . . . . . . . . . . . . . . . . . . . . .
Complimentary Expense . . . . . . . . . . . . . . . . . . . . . . . . . . . . . . . . . . . Gaming Taxes and Licenses . . . . . . . . . . . . . . . . . . . . . . . . . . . . . . . Preferred Guest Expenses (no complimentaries ) . . . . . . . . . . . Payroll Taxes . . . . . . . . . . . . . . . . . . . . . . . . . . . . . . . . . . . . . . . . . . . Payroll - Employee Benefits . . . . . . . . . . . . . . . . . . . . . . . . . . . . . Payrol l - Officers . . . . . . . . . . . . . . . . . . . . . . . . . . . . . . . . . . . . . . Payroll - Other Employees . . . . . . . . . . . . . . . . . . . . . . . . . . . . . . . Race Wire Fees . . . . . . . . . . . . . . . . . . . . . . . . . . . . . . . . . . . . . . . . . . Other Departmental Expenses . . . . . . . . . . . . . . . . . . . . . . . . . . . . .
TOTAL DEPARTMENTAL EXPENSES . . . . . . . . . . . . . . . . . . . . . . . . . . . . . . .
DEPARTMENTAL INCOME ( LOSS ) . . . . . . . . . . . . . . . . . . . . . . . . . . . . . . . . .
ROOMS DEPARTMENT
REVENUE
Room Sales . . . . . . . . . . . . . . . . . . . . . . . . . . . . . . . . . . . . . . . . . . . . . . Complimentary Rooms . . . . . . . . . . . . . . . . . . . . . . . . . . . . . . . . . . . . .
TOTAL REVENUE . . . . . . . . . . . . . . . . . . . . . . . . . . . . . . . . . . . . . . . . . . . . .
DEPARTMENTAL EXPENSES Bad Debt Expense . . . . . . . . . . . . . . . . . . . . . . . . . . . . . . . . . . . . . . . . Complimentary Expense . . . . . . . . . . . . . . . . . . . . . . . . . . . . . . . . . . . Payrol l - Taxes . . . . . . . . . . . . . . . . . . . . . . . . . . . . . . . . . . . . . . . . . Payrol l - Employee Benefits . . . . . . . . . . . . . . . . . . . . . . . . . . . . . Payrol l - Officers . . . . . . . . . . . . . . . . . . . . . . . . . . . . . . . . . . . . . . Payrol l - Other Employees . . . . . . . . . . . . . . . . . . . . . . . . . . . . . . . Other Departmental Expenses . . . . . . . . . . . . . . . . . . . . . . . . . . . . .
TOTAL DEPARTMENTAL EXPENSES . . . . . . . . . . . . . . . . . . . . . . . . . . . . . . .
DEPARTMENTAL INCOME ( LOSS ) . . . . . . . . . . . . . . . . . . . . . . . . . . . . . . . . .
DOLLARS 2 , 6 7 8 , 14 9 , 0 3 3 2 , 8 7 7 , 513 , 2 8 2
1 0 1 , 7 5 9 , 8 0 3 2 7 , 992 , 8 3 3 6 6 , 2 3 0 , 8 7 2
5 , 7 5 1 , 64 5 , 8 2 3
14 0 , 69 9 , 2 7 7 9 , 6 6 9 , 8 0 4
1 , 4 8 7 , 963 , 3 0 1 4 3 3 , 2 8 5 , 2 19 2 17 , 0 14 , 6 6 5 113 , 44 5 , 7 8 2 196 , 3 14 , 3 5 7
14 , 13 2 , 1 6 1 7 4 5 , 152 , 4 94
6 , 7 5 6 , 9 1 9 4 6 3 , 83 4 , 8 6 6
3 , 8 2 8 , 2 6 8 , 8 4 5
1 , 923 ! 3 7 6 ! 9 7 8
DOLLARS 3 , 182 , 94 3 , 3 6 9
7 4 5 , 8 03 , 0 1 5 3 , 92 8 , 74 6 ! 3 8 4
13 , 6 9 7 , 1 8 8 113 , 75 8 , 7 0 7
7 5 , 7 7 9 , 9 9 6 2 2 0 , 34 2 , 9 2 7
2 , 98 0 , 3 6 8 7 2 0 , 2 3 3 , 4 4 4 4 5 8 , 72 5 , 0 4 9
1 , 6 0 5 , 5 17 , 6 7 9
2 , 3 2 3 ! 2 2 8 , 7 0 5
2 - 3
PERCENT 4 6 . 6% 5 0 . 0 %
1 . 8 % 0 . 5 % 1 . 2 %
1 0 0 . 0 %
2 . 4 % 0 . 2 %
2 5 . 9 % 7 . 5 % 3 . 8 % 2 . 0 % 3 . 4 % 0 . 2 %
13 . 0 % 0 . 1% 8 . 1%
6 6 . 6 %
3 3 . 4 %
PERCENT 8 1 . 0 % 1 9 . 0 %
1 0 0 . 0 %
0 . 3 % 2 . 9% 1 . 9 % 5 . 6 % 0 . 1%
18 . 3 % 11 . 7% 4 0 . 9 %
59 . 1%

2 - 4 COMBINED INCOME STATEMENT - DETAIL ( CONTINUED)
Fiscal Year 2 0 1 3 Clark County - Las Vegas Strip Area With Gaming Revenue of $ 1 , 0 0 0 , 0 0 0 and over
Amounts Represent 4 3 Locat ions .
FOOD DEPARTMENT REVENUE DOLLARS PERCENT
Food Sales 2 , 0 2 8 , 3 6 8 , 0 4 6 84 . 0 % Complimentary Food Sales . . . . . . . . . . . . . . . . . . . . . . . . . . . . . . . . 3 8 5 , 6 5 8 , 132 16 . 0 %
TOTAL REVENUE . . . . . . . . . . . . . . . . . . . . . . . . . . . . . . . . . . . . . . . . . . . . . 2 , 4 14 , 02 6 , 1 7 8 1 0 0 . 0 %
COST OF SALES 6 7 7 , 2 9 9 , 3 2 1 2 8 . 1%
GROSS MARGIN 1 , 7 3 6 , 726 , 8 5 7 7 1 . 9 %
DEPARTMENTAL EXPENSES Bad Debt Expense . . . . . . . . . . . . . . . . . . . . . . . . . . . . . . . . . . . . . . . . 2 , 9 95 , 5 8 9 0 . 1% Compl imentary Expense . . . . . . . . . . . . . . . . . . . . . . . . . . . . . . . . . . . 2 3 , 4 5 9 , 8 3 6 1 . 0 % Payrol l - Taxes . . . . . . . . . . . . . . . . . . . . . . . . . . . . . . . . . . . . . . . . . 1 0 2 , 3 7 7 , 163 4 . 2 % Payrol l - Employee Benefits . . . . . . . . . . . . . . . . . . . . . . . . . . . . . 2 52 , 93 3 , 0 5 8 10 . 5 % Payrol l - Officers . . . . . . . . . . . . . . . . . . . . . . . . . . . . . . . . . . . . . . 2 8 , 3 94 , 6 8 1 1 . 2 % Payrol l - Other Employees . . . . . . . . . . . . . . . . . . . . . . . . . . . . . . . 8 0 3 , 913 , 3 1 9 3 3 . 3 % Other Departmental Expenses . . . . . . . . . . . . . . . . . . . . . . . . . . . . . 1 4 2 , 4 6 6 , 2 8 5 5 . 9 %
TOTAL DEPARTMENTAL EXPENSES . . . . . . . . . . . . . . . . . . . . . . . . . . . . . . . 1 , 3 5 6 , 53 9 , 9 3 1 5 6 . 2 %
DEPARTMENTAL INCOME ( LOSS ) 3 8 0 , 18 6 , 9 2 6 15 . 7 %
BEVERAGE DEPARTMENT REVENUE DOLLARS PERCENT
Beverage Sales . . . . . . . . . . . . . . . . . . . . . . . . . . . . . . . . . . . . . . . . . . 8 2 0 , 72 9 , 515 6 8 . 7 % Complimentary Beverage Sales . . . . . . . . . . . . . . . . . . . . . . . . . . . . 3 73 , 5 3 7 , 2 1 9 3 1 . 3 %
TOTAL REVENUE . . . . . . . . . . . . . . . . . . . . . . . . . . . . . . . . . . . . . . . . . . . . . 1 , 1 94 , 2 6 6 , 7 3 4 1 0 0 . 0 %
COST OF SALES 1 9 1 , 63 5 , 4 7 3 1 6 . 0 %
GROSS MARGIN . . . . . . . . . . . . . . . . . . . . . . . . . . . . . . . . . . . . . . . . . . . . . . 1 , 0 02 , 6 3 1 , 2 6 1 84 . 0 %
DEPARTMENTAL EXPENSES Bad Debt Expense . . . . . . . . . . . . . . . . . . . . . . . . . . . . . . . . . . . . . . . . 4 1 3 , 3 5 9 0 . 0 % Complimentary Expense . . . . . . . . . . . . . . . . . . . . . . . . . . . . . . . . . . . 2 8 , 5 1 3 , 4 2 0 2 . 4 % Payroll - Taxes . . . . . . . . . . . . . . . . . . . . . . . . . . . . . . . . . . . . . . . . . 2 6 , 3 0 9 , 4 8 7 2 . 2 % Payroll - Employee Benefits . . . . . . . . . . . . . . . . . . . . . . . . . . . . . 5 9 , 7 1 0 , 8 5 9 5 . 0 % Payrol l - Officers . . . . . . . . . . . . . . . . . . . . . . . . . . . . . . . . . . . . . . 7 2 5 , 2 13 0 . 1% Payrol l - Other Employees . . . . . . . . . . . . . . . . . . . . . . . . . . . . . . . 1 8 5 , 8 58 , 755 15 . 6 % Other Departmental Expenses . . . . . . . . . . . . . . . . . . . . . . . . . . . . . 2 2 3 , 53 1 , 3 5 1 18 . 7 %
TOTAL DEPARTMENTAL EXPENSES . . . . . . . . . . . . . . . . . . . . . . . . . . . . . . . 5 2 5 , 0 62 , 444 44 . 0 %
DEPARTMENTAL INCOME ( LOSS ) . . . . . . . . . . . . . . . . . . . . . . . . . . . . . . . . . 4 7 7 , 5 6 8 , 8 1 7 4 0 . 0 %

COMBINED INCOME STATEMENT - DETAIL ( CONTINUED)
Fiscal Year 2 0 1 3 Clark County - Las Vegas Strip Area With Gaming Revenue of $ 1 , 0 0 0 , 0 0 0 and over
Amounts Represent 4 3 Locations .
OTHER INCOME REVENUE
Other Operating and Non- operating Income . . . . . . . . . . . . . . . . Other Complimentary Items . . . . . . . . . . . . . . . . . . . . . . . . . . . . . . .
TOTAL REVENUE . . . . . . . . . . . . . . . . . . . . . . . . . . . . . . . . . . . . . . . . . . . . .
COST OF SALES . . . . . . . . . . . . . . . . . . . . . . . . . . . . . . . . . . . . . . . . . . . . .
GROSS MARGIN . . . . . . . . . . . . . . . . . . . . . . . . . . . . . . . . . . . . . . . . . . . . . .
DEPARTMENTAL EXPENSES Bad Debt Expense . . . . . . . . . . . . . . . . . . . . . . . . . . . . . . . . . . . . . . . .
Complimentary Expense . . . . . . . . . . . . . . . . . . . . . . . . . . . . . . . . . . .
Payroll - Taxes . . . . . . . . . . . . . . . . . . . . . . . . . . . . . . . . . . . . . . . . .
Payroll - Employee Benefits . . . . . . . . . . . . . . . . . . . . . . . . . . . . .
Payroll - Officers . . . . . . . . . . . . . . . . . . . . . . . . . . . . . . . . . . . . . .
Payroll - Other Employees . . . . . . . . . . . . . . . . . . . . . . . . . . . . . . .
Other Departmental Expense s . . . . . . . . . . . . . . . . . . . . . . . . . . . . .
TOTAL DEPARTMENTAL EXPENSES . . . . . . . . . . . . . . . . . . . . . . . . . . . . . . .
DEPARTMENTAL INCOME ( LOSS ) . . . . . . . . . . . . . . . . . . . . . . . . . . . . . . . . .
AVERAGE NUMBER OF EMPLOYEES FOR THE YEAR
CASINO DEPARTMENT . . . . . . . . . . . . . . . . . . . . .
ROOMS DEPARTMENT . . . . . . . . . . . . . . . . . . . . . . FOOD DEPARTMENT . . . . . . . . . . . . . . . . . . . . . . . BEVERAGE DEPARTMENT . . . . . . . . . . . . . . . . . . .
G & A DEPARTMENT . . . . . . . . . . . . . . . . . . . . .
OTHER DEPARTMENTS . . . . . . . . . . . . . . . . . . . . .
TOTAL
DOLLARS 2 , 15 3 , 6 3 9 , 7 0 8
9 6 , 2 95 , 5 4 9 2 , 24 9 , 9 3 5 , 2 5 7
2 0 7 , 18 5 , 4 9 7
2 , 04 2 , 74 9 , 7 6 0
3 , 904 , 4 3 6 2 2 , 04 2 , 8 4 6 3 4 , 3 8 3 , 6 8 0 6 4 , 0 6 5 , 192
2 , 9 8 7 , 8 94 3 4 4 , 8 1 0 , 9 9 7 4 4 9 , 12 7 , 7 6 9 9 2 1 , 3 2 2 , 8 1 4
1 , 12 1 , 4 2 6 , 9 4 6
2 3 , 0 6 2 2 0 , 911 2 3 , 93 0
6 , 3 13 16 , 2 9 2
9 , 2 2 4
9 9 , 7 3 2
2 - 5
PERCENT 95 . 7 %
4 . 3 % 1 0 0 . 0 %
9 . 2 %
90 . 8 %
0 . 2 % 1 . 0% 1 . 5% 2 . 8 % 0 . 1%
15 . 3 % 2 0 . 0 % 4 0 . 9%
4 9 . 8 %

2 - 6 ROOM OCCUPANCY AND PER ROOM PER DAY ANALYSIS
Fiscal Year 2 0 13 Clark County - Las Vegas Strip Area With Gaming Revenue of $ 1 , 0 0 0 , 0 0 0 and over
Amounts Represent 4 3 Locations .
RATE OF ROOM OCCUPANCY
MONTH JULY . . . . . . . . . . AUGUST . . . . . . . . SEPTEMBER . . . . . OCTOBER . . . . . . . NOVEMBER . . . . . . DECEMBER . . . . . . JANUARY . . . . . . . FEBRUARY . . . . . .
MAR CH . . . . . . . . .
APRIL . . . . . . . . .
MAY . . . . . . . . . . . JUNE . . . . . . . . . .
TOTAL . . . . . . . . .
Average Pit Revenue Per Room Per Day
Average Slot Revenue Per Room Per Day
Average Food Sales Per Room Per Day
AVAILABLE ROOMS ROOMS OCCUPIED
2 , 7 7 7 , 5 8 0 2 , 5 7 0 , 5 1 7 2 , 7 6 0 , 3 3 4 2 , 4 6 1 , 6 7 0 2 , 6 7 6 , 9 7 3 2 , 44 4 , 6 4 7 2 , 7 8 2 , 8 3 7 2 , 6 0 7 , 2 2 7 2 , 664 , 0 22 2 , 2 5 5 , 544 2 , 7 3 7 , 6 8 3 2 , 2 2 3 , 7 18 2 , 7 8 3 , 3 6 8 2 , 3 6 5 , 965 2 , 4 98 , 6 9 9 2 , 2 3 3 , 655 2 , 7 92 , 6 5 2 2 , 6 12 , 5 9 9 2 , 7 0 3 , 2 3 4 2 , 5 0 5 , 5 3 5 2 , 7 95 , 6 8 5 2 , 5 6 6 , 8 3 0 2 , 7 1 0 , 7 7 0 2 , 52 7 , 9 7 8
3 2 , 6 8 3 , 8 3 7 2 9 , 3 7 5 , 8 8 5
PER ROOM PER DAY STATISTICS
9 1 . 1 7
9 7 . 95
8 2 . 18
Average Beverage Sales Per Room Per Day
Average Rooms Department Payroll Per Room Per Day
Average Room Rate Per Day
% OF OCCUPANCY
(COMPUTED) 92 . 5 5 % 8 9 . 1 8 % 9 1 . 3 2 % 9 3 . 6 9 % 84 . 6 7 % 8 1 . 2 3 % 8 5 . 0 0 % 8 9 . 3 9 % 9 3 . 5 5 % 92 . 6 9 % 9 1 . 8 1 % 9 3 . 2 6 %
8 9 . 8 8 %
4 0 . 65
3 4 . 7 0
1 3 3 . 74

PER SQUARE FOOT ANALYSIS AND RATIOS 2 - 7 Fiscal Year 2 0 13 Clark County - Las Vegas Strip Area With Gaming Revenue of $ 1 , 0 0 0 , 0 0 0 and over
Amounts Represent 4 3 Locations .
GAMING REVENUE PER SQUARE FOOT OF FLOOR SPACE
NO . OF CASINOS AVERAGE AREA GAMING REVENUE AREA OPERATING IN SQUARE FEET PER SQUARE FOOT
Pit ( Includes B ingo and Coin Operated Devices Poker and Pan Race and Sports
TOTAL CASINO
Keno )
RATIOS
3 6 1 8 , 153 3 8 5 6 , 44 9 2 5 3 , 3 8 1 2 9 6 , 0 92
4 3 7 1 , 1 5 8
TOTAL CURRENT ASSETS T O TOTAL CURRENT LIABILITIES . . . . . . . . .
TOTAL CAPITAL TO TOTAL LIABILITIES . . . . . . . . . . . . . . . . . . . . . . . .
TOTAL CAPITAL TO TOTAL CURRENT LIABILITIES . . . . . . . . . . . . . . . .
TOTAL CURRENT LIABILITIES TO TOTAL LIABILITIES . . . . . . . . . . . .
TOTAL COMPLIMENTARY EXPENSE TO GAMING REVENUE . . . . . . . . . . . • .
MUSIC AND ENTERTAINMENT EXPENSES TO GAMING REVENUE . . . . . . . .
TOTAL REVENUE TO AVERAGE TOTAL ASSETS . . . . . . . . . . . . . . . . . . . . .
TOTAL REVENUE LESS COMP SALES TO AVERAGE TOTAL ASSETS . . . . .
RETURN ON INVESTED CAPITAL* . . . . . . . . . . . . . . . . . . . . . . . . . . . . . . .
RETURN ON AVERAGE ASSETS* . . . . . . . . . . . . . . . . . . . . . . . . . . . . . . . . .
* - FORMULAS
Return on Invested Capital is equal to the total of net income (before federal income taxes and extraordinary items ) and interest expense divided by the total of average total assets less average current liabilitie s .
4 , 0 8 3 1 , 3 4 1 1 , 197
528
1 , 8 8 0
PERCENT 153 . 7 %
3 3 . 3 %
1 5 0 . 6%-
2 2 . 1%-
3 0 . 1%-
4 . 9 %-
2 6 . 6 %-
2 3 . 9%
2 . 6%
1 . 9%-
Return on Average Assets is equal to the total of net income (before federal income taxes and extraordinary items ) and interest expense divided by the average total assets .

2 - 8
THIS PAGE LEFT INTENTIONALLY BLANK

COMBINED BALANCE SHEET Fiscal Year 2 0 13 Clark County - Las Vegas Strip Area With Gaming Revenue of $ 1 , 0 0 0 , 0 0 0 to $72 , 0 0 0 , 0 0 0
Amounts Represent 2 0 Locations .
ASSETS CURRENT ASSETS
Cash . . . . . . . . . . . . . . . . . . . . . . . . . . . . . . . . . . . . . . . . . . , . . . . . . . . .
Receivables TOTAL ALLOWANCE Casino 14 , 93 4 , 0 6 8 8 , 5 12 , 4 7 5 Trade 3 0 , 0 6 2 , 160 2 , 12 0 , 6 5 9 Sundry 2 , 4 5 3 , 192 0 Notes 2 1 1 , 752 0
Prepaid Expense s . . . . . . . . . . . . . . . . . . . . . . . . . . . . . . . . . . . . . . . .
Other Current Assets . . . . . . . . . . . . . . . . . . . . . . . . . . . . . . . . . . . .
TOTAL CURRENT ASSETS . . . . . . . . . . . . . . . . . . . . . . . . . . . . . . . . . . . . . .
FIXED ASSETS COST DEPRECIATION Land 1 , 4 0 9 , 6 7 3 , 4 54 . . . . . . . . . . .
Land Improvements 5 6 , 8 4 1 , 6 3 6 6 , 152 , 7 0 9 Buildings & Improvements 9 7 2 , 2 1 9 , 959 16 6 , 76 0 , 704 Furniture & Equipment 3 8 0 , 652 , 136 2 6 1 , 6 3 2 , 9 7 1 Lease Improvements 16 , 72 8 , 9 7 9 6 , 2 7 1 , 2 9 9 Construction i n Progress 7 8 , 3 4 9 , 2 5 7 . . . . . . . . . . .
TOTAL FIXED ASSETS . . . . . . . . . . . . . . . . . . . . . . . . . . . . . . . . . . . . . . . .
OTHER ASSETS
TOTAL ASSETS
LIABILITIES AND CAPITAL CURRENT LIABILITIES
Accounts Payable - Trade . . . . . . . . . . . . . . . . . . . . . . . . . . . . . . . .
Accounts Payable - Other . . . . . . . . . . . . . . . . . . . . . . . . . . . . . . . .
Current Portion of Long- Term Debt . . . . . . . . . . . . . . . . . . . . . . .
Accrued Expenses . . . . . . . . . . . . . . . . . . . . . . . . . . . . . . . . . . . . . . . .
Other Current Liabilities . . . . . . . . . . . . . . . . . . . . . . . . . . . . . . .
TOTAL CURRENT LIABILITIES . . . . . . . . . . . . . . . . . . . . . . . . . . . . . . . . .
LONG-TERM DEBT Mortgages Debentures & Bonds Notes Contracts Other
TOTAL LONG-TERM DEBT OTHER LIABILITIES TOTAL LIABILITIES
CAPITAL
TOTAL OWING CURRENT PORTION 4 , 52 9 , 2 3 9 1 8 0 , 5 95
7 9 , 6 4 2 , 814 7 9 , 6 4 2 , 8 14 1 , 16 5 , 6 7 0 , 584 18 , 18 8 , 3 9 1
903 , 32 7 5 93 , 045 4 9 3 , 54 4 , 3 0 7 3 , 3 92 , 64 7
1 , 74 4 , 2 9 0 , 2 7 1 101 , 9 9 7 , 4 92
Owners Capital Accounts . . . . . . . . . . . . . . . . . . . . . . . . . . . . . . . . .
Capital Stock & Other Capital . . . . . . . . . . . . . . . . . . . . . . . . . . . Retained Earnings . . . . . . . . . . . . . . . . . . . . . . . . . . . . . . . . . . . . . . .
TOTAL CAPITAL . . . . . . . . . . . . . . . . . . . . . . . . . . . . . . . . . . . . . . . . . . . . .
TOTAL LIABILITIES AND CAPITAL . . . . . . . . . . . . . . . . . . . . . . . . . . . . . .
Average Assets 155 , 23 3 , 2 1 7
Upper Quartile 2 3 6 , 8 90 , 14 2
Median 2 5 , 92 8 , 92 9
2 - 9
DOLLARS PERCENT 2 4 8 , 4 5 0 , 8 5 5
6 , 4 2 1 , 5 93 2 7 , 941 , 5 0 1
2 , 4 53 , 192 2 1 1 , 752
2 1 , 7 3 1 , 22 1 12 , 8 8 1 , 5 6 3
3 2 0 , 0 9 1 , 6 7 7
1 , 4 0 9 , 6 7 3 , 4 54 5 0 , 6 8 8 , 9 2 7
8 0 5 , 4 5 9 , 2 5 5 119 , 0 19 , 165
10 , 4 5 7 , 6 8 0 7 8 , 34 9 , 2 5 7
2 , 4 7 3 ! 647 , 73 8
3 1 0 , 924 ! 93 2
3 , 1 04 , 6 64 , 34 7
4 2 , 4 7 1 , 3 6 6 5 9 , 64 2 , 6 0 3
10 1 , 997 , 4 9 2 72 , 106 , 9 4 1 6 4 , 2 8 9 , 12 5
3 4 0 , 5 0 7 ! 5 2 7
4 , 34 8 , 644 0
1 , 14 7 , 4 8 2 , 193 3 10 , 2 8 2
4 9 0 , 151 , 6 6 0 1 , 64 2 , 2 92 , 7 7 9
- 1 5 9 , 5 6 0 , 754 1 , 8 2 3 ! 2 3 9 , 5 5 2
4 8 6 , 975 , 2 6 9 1 , 4 54 , 6 19 , 7 8 2
- 6 6 0 , 170 , 2 5 6 1 , 2 8 1 , 4 2 4 , 795
3 , 104 , 6 64 , 3 4 7
Lower Quartile 12 , 793 , 4 93
8 . 0 %
0 . 2 % 0 . 9% 0 . 1% 0 . 0 % 0 . 7 % 0 . 4 %
10 . 3 %
4 5 . 4 % 1 . 6 %
2 5 . 9% 3 . 8 % 0 . 3 % 2 . 5 %
7 9 . 7 %
1 0 . 0 %
1 0 0 . 0 %
1 . 4 % 1 . 9% 3 . 3 % 2 . 3 % 2 . 1%
11 . 0 %
0 . 1% 0 . 0%
3 7 . 0 % 0 . 0 %
15 . 8 % 5 2 . 9% - 5 . 1% 5 8 . 7%
15 . 7 % 4 6 . 9 %
- 2 1 . 3 % 4 1 . 3 %
1 0 0 . 0%
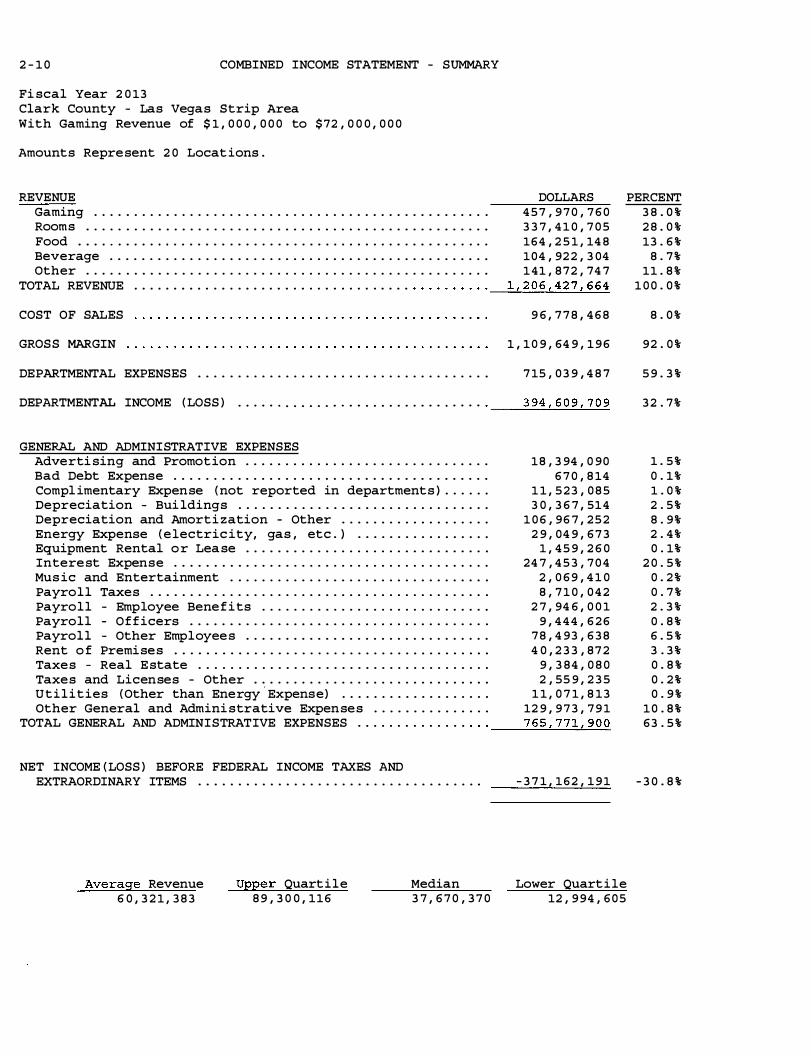
2 - 1 0 COMBINED INCOME STATEMENT - SUMMARY
Fiscal Year 2 0 13 Clark County - Las Vegas Strip Area With Gaming Revenue of $ 1 , 0 0 0 , 0 0 0 to $ 72 , 0 0 0 , 0 0 0
Amounts Represent 2 0 Locat ions .
REVENUE DOLLARS Gaming . . . . . . . . . . . . . . . . . . . . . . . . . . . . . . . . . . . . . . . . . . . . . . . . . . 4 5 7 , 9 7 0 , 7 6 0 Rooms . . . . . . . . . . . . . . . . . . . . . . . . . . . . . . . . . . . . . . . . . . . . . . . . . . . 3 3 7 , 4 1 0 , 7 0 5 Food . . . . . . . . . . . . . . . . . . . . . . . . . . . . . . . . . . . . . . . . . . . . . . . . . . . . 164 , 2 5 1 , 14 8 Beverage . . . . . . . . . . . . . . . . . . . . . . . . . . . . . . . . . . . . . . . . . . . . . . . . 104 , 92 2 , 3 04 Other . . . . . . . . . . . . . . . . . . . . . . . . . . . . . . . . . . . . . . . . . . . . . . . . . . . 141 , 8 72 , 74 7
1 , 2 0 6 , 4 2 7 , 664 TOTAL REVENUE . . . . . . . . . . . . . . . . . . . . . . . . . . . . . . . . . . . · · · · · · · · · ·--
�������
COST OF SALES 9 6 , 7 7 8 , 4 6 8
GROSS MARGIN 1 , 1 0 9 , 64 9 , 1 9 6
DEPARTMENTAL EXPENSES . . . . . . . . . . . . . . . . . . . . . . . . . . . . . . . . . . . . . 7 15 , 0 3 9 , 4 8 7
DEPARTMENTAL INCOME ( LOSS ) 3 94 , 60 9 , 7 0 9 • • • • • • • • • • • • • • • • • • • • • • • • • • • • • • • ·----
=�.:::...:::..=...!-..:....=..::.
GENERAL AND ADMINISTRATIVE EXPENSES Advertising and Promotion . . . . . . . . . . . . . . . . . . . . . . . . . . . . . . . 18 , 3 94 , 0 90 Bad Debt Expense . . . . . . . . . . . . . . . . . . . . . . . . . . . . . . . . . . . . . . . . 6 7 0 , 8 14 Compl imentary Expense ( not reported in departments ) . . . . . . 1 1 , 5 2 3 , 0 8 5 Depreciation - Bui ldings . . . . . . . . . . . . . . . . . . . . . . . . . . . . . . . . 3 0 , 3 6 7 , 514 Depreciation and Amorti zation - Other . . . . . . . . . . . . . . . . . . . 1 0 6 , 96 7 , 2 5 2 Energy Expense ( electric ity, gas , etc . ) . . . . . . . . . . . . . . . . . 2 9 , 04 9 , 6 7 3 Equipment Rental o r Lease . . . . . . . . . . . . . . . . . . . . . . . . . . . . . . . 1 , 4 5 9 , 2 6 0 Interest Expense . . . . . . . . . . . . . . . . . . . . . . . . . . . . . . . . . . . . . . . . 24 7 , 4 5 3 , 7 0 4 Mus ic and Entertainment . . . . . . . . . . . . . . . . . . . . . . . . . . . . . . . . . 2 , 0 6 9 , 4 1 0 Payroll Taxes . . . . . . . . . . . . . . . . . . . . . . . . . . . . . . . . . . . . . . . . . . . 8 , 7 1 0 , 0 4 2 Payroll - Employee Benefits . . . . . . . . . . . . . . . . . . . . . . . . . . . . . 2 7 , 94 6 , 0 0 1 Payroll - Officers . . . . . . . . . . . . . . . . . . . . . . . . . . . . . . . . . . . . . . 9 , 4 4 4 , 6 2 6 Payroll - Other Employees . . . . . . . . . . . . . . . . . . . . . . . . . . . . . . . 7 8 , 4 93 , 6 3 8 Rent o f Premises . . . . . . . . . . . . . . . . . . . . . . . . . . . . . . . . . . . . . . . . 4 0 , 2 3 3 , 8 7 2 Taxes - Real Estate . . . . . . . . . . . . . . . . . . . . . . . . . . . . . . . . . . . . . 9 , 3 84 , 0 8 0 Taxes and Licenses - Other . . . . . . . . . . . . . . . . . . . . . . . . . . . . . . 2 , 55 9 , 2 3 5 Utilities ( Other than Energy
'Expense) . . . . . . . . . . . . . . . . . . . 1 1 , 0 7 1 , 8 13
Other General and Administrative Expenses . . . . . . . . . . . . . . . 12 9 , 9 7 3 , 7 9 1 7 6 5 , 7 7 1 , 9 0 0 TOTAL GENERAL AND ADMIN ISTRATIVE EXPENSES . . . . . . . . . . . . . . · · ·
----
����=�
NET INCOME ( LOSS ) BEFORE FEDERAL INCOME TAXES AND EXTRAORDINARY ITEMS . . . . . . . . . . . . . . . . . . . . . . . . . . . . . . . . . . . .
Average Revenue 6 0 , 3 2 1 , 3 8 3
Upper Quartile 8 9 , 3 0 0 , 116
Median 3 7 , 6 7 0 , 3 7 0
- 3 7 1 , 162 , 1 9 1
Lower Quartile 12 , 9 94 , 6 0 5
PERCENT 3 8 . 0 % 2 8 . 0 % 13 . 6 %
8 . 7% 11 . 8 %
1 0 0 . 0 %
8 . 0 %
92 . 0 %
5 9 . 3 %
3 2 . 7%
1 . 5 % 0 . 1% 1 . 0 % 2 . 5 % 8 . 9% 2 . 4 % 0 . 1%
2 0 . 5 % 0 . 2 % 0 . 7 % 2 . 3 % 0 . 8 % 6 . 5 % 3 . 3 % 0 . 8 % 0 . 2 % 0 . 9 %
1 0 . 8 % 63 . 5 %
- 3 0 . 8 %

COMBINED INCOME STATEMENT - DETAIL Fi scal Year 2 0 13 Clark County - Las Vegas Strip Area With Gaming Revenue of $ 1 , 0 0 0 , 0 0 0 to $ 72 , 0 0 0 , 0 0 0
Amounts Represent 2 0 Locations .
CASINO DEPARTMENT
REVENUE Pit Revenue { Includes Keno and Bingo) . . . . . . . . . . . . . . . . . . .
Coin Operated Devices . . . . . . . . . . . . . . . . . . . . . . . . . . . . . . . . . . . Poker and Pan . . . . . . . . . . . . . . . . . . . . . . . . . . . . . . . . . . . . . . . . . . .
Race Book . . . . . . . . . . . . . . . . . . . . . . . . . . . . . . . . . . . . . . . . . . . . . . .
Sports Pool . . . . . . . . . . . . . . . . . . . . . . . . . . . . . . . . . . . . . . . . . . . . . TOTAL REVENUE . . . . . . . . . . . . . . . . . . . . . . . . . . . . . . . . . . . . . . . . . . . . .
DEPARTMENTAL EXPENSES Bad Debt Expense . . . . . . . . . . . . . . . . . . . . . . . . . . . . . . . . . . . . . . . . Commissions . . . . . . . . . . . . . . . . . . . . . . . . . . . . . . . . . . . . . . . . . . . . .
Compl imentary Expense . . . . . . . . . . . . . . . . . . . . . . . . . . . . . . . . . . .
Gaming Taxes and Licenses . . . . . . . . . . . . . . . . . . . . . . . . . . . . . . .
Preferred Guest Expenses {no complimentaries ) . . . . . . . . . . .
Payrol l Taxes . . . . . . . . . . . . . . . . . . . . . . . . . . . . . . . . . . . . . . . . . . .
Payrol l - Employee Benefits . . . . . . . . . . . . . . . . . . . . . . . . . . . . .
Payrol l - Officers . . . . . . . . . . . . . . . . . . . . . . . . . . . . . . . . . . . . . .
Payrol l - Other Employees . . . . . . . . . . . . . . . . . . . . . . . . . . . . . . .
Race Wire Fees . . . . . . . . . . . . . . . . . . . . . . . . . . . . . . . . . . . . . . . . . .
Other Departmental Expenses . . . . . . . . . . . . . . . . . . . . . . . . . . . . .
TOTAL DEPARTMENTAL EXPENSES . . . . . . . . . . . . . . . . . . . . . . . . . . . . . . .
DEPARTMENTAL INCOME {LOSS ) . . . . . . . . . . . . . . . . . . . . . . . . . . . . . . . . .
ROOMS DEPARTMENT
REVENUE Room Sales . . . . . . . . . . . . . . . . . . . . . . . . . . . . . . . . . . . . . . . . . . . . . . Complimentary Rooms . . . . . . . . . . . . . . . . . . . . . . . . . . . . . . . . . . . . .
TOTAL REVENUE . . . . . . . . . . . . . . . . . . . . . . . . . . . . . . . . . . . . . . . . . . . . .
DEPARTMENTAL EXPENSES Bad Debt Expense . . . . . . . . . . . . . . . . . . . . . . . . . . . . . . . . . . . . . . . . Compl imentary Expense . . . . . . . . . . . . . . . . . . . . . . . . . . . . . . . . . . .
Payrol l - Taxes . . . . . . . . . . . . . . . . . . . . . . . . . . . . . . . . . . . . . . . . . Payrol l - Employee Benefits . . . . . . . . . . . . . . . . . . . . . . . . . . . . .
Payrol l - Officers . . . . . . . . . . . . . . . . . . . . . . . . . . . . . . . . . . . . . .
Payrol l - Other Employees . . . . . . . . . . . . . . . . . . . . . . . . . . . . . . .
Other Departmental Expenses . . . . . . . . . . . . . . . . . . . . . . . . . . . . .
TOTAL DEPARTMENTAL EXPENSES . . . . . . . . . . . . . . . . . . . . . . . . . . . . . . .
DEPARTMENTAL INCOME {LOSS ) . . . . . . . . . . . . . . . . . . . . . . . . . . . . . . . . .
DOLLARS 1 0 9 , 45 9 , 2 1 0 3 19 , 96 0 , 74 9
3 , 17 5 , 6 5 7 5 , 22 4 , 3 0 9
2 0 , 15 0 , 8 3 5 4 5 7 , 9 7 0 , 7 6 0
2 , 8 5 7 , 93 6 4 , 52 9 , 6 6 1
84 , 22 1 , 0 6 2 3 9 , 914 , 63 6
2 , 3 9 5 , 0 74 12 , 4 3 8 , 8 6 6 2 2 , 4 5 0 , 3 5 9
1 , 3 9 9 , 7 0 6 8 3 , 92 0 , 9 5 7
1 , 8 8 0 , 2 0 3 4 3 , 0 0 5 , 3 0 2
2 9 9 , 0 1 3 , 7 6 2
1 5 8 , 95 6 , 9 9 8
DOLLARS 2 9 9 , 02 1 , 2 6 1
3 8 , 3 8 9 , 44 4 3 3 7 , 4 1 0 , 7 0 5
1 , 14 6 , 4 4 6 4 , 6 9 8 , 8 1 8 9 , 24 1 , 5 14
2 7 , 0 0 4 , 8 6 0 53 7 , 1 3 8
7 9 , 97 9 , 3 4 0 5 6 , 914 , 2 8 5
1 7 9 , 52 2 , 4 0 1
157 , 8 8 8 , 3 04
2 - 11
PERCENT 2 3 . 9% 6 9 . 9%
0 . 7%'
1 . 1% 4 . 4 %
1 0 0 . 0 %
0 . 6% 1 . 0 %
1 8 . 4 % 8 . 7 % 0 . 5% 2 . 7% 4 . 9% 0 . 3 %
1 8 . 3 % 0 . 4 % 9 . 4 %
6 5 . 3 %
3 4 . 7 %
PERCENT 8 8 . 6 % 11 . 4 %
1 0 0 . 0 %
0 . 3 % 1 . 4 % 2 . 7 % 8 . 0 % 0 . 2 %
2 3 . 7 % 16 . 9 % 5 3 . 2 %
4 6 . 8 %

2 - 12 COMBINED INCOME STATEMENT - DETAIL ( CONTINUED)
Fiscal Year 2 0 1 3 Clark County - Las Vegas Strip Area With Gaming Revenue of $ 1 , 0 0 0 , 0 0 0 to $72 , 0 0 0 , 0 0 0
Amounts Represent 2 0 Locations .
FOOD DEPARTMENT REVENUE DOLLARS PERCENT
Food Sales 142 , 98 4 , 2 62 8 7 . 1 % Compl imentary Food Sales . . . . . . . . . . . . . . . . . . . . . . . . . . . . . . . . 2 1 , 2 6 6 , 8 8 6 12 . 9 %
TOTAL REVENUE . . . . . . . . . . . . . . . . . . . . . . . . . . . . . . . . . . . . . . . . . . . . . 1 6 4 , 2 5 1 , 1 4 8 1 0 0 . 0 %
COST OF SALES 5 3 , 68 1 , 724 3 2 . 7 %
GROSS MARGIN 1 10 , 5 6 9 , 4 2 4 6 7 . 3 %
DEPARTMENTAL EXPENSES Bad Debt Expense . . . . . . . . . . . . . . . . . . . . . . . . . . . . . . . . . . . . . . . . 2 5 , 2 3 6 0 . 0 % Compl imentary Expense . . . . . . . . . . . . . . . . . . . . . . . . . . . . . . . . . . . 2 , 0 4 5 , 6 3 9 1 . 2 % Payrol l - Taxes . . . . . . . . . . . . . . . . . . . . . . . . . . . . . . . . . . . . . . . . . 9 , 2 0 1 , 2 5 6 5 . 6 % Payrol l - Employee Benefits . . . . . . . . . . . . . . . . . . . . . . . . . . . . . 2 2 , 0 14 , 974 13 . 4 % Payrol l - Officers . . . . . . . . . . . . . . . . . . . . . . . . . . . . . . . . . . . . . . 3 , 3 4 5 , 2 3 2 2 . 0 % Payrol l - Other Employees . . . . . . . . . . . . . . . . . . . . . . . . . . . . . . . 6 5 , 8 0 6 , 1 2 0 4 0 . 1 % Other Departmental Expenses . . . . . . . . . . . . . . . . . . . . . . . . . . . . . 8 , 7 3 3 , 1 1 8 5 . 3 %
TOTAL DEPARTMENTAL EXPENSES . . . . . . . . . . . . . . . . . . . . . . . . . . . . . . . 1 1 1 , 17 1 , 5 7 5 67 . 7 %
DEPARTMENTAL INCOME ( LOSS ) . . . . . . . . . . . . . . . . . . . . . . . . . . . . . . . . . - 6 02 , 15 1 - 0 . 4 %
BEVERAGE DEPARTMENT REVENUE DOLLARS PERCENT
Beverage Sales . . . . . . . . . . . . . . . . . . . . . . . . . . . . . . . . . . . . . . . . . . 6 6 , 5 8 8 , 2 0 5 6 3 . 5 % Complimentary Beverage Sales . . . . . . . . . . . . . . . . . . . . . . . . . . . . 3 8 , 3 3 4 , 0 9 9 3 6 . 5 %
TOTAL REVENUE . . . . . . . . . . . . . . . . . . . . . . . . . . . . . . . . . . . . . . . . . . . . . 1 04 , 92 2 , 3 04 1 0 0 . 0 %
COST OF SALES 2 2 , 4 11 , 0 4 8 2 1 . 4 %
GROSS MARGIN . . . . . . . . . . . . . . . . . . . . . . . . . . . . . . . . . . . . . . . . . . . . . . 8 2 , 5 1 1 , 2 5 6 78 . 6 %
DEPARTMENTAL EXPENSES Bad Debt Expense . . . . . . . . . . . . . . . . . . . . . . . . . . . . . . . . . . . . . . . . 1 , 194 0 . 0 % Complimentary Expense . . . . . . . . . . . . . . . . . . . . . . . . . . . . . . . . . . . 2 , 9 6 5 , 4 9 5 2 . 8 % Payrol l - Taxes . . . . . . . . . . . . . . . . . . . . . . . . . . . . . . . . . . . . . . . . . 3 , 3 8 9 , 6 9 8 3 . 2 % Payroll - Employee Benefits . . . . . . . . . . . . . . . . . . . . . . . . . . . . . 6 , 7 2 2 , 1 8 5 6 . 4 % Payroll - Off icers . . . . . . . . . . . . . . . . . . . . . . . . . . . . . . . . . . . . . . 5 3 5 , 92 7 0 . 5 % Payroll - Other Employees . . . . . . . . . . . . . . . . . . . . . . . . . . . . . . . 2 1 , 9 0 3 , 1 9 8 2 0 . 9 % Other Departmental Expenses . . . . . . . . . . . . . . . . . . . . . . . . . . . . . 15 , 7 54 , 93 7 15 . 0 %
TOTAL DEPARTMENTAL EXPENSES . . . . . . . . . . . . . . . . . . . . . . . . . . . . . . . 5 1 , 2 72 , 6 3 4 4 8 . 9 %
DEPARTMENTAL INCOME ( LOSS ) . . . . . . . . . . . . . . . . . . . . . . . . . . . . . . . . . 3 1 , 2 3 8 , 6 2 2 2 9 . 8 %

COMBINED INCOME STATEMENT - DETAIL ( CONTINUED)
Fiscal Year 2 0 13 Clark County - Las Vegas Strip Area With Gaming Revenue of $ 1 , 0 0 0 , 0 0 0 to $ 72 , 0 0 0 , 0 0 0
Amounts Represent 2 0 Locations .
OTHER INCOME REVENUE
Other Operating and Non-operating Income . . . . . . . . . . . . . . . .
Other Complimentary Items . . . . . . . . . . . . . . . . . . . . . . . . . . . . . . .
TOTAL REVENUE . . . . . . . . . . . . . . . . . . . . . . . . . . . . . . . . . . . . . . . . . . . . .
COST OF SALES . . . . . . . . . . . . . . . . . . . . . . . . . . . . . . . . . . . . . . . . . . . . .
GROSS MARGIN . . . . . . . . . . . . . . . . . . . . . . . . . . . . . . . . . . . . . . . . . . . . . .
DEPARTMENTAL EXPENSES Bad Debt Expense . . . . . . . . . . . . . . . . . . . . . . . . . . . . . . . . . . . . . . . .
Complimentary Expense . . . . . . . . . . . . . . . . . . . . . . . . . . . . . . . . . . .
Payroll - Taxes . . . . . . . . . . . . . . . . . . . . . . . . . . . . . . . . . . . . . . . . .
Payroll - Employee Benefits . . . . . . . . . . . . . . . . . . . . . . . . . . . . .
Payroll - Officers . . . . . . . . . . . . . . . . . . . . . . . . . . . . . . . . . . . . . .
Payroll - Other Employees . . . . . . . . . . . . . . . . . . . . . . . . . . . . . . .
Other Departmental Expenses . . . . . . . . . . . . . . . . . . . . . . . . . . . . .
TOTAL DEPARTMENTAL EXPENSES . . . . . . . . . . . . . . . . . . . . . . . . . . . . . . .
DEPARTMENTAL INCOME ( LOSS ) . . . . . . . . . . . . . . . . . . . . . . . . . . . . . . . . .
AVERAGE NUMBER OF EMPLOYEES FOR THE YEAR
CASINO DEPARTMENT . . . . . . . . . . . . . . . . . . . . .
ROOMS DEPARTMENT . . . . . . . . . . . . . . . . . . . . . .
FOOD DEPARTMENT . . . . . . . . . . . . . . . . . . . . . . .
BEVERAGE DEPARTMENT . . . . . . . . . . . . . . . . . . .
G & A DEPARTMENT . . . . . . . . . . . . . . . . . . . . .
OTHER DEPARTMENTS . . . . . . . . . . . . . . . . . . . . .
TOTAL
DOLLARS 1 3 5 , 04 0 , 6 12
6 , 8 3 2 , 13 5 141 , 8 72 , 74 7
2 0 , 6 8 5 , 6 9 6
1 2 1 , 18 7 , 0 5 1
1 3 7 , 2 8 3 2 , 93 8 , 4 0 2 2 , 54 9 , 24 0 5 , 7 7 8 , 5 6 6
4 15 , 4 0 9 2 4 , 2 2 4 , 195 3 8 , 0 16 , 0 2 0 74 , 0 5 9 , 115
4 7 , 1 2 7 , 93 6
3 , 0 5 2 2 , 5 9 0 2 , 7 3 0 1 , 0 0 9 2 , 12 2
8 5 8
12 , 3 6 1
2 - 13
PERCENT 9 5 . 2 %
4 . 8 % 1 0 0 . 0%
14 . 6 %
8 5 . 4 %
0 . 1% 2 . 1% 1 . 8 % 4 . 1% 0 . 3 %
17 . 1% 2 6 . 8 % 5 2 . 2 %
3 3 . 2 %

2 - 14 ROOM OCCUPANCY AND PER ROOM PER DAY ANALYSIS
Fiscal Year 2 0 13 Clark County - Las Vegas Strip Area With Gaming Revenue of $ 1 , 0 0 0 , 0 0 0 to $ 7 2 , 0 0 0 , 0 0 0
Amounts Represent 2 0 Locations .
RATE OF ROOM OCCUPANCY
MONTH JULY . . . . . . . . . .
AUGUST . . . . . . . .
SEPTEMBER . . . . .
OCTOBER . . . . . . . NOVEMBER . . . . . . DECEMBER . . . . . . JANUARY . . . . . . . FEBRUARY . . . . . . MARCH . . . . . . . . . APRIL . . . . . . . . . MAY . . . . . . . . . . . JUNE . . . . . . . . . .
TOTAL . . . . . . . . .
Average Pit Revenue Per Room Per Day
Average Slot Revenue Per Room Per Day
Average Food Sales Per Room Per Day
AVAILABLE ROOMS ROOMS OCCUPIED 523 , 2 9 9 4 5 1 , 3 7 8 523 , 2 3 2 4 2 5 , 4 8 6 504 1 9 7 1 4 2 3 , 9 1 0 5 2 3 , 914 4 4 7 , 2 1 5 4 9 9 , 3 2 3 3 5 3 , 9 3 9 5 0 1 , 2 2 6 3 4 5 , 142 5 2 1 , 4 5 3 3 5 3 , 8 1 0 4 5 8 , 4 6 7 3 4 9 , 8 6 6 5 1 1 , 3 1 2 44 0 , 8 9 2 4 9 3 , 44 7 4 0 2 , 145 5 1 0 , 9 0 8 4 0 7 , 2 0 3 4 9 5 , 0 4 7 4 13 , 4 3 0
6 , 0 6 6 , 5 9 9 4 , 8 14 , 4 1 6
PER ROOM PER DAY STATISTICS
2 2 . 74
6 6 . 4 6
3 4 . 12
Average Beverage Sales Per Room Per Day
Average Rooms Department Payroll Per Room Per Day
Average Room Rate Per Day
% OF OCCUPANCY
( COMPUTED) 8 6 . 2 6 % 8 1 . 3 2 % 8 3 . 95% 85 . 3 6 % 7 0 . 8 8 % 6 8 . 8 6 % 67 . 8 5 % 76 . 3 1% 8 6 . 2 3 % 8 1 . 5 0 % 7 9 . 7 0 % 8 3 . 5 1 %
7 9 . 3 6 %-
2 1 . 7 9
2 4 . 2 5
7 0 . 0 8

PER SQUARE FOOT ANALYSIS AND RATIOS 2 - 15 Fiscal Year 2 0 1 3 Clark County - Las Vegas Strip Area With Gaming Revenue of $ 1 , 0 0 0 , 0 0 0 to $ 72 , 0 0 0 , 0 0 0
Amounts Represent 2 0 Locations .
GAMING REVENUE PER SQUARE FOOT OF FLOOR SPACE
NO . OF CASINOS AREA OPERATING
AVERAGE AREA IN SQUARE FEET
GAMING REVENUE PER SQUARE FOOT
Pit ( Includes Bingo and Keno ) 1 3 Coin Operated Devices 15 Poker and Pan 6 Race and Sports 8
TOTAL CASINO 2 0
RATIOS
6 , 514 3 1 , 0 9 6
9 2 3 6 , 0 2 4
3 0 , 24 3
TOTAL CURRENT ASSETS TO TOTAL CURRENT LIABILITIES . . . . . . . . .
TOTAL CAPITAL TO TOTAL LIABILITIES . . . . . . . . . . . . . . . . . . . . . . . .
TOTAL CAPITAL TO TOTAL CURRENT LIABILITIES . . . . . . . . . . . . . . . .
TOTAL CURRENT LIABILITIES TO TOTAL LIABILITIES . . . . . . . . . . . .
TOTAL COMPLIMENTARY EXPENSE TO GAMING REVENUE . . . . . . . . . . . . .
MUSIC AND ENTERTAINMENT EXPENSES TO GAMING REVENUE . . . . . . . .
TOTAL REVENUE TO AVERAGE TOTAL ASSETS . . . . . . . . . . . . . . . . . . . . .
TOTAL REVENUE LESS COMP SALES TO AVERAGE TOTAL ASSETS . . . . .
RETURN ON INVESTED CAPITAL* . . . . . . . . . . . . . . . . . . . . . . . . . . . . . . .
RETURN ON AVERAGE ASSETS* . . . . . . . . . . . . . . . . . . . . . . . . . . . . . . . . .
* - FORMULAS
Return on Invested Capital i s equal to the total of net income (before federal income taxes and extraordinary items ) and interest
expense divided by the total of average total assets less average current liabi lities .
1 , 1 7 9 6 8 6 4 6 4 5 0 6
PERCENT 94 . 0%
7 0 . 3 %
3 76 . 3 %
18 . 7 %
2 3 . 7 %
0 . 5 %
3 9 . 4 %
3 6 . 0 %
- 4 . 8 %
- 4 . 0 %
7 5 7
Return on Average Assets i s equal t o the total o f net income (before federal income taxes and extraordinary items ) and interest expense divided by the average total asset s .

2 - 16
THIS PAGE LEFT INTENTIONALLY BLANK

COMBINED BALANCE SHEET Fiscal Year 2 0 13 Clark County - Las Vegas Strip Area With Gaming Revenue of $ 7 2 , 0 0 0 , 0 0 0 and over
Amounts Represent 2 3 Locations .
ASSETS CURRENT ASSETS
Cash . . . . . . . . . . . . . . . . . . . . . . . . . . . . . . . . . . . . . . . . . . . . . . . . . . . . Receivables TOTAL ALLOWANCE
Casino 1 , 14 9 , 175 , 6 7 3 4 8 0 , 2 2 8 , 2 0 7 Trade 4 0 7 , 3 0 0 , 7 6 6 1 8 , 952 , 2 19 Sundry 7 , 0 8 6 , 055 , 78 2 6 6 0 , 2 4 4 Notes 0 0
Prepaid Expenses . . . . . . . . . . . . . . . . . . . . . . . . . . . . . . . . . . . . . . . . Other Current Assets . . . . . . . . . . . . . . . . . . . . . . . . . . . . . . . . . . . .
TOTAL CURRENT ASSETS . . . . . . . . . . . . . . . . . . . . . . . . . . . . . . . . . . . . . .
FIXED ASSETS COST DEPRECIATION Land 11 , 8 0 7 , 5 8 1 , 5 8 4 . . . . . . . . . . . Land Improvements 1 , 2 3 6 , 74 0 , 4 3 5 4 11 , 6 12 , 0 9 9 Buildings & Improvements 2 3 , 4 84 , 0 0 6 , 3 6 9 5 , 5 93 , 74 0 , 8 8 3 Furniture & Equipment 7 , 6 8 3 , 8 5 6 , 7 9 2 4 , 4 5 8 , 7 8 8 , 3 11 Lease Improvements 3 2 , 2 8 2 , 0 1 6 13 , 0 8 7 , 5 95 Construction in Progress 6 3 1 , 8 3 3 , 6 5 0 . . . . . . . . . . .
TOTAL FIXED ASSETS . . . . . . . . . . . . . . . . . . . . . . . . . . . . . . . . . . . . . . . .
OTHER ASSETS
TOTAL ASSETS
LIABILITIES AND CAPITAL CURRENT LIABILITIES
Accounts Payable - Trade . . . . . . . . . . . . . . . . . . . . . . . . . . . . . . . . Accounts Payable - Other . . . . . . . . . . . . . . . . . . . . . . . . . . . . . . . . Current Portion of Long-Term Debt . . . . . . . . . . . . . . . . . . . . . . . Accrued Expenses . . . . . . . . . . . . . . . . . . . . . . . . . . . . . . . . . . . . . . . . Other Current Liabilities . . . . . . . . . . . . . . . . . . . . . . . . . . . . . . .
TOTAL CURRENT LIABILITIES . . . . . . . . . . . . . . . . . . . . . . . . . . . . . . . . .
LONG-TERM DEBT Mortgages Debentures & Bonds Notes Contracts Other
TOTAL LONG-TERM DEBT OTHER LIABILITIES TOTAL LIABILITIES
CAPITAL
TOTAL OWING 10 , 16 1 , 8 7 5 , 7 0 6
2 , 6 10 , 93 0 , 5 6 4 1 , 12 0 , 3 3 1 , 5 7 2
6 , 92 2 , 8 5 8 6 , 5 19 , 2 0 4 , 5 9 0
2 0 , 4 19 , 2 6 5 , 2 90
CURRENT PORTION 0
975 , 705 , 6 8 4 14 , 0 10 , 0 0 0
3 , 4 1 1 , 2 74 4 6 , 909 , 02 7
1 , 04 0 , 0 3 5 , 985
Owners Capital Accounts . . . . . . . . . . . . . . . . . . . . . . . . . . . . . . . . . Capital Stock & Other Capital . . . . . . . . . . . . . . . . . . . . . . . . . . . Retained Earnings . . . . . . . . . . . . . . . . . . . . . . . . . . . . . . . . . . . . . . .
TOTAL CAPITAL . . . . . . . . . . . . . . . . . . . . . . . . . . . . . . . . . . . . . . . . . . . . .
TOTAL LIABILITIES AND CAPITAL . . . . . . . . . . . . . . . . . . . . . . . . . . . . . .
Average Assets 2 , 1 8 5 , 1 0 3 , 0 3 3
Upper Quarti le 3 , 4 7 7 , 9 8 0 , 193
Median 1 , 3 6 8 , 3 2 2 , 974
2 - 17
DOLLARS PERCENT 1 , 4 1 8 , 3 5 9 , 7 8 0 2 . 8 %'
6 6 8 , 94 7 , 4 6 6 1 . 3 %' 3 8 8 , 34 8 , 5 4 7 0 . 8 %'
7 , 0 8 5 , 3 9 5 , 5 3 8 1 4 . 1%'
0 0 . 0 %' 18 7 , 3 3 8 , 3 8 7 0 . 4%'
3 , 5 19 , 4 0 5 , 4 02 7 . 0 %' 13 , 2 6 7 , 7 9 5 , 1 2 0 2 6 . 4 %'
11 , 8 0 7 , 5 8 1 , 5 8 4 2 3 . 5 %' 8 2 5 , 12 8 , 3 3 6 1 . 6 %'
17 , 8 9 0 , 2 65 , 4 8 6 3 5 . 6 %' 3 , 2 2 5 , 0 6 8 , 4 8 1 6 . 4 %'
1 9 , 194 , 42 1 0 . 0 %' 6 3 1 , 8 3 3 , 6 5 0 1 . 3 %'
3 4 , 3 9 9 , 0 7 1 , 9 5 8 6 8 . 4 %'
2 , 5 9 0 , 50 2 , 6 8 6 5 . 2 %'
5 0 , 2 5 7 , 3 6 9 ! 764 1 0 0 . 0 %'
2 2 2 , 2 7 6 , 4 2 4 0 . 4%'
2 , 4 06 , 53 1 , 8 4 3 4 . 8 %' 1 , 04 0 , 0 3 5 , 9 8 5 2 . 1%
6 74 , 199 , 17 6 1 . 3 %' 4 , 15 8 , 02 3 , 92 3 8 . 3 %' 8 , 5 0 1 , 0 6 7 , 3 5 1 16 . 9%'
1 0 , 16 1 , 8 7 5 , 7 0 6 2 0 . 2 %' 1 , 6 3 5 , 22 4 , 8 8 0 3 . 3 %' 1 , 1 0 6 , 32 1 , 5 7 2 2 . 2 %'
3 , 5 11 , 5 8 4 0 . 0 %' 6 , 4 7 2 , 2 9 5 , 5 6 3 12 . 9%'
19 , 3 7 9 , 2 2 9 , 3 0 5 3 8 . 6 %' 10 , 3 3 9 , 0 1 8 , 5 8 0 2 0 . 6 %' 3 8 , 2 19 ! 3 1 5 , 2 3 6 7 6 . 0 %
- 7 , 34 0 , 3 1 0 , 5 6 6 - 14 . 6% 17 , 6 8 8 , 6 6 0 , 911 3 5 . 2 %
1 , 6 8 9 , 7 0 4 , 18 3 3 . 4 % 12 , 0 3 8 , 054 , 52 8 2 4 . 0 %
5 0 , 2 5 7 , 3 6 9 , 7 6 4 1 0 0 . 0 %
Lower Quartile 7 95 , 4 3 6 , 52 7

2 - 1 8 COMBINED INCOME STATEMENT - SUMMARY
Fiscal Year 2 0 13 Clark County - Las Vegas Strip Area With Gaming Revenue of $ 72 , 0 0 0 , 0 0 0 and over
Amounts Represent 2 3 Locations .
REVENUE Gaming Rooms . . . . . . . . . . . . . . . . . . . . . . . . . . . . . . . . . . . . . . . . . . . . . . . . . . .
Food . . . . . . . . . . . . . . . . . . . . . . . . . . . . . . . . . . . . . . . . . . . . . . . . . . . .
Beverage . . . . . . . . . . . . . . . . . . . . . . . . . . . . . . . . . . . . . . . . . . . . . . . .
Other . . . . . . . . . . . . . . . . . . . . . . . . . . . . . . . . . . . . . . . . . . . . . . . . . . . TOTAL REVENUE . . . . . . . . . . . . . . . . . . . . . . . . . . . . . . . . . . . . . . . . . . . . .
COST OF SALES
GROSS MARGIN
DEPARTMENTAL EXPENSES . . . . . . . . . . . . . . . . . . . . . . . . . . . . . . . . . . . . .
DEPARTMENTAL INCOME (LOSS ) . . . . . . . . . . . . . . . . . . . . . . . . . . . . . . . .
GENERAL AND ADMINISTRATIVE EXPENSES Advertising and Promotion . . . . . . . . . . . . . . . . . . . . . . . . . . . . . . .
Bad Debt Expense . . . . . . . . . . . . . . . . . . . . . . . . . . . . . . . . . . . . . . . .
Complimentary Expense (not reported in departments ) . . . . . .
Depreciation - Bui ldings . . . . . . . . . . . . . . . . . . . . . . . . . . . . . . . .
Depreciation and Amortization - Other . . . . . . . . . . . . . . . . . . .
Energy Expense (electricity, gas , etc . ) . . . . . . . . . . . . . . . . .
Equipment Rental or Lease . . . . . . . . . . . . . . . . . . . . . . . . . . . . . . .
Interest Expense . . . . . . . . . . . . . . . . . . . . . . . . . . . . . . . . . . . . . . . .
Music and Entertainment . . . . . . . . . . . . . . . . . . . . . . . . . . . . . . . . . Payrol l Taxes . . . . . . . . . . . . . . . . . . . . . . . . . . . . . . . . . . . . . . . . . . .
Payrol l - Employee Benefits . . . . . . . . . . . . . . . . . . . . . . . . . . . . .
Payrol l - Officers . . . . . . . . . . . . . . . . . . . . . . . . . . . . . . . . . . . . . .
Payrol l - Other Employees . . . . . . . . . . . . . . . . . . . . . . . . . . . . . . .
Rent of Premises . . . . . . . . . . . . . . . . . . . . . . . . . . . . . . . . . . . . . . . .
Taxes - Real Estate . . . . . . . . . . . . . . . . . . . . . . . . . . . . . . . . . . . . .
Taxes and Licenses - Other . . . . . . . . . . . . . . . . . . . . . . . . . . . . . .
Uti l ities (Other than Energy Expense) . . . . . . . . . . . . . . . . . . .
Other General and Administrative Expenses . . . . . . . . . . . . . . .
DOLLARS 5 , 2 9 3 , 6 7 5 , 0 6 3 3 , 5 9 1 , 3 3 5 , 6 7 9 2 , 2 4 9 , 7 7 5 , 0 3 0 1 , 0 8 9 , 3 44 , 4 3 0 2 , 10 8 , 0 6 2 , 5 1 0
14 , 3 3 2 , 192 , 712
9 7 9 , 3 4 1 , 8 2 3
1 3 , 3 5 2 , 8 5 0 , 8 8 9
7 , 52 1 , 6 7 2 , 2 2 6
5 , 8 3 1 , 1 7 8 , 6 6 3
1 7 4 , 95 6 , 0 0 1 2 , 5 8 2 , 15 3
4 6 , 6 7 9 , 4 94 9 6 0 , 5 1 0 , 5 5 0 7 2 4 , 6 5 2 , 3 8 2 1 7 7 , 5 92 , 3 1 2
4 , 0 0 1 , 8 3 1 2 , 3 4 6 , 1 3 0 , 72 9
2 82 , 04 7 , 14 5 55 , 4 8 6 , 7 3 8
2 3 2 , 3 4 7 , 7 2 5 1 1 , 4 4 7 , 5 4 3
6 2 3 , 11 3 , 9 8 7 1 3 , 2 0 2 , 3 0 6
1 4 5 , 0 18 , 4 0 6 3 0 , 64 2 , 2 3 2 6 8 , 5 8 8 , 3 6 5
1 , 0 5 7 , 5 9 7 , 0 2 2 6 , 9 5 6 , 5 9 6 , 92 1 TOTAL GENERAL AND ADMINISTRATIVE EXPENSES . . . . . . . . . . . . . . . · · --�������
NET INCOME (LOSS) BEFORE FEDERAL INCOME TAXES AND EXTRAORDINARY ITEMS . . . . . . . . . . . . . . . . . . . . . . . . . . . . . . . . . . . . - 1 , 12 5 , 4 18 , 2 5 8
Average Revenue 6 2 3 , 13 8 , 8 14
Upper Quartile 1 , 02 7 , 7 5 1 , 6 2 5
Median 3 8 0 , 74 6 , 962
Lower Quartile 2 9 1 , 177 , 4 3 7
PERCENT 3 6 . 9% 2 5 . 1% 15 . 7 %
7 . 6 % 14 . 7 %
1 0 0 . 0 %
6 . 8 %
9 3 . 2 %
52 . 5 %
4 0 . 7 %
1 . 2 % 0 . 0 % 0 . 3 % 6 . 7 % 5 . 1 % 1 . 2 % 0 . 0 %
1 6 . 4 % 2 . 0 % 0 . 4 % 1 . 6 % 0 . 1% 4 . 3 % 0 . 1% 1 . 0 % 0 . 2 % 0 . 5 % 7 . 4 %
4 8 . 5 %
- 7 . 9%

COMBINED INCOME STATEMENT - DETAIL 2 - 1 9 Fiscal Year 2 0 1 3 Clark County - Las Vegas Strip Area With Gaming Revenue of $ 72 , 0 0 0 , 0 0 0 and over
Amounts Represent 2 3 Locations .
CASINO DEPARTMENT
REVENUE DOLLARS PERCENT Pit Revenue ( Includes Keno and Bingo ) . . . . . . . . . . . . . . . . . . . 2 , 56 8 , 6 8 9 , 8 2 3 4 8 . 5% Coin Operated Devices . . . . . . . . . . . . . . . . . . . . . . . . . . . . . . . . . . . 2 , 55 7 , 5 52 , 53 3 4 8 . 3 % Poker and Pan . . . . . . . . . . . . . . . . . . . . . . . . . . . . . . . . . . . . . . . . . . . 9 8 , 5 8 4 , 1 4 6 1 . 9 % Race Book . . . . . . . . . . . . . . . . . . . . . . . . . . . . . . . . . . . . . . . . . . . . . . . 2 2 , 7 6 8 , 5 2 4 0 . 4 % Sports Pool . . . . . . . . . . . . . . . . . . . . . . . . . . . . . . . . . . . . . . . . . . . . . 4 6 , 0 8 0 , 0 3 7 0 . 9%
TOTAL REVENUE . . . . . . . . . . . . . . . . . . . . . . . . . . . . . . . . . . . . . . . . . . . . . 5 , 2 9 3 , 6 7 5 , 0 6 3 1 0 0 . 0 %
DEPARTMENTAL EXPENSES Bad Debt Expense . . . . . . . . . . . . . . . . . . . . . . . . . . . . . . . . . . . . . . . . 1 3 7 , 84 1 , 3 4 1 2 . 6 % Commis sions . . . . . . . . . . . . . . . . . . . . . . . . . . . . . . . . . . . . . . . . . . . . . 5 , 14 0 , 1 4 3 0 . 1% Complimentary Expense . . . . . . . . . . . . . . . . . . . . . . . . . . . . . . . . . . . 1 , 4 0 3 , 74 2 , 2 3 9 2 6 . 5 % Gaming Taxes and Licenses . . . . . . . . . . . . . . . . . . . . . . . . . . . . . . . 3 9 3 , 3 7 0 , 5 8 3 7 . 4 % Preferred Guest Expenses ( no compl imentaries ) . . . . . . . . . . . 2 14 , 6 19 , 5 9 1 4 . 1% Payrol l Taxes . . . . . . . . . . . . . . . . . . . . . . . . . . . . . . . . . . . . . . . . . . . 1 0 1 , 0 0 6 , 9 1 6 1 . 9 % Payrol l - Employee Benefits . . . . . . . . . . . . . . . . . . . . . . . . . . . . . 1 7 3 , 8 6 3 , 9 9 8 3 . 3 % Payrol l - O f ficers . . . . . . . . . . . . . . . . . . . . . . . . . . . . . . . . . . . . . . 12 , 73 2 , 4 5 5 0 . 2 % Payrol l - Other Employees . . . . . . . . . . . . . . . . . . . . . . . . . . . . . . . 6 6 1 , 2 3 1 , 5 3 7 12 . 5% Race Wire Fees . . . . . . . . . . . . . . . . . . . . . . . . . . . . . . . . . . . . . . . . . . 4 , 8 7 6 , 7 1 6 0 . 1% Other Departmental Expenses . . . . . . . . . . . . . . . . . . . . . . . . . . . . . 4 2 0 , 8 2 9 , 5 6 4 7 . 9%
TOTAL DEPARTMENTAL EXPENSES . . . . . . . . . . . . . . . . . . . . . . . . . . . . . . . 3 , 52 9 , 2 5 5 , 0 8 3 6 6 . 7%
DEPARTMENTAL INCOME ( LOSS ) . . . . . . . . . . . . . . . . . . . . . . . . . . . . . . . . . 1 , 76 4 , 4 1 9 , 9 8 0 3 3 . 3 %
ROOMS DEPARTMENT
REVENUE DOLLARS PERCENT Room Sales . . . . . . . . . . . . . . . . . . . . . . . . . . . . . . . . . . . . . . . . . . . . . . 2 , 8 8 3 , 9 2 2 , 10 8 8 0 . 3 % Complimentary Rooms . . . . . . . . . . . . . . . . . . . . . . . . . . . . . . . . . . . . . 7 0 7 , 4 1 3 , 5 7 1 1 9 . 7 %
TOTAL REVENUE . . . . . . . . . . . . . . . . . . . . . . . . . . . . . . . . . . . . . . . . . . . . . 3 , 5 9 1 , 3 3 5 , 6 7 9 1 0 0 . 0 %
DEPARTMENTAL EXPENSES Bad Debt Expense . . . . . . . . . . . . . . . . . . . . . . . . . . . . . . . . . . . . . . . . 12 , 55 0 , 7 4 2 0 . 3 % Compl imentary Expense . . . . . . . . . . . . . . . . . . . . . . . . . . . . . . . . . . . 1 0 9 , 0 5 9 , 8 8 9 3 . 0 % Payrol l - Taxes . . . . . . . . . . . . . . . . . . . . . . . . . . . . . . . . . . . . . . . . . 6 6 , 5 3 8 , 4 82 1 . 8 % Payrol l - Employee Benefits . . . . . . . . . . . . . . . . . . . . . . . . . . . . . 1 9 3 , 3 3 8 , 0 6 7 5 . 3 % Payrol l - Of ficers . . . . . . . . . . . . . . . . . . . . . . . . . . . . . . . . . . . . . . 2 , 44 3 , 2 3 0 0 . 1% Payrol l - Other Employees . . . . . . . . . . . . . . . . . . . . . . . . . . . . . . . 64 0 , 2 54 , 1 0 4 1 7 . 8 % Other Departmental Expenses . . . . . . . . . . . . . . . . . . . . . . . . . . . . . 4 0 1 , 8 1 0 , 7 6 4 1 1 . 2 %
TOTAL DEPARTMENTAL EXPENSES . . . . . . . . . . . . . . . . . . . . . . . . . . . . . . . 1 , 4 2 5 , 9 95 ! 2 7 8 3 9 . 7 %
DEPARTMENTAL INCOME ( LOSS ) . . . . . . . . . . . . . . . . . . . . . . . . . . . . . . . . . 2 , 16 5 , 3 4 0 , 4 0 1 6 0 . 3 %
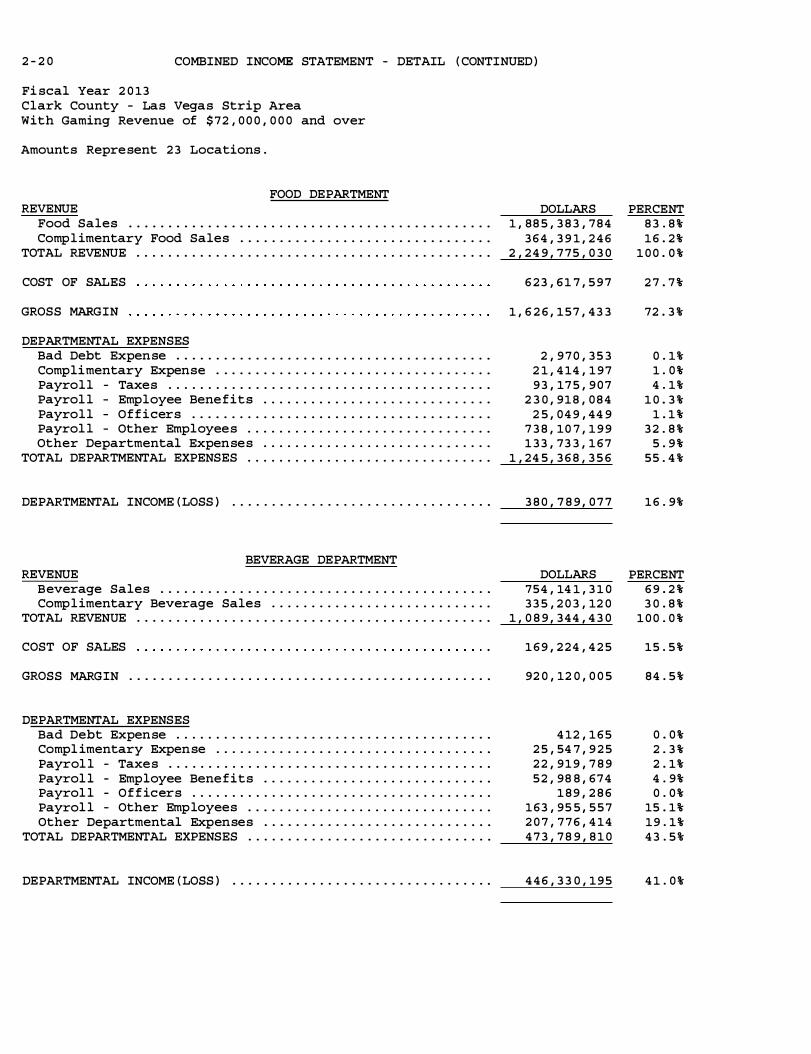
2 - 2 0 COMBINED INCOME STATEMENT - DETAIL ( CONTINUED )
Fiscal Year 2 0 13 Clark County - Las Vegas Strip Area With Gaming Revenue of $ 72 , 0 0 0 , 0 0 0 and over
Amounts Represent 2 3 Locations .
FOOD DEPARTMENT REVENUE DOLLARS PERCENT
Food Sales . . . . . . . . . . . . . . . . . . . . . . . . . . . . . . . . . . . . . . . . . . . . . . 1 , 88 5 , 3 8 3 , 7 8 4 8 3 . 8 % Complimentary Food Sales . . . . . . . . . . . . . . . . . . . . . . . . . . . . . . . . 3 6 4 , 3 9 1 , 2 4 6 1 6 . 2 %
TOTAL REVENUE . . . . . . . . . . . . . . . . . . . . . . . . . . . . . . . . . . . . . . . . . . . . . 2 , 2 4 9 , 7 75 , 0 3 0 1 0 0 . 0 %
COST OF SALES 6 2 3 , 6 1 7 , 5 9 7 2 7 . 7 %
GROSS MARGIN 1 , 6 2 6 , 1 5 7 , 4 3 3 72 . 3 %
DEPARTMENTAL EXPENSES Bad Debt Expense . . . . . . . . . . . . . . . . . . . . . . . . . . . . . . . . . . . . . . . . 2 , 9 7 0 , 3 5 3 0 . 1% Complimentary Expense . . . . . . . . . . . . . . . . . . . . . . . . . . . . . . . . . . . 2 1 , 4 14 , 1 9 7 1 . 0 % Payroll - Taxes . . . . . . . . . . . . . . . . . . . . . . . . . . . . . . . . . . . . . . . . . 9 3 , 17 5 , 9 0 7 4 . 1% Payrol l - Employee Benefits . . . . . . . . . . . . . . . . . . . . . . . . . . . . . 2 3 0 , 9 1 8 , 0 8 4 1 0 . 3 % Payroll - Officers . . . . . . . . . . . . . . . . . . . . . . . . . . . . . . . . . . . . . . 2 5 , 0 4 9 , 44 9 1 . 1 % Payrol l - Other Employees . . . . . . . . . . . . . . . . . . . . . . . . . . . . . . . 7 3 8 , 10 7 , 1 9 9 3 2 . 8 % Other Departmental Expenses . . . . . . . . . . . . . . . . . . . . . . . . . . . . . 1 3 3 , 73 3 , 1 6 7 5 . 9 %
TOTAL DEPARTMENTAL EXPENSES . . . . . . . . . . . . . . . . . . . . . . . . . . . . . . . 1 , 24 5 , 3 6 8 , 3 5 6 55 . 4 %
DEPARTMENTAL INCOME ( LOSS ) . . . . . . . . . . . . . . . . . . . . . . . . . . . . . . . . . 3 8 0 , 7 8 9 , 0 7 7 1 6 . 9%
BEVERAGE DEPARTMENT REVENUE DOLLARS PERCENT
Beverage Sales . . . . . . . . . . . . . . . . . . . . . . . . . . . . . . . . . . . . . . . . . . 754 , 14 1 , 3 1 0 6 9 . 2 % Complimentary Beverage Sales . . . . . . . . . . . . . . . . . . . . . . . . . . . . 3 3 5 , 2 0 3 , 12 0 3 0 . 8 %
TOTAL REVENUE . . . . . . . . . . . . . . . . . . . . . . . . . . . . . . . . . . . . . . . . . . . . . 1 , 0 8 9 , 3 4 4 , 4 3 0 1 0 0 . 0 %
COST OF SALES 1 6 9 , 2 2 4 , 4 2 5 15 . 5 %
GROSS MARGIN . . . . . . . . . . . . . . . . . . . . . . . . . . . . . . . . . . . . . . . . . . . . . . 92 0 , 12 0 , 0 0 5 84 . 5 %
DEPARTMENTAL EXPENSES Bad Debt Expense . . . . . . . . . . . . . . . . . . . . . . . . . . . . . . . . . . . . . . . . 4 12 , 1 6 5 0 . 0 % Compl imentary Expense . . . . . . . . . . . . . . . . . . . . . . . . . . . . . . . . . . . 2 5 , 54 7 , 9 2 5 2 . 3 % Payrol l - Taxes . . . . . . . . . . . . . . . . . . . . . . . . . . . . . . . . . . . . . . . . . 2 2 , 9 1 9 , 7 8 9 2 . 1% Payrol l - Employee Benefits . . . . . . . . . . . . . . . . . . . . . . . . . . . . . 5 2 , 98 8 , 674 4 . 9% Payrol l - Officers . . . . . . . . . . . . . . . . . . . . . . . . . . . . . . . . . . . , . . . 1 8 9 , 2 8 6 0 . 0 % Payrol l - Other Employees . . . . . . . . . . . . . . . . . . . . . . . . . . . . . . . 163 , 95 5 , 5 5 7 15 . 1% Other Departmental Expenses . . . . . . . . . . . . . . . . . . . . . . . . . . . . . 2 0 7 , 7 7 6 , 4 14 1 9 . 1%
TOTAL DEPARTMENTAL EXPENSES . . . . . . . . . . . . . . . . . . . . . . . . . . . . . . . 4 7 3 , 7 8 9 , 8 1 0 4 3 . 5 %
DEPARTMENTAL INCOME ( LOSS ) . . . . . . . . . . . . . . . . . . . . . . . . . . . . . . . . . 4 4 6 , 3 3 0 , 1 9 5 4 1 . 0 %

COMBINED INCOME STATEMENT - DETAIL { CONTINUED)
Fiscal Year 2 0 13 Clark County - Las Vegas Strip Area With Gaming Revenue of $ 72 , 0 0 0 , 0 0 0 and over
Amounts Represent 2 3 Locations .
OTHER INCOME REVENUE
Other Operating and Non-operating Income . . . . . . . . . . . . . . . .
Other Complimentary Items . . . . . . . . . . . . . . . . . . . . . . . . . . . . . . .
TOTAL REVENUE . . . . . . . . . . . . . . . . . . . . . . . . . . . . . . . . . . . . . . . . . . . . .
COST OF SALES . . . . . . . . . . . . . . . . . . . . . . . . . . . . . . . . . . . . . . . . . . . . .
GROSS MARGIN . . . . . . . . . . . . . . . . . . . . . . . . . . . . . . . . . . . . . . . . . . . . . .
DEPARTMENTAL EXPENSES Bad Debt Expense . . . . . . . . . . . . . . . . . . . . . . . . . . . . . . . . . . . . . . . .
Complimentary Expense . . . . . . . . . . . . . . . . . . . . . . . . . . . . . . . . . . .
Payrol l - Taxes . . . . . . . . . . . . . . . . . . . . . . . . . . . . . . . . . . . . . . . . .
Payrol l - Employee Benefits . . . . . . . . . . . . . . . . . . . . . . . . . . . . . Payrol l - Officers . . . . . . . . . . . . . . . . . . . . . . . . . . . . . . . . . . . . . .
Payrol l - Other Employees . . . . . . . . . . . . . . . . . . . . . . . . . . . . . . . Other Departmental Expenses . . . . . . . . . . . . . . . . . . . . . . . . . . . . .
TOTAL DEPARTMENTAL EXPENSES . . . . . . . . . . . . . . . . . . . . . . . . . . . . . . .
DEPARTMENTAL INCOME { LOSS ) . . . . . . . . . . . . . . . . . . . . . . . . . . . . . . . . .
AVERAGE NUMBER OF EMPLOYEES FOR THE YEAR
CASINO DEPARTMENT ROOMS DEPARTMENT . . . . . . . . . . . . . . . . . . . . . .
FOOD DEPARTMENT . . . . . . . . . . . . . . . . . . . . . . .
BEVERAGE DEPARTMENT . . . . . . . . . . . . . . . . . . .
G & A DEPARTMENT . . . . . . . . . . . . . . . . . . . . .
OTHER DEPARTMENTS . . . . . . . . . . . . . . . . . . . . .
TOTAL
DOLLARS 2 , 0 18 , 59 9 , 0 9 6
8 9 , 4 6 3 , 4 14 2 , 1 0 8 , 0 62 , 5 1 0
1 8 6 , 4 9 9 , 8 0 1
1 , 9 2 1 , 562 , 7 0 9
3 , 7 6 7 , 153 1 9 , 104 , 4 4 4 3 1 , 8 3 4 , 44 0 5 8 , 2 8 6 , 6 2 6
2 , 572 , 4 8 5 3 2 0 , 5 8 6 , 8 0 2 4 1 1 , 111 , 74 9 8 4 7 , 2 6 3 , 6 9 9
1 , 0 74 , 2 9 9 , 0 1 0
2 0 , 0 1 0 1 8 , 3 2 1 2 1 , 2 0 0
5 , 3 04 14 , 170
8 , 3 66
8 7 , 3 7 1
2 - 2 1
PERCENT 9 5 . 8 %
4 . 2 % 1 0 0 . 0 %
8 . 8 %
91 . 2 %
0 . 2 % 0 . 9% 1 . 5 % 2 . 8 % 0 . 1%-
15 . 2 % 1 9 . 5 % 4 0 . 2 %
5 1 . 0 %

2 - 2 2 ROOM OCCUPANCY AND PER ROOM PER DAY ANALYSIS
Fiscal Year 2 0 13 Clark County - Las Vegas Strip Area With Gaming Revenue of $ 72 , 0 0 0 , 0 0 0 and over
Amounts Represent 2 3 Locations .
RATE OF ROOM OCCUPANCY
MONTH JULY . . . . . . . . . . AUGUST . . . . . . . . SEPTEMBER . . . . .
OCTOBER . . . . . . .
NOVEMBER . . . . . . DECEMBER . . . . . . JANUARY . . . . . . . FEBRUARY . . . . . . MARCH . . . . . . . . . APRIL . . . . . . . . . MAY . . . . . . . . . . . JUNE . . . . . . . . . .
TOTAL . . . . . . . . .
Average Pit Revenue Per Room Per Day
Average Slot Revenue Per Room Per Day
Average Food Sales Per Room Per Day
AVAILABLE ROOMS ROOMS OCCUPIED
2 , 2 54 , 2 8 1 2 , 119 , 1 3 9 2 , 2 3 7 , 1 0 2 2 , 0 3 6 , 184 2 , 172 , 0 0 2 2 , 0 2 0 , 7 3 7 2 , 2 5 8 , 9 2 3 2 , 160 , 0 12 2 , 164 , 6 9 9 1 , 9 0 1 , 6 0 5 2 , 2 3 6 , 4 5 7 1 , 8 7 8 , 5 7 6 2 , 2 6 1 , 915 2 , 0 1 2 , 155 2 , 04 0 , 2 3 2 1 , 8 8 3 , 78 9 2 , 2 8 1 , 3 4 0 2 , 17 1 , 7 0 7 2 , 2 0 9 , 7 8 7 2 , 103 , 3 9 0 2 , 2 84 , 7 7 7 2 , 159 , 62 7 2 , 2 1 5 , 7 2 3 2 , 114 , 54 8
2 6 , 6 17 , 2 3 8 2 4 , 5 6 1 , 4 6 9
PER ROOM PER DAY STATISTICS
104 . 5 8
104 . 13
9 1 . 6 0
Average Beverage Sales Per Room Per Day
Average Rooms Department Payrol l Per Room Per Day
Average Room Rate Per Day
% OF OCCUPANCY
( COMPUTED) 94 . 0 1 % 9 1 . 0 2 % 9 3 . 04 % 95 . 62 % 8 7 . 8 5 % 84 . 0 0 % 8 8 . 9 6 % 92 . 3 3 % 95 . 1 9% 95 . 1 9 % 94 . 52 % 95 . 4 3 %
92 . 2 8 %
44 . 3 5
3 6 . 7 5
14 6 . 2 2

PER SQUARE FOOT ANALYSIS AND RATIOS 2 - 2 3 Fiscal Year 2 0 13 Clark County - Las Vegas Strip Area With Gaming Revenue of $ 72 , 0 0 0 , 0 0 0 and over
Amounts Represent 2 3 Locations .
GAMING REVENUE PER SQUARE FOOT OF FLOOR SPACE
NO . OF CASINOS AVERAGE AREA GAMING REVENUE AREA OPERATING IN SQUARE FEET PER
Pit ( Includes Bingo and Keno ) 2 3 2 4 , 7 3 2 Coin Operated Devices 2 3 7 2 , 9 8 4 Poker and Pan 1 9 4 , 15 8 Race and Sports 2 1 6 , 118
TOTAL CASINO 2 3 1 0 6 , 73 7
RATIOS
TOTAL CURRENT ASSETS TO TOTAL CURRENT LIABILITIES . . . . . . . . .
TOTAL CAPITAL TO TOTAL LIABILITIES . . . . . . . . . . . . . . . . . . . . . . . .
TOTAL CAPITAL TO TOTAL CURRENT LIABILITIES . . . . . . . . . . . . . . . .
TOTAL CURRENT LIABILITIES TO TOTAL LIABILITIES . . . . . . . . . . . .
TOTAL COMPLIMENTARY EXPENSE TO GAMING REVENUE . . . . . . . . . . . . .
MUSIC AND ENTERTAINMENT EXPENSES TO GAMING REVENUE . . . . . . . .
TOTAL REVENUE TO AVERAGE TOTAL ASSETS . . . . . . . . . . . . . . . . . . . . .
TOTAL REVENUE LESS COMP SALES TO AVERAGE TOTAL ASSETS . . . . .
RETURN ON INVESTED CAPITAL* . . . . . . . . . . . . . . . . . . . . . . . . . . . . . . .
RETURN ON AVERAGE ASSETS* . . . . . . . . . . . . . . . . . . . . . . . . . . . . . . . . .
* - FORMULAS
Return on Invested Capital i s equal to the total of net income (before federal income taxes and extraordinary items ) and interest
expense divided by the total of average total assets less average current liabil ities .
SQUARE FOOT
4 , 5 1 6 1 , 5 2 4 1 , 2 4 8
5 3 6
2 , 15 6
PERCENT 1 5 6 . 1%
3 1 . 5 %
1 4 1 . 6 %
2 2 . 2 %
3 0 . 7 %
5 . 3 %
2 5 . 9%'
2 3 . 2 %'
3 . 1%'
2 . 2 %'
Return on Average Assets i s equal to the total o f net income (be fore federal income taxes and extraordinary items ) and interest expense divided by the average total assets .

2 - 2 4
THIS PAGE LEFT INTENTIONALLY BLANK

COMBINED BALANCE SHEET Fi scal Year 2 0 13 C lark County - Downtown Las Vegas Area With Gaming Revenue of $ 1 , 0 0 0 , 0 0 0 and over
Amounts Represent 16 Locations .
ASSETS CURRENT ASSETS
Cash . . . . . . . . . . . . . . . . . . . . . . . . . . . . . . . . . . . . . . . . . . . . . . . . . . . .
Receivables TOTAL ALLOWANCE Casino Trade Sundry Notes
7 , 122 , 754 1 0 , 63 6 , 4 7 0 2 7 , 182 , 7 9 7
0
1 , 724 , 1 0 8 3 8 9 , 7 2 5
5 0 0 0
Prepaid Expenses . . . . . . . . . . . . . . . . . . . . . . . . . . . . . . . . . . . . . . . .
Other Current Assets . . . . . . . . . . . . . . . . . . . . . . . . . . . . . . . . . . . .
TOTAL CURRENT ASSETS . . . . . . . . . . . . . . . . . . . . . . . . . . . . . . . . . . . . . .
FIXED ASSETS Land
COST 5 8 9 , 6 0 2 , 92 8
DEPRECIATION
Land Improvements 6 , 6 04 , 6 5 2 2 , 6 0 7 , 8 4 1 Buildings & Improvements 9 3 0 , 4 94 , 0 3 1 2 8 4 , 90 8 , 5 2 1 Furniture & Equipment 4 12 , 4 2 4 , 2 7 8 3 3 5 , 5 3 9 , 6 3 2 Lease Improvements 2 6 , 2 6 7 , 4 7 4 4 , 8 6 9 , 3 58 Construction in Progress 10 , 7 3 5 , 3 0 1 . . . . . . . . . . .
TOTAL FIXED ASSETS . . . . . . . . . . . . . . . . . . . . . . . . . . . . . . . . . . . . . . . .
OTHER ASSETS
TOTAL ASSETS
LIABILITIES AND CAPITAL CURRENT LIABILITIES
Accounts Payable - Trade . . . . . . . . . . . . . . . . . . . . . . . . . . . . . . . .
Accounts Payable - Other . . . . . . . . . . . . . . . . . . . . . . . . . . . . . . . . Current Portion of Long-Term Debt . . . . . . . . . . . . . . . . . . . . . . .
Accrued Expenses . . . . . . . . . . . . . . . . . . . . . . . . . . . . . . . . . . . . . . . .
Other Current Liabilities . . . . . . . . . . . . . . . . . . . . . . . . . . . . . . .
TOTAL CURRENT LIABILITIES . . . . . . . . . . . . . . . . . . . . . . . . . . . . . . . . .
LONG-TERM DEBT Mortgages Debentures & Bonds
TOTAL OWING 2 , 7 92 , 52 4
0
CURRENT PORTION 3 0 7 , 5 2 1
0 Notes 4 3 2 , 7 9 6 , 4 3 9 3 4 4 , 8 7 0 , 34 2 Contracts 3 0 4 , 0 0 2 2 6 6 , 5 0 2 Other 92 , 8 3 7 , 0 6 4 1 , 5 2 1 , 24 8
TOTAL LONG-TERM DEBT 5 2 8 , 73 0 , 0 2 9 3 4 6 , 96 5 , 6 13 OTHER LIABILITIES . . . . . . . . . . . . . . . . . . . . . . . . . . . . . . . . . . . . . . . . .
TOTAL LIABILITIES
CAPITAL Owners Capital Accounts . . . . . . . . . . . . . . . . . . . . . . . . . . . . . . . . .
Capital Stock & Other Capital . . . . . . . . . . . . . . . . . . . . . . . . . . . Retained Earnings . . . . . . . . . . . . . . . . . . . . . . . . . . . . . . . . . . . . . . .
TOTAL CAPITAL . . . . . . . . . . . . . . . . . . . . . . . . . . . . . . . . . . . . . . . . . . . . .
TOTAL LIABILITIES AND CAPITAL . . . . . . . . . . . . . . . . . . . . . . . . . . . . . .
Average Assets 14 6 , 63 5 , 103
Upper Quartile 134 , 974 , 0 0 5
Median 3 3 , 3 7 6 , 8 7 0
2 - 2 5
DOLLARS PERCENT 5 7 , 653 , 2 3 4
5 , 3 98 , 64 6 10 , 2 4 6 , 7 4 5 2 7 , 182 , 2 9 7
0 16 , 354 , 9 3 1
3 0 0 , 4 8 7 , 4 1 5 4 17 , 32 3 , 2 6 8
5 8 9 , 602 , 92 8 3 , 996 , 8 11
6 4 5 , 58 5 , 5 1 0 7 6 , 8 8 4 , 6 4 6 2 1 , 3 9 8 , 116 1 0 , 73 5 , 3 0 1
1 , 3 4 8 , 2 0 3 , 3 12
5 8 0 , 6 3 5 ! 0 6 1
2 , 3 4 6 ! 16 1 , 6 4 1
2 1 , 4 8 5 , 5 7 1 6 , 72 9 , 6 2 2
3 4 6 , 965 , 6 13 7 1 , 2 2 7 , 3 2 3
2 3 9 , 813 , 8 9 6 6 8 6 , 22 2 , 0 2 5
2 , 4 8 5 , 0 0 3 0
8 7 , 92 6 , 0 9 7 3 7 , 5 0 0
9 1 , 3 15 , 8 1 6 181 , 7 64 , 4 1 6
13 , 14 3 , 92 1 8 8 1 , 13 0 , 3 6 2
1 , 194 , 92 6 , 5 0 2 8 , 6 7 9 , 2 9 6
2 6 1 , 4 2 5 , 4 8 1 1 , 4 6 5 , 03 1 , 2 7 9
2 , 3 4 6 , 1 6 1 , 6 4 1
Lower Quartile 5 , 9 7 9 , 4 94
2 . 5%
0 . 2 % 0 . 4 % 1 . 2 % 0 . 0 % 0 . 7 %
12 . 8 % 1 7 . 8 %
2 5 . 1% 0 . 2 %
2 7 . 5% 3 . 3 % 0 . 9% 0 . 5 %
5 7 . 5%
2 4 . 7%
1 0 0 . 0 %
0 . 9% 0 . 3 %
14 . 8 % 3 . 0%
1 0 . 2 % 2 9 . 2 %
0 . 1% 0 . 0 % 3 . 7 % 0 . 0% 3 . 9% 7 . 7 % 0 . 6 %
3 7 . 6%
5 0 . 9% 0 . 4 %
11 . 1% 6 2 . 4 %
1 0 0 . 0 %

2 - 2 6 COMBINED INCOME STATEMENT - SUMMARY
Fiscal Year 2 0 13 Clark County - Downtown Las Vegas Area With Gaming Revenue of $ 1 , 0 0 0 , 0 0 0 and over
Amounts Represent 16 Locations .
REVENUE DOLLARS PERCENT Gaming . . . . . . . . . . . . . . . . . . . . . . . . . . . . . . . . . . . . . . . . . . . . . . . . . . 5 0 5 , 8 9 6 , 7 0 6 Rooms . . . . . . . . . . . . . . . . . . . . . . . . . . . . . . . . . . . . . . . . . . . . . . . . . . . 15 6 , 0 7 7 , 975 Food . . . . . . . . . . . . . . . . . . . . . . . . . . . . . . . . . . . . . . . . . . . . . . . . . . . . 14 1 , 0 8 3 , 7 8 9 Beverage . . . . . . . . . . . . . . . . . . . . . . . . . . . . . . . . . . . . . . . . . . . . . . . . 7 8 , 92 8 , 5 9 6 Other . . . . . . . . . . . . . . . . . . . . . . . . . . . . . . . . . . . . . . . . . . . . . . . . . . . 5 9 , 4 5 5 , 1 5 9
94 1 , 4 4 2 , 2 2 5 TOTAL REVENUE . . . . . . . . . . . . . . . . . . . . . . . . . . . . . . · · · · · · · · · · · · · · · ----����==�
COST OF SALES 7 6 , 5 8 5 , 4 8 4
GROSS MARGIN 8 64 , 8 5 6 , 74 1
DEPARTMENTAL EXPENSES . . . . . . . . . . . . . . . . . . . . . . . . . . . . . . . . . . . . . 5 13 , 7 0 9 , 6 9 1
DEPARTMENTAL INCOME (LOSS) 3 5 1 , 14 7 , 0 5 0 . . . . . . · · · · · · · · · • . . . . . . . . . . . . · · · · ----=.=:.L..:::..=....:....L=�
GENERAL AND ADMIN ISTRATIVE EXPENSES Advert ising and Promotion . . . . . . . . . . . . . . . . . . . . . . . . . . . . . . . 12 , 5 54 , 0 8 4 Bad Debt Expense . . . . . . . . . . . . . . . . . . . . . . . . . . . . . . . . . . . . . . . . 3 , 9 1 0 Compl imentary Expense (not reported i n departments ) . . . . . . 2 9 , 8 1 6 , 9 1 9 Depreciation - Buildings . . . . . . . . . . . . . . . . . . . . . . . . . . . . . . . . 2 6 , 7 8 0 , 0 4 4 Depreciation and Amorti zation - Other . . . . . . . . . . . . . . . . . . . 3 0 , 1 0 6 , 1 1 2 Energy Expense (electricity , gas , etc . ) . . . . . . . . . . . . . . . . . 1 9 , 6 5 9 , 4 7 7 Equipment Rental or Lease . . . . . . . . . . . . . . . . . . . . . . . . . . . . . . . 112 , 9 7 7 Interest Expense . . . . . . . . . . . . . . . . . . . . . . . . . . . . . . . . . . . . . . . . 6 5 , 5 5 3 , 3 5 5 Music and Entertainment . . . . . . . . . . . . . . . . . . . . . . . . . . . . . . . . . 4 7 6 , 7 5 9 Payroll Taxes . . . . . . . . . . . . . . . . . . . . . . . . . . . . . . . . . . . . . . . . . . . 6 , 4 2 9 , 5 0 8 Payroll - Employee Benefits . . . . . . . . . . . . . . . . . . . . . . . . . . . . . 1 7 , 0 7 5 , 5 0 5 Payrol l - Officers . . . . . . . . . . . . . . . . . . . . . . . . . . . . . . . . . . . . . . 4 , 3 12 , 5 3 2 Payroll - Other Employees . . . . . . . . . . . . . . . . . . . . . . . . . . . . . . . 6 8 , 9 8 5 , 2 4 2 Rent o f Premises . . . . . . . . . . . . . . . . . . . . . . . . . . . . . . . . . . . . . . . . 6 , 7 9 3 , 3 1 9 Taxes - Real Estate . . . . . . . . . . . . . . . . . . . . . . . . . . . . . . . . . . . . . 5 , 5 0 6 , 5 7 2 Taxes and Licenses - Other . . . . . . . . . . . . . . . . . . . . . . . . . . . . . . 3 , 6 9 1 , 12 0 Uti l ities (Other than Energy Expense) . . . . . . . . . . . . . . . . . . . 6 , 6 8 9 , 3 5 4 O ther General and Administrative Expenses . . . . . . . . . . . . . . . 64 , 4 5 5 , 3 1 9
3 6 9 , 0 0 2 , 1 0 8 TOTAL GENERAL AND ADMIN ISTRATIVE EXPENSES . . . . . . . . . . . . · · · · · ----=�=���
NET INCOME (LOSS ) BEFORE FEDERAL INCOME TAXES AND EXTRAORDINARY ITEMS . . . . . . . . . . . . . . . . . . . . . . . . . . . . . . . . . . . .
Average Revenue 58 , 84 0 , 1 3 9
Upper Quart ile 7 1 , 9 0 2 , 925
Median 4 8 , 53 4 , 4 1 9
- 1 7 , 8 5 5 , 0 5 8
Lower Quartile 8 , 9 94 , 64 0
5 3 . 7 % 16 . 6 % 15 . 0 %
8 . 4 % 6 . 3 %
1 0 0 . 0 %
8 . 1%
9 1 . 9 %
54 . 6 %
3 7 . 3 %
1 . 3 % 0 . 0 % 3 . 2 % 2 . 8 % 3 . 2 % 2 . 1% 0 . 0 % 7 . 0 % 0 . 1% 0 . 7 % 1 . 8 % 0 . 5 % 7 . 3 % 0 . 7% 0 . 6 % 0 . 4 % 0 . 7 % 6 . 8 %
3 9 . 2 %
- 1 . 9%

COMBINED INCOME STATEMENT - DETAIL Fiscal Year 2 0 13 Clark County - Downtown Las Vegas Area With Gaming Revenue of $ 1 , 0 0 0 , 0 0 0 and over
Amounts Represent 1 6 Locations .
CASINO DEPARTMENT
REVENUE Pit Revenue ( Includes Keno and Bingo) . . . . . . . . . . . . . . . . . . .
Coin Operated Devices . . . . . . . . . . . . . . . . . . . . . . . . . . . . . . . . . . .
Poker and Pan . . . . . . . . . . . . . . . . . . . . . . . . . . . . . . . . . . . . . . . . . . .
Race Book . . . . . . . . . . . . . . . . . . . . . . . . . . . . . . . . . . . . . . . . . . . . . . .
Sports Pool . . . . . . . . . . . . . . . . . . . . . . . . . . . . . . . . . . . . . . . . . . . . .
TOTAL REVENUE . . . . . . . . . . . . . . . . . . . . . . . . . . . . . . . . . . . . . . . . . . . . .
DEPARTMENTAL EXPENSES Bad Debt Expense . . . . . . . . . . . . . . . . . . . . . . . . . . . . . . . . . . . . . . . .
Commissions . . . . . . . . . . . . . . . . . . . . . . . . . . . . . . . . . . . . . . . . . . . . .
Complimentary Expense . . . . . . . . . . . . . . . . . . . . . . . . . . . . . . . . . . . Gaming Taxes and Licenses . . . . . . . . . . . . . . . . . . . . . . . . . . . . . . .
Preferred Guest Expenses (no complimentaries ) . . . . . . . . . . .
Payrol l Taxes . . . . . . . . . . . . . . . . . . . . . . . . . . . . . . . . . . . . . . . . . . .
Payrol l - Employee Benefits . . . . . . . . . . . . . . . . . . . . . . . . . . . . .
Payrol l - Officers . . . . . . . . . . . . . . . . . . . . . . . . . . . . . . . . . . . . . . Payroll - Other Employees . . . . . . . . . . . . . . . . . . . . . . . . . . . . . . .
Race Wire Fees . . . . . . . . . . . . . . . . . . . . . . . . . . . . . . . . . . . . . . . . . .
Other Departmental Expenses . . . . . . . . . . . . . . . . . . . . . . . . . . . . .
TOTAL DEPARTMENTAL EXPENSES . . . . . . . . . . . . . . . . . . . . . . . . . . . . . . .
DEPARTMENTAL INCOME (LOSS ) . . . . . . . . . . . . . . . . . . . . . . . . . . . . . . . . .
ROOMS DEPARTMENT
REVENUE Room Sales . . . . . . . . . . . . . . . . . . . . . . . . . . . . . . . . . . . . . . . . . . . . . .
Complimentary Rooms . . . . . . . . . . . . . . . . . . . . . . . . . . . . . . . . . . . . .
TOTAL REVENUE . . . . . . . . . . . . . . . . . . . . . . . . . . . . . . . . . . . . . . . . . . . . .
DEPARTMENTAL EXPENSES Bad Debt Expense . . . . . . . . . . . . . . . . . . . . . . . . . . . . . . . . . . . . . . . .
Complimentary Expense . . . . . . . . . . . . . . . . . . . . . . . . . . . . . . . . . . . Payroll - Taxes . . . . . . . . . . . . . . . . . . . . . . . . . . . . . . . . . . . . . . . . .
Payroll - Employee Benefits . . . . . . . . . . . . . . . . . . . . . . . . . . . . . Payrol l - Officers . . . . . . . . . . . . . . . . . . . . . . . . . . . . . . . . . . . . . .
Payroll - Other Employees . . . . . . . . . . . . . . . . . . . . . . . . . . . . . . .
Other Departmental Expenses . . . . . . . . . . . . . . . . . . . . . . . . . . . . .
TOTAL DEPARTMENTAL EXPENSES . . . . . . . . . . . . . . . . . . . . . . . . . . . . . . .
DEPARTMENTAL INCOME (LOS S ) . . . . . . . . . . . . . . . . . . . . . . . . . . . . . . . . .
2 - 2 7
DOLLARS PERCENT 115 , 7 8 8 , 3 2 0 2 2 . 9% 3 7 6 , 73 1 , 8 4 1 74 . 5 %
5 , 8 0 4 , 4 14 1 . 1% 1 , 4 8 2 , 0 7 9 0 . 3 % 6 , 0 9 0 , 0 5 2 1 . 2 %
5 0 5 , 8 96 , 7 0 6 1 0 0 . 0 %
9 1 , 4 7 3 0 . 0 % 15 , 3 2 6 , 93 9 3 . 0 % 5 7 , 4 74 , 8 3 6 11 . 4 % 3 9 , 4 9 9 , 8 8 2 7 . 8 %
4 , 99 0 , 5 7 1 1 . 0 % 9 , 8 4 9 , 3 1 0 1 . 9 %
16 , 55 3 , 0 8 9 3 . 3 % 0 0 . 0 %
7 0 , 8 8 9 , 135 14 . 0 % 2 2 8 , 4 72 0 . 0 %
4 1 , 0 9 7 , 2 4 7 8 . 1% 2 5 6 , 0 0 0 , 954 5 0 . 6 %
2 4 9 , 8 9 5 , 7 5 2 4 9 . 4 %
DOLLARS PERCENT 12 1 , 4 9 9 , 6 7 9 7 7 . 8 %
3 4 , 5 7 8 , 2 9 6 2 2 . 2 % 15 6 , 0 7 7 , 9 7 5 1 0 0 . 0 %
4 4 3 , 7 7 6 0 . 3 % 4 , 0 5 1 , 9 5 1 2 . 6 % 4 , 8 8 7 , 2 9 3 3 . 1%
16 , 8 6 9 , 0 4 0 1 0 . 8 % 0 0 . 0 %
4 9 , 6 9 7 , 0 3 8 3 1 . 8 % 2 4 , 3 2 6 , 2 7 7 15 . 6 %
1 0 0 , 2 7 5 , 3 7 5 64 . 2 %
55 , 8 0 2 , 6 0 0 3 5 . 8 %

2 - 2 8 COMBINED INCOME STATEMENT - DETAIL ( CONTINUED)
Fiscal Year 2 0 1 3 Clark County - Downtown Las Vegas Area With Gaming Revenue of $ 1 , 0 0 0 , 0 0 0 and over
Amounts Represent 16 Locations .
FOOD DEPARTMENT REVENUE
Food Sales Compl imentary Food Sales . . . . . . . . . . . . . . . . . . . . . . . . . . . . . . . .
TOTAL REVENUE . . . . . . . . . . . . . . . . . . . . . . . . . . . . . . . . . . . . . . . . . . . . .
COST OF SALES
GROSS MARGIN
DEPARTMENTAL EXPENSES Bad Debt Expense . . . . . . . . . . . . . . . . . . . . . . . . . . . . . . . . . . . . . . . . Complimentary Expense . . . . . . . . . . . . . . . . . . . . . . . . . . . . . . . . . . .
Payrol l - Taxes . . . . . . . . . . . . . . . . . . . . . . . . . . . . . . . . . . . . . . . . . Payrol l - Employee Benef its . . . . . . . . . . . . . . . . . . . . . . . . . . . . . Payrol l - Officers . . . . . . . . . . . . . . . . . . . . . . . . . . . . . . . . . . . . . . Payrol l - Other Employees . . . . . . . . . . . . . . . . . . . . . . . . . . . . . . . Other Departmental Expenses . . . . . . . . . . . . . . . . . . . . . . . . . . . . .
TOTAL DEPARTMENTAL EXPENSES . . . . . . . . . . . . . . . . . . . . . . . . . . . . . . .
DEPARTMENTAL INCOME ( LOSS ) . . . . . . . . . . . . . . . . . . . . . . . . . . . . . . . . .
BEVERAGE DEPARTMENT REVENUE
Beverage Sales . . . . . . . . . . . . . . . . . . . . . . . . . . . . . . . . . . . . . . . . . .
Compl imentary Beverage Sales . . . . . . . . . . . . . . . . . . . . . . . . . . . .
TOTAL REVENUE . . . . . . . . . . . . . . . . . . . . . . . . . . . . . . . . . . . . . . . . . . . . .
COST OF SALES
GROSS MARGIN . . . . . . . . . . . . . . . . . . . . . . . . . . . . . . . . . . . . . . . . . . . . . .
DEPARTMENTAL EXPENSES Bad Debt Expense . . . . . . . . . . . . . . . . . . . . . . . . . . . . . . . . . . . . . . . .
Compl imentary Expense . . . . . . . . . . . . . . . . . . . . . . . . . . . . . . . . . . . Payrol l - Taxes . . . . . . . . . . . . . . . . . . . . . . . . . . . . . . . . . . . . . . . . .
Payroll - Employee Benefits . . . . . . . . . . . . . . . . . . . . . . . . . . . . .
Payrol l - Officers . . . . . . . . . . . . . . . . . . . . . . . . . . . . . . . . . . . . . . Payrol l - Other Employees . . . . . . . . . . . . . . . . . . . . . . . . . . . . . . .
Other Departmental Expenses . . . . . . . . . . . . . . . . . . . . . . . . . . . . .
TOTAL DEPARTMENTAL EXPENSES . . . . . . . . . . . . . . . . . . . . . . . . . . . . . . .
DEPARTMENTAL INCOME ( LOSS ) . . . . . . . . . . . . . . . . . . . . . . . . . . . . . . . . .
DOLLARS 115 , 7 95 , 2 5 3
2 5 , 2 8 8 , 5 3 6 14 1 , 0 8 3 , 7 8 9
5 0 , 952 , 2 4 3
90 , 13 1 , 5 4 6
1 , 9 0 0 5 5 3 , 4 9 5
6 , 6 8 7 , 7 6 0 2 3 , 3 5 6 , 5 6 7
0 6 1 , 3 3 4 , 4 8 3
5 , 6 0 3 , 6 8 2 9 7 , 5 3 7 , 8 8 7
- 7 , 4 0 6 , 3 4 1
DOLLARS 4 7 , 5 1 8 , 3 8 2 3 1 , 4 1 0 1 2 14 7 8 , 9 2 8 , 5 9 6
2 0 , 3 8 8 , 5 3 4
58 , 54 0 , 0 6 2
0 3 3 4 , 2 2 2
2 , 4 4 5 , 2 0 6 7 , 82 1 , 1 3 2
0 18 , 9 93 , 5 5 0
5 , 7 6 6 , 9 2 0 3 5 , 3 6 1 , 0 3 0
2 3 , 1 7 9 , 0 3 2
PERCENT 8 2 . 1% 1 7 . 9%
1 0 0 . 0 %
3 6 . 1 %
6 3 . 9 %
0 . 0 % 0 . 4 % 4 . 7 %
1 6 . 6 % 0 . 0 %
4 3 . 5 % 4 . 0 %
6 9 . 1%
- 5 . 2 %
PERCENT 6 0 . 2 % 3 9 . 8 %
1 0 0 . 0 %
2 5 . 8 %
74 . 2 %
0 . 0 % 0 . 4 % 3 . 1% 9 . 9 % 0 . 0 %
2 4 . 1% 7 . 3 %
4 4 . 8 %
2 9 . 4 %

COMBINED INCOME STATEMENT - DETAIL ( CONTINUED)
Fiscal Year 2 0 13 Clark County - Downtown Las Vegas Area With Gaming Revenue of $ 1 , 0 0 0 , 0 0 0 and over
Amounts Represent 1 6 Locations .
OTHER INCOME REVENUE
Other Operating and Non- operating Income . . . . . . . . . . . . . . . .
Other Complimentary Items . . . . . . . . . . . . . . . . . . . . . . . . . . . . . . .
TOTAL REVENUE . . . . . . . . . . . . . . . . . . . . . . . . . . . . . . . . . . . . . . . . . . . . .
COST OF SALES . . . . . . . . . . . . . . . . . . . . . . . . . . . . . . . . . . . . . . . . . . . . .
GROSS MARGIN . . . . . . . . . . . . . . . . . . . . . . . . . . . . . . . . . . . . . . . . . . . . . .
DEPARTMENTAL EXPENSES Bad Debt Expense . . . . . . . . . . . . . . . . . . . . . . . . . . . . . . . . . . . . . . . .
Complimentary Expense . . . . . . . . . . . . . . . . . . . . . . . . . . . . . . . . . . .
Payroll - Taxes . . . . . . . . . . . . . . . . . . . . . . . . . . . . . . . . . . . . . . . . .
Payroll - Employee Benefits . . . . . . . . . . . . . . . . . . . . . . . . . . . . .
Payroll - Officers . . . . . . . . . . . . . . . . . . . . . . . . . . . . . . . . . . . . . .
Payroll - Other Employees . . . . . . . . . . . . . . . . . . . . . . . . . . . . . . .
Other Departmental Expenses . . . . . . . . . . . . . . . . . . . . . . . . . . . . .
TOTAL DEPARTMENTAL EXPENSES . . . . . . . . . . . . . . . . . . . . . . . . . . . . . . .
DEPARTMENTAL INCOME (LOS S ) . . . . . . . . . . . . . . . . . . . . . . . . . . . . . . . . .
AVERAGE NUMBER OF EMPLOYEES FOR THE YEAR
CASINO DEPARTMENT . . . . . . . . . . . . . . . . . . . . .
ROOMS DEPARTMENT . . . . . . . . . . . . . . . . . . . . . .
FOOD DEPARTMENT . . . . . . . . . . . . . . . . . . . . . . .
BEVERAGE DEPARTMENT . . . . . . . . . . . . . . . . . . .
G & A DEPARTMENT . . . . . . . . . . . . . . . . . . . . . OTHER DEPARTMENTS . . . . . . . . . . . . . . . . . . . . .
TOTAL
DOLLARS 5 7 , 2 3 2 , 1 3 8
2 , 22 3 , 0 2 1 5 9 , 455 , 159
5 , 24 4 , 7 0 7
54 , 2 10 , 4 52
- 63 8 3 7 6 , 6 9 2
1 , 172 , 52 8 1 , 9 7 9 , 64 9
0 12 , 04 2 , 613
8 , 9 63 , 6 0 1 2 4 , 5 3 4 , 4 4 5
2 9 , 6 7 6 , 0 0 7
2 , 995 1 , 6 2 0 2 , 119
7 7 0 1 , 8 4 8
4 14
9 , 7 6 6
2 - 2 9
PERCENT 9 6 . 3 %-
3 . 7%-1 0 0 . 0 %-
8 . 8 %
9 1 . 2 %-
0 . 0 %-0 . 6 %-2 . 0 %-3 . 3 %-0 . 0 %-
2 0 . 3 %-15 . 1%-4 1 . 3 %-
4 9 . 9%-

2 - 3 0 ROOM OCCUPANCY AND PER ROOM PER DAY ANALYSIS
Fiscal Year 2 0 1 3 Clark County - Downtown Las Vegas Area With Gaming Revenue of $ 1 , 0 0 0 , 0 0 0 and over
Amounts Represent 16 Locations .
RATE OF ROOM OCCUPANCY
MONTH JULY .. . . . . . . . . . AUGUST . . . . . . . . SEPTEMBER . . . . . OCTOBER . . . . . . . NOVEMBER . . . . . . DECEMBER . . .. . . . JANUARY . . . . . . . FEBRUARY . . . . . . MARCH . . . . . . . . . APRIL . . . . . . . . . MAY . . . . . . . . . . . JUNE . . . . . . . . . .
TOTAL . . . . . . . . .
Average Pit Revenue Per Room Per Day
Average Slot Revenue Per Room Per Day
Average Food Sales Per Room Per Day
AVAILABLE ROOMS ROOMS OCCUPIED 2 9 1 , 8 7 5 2 4 8 , 52 0 2 8 7 , 9 2 8 2 3 5 , 4 7 7 2 8 1 , 7 1 0 2 4 1 , 3 4 0 2 8 9 , 126 2 5 0 , 6 4 1 2 7 5 , 2 9 9 2 02 , 5 2 2 2 8 4 , 6 11 2 0 0 , 0 6 9 2 8 5 , 3 15 2 11 , 0 0 3 2 5 9 , 6 3 0 2 02 , 8 6 8 2 93 , 972 2 5 0 , 1 1 8 2 8 3 , 8 4 7 2 3 5 , 4 5 7 2 7 7 , 153 2 3 7 , 9 8 7 2 7 0 , 175 2 3 6 , 2 2 8
3 , 3 8 0 , 64 1 2 , 7 52 , 2 3 0
PER ROOM PER DAY STATISTICS
4 2 . 0 7
1 3 6 . 8 8
5 1 . 2 6
Average Beverage Sales Per Room Per Day
Average Rooms Department Payrol l Per Room Per Day
Average Room Rate Per Day
% OF OCCUPANCY
(COMPUTED ) 8 5 . 15 % 8 1 . 7 8 % 8 5 . 6 7 % 8 6 . 6 9 % 7 3 . 5 6 % 7 0 . 3 0 % 7 3 . 95% 7 8 . 14 % 8 5 . 0 8 % 8 2 . 95% 8 5 . 8 7 % 8 7 . 4 4 %
8 1 . 4 1 %
2 8 . 6 8
2 5 . 9 6
5 6 . 7 1

PER SQUARE FOOT ANALYSIS AND RATIOS Fiscal Year 2 0 13 Clark County - Downtown Las Vegas Area With Gaming Revenue of $ 1 , 0 0 0 , 0 0 0 and over
Amounts Represent 16 Locations .
GAMING REVENUE PER SQUARE FOOT OF FLOOR SPACE
2 - 3 1
NO . OF CASINOS AREA OPERATING
AVERAGE AREA IN SQUARE FEET
GAMING REVENUE PER SQUARE FOOT
Pit ( Includes Bingo and Keno ) 12 Coin Operated Devices 15 Poker and Pan 4 Race and Sports 6
TOTAL CASINO 1 6
RATIOS
6 , 1 9 0 2 7 , 5 1 1
1 , 764 1 , 8 5 7
3 1 , 5 7 1
TOTAL CURRENT ASSETS TO TOTAL CURRENT LIABILITIES . . . . . . . . .
TOTAL CAPITAL TO TOTAL LIABILITIES . . . . . . . . . . . . . . . . . . . . . . . .
TOTAL CAPITAL TO TOTAL CURRENT LIABILITIES . . . . . . . . . . . . . . . .
TOTAL CURRENT LIABILITIES TO TOTAL LIABILITIES . . . . . . . . . . . .
TOTAL COMPLIMENTARY EXPENSE TO GAMING REVENUE . . . . . . . . . . . . .
MUSIC AND ENTERTAINMENT EXPENSES TO GAMING REVENUE . . . . . . . .
TOTAL REVENUE TO AVERAGE TOTAL ASSETS . . . . . . . . . . . . . . . . . . . . .
TOTAL REVENUE LESS COMP SALES TO AVERAGE TOTAL ASSETS . . . . .
RETURN ON INVESTED CAPITAL* . . . . . . . . . . . . . . . . . . . . . . . . . . . . . . .
RETURN ON AVERAGE ASSETS * . . . . . . . . . . . . . . . . . . . . . . . . . . . . . . . . .
* - FORMULAS
Return on Invested Capital is equal to the total of net income (before federal income taxes and extraordinary items ) and interest expense divided by the total of average total assets less average current liabilities .
1 , 5 5 8 9 1 3 8 2 3 6 8 0
1 , 0 0 2
PERCENT 6 0 . 8 %-
1 6 6 . 3 %-
2 1 3 . 5 %-
77 . 9%-
18 . 3 %-
0 . 1%-
4 0 . 6%-
3 6 . 6 %-
3 . 3 %
2 . 1%-
Return on Average Assets is equal to the total of net income (before federal income taxes and extraordinary items ) and interest expense divided by the average total assets .

2 - 3 2
THIS PAGE LEFT INTENTIONALLY BLANK

COMBINED BALANCE SHEET Fiscal Year 2 0 13 C lark County - Downtown Las Vegas Area With Gaming Revenue of $ 1 , 0 0 0 , 0 0 0 to $ 12 , 0 0 0 , 0 0 0
Amounts Represent 5 Locations .
ASSETS CURRENT ASSETS
Cash . . . . . . . . . . . . . . . . . . . . . . . . . . . . . . . . . . . . . . . . . . . . . . . . . . . .
Receivables TOTAL ALLOWANCE Casino 4 2 , 4 4 4 7 , 0 2 4 Trade 1 0 8 , 2 8 7 5 2 , 4 11 Sundry 5 , 8 7 7 , 7 9 9 0 Notes 0 0
Prepaid Expenses . . . . . . . . . . . . . . . . . . . . . . . . . . . . . . . . . . . . . . . .
Other Current Assets . . . . . . . . . . . . . . . . . . . . . . . . . . . . . . . . . . . .
TOTAL CURRENT ASSETS . . . . . . . . . . . . . . . . . . . . . . . . . . . . . . . . . . . . . .
FIXED ASSETS Land
COST 0
Land Improvements 0 Buildings & Improvements 9 3 1 , 1 8 6 Furniture & Equipment 5 , 0 74 , 92 9 Lease Improvements 0
DEPRECIATION
0 1 0 3 , 5 0 4
4 , 12 3 , 4 7 2 0
Construction in Progres s 2 , 0 0 0 . . . . . . . . . . .
TOTAL FIXED ASSETS . . . . . . . . . . . . . . . . . . . . . . . . . . . . . . . . . . . . . . . .
OTHER ASSETS
TOTAL ASSETS
LIABILITIES AND CAPITAL CURRENT LIABILITIES
Accounts Payabl e - Trade . . . . . . . . . . . . . . . . . . . . . . . . . . . . . . . .
Accounts Payabl e - Other . . . . . . . . . . . . . . . . . . . . . . . . . . . . . . . .
Current Portion of Long-Term Debt . . . . . . . . . . . . . . . . . . . . . . .
Accrued Expenses . . . . . . . . . . . . . . . . . . . . . . . . . . . . . . . . . . . . . . . .
Other Current Liabilities . . . . . . . . . . . . . . . . . . . . . . . . . . . . . . .
TOTAL CURRENT LIABILITIES . . . . . . . . . . . . . . . . . . . . . . . . . . . . . . . . .
LONG- TERM DEBT Mortgages Debentures & Bonds Notes Contracts Other
TOTAL LONG-TERM DEBT
TOTAL OWING 2 , 3 9 7 , 3 98
0 0 0 0
2 , 3 97 , 3 98
CURRENT PORTION 1 3 , 6 5 5
0 0 0 0
1 3 , 6 5 5 OTHER LIABILITIES . . . . . . . . . . . . . . . . . . . . . . . . . . . . . . . . . . . . . . . . .
TOTAL LIABILITIES
CAPITAL Owners Capital Accounts . . . . . . . . . . . . . . . . . . . . . . . . . . . . . . . . .
Capital Stock & Other · capital . . . . . . . . . . . . . . . . . . . . . . . . . . .
Retained Earnings . . . . . . . . . . . . . . . . . . . . . . . . . . . . . . . . . . . . . . .
TOTAL CAPITAL . . . . . . . . . . . . . . . . . . . . . . . . . . . . . . . . . . . . . . . . . . . . .
TOTAL LIABILITIES AND CAPITAL . . . . . . . . . . . . . . . . . . . . . . . . . . . . . .
Average Assets 4 , 2 0 2 , 3 1 9
Upper Quartile Median 4 , 2 0 2 , 3 19
2 - 3 3
DOLLARS PERCENT 2 , 18 7 , 0 2 9 1 0 . 4 %
3 5 , 4 2 0 0 . 2 % 5 5 , 8 7 6 0 . 3 %
5 , 8 7 7 , 7 9 9 2 8 . 0% 0 0 . 0 %
92 9 , 2 19 4 . 4 % 2 2 7 , 4 6 2 1 . 1%
9 , 3 12 , 8 0 5 4 4 . 3 %
0 0 . 0% 0 0 . 0 %
8 2 7 , 682 3 . 9% 9 5 1 , 4 5 7 4 . 5%
0 0 . 0 % 2 , 0 0 0 0 . 0 %
1 , 7 8 1 , 13 9 8 . 5 %
9 , 917 , 6 5 1 4 7 . 2 %
2 1 , 0 1 1 , 5 9 5 1 0 0 . 0 %
3 7 6 , 4 4 7 1 . 8% 3 2 , 7 2 3 0 . 2 % 1 3 , 655 0 . 1%
1 6 6 , 4 4 4 0 . 8 % 15 , 6 52 , 0 14 74 . 5% 16 , 24 1 , 2 8 3 7 7 . 3 %
2 , 3 8 3 , 74 3 1 1 . 3 % 0 0 . 0 % 0 0 . 0 % 0 0 . 0 % 0 0 . 0 %
2 , 3 8 3 , 74 3 1 1 . 3 % 522 , 4 1 6 2 . 5%
1 9 , 14 7 , 4 4 2 9 1 . 1 %
5 , 5 54 , 6 0 2 2 6 . 4 % - 5 , 2 5 7 , 58 7 - 2 5 . 0 %
1 , 5 6 7 , 13 8 7 . 5 % 1 , 8 6 4 , 153 8 . 9%
2 1 , 0 1 1 , 5 9 5 1 0 0 . 0%
Lower Quartile

2 - 3 4 COMBINED INCOME STATEMENT - SUMMARY
Fiscal Year 2 0 1 3 Clark County - Downtown Las Vegas Area With Gaming Revenue of $ 1 , 0 0 0 , 0 0 0 to $ 12 , 0 0 0 , 0 0 0
Amounts Represent 5 Locations .
REVENUE DOLLARS Gaming . . . . . . . . . . . . . . . . . . . . . . . . . . . . . . . . . . . . . . . . . . . . . . . . . . 1 7 , 7 94 , 0 6 2 Rooms . . . . . . . . . . . . . . . . . . . . . . . . . . . . . . . . . . . . . . . . . . . . . . . . . . . 8 7 9 , 8 0 6 Food . . . . . . . . . . . . . . . . . . . . . . . . . . . . . . . . . . . . . . . . . . . . . . . . . . . . 8 3 9 , 7 8 1 Beverage . . . . . . . . . . . . . . . . . . . . . . . . . . . . . . . . . . . . . . . . . . . . . . . . 4 , 3 8 6 , 4 55 Other . . . . . . . . . . . . . . . . . . . . . . . . . . . . . . . . . . . . . . . . . . . . . . . . . . . 4 8 1 , 4 3 2
2 4 , 3 8 1 , 5 3 6 TOTAL REVENUE . . . . . . . . . . . . . . . . . . . . . . . . . . . . . . . . . . . . . . . . . . . · ·----
������
COST OF SALES 1 , 6 9 7 , 3 2 9
GROSS MARGIN 2 2 , 6 8 4 , 2 0 7
DEPARTMENTAL EXPENSES . . . . . . . . . . . . . . . . . . . . . . . . . . . . . . . . . . . . . 1 3 , 8 9 9 , 52 9
DEPARTMENTAL INCOME ( LOSS ) 8 , 7 8 4 , 6 7 8 • • • • • • • • • • • • • • • • • • • • • • • • • • • • • • • • ______ .:::....!......:....:::...=....!......::....:....=.
GENERAL AND ADMINISTRATIVE EXPENSES Advertising and Promotion . . . . . . . . . . . . . . . . . . . . . . . . . . . . . . . 2 1 1 , 0 3 4 Bad Debt Expense . . . . . . . . . . . . . . . . . . . . . . . . . . . . . . . . . . . . . . . . 0 Complimentary Expense (not reported in department s ) . . . . . . 8 , 6 6 7 Depreciation - Bui ldings . . . . . . . . . . . . . . . . . . . . . . . . . . . . . . . . 4 0 5 , 2 2 2 Depreciation and Amorti zation - Other . . . . . . . . . . . . . . . . . . . 2 6 7 , 8 3 9 Energy Expense ( electricity , gas , etc . ) . . . . . . . . . . . . . . . . . 8 7 7 , 4 0 6 Equipment Rental o r Lease . . . . . . . . . . . . . . . . . . . . . . . . . . . . . . . 9 , 2 8 6 Interest Expense . . . . . . . . . . . . . . . . . . . . . . . . . . . . . . . . . . . . . . . . 115 , 6 2 2 Music and Entertainment . . . . . . . . . . . . . . . . . . . . . . . . . . . . . . . . . 0 Payroll Taxes . . . . . . . . . . . . . . . . . . . . . . . . . . . . . . . . . . . . . . . . . . . 2 1 5 , 6 8 6 Payroll - Employee Benefits . . . . . . . . . . . . . . . . . . . . . . . . . . . . . 3 12 , 4 56 Payroll - Officers . . . . . . . . . . . . . . . . . . . . . . . . . . . . . . . . . . . . . . 1 5 0 , 0 0 0 Payroll - Other Employees . . . . . . . . . . . . . . . . . . . . . . . . . . . . . . . 1 , 7 0 1 , 0 8 7 Rent o f Premises . . . . . . . . . . . . . . . . . . . . . . . . . . . . . . . . . . . . . . . . - 1 , 5 3 1 , 1 6 1 Taxes - Real Estate . . . . . . . . . . . . . . . . . . . . . . . . . . . . . . . . . . . . . 3 7 , 4 74 Taxes and Licenses - Other . . . . . . . . . . . . . . . . . . . . . . . . . . . . . . 2 7 1 , 2 6 8 Ut i lities ( Other than Energy Expense ) . . . . . . . . . . . . . . . . . . . 3 2 4 , 6 7 9 Other General and Admini strative Expenses . . . . . . . . . . . . . . . 1 , 7 1 6 , 4 2 8
5 , 0 9 2 , 9 9 3 TOTAL GENERAL AND ADMINISTRATIVE EXPENSES . . . . . . . . . · · · · · · · ·
------
����-=-
NET INCOME ( LOSS ) BEFORE FEDERAL INCOME TAXES AND EXTRAORDINARY ITEMS . . . . . . . . . . . . . . . . . . . . . . . . . . . . . . . . . . . .
Average Revenue 4 , 8 7 6 , 3 0 7
Upper Quartile Median 4 , 8 7 6 , 3 0 7
3 , 6 9 1 , 6 8 5
Lower Quart ile
PERCENT 73 . 0 %
3 . 6 % 3 . 4 %
18 . 0 % 2 . 0 %
1 0 0 . 0 %
7 . 0 %
93 . 0 %
5 7 . 0 %
3 6 . 0 %
0 . 9 % 0 . 0 % 0 . 0 % 1 . 7% 1 . 1% 3 . 6 % 0 . 0 % 0 . 5 % 0 . 0 % 0 . 9% 1 . 3 % 0 . 6 % 7 . 0 %
- 6 . 3 % 0 . 2 % 1 . 1% 1 . 3 % 7 . 0 %
2 0 . 9%
15 . 1%
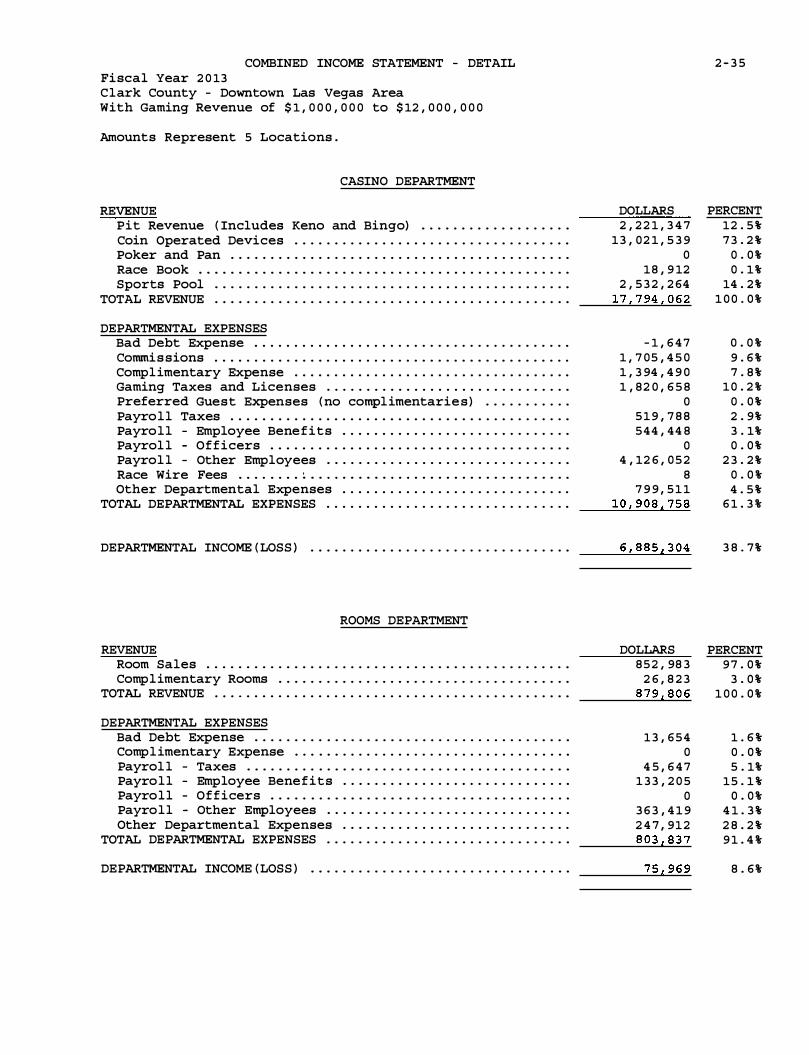
COMBINED INCOME STATEMENT - DETAIL 2 - 3 5 Fiscal Year 2 0 13 Clark County - Downtown Las Vegas Area With Gaming Revenue of $ 1 , 0 0 0 , 0 0 0 to $ 12 , 0 0 0 , 0 0 0
Amounts Represent 5 Locations .
CASINO DEPARTMENT
REVENUE DOLLARS PERCENT Pit Revenue ( Includes Keno and Bingo) . . . . . . . . . . . . . . . . . . . 2 , 2 2 1 , 3 4 7 12 . 5 % Coin Operated Devices . . . . . . . . . . . . . . . . . . . . . . . . . . . . . . . . . . . 1 3 , 02 1 , 5 3 9 7 3 . 2 % Poker and Pan . . . . . . . . . . . . . . . . . . . . . . . . . . . . . . . . . . . . . . . . . . . 0 0 . 0 % Race Book . . . . . . . . . . . . . . . . . . . . . . . . . . . . . . . . . . . . . . . . . . . . . . . 18 , 9 12 0 . 1% Sports Pool . . . . . . . . . . . . . . . . . . . . . . . . . . . . . . . . . . . . . . . . . . . . . 2 , 5 3 2 , 2 64 14 . 2 %
TOTAL REVENUE . . . . . . . . . . . . . . . . . . . . . . . . . . . . . . . . . . . . . . . . . . . . . 17 , 7 94 , 0 6 2 1 0 0 . 0 %
DEPARTMENTAL EXPENSES Bad Debt Expense . . . . . . . . . . . . . . . . . . . . . . . . . . . . . . . . . . . . . . . . - 1 , 6 4 7 0 . 0 % Commis sions . . . . . . . . . . . . . . . . . . . . . . . . . . . . . . . . . . . . . . . . . . . . . 1 , 7 05 , 4 5 0 9 . 6 % Complimentary Expense . . . . . . . . . . . . . . . . . . . . . . . . . . . . . . . . . . . 1 , 3 94 , 4 9 0 7 . 8 % Gaming Taxes and Licenses . . . . . . . . . . . . . . . . . . . . . . . . . . . . . . . 1 , 82 0 , 6 5 8 1 0 . 2 % Preferred Guest Expenses ( no complimentarie s ) . . . . . . . . . . . 0 0 . 0 % Payroll Taxes . . . . . . . . . . . . . . . . . . . . . . . . . . . . . . . . . . . . . . . . . . . 5 1 9 , 7 8 8 2 . 9% Payroll - Employee Benefits . . . . . . . . . . . . . . . . . . . . . . . . . . . . . 544 , 44 8 3 . 1% Payrol l - Officers . . . . . . . . . . . . . . . . . . . . . . . . . . . . . . . . . . . . . . 0 0 . 0 % Payrol l - Other Employees . . . . . . . . . . . . . . . . . . . . . . . . . . . . . . . 4 , 12 6 , 0 5 2 2 3 . 2 % Race Wire Fees . . . . . . . . � . . . . . . . . . . . . . . . . . . . . . . . . . . . . . . . . . 8 0 . 0 % Other Departmental Expenses . . . . . . . . . . . . . . . . . . . . . . . . . . . . . 7 9 9 , 5 1 1 4 . 5 %
TOTAL DEPARTMENTAL EXPENSES . . . . . . . . . . . . . . . . . . . . . . . . . . . . . . . 1 0 , 9 0 8 , 7 5 8 6 1 . 3 %
DEPARTMENTAL INCOME ( LOSS ) . . . . . . . . . . . . . . . . . . . . . . . . . . . . . . . . . 6 , 8 85 , 3 04 3 8 . 7%
ROOMS DEPARTMENT
REVENUE DOLLARS PERCENT Room Sales . . . . . . . . . . . . . . . . . . . . . . . . . . . . . . . . . . . . . . . . . . . . . . 8 5 2 , 98 3 9 7 . 0 % Complimentary Rooms . . . . . . . . . . . . . . . . . . . . . . . . . . . . . . . . . . . . . 2 6 , 8 2 3 3 . 0 %
TOTAL REVENUE . . . . . . . . . . . . . . . . . . . . . . . . . . . . . . . . . . . . . . . . . . . . . 8 7 9 , 8 0 6 1 0 0 . 0 %
DEPARTMENTAL EXPENSES Bad Debt Expense . . . . . . . . . . . . . . . . . . . . . . . . . . . . . . . . . . . . . . . . 1 3 , 6 5 4 1 . 6 % Complimentary Expense . . . . . . . . . . . . . . . . . . . . . . . . . . . . . . . . . . . 0 0 . 0 % Payrol l - Taxes . . . . . . . . . . . . . . . . . . . . . . . . . . . . . . . . . . . . . . . . . 4 5 , 6 4 7 5 . 1% Payroll - Employee Benefits . . . . . . . . . . . . . . . . . . . . . . . . . . . . . 1 3 3 , 2 0 5 15 . 1 % Payroll - Officers . . . . . . . . . . . . . . . . . . . . . . . . . . . . . . . . . . . . . . 0 0 . 0 % Payroll - Other Employees . . . . . . . . . . . . . . . . . . . . . . . . . . . . . . . 3 6 3 , 4 1 9 4 1 . 3 % Other Departmental Expenses . . . . . . . . . . . . . . . . . . . . . . . . . . . . . 2 4 7 , 912 2 8 . 2 %
TOTAL DEPARTMENTAL EXPENSES . . . . . . . . . . . . . . . . . . . . . . . . . . . . . . . 8 0 3 , 8 3 7 9 1 . 4 %
DEPARTMENTAL INCOME ( LOSS ) . . . . . . . . . . . . . . . . . . . . . . . . . . . . . . . . . 7 5 , 9 6 9 8 . 6%

2 - 3 6 COMBINED INCOME STATEMENT - DETAIL (CONTINUED)
Fiscal Year 2 0 13 Clark County - Downtown Las Vegas Area With Gaming Revenue of $ 1 , 0 0 0 , 0 0 0 to $ 12 , 0 0 0 , 0 0 0
Amounts Represent 5 Locations .
FOOD DEPARTMENT REVENUE DOLLARS PERCENT
Food Sales 8 3 8 , 9 6 8 99 . 9 % Compl imentary Food Sales . . . . . . . . . . . . . . . . . . . . . . . . . . . . . . . . 8 13 0 . 1%
TOTAL REVENUE . . . . . . . . . . . . . . . . . . . . . . . . . . . . . . . . . . . . . . . . . . . . . 8 3 9 , 7 8 1 1 0 0 . 0 %
COST OF SALES 5 3 3 , 6 1 8 63 . 5 %
GROSS MARGIN 3 0 6 , 1 6 3 3 6 . 5 %
DEPARTMENTAL EXPENSES Bad Debt Expense . . . . . . . . . . . . . . . . . . . . . . . . . . . . . . . . . . . . . . . . 0 0 . 0 % Compl imentary Expense . . . . . . . . . . . . . . . . . . . . . . . . . . . . . . . . . . . 0 0 . 0 % Payrol l - Taxes . . . . . . . . . . . . . . . . . . . . . . . . . . . . . . . . . . . . . . . . . 1 9 , 6 9 7 2 . 3 % Payrol l - Employee Benefits . . . . . . . . . . . . . . . . . . . . . . . . . . . . . 2 , 4 8 1 0 . 3 % Payrol l - Officers . . . . . . . . . . . . . . . . . . . . . . . . . . . . . . . . . . . . . . 0 0 . 0 % Payrol l - Other Employees . . . . . . . . . . . . . . . . . . . . . . . . . . . . . . . 1 8 8 , 3 85 2 2 . 4 % Other Departmental Expenses . . . . . . . . . . . . . . . . . . . . . . . . . . . . . 7 1 , 8 6 5 8 . 6 %
TOTAL DEPARTMENTAL EXPENSES . . . . . . . . . . . . . . . . . . . . . . . . . . . . . . . 2 8 2 , 4 2 8 3 3 . 6 %
DEPARTMENTAL INCOME (LOSS) . . . . . . . . . . . . . . . . . . . . . . . . . . . . . . . . . 2 3 , 7 3 5 2 . 8 %
BEVERAGE DEPARTMENT REVENUE DOLLARS PERCENT
Beverage Sales . . . . . . . . . . . . . . . . . . . . . . . . . . . . . . . . . . . . . . . . . . 3 , 2 8 5 , 964 74 . 9 % Compl imentary Beverage Sales . . . . . . . . . . . . . . . . . . . . . . . . . . . . 1 , 1 0 0 , 4 91 2 5 . 1%
TOTAL REVENUE . . . . . . . . . . . . . . . . . . . . . . . . . . . . . . . . . . . . . . . . . . . . . 4 , 3 8 6 , 4 5 5 1 0 0 . 0 %
COST OF SALES 1 , 1 12 , 8 0 2 2 5 . 4 %
GROSS MARGIN . . . . . . . . . . . . . . . . . . . . . . . . . . . . . . . . . . . . . . . . . . . . . . 3 , 2 7 3 , 6 5 3 74 . 6 %
DEPARTMENTAL EXPENSES Bad Debt Expense . . . . . . . . . . . . . . . . . . . . . . . . . . . . . . . . . . . . . . . . 0 0 . 0 % Complimentary Expense . . . . . . . . . . . . . . . . . . . . . . . . . . . . . . . . . . . 3 5 , 3 2 0 0 . 8 % Payrol l - Taxes . . . . . . . . . . . . . . . . . . . . . . . . . . . . . . . . . . . . . . . . . 1 4 6 , 4 7 7 3 . 3 % Payrol l - Employee Benef its . . . . . . . . . . . . . . . . . . . . . . . . . . . . . 2 5 3 , 3 2 0 5 . 8 % Payroll - Officers . . . . . . . . . . . . . . . . . . . . . . . . . . . . . . . . . . . . . . 0 0 . 0 % Payrol l - Other Employees . . . . . . . . . . . . . . . . . . . . . . . . . . . . . . . 1 , 0 94 , 1 0 2 2 4 . 9 % Other Departmental Expenses . . . . . . . . . . . . . . . . . . . . . . . . . . . . . 2 6 5 , 5 7 7 6 . 1%
TOTAL DEPARTMENTAL EXPENSES . . . . . . . . . . . . . . . . . . . . . . . . . . . . . . . 1 , 7 94 , 7 9 6 4 0 . 9 %
DEPARTMENTAL INCOME (LOSS) . . . . . . . . . . . . . . . . . . . . . . . . . . . . . . . . . 1 , 4 7 8 , 8 5 7 3 3 . 7 %

COMBINED INCOME STATEMENT - DETAIL ( CONTINUED)
Fiscal Year 2 0 1 3 Clark County - Downtown Las Vegas Area With Gaming Revenue of $ 1 , 0 0 0 , 0 0 0 to $ 12 , 0 0 0 , 0 0 0
Amounts Represent 5 Locations .
OTHER INCOME REVENUE
Other Operating and Non-operating Income . . . . . . . . . . . . . . . .
Other Complimentary Items . . . . . . . . . . . . . . . . . . . . . . . . . . . . . . .
TOTAL REVENUE . . . . . . . . . . . . . . . . . . . . . . . . . . . . . . . . . . . J • • • • • • • • •
COST OF SALES . . . . . . . . . . . . . . . . . . . . . . . . . . . . . . . . . . . . . . . . . . . . .
GROSS MARGIN . . . . . . . . . . . . . . . . . . . . . . . . . . . . . . . . . . . . . . . . . . . . . .
DEPARTMENTAL EXPENSES Bad Debt Expense . . . . . . . . . . . . . . . . . . . . . . . . . . . . . . . . . . . . . . . .
Complimentary Expense . . . . . . . . . . . . . . . . . . . . . . . . . . . . . . . . . . .
Payrol l - Taxes . . . . . . . . . . . . . . . . . . . . . . . . . . . . . . . . . . . . . . . . .
Payroll - Employee Benefits . . . . . . . . . . . . . . . . . . . . . . . . . . . . .
Payrol l - Officers . . . . . . . . . . . . . . . . . . . . . . . . . . . . . . . . . . . . . .
Payroll - Other Employees . . . . . . . . . . . . . . . . . . . . . . . . . . . . . . .
Other Departmental Expenses . . . . . . . . . . . . . . . . . . . . . . . . . . . . .
TOTAL DEPARTMENTAL EXPENSES . . . . . . . . . . . . . . . . . . . . . . . . . . . . . . .
DEPARTMENTAL INCOME ( LOSS) . . . . . . . . . . . . . . . . . . . . . . . . . . . . . . . . .
AVERAGE NUMBER OF EMPLOYEES FOR THE YEAR
CASINO DEPARTMENT ROOMS DEPARTMENT . . . . . . . . . . . . . . . . . . . . . .
FOOD DEPARTMENT . . . . . . . . . . . . . . . . . . . . . . .
BEVERAGE DEPARTMENT . . . . . . . . . . . . . . . . . . .
G & A DEPARTMENT . . . . . . . . . . . . . . . . . . . . .
OTHER DEPARTMENTS . . . . . . . . . . . . . . . . . . . . .
TOTAL
DOLLARS 4 8 1 , 4 3 2
0 4 8 1 , 4 3 2
5 0 , 9 0 9
• 4 3 0 1 5 2 3
0 0 0 0 0 0
1 0 9 , 7 1 0 1 0 9 , 7 1 0
3 2 0 , 8 13
1 5 6 3
14 3 6 5 1
0
2 6 0
2 - 3 7
PERCENT 1 0 0 . 0 %-
0 . 0 %-1 0 0 . 0 %-
1 0 . 6%-
8 9 . 4 %-
0 . 0 %-0 . 0 %-0 . 0%-0 . 0 %-0 . 0 %-0 . 0 %-
2 2 . 8 %-2 2 . 8 %-
6 6 . 6 %-

2 - 3 8 ROOM OCCUPANCY AND PER ROOM PER DAY ANALYSIS
Fiscal Year 2 0 1 3 Clark County - Downtown Las Vegas Area With Gaming Revenue of $ 1 , 0 0 0 , 0 0 0 to $12 , 0 0 0 , 0 0 0
Amounts Represent 5 Locations .
RATE OF ROOM OCCUPANCY
MONTH JULY . .. . . . . . . . . AUGUST . . . . . . . . SEPTEMBER . . . . .
OCTOBER . . . . . . . NOVEMBER . . . . . .
DECEMBER . . . . . . JANUARY .. . . . . . . FEBRUARY . . . . . . MARCH . . . . . . . . . APRIL . . . . . . . . . MAY . . . . . . . . . . . JUNE . . . . . . . . . .
TOTAL . . . . . . . . .
Average Pit Revenue Per Room Per Day
Average Slot Revenue Per Room Per Day
Average Food Sales Per Room Per Day
AVAILABLE ROOMS ROOMS OCCUPIED
12 , 6 4 8 3 , 5 0 3 12 , 6 4 8 3 , 63 5 12 , 24 0 4 , 4 14 12 , 6 4 8 3 , 8 6 7 12 , 2 4 0 1 , 12 1 12 , 6 4 8 8 7 1 12 , 6 4 8 1 , 1 7 0 11 , 4 2 4 1 , 7 3 9 12 , 6 4 8 2 , 1 5 2 12 , 2 70 556
0 0 0 0
124 , 0 62 2 3 , 0 2 8
PER ROOM PER DAY STATISTICS
96 . 4 6
5 6 5 . 4 7
3 6 . 4 7
Average Beverage Sales Per Room Per Day
Average Rooms Department Payrol l Per Room Per Day
Average Room Rate Per Day
% OF OCCUPANCY
{ COMPUTED) 2 7 . 7 0 % 2 8 . 74 % 3 6 . 0 6 % 3 0 . 5 7 %
9 . 1 6 % 6 . 8 9 % 9 . 2 5 %
15 . 2 2 % 1 7 . 0 1 %
4 . 5 3 % 0 . 0 0 % 0 . 0 0 %
1 8 . 5 6 %
1 9 0 . 4 8
2 3 . 5 5
3 8 . 2 1
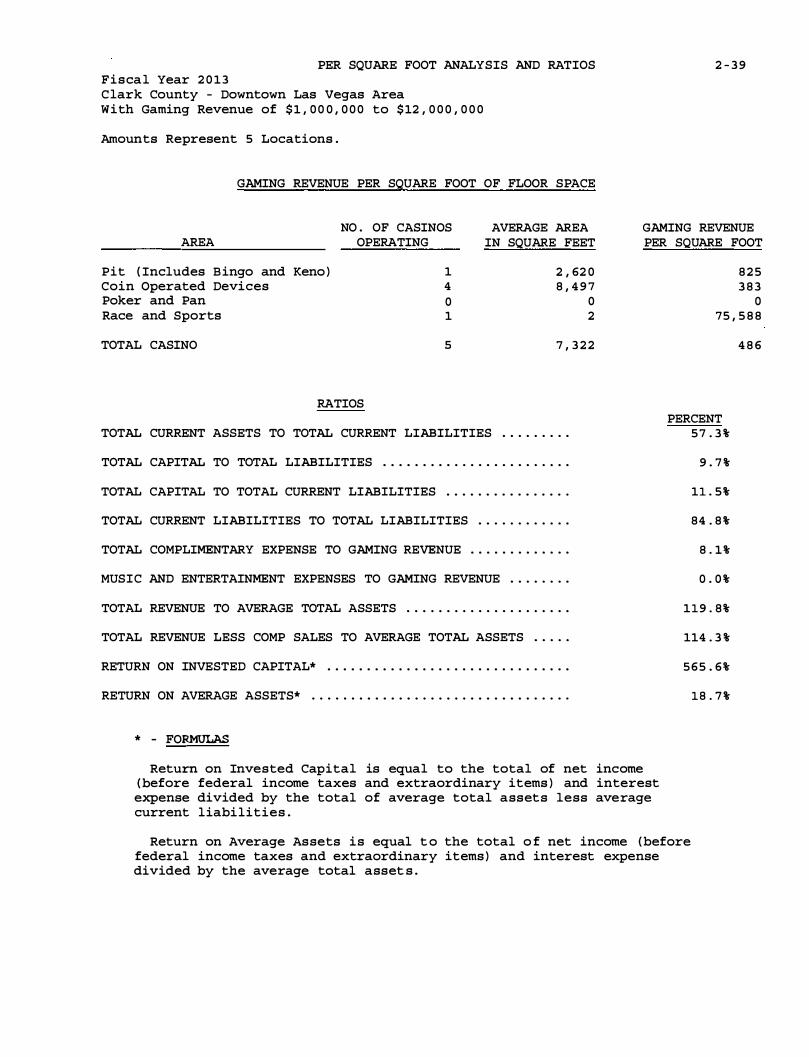
PER SQUARE FOOT ANALYSIS AND RATIOS 2 - 3 9 Fiscal Year 2 0 13 Clark County - Downtown Las Vegas Area With Gaming Revenue of $ 1 , 0 0 0 , 0 0 0 to $ 12 , 0 0 0 , 0 0 0
Amounts Represent 5 Locations .
GAMING REVENUE PER SQUARE FOOT OF FLOOR SPACE
NO . OF CASINOS AREA OPERATING
AVERAGE AREA IN SQUARE FEET
GAMING REVENUE PER SQUARE FOOT
Pit ( Includes Bingo and Keno ) 1 Coin Operated Devices 4 Poker and Pan 0 Race and Sports 1
TOTAL CASINO 5
RATIOS
2 , 62 0 8 , 4 9 7
0 2
7 , 3 2 2
TOTAL CURRENT ASSETS TO TOTAL CURRENT LIABILITIES . . . . . . . . .
TOTAL CAPITAL TO TOTAL LIABILITIES . . . . . . . . . . . . . . . . . . . . . . . .
TOTAL CAPITAL TO TOTAL CURRENT LIABILITIES . . . . . . . . . . . . . . . .
TOTAL CURRENT LIABILITIES TO TOTAL LIABILITIES . . . . . . . . . . . .
TOTAL COMPLIMENTARY EXPENSE TO GAMING REVENUE . . . . . . . . . . . . .
MUSIC AND ENTERTAINMENT EXPENSES TO GAMING REVENUE . . . . . . . .
TOTAL REVENUE TO AVERAGE TOTAL ASSETS . . . . . . . . . . . . . . . . . . . . .
TOTAL REVENUE LESS COMP SALES TO AVERAGE TOTAL ASSETS . . . . .
RETURN ON INVESTED CAPITAL* . . . . . . . . . . . . . . . . . . . . . . . . . . . . . . .
RETURN ON AVERAGE ASSETS* . . . . . . . . . . . . . . . . . . . . . . . . . . . . . . . . .
* - FORMULAS
Return on Invested Capital is equal to the total of net income ( before federal income taxes and extraordinary items ) and interest
expense divided by the total of average total assets less average current liabilities .
8 2 5 3 8 3
0 75 , 5 8 8
PERCENT 5 7 . 3 %
9 . 7 %
11 . 5%
84 . 8 %
8 . 1%
0 . 0 %
119 . 8%
114 . 3 %
5 6 5 . 6%
18 . 7 %
4 8 6
Return on Average Assets is equal t o the total o f net income ( before federal income taxes and extraordinary items ) and interest expense divided by the average total asset s .

2 - 4 0
THIS PAGE LEFT INTENTIONALLY BLANK
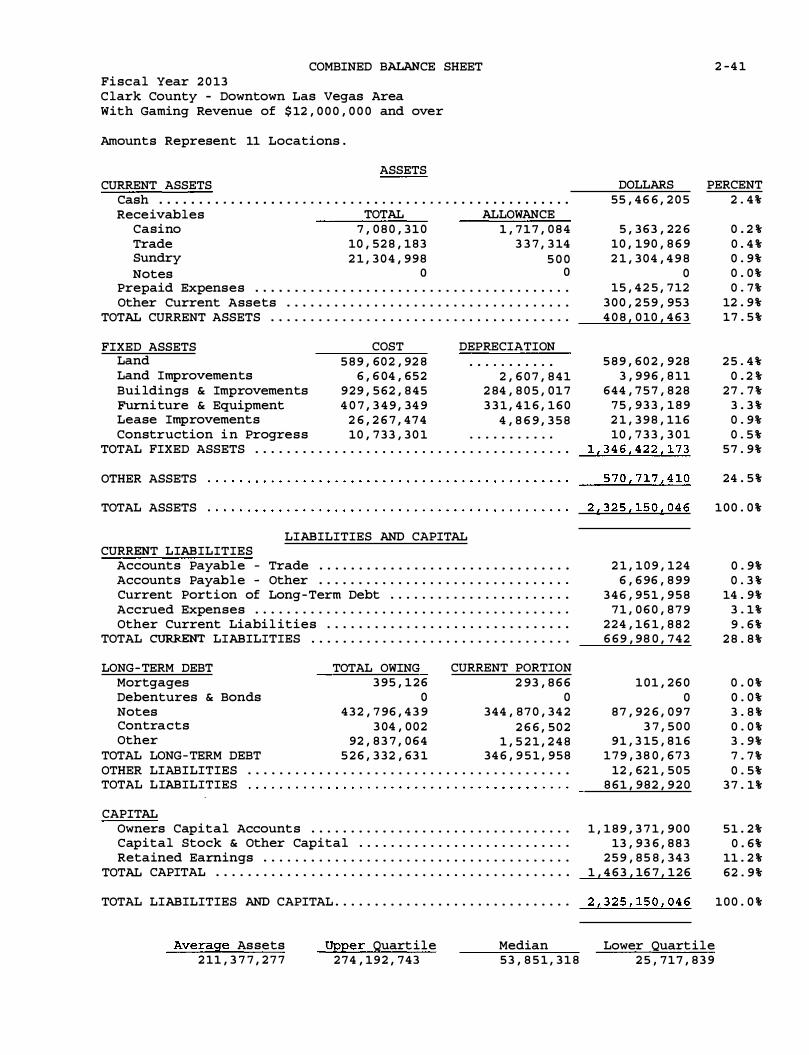
COMBINED BALANCE SHEET Fiscal Year 2 0 13 Clark County - Downtown Las Vegas Area With Gaming Revenue of $ 12 , 0 0 0 , 0 0 0 and over
Amounts Represent 11 Locations .
ASSETS CURRENT ASSETS
Cash . . . . . . . . . . . . . . . . . . . . . . . . . . . . . . . . . . . . . . . . . . . . . . . . . . . .
Receivables TOTAL ALLOWANCE Casino 7 , 0 8 0 , 3 1 0 1 , 7 1 7 , 0 8 4 Trade 10 , 52 8 , 183 3 3 7 , 3 14 Sundry 2 1 , 3 0 4 , 998 5 0 0 Notes o o
Prepaid Expenses . . . . . . . . . . . . . . . . . . . . . . . . . . . . . . . . . . . . . . . . Other Current Assets . . . . . . . . . . . . . . . . . . . . . . . . . . . . . . . . . . . .
TOTAL CURRENT ASSETS . . . . . . . . . . . . . . . . . . . . . . . . . . . . . . . . . . . . . .
FIXED ASSETS COST DEPRECIATION Land 5 8 9 , 60 2 , 92 8 . . . . . . . . . . .
Land Improvements 6 , 6 04 , 652 2 , 6 0 7 , 8 4 1 Bui ldings & Improvements 9 2 9 , 5 62 , 8 4 5 2 84 , 8 0 5 , 0 1 7 Furniture & Equipment 4 0 7 , 3 4 9 , 34 9 3 3 1 , 4 1 6 , 1 6 0 Lease Improvements 2 6 , 2 6 7 , 4 7 4 4 , 8 6 9 , 3 5 8 Construction i n Progress 10 , 7 3 3 , 3 0 1 . . . . . . . . . . .
TOTAL FIXED ASSETS . . . . . . . . . . . . . . . . . . . . . . . . . . . . . . . . . . . . . . . .
OTHER ASSETS
TOTAL ASSETS
LIABILITIES AND CAPITAL CURRENT LIABILITIES
Accounts Payable - Trade . . . . . . . . . . . . . . . . . . . . . . . . . . . . . . . .
Accounts Payable - Other . . . . . . . . . . . . . . . . . . . . . . . . . . . . . . . .
Current Portion of Long- Term Debt . . . . . . . . . . . . . . . . . . . . . . .
Accrued Expenses . . . . . . . . . . . . . . . . . . . . . . . . . . . . . . . . . . . . . . . .
Other Current Liabil ities . . . . . . . . . . . . . . . . . . . . . . . . . . . . . . .
TOTAL CURRENT LIABILITIES . . . . . . . . . . . . . . . . . . . . . . . . . . . . . . . . .
LONG- TERM DEBT Mortgages Debentures & Bonds
TOTAL OWING 3 95 , 1 2 6
0
CURRENT PORTION 2 93 , 8 6 6
0 Notes 4 3 2 , 7 96 , 4 3 9 344 , 8 7 0 , 34 2 Contracts 3 04 , 0 0 2 2 6 6 , 5 0 2 Other 92 , 8 3 7 , 0 6 4 1 , 5 2 1 , 2 4 8
TOTAL LONG- TERM DEBT 5 2 6 , 3 32 , 63 1 34 6 , 9 5 1 , 958 OTHER LIABILITIES . . . . . . . . . . . . . . . . . . . . . . . . . . . . . . . . . . . . . . . . .
TOTAL LIABILITIES
CAPITAL Owners Capital Accounts . . . . . . . . . . . . . . . . . . . . . . . . . . . . . . . . .
Capital Stock & Other Capital . . . . . . . . . . . . . . . . . . . . . . . . . . .
Retained Earnings . . . . . . . . . . . . . . . . . . . . . . . . . . . . . . . . . . . . . . . TOTAL CAPITAL . . . . . . . . . . . . . . . . . . . . . . . . . . . . . . . . . . . . . . . . . . . . .
TOTAL LIABILITIES AND CAPITAL . . . . . . . . . . . . . . . . . . . . . . . . . . . . . .
Average Assets 2 11 , 3 7 7 , 2 7 7
Upper Quartile 2 74 , 19 2 , 743
Median 5 3 , 8 5 1 , 3 1 8
2 -4 1
DOLLARS PERCENT 55 , 4 6 6 , 2 0 5
5 , 3 6 3 , 22 6 10 , 190 , 8 6 9 2 1 , 3 0 4 , 4 9 8
0 15 , 4 2 5 , 7 12
3 0 0 , 2 5 9 , 953 4 0 8 , 0 10 , 4 6 3
5 8 9 , 6 0 2 , 9 2 8 3 , 9 9 6 , 8 11
644 , 7 5 7 , 8 2 8 7 5 , 93 3 , 1 8 9 2 1 , 3 9 8 , 116 10 , 7 3 3 , 3 0 1
1 , 3 4 6 , 4 2 2 , 173
5 7 0 , 7 1 7 , 4 10
2 ! 32 5 , 15 0 ! 04 6
2 1 , 1 0 9 , 124 6 , 6 96 , 8 99
3 4 6 , 95 1 , 9 5 8 7 1 , 0 6 0 , 8 7 9
2 2 4 , 16 1 , 8 8 2 6 6 9 , 98 0 , 742
1 0 1 , 2 6 0 0
8 7 , 92 6 , 0 9 7 3 7 , 5 0 0
9 1 , 3 15 , 8 1 6 1 7 9 , 3 8 0 , 6 7 3
12 , 62 1 , 5 0 5 8 6 1 , 9 8 2 , 9 2 0
1 , 1 8 9 , 3 7 1 , 9 0 0 13 , 93 6 , 8 8 3
2 5 9 , 8 5 8 , 343 1 , 4 6 3 , 16 7 , 1 2 6
2 ! 3 2 5 , 15 0 ! 0 4 6
Lower Quartile 2 5 , 7 1 7 , 8 3 9
2 . 4 %
0 . 2 % 0 . 4 % 0 . 9% 0 . 0 % 0 . 7%
12 . 9% 17 . 5 %
2 5 . 4 % 0 . 2 %
2 7 . 7 % 3 . 3 % 0 . 9% 0 . 5 %
5 7 . 9%
24 . 5 %
1 0 0 . 0 %
0 . 9% 0 . 3 %
14 . 9% 3 . 1% 9 . 6 %
2 8 . 8 %
0 . 0 % 0 . 0 % 3 . 8 % 0 . 0 % 3 . 9% 7 . 7 % 0 . 5%
3 7 . 1%
5 1 . 2 % 0 . 6%
11 . 2 % 62 . 9%
1 0 0 . 0 %

2 - 4 2 COMBINED INCOME STATEMENT - SUMMARY
Fiscal Year 2 0 13 Clark County - Downtown Las Vegas Area With Gaming Revenue of $ 12 , 0 0 0 , 0 0 0 and over
Amounts Represent 11 Locat ions .
REVENUE DOLLARS Gaming . . . . . . . . . . . . . . . . . . . . . . . . . . . . . . . . . . . . . . . . . . . . . . . . . . 4 8 8 , 102 , 644 Rooms . . . . . . . . . . . . . . . . . . . . . . . . . . . . . . . . . . . . . . . . . . . . . . . . . . . 15 5 , 1 9 8 , 1 6 9 Food . . . . . . . . . . . . . . . . . . . . . . . . . . . . . . . . . . . . . . . . . . . . . . . . . . . . 1 4 0 , 2 44 , 0 0 8 Beverage . . . . . . . . . . . . . . . . . . . . . . . . . . . . . . . . . . . . . . . . . . . . . . . . 74 , 54 2 , 14 1 Other . . . . . . . . . . . . . . . . . . . . . . . . . . . . . . . . . . . . . . . . . . . . . . . . . . . 58 , 9 7 3 , 7 2 7
9 17 , 0 6 0 , 6 8 9 TOTAL REVENUE . . . . . . . . . . . . . . . . . . . . . . . . . . . . . . . . . . . . . . . . . . . . ·----
������
COST OF SALES 74 , 8 8 8 , 155
GROSS MARGIN 8 4 2 , 172 , 5 3 4
DEPARTMENTAL EXPENSES . . . . . . . . . . . . . . . . . . . . . . . . . . . . . . . . . . . . . 4 9 9 , 8 1 0 , 162
3 4 2 , 3 6 2 , 3 72 DEPARTMENTAL INCOME ( LOS S ) . . . . . . . . . . . . . . . . . . . . . . . . . . . . . · · ·----
������
GENERAL AND ADMINISTRATIVE EXPENSES Advertising and Promotion . . . . . . . . . . . . . . . . . . . . . . . . . . . . . . . 12 , 34 3 , 0 5 0 Bad Debt Expense . . . . . . . . . . . . . . . . . . . . . . . . . . . . . . . . . . . . . . . . 3 , 9 1 0 Compl imentary Expense ( not reported i n departments ) . . . . . . 2 9 , 8 0 8 , 2 5 2 Depreciation - Buildings . . . . . . . . . . . . . . . . . . . . . . . . . . . . . . . . 2 6 , 3 7 4 , 8 2 2 Depreciation and Amorti zation - Other . . . . . . . . . . . . . . . . . . . 2 9 , 8 3 8 , 2 7 3 Energy Expense ( electricity, gas , etc . ) . . . . . . . . . . . . . . . . . 18 , 7 8 2 , 0 7 1 Equipment Rental or Lease . . . . . . . . . . . . . . . . . . . . . . . . . . . . . . . 1 0 3 , 6 9 1 Interest Expense . . . . . . . . . . . . . . . . . . . . . . . . . . . . . . . . . . . . . . . . 6 5 , 4 3 7 , 7 3 3 Music and Entertainment . . . . . . . . . . . . . . . . . . . . . . . . . . . . . . . . . 4 7 6 , 7 5 9 Payrol l Taxes . . . . . . . . . . . . . . . . . . . . . . . . . . . . . . . . . . . . . . . . . . . 6 , 2 1 3 , 8 2 2 Payroll - Employee Benefits . . . . . . . . . . . . . . . . . . . . . . . . . . . . . 16 , 76 3 , 0 4 9 Payroll - Officers . . . . . . . . . . . . . . . . . . . . . . . . . . . . . . . . . . . . . . 4 , 16 2 , 5 3 2 Payroll - Other Employees . . . . . . . . . . . . . . . . . . . . . . . . . . . . . . . 6 7 , 2 8 4 , 155 Rent of Premises . . . . . . . . . . . . . . . . . . . . . . . . . . . . . . . . . . . . . . . . 8 , 3 2 4 , 4 8 0 Taxes - Real Estate . . . . . . . . . . . . . . . . . . . . . . . . . . . . . . . . . . . . . 5 , 4 6 9 , 0 9 8 Taxes and Licenses - Other . . . . . . . . . . . . . . . . . . . . . . . . . . . . . . 3 , 4 1 9 , 8 5 2 Ut ilities ( Other than Energy Expense) . . . . . . . . . . . . . . . . . . . 6 , 3 64 , 6 75 Other General and Administrative Expenses . . . . . . . . . . . . . . . 62 , 73 8 , 8 9 1
3 6 3 , 9 0 9 , 115 TOTAL GENERAL AND ADMIN ISTRATIVE EXPENSES . . . . . . . . . . . . . . . . ·----
����===
NET INCOME ( LOSS ) BEFORE FEDERAL INCOME TAXES AND EXTRAORDINARY ITEMS . . . . . . . . . . . . . . . . . . . . . . . . . . . . . . . . . . . .
Average Revenue 8 3 , 3 6 9 , 154
Upper Quartile 8 5 , 6 8 2 , 2 4 7
Median 6 0 , 6 2 5 , 2 6 1
- 2 1 , 5 4 6 , 7 4 3
Lower Quart ile 44 , 2 92 , 5 6 6
PERCENT 5 3 . 2 % 1 6 . 9 % 15 . 3 %
8 . 1% 6 . 4 %
1 0 0 . 0 %
8 . 2 %
9 1 . 8 %
54 . 5 %
3 7 . 3 %
1 . 3 % 0 . 0 % 3 . 3 % 2 . 9 % 3 . 3 % 2 . 0 % 0 . 0 % 7 . 1% 0 . 1% 0 . 7% 1 . 8% 0 . 5 % 7 . 3 % 0 . 9 % 0 . 6 % 0 . 4 % 0 . 7 % 6 . 8 %
3 9 . 7 %
- 2 . 3 %

COMBINED INCOME STATEMENT - DETAIL 2 -4 3 Fiscal Year 2 0 13 Clark County - Downtown Las Vegas Area With Gaming Revenue of $ 12 , 0 0 0 , 0 0 0 and over
Amounts Represent 1 1 Locations .
CASINO DEPARTMENT
REVENUE DOLLARS PERCENT Pit Revenue ( Includes Keno and Bingo) . . . . . . . . . . . . . . . . . . . 1 1 3 , 56 6 , 9 7 3 2 3 . 3 % Coin Operated Devices . . . . . . . . . . . . . . . . . . . . . . . . . . . . . . . . . . . 3 6 3 , 7 10 , 3 0 2 74 . 5 % Poker and Pan . . . . . . . . . . . . . . . . . . . . . . . . . . . . . . . . . . . . . . . . . . . 5 , 8 0 4 , 4 14 1 . 2 % Race Book . . . . . . . . . . . . . . . . . . . . . . . . . . . . . . . . . . . . . . . . . · . . . . . . 1 , 4 6 3 , 1 6 7 0 . 3 % Sports Pool . . . . . . . . . . . . . . . . . . . . . . . . . . . . . . . . . . . . . . . . . . . . . 3 , 55 7 , 7 8 8 0 . 7 %
TOTAL REVENUE . . . . . . . . . . . . . . . . . . . . . . . . . . . . . . . . . . . . . . . . . . . . . 4 8 8 , 10 2 , 6 4 4 1 0 0 . 0 %
DEPARTMENTAL EXPENSES Bad Debt Expense . . . . . . . . . . . . . . . . . . . . . . . . . . . . . . . . . . . . . . . . 93 , 12 0 0 . 0 % Commi ssions . . . . . . . . . . . . . . . . . . . . . . . . . . . . . . . . . . . . . . . . . . . . . 1 3 , 6 2 1 , 4 8 9 2 . 8 % Complimentary Expense . . . . . . . . . . . . . . . . . . . . . . . . . . . . . . . . . . . 5 6 , 0 8 0 , 34 6 1 1 . 5 % Gaming Taxes and Licenses . . . . . . . . . . . . . . . . . . . . . . . . . . . . . . . 3 7 , 6 7 9 , 2 2 4 7 . 7 % Preferred Guest Expenses ( no complimentaries ) . . . . . . . . . . . 4 , 9 9 0 , 5 7 1 1 . 0 % Payroll Taxes . . . . . . . . . . . . . . . . . . . . . . . . . . . . . . . . . . . . . . . . . . . 9 , 3 2 9 , 5 2 2 1 . 9 % Payroll - Employee Benefits . . . . . . . . . . . . . . . . . . . . . . . . . . . . . 1 6 , 0 0 8 , 64 1 3 . 3 % Payrol l - Officers . . . . . . . . . . . . . . . . . . . . . . . . . . . . . . . . . . . . . . 0 0 . 0 % Payrol l - Other Employees . . . . . . . . . . . . . . . . . . . . . . . . . . . . . . . 6 6 , 7 6 3 , 0 8 3 1 3 . 7%'
Race Wire Fees . . . . . . . . . . . . . . . . . . . . . . . . . . . . . . . . . . . . . . . . . . 2 2 8 , 4 6 4 0 . 0% Other Departmental Expenses . . . . . . . . . . . . . . . . . . . . . . . . . . . . . 4 0 , 2 97 , 7 3 6 8 . 3 %
TOTAL DEPARTMENTAL EXPENSES . . . . . . . . . . . . . . . . . . . . . . . . . . . . . . . 2 4 5 , 0 92 , 1 9 6 5 0 . 2 %
DEPARTMENTAL INCOME ( LOSS ) . . . . . . . . . . . . . . . . . . . . . . . . . . . . . . . . ; 2 4 3 , 0 1 0 , 4 4 8 4 9 . 8%
ROOMS DEPARTMENT
REVENUE DOLLARS PERCENT Room Sales . . . . . . . . . . . . . . . . . . . . . . . . . . . . . . . . . . . . . . . . . . . . . . 12 0 , 64 6 , 6 9 6 7 7 . 7% Complimentary Rooms . . . . . . . . . . . . . . . . . . . . . . . . . . . . . . . . . . . . . 3 4 , 5 5 1 , 4 7 3 2 2 . 3 %
TOTAL REVENUE . . . . . . . . . . . . . . . . . . . . . . . . . . . . . . . . . . . . . . . . . . . . . 1 55 , 19 8 , 1 6 9 1 0 0 . 0 %
DEPARTMENTAL EXPENSES Bad Debt Expense . . . . . . . . . . . . . . . . . . . . . . . . . . . . . . . . . . . . . . . . 4 3 0 , 122 0 . 3 % Complimentary Expense . . . . . . . . . . . . . . . . . . . . . . . . . . . . . . . . . . . 4 , 0 5 1 , 9 5 1 2 . 6 % Payrol l - Taxes . . . . . . . . . . . . . . . . . . . . . . . . . . . . . . . . . . . . . . . . . 4 , 84 1 , 6 4 6 3 . 1% Payrol l - Employee Benefits . . . . . . . . . . . . . . . . . . . . . . . . . . . . . 1 6 , 73 5 , 8 3 5 1 0 . 7 % Payrol l - Officers . . . . . . . . . . . . . . . . . . . . . . . . . . . . . . . . . . . . . . 0 0 . 0 % Payrol l - Other Employees . . . . . . . . . . . . . . . . . . . . . . . . . . . . . . . 4 9 , 3 3 3 , 6 1 9 3 1 . 8 % Other Departmental Expenses . . . . . . . . . . . . . . . . . . . . . . . . . . . . . 2 4 , 0 7 8 , 3 65 15 . 5 %
TOTAL DEPARTMENTAL EXPENSES . . . . . . . . . . . . . . . . . . . . . . . . . . . . . . . 9 9 , 4 7 1 , 5 3 8 6 4 . 1%
DEPARTMENTAL INCOME ( LOSS ) . . . . . . . . . . . . . . . . . . . . . . . . . . . . . . . . . 5 5 , 72 6 , 6 3 1 3 5 . 9%

2 - 4 4 COMBINED INCOME STATEMENT - DETAIL ( CONTINUED )
Fiscal Year 2 0 13 Clark County - Downtown Las Vegas Area With Gaming Revenue of $ 12 , 0 0 0 , 0 0 0 and over
Amount s Represent 11 Locat ions .
FOOD DEPARTMENT REVENUE
Food Sales Compl imentary Food Sales . . . . . . . . . . . . . . . . . . . . . . . . . . . . . . . .
TOTAL REVENUE . . . . . . . . . . . . . . . . . . . . . . . . . . . . . . . . . . . . . . . . . . . . .
COST OF SALES
GROSS MARGIN
DEPARTMENTAL EXPENSES Bad Debt Expense . . . . . . . . . . . . . . . . . . . . . . . . . . . . . . . . . . . . . . . .
Compl imentary Expense . . . . . . . . . . . . . . . . . . . . . . . . . . . . . . . . . . . Payrol l - Taxes . . . . . . . . . . . . . . . . . . . . . . . . . . . . . . . . . . . . . . . . .
Payrol l - Employee Benefits . . . . . . . . . . . . . . . . . . . . . . . . . . . . .
Payrol l - Officers . . . . . . . . . . . . . . . . . . . . . . . . . . . . . . . . . . . . . .
Payrol l - Other Employees . . . . . . . . . . . . . . . . . . . . . . . . . . . . . . .
Other Departmental Expenses . . . . . . . . . . . . . . . . . . . . . . . . . . . . .
TOTAL DEPARTMENTAL EXPENSES . . . . . . . . . . . . . . . . . . . . . . . . . . . . . . .
DEPARTMENTAL INCOME ( LOSS ) . . . . . . . . . . . . . . . . . . . . . . . . . . . . . . . . .
BEVERAGE DEPARTMENT REVENUE
Beverage Sales . . . . . . . . . . . . . . . . . . . . . . . . . . . . . . . . . . . . . . . . . .
Compl imentary Beverage Sales . . . . . . . . . . . . . . . . . . . . . . . . . . . .
TOTAL REVENUE . . . . . . . . . . . . . . . . . . . . . . . . . . . . . . . . . . . . . . . . . . . . .
COST OF SALES
GROSS MARGIN . . . . . . . . . . . . . . . . . . . . . . . . . . . . . . . . . . . . . . . . . . . . . .
DEPARTMENTAL EXPENSES Bad Debt Expense . . . . . . . . . . . . . . . . . . . . . . . . . . . . . . . . . . . . . . . .
Compl imentary Expense . . . . . . . . . . . . . . . . . . . . . . . . . . . . . . . . . . .
Payroll - Taxes . . . . . . . . . . . . . . . . . . . . . . . . . . . . . . . . . . . . . . . . .
Payrol l - Employee Benefits . . . . . . . . . . . . . . . . . . . . . . . . . . . . .
Payroll - Off icers . . . . . . . . . . . . . . . . . . . . . . . . . . . . . . . . . . . . . . Payrol l - Other Employees . . . . . . . . . . . . . . . . . . . . . . . . . . . . . . .
Other Departmental Expenses . . . . . . . . . . . . . . . . . . . . . . . . . . . . .
TOTAL DEPARTMENTAL EXPENSES . . . . . . . . . . . . . . . . . . . . . . . . . . . . . . .
DEPARTMENTAL INCOME ( LOSS ) . . . . . . . . . . . . . . . . . . . . . . . . . . . . . . . . .
DOLLARS 1 14 , 956 , 2 8 5
2 5 , 2 8 7 , 7 2 3 14 0 , 2 4 4 , 0 0 8
5 0 , 4 1 8 , 6 2 5
8 9 , 8 2 5 , 3 8 3
1 , 9 0 0 5 5 3 , 4 95
6 , 6 6 8 , 0 6 3 2 3 , 3 5 4 , 0 8 6
0 6 1 , 14 6 , 0 9 8
5 , 5 3 1 , 8 1 7 9 7 , 2 55 , 4 5 9
- 7 , 4 3 0 , 0 7 6
DOLLARS 4 4 , 2 3 2 , 4 1 8 3 0 , 3 0 9 , 7 2 3 74 , 54 2 , 141
1 9 , 2 75 , 7 3 2
55 , 2 6 6 , 4 0 9
0 2 9 8 , 9 0 2
2 , 2 9 8 , 72 9 7 , 5 6 7 , 8 12
0 1 7 , 8 9 9 , 4 4 8
5 , 5 0 1 , 3 4 3 3 3 , 5 6 6 , 2 3 4
2 1 , 7 0 0 , 175
PERCENT 82 . 0 % 18 . 0 %
1 0 0 . 0 %
3 6 . 0 %
64 . 0 %
0 . 0 % 0 . 4 % 4 . 8 %
16 . 7 % 0 . 0 %
4 3 . 6 % 3 . 9 %
6 9 . 3 %
- 5 . 3 %
PERCENT 5 9 . 3 % 4 0 . 7 %
1 0 0 . 0 %
2 5 . 9 %
74 . 1%
0 . 0 % 0 . 4 % 3 . 1 %
1 0 . 2 % 0 . 0 %
24 . 0 % 7 . 4 %
45 . 0 %
2 9 . 1%

COMBINED INCOME STATEMENT - DETAIL ( CONTINUED)
Fi scal Year 2 0 13 Clark County - Downtown Las Vegas Area With Gaming Revenue of $ 12 , 0 0 0 , 0 0 0 and over
Amounts Represent 11 Locations .
OTHER INCOME REVENUE
Other Operating and Non- operating Income . . . . . . . . . . . . . . . .
Other Complimentary Items . . . . . . . . . . . . . . . . . . . . . . . . . . . . . . . TOTAL REVENUE . . . . . . . . . . . . . . . . . . . . . . . . . . . . . . . . . . . . . . . . . . . . .
COST OF SALES . . . . . . . . . . . . . . . . . . . . . . . . . . . . . . . . . . . . . . . . . . . . .
GROSS MARGIN . . . . . . . . . . . . . . . . . . . . . . . . . . . . . . . . . . . . . . . . . . . . . .
DEPARTMENTAL EXPENSES Bad Debt Expense . . . . . . . . . . . . . . . . . . . . . . . . . . . . . . . . . . . . . . . .
Compl imentary Expense . . . . . . . . . . . . . . . . . . . . . . . . . . . . . . . . . . .
Payrol l - Taxes . . . . . . . . . . . . . . . . . . . . . . . . . . . . . . . . . . . . . . . . .
Payroll - Employee Benefits . . . . . . . . . . . . . . . . . . . . . . . . . . . . .
Payroll - Officers . . . . . . . . . . . . . . . . . . . . . . . . . . . . . . . . . . . . . .
Payrol l - Other Employees . . . . . . . . . . . . . . . . . . . . . . . . . . . . . . .
Other Departmental Expenses . . . . . . . . . . . . . . . . . . . . . . . . . . . . .
TOTAL DEPARTMENTAL EXPENSES . . . . . . . . . . . . . . . . . . . . . . . . . . . . . . .
DEPARTMENTAL INCOME ( LOSS ) . . . . . . . . . . . . . . . . . . . . . . . . . . . . . . . . .
AVERAGE NUMBER OF EMPLOYEES FOR THE YEAR
CASINO DEPARTMENT ROOMS DEPARTMENT . . . . . . . . . . . . . . . . . . . . . .
FOOD DEPARTMENT . . . . . . . . . . . . . . . . . . . . . . .
BEVERAGE DEPARTMENT . . . . . . . . . . . . . . . . . . .
G & A DEPARTMENT . . . . . . . . . . . . . . . . . . . . .
OTHER DEPARTMENTS . . . . . . . . . . . . . . . . . . . . .
TOTAL
DOLLARS 5 6 , 75 0 , 7 0 6
2 , 2 2 3 , 0 2 1 5 8 , 973 , 72 7
5 , 193 , 7 9 8
53 , 7 7 9 , 9 2 9
- 63 8 3 7 6 , 6 9 2
1 , 172 , 52 8 1 , 9 7 9 , 64 9
0 12 , 04 2 , 6 1 3
8 , 8 5 3 , 8 9 1 2 4 , 42 4 , 7 3 5
2 9 , 3 5 5 , 194
2 , 8 3 9 1 , 6 1 7 2 , 10 5
7 3 4 1 , 7 9 7
4 14
9 , 5 0 6
2 -4 5
PERCENT 96 . 2 %
3 . 8 % 1 0 0 . 0 %
8 . 8 %
9 1 . 2 %
0 . 0 % 0 . 6 % 2 . 0 % 3 . 4 % 0 . 0 %
2 0 . 4 % 15 . 0 % 4 1 . 4 %
4 9 . 8 %

2 - 4 6 ROOM OCCUPANCY AND PER ROOM PER DAY ANALYSIS
Fiscal Year 2 0 13 Clark County - Downtown Las Vegas Area With Gaming Revenue of $ 12 , 0 0 0 , 0 0 0 and over
Amounts Represent 11 Locations .
RATE OF ROOM OCCUPANCY
MONTH JULY . . . . . . . .. . . AUGUST . . . . . . . .
SEPTEMBER . . . . . OCTOBER . . . . . . .
NOVEMBER . . . . . .
DECEMBER . . . . . . JANUARY . . . . . . .
FEBRUARY . . . . . . MARCH . . . . . . . . .
APRIL . . . . . . . . . MAY . . . . . . . . . . . JUNE . . . . . . . . . .
TOTAL . . . . . . .. . .
Average Pit Revenue Per Room Per Day
Average Slot Revenue Per Room Per Day
Average Food Sales Per Room Per Day
AVAILABLE ROOMS ROOMS OCCUPIED 2 7 9 , 2 2 7 2 4 5 , 0 1 7 2 7 5 , 2 8 0 2 3 1 , 8 4 2 2 6 9 , 4 7 0 2 3 6 , 9 2 6 2 7 6 , 4 7 8 2 4 6 , 774 2 6 3 , 0 5 9 2 0 1 , 4 0 1 2 7 1 , 9 6 3 199 , 198 2 7 2 , 6 6 7 2 0 9 , 8 3 3 2 4 8 , 2 0 6 2 0 1 , 129 2 8 1 , 3 2 4 24 7 , 9 6 6 2 7 1 , 5 7 7 2 3 4 , 9 0 1 2 7 7 , 1 5 3 2 3 7 , 9 8 7 2 7 0 , 175 2 3 6 , 2 2 8
3 , 2 5 6 , 5 7 9 2 , 7 2 9 , 2 02
PER ROOM PER DAY STATISTICS
4 1 . 6 1
1 3 3 . 2 7
5 1 . 3 9
Average Beverage Sales Per Room Per Day
Average Rooms Department Payroll Per Room Per Day
Average Room Rate Per Day
% OF OCCUPANCY
( COMPUTED ) 8 7 . 7 5 % 84 . 2 2 % 8 7 . 92 % 8 9 . 2 6 % 76 . 5 6 % 73 . 2 4 % 7 6 . 9 6 % 8 1 . 0 3 % 8 8 . 14 % 8 6 . 5 0 % 8 5 . 8 7 % 8 7 . 44 %
8 3 . 8 1%
2 7 . 3 1
2 5 . 9 8
5 6 . 8 7

PER SQUARE FOOT ANALYSIS AND RATIOS Fiscal Year 2 0 13 Clark County - Downtown Las Vegas Area With Gaming Revenue of $ 12 , 0 0 0 , 0 0 0 and over
Amounts Represent 11 Locations .
GAMING REVENUE PER SQUARE FOOT OF FLOOR SPACE
2 -4 7
NO . OF CASINOS AVERAGE AREA GAMING REVENUE AREA OPERATING IN SQUARE FEET PER SQUARE FOOT
Pit ( Includes Bingo and Keno) 11 6 , 5 14 1 , 5 8 5 Coin Operated Devices 11 3 4 , 4 2 5 9 6 0 Poker and Pan 4 1 , 7 6 4 8 2 3 Race and Sports 5 2 , 2 2 7 4 5 1
TOTAL CASINO 1 1 4 2 , 5 9 3 1 , 0 4 2
RATIOS
TOTAL CURRENT ASSETS TO TOTAL CURRENT LIABILITIES . . . . . . . . .
TOTAL CAPITAL TO TOTAL LIABILITIES . . . . . . . . . . . . . . . . . . . . . . . .
TOTAL CAPITAL TO TOTAL CURRENT LIABILITIES . . . . . . . . . . . . . . . .
TOTAL CURRENT LIABILITIES TO TOTAL LIABILITIES . . . . . . . . . . . .
TOTAL COMPLIMENTARY EXPENSE TO GAMING REVENUE . . . . . . . . . . . . .
MUSIC AND ENTERTAINMENT EXPENSES TO GAMING REVENUE . . . . . . . .
TOTAL REVENUE TO AVERAGE TOTAL ASSETS . . . . . . . . . . . . . . . . . . . . .
TOTAL REVENUE LESS COMP SALES TO AVERAGE TOTAL ASSETS . . . . .
RETURN ON INVESTED CAPITAL* . . . . . . . . . . . . . . . . . . . . . . . . . . . . . . .
RETURN ON AVERAGE ASSETS * . . . . . . . . . . . . . . . . . . . . . . . . . . . . . . . . .
* - FORMULAS
Return on Invested Capital is equal to the total of net income (before federal income taxes and extraordinary items ) and interest
expense divided by the total of average total assets less average current l iabilities .
PERCENT 6 0 . 9%
1 6 9 . 7%
2 1 8 . 4 %
7 7 . 7 %
18 . 7 %
0 . 1%
3 9 . 9%
3 5 . 9%
3 . 0 %
1 . 9%
Return on Average Assets is equal to the total of net income ( before federal income taxes and extraordinary items ) and interest expense divided by the average total assets .

2 - 4 8
THIS PAGE LEFT INTENTIONALLY BLANK

COMBINED BALANCE SHEET Fiscal Year 2 0 13 Clark County - Laughlin Area With Gaming Revenue of $ 1 , 0 0 0 , 0 0 0 and over
Amounts Represent 9 Locations .
ASSETS CURRENT ASSETS
Cash . . . . . . . . . . . . . . . . . . . . . . . . . . . . . . . . . . . . . . . . . . . . . . . . . . . .
Receivables TOTAL ALLOWANCE casino 1 , 14 5 , 654 4 13 , 724 Trade 2 , 3 3 8 , 5 9 9 3 1 6 , 6 6 6 Sundry 4 , 3 6 1 , 3 4 9 0 Notes 0 0
Prepaid Expenses . . . . . . . . . . . . . . . . . . . . . . . . . . . . . . . . . . . . . . . .
Other Current Assets . . . . . . . . . . . . . . . . . . . . . . . . . . . . . . . . . . . .
TOTAL CURRENT ASSETS . . . . . . . . . . . . . . . . . . . . . . . . . . . . . . . . . . . . . .
FIXED ASSETS COST DEPRECIATION Land 8 1 , 175 , 2 93 . . . . . . . . . . . Land Improvements 2 2 , 7 7 1 , 94 6 17 , 7 9 9 , 624 Bui ldings & Improvements 5 7 3 , 4 3 8 , 2 3 9 17 1 , 0 4 7 , 5 5 6 Furniture & Equipment 2 12 , 2 3 4 , 138 172 , 2 74 , 5 8 2 Lease Improvements 3 , 8 2 7 , 664 2 , 8 7 9 , 110 Construction in Progres s 15 , 5 5 5 , 544 . . . . . . . . . . .
TOTAL FIXED ASSETS . . . . . . . . . . . . . . . . . . . . . . . . . . . . . . . . . . . . . . . .
OTHER ASSETS
TOTAL ASSETS
LIABILITIES AND CAPITAL CURRENT LIABILITIES
Accounts Payable - Trade . . . . . . . . . . . . . . . . . . . . . . . . . . . . . . . .
Accounts Payable - Other . . . . . . . . . . . . . . . . . . . . . . . . . . . . . . . .
Current Portion of Long- Term Debt . . . . . . . . . . . . . . . . . . . . . . .
Accrued Expenses . . . . . . . . . . . . . . . . . . . . . . . . . . . . . . . . . . . . . . . . Other Current Liabil ities . . . . . . . . . . . . . . . . . . . . . . . . . . . . . . .
TOTAL CURRENT LIABILITIES . . . . . . . . . . . . . . . . . . . . . . . . . . . . . . . . .
LONG-TERM DEBT Mortgages Debentures & Bonds
TOTAL OWING 2 7 1 , 9 1 0 , 910
0
CURRENT PORTION 0 0
Notes 6 4 , 7 7 7 , 6 2 8 54 , 42 9 , 5 4 3 Contracts 3 8 7 , 5 4 9 1 8 9 , 5 0 5 Other 2 0 2 , 7 9 6 , 2 5 2 1 , 3 6 8 , 6 2 6
TOTAL LONG- TERM DEBT 5 3 9 , 8 72 , 3 3 9 55 , 98 7 , 6 7 4 OTHER LIABILITIES . . . . . . . . . . . . . . . . . . . . . . . . . . . . . . . . . . . . . . . . .
TOTAL LIABILITIES
CAPITAL Owners Capital Accounts . . . . . . . . . . . . . . . . . . . . . . . . . . . . . . . . .
Capital Stock & Other Capital . . . . . . . . . . . . . . . . . . . . . . . . . . . Retained Earnings . . . . . . . . . . . . . . . . . . . . . . . . . . . . . . . . . . . . . . .
TOTAL CAPITAL . . . . . . . . . . . . . . . . . . . . . . . . . . . . . . . . . . . . . . . . . . . . .
TOTAL LIABILITIES AND CAPITAL . . . . . . . . . . . . . . . . . . . . . . . . . . . . . .
Average Assets 13 1 , 2 9 5 , 1 2 8
Upper Quartile 2 3 2 , 0 5 7 , 612
Median 7 1 , 5 7 5 , 2 1 9
2 -4 9
DOLLARS PERCENT 14 0 , 2 18 , 14 2
7 3 1 , 93 0 2 , 0 2 1 , 9 3 3 4 , 3 6 1 , 3 4 9
0 17 , 6 19 , 5 2 7
1 3 8 , 24 1 , 2 8 8 3 0 3 , 194 , 16 9
8 1 , 175 , 2 93 4 , 97 2 , 3 2 2
4 0 2 , 3 90 , 6 8 3 3 9 , 959 , 5 5 6
94 8 , 554 15 , 555 , 544
54 5 , 0 0 1 ! 952
3 3 3 , 4 6 0 , 0 3 2
1 , 18 1 , 6 5 6 , 153
10 , 131 , 0 92 6 8 , 8 91 , 1 8 9 5 5 , 9 8 7 , 6 74 3 9 , 93 8 , 9 8 8
- 13 , 92 2 , 6 7 6 1 6 1 , 02 6 , 2 6 7
2 7 1 , 910 , 9 1 0 0
1 0 , 3 4 8 , 0 8 5 1 9 8 , 044
2 0 1 , 4 2 7 , 6 2 6 4 8 3 , 8 8 4 , 6 6 5
2 7 , 4 0 8 , 2 7 8 6 7 2 , 3 1 9 ! 2 1 0
122 , 4 6 3 , 5 6 3 3 5 0 , 6 0 2 , 2 7 6
3 6 , 2 7 1 , 104 5 0 9 , 3 3 6 , 94 3
1 , 18 1 , 6 5 6 ! 153
Lower Quartile 3 5 , 78 8 , 8 93
11 . 9%
0 . 1% 0 . 2 % 0 . 4 % 0 . 0 % 1 . 5%
11 . 7 % 2 5 . 7 %
6 . 9% 0 . 4 %
34 . 1% 3 . 4 % 0 . 1% 1 . 3 %
4 6 . 1%
2 8 . 2 %
1 0 0 . 0 %
0 . 9% 5 . 8 % 4 . 7 % 3 . 4 %
- 1 . 2 % 13 . 6 %
2 3 . 0 % 0 . 0 % 0 . 9% 0 . 0 %
17 . 0 % 4 0 . 9 %
2 . 3 % 5 6 . 9%
10 . 4 % 2 9 . 7%'
3 . 1% 4 3 . 1%
1 0 0 . 0 %

2 - 5 0 COMBINED INCOME STATEMENT - SUMMARY
Fiscal Year 2 0 13 Clark County - Laughlin Area With Gaming Revenue of $ 1 , 0 0 0 , 0 0 0 and over
Amounts Represent 9 Locations .
REVENUE DOLLARS Gaming . . . . . . . . . . . . . . . . . . . . . . . . . . . . . . . . . . . . . . . . . . . . . . . . . . 4 5 5 , 6 7 9 , 5 6 0 Rooms . . . . . . . . . . . . . . . . . . . . . . . . . . . . . . . . . . . . . . . . . . . . . . . . . . . 9 1 , 1 2 9 , 0 8 7 Food . . . . . . . . . . . . . . . . . . . . . . . . . . . . . . . . . . . . . . . . . . . . . . . . . . . . 7 8 , 3 8 6 , 1 3 5 Beverage . . . . . . . . . . . . . . . . . . . . . . . . . . . . . . . . . . . . . . . . . . . . . . . . 4 0 , 0 3 6 , 3 9 0 Other . . . . . . . . . . . . . . . . . . . . . . . . . . . . . . . . . . . . . . . . . . . . . . . . . . . 4 3 , 998 , 2 4 4
7 0 9 , 2 2 9 , 4 16 TOTAL REVENUE . . . . . . . . . . . . . . . . . . . . . . . . . . . . . . . . . . . . . . . · · · · · · ----������
COST OF SALES 5 6 , 2 6 7 , 4 6 6
GROSS MARGIN 652 , 96 1 , 9 5 0
DEPARTMENTAL EXPENSES . . . . . . . . . . . . . . . . . . . . . . . . . . . . . . . . . . . . . 3 7 3 , 172 , 4 0 0
2 7 9 , 7 8 9 , 5 5 0 DEPARTMENTAL INCOME ( LOSS ) . . . . . . . . . . . . . . . . . . . . . . . . . . . . . . . · ----������
GENERAL AND ADMINISTRATIVE EXPENSES Adverti sing and Promotion . . . . . . . . . . . . . . . . . . . . . . . . . . . . . . . 1 9 , 0 4 0 , 3 18 Bad Debt Expense . . . . . . . . . . . . . . . . . . . . . . . . . . . . . . . . . . . . . . . . 2 1 , 0 3 0 Compl imentary Expense ( not reported in departments ) . . . . . . 12 , 0 7 5 , 8 8 3 Depreciation - Buildings . . . . . . . . . . . . . . . . . . . . . . . . . . . . . . . . 1 6 , 7 1 7 , 3 2 7 Deprec iation and Amorti zation - Other . . . . . . . . . . . . . . . . . . . 3 0 , 6 7 1 , 0 3 7 Energy Expense ( electricity, gas , etc . ) . . . . . . . . . . . . . . . . . 14 , 91 7 , 8 3 6 Equipment Rental or Lease . . . . . . . . . . . . . . . . . . . . . . . . . . . . . . . 1 , 1 8 6 , 3 9 8 Interest Expense . . . . . . . . . . . . . . . . . . . . . . . . . . . . . . . . . . . . . . . . 4 8 , 522 , 4 12 Music and Entertainment . . . . . . . . . . . . . . . . . . . . . . . . . . . . . . . . . 4 , 0 8 3 , 2 5 1 Payroll Taxes . . . . . . . . . . . . . . . . . . . . . . . . . . . . . . . . . . . . . . . . . . . 3 , 9 9 0 , 0 6 8 Payroll - Employee Benefits . . . . . . . . . . . . . . . . . . . . . . . . . . . . . 8 , 1 05 , 0 9 7 Payroll - Officers . . . . . . . . . . . . . . . . . . . . . . . . . . . . . . . . . . . . . . 2 , 3 5 0 , 7 3 9 Payroll - Other Employees . . . . . . . . . . . . . . . . . . . . . . . . . . . . . . . 4 3 , 12 8 , 4 0 2 Rent o f Premises . . . . . . . . . . . . . . . . . . . . . . . . . . . . . . . . . . . . . . . . 9 72 , 6 5 7 Taxes - Real Estate . . . . . . . . . . . . . . . . . . . . . . . . . . . . . . . . . . . . . 5 , 0 11 , 0 1 0 Taxes and Licenses - Other . . . . . . . . . . . . . . . . . . . . . . . . . . . . . . 1 , 7 7 9 , 9 7 7 Ut i l ities ( Other than Energy Expense ) . . . . . . . . . . . . . . . . . . . 5 , 3 54 , 7 2 0 Other General and Administrative Expenses . . . . . . . . . . . . . . . 4 8 , 795 , 4 18
2 6 6 , 72 3 , 5 8 0 TOTAL GENERAL AND ADMINISTRATIVE EXPENSES . . . . . . . . . . . . . . . . · ----������
NET INCOME ( LOSS ) BEFORE FEDERAL INCOME TAXES AND EXTRAORDINARY ITEMS . . . . . . . . . . . . . . . . . . . . . . . . . . . . . . . . . . . .
Average Revenue 7 8 , 8 0 3 , 2 6 8
Upper Quartile 1 3 5 , 2 3 8 , 0 5 0
Median 5 7 , 1 8 5 , 3 3 3
1 3 , 0 6 5 , 9 7 0
Lower Quartile 3 4 , 8 0 9 , 4 0 4
PERCENT 64 . 2 % 12 . 8 % 11 . 1 %
5 . 6 % 6 . 2 %
1 0 0 . 0 %
7 . 9 %
92 . 1 %
52 . 6 %
3 9 . 4 %
2 . 7% 0 . 0 % 1 . 7 % 2 . 4 % 4 . 3 % 2 . 1 % 0 . 2 % 6 . 8 % 0 . 6 % 0 . 6% 1 . 1 % 0 . 3 % 6 . 1% 0 . 1% 0 . 7 % 0 . 3 % 0 . 8 % 6 . 9 %
3 7 . 6 %
1 . 8 %

COMBINED INCOME STATEMENT - DETAIL 2 - 5 1 Fiscal Year 2 0 13 Clark County - Laughlin Area With Gaming Revenue of $ 1 , 0 0 0 , 0 0 0 and over
Amounts Represent 9 Locations .
CASINO DEPARTMENT
REVENUE DOLLARS PERCENT Pit Revenue ( Includes Keno and Bingo) . . . . . . . . . . . . . . . . . . . 4 4 , 3 9 9 , 157 9 . 7 % Coin Operated Devices . . . . . . . . . . . . . . . . . . . . . . . . . . . . . . . . . . . 4 05 , 42 0 , 9 6 6 8 9 . 0 % Poker and Pan . . . . . . . . . . . . . . . . . . . . . . . . . . . . . . . . . . . . . . . . . . . 3 , 02 8 , 1 3 1 0 . 7 % Race Book . . . . . . . . . . . . . . . . . . . . . . . . . . . . . . . . . . . . . . . . . . . . . . . 1 , 624 , 5 3 8 0 . 4 % Sports Pool . . . . . . . . . . . . . . . . . . . . . . . . . . . . . . . . . . . . . . . . . . . . . 1 , 2 0 6 , 7 6 8 0 . 3 %
TOTAL REVENUE . . . . . . . . . . . . . . . . . . . . . . . . . . . . . . . . . . . . . . . . . . . . . 4 5 5 , 6 7 9 , 5 6 0 1 0 0 . 0 %
DEPARTMENTAL EXPENSES Bad Debt Expense . . . . . . . . . . . . . . . . . . . . . . . . . . . . . . . . . . . . . . . . - 7 , 5 1 1 0 . 0% Commis sions . . . . . . . . . . . . . . . . . . . . . . . . . . . . . . . . . . . . . . . . . . . . . 3 , 4 94 , 52 1 0 . 8% Complimentary Expense . . . . . . . . . . . . . . . . . . . . . . . . . . . . . . . . . . . 8 8 , 44 5 , 156 1 9 . 4 % Gaming Taxes and Licenses . . . . . . . . . . . . . . . . . . . . . . . . . . . . . . . 3 7 , 3 3 1 , 122 8 . 2 % Preferred Gues t Expenses ( no compl imentaries ) . . . . . . . . . . . 976 , 794 0 . 2 % Payroll Taxes . . . . . . . . . . . . . . . . . . . . . . . . . . . . . . . . . . . . . . . . . . . 4 , 7 9 1 , 0 6 8 1 . 1% Payroll - Employee Benefits . . . . . . . . . . . . . . . . . . . : . . . . . . . . . 8 , 933 , 7 1 9 2 . 0 % Payroll - Officers . . . . . . . . . . . . . . . . . . . . . . . . . . . . . . . . . . . . . . 1 , 50 5 , 1 6 1 0 . 3 % Payroll - Other Employees . . . . . . . . . . . . . . . . . . . . . . . . . . . . . . . 3 2 , 994 , 5 8 8 7 . 2 % Race Wire Fees . . . . . . . . . . . . . . . . . . . . . . . . . . . . . . . . . . . . . . . . . . 3 2 6 , 4 33 0 . 1% Other Departmental Expenses . . . . . . . . . . . . . . . . . . . . . . . . . . . . . 4 8 , 954 , 8 3 9 10 . 7 %
TOTAL DEPARTMENTAL EXPENSES . . . . . . . . . . . . . . . . . . . . . . . . . . . . . . . 2 2 7 , 74 5 , 8 9 0 5 0 . 0 %
DEPARTMENTAL INCOME ( LOS S ) . . . . . . . . . . . . . . . . . . . . . . . . . . . . . . . . . 2 2 7 , 933 , 6 7 0 5 0 . 0 %
ROOMS DEPARTMENT
REVENUE DOLLARS PERCENT Room Sales . . . . . . . . . . . . . . . . . . . . . . . . . . . . . . . . . . . . . . . . . . . . . . 5 0 , 8 7 1 , 0 9 7 55 . 8 % Complimentary Rooms . . . . . . . . . . . . . . . . . . . . . . . . . . . . . . . . . . . . . 4 0 , 2 5 7 , 990 4 4 . 2 %
TOTAL REVENUE . . . . . . . . . . . . . . . . . . . . . . . . . . . . . . . . . . . . . . . . . . . . . 9 1 , 12 9 , 0 8 7 1 0 0 . 0 %
DEPARTMENTAL EXPENSES Bad Debt Expense . . . . . . . . . . . . . . . . . . . . . . . . . . . . . . . . . . . . . . . . 5 8 3 , 2 3 5 0 . 6% Complimentary Expense . . . . . . . . . . . . . . . . . . . . . . . . . . . . . . . . . . . 8 3 8 , 3 3 6 0 . 9% Payroll - Taxes . . . . . . . . . . . . . . . . . . . . . . . . . . . . . . . . . . . . . . . . . 2 , 2 8 7 , 5 7 2 2 . 5% Payroll - Employee Benefits . . . . . . . . . . . . . . . . . . . . . . . . . . . . . 4 , 93 2 , 2 5 6 5 . 4 % Payroll - Officers . . . . . . . . . . . . . . . . . . . . . . . . . . . . . . . . . . . . . . 5 0 0 , 0 9 5 0 . 5 % Payroll - Other Employees . . . . . . . . . . . . . . . . . . . . . . . . . . . . . . . 2 1 , 9 0 0 , 544 2 4 . 0 % Other Departmental Expenses . . . . . . . . . . . . . . . . . . . . . . . . . . . . . 1 8 , 6 9 6 , 3 18 2 0 . 5%
TOTAL DEPARTMENTAL EXPENSES . . . . . . . . . . . . . . . . . . . . . . . . . . . . . . . 4 9 , 7 3 8 , 3 5 6 54 . 6 %
DEPARTMENTAL INCOME ( LOSS ) . . . . . . . . . . . . . . . . . . . . . . . . . . . . . . . . . 4 1 , 3 9 0 , 7 3 1 4 5 . 4 %

2 - 5 2 COMBINED INCOME STATEMENT - DETAIL ( CONTINUED)
Fiscal Year 2 0 1 3 Clark County - Laughlin Area With Gaming Revenue of $ 1 , 0 0 0 , 0 0 0 and over
Amount s Represent 9 Locations .
REVENUE Food Sales
FOOD DEPARTMENT
Complimentary Food Sales . . . . . . . . . . . . . . . . . . . . . . . . . . . . . . . . TOTAL REVENUE . . . . . . . . . . . . . . . . . . . . . . . . . . . . . . . . . . . . . . . . . . . . .
COST OF SALES
GROSS MARGIN
DEPARTMENTAL EXPENSES Bad Debt Expense . . . . . . . . . . . . . . . . . . . . . . . . . . . . . . . . . . . . . . . .
Compl imentary Expense . . . . . . . . . . . . . . . . . . . . . . . . . . . . . . . . . . .
Payroll - Taxes . . . . . . . . . . . . . . . . . . . . . . . . . . . . . . . . . . . . . . . . .
Payroll - Employee Benefits . . . . . . . . . . . . . . . . . . . . . . . . . . . . .
Payroll - Officers . . . . . . . . . . . . . . . . . . . . . . . . . . . . . . . . . . . . . .
Payroll - Other Employees . . . . . . . . . . . . . . . . . . . . . . . . . . . . . . .
Other Departmental Expenses . . . . . . . . . . . . . . . . . . . . . . . . . . . . .
TOTAL DEPARTMENTAL EXPENSES . . . . . . . . . . . . . . . . . . . . . . . . . . . . . . .
DEPARTMENTAL INCOME ( LOS S ) . . . . . . . . . . . . . . . . . . . . . . . . . . . . . . . . .
BEVERAGE DEPARTMENT REVENUE
B everage Sales . . . . . . . . . . . . . . . . . . . . . . . . . . . . . . . . . . . . . . . . . .
Complimentary Beverage Sales . . . . . . . . . . . . . . . . . . . . . . . . . . . .
TOTAL REVENUE . . . . . . . . . . . . . . . . . . . . . . . . . . . . . . . . . . . . . . . . . . . . .
COST OF SALES
GROSS MARGIN . . . . . . . . . . . . . . . . . . . . . . . . . . . . . . . . . . . . . . . . . . . . . .
DEPARTMENTAL EXPENSES Bad Debt Expense . . . . . . . . . . . . . . . . . . . . . . . . . . . . . . . . . . . . . . . .
Compl imentary Expense . . . . . . . . . . . . . . . . . . . . . . . . . . . . . . . . . . .
Payroll - Taxes . . . . . . . . . . . . . . . . . . . . . . . . . . . . . . . . . . . . . . . . .
Payroll - Employee Benefits . . . . . . . . . . . . . . . . . . . . . . . . . . . . .
Payroll - Off icers . . . . . . . . . . . . . . . . . . . . . . . . . . . . . . . . . . . . . .
Payroll - Other Employees . . . . . . . . . . . . . . . . . . . . . . . . . . . . . . .
Other Departmental Expenses . . . . . . . . . . . . . . . . . . . . . . . . . . . . .
TOTAL DEPARTMENTAL EXPENSES . . . . . . . . . . . . . . . . . . . . . . . . . . . . . . .
DEPARTMENTAL INCOME ( LOSS )
DOLLARS 4 8 , 0 8 3 , 5 8 5 3 0 , 3 02 , 5 5 0 7 8 , 3 8 6 , 1 3 5
3 1 , 7 9 3 , 8 3 5
4 6 , 5 92 , 3 0 0
15 , 1 1 3 2 7 1 , 5 8 6
3 , 3 7 1 , 1 6 6 6 , 712 , 4 7 5
7 4 7 , 5 9 3 2 7 , 5 2 6 , 6 0 0
5 , 54 3 , 2 95 4 4 , 18 7 , 8 2 8
2 , 4 0 4 , 4 7 2
DOLLARS 12 , 4 3 2 , 1 9 9 2 7 , 6 04 , 1 9 1 4 0 , 0 3 6 , 3 9 0
11 , 0 3 4 , 6 6 6
2 9 , 0 0 1 , 724
141 6 , 2 0 6
1 , 12 2 , 7 9 9 1 , 7 3 8 , 674
8 0 1 , 7 8 8 7 , 2 1 7 , 126 1 , 5 9 5 , 0 94
12 , 4 8 1 , 8 2 8
16 , 5 1 9 , 8 9 6
PERCENT 6 1 . 3 % 3 8 . 7 %
1 0 0 . 0 %
4 0 . 6 %
5 9 . 4 %
0 . 0 % 0 . 3 % 4 . 3 % 8 . 6 % 1 . 0 %
3 5 . 1 % 7 . 1 %
5 6 . 4 %
3 . 1 %
PERCENT 3 1 . 1% 6 8 . 9 %
1 0 0 . 0 %
2 7 . 6 %
72 . 4 %
0 . 0 % 0 . 0 % 2 . 8 % 4 . 3 % 2 . 0 %
18 . 0 % 4 . 0 %
3 1 . 2 %
4 1 . 3 %

COMBINED INCOME STATEMENT - DETAIL ( CONTINUED)
Fiscal Year 2 0 13 Clark County - Laughlin Area With Gaming Revenue of $ 1 , 0 0 0 , 0 0 0 and over
Amounts Represent 9 Locations .
OTHER INCOME REVENUE
Other Operating and Non-operating Income . . . . . . . . . . . . . . . . Other Complimentary Items . . . . . . . . . . . . . . . . . . . . . . . . . . . . . . .
TOTAL REVENUE . . . . . . . . . . . . . . . . . . . . . . . . . . . . . . . . . . . . . . . . . . . . .
COST OF SALES . . . . . . . . . . . . . . . . . . . . . . . . . . . . . . . . . . . . . . . . . . . . .
GROSS MARGIN . . . . . . . . . . . . . . . . . . . . . . . . . . . . . . . . . . . . . . . . . . . . . .
DEPARTMENTAL EXPENSES Bad Debt Expense . . . . . . . . . . . . . . . . . . . . . . . . . . . . . . . . . . . . . . . . Complimentary Expense . . . . . . . . . . . . . . . . . . . . . . . . . . . . . . . . . . . Payrol l - Taxes . . . . . . . . . . . . . . . . . . . . . . . . . . . . . . . . . . . . . . . . . Payrol l - Employee Benefits . . . . . . . . . . . . . . . . . . . . . . . . . . . . . Payrol l - Officers . . . . . . . . . . . . . . . . . . . . . . . . . . . . . . . . . . . . . . Payroll - Other Employees . . . . . . . . . . . . . . . . . . . . . . . . . . . . . . . Other Departmental Expenses . . . . . . . . . . . . . . . . . . . . . . . . . . . . .
TOTAL DEPARTMENTAL EXPENSES . . . . . . . . . . . . . . . . . . . . . . . . . . . . . . .
DEPARTMENTAL INCOME ( LOSS ) . . . . . . . . . . . . . . . . . . . . . . . . . . . . . . . . .
AVERAGE NUMBER OF EMPLOYEES FOR THE YEAR
CASINO DEPARTMENT . . . . . . . . . . . . . . . . . . . . . ROOMS DEPARTMENT . . . . . . . . . . . . . . . . . . . . . . FOOD DEPARTMENT . . . . . . . . . . . . . . . . . . . . . . . BEVERAGE DEPARTMENT . . . . . . . . . . . . . . . . . . . G & A DEPARTMENT . . . . . . . . . . . . . . . . . . . . . OTHER DEPARTMENTS . . . . . . . . . . . . . . . . . . . . .
TOTAL
DOLLARS 3 8 , 4 3 6 , 2 4 6
5 , 56 1 , 99 8 4 3 , 998 , 2 4 4
13 , 4 3 8 , 9 6 5
3 0 , 5 5 9 , 2 7 9
16 , 5 9 8 2 , 7 0 0 , 0 5 4
5 4 2 , 7 8 6 1 , 3 7 5 , 2 0 2
10 9 , 7 4 6 5 , 22 7 , 5 7 0
2 9 , 04 6 , 5 4 2 3 9 , 0 1 8 , 4 9 8
- 8 , 4 5 9 , 2 1 9
1 , 5 6 2 1 , 0 6 1 1 , 6 2 8
5 1 1 1 , 3 8 2
2 9 8
6 , 44 2
2 - 5 3
PERCENT 8 7 . 4 % 12 . 6 %
1 0 0 . 0 %
3 0 . 5%
6 9 . 5%
0 . 0 % 6 . 1% 1 . 2 % 3 . 1% 0 . 2 %
1 1 . 9% 6 6 . 0 % 8 8 . 7 %
- 1 9 . 2 %

2 - 5 4 ROOM OCCUPANCY AND PER ROOM PER DAY ANALYSIS
Fiscal Year 2 0 1 3 Clark County - Laughlin Area With Gaming Revenue of $ 1 , 0 0 0 , 0 0 0 and over
Amounts Represent 9 Locations .
RATE OF ROOM OCCUPANCY
MONTH JULY . . . . . . . . . . AUGUST . . . . . . . . SEPTEMBER . . . . . OCTOBER . . . . . . . NOVEMBER . . . . . . DECEMBER . . . . . . JANUARY . . . . . . . FEBRUARY . . . . . . MARCH . . . . . . . . . APRIL . . . . . . . . . MAY . . . . . . . . . . . JUNE . . . . . . . . . .
TOTAL . . . . . . . . .
Average Pit Revenue Per Room Per Day
Average Slot Revenue Per Room Per Day
Average Food Sales Per Room Per Day
AVAILABLE ROOMS ROOMS OCCUPIED 3 0 4 , 7 3 4 2 2 3 , 8 3 8 3 0 5 , 8 2 0 196 , 2 8 2 2 8 3 , 2 4 9 172 , 0 0 8 2 9 1 , 4 3 3 1 73 , 4 8 9 2 8 4 , 0 0 2 159 , 052 2 8 6 , 4 13 133 , 8 2 7 2 9 0 , 2 2 1 151 , 7 94 2 6 6 , 8 5 8 170 , 3 14 2 9 9 , 8 14 2 1 3 , 522 2 8 8 , 52 6 2 0 2 , 0 3 7 2 9 9 , 5 2 0 1 95 , 4 8 8 2 9 1 , 4 82 1 9 7 , 4 7 5
3 , 4 92 , 0 7 2 2 , 1 8 9 , 126
PER ROOM PER DAY STATISTICS
2 0 . 2 8
1 8 5 . 2 0
3 5 . 8 1
Average Beverage Sales Per Room Per Day
Average Rooms Department Payrol l Per Room Per Day
Average Room Rate Per Day
% OF OCCUPANCY
( COMPgTED) 73 . 4 5 % 64 . 1 8 % 6 0 . 7 3 % 5 9 . 5 3 % 5 6 . 0 0 % 4 6 . 7 3 % 5 2 . 3 0 % 63 . 8 2 % 7 1 . 2 2 % 7 0 . 02 % 65 . 2 7 % 6 7 . 7 5 %
62 . 6 9 %
18 . 2 9
13 . 5 3
4 1 . 6 3

PER SQUARE FOOT ANALYSI S AND RATIOS 2 - 5 5 Fiscal Year 2 0 13 Clark County - Laughlin Area With Gaming Revenue of $ 1 , 0 0 0 , 0 0 0 and over
Amounts Represent 9 Locations .
GAMING REVENUE PER SQUARE FOOT OF FLOOR SPACE
NO . OF CASINOS AVERAGE AREA GAMING REVENUE AREA OPERATING IN SQUARE FEET PER SQUARE FOOT
Pit ( Includes Bingo and Keno) 9 5 , 904 836 Coin Operated Devices 9 3 8 , 8 9 0 1 , 158 Poker and Pan 5 1 , 164 5 2 0 Race and Sports 4 3 , 917 1 8 1
TOTAL CASINO 9 4 7 , 182 1 , 0 7 3
RATIOS
TOTAL CURRENT ASSETS TO TOTAL CURRENT LIABILITIES . . . . . . . . .
TOTAL CAPITAL TO TOTAL LIABILITIES . . . . . . . . . . . . . . . . . . . . . . . .
TOTAL CAPITAL TO TOTAL CURRENT LIABILITIES . . . . . . . . . . . . . . . .
TOTAL CURRENT LIABILITIES TO TOTAL LIABILITIES . . . . . . . . . . . .
TOTAL COMPLIMENTARY EXPENSE TO GAMING REVENUE . . . . . . . . . . . . .
MUSIC AND ENTERTAINMENT EXPENSES TO GAMING REVENUE . . . . . . . .
TOTAL REVENUE TO AVERAGE TOTAL ASSETS . . . . . . . . . . . . . . . . . . . . .
TOTAL REVENUE LESS COMP SALES TO AVERAGE TOTAL ASSETS . . . . .
RETURN ON INVESTED CAPITAL* . . . . . . . . . . . . . . . . . . . . . . . . . . . . . . .
RETURN ON AVERAGE ASSETS* . . . . . . . . . . . . . . . . . . . . . . . . . . . . . . . . .
* - FORMULAS
Return on Invested Capital i s equal to the total of net income (before federal income taxes and extraordinary items ) and interest expense divided by the total of average total assets less average current liabil ities .
PERCENT 1 8 8 . 3 %
7 5 . 8 %
3 16 . 3 %
2 4 . 0 %
2 2 . 9%
0 . 9%
6 0 . 2 %
5 1 . 4 %
7 . 0 %
5 . 2 %
Return on Average Assets i s equal to the total of net income (before federal income taxes and extraordinary items ) and interest expense divided by the average total assets .

2 - 5 6
THIS PAGE LEFT INTENTIONALLY BLANK

COMBINED BALANCE SHEET Fiscal Year 2 0 13 Clark County - Boulder Strip Area With Gaming Revenue of $ 1 , 0 0 0 , 0 0 0 and over
Amounts Represent 3 1 Locations .
ASSETS CURRENT ASSETS
Cash . . . . . . . . . . . . . . . . . . . . . . . . . . . . . . . . . . . . . . . . . . . . . . . . . . . .
Receivables TOTAL ALLOWANCE Casino 5 , 2 7 6 , 94 8 2 , 7 9 7 , 8 8 2 Trade 1 0 , 14 8 , 723 2 8 1 , 8 94 Sundry 1 , 0 4 3 , 5 9 1 0 Notes 2 , 933 , 2 9 1 o
Prepaid Expenses . . . . . . . . . . . . . . . . . . . . . . . . . . . . . . . . . . . . . . . .
Other Current Assets . . . . . . . . . . . . . . . . . . . . . . . . . . . . . . . . . . . .
TOTAL CURRENT ASSETS . . . . . . . . . . . . . . . . . . . . . . . . . . . . . . . . . . . . . .
FIXED ASSETS COST DEPRECIATION Land 3 11 , 0 2 7 , 8 6 8 . . . . . . . . . . .
Land Improvements 1 7 , 0 9 3 , 54 3 6 , 94 9 , 4 2 6 Bui ldings & Improvements 1 , 4 7 8 , 9 6 6 , 724 2 6 6 , 5 9 2 , 8 9 8 Furniture & Equipment 4 2 9 , 4 6 6 , 2 6 4 3 13 , 52 1 , 623 Lease Improvements 14 , 64 3 , 8 8 3 5 , 4 1 6 , 362 Construction in Progres s 2 , 74 4 , 3 3 5 . . . . . . . . . . .
TOTAL FIXED ASSETS . . . . . . . . . . . . . . . . . . . . . . . . . . . . . . . . . . . . . . . .
OTHER ASSETS
TOTAL ASSETS
LIABILITIES AND CAPITAL CURRENT LIABILITIES
Accounts Payabl e - Trade . . . . . . . . . . . . . . . . . . . . . . . . . . . . . . . . Accounts Payable - Other . . . . . . . . . . . . . . . . . . . . . . . . . . . . . . . .
Current Portion of Long- Term Debt . . . . . . . . . . . . . . . . . . . . . . .
Accrued Expenses . . . . . . . . . . . . . . . . . . . . . . . . . . . . . . . . . . . . . . . .
Other current Liabilities . . . . . . . . . . . . . . . . . . . . . . . . . . . . . . .
TOTAL CURRENT LIABILITIES . . . . . . . . . . . . . . . . . . . . . . . . . . . . . . . . .
LONG-TERM DEBT Mortgages Debentures & Bonds Notes Contracts Other
TOTAL LONG-TERM DEBT OTHER LIABILITIES TOTAL LIABILITIES
CAPITAL
TOTAL OWING CURRENT PORTION 1 0 , 2 19 , 4 1 8 2 0 4 , 0 0 0
0 0 15 , 2 95 , 4 9 7 5 8 5 , 0 7 0
5 6 9 , 0 4 7 3 0 7 , 2 9 0 1 7 2 , 7 7 8 , 7 0 7 3 , 2 3 5 , 0 0 0 1 9 8 , 86 2 , 6 6 9 4 , 3 3 1 , 360
Owners Capital Accounts . . . . . . . . . . . . . . . . . . . . . . . . . . . . . . . . .
Capital Stock & Other Capital . . . . . . . . . . . . . . . . . . . . . . . . . . .
Retained Earnings . . . . . . . . . . . . . . . . . . . . . . . . . . . . . . . . . . . . . . .
TOTAL CAPITAL . . . . . . . . . . . . . . . . . . . . . . . . . . . . . . . . . . . . . . . . . . . . .
TOTAL LIABILITIES AND CAPITAL . . . . . . . . . . . . . . . . . . . . . . . . . . . . . .
Average Assets 73 , 0 0 5 , 2 4 6
Upper Quartile 74 , 3 17 , 130
Median 13 , 62 0 , 6 0 3
2 - 5 7
DOLLARS PERCENT 10 0 , 543 , 7 3 2 4 . 4 %
2 , 4 7 9 , 0 6 6 0 . 1 % 9 , 8 66 , 8 2 9 0 . 4 % 1 , 0 4 3 , 5 9 1 0 . 0 % 2 , 93 3 , 2 9 1 0 . 1%
9 2 , 3 8 6 , 4 1 9 4 . 1% - 14 4 , 0 9 1 , 5 0 3 - 6 . 4 %
6 5 , 161 , 42 5 2 . 9%
3 1 1 , 0 2 7 , 8 6 8 13 . 7% 1 0 , 14 4 , 117 0 . 4 %
1 , 2 12 , 3 73 , 8 2 6 5 3 . 6% 115 , 94 4 , 64 1 5 . 1%
9 , 22 7 , 5 2 1 0 . 4 % 2 , 74 4 , 3 3 5 0 . 1%
1 , 6 6 1 , 4 62 , 3 0 8 73 . 4 %
5 3 6 , 53 8 , 8 7 9 2 3 . 7 %
2 , 2 6 3 , 1 6 2 , 6 12 1 0 0 . 0 %
11 , 4 0 3 , 7 1 0 0 . 5 % 2 6 3 , 62 6 , 0 6 8 11 . 6 %
4 , 3 3 1 , 3 6 0 0 . 2 % 3 0 , 8 2 2 , 554 1 . 4 % 5 0 , 8 3 3 , 7 9 1 2 . 2 %
3 6 1 , 0 1 7 , 4 8 3 1 6 . 0 %
10 , 0 1 5 , 4 1 8 0 . 4 % 0 0 . 0 %
14 , 7 1 0 , 4 2 7 0 . 6 % 2 6 1 , 7 5 7 0 . 0 %
1 6 9 , 54 3 , 7 0 7 7 . 5 % 194 , 5 3 1 , 3 0 9 8 . 6 % - 4 2 , 0 3 8 , 3 74 - 1 . 9% 5 13 , 5 1 0 , 4 1 8 2 2 . 7%
2 2 1 , 6 3 8 , 3 6 7 9 . 8 % 1 , 1 3 1 , 5 8 0 , 1 5 7 5 0 . 0 %
3 9 6 , 4 3 3 , 6 7 0 17 . 5 % 1 , 7 4 9 , 652 , 194 77 . 3 %
2 , 2 6 3 , 1 6 2 , 6 12 1 0 0 . 0 %
Lower Quartile 1 , 8 8 8 , 6 7 0
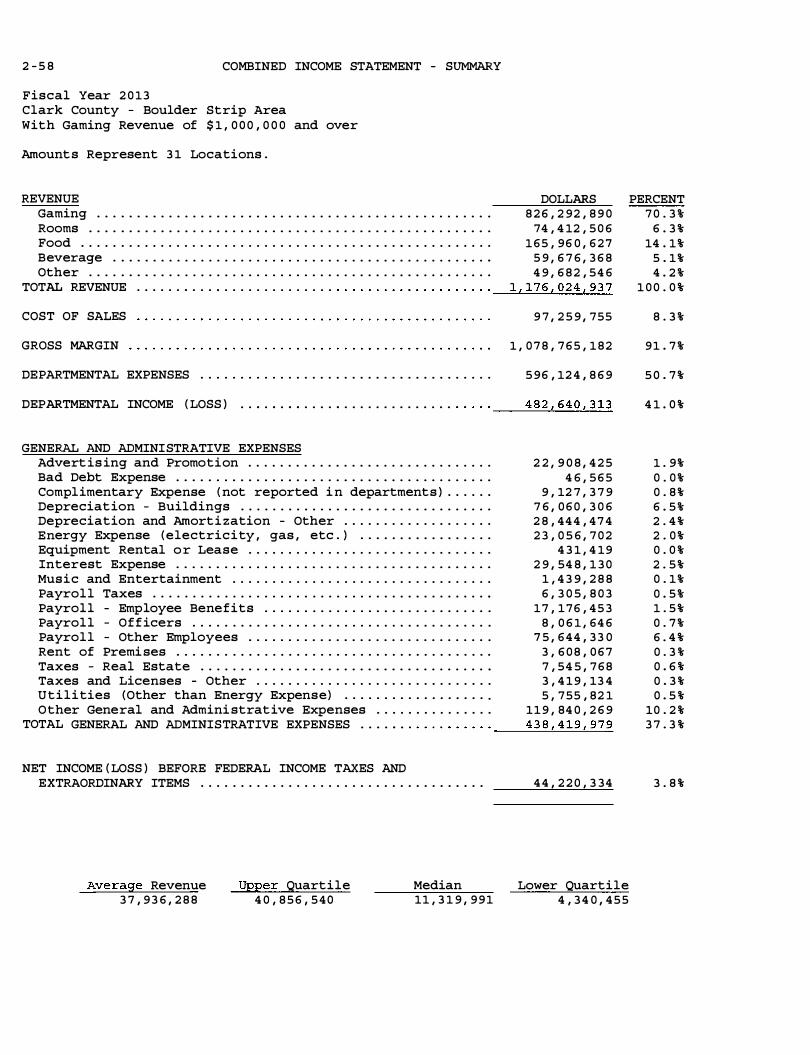
2 - 5 8 COMBINED INCOME STATEMENT - SUMMARY
Fiscal Year 2 0 13 Clark County - Boulder Strip Area With Gaming Revenue of $ 1 , 0 0 0 , 0 0 0 and over
Amount s Represent 3 1 Locations .
REVENUE DOLLARS Gaming . . . . . . . . . . . . . . . . . . . . . . . . . . . . . . . . . . . . . . . . . . . . . . . . . . 8 2 6 , 2 92 , 8 9 0 Rooms . . . . . . . . . . . . . . . . . . . . . . . . . . . . . . . . . . . . . . . . . . . . . . . . . . . 74 , 4 12 , 5 0 6 Food . . . . . . . . . . . . . . . . . . . . . . . . . . . . . . . . . . . . . . . . . . . . . . . . . . . . 1 6 5 , 96 0 , 6 2 7 Beverage . . . . . . . . . . . . . . . . . . . . . . . . . . . . . . . . . . . . . . . . . . . . . . . . 5 9 , 6 7 6 , 3 6 8 Other . . . . . . . . . . . . . . . . . . . . . . . . . . . . . . . . . . . . . . . . . . . . . . . . . . . 4 9 , 6 8 2 , 54 6
1 , 1 7 6 , 0 2 4 , 9 3 7 TOTAL REVENUE . . . . . . . . . . . . . . . . . . . . . . . . . · · · · · · · · · · · · · · · · · · · ·--
�������
COST OF SALES 9 7 , 2 5 9 , 755
GROSS MARGIN 1 , 0 7 8 , 7 6 5 , 1 8 2
DEPARTMENTAL EXPENSES . . . . . . . . . . . . . . . . . . . . . . . . . . . . . . . . . . . . . 5 96 , 12 4 , 8 6 9
DEPARTMENTAL INCOME ( LOSS ) 4 82 , 64 0 , 3 13 . . • . • . • • . . . . • . . . . . . . . . . . . . . · · · · ·
----
-=--=-=-..!...-=--=-�=.=:.
GENERAL AND ADMINISTRATIVE EXPENSES Advert is ing and Promotion . . . . . . . . . . . . . . . . . . . . . . . . . . . . . . . 2 2 , 9 0 8 , 4 2 5 Bad Debt Expense . . . . . . . . . . . . . . . . . . . . . . . . . . . . . . . . . . . . . . . . 4 6 , 5 6 5 Complimentary Expense ( not reported i n departments ) . . . . . . 9 , 12 7 , 3 7 9 Depreciation - Buildings . . . . . . . . . . . . . . . . . . . . . . . . . . . . . . . . 7 6 , 0 6 0 , 3 0 6 Depreciation and Amorti zation - Other . . . . . . . . . . . . . . . . . . . 2 8 , 44 4 , 4 7 4 Energy Expense ( electricity , gas , etc . ) . . . . . . . . . . . . . . . . . 2 3 , 0 5 6 , 7 0 2 Equipment Rental o r Lease . . . . . . . . . . . . . . . . . . . . . . . . . . . . . . . 4 3 1 , 4 19 Interest Expense . . . . . . . . . . . . . . . . . . . . . . . . . . . . . . . . . . . . . . . . 2 9 , 54 8 , 1 3 0 Music and Entertainment . . . . . . . . . . . . . . . . . . . . . . . . . . . . . . . . . 1 , 4 3 9 , 2 8 8 Payroll Taxes . . . . . . . . . . . . . . . . . . . . . . . . . . . . . . . . . . . . . . . . . . . 6 , 3 0 5 , 8 0 3 Payroll - Employee Benefits . . . . . . . . . . . . . . . . . . . . . . . . . . . . . 1 7 , 176 , 4 5 3 Payroll - Officers . . . . . . . . . . . . . . . . . . . . . . . . . . . . . . . . . . . . . . 8 , 0 6 1 , 64 6 Payroll - Other Employees . . . . . . . . . . . . . . . . . . . . . . . . . . . . . . . 7 5 , 6 4 4 , 3 3 0 Rent of Premi ses . . . . . . . . . . . . . . . . . . . . . . . . . . . . . . . . . . . . . . . . 3 , 6 0 8 , 0 6 7 Taxes - Real Estate . . . . . . . . . . . . . . . . . . . . . . . . . . . . . . . . . . . . . 7 , 54 5 , 7 6 8 Taxes and Licenses - Other . . . . . . . . . . . . . . . . . . . . . . . . . . . . . . 3 , 4 1 9 , 13 4 Utilities (Other than Energy Expense) . . . . . . . . . . . . . . . . . . . 5 , 7 55 , 82 1 Other General and Admini strative Expenses . . . . . . . . . . . . . . . 11 9 , 84 0 , 2 6 9
4 3 8 , 4 1 9 , 9 7 9 TOTAL GENERAL AND ADMINISTRATIVE EXPENSES . . . . . . · · · · · · · · · · ·
----
-=--=-�����
NET INCOME ( LOSS ) BEFORE FEDERAL INCOME TAXES AND EXTRAORDINARY ITEMS . . . . . . . . . . . . . . . . . . . . . . . . . . . . . . . . . . . .
Average Revenue 3 7 , 9 3 6 , 2 8 8
Upper Quartile 4 0 , 8 5 6 , 5 4 0
Median 11 , 3 1 9 , 9 9 1
4 4 , 2 2 0 , 3 34
Lower Quartile 4 , 3 4 0 , 4 5 5
PERCENT 7 0 . 3 %
6 . 3 % 14 . 1%
5 . 1% 4 . 2 %
1 0 0 . 0 %
8 . 3 %
9 1 . 7 %
5 0 . 7 %
4 1 . 0 %
1 . 9% 0 . 0 % 0 . 8 % 6 . 5 % 2 . 4 % 2 . 0 % 0 . 0 % 2 . 5 % 0 . 1% 0 . 5 % 1 . 5 % 0 . 7 % 6 . 4 % 0 . 3 % 0 . 6 % 0 . 3 % 0 . 5 %
10 . 2 % 3 7 . 3 %
3 . 8 %

COMBINED INCOME STATEMENT - DETAIL 2 - 5 9 Fi scal Year 2 0 13 C lark County - Boulder Strip Area W i th Gaming Revenue of $ 1 , 0 0 0 , 0 0 0 and over
Amounts Represent 3 1 Locations .
CASINO DEPARTMENT
REVENUE DOLLARS PERCENT Pit Revenue ( Includes Keno and Bingo) . . . . . . . . . . . . . . . . . . . 6 3 , 5 3 4 , 7 2 0 7 . 7 % Coin Operated Devices . . . . . . . . . . . . . . . . . . . . . . . . . . . . . . . . . . . 72 1 , 3 0 1 , 6 8 4 8 7 . 3 % Poker and Pan . . . . . . . . . . . . . . . . . . . . . . . . . . . . . . . . . . . . . . . . . . . 8 , 13 0 , 3 6 6 1 . 0 % Race Book . . . . . . . . . . . . . . . . . . . . . . . . . . . . . . . . . . . . . . . . . . . . . . . 1 1 , 3 4 3 , 3 7 5 1 . 4 % Sports Pool . . . . . . . . . . . . . . . . . . . . . . . . . . . . . . . . . . . . . . . . . . . . . 2 1 , 98 2 , 7 4 5 2 . 7 %
TOTAL REVENUE . . . . . . . . . . . . . . . . . . . . . . . . . . . . . . . . . . . . . . . . . . . . . 8 2 6 , 2 92 , 8 9 0 100 . 0 %
DEPARTMENTAL EXPENSES Bad Debt Expense . . . . . . . . . . . . . . . . . . . . . . . . . . . . . . . . . . . . . . . . 7 7 1 , 44 0 0 . 1% Commiss ions . . . . . . . . . . . . . . . . . . . . . . . . . . . . . . . . . . . . . . . . . . . . . 12 , 2 0 1 , 7 0 3 1 . 5 % Complimentary Expense . . . . . . . . . . . . . . . . . . . . . . . . . . . . . . . . . . . 9 8 , 8 5 7 , 8 0 0 12 . 0 % Gaming Taxes and Licenses . . . . . . . . . . . . . . . . . . . . . . . . . . . . . . . 6 6 , 4 8 6 , 3 8 9 8 . 0 % Preferred Guest Expenses (no complimentarie s ) . . . . . . . . . . . 2 , 6 9 0 , 0 2 8 0 . 3 % Payroll Taxes . . . . . . . . . . . . . . . . . . . . . . . . . . . . . . . . . . . . . . . . . . . 9 , 14 3 , 7 2 5 1 . 1% Payrol l - Employee Benefits . . . . . . . . . . . . . . . . . . . . . . . . . . . . . 17 , 96 6 , 1 0 5 2 . 2 % Payrol l - Officers . . . . . . . . . . . . . . . . . . . . . . . . . . . . . . . . . . . . . . 3 , 0 6 1 , 5 0 9 0 . 4 % Payroll - Other Employees . . . . . . . . . . . . . . . . . . . . . . . . . . . . . . . 6 6 , 6 9 2 , 9 6 4 8 . 1% Race Wire Fees . . . . . . . . . . . . . . . . . . . . . . . . . . . . . . . . . . . . . . . . . . 2 , 14 5 , 2 2 4 0 . 3 % Other Departmental Expenses . . . . . . . . . . . . . . . . . . . . . . . . . . . . . 92 , 0 3 2 , 6 14 11 . 1%
TOTAL DEPARTMENTAL EXPENSES . . . . . . . . . . . . . . . . . . . . . . . . . . . . . . . 3 72 , 0 4 9 , 5 0 1 4 5 . 0 %
DEPARTMENTAL INCOME ( LOSS ) . . . . . . . . . . . . . . . . . . . . . . . . . . . . . . . . . 4 54 , 24 3 , 3 8 9 55 . 0 %
ROOMS DEPARTMENT
REVENUE DOLLARS PERCENT Room Sales . . . . . . . . . . . . . . . . . . . . . . . . . . . . . . . . . . . . . . . . . . . . . . 5 8 , 02 3 , 6 3 1 7 8 . 0 % Complimentary Rooms . . . . . . . . . . . . . . . . . . . . . . . . . . . . . . . . . . . . . 16 , 3 8 8 , 8 7 5 2 2 . 0 %
TOTAL REVENUE . . . . . . . . . . . . . . . . . . . . . . . . . . . . . . . . . . . . . . . . . . . . . 74 , 4 12 , 5 0 6 1 0 0 . 0 %
DEPARTMENTAL EXPENSES Bad Debt Expense . . . . . . . . . . . . . . . . . . . . . . . . . . . . . . . . . . . . . . . . 2 0 6 , 6 2 3 0 . 3 % Compl imentary Expense . . . . . . . . . . . . . . . . . . . . . . . . . . . . . . . . . . . 1 , 4 7 6 , 0 1 1 2 . 0 % Payrol l - Taxes · . . . . . . . . . . . . . . . . . . . . . . . . . . . . . . . . . . . . . . . . . 2 , 3 8 3 , 6 9 8 3 . 2 % Payrol l - Employee Benefits . . . . . . . . . . . . . . . . . . . . . . . . . . . . . 5 , 15 5 , 3 0 3 6 . 9% Payrol l - Officers . . . . . . . . . . . . . . . . . . . . . . . . . . . . . . . . . . . . . . 3 , 3 74 , 14 7 4 . 5% Payroll - Other Employees . . . . . . . . . . . . . . . . . . . . . . . . . . . . . . . 18 , 98 7 , 7 8 3 2 5 . 5% Other Departmental Expenses . . . . . . . . . . . . . . . . . . . . . . . . . . . . . 12 , 12 9 , 9 0 9 16 . 3 %
TOTAL DEPARTMENTAL EXPENSES . . . . . . . . . . . . . . . . . . . . . . . . . . . . . . . 4 3 , 713 , 4 7 4 5 8 . 7 %
DEPARTMENTAL INCOME ( LOSS ) . . . . . . . . . . . . . . . . . . . . . . . . . . . . . . . . . 3 0 , 6 9 9 , 0 3 2 4 1 . 3 %

2 - 6 0 COMBINED INCOME STATEMENT - DETAIL ( CONTINUED)
Fiscal Year 2 0 13 Clark County - Boulder Strip Area With Gaming Revenue of $ 1 , 0 0 0 , 0 0 0 and over
Amounts Represent 3 1 Locations .
FOOD DEPARTMENT REVENUE DOLLARS PERCENT
Food Sale s 115 , 554 , 8 5 2 6 9 . 6 % Complimentary Food Sales . . . . . . . . . . . . . . . . . . . . . . . . . . . . . . . . 5 0 , 4 0 5 , 7 7 5 3 0 . 4 %
TOTAL REVENUE . . . . . . . . . . . . . . . . . . . . . . . . . . . . . . . . . . . . . . . . . . . . . 1 6 5 , 96 0 , 6 2 7 1 0 0 . 0 %
COST OF SALES 7 0 , 2 8 2 , 10 9 4 2 . 3 %
GROSS MARGIN 9 5 , 6 7 8 , 5 1 8 5 7 . 7 %
DEPARTMENTAL EXPENSES Bad Debt Expense . . . . . . . . . . . . . . . . . . . . . . . . . . . . . . . . . . . . . . . . 2 , 7 3 9 0 . 0 % Complimentary Expense . . . . . . . . . . . . . . . . . . . . . . . . . . . . . . . . . . . 1 , 7 1 0 , 1 5 2 1 . 0 % Payrol l - Taxes . . . . . . . . . . . . . . . . . . . . . . . . . . . . . . . . . . . . . . . . . 9 , 4 0 6 , 8 6 9 5 . 7 % Payrol l - Employee Benefits . . . . . . . . . . . . . . . . . . . . . . . . . . . . . 1 9 , 9 0 5 , 052 12 . 0 % Payrol l - Officers . . . . . . . . . . . . . . . . . . . . . . . . . . . . . . . . . . . . . . 1 , 3 8 5 , 117 0 . 8 % Payroll - Other Employees . . . . . . . . . . . . . . . . . . . . . . . . . . . . . . . 7 7 , 0 5 0 , 2 65 4 6 . 4 % Other Departmental Expenses . . . . . . . . . . . . . . . . . . . . . . . . . . . . . 14 , 5 7 0 , 8 3 1 8 . 8 %
TOTAL DEPARTMENTAL EXPENSES . . . . . . . . . . . . . . . . . . . . . . . . . . . . . . . 124 , 0 3 1 , 0 2 5 74 . 7 %
DEPARTMENTAL INCOME (LOSS ) - 2 8 , 3 5 2 , 5 0 7 - 17 . 1%
BEVERAGE DEPARTMENT REVENUE DOLLARS PERCENT
Beverage Sales . . . . . . . . . . . . . . . . . . . . . . . . . . . . . . . . . . . . . . . . . . 2 2 , 1 7 1 , 8 9 6 3 7 . 2 % Compl imentary Beverage Sales . . . . . . . . . . . . . . . . . . . . . . . . . . . . 3 7 , 504 , 4 72 62 . 8 %
TOTAL REVENUE . . . . . . . . . . . . . . . . . . . . . . . . . . . . . . . . . . . . . . . . . . . . . 5 9 , 6 7 6 , 3 6 8 1 0 0 . 0 %
COST OF SALES 1 8 , 5 6 0 , 6 1 3 3 1 . 1 %
GROSS MARGIN . . . . . . . . . . . . . . . . . . . . . . . . . . . . . . . . . . . . . . . . . . . . . . 4 1 , 115 , 7 5 5 6 8 . 9 %
DEPARTMENTAL EXPENSES Bad Debt Expense . . . . . . . . . . . . . . . . . . . . . . . . . . . . . . . . . . . . . . . . 0 0 . 0 % Complimentary Expense . . . . . . . . . . . . . . . . . . . . . . . . . . . . . . . . . . . 113 , 74 3 0 . 2 % Payroll - Taxes . . . . . . . . . . . . . . . . . . . . . . . . . . . . . . . . . . . . . . . . . 2 , 6 3 5 , 3 1 1 4 . 4 % Payroll - Employee Benefits . . . . . . . . . . . . . . . . . . . . . . . . . . . . . 5 , 3 9 8 , 1 3 5 9 . 0 % Payroll - Officers . . . . . . . . . . . . . . .. . . . . . . . . . . . . . . . . . . . . . . . 62 , 1 7 1 0 . 1% Payroll - Other Employees . . . . . . . . . . . . . . . . . . . . . . . . . . . . . . . 1 8 , 0 2 3 , 0 8 4 3 0 . 2 % Other Departmental Expenses . . . . . . . . . . . . . . . . . . . . . . . . . . . . . 2 , 4 7 5 , 2 6 6 4 . 1%
TOTAL DEPARTMENTAL EXPENSES . . . . . . . . . . . . . . . . . . . . . . . . . . . . . . . 2 8 , 7 0 7 , 7 1 0 4 8 . 1 %
DEPARTMENTAL INCOME (LOSS ) . . . . . . . . . . . . . . . . . . . . . . . . . . . . . . . . . 12 , 4 0 8 , 0 4 5 2 0 . 8 %

COMBINED INCOME STATEMENT - DETAIL ( CONTINUED )
Fiscal Year 2 0 13 Clark County - Boulder Strip Area With Gaming Revenue of $ 1 , 0 0 0 , 0 0 0 and over
Amounts Represent 3 1 Locations .
OTHER INCOME REVENUE
Other Operating and Non- operating Income . . . . . . . . . . . . . . . .
Other Complimentary I tems . . . . . . . . . . . . . . . . . . . . . . . . . . . . . . . TOTAL REVENUE . . . . . . . . . . . . . . . . . . . . . . . . . . . . . . . . . . . . . . . . . . . . .
COST OF SALES . . . . . . . . . . . . . . . . . . . . . . . . . . . . . . . . . . . . . . . . . . . . .
GROSS MARGIN . . . . . . . . . . . . . . . . . . . . . . . . . . . . . . . . . . . . . . . . . . . . . .
DEPARTMENTAL EXPENSES Bad Debt Expense . . . . . . . . . . . . . . . . . . . . . . . . . . . . . . . . . . . . . . . .
Complimentary Expense . . . . . . . . . . . . . . . . . . . . . . . . . . . . . . . . . . .
Payroll - Taxes . . . . . . . . . . . . . . . . . . . . . . . . . . . . . . . . . . . . . . . . .
Payroll - Employee Benefits . . . . . . . . . . . . . . . . . . . . . . . . . . . . .
Payroll - Officers . . . . . . . . . . . . . . . . . . . . . . . . . . . . . . . . . . . . . .
Payroll - Other Employees . . . . . . . . . . . . . . . . . . . . . . . . . . . . . . .
Other Departmental Expenses . . . . . . . . . . . . . . . . . . . . . . . . . . . . .
TOTAL DEPARTMENTAL EXPENSES . . . . . . . . . . . . . . . . . . . . . . . . . . . . . . .
DEPARTMENTAL INCOME ( LOS S ) . . . . . . . . . . . . . . . . . . . . . . . . . . . . . . . . .
AVERAGE NUMBER OF EMPLOYEES FOR THE YEAR
CASINO DEPARTMENT ROOMS DEPARTMENT . . . . . . . . . . . . . . . . . . . . . . FOOD DEPARTMENT . . . . . . . . . . . . . . . . . . . . . . .
BEVERAGE DEPARTMENT . . . . . . . . . . . . . . . . . . . G & A DEPARTMENT . . . . . . . . . . . . . . . . . . . . .
OTHER DEPARTMENTS . . . . . . . . . . . . . . . . . . . . .
TOTAL
DOLLARS 4 7 , 5 8 5 , 3 5 8
2 , 0 9 7 , 1 8 8 4 9 , 6 8 2 , 5 4 6
8 , 4 1 7 , 0 3 3
4 1 , 2 6 5 , 5 13
0 7 1 8 , 9 9 2
1 , 2 2 7 , 8 6 5 1 , 8 0 4 , 6 6 9
1 3 5 , 0 6 6 9 , 7 6 9 , 7 0 5
1 3 , 9 6 6 , 8 6 2 2 7 , 6 2 3 , 15 9
1 3 , 64 2 , 3 54
2 , 764 7 7 0
3 , 04 6 7 7 8
1 , 8 2 9 5 6 2
9 , 74 9
2 - 6 1
PERCENT 95 . 8 %
4 . 2 % 1 0 0 . 0 %
1 6 . 9%
8 3 . 1%
0 . 0% 1 . 4 % 2 . 5% 3 . 6% 0 . 3 %
1 9 . 7% 2 8 . 1% 5 5 . 6 %
2 7 . 5 %
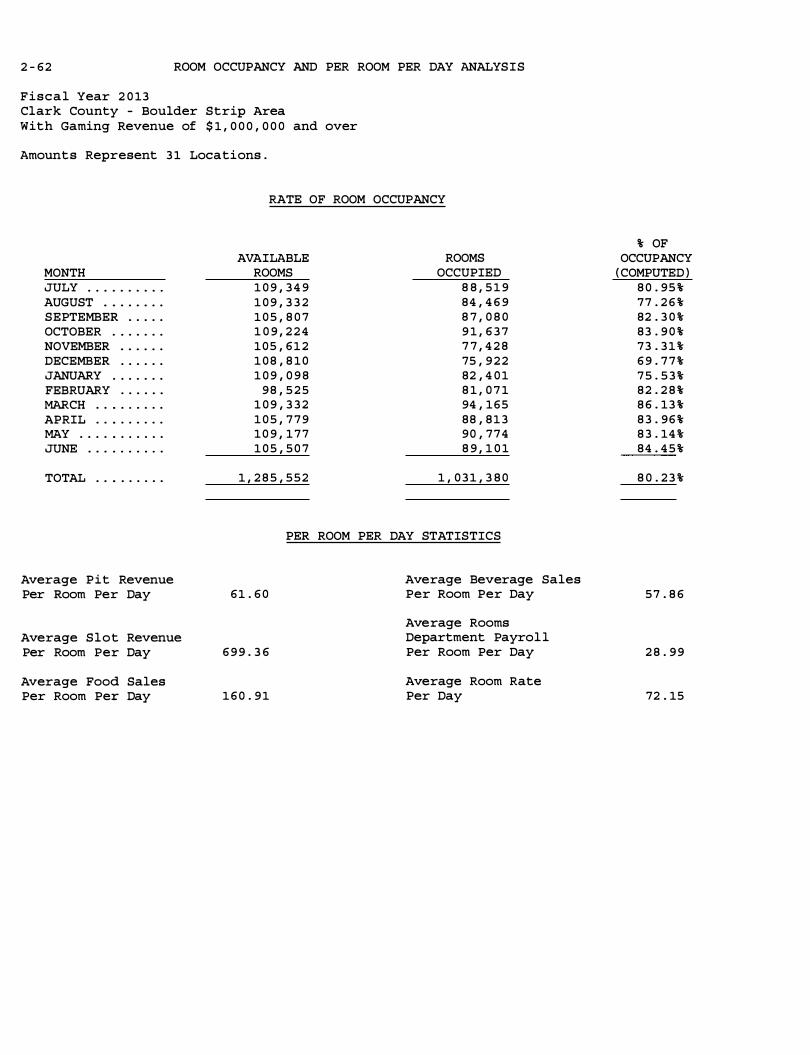
2 - 62 ROOM OCCUPANCY AND PER ROOM PER DAY ANALYSIS
Fiscal Year 2 0 13 Clark County - Boulder Strip Area With Gaming Revenue of $ 1 , 0 0 0 , 0 0 0 and over
Amounts Represent 3 1 Locations .
RATE OF ROOM OCCUPANCY
MONTH JULY . . . . . . . . . ..
AUGUST . . . . . . . . SEPTEMBER . . . . . OCTOBER . . . . . . . NOVEMBER . . . . . . DECEMBER . . . . . . JANUARY . . . . . . . FEBRUARY . . . . . . MARCH . . . . . . . . . APRIL . . . . . . . . . MAY . . . . . . . . . . . JUNE . . . . . . . . .. .
TOTAL . . . . . . . . .
Average Pit Revenue Per Room Per Day
Average Slot Revenue Per Room Per Day
Average Food Sales Per Room Per Day
AVAILABLE ROOMS ROOMS OCCUPIED 1 0 9 , 3 4 9 8 8 , 5 1 9 1 0 9 , 3 3 2 84 , 4 6 9 1 0 5 , 8 0 7 8 7 , 0 8 0 1 0 9 , 2 2 4 9 1 , 6 3 7 1 0 5 , 6 1 2 7 7 , 4 2 8 1 0 8 , 8 1 0 75 , 9 2 2 1 0 9 , 0 9 8 82 , 4 0 1
9 8 , 5 2 5 8 1 , 0 7 1 1 0 9 , 3 3 2 94 , 165 1 0 5 , 7 7 9 88 , 8 1 3 1 0 9 , 1 7 7 90 , 774 1 0 5 , 5 0 7 8 9 , 1 0 1
1 , 2 8 5 , 5 5 2 1 , 0 3 1 , 3 8 0
PER ROOM PER DAY STATISTICS
6 1 . 6 0
6 9 9 . 3 6
1 6 0 . 9 1
Average Beverage Sales Per Room Per Day
Average Rooms Department Payrol l Per Room Per Day
Average Room Rate Per Day
% OF OCCUPANCY
( COMPUTED ) 8 0 . 95 % 77 . 2 6 % 82 . 3 0 % 8 3 . 9 0 % 73 . 3 1 % 6 9 . 7 7 % 7 5 . 5 3 % 8 2 . 2 8 % 8 6 . 13 % 8 3 . 96 % 8 3 . 14 % 84 . 4 5 %
8 0 . 2 3 %
5 7 . 8 6
2 8 . 9 9
72 . 15

PER SQUARE FOOT ANALYSIS AND RATIOS 2 - 6 3 Fi scal Year 2 0 13 Clark County - Boulder Strip Area With Gaming Revenue of $ 1 , 0 0 0 , 0 0 0 and over
Amounts Represent 3 1 Locations .
GAMING REVENUE PER SQUARE FOOT OF FLOOR SPACE
NO . OF CASINOS AVERAGE AREA GAMING REVENUE AREA OPERATING IN SQUARE FEET PER SQUARE
Pit ( Includes Bingo and Keno ) 14 8 , 34 7 Coin Operated Devices 3 0 2 4 , 5 94 Poker and Pan 8 1 , 9 2 5 Race and Sports 14 4 , 2 6 2
TOTAL CASINO 3 1 2 9 , 9 9 1
RATIOS
TOTAL CURRENT ASSETS TO TOTAL CURRENT LIABILITIES . . . . . . . . .
TOTAL CAPITAL TO TOTAL LIABILITIES . . . . . . . . . . . . . . . . . . . . . . . .
TOTAL CAPITAL TO TOTAL CURRENT LIABILITIES . . . . . . . . . . . . . . . .
TOTAL CURRENT LIABILITIES TO TOTAL LIABILITIES . . . . . . . . . . . .
TOTAL COMPLIMENTARY EXPENSE TO GAMING REVENUE . . . . . . . . . . . . .
MUS IC AND ENTERTAINMENT EXPENSES TO GAMING REVENUE . . . . . . . .
TOTAL REVENUE TO AVERAGE TOTAL ASSETS . . . . . . . . . . . . . . . . . . . . .
TOTAL REVENUE LESS COMP SALES TO AVERAGE TOTAL ASSETS . . . . .
RETURN ON INVESTED CAPITAL* . . . . . . . . . . . . . . . . . . . . . . . . . . . . . . .
RETURN ON AVERAGE ASSETS* . . . . . . . . . . . . . . . . . . . . . . . . . . . . . . . . .
* - FORMULAS
Return on Invested Capital i s equal to the total of net income (before federal income taxes and extraordinary items ) and interest
expense divided by the total of average total assets less average current liabi lities .
PERCENT 1 8 . 0%
3 4 0 . 7 %
4 8 4 . 6%
7 0 . 3 %
13 . 6 %
0 . 2 %
4 8 . 7%
4 4 . 3 %
4 . 0 %
3 . 1%
Return on Average Assets i s equal to the total of net income ( be fore federal income taxes and extraordinary items ) and interest expense divided by the average total asset s .
FOOT
5 4 4 9 7 8 52 8 5 5 9
8 8 9

2 - 64
THIS PAGE LEFT INTENTIONALLY BLANK

COMBINED BALANCE SHEET Fiscal Year 2 0 13 Clark County - Balance of County With Gaming Revenue of $ 1 , 0 0 0 , 0 0 0 and over
Amounts Represent 5 1 Locations .
ASSETS CURRENT ASSETS
Cash . . . . . . . . . . . . . . . . . . . . . . . . . . . . . . . . . . . . . . . . . . . . . . . . . . . .
Receivables TOTAL ALLOWANCE Casino 7 , 54 2 , 1 8 9 2 , 54 4 , 8 4 0 Trade 4 1 , 4 9 0 , 8 3 0 5 9 5 , 2 63 Sundry 3 8 , 0 2 0 , 4 54 3 3 , 3 1 0 Notes 4 , 3 3 7 , 16 9 0
Prepaid Expenses . . . . . . . . . . . . . . . . . . . . . . . . . . . . . . . . . . . . . . . .
Other Current Assets . . . . . . . . . . . . . . . . . . . . . . . . . . . . . . . . . . . .
TOTAL CURRENT ASSETS . . . . . . . . . . . . . . . . . . . . . . . . . . . . . . . . . . . . . .
FIXED ASSETS COST DEPRECIATION Land 4 3 8 , 64 7 , 14 8 . . . . . . . . . . .
Land Improvements 9 2 , 0 0 7 , 8 0 3 4 2 , 954 , 6 1 6 Buildings & Improvements 2 , 4 9 2 , 1 7 5 , 122 4 2 7 , 24 2 , 0 5 0 Furniture & Equipment 6 54 , 74 5 , 8 8 0 4 9 8 , 4 3 2 , 6 4 9 Lease Improvements 4 5 , 72 9 , 5 0 7 2 2 , 14 6 , 2 5 9 Construction i n Progress 8 , 8 62 , 54 9 . . . . . . . . . . .
TOTAL FIXED ASSETS . . . . . . . . . . . . . . . . . . . . . . . . . . . . . . . . . . . . . . . .
OTHER ASSETS
TOTAL ASSETS
LIABILITIES AND CAPITAL CURRENT LIABILITIES
Accounts Payable - Trade . . . . . . . . . . . . . . . . . . . . . . . . . . . . . . . .
Accounts Payable - Other . . . . . . . . . . . . . . . . . . . . . . . . . . . . . . . .
Current Portion of Long- Term Debt . . . . . . . . . . . . . . . . . . . . . . .
Accrued Expenses . . . . . . . . . . . . . . . . . . . . . . . . . . . . . . . . . . . . . . . .
Other Current Liabil ities . . . . . . . . . . . . . . . . . . . . . . . . . . . . . . .
TOTAL CURRENT LIABILITIES . . . . . . . . . . . . . . . . . . . . . . . . . . . . . . . . .
LONG-TERM DEBT Mortgages Debentures & Bonds
TOTAL OWING 4 5 , 6 6 3 , 5 7 2
0
CURRENT PORTION 4 5 , 22 2 , 0 2 8
0 Notes 2 94 , 13 2 , 724 2 3 , 2 0 3 , 3 72 Contracts 2 , 3 9 9 , 2 7 0 9 3 6 , 9 9 6 Other 9 4 5 , 13 1 , 8 7 0 2 2 , 125 , 2 61
TOTAL LONG-TERM DEBT 1 , 2 8 7 , 3 2 7 , 4 3 6 9 1 , 4 8 7 , 6 5 7 OTHER LIABILITIES . . . . . . . . . . . . . . . . . . . . . . . . . . . . . . . . . . . . . . . . .
TOTAL LIABILITIES
CAPITAL Owners Capital Accounts . . . . . . . . . . . . . . . . . . . . . . . . . . . . . . . . .
Capital Stock & Other Capital . . . . . . . . . . . . . . . . . . . . . . . . . . .
Retained Earnings . . . . . . . . . . . . . . . . . . . . . . . . . . . . . . . . . . . . . . .
TOTAL CAPITAL . . . . . . . . . . . . . . . . . . . . . . . . . . . . . . . . . . . . . . . . . . . . .
TOTAL LIABILITIES AND CAPITAL . . . . . . . . . . . . . . . . . . . . . . . . . . . . . .
Average Assets 9 9 , 4 7 2 , 6 7 0
Upper Quartile 3 9 , 5 7 2 , 0 3 2
Median 4 , 0 6 1 , 2 1 3
2 - 6 5
DOLLARS PERCENT 2 0 1 , 9 5 0 , 9 8 3
4 , 9 9 7 , 3 4 9 4 0 , 8 9 5 , 5 6 7 3 7 , 9 8 7 , 144
4 , 33 7 , 16 9 4 3 , 5 11 , 4 4 3
3 6 9 , 6 13 , 9 0 1 7 0 3 , 2 9 3 , 5 5 6
4 3 8 , 6 4 7 , 14 8 4 9 , 0 5 3 , 1 8 7
2 , 0 64 , 9 3 3 , 0 72 156 , 3 1 3 , 2 3 1
2 3 , 58 3 , 2 4 8 8 , 8 6 2 , 5 4 9
2 , 74 1 , 3 92 , 4 3 5
1 , 62 8 , 4 2 0 , 1 5 8
5 , 0 7 3 , 10 6 , 14 9
2 4 , 6 8 0 , 0 9 5 3 4 , 5 8 1 , 7 8 3 9 1 , 4 8 7 , 6 5 7 7 1 , 80 5 , 3 4 8 7 0 , 8 5 6 , 7 0 4
2 93 , 4 1 1 , 5 8 7
4 4 1 , 5 4 4 0
2 7 0 , 92 9 , 3 5 2 1 , 4 6 2 , 2 74
92 3 , 0 0 6 , 6 0 9 1 , 195 , 8 3 9 , 7 7 9
7 7 , 7 72 , 6 3 0 1 , 5 6 7 , 0 2 3 , 9 9 6
1 , 4 2 4 , 13 5 , 7 8 8 1 , 7 3 8 , 67 9 , 3 2 5
3 4 3 , 2 6 7 , 0 4 0 3 , 5 0 6 , 0 8 2 , 153
5 , 0 7 3 , 1 0 6 , 14 9
Lower Quartile 7 3 5 , 4 9 3
4 . 0 %
0 . 1% 0 . 8 % 0 . 7% 0 . 1% 0 . 9% 7 . 3 %
13 . 9%
8 . 6 % 1 . 0 %
4 0 . 7 % 3 . 1% 0 . 5 % 0 . 2 %
54 . 0 %
3 2 . 1%
1 0 0 . 0 %
0 . 5 % 0 . 7% 1 . 8 % 1 . 4 % 1 . 4 % 5 . 8 %
0 . 0% 0 . 0 % 5 . 3 % 0 . 0 %
1 8 . 2 % 2 3 . 6 %
1 . 5 % 3 0 . 9%
2 8 . 1% 3 4 . 3 %
6 . 8 % 6 9 . 1%
1 0 0 . 0 %

2 - 6 6 COMBINED INCOME STATEMENT - SUMMARY
Fiscal Year 2 0 1 3 Clark County - Balance of County With Gaming Revenue of $ 1 , 0 0 0 , 0 0 0 and over
Amounts Represent 5 1 Locations .
REVENUE DOLLARS Gaming . . . . . . . . . . . . . . . . . . . . . . . . . . . . . . . . . . . . . . . . . . . . . . . . . . 1 , 4 3 6 , 2 9 7 , 44 3 Rooms . . . . . . . . . . . . . . . . . . . . . . . . . . . . . . . . . . . . . . . . . . . . . . . . . . . 1 92 , 2 9 0 , 2 3 3 Food . . . . . . . . . . . . . . . . . . . . . . . . . . . . . . . . . . . . . . . . . . . . . . . . . . . . 2 8 7 , 6 0 4 , 2 0 5 Beverage . . . . . . . . . . . . . . . . . . . . . . . . . . . . . . . . . . . . . . . . . . . . . . . . 1 12 , 665 , 7 75 Other . . . . . . . . . . . . . . . . . . . . . . . . . . . . . . . . . . . . . . . . . . . . . . . . . . . 1 8 8 , 92 5 , 9 0 3
2 , 2 17 , 7 8 3 , 5 5 9 TOTAL REVENUE . . . . . . . . . . . . . . . . . . . . . . . . . . . . . . . . . . . . . . . . . . · · · --�������
COST OF SALES 2 3 0 , 2 2 1 , 8 7 0
GROSS MARGIN 1 , 9 8 7 , 5 6 1 , 6 8 9
DEPARTMENTAL EXPENSES . . . . . . . . . . . . . . . . . . . . . . . . . . . . . . . . . . . . . 1 , 0 8 1 , 2 9 5 , 177
DEPARTMENTAL INCOME ( LOSS ) 9 0 6 , 2 6 6 , 512 • • • • • • • • • • • • • • • • • • • • • • • • • • • • • • • • __ _:_:....;:_,_;;;;..;;...;;...<...:::;. -==
GENERAL AND ADMINISTRATIVE EXPENSES Adverti sing and Promotion . . . . . . . . . . . . . . . . . . . . . . . . . . . . . . . 5 0 , 0 1 6 , 3 2 4 B a d Debt Expense . . . . . . . . . . . . . . . . . . . . . . . . . . . . . . . . . . . . . . . . 3 0 8 , 9 8 2 C ompl imentary Expense ( not reported i n departments ) . . . . . . 3 5 , 5 7 3 , 4 9 6 Depreciation - Buildings . . . . . . . . . . . . . . . . . . . . . . . . . . . . . . . . 1 15 , 2 3 8 , 2 5 7 Depreciation and Amorti zation - Other . . . . . . . . . . . . . . . . . . . 54 , 3 3 3 , 5 5 0 Energy Expense ( electricity, gas , etc . ) . . . . . . . . . . . . . . . . . 4 1 , 6 3 7 , 1 4 3 Equipment Rental o r Lease . . . . . . . . . . . . . . . . . . . . . . . . . . . . . . . 6 , 0 9 7 , 9 9 8 Interest Expense . . . . . . . . . . . . . . . . . . . . . . . . . . . . . . . . . . . . . . . . 8 8 , 6 8 5 , 3 95 Music and Entertainment . . . . . . . . . . . . . . . . . . . . . . . . . . . . . . . . . 4 , 195 , 1 4 3 Payroll Taxes . . . . . . . . . . . . . . . . . . . . . . . . . . . . . . . . . . . . . . . . . . . 12 , 82 1 , 8 9 0 Payroll - Employee Benefits . . . . . . . . . . . . . . . . . . . . . . . . . . . . . 2 9 , 965 , 7 1 1 Payroll - Officers . . . . . . . . . . . . . . . . . . . . . . . . . . . . . . . . . . . . . . 2 , 5 3 8 , 855 Payroll - Other Employees . . . . . . . . . . . . . . . . . . . . . . . . . . . . . . . 144 , 9 0 7 , 64 3 Rent o f Premi ses . . . . . . . . . . . . . . . . . . . . . . . . . . . . . . . . . . . . . . . . 12 , 92 0 , 0 9 3 Taxes - Real Estate . . . . . . . . . . . . . . . . . . . . . . . . . . . . . . . . . . . . . 1 7 , 2 64 , 3 12 Taxes and Licenses - Other . . . . . . . . . . . . . . . . . . . . . . . . . . . . . . 5 , 8 1 3 , 2 5 5 Utilities ( Other than Energy Expense ) . . . . . . . . . . . . . . . . . . . 1 0 , 93 9 , 154 O ther General and Administrative Expenses . . . . . . . . . . . . . . . 15 2 , 9 6 6 , 44 8
7 8 6 , 2 2 3 , 64 9 TOTAL GENERAL AND ADMINISTRATIVE EXPENSES . . . . . . . . . . . · · · · · · ----��==���
NET INCOME ( LOSS ) BEFORE FEDERAL INCOME TAXES AND EXTRAORDINARY ITEMS . . . . . . . . . . . . . . . . . . . . . . . . . . . . . . . . . . . .
Average Revenue 4 3 , 4 8 5 , 952
Upper Quarti le 6 3 , 024 , 0 3 3
Median 6 , 8 8 0 , 757
12 0 , 04 2 , 8 6 3
Lower Quartile 2 , 2 3 5 , 8 0 2
PERCENT 64 . 8 %
8 . 7 % 1 3 . 0 %
5 . 1% 8 . 5 %
1 0 0 . 0 %
1 0 . 4 %
8 9 . 6 %
4 8 . 8 %
4 0 . 9%
2 . 3 % 0 . 0 % 1 . 6 % 5 . 2 % 2 . 4 % 1 . 9 % 0 . 3 % 4 . 0 % 0 . 2 % 0 . 6 % 1 . 4 % 0 . 1% 6 . 5 % 0 . 6 % 0 . 8 % 0 . 3 % 0 . 5 % 6 . 9%
3 5 . 5 %
5 . 4 %

COMBINED INCOME STATEMENT - DETAIL 2 - 67 Fiscal Year 2 0 1 3 Clark County - Balance of County With Gaming Revenue of $ 1 , 0 0 0 , 0 0 0 and over
Amounts Represent 5 1 Locations .
CASINO DEPARTMENT
REVENUE DOLLARS PERCENT Pit Revenue ( Includes Keno and Bingo) . . . . . . . . . . . . . . . . . . . 15 7 , 1 7 9 , 4 5 9 1 0 . 9% Coin Operated Devices . . . . . . . . . . . . . . . . . . . . . . . . . . . . . . . . . . . 1 , 2 14 , 1 0 4 , 2 7 7 84 . 5% Poker and Pan . . . . . . . . . . . . . . . . . . . . . . . . . . . . . . . . . . . . . . . . . . . 1 8 , 7 7 6 , 1 1 3 1 . 3 % Race Book . . . . . . . . . . . . . . . . . . . . . . . . . . . . . . . . . . . . . . . . . . . . . . . 15 , 0 4 1 , 64 8 1 . 0 % Sports Pool . . . . . . . . . . . . . . . . . . . . . . . . . . . . . . . . . . . . . . . . . . . . . 3 1 , 1 9 5 , 94 6 2 . 2 %
TOTAL REVENUE . . . . . . . . . . . . . . . . . . . . . . . . . . . . . . . . . . . . . . . . . . . . . 1 , 4 3 6 , 2 97 , 4 4 3 1 0 0 . 0 %
DEPARTMENTAL EXPENSES Bad Debt Expense . . . . . . . . . . . . . . . . . . . . . . . . . . . . . . . . . . . . . . . . 8 3 , 3 2 4 0 . 0 % Commis sions . . . . . . . . . . . . . . . . . . . . . . . . . . . . . . . . . . . . . . . . . . . . . 2 2 , 6 5 7 , 0 12 1 . 6 % Compl imentary Expense . . . . . . . . . . . . . . . . . . . . . . . . . . . . . . . . . . . 1 6 8 , 7 62 , 1 1 8 1 1 . 7 % Gaming Taxes and Licenses . . . . . . . . . . . . . . . . . . . . . . . . . . . . . . . 1 15 , 2 11 , 7 1 3 8 . 0 % Preferred Guest Expenses ( no compl imentarie s ) . . . . . . . . . . . 4 , 2 6 5 , 5 2 4 0 . 3 % Payroll Taxes . . . . . . . . . . . . . . . . . . . . . . . . . . . . . . . . . . . . . . . . . . . 17 , 8 0 7 , 9 7 5 1 . 2 % Payroll - Employee Benefits . . . . . . . . . . . . . . . . . . . . . . . . . . . . . 3 3 , 3 4 7 , 0 1 6 2 . 3 % Payroll - Officers . . . . . . . . . . . . . . . . . . . . . . . . . . . . . . . . . . . . . . 8 5 , 8 6 3 0 . 0 % Payroll - Other Employees . . . . . . . . . . . . . . . . . . . . . . . . . . . . . . . 1 2 8 , 95 0 , 9 3 8 9 . 0 % Race Wire Fees . . . . . . . . . . . . . . . . . . . . . . . . . . . . . . . . . . . . . . . . . . 1 , 5 17 , 12 6 0 . 1% Other Departmental Expenses . . . . . . . . . . . . . . . . . . . . . . . . . . . . . 1 3 7 , 68 5 , 4 3 3 9 . 6 %
TOTAL DEPARTMENTAL EXPENSES . . . . . . . . . . . . . . . . . . . . . . . . . . . . . . . 6 3 0 , 3 74 , 0 4 2 4 3 . 9 %
DEPARTMENTAL INCOME ( LOSS ) . . . . . . . . . . . . . . . . . . . . . . . . . . . . . . . . . 8 0 5 , 92 3 , 4 0 1 5 6 . 1%
ROOMS DEPARTMENT
REVENUE DOLLARS PERCENT Room Sales . . . . . . . . . . . . . . . . . . . . . . . . . . . . . . . . . . . . . . . . . . . . . . 146 , 8 3 5 , 3 3 1 76 . 4 % Complimentary Rooms . . . . . . . . . . . . . . . . . . . . . . . . . . . . . . . . . . . . . 4 5 , 454 , 9 0 2 2 3 . 6 %
TOTAL REVENUE . . . . . . . . . . . . . . . . . . . . . . . . . . . . . . . . . . . . . . . . . . . . . 1 92 , 2 9 0 , 2 3 3 1 0 0 . 0 %
DEPARTMENTAL EXPENSES Bad Debt Expense . . . . . . . . . . . . . . . . . . . . . . . . . . . . . . . . . . . . . . . . - 2 3 , 174 0 . 0 % Complimentary Expense . . . . . . . . . . . . . . . . . . . . . . . . . . . . . . . . . . . 2 , 5 0 3 , 0 6 3 1 . 3 % Payroll - Taxes . . . . . . . . . . . . . . . . . . . . . . . . . . . . . . . . . . . . . . . . . 5 , 2 9 7 , 5 4 8 2 . 7 % Payroll - Employee Benefits . . . . . . . . . . . . . . . . . . . . . . . . . . . . . 12 , 2 7 3 , 7 3 7 6 . 3 % Payroll - Officers . . . . . . . . . . . . . . . . . . . . . . . . . . . . . . . . . . . . . . 8 3 , 9 5 6 0 . 0 % Payroll - Other Employees . . . . . . . . . . . . . . . . . . . . . . . . . . . . . . . 4 8 , 3 0 3 , 6 0 1 2 5 . 1% Other Departmental Expenses . . . . . . . . . . . . . . . . . . . . . . . . . . . . . 3 1 , 844 , 0 8 0 1 6 . 6 %
TOTAL DEPARTMENTAL EXPENSES . . . . . . . . . . . . . . . . . . . . . . . . . . . . . . . 1 0 0 , 2 8 2 , 8 1 1 5 2 . 2 %
DEPARTMENTAL INCOME ( LOSS ) . . . . . . . . . . . . . . . . . . . . . . . . . . . . . . . . . 92 , 0 0 7 , 4 2 2 4 7 . 8 %

2 - 6 8 COMBINED INCOME STATEMENT - DETAIL ( CONTINUED)
Fiscal Year 2 0 1 3 Clark County - Balance o f County With Gaming Revenue of $ 1 , 0 0 0 , 0 0 0 and over
Amounts Represent 5 1 Locations .
FOOD DEPARTMENT REVENUE DOLLARS PERCENT
Food Sales 2 11 , 14 6 , 7 6 8 7 3 . 4 % Compl imentary Food Sales . . . . . . . . . . . . . . . . . . . . . . . . . . . . . . . . 76 , 4 5 7 , 4 3 7 2 6 . 6 %
TOTAL REVENUE . . . . . . . . . . . . . . . . . . . . . . . . . . . . . . . . . . . . . . . . . . . . . 2 8 7 , 6 04 , 2 0 5 1 0 0 . 0 %
COST OF SALES 1 2 6 , 5 8 6 , 0 4 3 4 4 . 0 %
GROSS MARGIN 16 1 , 0 1 8 , 162 5 6 . 0 %
DEPARTMENTAL EXPENSES Bad Debt Expense . . . . . . . . . . . . . . . . . . . . . . . . . . . . . . . . . . . . . . . . 8 , 4 4 5 0 . 0 % Compl imentary Expense . . . . . . . . . . . . . . . . . . . . . . . . . . . . . . . . . . . 2 , 6 7 7 , 3 9 9 0 . 9% Payroll - Taxes . . . . . . . . . . . . . . . . . . . . . . . . . . . . . . . . . . . . . . . . . 16 , 3 8 2 , 9 0 1 5 . 7 % Payroll - Employee Benefits . . . . . . . . . . . . . . . . . . . . . . . . . . . . . 3 3 , 8 8 1 , 6 2 5 1 1 . 8 % Payrol l - Officers . . . . . . . . . . . . . . . . . . . . . . . . . . . . . . . . . . . . . . 1 , 1 3 9 , 2 6 1 0 . 4 % Payrol l - Other Employees . . . . . . . . . . . . . . . . . . . . . . . . . . . . . . . 1 3 7 , 6 8 1 , 2 17 4 7 . 9 % Other Departmental Expenses . . . . . . . . . . . . . . . . . . . . . . . . . . . . . 1 9 , 4 3 9 , 3 4 2 6 . 8 %
TOTAL DEPARTMENTAL EXPENSES . . . . . . . . . . . . . . . . . . . . . . . . . . . . . . . 2 1 1 , 2 1 0 , 1 9 0 7 3 . 4 %
DEPARTMENTAL INCOME ( LOSS ) . . . . . . . . . . . . . . . . . . . . . . . . . . . . . . . . . - 5 0 , 1 92 , 0 2 8 - 17 . 5 %
BEVERAGE DEPARTMENT REVENUE DOLLARS PERCENT
Beverage Sales . . . . . . . . . . . . . . . . . . . . . . . . . . . . . . . . . . . . . . . . . . 4 1 , 756 , 7 5 0 3 7 . 1% Complimentary Beverage Sales . . . . . . . . . . . . . . . . . . . . . . . . . . . . 7 0 , 9 0 9 , 0 2 5 6 2 . 9 %
TOTAL REVENUE . . . . . . . . . . . . . . . . . . . . . . . . . . . . . . . . . . . . . . . . . . . . . 1 12 , 665 , 7 7 5 1 0 0 . 0 %
COST OF SALES 3 4 , 4 22 , 7 2 1 3 0 . 6 %
GROSS MARGIN . . . . . . . . . . . . . . . . . . . . . . . . . . . . . . . . . . . . . . . . . . . . . . 7 8 , 24 3 , 054 6 9 . 4 %
DEPARTMENTAL EXPENSES Bad Debt Expense . . . . . . . . . . . . . . . . . . . . . . . . . . . . . . . . . . . . . . . . 7 5 0 . 0 % Compl imentary Expense . . . . . . . . . . . . . . . . . . . . . . . . . . . . . . . . . . . 1 , 192 , 4 6 5 1 . 1% Payroll - Taxes . . . . . . . . . . . . . . . . . . . . . . . . . . . . . . . . . . . . . . . . . 4 , 2 6 1 , 6 8 0 3 . 8 % Payroll - Employee Benefits . . . . . . . . . . . . . . . . . . . . . . . . . . . . . 8 , 6 9 7 , 0 9 0 7 . 7 % Payroll - Off icers . . . . . . . . . . . . . . . . . . . . . . . . . . . . . . . . . . . . . . 18 , 0 4 9 0 . 0 % Payroll - Other Employees . . . . . . . . . . . . . . . . . . . . . . . . . . . . . . . 3 0 , 3 02 , 4 8 5 2 6 . 9% Other Departmental Expenses . . . . . . . . . . . . . . . . . . . . . . . . . . . . . 5 , 97 6 , 2 3 7 5 . 3 %
TOTAL DEPARTMENTAL EXPENSES . . . . . . . . . . . . . . . . . . . . . . . . . . . . . . . 5 0 , 4 4 8 , 0 8 1 44 . 8 %
DEPARTMENTAL INCOME ( LOSS ) . . . . . . . . . . . . . . . . . . . . . . . . . . . . . . . . . 2 7 , 7 94 , 9 7 3 2 4 . 7%

COMBINED INCOME STATEMENT - DETAIL ( CONTINUED)
Fiscal Year 2 0 1 3 Clark County - Balance o f County With Gaming Revenue of $ 1 , 0 0 0 , 0 0 0 and over
Amounts Represent 5 1 Locations .
OTHER INCOME REVENUE
Other Operating and Non-operating Income . . . . . . . . . . . . . . . .
Other Complimentary Items . . . . . . . . . . . . . . . . . . . . . . . . . . . . . . .
TOTAL REVENUE . . . . . . . . . . . . . . . . . . . . . . . . . . . . . . . . . . . . . . . . . . . . .
COST OF SALES . . . . . . . . . . . . . . . . . . . . . . . . . . . . . . . . . . . . . . . . . . . . .
GROSS MARGIN . . . . . . . . . . . . . . . . . . . . . . . . . . . . . . . . . . . . . . . . . . . . . .
DEPARTMENTAL EXPENSES Bad Debt Expense . . . . . . . . . . . . . . . . . . . . . . . . . . . . . . . . . . . . . . . .
Complimentary Expense . . . . . . . . . . . . . . . . . . . . . . . . . . . . . . . . . . .
Payroll - Taxes . . . . . . . . . . . . . . . . . . . . . . . . . . . . . . . . . . . . . . . . .
Payrol l - Employee Benefits . . . . . . . . . . . . . . . . . . . . . . . . . . . . .
Payroll - Offi cers . . . . . . . . . . . . . . . . . . . . . . . . . . . . . . . . . . . . . . Payroll - Other Employees . . . . . . . . . . . . . . . . . . . . . . . . . . . . . . .
Other Departmental Expenses . . . . . . . . . . . . . . . . . . . . . . . . . . . . .
TOTAL DEPARTMENTAL EXPENSES . . . . . . . . . . . . . . . . . . . . . . . . . . . . . . .
DEPARTMENTAL INCOME ( LOSS ) . . . . . . . . . . . . . . . . . . . . . . . . . . . . . . . . .
AVERAGE NUMBER OF EMPLOYEES FOR THE YEAR
CASINO DEPARTMENT ROOMS DEPARTMENT . . . . . . . . . . . . . . . . . . . . . .
FOOD DEPARTMENT . . . . . . . . . . . . . . . . . . . . . . .
BEVERAGE DEPARTMENT . . . . . . . . . . . . . . . . . . .
G & A DEPARTMENT . . . . . . . . . . . . . . . . . . . . .
OTHER DEPARTMENTS . . . . . . . . . . . . . . . . . . . . .
TOTAL
DOLLARS 1 7 8 , 6 9 0 , 197
1 0 , 2 3 5 , 7 0 6 1 8 8 , 9 2 5 , 9 0 3
6 9 , 2 13 , 1 0 6
1 19 , 7 12 , 7 9 7
2 7 , 4 3 9 1 1 , 0 94 , 0 6 3
3 , 8 6 2 , 4 8 2 5 , 13 9 , 8 1 6
3 0 8 , 0 2 1 3 3 , 12 8 , 4 5 7 3 5 , 4 19 , 7 7 5 8 8 , 9 8 0 , 0 5 3
3 0 , 7 3 2 , 744
4 , 6 5 3 1 , 8 6 6 5 , 2 3 5 1 , 2 3 4 3 , 3 94 1 , 24 1
1 7 , 6 2 3
2 - 6 9
PERCENT 94 . 6 %
5 . 4 % 1 0 0 . 0 %
3 6 . 6 %
6 3 . 4 %
0 . 0 % 5 . 9% 2 . 0 % 2 . 7% 0 . 2 %
17 . 5 % 18 . 7 % 4 7 . 1%
16 . 3 %

2 - 7 0 ROOM OCCUPANCY AND PER ROOM PER DAY ANALYSIS
Fiscal Year 2 0 13 Clark County - Balance of County With Gaming Revenue of $ 1 , 0 0 0 , 0 0 0 and over
Amounts Represent 51 Locations .
RATE OF ROOM OCCUPANCY
MONTH JULY . . . . . . . . . .
AUGUST . . . . . . . .
SEPTEMBER . . . . .
OCTOBER . . . . . . . NOVEMBER . . . . . . DECEMBER . . . . . . JANUARY . . . . . . . FEBRUARY . . . . . .
MARCH . . . . . . . . .
APRIL . . . . . . . . . MAY . . . . . . . . . . .
JUNE . . . . . . . . . .
TOTAL . . . . . . . . .
Average Pit Revenue Per Room Per Day
Average Slot Revenue Per Room Per Day
Average Food Sales Per Room Per Day
AVAILABLE ROOMS ROOMS OCCUPIED 3 6 5 , 978 2 7 1 , 8 3 1 3 6 4 , 4 2 9 2 5 9 , 4 7 6 3 5 1 , 954 2 5 1 , 6 5 2 3 6 6 , 3 9 0 2 7 9 , 5 6 6 3 4 6 , 7 3 9 2 3 7 , 8 1 3 3 3 6 , 0 7 3 2 3 1 , 8 52 3 64 , 3 8 1 2 3 2 , 1 5 1 3 2 8 , 0 1 7 2 3 6 , 4 9 1 3 6 3 , 2 5 1 2 8 3 , 3 5 8 3 5 1 , 2 5 1 2 6 6 , 2 7 4 3 5 0 , 8 9 0 2 5 1 , 8 7 2 3 3 9 , 5 9 6 2 5 9 , 0 2 8
4 , 2 2 8 , 94 9 3 , 0 6 1 , 3 64
PER ROOM PER DAY STATISTICS
5 1 . 34
3 9 6 . 5 9
93 . 9 5
Average Beverage Sales Per Room Per Day
Average Rooms Department Payrol l Per Room Per Day
Average Room Rate Per Day
% OF OCCUPANCY
( COMPUTED ) 74 . 2 8 % 7 1 . 2 0 % 7 1 . 5 0 % 7 6 . 3 0 % 6 8 . 5 9 % 6 8 . 9 9 % 6 3 . 7 1 % 72 . 1 0 % 7 8 . 0 1 % 75 . 8 1 % 7 1 . 7 8 % 76 . 2 8 %
72 . 3 9 %
3 6 . 8 0
2 1 . 5 5
62 . 8 1

PER SQUARE FOOT ANALYSIS AND RATIOS 2 - 7 1 Fiscal Year 2 0 13 Clark County - Balance of County With Gaming Revenue of $ 1 , 0 0 0 , 0 0 0 and over
Amounts Represent 5 1 Locations .
GAMING REVENUE PER SQUARE FOOT OF FLOOR SPACE
NO . OF CASINOS AVERAGE AREA GAMING REVENUE AREA OPERATING IN SQUARE FEET PER SQUARE FOOT
Pit ( Includes Bingo and Keno) 2 6 9 , 2 5 7 Coin Operated Devices 4 9 2 6 , 6 2 0 Poker and Pan 14 1 , 9 1 0 Race and Sports 2 0 5 , 62 0
TOTAL CASINO 5 1 3 3 , 0 2 3
RATIOS
TOTAL CURRENT ASSETS TO TOTAL CURRENT LIABILITIES . . . . . . . . .
TOTAL CAPITAL TO TOTAL LIABILITIES . . . . . . . . . . . . . . . . . . . . . . . .
TOTAL CAPITAL TO TOTAL CURRENT LIABILITIES . . . . . . . . . . . . . . . .
TOTAL CURRENT LIABILITIES TO TOTAL LIABILITIES . . . . . . . . . . . .
TOTAL COMPLIMENTARY EXPENSE TO GAMING REVENUE . . . . . . . . . . . . .
MUSIC AND ENTERTAINMENT EXPENSES TO GAMING REVENUE . . . . . . . .
TOTAL REVENUE TO AVERAGE TOTAL ASSETS . . . . . . . . . . . . . . . . . . . . .
TOTAL REVENUE LESS COMP SALES TO AVERAGE TOTAL ASSETS . . . . .
RETURN ON INVESTED CAPITAL* . . . . . . . . . . . . . . . . . . . . . . . . . . . . . . .
RETURN ON AVERAGE ASSETS* . . . . . . . . . . . . . . . . . . . . . . . . . . . . . . . . .
* - FORMULAS
Return on Invested Capital i s equal to the total of net income ( before federal income taxes and extraordinary items ) and interest
expense divided by the total of average total assets less average current liabil ities .
PERCENT 2 3 9 . 7%
2 2 3 . 7 \
1194 . 9\
1 8 . 7 \
15 . 4 \
0 . 3 \
4 2 . 9\
3 9 . 0 \
4 . 6\
4 . 0\
Return on Average Assets i s equal to the total of net income ( before federal income taxes and extraordinary items ) and interest expense divided by the average total assets .
6 5 3 9 3 1 7 0 2 4 1 1
8 5 3
2 - 7 2
THIS PAGE LEFT INTENTIONALLY BLANK
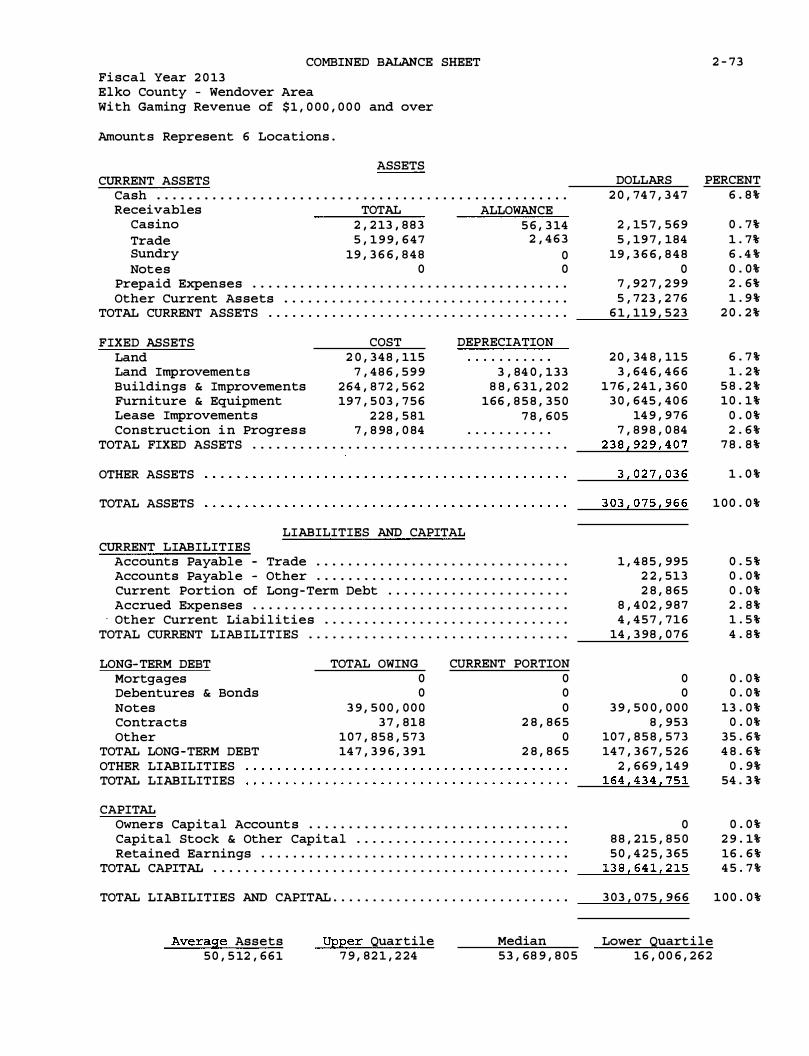
COMBINED BALANCE SHEET Fiscal Year 2 0 13 Elko County - Wendover Area With Gaming Revenue of $ 1 , 0 0 0 , 0 0 0 and over
Amounts Represent 6 Locations .
ASSETS CURRENT ASSETS
Cash . . . . . . . . . . . . . . . . . . . . . . . . . . . . . . . . . . . . . . . . . . . . . . . . . . . .
Receivables TOTAL ALLOWANCE Casino 2 , 2 13 , 8 8 3 5 6 , 3 14 Trade 5 , 1 9 9 , 6 4 7 2 , 4 6 3 Sundry 19 , 3 6 6 , 8 4 8 0 Notes 0 0
Prepaid Expenses . . . . . . . . . . . . . . . . . . . . . . . . . . . . . . . . . . . . . . . .
Other Current Assets . . . . . . . . . . . . . . . . . . . . . . . . . . . . . . . . . . . .
TOTAL CURRENT ASSETS . . . . . . . . . . . . . . . . . . . . . . . . . . . . . . . . . . . . . .
FIXED ASSETS COST DEPRECIATION Land 2 0 , 3 4 8 , 115 . . . . . . . . . . .
Land Improvements 7 , 4 8 6 , 5 9 9 3 , 84 0 , 133 Buildings & Improvements 2 64 , 8 7 2 , 5 6 2 8 8 , 6 3 1 , 2 0 2 Furniture & Equipment 19 7 , 5 03 , 7 5 6 166 , 8 5 8 , 3 5 0 Lease Improvements 2 2 8 , 5 8 1 7 8 , 6 0 5 Construction i n Progres s 7 , 8 98 , 0 84 . . . . . . . . . . .
TOTAL FIXED ASSETS . . . . . . . . . . . . . . . . . . . . . . . . . . . . . . . . . . . . . . . .
OTHER ASSETS
TOTAL ASSETS
LIABILITIES AND CAPITAL CURRENT LIABILITIES
Accounts Payable - Trade . . . . . . . . . . . . . . . . . . . . . . . . . . . . . . . .
Accounts Payable - Other . . . . . . . . . . . . . . . . . . . . . . . . . . . . . . . . Current Portion of Long-Term Debt . . . . . . . . . . . . . . . . . . . . . . .
Accrued Expenses . . . . . . . . . . . . . . . . . . . . . . . . . . . . . . . . . . . . . . . .
· Other Current Liabilities . . . . . . . . . . . . . . . . . . . . . . . . . . . . . . .
TOTAL CURRENT LIAB ILITIES . . . . . . . . . . . . . . . . . . . . . . . . . . . . . . . . .
LONG-TERM DEBT Mortgages Debentures & Bonds Notes Contracts Other
TOTAL LONG-TERM DEBT OTHER LIABILITIES TOTAL LIABILITIES
CAPITAL
TOTAL OWING CURRENT PORTION 0 0 0 0
3 9 , 5 0 0 , 0 0 0 0 3 7 , 8 1 8 2 8 , 8 6 5
1 0 7 , 8 5 8 , 5 7 3 0 14 7 , 3 9 6 , 3 9 1 2 8 , 8 6 5
Owners Capital Accounts . . . . . . . . . . . . . . . . . . . . . . . . . . . . . . . . .
Capital Stock & Other Capital . . . . . . . . . . . . . . . . . . . . . . . . . . . Retained Earnings . . . . . . . . . . . . . . . . . . . . . . . . . . . . . . . . . . . . . . .
TOTAL CAPITAL . . . . . . . . . . . . . . . . . . . . . . . . . . . . . . . . . . . . . . . . . . . . .
TOTAL LIABILITIES AND CAPITAL . . . . . . . . . . . . . . . . . . . . . . . . . . . . . .
Average Assets 5 0 , 5 12 , 6 6 1
Upper Quartile 7 9 , 8 2 1 , 2 24
Median 5 3 , 68 9 , 8 0 5
2 - 73
DOLLARS PERCENT 2 0 , 74 7 , 3 4 7 6 . 8 %
2 , 15 7 , 5 6 9 0 . 7% 5 , 19 7 , 184 1 . 7%
19 , 3 6 6 , 8 4 8 6 . 4 % 0 0 . 0%
7 , 92 7 , 2 9 9 2 . 6% 5 , 72 3 , 2 76 1 . 9 %
6 1 , 119 , 5 2 3 2 0 . 2 %
2 0 , 34 8 , 115 6 . 7 % 3 , 64 6 , 4 6 6 1 . 2 %
1 76 , 2 4 1 , 3 6 0 5 8 . 2 % 3 0 , 6 4 5 , 4 0 6 1 0 . 1%
14 9 , 9 7 6 0 . 0 % 7 , 8 9 8 , 0 84 2 . 6 %
2 3 8 , 92 9 , 4 0 7 7 8 . 8 %
3 , 0 2 7 , 0 3 6 1 . 0 %
3 0 3 , 0 7 5 , 9 6 6 1 0 0 . 0 %
1 , 4 8 5 , 995 0 . 5 % 2 2 , 513 0 . 0 % 2 8 , 8 6 5 0 . 0 %
8 , 4 0 2 , 9 8 7 2 . 8 % 4 , 4 5 7 , 7 1 6 1 . 5 %
14 , 3 98 , 0 7 6 4 . 8 %
0 0 . 0 % 0 0 . 0 %
3 9 , 5 0 0 , 0 0 0 13 . 0 % 8 , 953 0 . 0%
10 7 , 8 5 8 , 5 7 3 3 5 . 6 % 14 7 , 3 6 7 , 5 2 6 4 8 . 6 %
2 , 6 6 9 , 14 9 0 . 9% 164 , 4 3 4 , 7 5 1 54 . 3 %
0 0 . 0 % 8 8 , 2 15 , 8 5 0 2 9 . 1% 5 0 , 4 2 5 , 3 6 5 16 . 6 %
138 , 64 1 , 2 15 4 5 . 7 %
3 03 , 0 7 5 , 9 6 6 1 0 0 . 0 %
Lower Quartile 16 , 0 0 6 , 2 6 2

2 - 74 COMBINED INCOME STATEMENT - SUMMARY
Fi scal Year 2 0 1 3 Elko County - Wendover Area With Gaming Revenue of $ 1 , 0 0 0 , 0 0 0 and over
Amounts Represent 6 Locations .
REVENUE DOLLARS Gaming . . . . . . . . . . . . . . . . . . . . . . . . . . . . . . . . . . . . . . . . . . . . . . . . . . 1 6 1 , 3 7 6 , 5 7 7 Rooms . . . . . . . . . . . . . . . . . . . . . . . . . . . . . . . . . . . . . . . . . . . . . . . . . . . 15 , 4 1 0 , 734 Food . . . . . . . . . . . . . . . . . . . . . . . . . . . . . . . . . . . . . . . . . . . . . . . . . . . . 2 9 , 0 3 8 , 4 0 8 Beverage . . . . . . . . . . . . . . . . . . . . . . . . . . . . . . . . . . . . . . . . . . . . . . . . 12 , 3 7 7 , 3 0 0 Other . . . . . . . . . . . . . . . . . . . . . . . . . . . . . . . . . . . . . . . . . . . . . . . . . . . 1 1 , 2 9 9 , 7 5 9
2 2 9 , 5 0 2 , 7 7 8 TOTAL REVENUE . . . . . . . . . . . . . . . . . . . . . . . . . . . . . . . · · · · · · · · · · · · · ·----
==�����
COST OF SALES 2 0 , 2 3 6 , 2 6 6
GROSS MARGIN 2 0 9 , 2 6 6 , 5 12
DEPARTMENTAL EXPENSES . . . . . . . . . . . . . . . . . . . . . . . . . . . . . . . . . . . . . 8 3 , 8 9 3 , 0 8 6
DEPARTMENTAL INCOME ( LOSS ) 12 5 , 3 7 3 , 4 2 6 • • • • • • • • • • • • • • • • • • • • • • • • • • • • • • • • ---
-=-=.:::.....!...=.....:...:::...!...-=-=-=.
GENERAL AND ADMINISTRATIVE EXPENSES Adverti sing and Promotion . . . . . . . . . . . . . . . . . . . . . . . . . . . . . . . 1 7 , 7 0 0 , 964 Bad Debt Expense . . . . . . . . . . . . . . . . . . . . . . . . . . . . . . . . . . . . . . . . 0 Compl imentary Expense ( not reported in departments ) . . . . . . 9 , 7 8 6 , 1 7 5 Depreciation - Buildings . . . . . . . . . . . . . . . . . . . . . . . . . . . . . . . . 1 0 , 2 2 6 , 0 8 5 Depreciation and Amorti zation - Other . . . . . . . . . . . . . . . . . . . 9 , 6 5 7 , 1 0 9 Energy Expense ( electricity, gas , etc . ) . . . . . . . . . . . . . . . . . 5 , 2 63 , 3 9 8 Equipment Rental or Lease . . . . . . . . . . . . . . . . . . . . . . . . . . . . . . . 2 7 7 , 0 2 0 I nterest Expense . . . . . . . . . . . . . . . . . . . . . . . . . . . . . . . . . . . . . . . . 5 , 0 3 1 , 9 0 3 Music and Entertainment . . . . . . . . . . . . . . . . . . . . . . . . . . . . . . . . . 6 , 3 7 0 , 64 8 Payroll Taxes . . . . . . . . . . . . . . . . . . . . . . . . . . . . . . . . . . . . . . . . . . . 1 , 5 16 , 2 8 7 Payroll - Employee Benefits . . . . . . . . . . ' . . . . . . . . . . . . . . . . . . . 1 , 0 1 2 , 7 6 6 Payroll - Officers . . . . . . . . . . . . . . . . . . . . . . . . . . . . . . . . . . . . . . 6 7 5 , 0 0 0 Payroll - Other Employees . . . . . . . . . . . . . . . . . . . . . . . . . . . . . . . 16 , 2 0 3 , 0 9 1 Rent o f Premises . . . . . . . . . . . . . . . . . . . . . . . . . . . . . . . . . . . . . . . . 3 5 2 , 92 0 Taxes - Real Estate . . . . . . . . . . . . . . . . . . . . . . . . . . . . . . . . . . . . . 2 , 1 0 2 , 92 1 Taxes and Licenses - Other . . . . . . . . . . . . . . . . . . . . . . . . . . . . . . 9 5 0 , 1 3 0 Utilities ( Other than Energy Expense ) . . . . . . . . . . . . . . . . . . . 1 , 4 7 7 , 2 7 4 Other General and Administrative Expenses . . . . . . . . . . . . . . . 8 , 52 0 , 3 02
97 , 12 3 , 9 9 3 TOTAL GENERAL AND ADMINISTRATIVE EXPENSES . . . . . . . . . . . . · · · · ·---
��-=-=��-=-
NET INCOME ( LOSS ) BEFORE FEDERAL INCOME TAXES AND EXTRAORDINARY ITEMS . . . . . . . . . . . . . . . . . . . . . . . . . . . . . . . . . . . .
Average Revenue 3 8 , 2 5 0 , 4 6 3
Upper Quartile 63 , 3 6 3 , 6 6 0
Median 4 1 , 0 0 6 , 2 5 9
2 8 , 2 4 9 , 4 3 3
Lower Quartile 1 1 , 6 0 9 , 743
PERCENT 7 0 . 3 %
6 . 7 % 12 . 7 %
5 . 4 % 4 . 9 %
1 0 0 . 0 %
8 . 8 %
9 1 . 2 %
3 6 . 6 %
54 . 6 %
7 . 7 % 0 . 0 % 4 . 3 % 4 . 5 % 4 . 2 % 2 . 3 % 0 . 1% 2 . 2 % 2 . 8 % 0 . 7 % 0 . 4 % 0 . 3 % 7 . 1% 0 . 2 % 0 . 9% 0 . 4 % 0 . 6 % 3 . 7 %
4 2 . 3 %
12 . 3 %

COMBINED INCOME STATEMENT - DETAIL 2 - 7 5 Fiscal Year 2 0 13 Elko County - Wendover Area With Gaming Revenue of $ 1 , 0 0 0 , 0 0 0 and over
Amounts Represent 6 Locations .
CASINO DEPARTMENT
REVENUE DOLLARS PERCENT Pit Revenue ( Includes Keno and Bingo ) . . . . . . . . . . . . . . . . . . . 3 2 , 6 3 1 , 5 2 0 2 0 . 2 %' Coin Operated Devices . . . . . . . . . . . . . . . . . . . . . . . . . . . . . . . . . . . 124 , 7 7 8 , 98 9 7 7 . 3 %' Poker and Pan . . . . . . . . . . . . . . . . . . . . . . . . . . . . . . . . . . . . . . . . . . . 2 , 42 6 , 9 6 3 1 . 5 %' Race Book . . . . . . . . . . . . . . . . . . . . . . . . . . . . . . . . . . . . . . . . . . . . . . . 2 9 9 , 2 3 3 0 . 2 %' Sports Pool . . . . . . . . . . . . . . . . . . . . . . . . . . . . . . . . . . . . . . . . . . . . . 1 , 2 3 9 , 8 7 2 0 . 8 %'
TOTAL REVENUE . . . . . . . . . . . . . . . . . . . . . . . . . . . . . . . . . . . . . . . . . . . . . 16 1 , 3 7 6 , 5 7 7 1 0 0 . 0 %'
DEPARTMENTAL EXPENSES Bad Debt Expense . . . . . . . . . . . . . . . . . . . . . . . . . . . . . . . . . . . . . . . . 5_1 , 0 3 8 0 . 0 %' Commis sions . . . . . . . . . . . . . . . . . . . . . . . . . . . . . . . . . . . . . . . . . . . . . 0 0 . 0 %' Complimentary Expense . . . . . . . . . . . . . . . . . . . . . . . . . . . . . . . . . . . 2 0 , 3 0 0 , 0 3 6 12 . 6 %' Gaming Taxes and Licenses . . . . . . . . . . . . . . . . . . . . . . . . . . . . . . . 13 , 6 8 4 , 1 3 8 8 . 5%' Preferred Guest Expenses (no complimentaries ) . . . . . . . . . . . 0 0 . 0 %' Payroll Taxes . . . . . . . . . . . . . . . . . . . . . . . . . . . . . . . . . . . . . . . . . . . 1 , 96 0 , 7 3 8 1 . 2 % Payroll - Employee Benefits . . . . . . . . . . . . . . . . . . . . . . . . . . . . . 1 , 3 1 8 , 3 7 0 0 . 8 % Payroll - Officers . . . . . . . . . . . . . . . . . . . . . . . . . . . . . . . . . . . . . . 0 0 . 0 %' Payrol l - Other Employees . . . . . . . . . . . . . . . . . . . . . . . . . . . . . . . 11 , 3 0 9 , 6 8 9 7 . 0 %' Race Wire Fees . . . . . . . . . . . . . . . . . . . . . . . . . . . . . . . . . . . . . . . . . . 8 0 , 8 2 2 0 . 1%'
Other Departmental Expenses . . . . . . . . . . . . . . . . . . . . . . . . . . . . . 3 , 7 15 , 58 8 2 . 3 %' TOTAL DEPARTMENTAL EXPENSES . . . . . . . . . . . . . . . . . . . . . . . . . . . . . . . 5 2 , 42 0 , 4 1 9 3 2 . 5 %'
DEPARTMENTAL INCOME ( LOSS ) . . . . . . . . . . . . . . . . . . . . . . . . . . . . . . . . . 1 0 8 , 9 5 6 , 158 6 7 . 5 %'
ROOMS DEPARTMENT
REVENUE DOLLARS PERCENT Room Sales . . . . . . . . . . . . . . . . . . . . . . . . . . . . . . . . . . . . . . . . . . . . . . 12 , 0 7 6 , 4 3 0 7 8 . 4 %' Complimentary Rooms . . . . . . . . . . . . . . . . . . . . . . . . . . . . . . . . . . . . . 3 , 3 3 4 , 3 0 4 2 1 . 6%
TOTAL REVENUE . . . . . . . . . . . . . . . . . . . . . . . . . . . . . . . . . . . . . . . . . . . . . 15 , 4 1 0 , 7 3 4 1 0 0 . 0 %
DEPARTMENTAL EXPENSES Bad Debt Expense . . . . . . . . . . . . . . . . . . . . . . . . . . . . . . . . . . . . . . . . 0 0 . 0 % Complimentary Expense . . . . . . . . . . . . . . . . . . . . . . . . . . . . . . . . . . . 2 4 1 , 8 2 9 1 . 6 % Payroll - Taxes . . . . . . . . . . . . . . . . . . . . . . . . . . . . . . . . . . . . . . . . . 6 6 2 , 55 8 4 . 2 % Payroll - Employee Benefits . . . . . . . . . . . . . . . . . . . . . . . . . . . . . 3 0 4 , 0 9 1 1 . 9 % Payroll - Officers . . . . . . . . . . . . . . . . . . . . . . . . . . . . . . . . . . . . . . 0 0 . 0 % Payroll - Other Employees . . . . . . . . . . . . . . . . . . . . . . . . . . . . . . . 7 , 0 2 8 , 5 5 8 4 5 . 6 % Other Departmental Expenses . . . . . . . . . . . . . . . . . . . . . . . . . . . . . 3 , 5 6 7 , 7 6 3 2 3 . 2 %
TOTAL DEPARTMENTAL EXPENSES . . . . . . . . . . . . . . . . . . . . . . . . . . . . . . . 1 1 , 8 04 , 7 9 9 7 6 . 6 %
DEPARTMENTAL INCOME ( LOS S ) . . . . . . . . . . . . . . . . . . . . . . . . . . . . . . . . . 3 , 6 0 5 , 9 3 5 2 3 . 4 %

2 - 7 6 COMBINED INCOME STATEMENT - DETAIL ( CONTINUED)
Fiscal Year 2 0 1 3 Elko County - Wendover Area With Gaming Revenue of $ 1 , 0 0 0 , 0 0 0 and over
Amounts Represent 6 Locations .
FOOD DEPARTMENT REVENUE DOLLARS PERCENT
Food Sales 14 , 4 52 , 0 3 0 4 9 . 8 % Complimentary Food Sales . . . . . . . . . . . . . . . . . . . . . . . . . . . . . . . . 14 , 5 8 6 , 3 7 8 5 0 . 2 %
TOTAL REVENUE . . . . . . . . . . . . . . . . . . . . . . . . . . . . . . . . . . . . . . . . . . . . . 2 9 , 0 3 8 , 4 0 8 1 0 0 . 0 %
COST OF SALES 13 , 4 0 9 , 3 5 3 4 6 . 2 %
GROSS MARGIN 15 , 62 9 , 0 5 5 5 3 . 8 %
DEPARTMENTAL EXPENSES Bad Debt Expense . . . . . . . . . . . . . . . . . . . . . . . . . . . . . . . . . . . . . . . . 0 0 . 0 % Complimentary Expense . . . . . . . . . . . . . . . . . . . . . . . . . . . . . . . . . . . 1 , 15 1 , 8 7 5 4 . 0 % Payrol l - Taxes . . . . . . . . . . . . . . . . . . . . . . . . . . . . . . . . . . . . . . . . . 1 , 0 5 3 , 9 7 1 3 . 6 % Payrol l - Employee Benefits . . . . . . . . . . . . . . . . . . . . . . . . . . . . . 5 5 3 , 4 2 2 1 . 9% Payroll - Officers . . . . . . . . . . . . . . . . . . . . . . . . . . . . . . . . . . . . . . 0 0 . 0 % Payrol l - Other Employees . . . . . . . . . . . . . . . . . . . . . . . . . . . . . . . 9 , 7 96 , 4 11 3 3 . 7 % Other Departmental Expenses . . . . . . . . . . . . . . . . . . . . . . . . . . . . . 1 , 53 5 , 9 0 6 5 . 3 %
TOTAL DEPARTMENTAL EXPENSES . . . . . . . . . . . . . . . . . . . . . . . . . . . . . . . 14 , 0 9 1 , 5 8 5 4 8 . 5 %
DEPARTMENTAL INCOME ( LOSS ) . . . . . . . . . . . . . . . . . . . . . . . . . . . . . . . . . 1 , 5 3 7 , 4 7 0 5 . 3 %
BEVERAGE DEPARTMENT REVENUE DOLLARS PERCENT
Beverage Sales . . . . . . . . . . . . . . . . . . . . . . . . . . . . . . . . . . . . . . . . . . 2 , 2 7 7 , 1 3 5 18 . 4 % Compl imentary Beverage Sales . . . . . . . . . . . . . . . . . . . . . . . . . . . . 1 0 , 1 0 0 , 165 8 1 . 6 %
TOTAL REVENUE . . . . . . . . . . . . . . . . . . . . . . . . . . . . . . . . . . . . . . . . . . . . . 12 , 3 7 7 , 3 0 0 1 0 0 . 0 %
COST OF SALES 4 , 0 15 , 6 1 7 3 2 . 4 %
GROSS MARGIN . . . . . . . . . . . . . . . . . . . . . . . . . . . . . . . . . . . . . . . . . . . . . . 8 , 3 6 1 , 6 8 3 6 7 . 6 %
DEPARTMENTAL EXPENSES Bad Debt Expense . . . . . . . . . . . . . . . . . . . . . . . . . . . . . . . . . . . . . . . . 0 0 . 0 % Complimentary Expense . . . . . . . . . . . . . . . . . . . . . . . . . . . . . . . . . . . 1 , 6 8 7 0 . 0 % Payrol l - Taxes . . . . . . . . . . . . . . . . . . . . . . . . . . . . . . . . . . . . . . . . . 3 2 0 , 4 6 7 2 . 6 % Payroll - Employee Benefits . . . . . . . . . . . . . . . . . . . . . . . . . . . . . 3 2 5 , 3 2 6 2 . 6 % Payrol l - Officers . . . . . . . . . . . . . . . . . . . . . . . . . . . . . . . . . . . . . . 0 0 . 0 % Payrol l - Other Employees . . . . . . . . . . . . . . . . . . . . . . . . . . . . . . . 2 , 0 14 , 3 4 9 1 6 . 3 % Other Departmental Expenses . . . . . . . . . . . . . . . . . . . . . . . . . . . . . 3 8 6 , 9 6 8 3 . 1%
TOTAL DEPARTMENTAL EXPENSES . . . . . . . . . . . . . . . . . . . . . . . . . . . . . . . 3 , 0 4 8 , 7 9 7 2 4 . 6 %
DEPARTMENTAL INCOME ( LOSS ) . . . . . . . . . . . . . . . . . . . . . . . . . . . . . . . . . 5 , 3 12 , 8 8 6 4 2 . 9 %

COMBINED INCOME STATEMENT - DETAIL ( CONTINUED)
Fi scal Year 2 0 1 3 Elko County - Wendover Area With Gaming Revenue of $ 1 , 0 0 0 , 0 0 0 and over
Amounts Represent 6 Locations .
OTHER INCOME REVENUE
Other Operating and Non- operating Income . . . . . . . . . . . . . . . .
Other Complimentary Items . . . . . . . . . . . . . . . . . . . . . . . . . . . . . . .
TOTAL REVENUE . . . . . . . . . . . . . . . . . . . . . . . . . . . . . . . . . . . . . . . . . . . . .
COST OF SALES . . . . . . . . . . . . . . . . . . . . . . . . . . . . . . . . . . . . . . . . . . . . .
GROSS MARGIN . . . . . . . . . . . . . . . . . . . . . . . . . . . . . . . . . . . . . . . . . . . . . .
DEPARTMENTAL EXPENSES Bad Debt Expense . . . . . . . . . . . . . . . . . . . . . . . . . . . . . . . . . . . . . . . .
Complimentary Expense . . . . . . . . . . . . . . . . . . . . . . . . . . . . . . . . . . .
Payrol l - Taxes . . . . . . . . . . . . . . . . . . . . . . . . . . . . . . . . . . . . . . . . .
Payroll - Employee Benefits . . . . . . . . . . . . . . . . . . . . . . . . . . . . .
Payroll - Officers . . . . . . . . . . . . . . . . . . . . . . . . . . . . . . . . . . . . . . Payroll - Other Employees . . . . . . . . . . . . . . . . . . . . . . . . . . . . . . .
Other Departmental Expenses . . . . . . . . . . . . . . . . . . . . . . . . . . . . .
TOTAL DEPARTMENTAL EXPENSES . . . . . . . . . . . . . . . . . . . . . . . . . . . . . . .
DEPARTMENTAL INCOME ( LOS S ) . . . . . . . . . . . . . . . . . . . . . . . . . . . . . . . . .
AVERAGE NUMBER OF EMPLOYEES FOR THE YEAR
CASINO DEPARTMENT ROOMS DEPARTMENT . . . . . . . . . . . . . . . . . . . . . .
FOOD DEPARTMENT . . . . . . . . . . . . . . . . . . . . . . .
BEVERAGE DEPARTMENT . . . . . . . . . . . . . . . . . . .
G & A DEPARTMENT . . . . . . . . . . . . . . . . . . . . .
OTHER DEPARTMENTS . . . . . . . . . . . . . . . . . . . . .
TOTAL
DOLLARS 7 , 3 6 4 , 765 3 , 9 3 4 , 994
1 1 , 2 9 9 , 7 5 9
2 , 8 11 , 2 96
8 , 4 8 8 , 4 6 3
0 8 8 5 , 3 15
7 5 , 044 3 8 , 54 3
0 7 9 0 , 7 3 5 7 3 7 , 8 4 9
2 , 52 7 , 4 8 6
5 , 96 0 , 9 7 7
7 0 0 3 4 2 5 6 1 14 6 574
4 2
2 , 3 6 5
2 - 77
PERCENT 6 5 . 2 % 3 4 . 8 %
1 0 0 . 0 %
2 4 . 9%
7 5 . 1%
0 . 0 % 7 . 8 % 0 . 7% 0 . 3 % 0 . 0 % 7 . 0 % 6 . 5%
22 . 4 %
52 . 8 %

2 - 7 8 ROOM OCCUPANCY AND PER ROOM PER DAY ANALYSIS
Fiscal Year 2 0 1 3 Elko County - Wendover Area With Gaming Revenue of $ 1 , 0 0 0 , 0 0 0 and over
Amounts Represent 6 Locations .
RATE OF ROOM OCCUPANCY
MONTH JULY . . . . . . . . . . AUGUST . . . . . .. . . SEPTEMBER . . . . . OCTOBER . . . . . . . NOVEMBER . . . . . . DECEMBER . . . . . . JANUARY . . . . . . . FEBRUARY . . . . . . MARCH . . . . . . . . . APRIL . . . . . . . . .
MAY . . . . . . . . . . .
JUNE . . . . . . . . . .
TOTAL . . . . . . . . .
Average Pit Revenue Per Room Per Day
Average Slot Revenue Per Room Per Day
Average Food Sales Per Room Per Day
AVAILABLE ROOMS ROOMS OCCUPIED
58 , 1 0 3 4 8 , 3 1 8 5 8 , 3 02 4 8 , 954 6 6 , 5 7 0 5 3 , 3 5 6 5 7 , 6 0 7 44 , 7 9 5 5 7 , 0 5 7 4 0 , 3 5 8 6 6 , 54 6 4 1 , 844 5 7 , 3 4 6 3 8 , 5 9 0 55 , 8 1 3 4 1 , 4 2 5 67 , 5 1 0 5 1 , 9 9 6 5 7 , 7 0 2 4 0 , 4 3 8 5 7 , 9 6 0 4 2 , 919 6 6 , 2 5 6 5 0 , 7 8 6
72 6 , 7 7 2 5 4 3 , 7 7 9
PER ROOM PER DAY STATISTICS
6 0 . 0 1
2 2 9 . 4 7
5 3 . 4 0
Average Beverage Sales Per Room Per Day
Average Rooms Department Payrol l Per Room Per Day
Average Room Rate Per Day
% OF OCCUPANCY
( COMPUTED ) 8 3 . 1 6 % 8 3 . 9 7 % 8 0 . 15 % 77 . 7 6 % 7 0 . 7 3 % 62 . 8 8 % 6 7 . 2 9% 74 . 2 2 % 7 7 . 0 2 % 7 0 . 0 8 % 74 . 0 5 % 7 6 . 6 5 %
74 . 82 %
2 2 . 7 6
14 . 7 0
2 8 . 3 4

PER SQUARE FOOT ANALYSIS AND RATIOS 2 - 7 9 Fi s cal Year 2 0 13 Elko County - Wendover Area With Gaming Revenue of $ 1 , 0 0 0 , 0 0 0 and over
Amounts Represent 6 Locations .
GAMING REVENUE PER SQUARE FOOT OF FLOOR SPACE
NO . OF CASINOS AVERAGE AREA GAMING REVENUE AREA OPERATING IN SQUARE FEET PER SQUARE FOOT
Pit ( Includes Bingo and Coin Operated Devices Poker and Pan
Keno ) 5 6 , 3 9 0 1 , 0 2 1 6 2 5 , 2 94 3 1 , 8 9 6
Race and Sports 3 1 , 3 18
TOTAL CASINO 6 3 2 , 2 2 6
RATIOS
TOTAL CURRENT ASSETS TO TOTAL CURRENT LIABILITIES . . . . . . . . .
TOTAL CAPITAL TO TOTAL LIABILITIES . . . . . . . . . . . . . . . . . . . . . . . .
TOTAL CAPITAL TO TOTAL CURRENT LIABILITIES . . . . . . . . . . . . . . . .
TOTAL CURRENT LIABILITIES TO TOTAL LIABILITIES . . . . . . . . . . . .
TOTAL COMPLIMENTARY EXPENSE TO GAMING REVENUE . . . . . . . . . . . . .
MUSIC AND ENTERTAINMENT EXPENSES TO GAMING REVENUE . . . . . . . .
TOTAL REVENUE TO AVERAGE TOTAL ASSETS . . . . . . . . . . . . . . . . . . . . .
TOTAL REVENUE LESS COMP SALES TO AVERAGE TOTAL ASSETS . . . . .
RETURN ON INVESTED CAPITAL* ; . . . . . . . . . . . . . . . . . . . . . . . . . . . . . .
RETURN ON AVERAGE ASSETS* . . . . . . . . . . . . . . . . . . . . . . . . . . . . . . . . .
* - FORMULAS
Return on Invested Capital i s equal to the total of net income (before federal income taxes and extraordinary items ) and interest expense divided by the total of average total assets less average current liabi lities .
PERCENT 4 2 4 . 5%'
8 4 . 3 %'
9 6 2 . 9%
8 . 8 %'
2 0 .1%'
3 . 9%'
7 8 . 6 %'
6 7 . 7%
12 . 2 %
1 1 . 4 %'
Return on Average Assets is equal to the total of net income (before federal income taxes and extraordinary items ) and interest expense divided by the average total asset s .
8 2 2 4 2 7 3 8 9
8 3 5

2 - 8 0
THIS PAGE LEFT INTENTIONALLY BLANK

COMBINED BALANCE SHEET Fiscal Year 2 0 1 3 Washoe County - Reno/Sparks With Gaming Revenue of $ 1 , 0 0 0 , 0 0 0 and over
Amounts Represent 2 2 Locations .
ASSETS CURRENT ASSETS
Cash . . . . . . . . . . . . . . . . . . . . . . . . . . . . . . . . . . . . . . . . . . . . . . . . . . . .
Receivables TOTAL ALLOWANCE Casino 1 3 , 2 1 8 , 1 6 3 6 , 0 7 2 , 8 0 2 Trade 1 0 4 , 5 5 5 , 8 3 8 1 , 3 2 7 , 6 3 1 Sundry 6 , 0 5 8 , 4 0 3 o
Notes 2 1 1 , 8 6 8 o
Prepaid Expenses . . . . . . . . . . . . . . . . . . . . . . . . . . . . . . . . . . . . . . . .
Other CUrrent Assets . . . . . . . . . . . . . . . . . . . . . . . . . . . . . . . . . . . .
TOTAL CURRENT ASSETS . . . . . . . . . . . . . . . . . . . . . . . . . . . . . . . . . . . . . .
FIXED ASSETS Land
COST 1 7 6 , 74 1 , 5 9 8
DEPRECIATION
Land Improvements 7 , 6 6 6 , 7 3 6 4 , 0 6 9 , 6 8 5 Buildings & Improvements 1 , 44 9 , 5 3 9 , 2 2 3 5 7 1 , 44 9 , 0 3 1 Furniture & Equipment 8 2 0 , 1 7 7 , 8 9 9 6 6 1 , 0 0 8 , 634 Lease Improvements 1 6 , 3 7 1 , 6 0 2 1 0 , 92 1 , 2 2 5 Construction i n Progress 15 , 64 7 , 8 1 1 . . . . . . . . . . .
TOTAL FIXED ASSETS . . . . . . . . . . . . . . . . . . . . . . . . . . . . . . . . . . . . . . . .
OTHER ASSETS
TOTAL ASSETS
LIABILITIES AND CAPITAL CURRENT LIABILITIES
Accounts Payable - Trade . . . . . . . . . . . . . . . . . . . . . . . . . . . . . . . .
Accounts Payable - Other . . . . . . . . . . . . . . . . . . . . . . . . . . . . . . . .
Current Port ion of Long- Term Debt . . . . . . . . . . . . . . . . . . . . . . .
Accrued Expenses . . . . . . . . . . . . . . . . . . . . . . . . . . . . . . . . . . . . . . . .
Other Current Liabilities . . . . . . . . . . . . . . . . . . . . . . . . . . . . . . .
TOTAL CURRENT LIAB ILITIES . . . . . . . . . . . . . . . . . . . . . . . . . . . . . . . . .
LONG-TERM DEBT Mortgages Debentures & Bonds Notes Contracts Other
TOTAL LONG-TERM DEBT OTHER LIABILITIES TOTAL LIABILITIES
CAPITAL
TOTAL OWING CURRENT PORTION 8 4 , 5 6 6 , 1 8 1 3 4 , 4 7 1 , 3 4 9
1 9 3 , 72 5 , 4 2 7 0 1 6 2 , 54 9 , 8 2 6 1 3 , 74 0 , 9 8 3
1 , 4 54 , 6 1 7 1 , 0 7 3 , 9 6 7 5 5 1 , 17 3 , 1 0 8 4 4 8 , 3 3 1 9 9 3 , 4 6 9 , 1 5 9 4 9 , 7 3 4 , 6 3 0
Owners Capital Accounts . . . . . . . . . . . . . . . . . . . . . . . . . . . . . . . . . Capital Stock & Other Capital . . . . . . . . . . . . . . . . . . . . . . . . . . .
Retained Earnings . . . . . . . . . . . . . . . . . . . . . . . . . . . . . . . . . . . . . . .
TOTAL CAPITAL . . . . . . . . . . . . . . . . . . . . . . . . . . . . . . . . . . . . . . . . . . . . .
TOTAL LIABILITIES AND CAPITAL . . . . . . . . . . . . . . . . . . . . . . . . . . . . . .
Average Assets 7 8 , 0 7 1 , 8 8 9
Upper Quartile 9 0 , 0 74 , 0 6 9
Median 2 1 , 2 92 , 956
2 - 8 1
DOLLARS PERCENT 1 0 7 , 2 1 3 , 5 0 6 6 . 2 %
7 , 14 5 , 3 6 1 0 . 4 % 1 0 3 , 2 2 8 , 2 0 7 6 . 0 %
6 , 0 5 8 , 4 0 3 0 . 4 % 2 11 , 8 6 8 0 . 0 %
2 3 , 3 2 8 , 944 1 . 4 % 3 3 , 64 8 , 2 7 2 2 . 0 %
2 8 0 , 8 3 4 , 5 6 1 1 6 . 4 %
1 7 6 , 74 1 , 5 9 8 1 0 . 3 % 3 , 5 9 7 , 0 5 1 0 . 2 %
8 78 , 0 9 0 , 192 5 1 . 1% 15 9 , 1 6 9 , 2 6 5 9 . 3 %
5 , 4 5 0 , 3 7 7 0 . 3 % 15 , 64 7 , 8 1 1 0 . 9%
1 , 2 3 8 , 6 96 , 2 94 7 2 . 1%
1 98 , 0 5 0 , 6 9 3 1 1 . 5 %
1 , 7 17 , 5 8 1 , 5 4 8 1 0 0 . 0 %
2 5 , 8 1 6 , 2 74 1 . 5% - 8 3 , 1 0 1 , 2 6 1 - 4 . 8 %
4 9 , 73 4 , 6 3 0 2 . 9 % 5 6 , 18 3 , 3 10 3 . 3 % 3 0 , 8 17 , 0 9 3 1 . 8 % 7 9 , 4 5 0 , 0 4 6 4 . 6 %
5 0 , 0 94 , 8 3 2 2 . 9% 193 , 72 5 , 4 2 7 1 1 . 3 % 148 , 8 0 8 , 84 3 8 . 7 %
3 8 0 , 6 5 0 0 . 0 % 5 5 0 , 72 4 , 7 7 7 3 2 . 1% 9 4 3 , 7 3 4 , 5 2 9 54 . 9 %
2 3 , 0 0 0 , 8 3 2 1 . 3 % 1 , 04 6 , 185 , 4 0 7 6 0 . 9%
4 7 7 , 9 9 6 , 0 9 1 2 7 . 8 % 12 , 3 0 8 , 5 0 9 0 . 7%
18 1 , 0 9 1 , 54 1 1 0 . 5% 6 7 1 , 3 96 ! 1 4 1 3 9 . 1%
1 , 7 17 , 5 8 1 , 54 8 1 0 0 . 0 %
Lower Quartile 7 , 84 2 , 842

2 - 8 2 COMBINED INCOME STATEMENT - SUMMARY
Fi scal Year 2 0 13 Washoe County - Reno/Sparks With Gaming Revenue of $ 1 , 0 0 0 , 0 0 0 and over
Amounts Represent 2 2 Locations .
REVENUE DOLLARS Gaming . . . . . . . . . . . . . . . . . . . . . . . . . . . . . . . . . . . . . . . . . . . . . . . . . . 64 9 , 0 0 0 , 3 2 7 Rooms . . . . . . . . . . . . . . . . . . . . . . . . . . . . . . . . . . . . . . . . . . . . . . . . . . . 2 2 5 , 7 62 , 3 75 Food . . . . . . . . . . . . . . . . . . . . . . . . . . . . . . . . . . . . . . . . . . . . . . . . . . . . 2 0 8 , 574 , 2 5 9 Beverage . . . . . . . . . . . . . . . . . . . . . . . . . . . . . . . . . . . . . . . . . . . . . . . . 90 , 719 , 9 9 6 Other . . . . . . . . . . . . . . . . . . . . . . . . . . . . . . . . . . . . . . . . . . . . . . . . . . . 7 0 , 1 92 , 1 0 3
1 , 244 , 24 9 , 0 6 0 TOTAL REVENUE . . . . . . . . . . . . . . . . . . . . . . . . . . . . . . . . . . . . · · · · · · · · ·--
�������
COST OF SALES 127 , 85 1 , 6 2 0
GROSS MARGIN 1 , 116 , 3 9 7 , 4 4 0
DEPARTMENTAL EXPENSES . . . . . . . . . . . . . . . . . . . . . . . . . . . . . . . . . . . . . 6 5 8 , 62 5 , 6 0 7
4 5 7 , 7 7 1 , 8 3 3 DEPARTMENTAL INCOME ( LOSS ) . . . . . . . . . . . . . . . . . . . . . . . · · · · · · · · ·----
������
GENERAL AND ADMINISTRATIVE EXPENSES Adverti sing and Promotion . . . . . . . . . . . . . . . . . . . . . . . . . . . . . . . 3 5 , 0 1 8 , 3 90 Bad Debt Expense . . . . . . . . . . . . . . . . . . . . . . . . . . . . . . . . . . . . . . . . 15 , 3 2 3 Complimentary Expense (not reported i n departments ) . . . . . . 2 1 , 9 8 8 , 94 6 Depreciation - Buildings . . . . . . . . . . . . . . . . . . . . . . . . . . . . . . . . 4 1 , 7 9 9 , 4 14 Depreciation and Amortization - Other . . . . . . . . . . . . . . . . . . . 54 , 9 74 , 197 Energy Expense ( electric ity , gas , etc . ) . . . . . . . . . . . . . . . . . 3 3 , 5 52 , 153 Equipment Rental or Lease . . . . . . . . . . . . . . . . . . . . . . . . . . . . . . . 7 , 2 9 7 , 5 7 3 Interest Expense . . . . . . . . . . . . . . . . . . . . . . . . . . . . . . . . . . . . . . . . 6 1 , 8 9 9 , 544 Music and Entertainment . . . . . . . . . . . . . . . . . . . . . . . . . . . . . . . . . 7 , 5 52 , 7 7 0 Payroll Taxes . . . . . . . . . . . . . . . . . . . . . . . . . . . . . . . . . . . . . . . . . . . 7 , 7 95 , 564 Payrol l - Employee Benefits . . . . . . . . . . . . . . . . . . . . . . . . . . . . . 12 , 5 5 6 , 148 Payroll - Officers . . . . . . . . . . . . . . . . . . . . . . . . . . . . . . . . . . . . . . 2 , 0 6 8 , 0 6 7 Payroll - Other Employees . . . . . . . . . . . . . . . . . . . . . . . . . . . . . . . 8 0 , 7 8 7 , 1 1 7 Rent of Premises . . . . . . . . . . . . . . . . . . . . . . . . . . . . . . . . . . . . . . . . 7 , 564 , 1 0 7 Taxes - Real Estate . . . . . . . . . . . . . . . . . . . . . . . . . . . . . . . . . . . . . 11 , 2 15 , 7 0 1 Taxes and Licenses - Other . . . . . . . . . . . . . . . . . . . . . . . . . . . . . . 2 , 92 4 , 8 9 6 Utilities ( Other than Energy Expense ) . . . . . . . . . . . . . . . . . . . 9 , 8 94 , 44 3 Other General and Admini strat ive Expenses . . . . . . . . . . . . . . . 72 , 7 6 5 , 8 0 9
4 7 1 , 6 7 0 , 162 TOTAL GENERAL AND ADMINISTRATIVE EXPENSES . . . . . . . . . . . . . · · · ·------
����=
NET INCOME ( LOSS ) BEFORE FEDERAL INCOME TAXES AND EXTRAORDINARY ITEMS . . . . . . . . . . . . . . . . . . . . . . . . . . . . . . . . . . . .
Average Revenue 5 6 , 5 5 6 , 775
Upper Quartile 8 8 , 92 7 , 172
Median 2 7 , 1 9 0 , 8 1 1
- 13 , 8 98 , 3 2 9
Lower Quartile 8 , 7 9 0 , 84 3
PERCENT 52 . 2 % 18 . 1% 1 6 . 8 %
7 . 3 % 5 . 6 %
1 0 0 . 0 %
1 0 . 3 %
8 9 . 7 %
5 2 . 9 %
3 6 . 8 %
2 . 8 % 0 . 0 % 1 . 8 % 3 . 4 % 4 . 4 % 2 . 7 % 0 . 6 % 5 . 0 % 0 . 6 % 0 . 6 % 1 . 0 % 0 . 2 % 6 . 5 % 0 . 6 % 0 . 9% 0 . 2 % 0 . 8 % 5 . 8 %
3 7 . 9%
- 1 . 1%
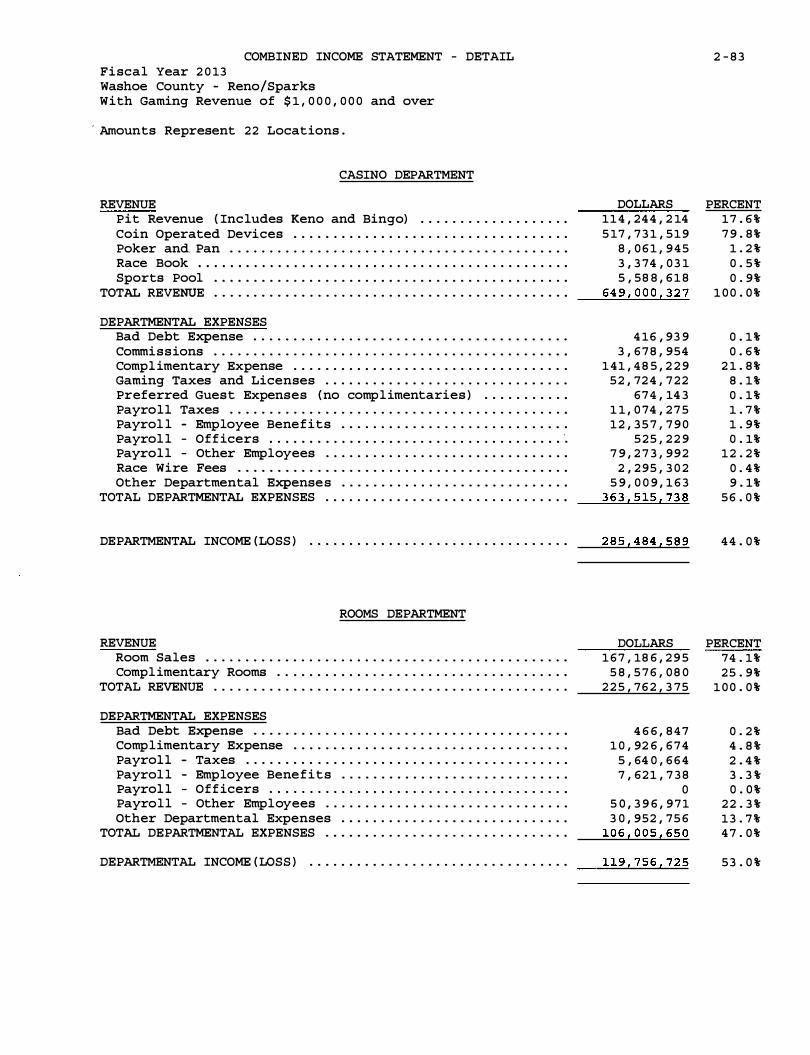
COMBINED INCOME STATEMENT - DETAIL 2 - 8 3 Fiscal Year 2 0 13 Washoe County - Reno/Sparks With Gaming Revenue of $ 1 , 0 0 0 , 0 0 0 and over
· Amounts Represent 22 Locations .
CASINO DEPARTMENT
REVENUE DOLLARS PERCENT Pit Revenue ( Includes Keno and Bingo) . . . . . . . . . . . . . . . . . . . 114 , 24 4 , 2 14 1 7 . 6 % Coin Operated Devices . . . . . . . . . . . . . . . . . . . . . . . . . . . . . . . . . . . 5 17 , 7 3 1 , 5 1 9 7 9 . 8 % Poker and. Pan . . . . . . . . . . . . . . . . . . . . . . . . . . . . . . . . . . . . . . . . . . . 8 , 0 6 1 , 9 4 5 1 . 2 % Race Book . . . . . . . . . . . . . . . . . . . . . . . . . . . . . . . . . . . . . . . . . . . . . . . 3 , 3 74 , 0 3 1 0 . 5 % Sports Pool . . . . . . . . . . . . . . . . . . . . . . . . . . . . . . . . . . . . . . . . . . . . . 5 , 58 8 , 6 1 8 0 . 9%
TOTAL REVENUE . . . . . . . . . . . . . . . . . . . . . . . . . . . . . . . . . . . . . . . . . . . . . 6 4 9 , 0 0 0 , 3 2 7 1 0 0 . 0 %
DEPARTMENTAL EXPENSES Bad Debt Expense . . . . . . . . . . . . . . . . . . . . . . . . . . . . . . . . . . . . . . . . 4 16 , 93 9 0 . 1% Commissions . . . . . . . . . . . . . . . . . . . . . . . . . . . . . . . . . . . . . . . . . . . . . 3 , 6 7 8 , 954 0 . 6 % Compl imentary Expense . . . . . . . . . . . . . . . . . . . . . . . . . . . . . . . . . . . 1 4 1 , 4 8 5 , 2 2 9 2 1 . 8 % Gaming Taxes and Licenses . . . . . . . . . . . . . . . . . . . . . . . . . . . . . . . 5 2 , 72 4 , 7 2 2 8 . 1% Preferred Guest Expenses ( no complimentaries ) . . . . . . . . . . . 674 , 14 3 0 . 1% Payroll Taxes . . . . . . . . . . . . . . . . . . . . . . . . . . . . . . . . . . . . . . . . . . . 1 1 , 0 74 , 2 7 5 1 . 7 % Payrol l - Employee Benefits . . . . . . . . . . . . . . . . . . . . . . . . . . . . . 1 2 , 3 5 7 , 7 9 0 1 . 9% Payrol l - Officers . . . . . . . . . . . . . . . . . . . . . . . . . . . . . . . . . . . . . ·. 5 2 5 , 2 2 9 0 . 1% Payroll - Other Employees . . . . . . . . . . . . . . . . . . . . . . . . . . . . . . . 7 9 , 2 7 3 , 9 9 2 1 2 . 2 % Race Wire Fees . . . . . . . . . . . . . . . . . . . . . . . . . . . . . . . . . . . . . . . . . . 2 , 2 95 , 3 0 2 0 . 4 % Other Departmental Expenses . . . . . . . . . . . . . . . . . . . . . . . . . . . . . 5 9 , 0 0 9 , 1 6 3 9 . 1%
TOTAL DEPARTMENTAL EXPENSES . . . . . . . . . . . . . . . . . . . . . . . . . . . . . . . 3 6 3 , 5 15 , 7 3 8 5 6 . 0 %
DEPARTMENTAL INCOME ( LOSS ) . . . . . . . . . . . . . . . . . . . . . . . . . . . . . . . . . 2 8 5 , 4 84 , 5 8 9 4 4 . 0 %
ROOMS DEPARTMENT
REVENUE DOLLARS PERCENT Room Sales . . . . . . . . . . . . . . . . . . . . . . . . . . . . . . . . . . . . . . . . . . . . . . 1 6 7 , 18 6 , 2 9 5 74 . 1% Compl imentary Rooms . . . . . . . . . . . . . . . . . . . . . . . . . . . . . . . . . . . . . 5 8 , 5 7 6 , 0 8 0 2 5 . 9%
TOTAL REVENUE . . . . . . . . . . . . . . . . . . . . . . . . . . . . . . . . . . . . . . . . . . . . . 2 2 5 , 76 2 , 3 75 1 0 0 . 0 %
DEPARTMENTAL EXPENSES Bad Debt Expense . . . . . . . . . . . . . . . . . . . . . . . . . . . . . . . . . . . . . . . . 4 6 6 , 8 4 7 0 . 2 % Complimentary Expense . . . . . . . . . . . . . . . . . . . . . . . . . . . . . . . . . . . 1 0 , 92 6 , 6 7 4 4 . 8 % Payroll - Taxes . . . . . . . . . . . . . . . . . . . . . . . . . . . . . . . . . . . . . . . . . 5 , 64 0 , 6 6 4 2 . 4 % Payrol l - Employee Benefits . . . . . . . . . . . . . . . . . . . . . . . . . . . . . 7 , 62 1 , 7 3 8 3 . 3 % Payrol l - Officers . . . . . . . . . . . . . . . . . . . . . . . . . . . . . . . . . . . . . . 0 0 . 0 % Payroll - Other Employees . . . . . . . . . . . . . . . . . . . . . . . . . . . . . . . 5 0 , 3 9 6 , 9 7 1 2 2 . 3 % Other Departmental Expenses . . . . . . . . . . . . . . . . . . . . . . . . . . . . . 3 0 , 952 , 75 6 1 3 . 7 %
TOTAL DEPARTMENTAL EXPENSES . . . . . . . . . . . . . . . . . . . . . . . . . . . . . . . 1 06 , 0 0 5 , 6 5 0 4 7 . 0 %
DEPARTMENTAL INCOME ( LOSS ) . . . . . . . . . . . . . . . . . . . . . . . . . . . . . . . . . 1 19 , 7 5 6 , 72 5 5 3 . 0 %

2 - 84 COMBINED INCOME STATEMENT - DETAIL ( CONTINUED)
Fiscal Year 2 0 1 3 Washoe County - Reno/Sparks With Gaming Revenue of $ 1 , 0 0 0 , 0 0 0 and over
Amount s Represent 2 2 Locations .
FOOD DEPARTMENT REVENUE DOLLARS PERCENT
Food Sales 148 , 92 7 , 6 2 7 7 1 . 4 % Complimentary Food Sales . . . . . . . . . . . . . . . . . . . . . . . . . . . . . . . . 5 9 , 64 6 , 6 3 2 2 8 . 6 %
TOTAL REVENUE . . . . . . . . . . . . . . . . . . . . . . . . . . . . . . . . . . . . . . . . . . . . . 2 0 8 , 5 74 , 2 5 9 1 0 0 . 0 %
COST OF SALES 8 5 , 7 3 9 , 0 8 8 4 1 . 1 %
GROSS MARGIN 122 , 8 3 5 , 1 7 1 5 8 . 9%
DEPARTMENTAL EXPENSES Bad Debt Expense . . . . . . . . . . . . . . . . . . . . . . . . . . . . . . . . . . . . . . . . 3 , 5 3 0 0 . 0 % Compl imentary Expense . . . . . . . . . . . . . . . . . . . . . . . . . . . . . . . . . . . 2 , 6 0 6 , 4 3 5 1 . 2 % Payrol l - Taxes . . . . . . . . . . . . . . . . . . . . . . . . . . . . . . . . . . . . . . . . . 1 0 , 18 1 , 64 7 4 . 9 % Payroll - Employee Benefits . . . . . . . . . . . . . . . . . . . . . . . . . . . . . 1 1 , 0 8 7 , 8 9 2 5 . 3 % Payrol l - Officers . . . . . . . . . . . . . . . . . . . . . . . . . . . . . . . . . . . . . . 0 0 . 0 % Payroll - Other Employees . . . . . . . . . . . . . . . . . . . . . . . . . . . . . . . 8 2 , 0 7 8 , 652 3 9 . 4 % Other Departmental Expenses . . . . . . . . . . . . . . . . . . . . . . . . . . . . . 12 , 5 15 , 6 0 5 6 . 0 %
TOTAL DEPARTMENTAL EXPENSES . . . . . . . . . . . . . . . . . . . . . . . . . . . . . . . 118 , 4 73 , 7 6 1 5 6 . 8 %
DEPARTMENTAL INCOME ( LOSS ) . . . . . . . . . . . . . . . . . . . . . . . . . . . . . . . . . 4 , 3 6 1 , 4 10 2 . 1 %
BEVERAGE DEPARTMENT REVENUE DOLLARS PERCENT
Beverage Sales . . . . . . . . . . . . . . . . . . . . . . . . . . . . . . . . . . . . . . . . . . 3 7 , 0 96 , 4 5 9 4 0 . 9 % Complimentary Beverage Sales . . . . . . . . . . . . . . . . . . . . . . . . . . . . 5 3 , 62 3 , 5 3 7 5 9 . 1 %
TOTAL REVENUE . . . . . . . . . . . . . . . . . . . . . . . . . . . . . . . . . . . . . . . . . . . . . 9 0 , 7 1 9 , 9 9 6 1 0 0 . 0 %
COST OF SALES 2 6 , 3 0 9 , 775 2 9 . 0 %
GROSS MARGIN . . . . . . . . . . . . . . . . . . . . . . . . . . . . . . . . . . . . . . . . . . . . . . 64 , 4 1 0 , 2 2 1 7 1 . 0 %
DEPARTMENTAL EXPENSES Bad Debt Expense . . . . . . . . . . . . . . . . . . . . . . . . . . . . . . . . . . . . . . . . 4 2 0 . 0 % Complimentary Expense . . . . . . . . . . . . . . . . . . . . . . . . . . . . . . . . . . . 1 , 0 8 5 , 2 0 1 1 . 2 % Payrol l - Taxes . . . . . . . . . . . . . . . . . . . . . . . . . . . . . . . . . . . . . . . . . 2 , 5 0 0 , 3 6 0 2 . 8 % Payroll - Employee Benefits . . . . . . . . . . . . . . . . . . . . . . . . . . . . . 3 , 0 8 6 , 4 8 9 3 . 4 % Payroll - Officers . . . . . . . . . . . . . . . . . . . . . . . . . . . . . . . . . . . . . . 0 0 . 0 % Payroll - Other Employees . . . . . . . . . . . . . . . . . . . . . . . . . . . . . . . 16 , 34 8 , 7 3 1 18 . 0 % Other Departmental Expenses . . . . . . . . . . . . . . . . . . . . . . . . . . . . . 4 , 8 2 8 , 995 5 . 3 %
TOTAL DEPARTMENTAL EXPENSES . . . . . . . . . . . . . . . . . . . . . . . . . . . . . . . 2 7 , 84 9 , 8 1 8 3 0 . 7 %
DEPARTMENTAL INCOME ( LOSS ) . . . . . . . . . . . . . . . . . . . . . . . . . . . . . . . . . 3 6 , 5 6 0 , 4 0 3 4 0 . 3 %

COMBINED INCOME STATEMENT - DETAIL ( CONTINUED)
Fiscal Year 2 0 13 Washoe County - Reno/Sparks With Gaming Revenue of $ 1 , 0 0 0 , 0 0 0 and over
Amounts Represent 2 2 Locations .
OTHER INCOME REVENUE
Other Operating and Non- operating Income . . . . . . . . . . . . . . . .
Other Complimentary Items . . . . . . . . . . . . . . . . . . . . . . . . . . . . . . .
TOTAL REVENUE . . . . . . . . . . . . . . . . . . . . . . . . . . . . . . . . . . . . . . . . . . . . .
COST OF SALES . . . . . . . . . . . . . . . . . . . . . . . . . . . . . . . . . . . . . . . . . . . . .
GROSS MARGIN . . . . . . . . . . . . . . . . . . . . . . . . . . . . . . . . . . . . . . . . . . . . . .
DEPARTMENTAL EXPENSES Bad Debt Expense . . . . . . . . . . . . . . . . . . . . . . . . . . . . . . . . . . . . . . . .
Complimentary Expense . . . . . . . . . . . . . . . . . . . . . . . . . . . . . . . . . . .
Payroll - Taxes . . . . . . . . . . . . . . . . . . . . . . . . . . . . . . . . . . . . . . . . .
Payroll - Employee Benefits . . . . . . . . . . . . . . . . . . . . . . . . . . . . .
Payroll - Officers . . . . . . . . . . . . . . . . . . . . . . . . . . . . . . . . . . . . . .
Payroll - Other Employees . . . . . . . . . . . . . . . . . . . . . . . . . . . . . . .
Other Departmental Expenses . . . . . . . . . . . . . . . . . . . . . . . . . . . . .
TOTAL DEPARTMENTAL EXPENSES . . . . . . . . . . . . . . . . . . . . . . . . . . . . . . .
DEPARTMENTAL INCOME ( LOSS ) . . . . . . . . . . . . . . . . . . . . . . . . . . . . . . . . .
AVERAGE NUMBER OF EMPLOYEES FOR THE YEAR
CASINO DEPARTMENT ROOMS DEPARTMENT . . . . . . . . . . . . . . . . . . . . . .
FOOD DEPARTMENT . . . . . . . . . . . . . . . . . . . . . . .
BEVERAGE DEPARTMENT . . . . . . . . . . . . . . . . . . .
G & A DEPARTMENT . . . . . . . . . . . . . . . . . . . . .
OTHER DEPARTMENTS . . . . . . . . . . . . . . . . . . . . .
TOTAL
DOLLARS 5 7 , 52 0 , 8 3 3 12 , 6 7 1 , 2 70 7 0 , 192 , 103
1 5 , 8 0 2 , 7 5 7
5 4 , 3 8 9 , 3 4 6
3 0 , 3 6 6 2 , 3 6 5 , 6 0 0 2 , 4 8 2 , 7 5 4 2 , 4 5 2 , 4 7 2
0 2 0 , 7 3 9 , 3 8 4 14 , 7 1 0 , 0 6 4 4 2 , 78 0 , 6 4 0
1 1 , 6 0 8 , 7 0 6
3 , 4 4 2 2 , 4 7 6 4 , 195 1 , 102 2 , 3 6 5
7 2 0
14 , 3 0 0
2 - 8 5
PERCENT 8 1 . 9%' 18 . 1%
1 0 0 . 0 %
2 2 . 5%
7 7 . 5 %
0 . 0 % 3 . 4 % 3 . 5% 3 . 5 % 0 . 0 %
2 9 . 5 % 2 1 . 0 % 6 0 . 9%
16 . 5 %

2 - 8 6 ROOM OCCUPANCY AND PER ROOM PER DAY ANALYSIS
Fiscal Year 2 0 1 3 Washoe County - Reno/Sparks With Gaming Revenue of $ 1 , 0 0 0 , 0 0 0 and over
Amounts Represent 2 2 Locations .
RATE OF ROOM OCCUPANCY
MONTH JULY . . . . . . . . . .
AUGUST . . . . . . . . SEPTEMBER . . . . .
OCTOBER . . . . . . . NOVEMBER . . . . . . DECEMBER . . . . . . JANUARY . . .. . . . . FEBRUARY . . . . . . MARCH . . . . . . . . . APRIL . . . . . . . . . MAY .. . . . . . . . . . . JUNE . . . . . . . . . .
TOTAL . . . . . . . . .
Average Pit Revenue Per Room Per Day
Average Slot Revenue Per Room Per Day
Average Food Sales Per Room Per Day
AVAILABLE ROOMS ROOMS OCCUPIED 3 7 8 , 6 7 0 2 8 6 , 4 6 1 3 7 9 , 0 3 3 2 94 , 8 9 1 3 8 0 , 7 3 8 2 8 8 , 7 6 8 3 75 , 9 6 7 2 4 2 , 0 4 9 3 6 2 , 7 6 4 1 9 0 , 9 7 7 3 8 7 , 3 0 9 2 16 , 0 4 9 3 7 6 , 6 0 8 2 1 1 , 4 4 7 3 4 6 , 4 2 8 2 0 9 , 4 6 1 3 9 0 , 145 252 , 0 8 7 3 6 6 , 4 0 2 2 4 5 , 197 3 7 7 , 0 74 2 7 0 , 7 7 9 3 7 9 , 9 6 2 3 0 2 , 6 2 3
4 , 5 0 1 , 10 0 3 , 0 1 0 , 7 8 9
PER ROOM PER DAY STATISTICS
3 7 . 94
1 7 1 . 9 6
6 9 . 2 8
Average Beverage Sales Per Room Per Day
Average Rooms Department Payroll Per Room Per Day
Average Room Rate Per Day
% OF OCCUPANCY
( COMPUTED) 7 5 . 6 5 % 7 7 . 8 0 % 7 5 . 84 % 64 . 3 8 % 5 2 . 64 % 5 5 . 7 8 % 5 6 . 1 5 % 6 0 . 4 6 % 64 . 6 1 % 6 6 . 92 % 7 1 . 8 1 % 7 9 . 6 5 %
6 6 . 8 9 %
3 0 . 13
2 1 . 14
74 . 9 8

PER SQUARE FOOT ANALYSIS AND RATIOS 2 - 8 7 Fiscal Year 2 0 13 Washoe County - Reno/Sparks With Gaming Revenue of $ 1 , 0 0 0 , 0 0 0 and over
Amounts Represent 2 2 Locations .
GAMING REVENUE PER SQUARE FOOT OF FLOOR SPACE
NO . OF CASINOS AVERAGE AREA GAMING REVENUE AREA OPERATING IN SQUARE FEET PER SQUARE FOOT
Pit ( Includes Bingo and Keno) 17 7 , 14 5 Coin Operated Devices 2 1 2 9 , 4 7 9 Poker and Pan 1 0 1 , 554 Race and Sports 8 3 , 65 1
TOTAL CASINO 2 2 3 5 , 6 94
RATIOS
TOTAL CURRENT ASSETS TO TOTAL CURRENT LIABILITIES . . . . . . . . .
TOTAL CAPITAL TO TOTAL LIABILITIES . . . . . . . . . . . . . . . . . . . . . . . .
TOTAL CAPITAL TO TOTAL CURRENT LIABILITIES . . . . . . . . . . . . . . . .
TOTAL CURRENT LIABILITIES TO TOTAL LIABILITIES . . . . . . . . . . . .
TOTAL COMPLIMENTARY EXPENSE TO GAMING REVENUE . . . . . . . . . . . . .
MUSIC AND ENTERTAINMENT EXPENSES TO GAMING REVENUE . . . . . . . .
TOTAL REVENUE TO AVERAGE TOTAL ASSETS . . . . . . . . . . . . . . . . . . . . .
TOTAL REVENUE LESS COMP SALES TO AVERAGE TOTAL ASSETS . . . . .
RETURN ON INVESTED CAPITAL* . . . . . . . . . . . . . . . . . . . . . . . . . . . . . . .
RETURN ON AVERAGE ASSETS * . . . . . . . . . . . . . . . . . . . . . . . . . . . . . . . . .
* - FORMULAS
Return on Invested Capital is equal to the total of net income (before federal income taxes and extraordinary items ) and interest
expense divided by the total of average total assets less average current liabilities .
PERCENT 3 5 3 . 5%
64 . 2 %
8 4 5 . 1%
7 . 6%
2 7 . 8 %
1 . 2 %
7 1 . 3 %
6 0 . 7 %
3 . 0 %
2 . 8 %
Return on Average Assets is equal to the total of net income (before federal income taxes and extraordinary items ) and interest expense divided by the average total assets .
9 4 1 8 3 6 5 1 9 3 0 7
8 2 6

2 - 8 8
THIS PAGE LEFT INTENTIONALLY BLANK

COMBINED BALANCE SHEET Fiscal Year 2 0 13 Washoe County - Reno/Sparks With Gaming Revenue of $ 1 , 0 0 0 , 0 0 0 to $ 12 , 0 0 0 , 0 0 0
Amounts Represent 8 Locations .
ASSETS CURRENT ASSETS
Cash . . . . . . . . . . . . . . . . . . . . . . . . . . . . . . . . . . . . . . . . . . . . . . . . . . . .
Receivables TOTAL ALLOWANCE Casino 157 , 8 10 8 1 , 0 62 Trade 255 , 0 88 o
Sundry 65 , 4 8 3 0 Notes 0 o
Prepaid Expenses . . . . . . . . . . . . . . . . . . . . . . . . . . . . . . . . . . . . . . . . Other Current Assets . . . . . . . . . . . . . . . . . . . . . . . . . . . . . . . . . . . .
TOTAL CURRENT ASSETS . . . . . . . . . . . . . . . . . . . . . . . . . . . . . . . . . . . . . .
FIXED ASSETS COST DEPRECIATION Land 3 , 54 9 , 4 7 8 . . . . . . . . . . . Land Improvements 0 0 Buildings & Improvements 2 0 , 4 0 3 , 722 7 , 0 2 2 , 5 75 Furniture & Equipment 3 0 , 595 , 2 66 2 3 , 2 0 5 , 0 1 0 Lease Improvements 6 96 , 3 3 8 5 11 , 4 94 Construction in Progress 3 8 , 4 4 9 . . . . . . . . . . .
TOTAL FIXED ASSETS . . . . . . . . . . . . . . . . . . . . . . . . . . . . . . . . . . . . . . . .
OTHER ASSETS
TOTAL ASSETS
LIABILITIES AND CAPITAL CURRENT LIABILITIES
Accounts Payable - Trade . . . . . . . . . . . . . . . . . . . . . . . . . . . . . . . . Accounts Payable - Other . . . . . . . . . . . . . . . . . . . . . . . . . . . . . . . . Current Portion of Long-Term Debt . . . . . . . . . . . . . . . . . . . . . . .
Accrued Expenses . . . . . . . . . . . . . . . . . . . . . . . . . . . . . . . . . . . . . . . . Other Current Liabilities . . . . . . . . . . . . . . . . . . . . . . . . . . . . . . .
TOTAL CURRENT LIABILITIES . . . . . . . . . . . . . . . . . . . . . . . . . . . . . . . . .
LONG-TERM DEBT Mortgages Debentures & Bonds Notes Contracts Other
TOTAL LONG-TERM DEBT OTHER LIABILITIES TOTAL LIABILITIES
CAPITAL
TOTAL OWING CURRENT PORTION 0 0 0 0
2 , 216 , 054 2 4 0 , 983 4 4 7 , 8 4 9 3 5 7 , 180
15 , 12 3 , 8 8 8 50 , 0 0 0 17 , 7 8 7 , 791 64 8 , 163
Owners Capital Accounts . . . . . . . . . . . . . . . . . . . . . . . . . . . . . . . . . Capital Stock & Other Capital . . . . . . . . . . . . . . . . . . . . . . . . . . .
Retained Earnings . . . . . . . . . . . . . . . . . . . . . . . . . . . . . . . . . . . . . . .
TOTAL CAPITAL . . . . . . . . . . . . . . . . . . . . . . . . . . . . . . . . . . . . . . . . . . . . .
TOTAL LIABILITIES AND CAPITAL . . . . . . . . . . . . . . . . . . . . . . . . . . . . . .
Average Assets 5 , 4 5 3 , 4 6 8
Upper Quartile 10 , 761 , 8 0 9
Median 2 , 6 0 9 , 7 7 3
2 - 8 9
DOLLARS PERCENT 14 , 3 0 0 , 7 9 1
7 6 , 748 255 , 0 8 8
65 , 4 83 0
1 , 3 3 4 , 735 63 0 , 7 9 9
16 , 66 3 , 644
3 , 54 9 , 4 7 8 0
13 , 3 8 1 , 14 7 7 , 3 9 0 , 256
184 , 84 4 3 8 , 4 4 9
24 , 544 , 174
2 , 4 19 , 92 8
4 3 , 62 7 , 746
1 , 59 5 , 683 3 6 , 171
64 8 , 163 2 , 4 7 7 , 0 7 0
2 8 3 , 5 0 6 5 , 040 , 593
0 0
1 , 975 , 0 7 1 90 , 6 6 9
15 , 0 73 , 888 17 , 13 9 , 628
3 0 9 , 105 22 , 4 8 9 , 3 2 6
3 7 , 8 7 0 , 134 - 1 , 878 , 2 8 7
- 14 , 853 , 4 2 7 2 1 , 13 8 , 4 2 0
4 3 , 627 , 74 6
Lower Quartile 1 , 34 7 , 3 6 3
3 2 . 8 %
0 . 2 % 0 . 6 % 0 . 2 % 0 . 0 % 3 . 1% 1 . 4 %
3 8 . 2 %
8 . 1% 0 . 0 %
3 0 . 7% 16 . 9%
0 . 4 % 0 . 1%
56 . 3 %
5 . 5 %
100 . 0 %
3 . 7 % 0 . 1% 1 . 5 % 5 . 7 % 0 . 6 %
11 . 6 %
0 . 0 % 0 . 0 % 4 . 5 % 0 . 2 %
3 4 . 6 % 3 9 . 3 %
0 . 7 % 5 1 . 5 %
8 6 . 8 % -4 . 3 %
-34 . 0 % 4 8 . 5 %
1 0 0 . 0 %

2 - 9 0 COMBINED INCOME STATEMENT - SUMMARY
Fiscal Year 2 0 1 3 Washoe County - Reno/Sparks With Gaming Revenue of $ 1 , 0 0 0 , 0 0 0 to $ 12 , 0 0 0 , 0 0 0
Amounts Represent 8 Locations .
REVENUE DOLLARS Gaming . . . . . . . . . . . . . . . . . . . . . . . . . . . . . . . . . . . . . . . . . . . . . . . . . . 3 6 , 5 5 6 , 3 6 2 Rooms . . . . . . . . . . . . . . . . . . . . . . . . . . . . . . . . . . . . . . . . . . . . . . . . . . . 4 , 74 9 , 3 94 Food . . . . . . . . . . . . . . . . . . . . . . . . . . . . . . . . . . . . . . . . . . . . . . . . . . . . 7 , 0 3 2 , 3 8 1 Beverage . . . . . . . . . . . . . . . . . . . . . . . . . . . . . . . . . . . . . . . . . . . . . . . . 3 , 4 5 8 , 7 9 1 Other . . . . . . . . . . . . . . . . . . . . . . . . . . . . . . . . . . . . . . . . . . . . . . . . . . . 1 , 97 9 , 4 3 7
5 3 , 7 7 6 , 3 65 TOTAL REVENUE . . . . . . . . . . . . . . . . . . . . . . . . . . . . . . . . . . . . . . . . . · · · ·----
������
COST OF SALES 5 , 3 66 , 6 8 6
GROSS MARGIN 4 8 , 4 0 9 , 6 7 9
DEPARTMENTAL EXPENSES . . . . . . . . . . . . . . . . . . . . . . . . . . . . . . . . . . . . . 2 9 , 5 2 6 , 2 0 5
DEPARTMENTAL INCOME ( LOSS ) 18 , 8 8 3 , 4 7 4 · · · · · · · · · · • · · · • • · · · · · · . . . . . . . . . ·---
-=:::...L.=:::...L...!....:.. -=.
GENERAL AND ADMINISTRATIVE EXPENSES Advertising and Promotion . . . . . . . . . . . . . . . . . . . . . . . . . . . . . . . 2 , 0 6 2 , 6 0 2 Bad Debt Expense . . . . . . . . . . . . . . . . . . . . . . . . . . . . . . . . . . . . . . . . 13 , 614 Complimentary Expense ( not reported in departments ) . . . . . . 1 , 0 1 7 , 24 7 Depreciation - Buildings . . . . . . . . . . . . . . . . . . . . . . . . . . . . . . . . 2 8 7 , 8 7 3 Depreciation and Amorti zation - Other . . . . . . . . . . . . . . . . . . . 1 , 0 0 3 , 4 0 2 Energy Expense ( electricity, gas , etc . ) . . . . . . . . . . . . . . . . . 1 , 3 1 0 , 5 9 3 Equipment Rental o r Lease . . . . . . . . . . . . . . . . . . . . . . . . . . . . . . . 4 5 , 5 15 Interest Expense . . . . . . . . . . . . . . . . . . . . . . . . . . . . . . . . . . . . . . . . 1 , 574 , 194 Music and Entertainment . . . . . . . . . . . . . . . . . . . . . . . . . . . . . . . . . 52 , 3 4 5 Payroll Taxes . . . . . . . . . . . . . . . . . . . . . . . . . . . . . . . . . . . . . . . . . . . 5 94 , 4 6 5 Payroll - Employee Benefits . . . . . . . . . . . . . . . . . . . . . . . . . . . . . 7 15 , 54 0 Payroll - Officers . . . . . . . . . . . . . . . . . . . . . . . . . . . . . . . . . . . . . . 97 7 , 0 2 0 Payrol l - Other Employees . . . . . . . . . . . . . . . . . . . . . . . . . . . . . . . 5 , 5 7 7 , 0 9 9 Rent o f Premises . . . . . . . . . . . . . . . . . . . . . . . . . . . . . . . . . . . . . . . . 4 , 2 7 7 , 8 7 8 Taxes - Real Estate . . . . . . . . . . . . . . . . . . . . . . . . . . . . . . . . . . . . . 3 2 2 , 3 5 3 Taxes and Licenses - Other . . . . . . . . . . . . . . . . . . . . . . . . . . . . . . 3 6 4 , 6 6 2 Utilities ( Other than Energy Expense ) . . . . . . . . . . . . . . . . . . . 2 6 1 , 5 8 3 Other General and Administrative Expenses . . . . . . . . . . . . . . . 3 , 9 2 9 , 3 0 4
2 4 , 3 8 7 , 2 8 9 TOTAL GENERAL AND ADMINISTRATIVE EXPENSES . . . . . . . . . . . . . . . . ·----
-=�����
NET INCOME ( LOSS ) BEFORE FEDERAL INCOME TAXES AND EXTRAORDINARY ITEMS . . . . . . . . . . . . . . . . . . . . . . . . . . . . . . . . . . . .
Average Revenue 6 , 722 , 0 4 6
Upper Quartile 10 , 8 9 7 , 9 7 5
Median 4 , 6 8 8 , 957
- 5 , 5 0 3 , 8 15
Lower Quartile 2 , 0 64 , 0 94
PERCENT 6 8 . 0 %
8 . 8 % 13 . 1%
6 . 4 % 3 . 7 %
1 0 0 . 0 %
1 0 . 0 %
9 0 . 0 %
54 . 9%
3 5 . 1%
3 . 8 % 0 . 0 % 1 . 9% 0 . 5 % 1 . 9% 2 . 4 % 0 . 1% 2 . 9% 0 . 1 % 1 . 1% 1 . 3 % 1 . 8 %
1 0 . 4 % 8 . 0 % 0 . 6% 0 . 7 % 0 . 5 % 7 . 3 %
4 5 . 3 %
- 1 0 . 2 %

COMBINED INCOME STATEMENT - DETAIL 2 - 91 Fiscal Year 2 0 1 3 Washoe County - Reno/Sparks With Gaming Revenue of $ 1 , 0 0 0 , 0 0 0 to $12 , 0 0 0 , 0 0 0
Amounts Represent 8 Locations .
CASINO DEPARTMENT
REVENUE DOLLARS PERCENT Pit Revenue ( Includes Keno and Bingo) . . . . . . . . . . . . . . . . . . . 2 , 3 18 , 915 6 . 3 % Coin Operated Devices . . . . . . . . . . . . . . . . . . . . . . . . . . . . . . . . . . . 32 , 34 9 , 4 0 1 88 . 5 % Poker and Pan . . . . . . . . . . . . . . . . . . . . . . . . . . . . . . . . . . . . . . . . . . . 2 8 1 , 564 0 . 8 % Race Book . . . . . . . . . . . . . . . . . . . . . . . . . . . . . . . . . . . . . . . . . . . . . . . 574 , 3 0 1 1 . 6 % Sports Pool . . . . . . . . . . . . . . . . . . . . . . . . . . . . . . . . . . . . . . . . . . . . . 1 , 032 , 1 8 1 2 . 8 %
TOTAL REVENUE . . . . . . . . . . . . . . . . . . . . . . . . . . . . . . . . . . . . . . . . . . . . . 3 6 , 556 , 3 6 2 1 0 0 . 0 %
DEPARTMENTAL EXPENSES Bad Debt Expense . . . . . . . . . . . . . . . . . . . . . . . . . . . . . . . . . . . . . . . . 2 5 , 2 02 0 . 1% Commi ssions . . . . . . . . . . . . . . . . . . . . . . . . . . . . . . . . . . . . . . . . . . . . . 2 , 6 8 9 , 6 12 7 . 4 % Complimentary Expense . . . . . . . . . . . . . . . . . . . . . . . . . . . . . . . : . . . 3 , 910 , 34 7 10 . 7 % Gaming Taxes and Licenses . . . . . . . . . . . . . . . . . . . . . . . . . . . . . . . 2 , 4 0 0 , 0 3 7 6 . 6 % Preferred Guest Expenses (no complimentaries ) . . . . . . . . . . . 2 6 9 , 4 8 7 0 . 7 % Payroll Taxes . . . . . . . . . . . . . . . . . . . . . . . . . . . . . . . . . . . . . . . . . . . 506 , 2 96 1 . 4 % Payroll - Employee Benefits . . . . . . . . . . . . . . . . . . . . . . . . . . . . . 28 6 , 6 9 9 0 . 8 % Payroll - Officers . . . . . . . . . . . . . . . . . . . . . . . . . . . . . . . . . . . . . . 525 , 2 2 9 1 . 4 % Payrol l - Other Employees . . . . . . . . . . . . . . . . . . . . . . . . . . . . . . . 3 , 94 0 , 0 9 6 10 . 8 % Race Wire Fees . . . . . . . . . . . . . . . . . . . . . . . . . . . . . . . . . . . . . . . . . . 1 , 2 0 7 , 3 3 7 3 . 3 % Other Departmental Expenses . . . . . . . . . . . . . . . . . . . . . . . . . . . . . 4 , 2 94 , 90 7 11 . 7 %
TOTAL DEPARTMENTAL EXPENSES . . . . . . . . . . . . . . . . . . . . . . . . . . . . . . . 2 0 , 055 , 24 9 54 . 9%
DEPARTMENTAL INCOME (LOSS ) . . . . . . . . . . . . . . . . . . . . . . . . . . . . . . . . . 16 , 5 0 1 , 113 4 5 . 1%
ROOMS DEPARTMENT
REVENUE DOLLARS PERCENT Room Sales . . . . . . . . . . . . . . . . . . . . . . . . . . . . . . . . . . . . . . . . . . . . . . 3 , 604 , 82 1 75 . 9% Complimentary Rooms . . . . . . . . . . . . . . . . . . . . . . . . . . . . . . . . . . . . . 1 , 14 4 , 5 7 3 24 . 1%
TOTAL REVENUE . . . . . . . . . . . . . . . . . . . . . . . . . . . . . . . . . . . . . . . . . . . . . 4 , 74 9 , 3 94 100 . 0 %
DEPARTMENTAL EXPENSES Bad Debt Expense . . . . . . . . . . . . . . . . . . . . . . . . . . . . . . . . . . . . . . . . 6 8 , 984 1 . 5% Complimentary Expense . . . . . . . . . . . . . . . . . . . . . . . . . . . . . . . . . . . 18 , 982 0 . 4 % Payroll - Taxes . . . . . . . . . . . . . . . . . . . . . . . . . . . . . . . . . . . . . . . . . 122 , 4 10 2 . 5% Payroll - Employee Benefits . . . . . . . . . . . . . . . . . . . . . . . . . . . . . 6 6 , 8 7 0 1 . 4 % Payroll - Officers . . . . . . . . . . . . . . . . . . . . . . . . . . . . . . . . . . . . . . 0 0 . 0 % Payroll - Other Employees . . . . . . . . . . . . . . . . . . . . . . . . . . . . . . . 1 , 172 , 6 94 24 . 7% Other Departmental Expenses . . . . . . . . . . . . . . . . . . . . . . . . . . . . . 1 , 2 8 8 , 9 3 3 2 7 . 1%
TOTAL DEPARTMENTAL EXPENSES . . . . . . . . . . . . . . . . . . . . . . . . . . . . . . . 2 , 7 3 8 , 8 7 3 57 . 7 %
DEPARTMENTAL INCOME (LOSS ) . . . . . . . . . . . . . . . . . . . . . . . . . . . . . . . . . 2 , 010 , 5 2 1 4 2 . 3 %

2 - 92 COMBINED INCOME STATEMENT - DETAIL ( CONTINUED )
Fiscal Year 2 0 13 Washoe County - Reno/Sparks With Gaming Revenue of $ 1 , 0 0 0 , 0 0 0 to $ 12 , 0 0 0 , 0 0 0
Amounts Represent 8 Locat ions .
FOOD DEPARTMENT REVENUE DOLLARS PERCENT
Food Sales 5 , 9 3 7 , 118 84 . 4 % Complimentary Food Sales . . . . . . . . . . . . . . . . . . . . . . . . . . . . . . . . 1 , 0 95 , 2 6 3 15 . 6 %
TOTAL REVENUE . . . . . . . . . . . . . . . . . . . . . . . . . . . . . . . . . . . . . . . . . . . . . 7 , 0 3 2 , 3 8 1 1 0 0 . 0 %
COST OF SALES 3 , 16 9 , 5 7 2 4 5 . 1%
GROSS MARGIN 3 , 8 6 2 , 8 0 9 54 . 9%
DEPARTMENTAL EXPENSES Bad Debt Expense . . . . . . . . . . . . . . . . . . . . . . . . . . . . . . . . . . . . . . . . 0 0 . 0 % Compl imentary Expense . . . . . . . . . . . . . . . . . . . . . . . . . . . . . . . . . . . 7 8 , 5 8 8 1 . 1% Payroll - Taxes . . . . . . . . . . . . . . . . . . . . . . . . . . . . . . . . . . . . . . . . . 3 9 6 , 3 9 0 5 . 6 % Payroll - Employee Benefits . . . . . . . . . . . . . . . . . . . . . . . . . . . . . 2 2 9 , 4 5 1 3 . 3 % Payrol l - Off icers . . . . . . . . . . . . . . . . . . . . . . . . . . . . . . . . . . . . . . 0 0 . 0 % Payroll - Other Employees . . . . . . . . . . . . . . . . . . . . . . . . . . . . . . . 3 , 5 8 7 , 0 3 5 5 1 . 0 % Other Departmental Expenses . . . . . . . . . . . . . . . . . . . . . . . . . . . . . 8 9 0 , 1 9 5 12 . 7 %
TOTAL DEPARTMENTAL EXPENSES . . . . . . . . . . . . . . . . . . . . . . . . . . . . . . . 5 , 18 1 , 6 5 9 73 . 7 %
DEPARTMENTAL INCOME ( LOS S ) . . . . . . . . . . . . . . . . . . . . . . . . . . . . . . . . . - 1 , 3 18 , 8 5 0 - 18 . 8 %
BEVERAGE DEPARTMENT REVENUE DOLLARS PERCENT
Beverage Sales . . . . . . . . . . . . . . . . . . . . . . . . . . . . . . . . . . . . . . . . . . 84 1 , 122 2 4 . 3 % Complimentary Beverage Sales . . . . . . . . . . . . . . . . . . . . . . . . . . . . 2 , 6 1 7 , 6 6 9 7 5 . 7 %
TOTAL REVENUE . . . . . . . . . . . . . . . . . . . . . . . . . . . . . . . . . . . . . . . . . . . . . 3 , 4 5 8 , 7 9 1 1 0 0 . 0 %
COST OF SALES 1 , 4 3 4 , 3 4 6 4 1 . 5 %
GROSS MARGIN . . . . . . . . . . . . . . . . . . . . . . . . . . . . . . . . . . . . . . . . . . . . . . 2 , 0 2 4 , 4 4 5 5 8 . 5 %
DEPARTMENTAL EXPENSES Bad Debt Expense . . . . . . . . . . . . . . . . . . . . . . . . . . . . . . . . . . . . . . . . 0 0 . 0 % Compl imentary Expense . . . . . . . . . . . . . . . . . . . . . . . . . . . . . . . . . . . 0 0 . 0 % Payroll - Taxes . . . . . . . . . . . . . . . . . . . . . . . . . . . . . . . . . . . . . . . . . 92 , 6 8 7 2 . 7 % Payroll - Employee Benefits . . . . . . . . . . . . . . . . . . . . . . . . . . . . . 7 9 , 8 1 9 2 . 3 % Payrol l - Officers . . . . . . . . . . . . . . . . . . . . . . . . . . . . . . . . . . . . . . 0 0 . 0 % Payroll - Other Employees . . . . . . . . . . . . . . . . . . . . . . . . . . . . . . . 7 3 0 , 167 2 1 . 1% Other Departmental Expenses . . . . . . . . . . . . . . . . . . . . . . . . . . . . . 2 3 1 , 6 7 3 6 . 7 %
TOTAL DEPARTMENTAL EXPENSES . . . . . . . . . . . . . . . . . . . . . . . . . . . . . . . 1 , 134 , 3 4 6 3 2 . 8 %
DEPARTMENTAL INCOME ( LOSS ) . . . . . . . . . . . . . . . . . . . . . . . . . . . . . . . . . 8 9 0 , 0 9 9 2 5 . 7 %

COMBINED INCOME STATEMENT - DETAIL ( CONTINUED)
Fiscal Year 2 0 1 3 Washoe County - Reno/Sparks With Gaming Revenue of $ 1 , 0 0 0 , 0 0 0 to $12 , 0 0 0 , 0 0 0
Amounts Represent 8 Locations .
OTHER INCOME REVENUE
Other Operating and Non-operating Income . . . . . . . . . . . . . . . .
Other Complimentary Items . . . . . . . . . . . . . . . . . . . . . . . . . . . . . . .
TOTAL REVENUE . . . . . . . . . . . . . . . . . . . . . . . . . . . . . . . . . . . . . . . . . . . . .
COST OF SALES . . . . . . . . . . . . . . . . . . . . . . . . . . . . . . . . . . . . . . . . . . . . .
GROSS MARGIN . . . . . . . . . . . . . . . . . . . . . . . . . . . . . . . . . . . . . . . . . . . . . .
DEPARTMENTAL EXPENSES Bad Debt Expense . . . . . . . . . . . . . . . . . . . . . . . . . . . . . . . . . . . . . . . .
Complimentary Expense . . . . . . . . . . . . . . . . . . . . . . . . . . . . . . . . . . .
Payroll - Taxes . . . . . . . . . . . . . . . . . . . . . . . . . . . . . . . . . . . . . . . . . Payroll - Employee Benefits . . . . . . . . . . . . . . . . . . . . . . . . . . . . .
Payroll - Officers . . . . . . . . . . . . . . . . . . . . . . . . . . . . . . . . . . . . . .
Payroll - Other Employees . . . . . . . . . . . . . . . . . . . . . . . . . . . . . . .
Other Departmental Expenses . . . . . . . . . . . . . . . . . . . . . . . . . . . . .
TOTAL DEPARTMENTAL EXPENSES . . . . . . . . . . . . . . . . . . . . . . . . . . . . . . .
DEPARTMENTAL INCOME (LOS S ) . . . . . . . . . . . . . . . . . . . . . . . . . . . . . . . . .
AVERAGE NUMBER OF EMPLOYEES FOR THE YEAR
CASINO DEPARTMENT ROOMS DEPARTMENT . . . . . . . . . . . . . . . . . . . . . .
FOOD DEPARTMENT . . . . . . . . . . . . . . . . . . . . . . .
BEVERAGE DEPARTMENT . . . . . . . . . . . . . . . . . . .
G & A DEPARTMENT . . . . . . . . . . . . . . . . . . . . .
OTHER DEPARTMENTS . . . . . . . . . . . . . . . . . . . . .
TOTAL
DOLLARS 1 , 88 8 , 154
9 1 , 2 8 3 1 , 97 9 , 4 3 7
762 , 76 8
1 , 2 1 6 , 6 6 9
0 4 , 52 8
3 1 , 7 3 5 8 , 6 6 8
0 3 13 , 0 6 0
5 8 , 0 8 7 4 1 6 , 0 7 8
8 0 0 , 5 9 1
2 2 6 68
194 69
154 2 7
7 3 8
2 - 93
PERCENT 95 . 4 %
4 . 6 % 100 . 0 %
3 8 . 5 %
6 1 . 5%
0 . 0 % 0 . 2 % 1 . 6 % 0 . 4 % 0 . 0 %
15 . 8 % 2 . 9%
2 1 . 0 %
4 0 . 4 %

2 - 94 ROOM OCCUPANCY AND PER ROOM PER DAY ANALYSIS
Fiscal Year 2 0 13 Washoe County - Reno/Sparks With Gaming Revenue of $ 1 , 0 0 0 , 0 0 0 to $ 12 , 0 0 0 , 0 0 0
Amounts Represent 8 Locations .
RATE OF ROOM OCCUPANCY
MONTH JULY . . . . . . . . . . AUGUST . . . . . . . . SEPTEMBER . . . . . OCTOBER . . . . . . . NOVEMBER . . . . . .
DECEMBER . . . . . . JANUARY . . . . . . .
FEBRUARY . . . . . .
MARCH . . . . . . . . . APRIL . . . . . . . . . MAY . . . . . . . . . . . JUNE . . . . . . . . . .
TOTAL . . . . . . . . .
Average Pit Revenue Per Room Per Day
Average Slot Revenue Per Room Per Day
Average Food Sales Per Room Per Day
AVAILABLE ROOMS ROOMS OCCUPIED
8 , 8 3 5 2 , 9 3 8 8 , 8 3 5 6 , 4 7 5 8 , 5 5 0 6 , 2 8 9 8 , 8 3 5 5 , 2 5 9 8 , 55 0 4 , 3 8 9 8 , 8 3 5 4 , 3 0 1 8 , 8 3 5 4 , 5 2 5 7 , 9 8 0 4 , 4 4 5 8 , 8 3 5 4 , 0 2 5 8 , 5 5 0 4 , 6 6 4 8 , 8 3 5 5 , 7 5 7 8 , 5 5 0 6 , 4 1 1
1 0 4 , 0 2 5 5 9 , 4 7 8
PER ROOM PER DAY STATISTICS
3 8 . 9 9
5 4 3 . 8 9
1 1 8 . 2 3
Average Beverage Sales Per Room Per Day
Average Rooms Department Payrol l Per Room Per Day
Average Room Rate Per Day
% OF OCCUPANCY
( COMPUTED } 3 3 . 2 5 % 7 3 . 2 9% 7 3 . 5 6 % 5 9 . 5 2 % 5 1 . 3 3 % 4 8 . 6 8 % 5 1 . 2 2 % 5 5 . 7 0 % 4 5 . 5 6 % 54 . 5 5 % 6 5 . 1 6 % 74 . 9 8 %
5 7 . 1 8 %
5 8 . 15
2 2 . 9 0
7 9 . 8 5

PER SQUARE FOOT ANALYSIS AND RATIOS 2 - 95 Fiscal Year 2 0 13 Washoe County - Reno/Sparks With Gaming Revenue of $ 1 , 0 0 0 , 0 0 0 to $ 12 , 0 0 0 , 0 0 0
Amounts Represent 8 Locations .
GAMING REVENUE PER SQUARE FOOT OF FLOOR SPACE
NO . OF CASINOS AVERAGE AREA GAMING REVENUE AREA OPERATING IN SQUARE FEET PER SQUARE FOOT
Pit ( Includes Bingo and Keno) 4 1 , 4 3 8 4 0 3 Coin Operated Devices 7 8 , 9 3 5 517 Poker and Pan 1 150 1 , 8 7 7 Race and Sports 1 14 , 174
TOTAL CASINO 8 10 , 3 2 8
RATIOS
TOTAL CURRENT ASSETS TO TOTAL CURRENT LIABILITIES . . . . . . . . .
TOTAL CAPITAL TO TOTAL LIABILITIES . . . . . . . . . . . . . . . . . . . . . . . .
TOTAL CAPITAL TO TOTAL CURRENT LIABILITIES . . . . . . . . . . . . . . . .
TOTAL CURRENT LIABILITIES TO TOTAL LIABILITIES . . . . . . . . . . . .
TOTAL COMPLIMENTARY EXPENSE TO GAMING REVENUE . . . . . . . . . . . . .
MUSIC AND ENTERTAINMENT EXPENSES TO GAMING REVENUE . . . . . . . .
TOTAL REVENUE TO AVERAGE TOTAL ASSETS . . . . . . . . . . . . . . . . . . . . .
TOTAL REVENUE LESS COMP SALES TO AVERAGE TOTAL ASSETS . . . . .
RETURN ON INVESTED CAPITAL* . . . . . . . . . . . . . . . . . . . . . . . . . . . . . . .
RETURN ON AVERAGE ASSETS * . . . . . . . . . . . . . . . . . . . . . . . . . . . . . . . . .
* - FORMULAS
Return on Invested Capital is equal to the total of net income (before federal income taxes and extraordinary items ) and interest expense divided by the total of average total assets less average current liabilities .
PERCENT 3 3 0 . 6%
94 . 0 %
4 1 9 . 4 %
2 2 . 4 %
13 . 8 %
0 . 1%
13 0 . 7 %
118 . 6 %
- 1 1 . 4 %
- 9 . 5 %
Return on Average Assets is equal to the total of net income (before federal income taxes and extraordinary items ) and interest expense divided by the average total assets .
113
442

2 - 9 6
THIS PAGE LEFT INTENTIONALLY BLANK

COMBINED BALANCE SHEET Fiscal Year 2 0 13 Washoe County - Reno/Sparks With Gaming Revenue of $12 , 0 0 0 , 0 0 0 to $36 , 0 0 0 , 0 0 0
Amounts Represent 8 Locations .
ASSETS CURRENT ASSETS
Cash . . . . . . . . . . . . . . . . . . . . . . . . . . . . . . . . . . . . . . . . . . . . . . . . . . . .
Receivables TOTAL ALLOWANCE Casino 1 , 2 8 1 , 9 3 1 5 7 3 , 4 2 2 Trade 5 , 18 9 , 621 4 4 7 , 3 8 1 Sundry 14 1 , 8 6 5 o
Notes 2 1 1 , 8 6 8 o
Prepaid Expenses . . . . . . . . . . . . . . . . . . . . . . . . . . . . . . . . . . . . . . . .
Other Current Assets . . . . . . . . . . . . . . . . . . . . . . . . . . . . . . . . . . . .
TOTAL CURRENT ASSETS . . . . . . . . . . . . . . . . . . . . . . . . . . . . . . . . . . . . . .
FIXED ASSETS COST DEPRECIATION Land 4 7 , 8 6 1 , 2 9 1 . . . . . . . . . . .
Land Improvements 2 , 4 3 4 , 6 4 6 8 8 3 , 948 Bui ldings & Improvements 2 54 , 13 9 , 0 2 1 12 9 , 136 , 5 8 6 Furniture & Equipment 178 , 97 6 , 546 14 8 , 7 0 3 , 0 7 3 Lease Improvements 11 , 6 9 0 , 795 8 , 026 , 70 8 Construction i n Progress 1 , 044 , 52 6 . . . . . . . . . . .
TOTAL FIXED ASSETS . . . . . . . . . . . . . . . . . . . . . . . . . . . . . . . . . . . . . . . .
OTHER ASSETS
TOTAL ASSETS
LIABILITIES AND CAPITAL CURRENT LIABILITIES
Accounts Payable - Trade . . . . . . . . . . . . . . . . . . . . . . . . . . . . . . . .
Accounts Payable - Other . . . . . . . . . . . . . . . . . . . . . . . . . . . . . . . .
current Portion of Long-Term Debt . . . . . . . . . . . . . . . . . . . . . . .
Accrued Expenses . . . . . . . . . . . . . . . . . . . . . . . . . . . . . . . . . . . . . . . .
Other Current Liabil ities . . . . . . . . . . . . . . . . . . . . . . . . . . . . . . .
TOTAL CURRENT LIABILITIES . . . . . . . . . . . . . . . . . . . . . . . . . . . . . . . . .
LONG-TERM DEBT TOTAL OWING CURRENT PORTION Mortgages 5 8 , 983 , 674 3 3 , 10 0 , 0 0 0 Debentures & Bonds 2 5 , 72 5 , 42 7 0 Notes 2 , 0 0 0 , 0 0 0 500 , 0 0 0 Contracts 4 3 9 , 6 94 3 3 2 , 3 4 5 Other 3 1 , 914 , 628 0
TOTAL LONG-TERM DEBT 1 19 , 0 6 3 , 42 3 3 3 , 932 , 3 4 5 OTHER LIABILITIES . . . . . . . . . . . . . . . . . . . . . . . . . . . . . . . . . . . . . . . . .
TOTAL LIABILITIES . . . . . . . . . . . . . . . . . . . . . . . . . . . . . . . . . . . . . . . . .
CAPITAL Owners Capital Accounts . . . . . . . . . . . . . . . . . . . . . . . . . . . . . . . . .
Capital Stock & Other Capital . . . . . . . . . . . . . . . . . . . . . . . . . . .
Retained Earnings . . . . . . . . . . . . . . . . . . . . . . . . . . . . . . . . . . . . . . .
TOTAL CAPITAL . . . . . . . . . . . . . . . . . . . . . . . . . . . . . . . . . . . . . . . . . . . . .
TOTAL LIABILITIES AND CAPITAL . . . . . . . . . . . . . . . . . . . . . . . . . . . . . .
Average Assets 3 3 , 7 2 1 , 764
UpPer Quartile 2 8 , 7 0 1 , 0 3 3
Median 24 , 715 , 513
2 - 97
DOLLARS PERCENT 25 , 73 7 , 105 9 . 5%
7 0 8 , 5 0 9 0 . 3 % 4 , 74 2 , 2 4 0 1 . 8 %
14 1 , 8 6 5 0 . 1% 2 11 , 8 6 8 0 . 1%
6 , 7 7 9 , 8 2 4 2 . 5 % 6 , 345 , 2 5 1 2 . 4 %
4 4 , 6 6 6 , 662 16 . 6 %
4 7 , 86 1 , 2 9 1 17 . 7 % 1 , 5 5 0 , 6 98 0 . 6 %
125 , 0 02 , 4 3 5 46 . 3 % 3 0 , 2 7 3 , 4 7 3 11 . 2 %
3 , 664 , 0 8 7 1 . 4 % 1 , 044 , 526 0 . 4 %
2 0 9 , 3 9 6 , 5 1 0 7 7 . 6%
15 , 7 10 , 9 3 7 5 . 8 %
2 6 9 , 774 , 10 9 100 . 0 %
6 , 754 , 3 65 2 . 5 % - 12 8 , 982 , 995 - 4 7 . 8 %
3 3 , 932 , 34 5 12 . 6 % 13 , 4 8 7 , 595 5 . 0 %
2 , 44 8 , 928 0 . 9% - 72 , 3 5 9 , 762 -26 . 8 %
2 5 , 8 8 3 , 674 9 . 6% 2 5 , 725 , 4 2 7 9 . 5 %
1 , 50 0 , 0 0 0 0 . 6 % 1 0 7 , 34 9 0 . 0 %
3 1 , 914 , 62 8 11 . 8 % 85 , 13 1 , 0 7 8 3 1 . 6 % 12 , 154 , 5 2 8 4 . 5 % 24 , 92 5 , 844 9 . 2 %
7 , 5 0 5 , 02 5 2 . 8 % 2 2 5 , 910 , 7 6 7 83 . 7%
1 1 , 4 3 2 , 4 73 4 . 2 % 244 , 84 8 , 2 6 5 90 . 8 %
2 6 9 , 774 , 1 0 9 100 . 0 %
Lower Quartile 17 , 74 3 , 3 8 9
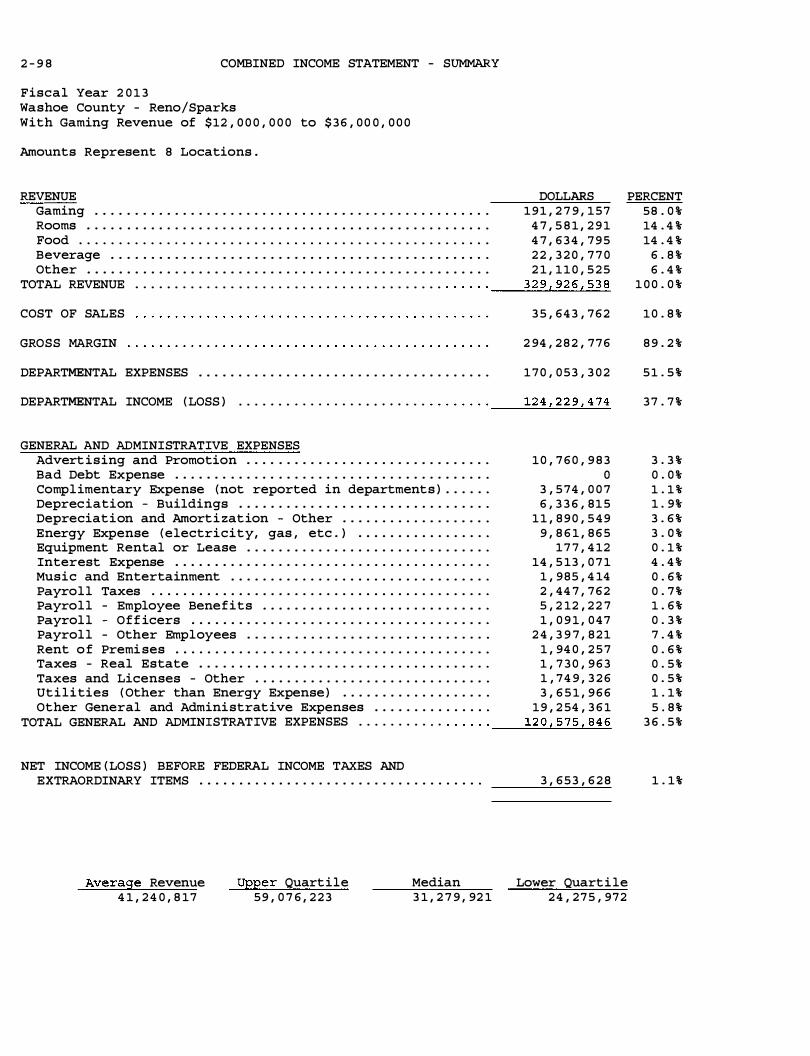
2 - 9 8 COMBINED INCOME STATEMENT - SUMMARY
Fiscal Year 2 0 1 3 Washoe County - Reno/Sparks With Gaming Revenue of $12 , 0 0 0 , 0 0 0 to $ 3 6 , 0 0 0 , 0 0 0
Amounts Represent 8 Locations .
REVENUE DOLLARS Gaming . . . . . . . . . . . . . . . . . . . . . . . . . . . . . . . . . . . . . . . . . . . . . . . . . . 1 9 1 , 2 7 9 , 1 5 7 Rooms . . . . . . . . . . . . . . . . . . . . . . . . . . . . . . . . . . . . . . . . . . . . . . . . . . . 4 7 , 5 8 1 , 2 9 1 Food . . . . . . . . . . . . . . . . . . . . . . . . . . . . . . . . . . . . . . . . . . . . . . . . . . . . 4 7 , 6 3 4 , 7 9 5 Beverage . . . . . . . . . . . . . . . . . . . . . . . . . . . . . . . . . . . . . . . . . . . . . . . . 2 2 , 3 2 0 , 7 7 0 Other . . . . . . . . . . . . . . . . . . . . . . . . . . . . . . . . . . . . . . . . . . . . . . . . . . . 2 1 , 1 1 0 , 5 2 5
3 2 9 , 9 2 6 , 5 3 8 TOTAL REVENUE . . . . . . . . . . . . . . . . . . . . . . . . . . . . . . . . . . . . . . . · · · · · ·----
������
COST OF SALES 3 5 , 64 3 , 7 6 2
GROSS MARGIN 2 94 , 2 8 2 , 7 7 6
DEPARTMENTAL EXPENSES . . . . . . . . . . . . . . . . . . . . . . . . . . . . . . . . . . . . . 1 7 0 , 0 5 3 , 3 0 2
DEPARTMENTAL INCOME ( LOSS ) 124 , 2 2 9 , 4 7 4 . . . . . . . · · · · · · · · · · · • • • · · · · · · · · · · ·----
=-=-..!...=�..::..:......::.
GENERAL AND ADMINISTRATIVE EXPENSES Advert ising and Promotion . . . . . . . . . . . . . . . . . . . . . . . . . . . . . . . 1 0 , 7 6 0 , 9 8 3 Bad Debt Expense . . . . . . . . . . . . . . . . . . . . . . . . . . . . . . . . . . . . . . . . 0 Complimentary Expense (not reported in departments ) . . . . . . 3 , 5 74 , 0 0 7 Depreciation - Buildings . . . . . . . . . . . . . . . . . . . . . . . . . . . . . . . . 6 , 3 3 6 , 8 1 5 Depreciation and Amorti zation - Other . . . . . . . . . . . . . . . . . . . 1 1 , 8 9 0 , 5 4 9 Energy Expense ( electricity, gas , etc . ) . . . . . . . . . . . . . . . . . 9 , 8 6 1 , 8 6 5 Equipment Rental or Lease . . . . . . . . . . . . . . . . . . . . . . . . . . . . . . . 1 7 7 , 4 12 Interest Expense . . . . . . . . . . . . . . . . . . . . . . . . . . . . . . . . . . . . . . . . 14 , 5 13 , 0 7 1 Music and Entertainment . . . . . . . . . . . . . . . . . . . . . . . . . . . . . . . . . 1 , 9 8 5 , 4 14 Payroll Taxes . . . . . . . . . . . . . . . . . . . . . . . . . . . . . . . . . . . . . . . . . . . 2 , 44 7 , 7 6 2 Payroll - Employee Benefits . . . . . . . . . . . . . . . . . . . . . . . . . . . . . 5 , 2 12 , 2 2 7 Payroll - Off icers . . . . . . . . . . . . . . . . . . . . . . . . . . . . . . . . . . . . . . 1 , 0 9 1 , 0 4 7 Payroll - Other Employees . . . . . . . . . . . . . . . . . . . . . . . . . . . . . . . 2 4 , 3 9 7 , 8 2 1 Rent o f Premi ses . . . . . . . . . . . . . . . . . . . . . . . . . . . . . . . . . . . . . . . . 1 , 94 0 , 2 5 7 Taxes - Real Estate . . . . . . . . . . . . . . . . . . . . . . . . . . . . . . . . . . . . . 1 , 7 3 0 , 9 6 3 Taxes and Licenses - Other . . . . . . . . . . . . . . . . . . . . . . . . . . . . . . 1 , 74 9 , 3 2 6 Utilities ( Other than Energy Expense ) . . . . . . . . . . . . . . . . . . . 3 , 6 5 1 , 9 6 6 Other General and Administrative Expenses . . . . . . . . . . . . . . . 1 9 , 2 54 , 3 6 1
1 2 0 , 5 75 , 8 4 6 TOTAL GENERAL AND ADMINISTRATIVE EXPENSES . . . . . . . . . . . · · · · · ·----
=�����
NET INCOME ( LOSS ) BEFORE FEDERAL INCOME TAXES AND EXTRAORDINARY ITEMS . . . . . . . . . . . . . . . . . . . . . . . . . . . . . . . . . . . .
Average Revenue 4 1 , 2 4 0 , 8 17
Upper Quartile 5 9 , 0 7 6 , 2 2 3
Median 3 1 , 2 7 9 , 92 1
3 , 6 5 3 , 6 2 8
Lower Quarti le 2 4 , 2 7 5 , 972
PERCENT 58 . 0 % 14 . 4 % 14 . 4 %
6 . 8 % 6 . 4 %
1 0 0 . 0 %
1 0 . 8 %
8 9 . 2 %
5 1 . 5 %
3 7 . 7 %
3 . 3 % 0 . 0 % 1 . 1 % 1 . 9% 3 . 6 % 3 . 0 % 0 . 1 % 4 . 4 % 0 . 6 % 0 . 7 % 1 . 6 % 0 . 3 % 7 . 4 % 0 . 6 % 0 . 5 % 0 . 5 % 1 . 1% 5 . 8 %
3 6 . 5 %
1 . 1%

COMBINED INCOME STATEMENT - DETAIL 2 - 9 9 Fi scal Year 2 0 13 Washoe County - Reno/Sparks With Gaming Revenue of $12 , 0 0 0 , 0 0 0 to $3 6 , 0 0 0 , 0 0 0
Amounts Represent 8 Locations .
CASINO DEPARTMENT
REVENUE DOLLARS PERCENT Pit Revenue ( Includes Keno and Bingo) . . . . . . . . . . . . . . . . . . . 22 , 925 , 4 0 2 12 . 0% Coin Operated Devices . . . . . . . . . . . . . . . . . . . . . . . . . . . . . . . . . . . 166 , 0 72 , 858 8 6 . 8 % Poker and Pan . . . . . . . . . . . . . . . . . . . . . . . . . . . . . . . . . . . . . . . . . . . 84 7 , 602 0 . 4 % Race Book . . . . . . . . . . . . . . . . . . . • . . . . . . . . . . . . . . . . . . . . . . . . . . . 4 04 , 8 8 1 0 . 2 % Sports Pool . . . . . . . . . . . . . . . . . . . . . . . . . . . . . . . . . . . . . . . . . . . . . 1 , 028 , 4 14 0 . 5%
TOTAL REVENUE . . . . . . . . . . . . . . . . . . . . . . . . . . . . . . . . . . . . . . . . . . . . . 191 , 2 7 9 , 157 100 . 0 %
DEPARTMENTAL EXPENSES Bad Debt Expense . . . . . . . . . . . . . . . . . . . . . . . . . . . . . . . . . . . . . . . . 4 1 , 3 9 6 0 . 0 % Commissions . . . . . . . . . . . . . . . . . . . . . . . . . . . . . . . . . . . . . . . . . . . . . 854 , 6 0 6 0 . 4 % Complimentary Expense . . . . . . . . . . . . . . . . . . . . . . . . . . . . . . . . . . . 3 3 , 7 6 7 , 84 7 17 . 7% Gaming Taxes and Licenses . . . . . . . . . . . . . . . . . . . . . . . . . . . . . . . 15 , 2 6 0 , 166 8 . 0 % Preferred Guest Expenses (no complimentaries ) . . . . . . . . . . . 4 04 , 656 0 . 2 % Payroll Taxes . . . . . . . . . . . . . . . . . . . . . . . . . . . . . . . . . . . . . . . . . . . 2 , 981 , 8 05 1 . 6 % Payroll - Employee Benefits . . . . . . . . . . . . . . . . . . . . . . . . . . . . . 3 , 2 3 0 , 97 8 1 . 7 % Payroll - Officers . . . . . . . . . . . . . . . . . . . . . . . . . . . . . . . . . . . . . . 0 0 . 0 % Payroll - Other Employees . . . . . . . . . . . . . . . . . . . . . . . . . . . . . . . 2 4 , 5 0 7 , 64 1 12 . 8 % Race Wire Fees . . . . . . . . . . . . . . . . . . . . . . . . . . . . . . . . . . . . . . . . . . 8 6 7 , 785 0 . 5 % Other Departmental Expenses . . . . . . . . . . . . . . . . . . . . . . . . . . . . . 1 7 , 2 5 1 , 322 9 . 0 %
TOTAL DEPARTMENTAL EXPENSES . . . . . . . . . . . . . . . . . . . . . . . . . . . . . . . 9 9 , 168 , 2 0 2 51 . 8 %
DEPARTMENTAL INCOME (LOSS ) . . . . . . . . . . . . . . . . . . . . . . . . . . . . . . . . . 92 , 110 , 955 4 8 . 2 %
ROOMS DEPARTMENT
REVENUE DOLLARS PERCENT Room Sales . . . . . . . . . . . . . . . . . . . . . . . . . . . . . . . . . . . . . . . . . . . . . . 3 8 , 752 , 3 08 8 1 . 4 % Complimentary Rooms . . . . . . . . . . . . . . . . . . . . . . . . . . . . . . . . . . . . . 8 , 82 8 , 983 18 . 6%
TOTAL REVENUE . . . . . . . . . . . . . . . . . . . . . . . . . . . . . . . . . . . . . . . . . . . . . 4 7 , 58 1 , 2 9 1 1 0 0 . 0 %
DEPARTMENTAL EXPENSES Bad Debt Expense . . . . . . . . . . . . . . . . . . . . . . . . . . . . . . . . . . . . . . . . 284 , 996 0 . 6 % Complimentary Expense . . . . . . . . . . . . . . . . . . . . . . . . . . . . . . . . . . . 1 , 571 , 324 3 . 3 % Payroll - Taxes . . . . . . . . . . . . . . . . . . . . . . . . . . . . . . . . . . . . . . . . . 1 , 4 1 6 , 0 7 7 2 . 9 % Payroll - Employee Benefits . . . . . . . . . . . . . . . . . . . . . . . . . . . . . 2 , 198 , 2 79 4 . 6 % Payroll - Officers . . . . . . . . . . . . . . . . . . . . . . . . . . . . . . . . . . . . . . 0 0 . 0 % Payroll - Other Employees . . . . . . . . . . . . . . . . . . . . . . . . . . . . . . . 13 , 557 , 3 93 2 8 . 5% Other Departmental Expenses . . . . . . . . . . . . . . . . . . . . . . . . . . . . . 6 , 8 3 7 , 8 0 3 14 . 4 %
TOTAL DEPARTMENTAL EXPENSES . . . . . . . . . . . . . . . . . . . . . . . . . . . . . . . 2 5 , 865 , 872 54 . 4 %
DEPARTMENTAL INCOME (LOSS ) . . . . . . . . . . . . . . . . . . . . . . . . . . . . . . . . . 2 1 , 715 , 4 1 9 45 . 6%

2 - 1 0 0 COMBINED INCOME STATEMENT - DETAIL ( CONTINUED)
Fiscal Year 2 0 13 Washoe County - Reno/Sparks With Gaming Revenue of $ 12 , 0 0 0 , 0 0 0 to $3 6 , 0 0 0 , 0 0 0
Amounts Represent 8 Locations .
FOOD DEPARTMENT REVENUE DOLLARS PERCENT
Food Sales 3 4 , 5 8 3 , 6 9 0 72 . 6 % Compl imentary Food Sales . . . . . . . . . . . . . . . . . . . . . . . . . . . . . . . . 13 , 0 5 1 , 105 27 . 4 %
TOTAL REVENUE . . . . . . . . . . . . . . . . . . . . . . . . . . . . . . . . . . . . . . . . . . . . . 4 7 , 6 3 4 , 795 100 . 0 %
COST OF SALES 22 , 7 6 9 , 9 3 6 4 7 . 8 %
GROSS MARGIN 24 , 8 64 , 8 5 9 52 . 2 %
DEPARTMENTAL EXPENSES Bad Debt Expense . . . . . . . . . . . . . . . . . . . . . . . . . . . . . . . . . . . . . . . . 0 0 . 0 % Compl imentary Expense . . . . . . . . . . . . . . . . . . . . . . . . . . . . . . . . . . . 978 , 592 2 . 1% Payroll - Taxes . . . . . . . . . . . . . . . . . . . . . . . . . . . . . . . . . . . . . . . . . 2 , 6 5 3 , 1 7 8 5 . 6 % Payroll - Employee Benefits . . . . . . . . . . . . . . . . . . . . . . . . . . . . . 3 , 4 5 1 , 0 8 7 7 . 2 % Payrol l - Officers . . . . . . . . . . . . . . . . . . . . . . . . . . . . . . . . . . . . . . 0 0 . 0 % Payroll - Other Employees . . . . . . . . . . . . . . . . . . . . . . . . . . . . . . . 2 2 , 3 2 1 , 3 2 3 4 6 . 9 % Other Departmental Expenses . . . . . . . . . . . . . . . . . . . . . . . . . . . . . 1 , 702 , 3 51 3 . 6 %
TOTAL DEPARTMENTAL EXPENSES . . . . . . . . . . . . . . . . . . . . . . . . . . . . . . . 3 1 , 1 0 6 , 5 3 1 65 . 3 %
DEPARTMENTAL INCOME ( LOSS ) . . . . . . . . . . . . . . . . . . . . . . . . . . . . . . . . . - 6 , 2 4 1 , 6 7 2 - 13 . 1%
BEVERAGE DEPARTMENT REVENUE DOLLARS PERCENT
B everage Sales . . . . . . . . . . . . . . . . . . . . . . . . . . . . . . . . . . . . . . . . . . 6 , 7 96 , 2 2 9 3 0 . 4 % Compl imentary Beverage Sales . . . . . . . . . . . . . . . . . . . . . . . . . . . . 15 , 524 , 54 1 69 . 6 %
TOTAL REVENUE . . . . . . . . . . . . . . . . . . . . . . . . . . . . . . . . . . . . . . . . . . . . . 22 , 3 2 0 , 7 7 0 100 . 0 %
COST OF SALES 7 , 8 18 , 057 35 . 0 %
GROSS MARGIN . . . . . . . . . . . . . . . . . . . . . . . . . . . . . . . . . . . . . . . . . . . . . . 14 , 5 02 , 7 13 65 . 0 %
DEPARTMENTAL EXPENSES Bad Debt Expense . . . . . . . . . . . . . . . . . . . . . . . . . . . . . . . . . . . . . . . . 0 0 . 0 % Complimentary Expense . . . . . . . . . . . . . . . . . . . . . . . . . . . . . . . . . . . 9 7 1 4 1 1 0 . 4% Payroll - Taxes . . . . . . . . . . . . . . . . . . . . . . . . . . . . . . . . . . . . . . . . . 6 5 8 , 196 2 . 9 % Payroll - Employee Benefits . . . . . . . . . . . . . . . . . . . . . . . . . . . . . 9 8 3 , 0 7 6 4 . 4 % Payroll - Officers . . . . . . . . . . . . . . . . . . . . . . . . . . . . . . . . . . . . . . 0 0 . 0 % Payroll - Other Employees . . . . . . . . . . . . . . . . . . . . . . . . . . . . . . . 4 , 4 7 5 , 625 2 0 . 1% Other Departmental Expenses . . . . . . . . . . . . . . . . . . . . . . . . . . . . . 7 6 7 , 0 0 3 3 . 4 %
TOTAL DEPARTMENTAL EXPENSES . . . . . . . . . . . . . . . . . . . . . . . . . . . . . . . 6 , 9 8 1 , 3 1 1 31 . 3 %
DEPARTMENTAL INCOME ( LOSS ) . . . . . . . . . . . . . . . . . . . . . . . . . . . . . . . . . 7 , 5 2 1 , 4 0 2 33 . 7 %

COMBINED INCOME STATEMENT - DETAIL ( CONTINUED)
Fiscal Year 2 0 1 3 Washoe County - Reno/Sparks With Gaming Revenue of $12 , 0 0 0 , 0 0 0 to $36 , 0 0 0 , 0 0 0
Amounts Represent 8 Locations .
OTHER INCOME REVENUE
Other Operating and Non-operating Income . . . . . . . . . . . . . . . .
Other Complimentary Items . . . . . . . . . . . . . . . . . . . . . . . . . . . . . . .
TOTAL REVENUE . . . . . . . . . . . . . . . . . . . . . . . . . . . . . . . . . . . . . . . . . . . . .
COST OF SALES . . . . . . . . . . . . . . . . . . . . . . . . . . . . . . . . . . . . . . . . . . . . .
GROSS MARGIN . . . . . . . . . . . . . . . . . . . . . . . . . . . . . . . . . . . . . . . . . . . . . .
DEPARTMENTAL EXPENSES Bad Debt Expense . . . . . . . . . . . . . . . . . . . . . . . . . . . . . . . . . . . . . . . .
Complimentary Expense . . . . . . . . . . . . . . . . . . . . . . . . . . . . . . . . . . .
Payroll - Taxes . . . . . . . . . . . . . . . . . . . . . . . . . . . . . . . . . . . . . . . . .
Payrol l - Employee Benefits . . . . . . . . . . . . . . . . . . . . . . . . . . . . .
Payroll - Officers . . . . . . . . . . . . . . . . . . . . . . . . . . . . . . . . . . . . . . Payroll - Other Employees . . . . . . . . . . . . . . . . . . . . . . . . . . . . . . .
Other Departmental Expenses . . . . . . . . . . . . . . . . . . . . . . . . . . . . .
TOTAL DEPARTMENTAL EXPENSES . . . . . . . . . . . . . . . . . . . . . . . . . . . . . . .
DEPARTMENTAL INCOME (LOSS)
AVERAGE NUMBER OF EMPLOYEES FOR THE YEAR
�ASINO DEPARTMENT ROOMS DEPARTMENT . . . . . . . . . . . . . . . . . . . . . .
FOOD DEPARTMENT . . . . . . . . . . . . . . . . . . . . . . .
BEVERAGE DEPARTMENT . . . . . . . . . . . . . . . . . . .
G & A DEPARTMENT . . . . . . . . . . . . . . . . . . . . .
OTHER DEPARTMENTS . . . . . . . . . . . . . . . . . . . . .
TOTAL
DOLLARS 19 , 979 , 2 8 7
1 , 13 1 , 2 3 8 2 1 , 110 , 52 5
5 , 055 , 7 6 9
16 , 0 54 , 7 5 6
- 6 130 , 5 6 7 4 1 3 , 615 4 7 1 , 9 0 1
0 4 , 106 , 7 5 7 1 , 8 0 8 , 552 6 , 93 1 , 3 8 6
9 , 12 3 , 3 7 0
1 , 074 5 8 1
1 , 182 311 855 195
4 , 198
2 - 10 1
PERCENT 94 . 6 %-
5 . 4 %-1 0 0 . 0 %-
2 3 . 9%-
76 . 1%-
0 . 0 %-0 . 6%-2 . 0 %-2 . 2 %-0 . 0 %-
19 . 5%-8 . 6%-
3 2 . 8 %-
4 3 . 2 %-

2 - 1 0 2 ROOM OCCUPANCY AND PER ROOM PER DAY ANALYSIS
Fiscal Year 2 0 13 Washoe County - Reno/Sparks With Gaming Revenue of $ 12 , 0 0 0 , 0 0 0 to $ 3 6 , 0 0 0 , 0 0 0
Amounts Represent 8 Locations .
MONTH JULY . . . . . . . . .. . AUGUST .. . . . . . . . SEPTEMBER . . .. . . OCTOBER . . . .. . . . NOVEMBER . . . . . . DECEMBER . . . . . . JANUARY . . . . . . . FEBRUARY . . . . . . MARCH . . . . . . . . . APRIL . . . .. . . . . ..
MAY . . . . . . . .. . . . JUNE . . . . . . . . . .
TOTAL . . . . . . . . .
Average Pit Revenue Per Room Per Day
Average Slot Revenue Per Room Per Day
Average Food Sales Per Room Per Day
RATE OF ROOM OCCUPANCY
AVAILABLE ROOMS ROOMS OCCUPIED 1 3 0 , 2 3 4 78 , 4 4 6 13 0 , 5 3 7 8 3 , 8 2 9 12 7 , 5 7 9 8 0 , 3 4 2 12 9 , 6 3 8 6 0 , 3 3 7 1 2 4 , 8 7 8 4 8 , 7 2 0 1 3 0 , 1 7 5 5 6 , 2 2 9 1 3 0 , 2 2 8 5 1 , 3 2 1 1 1 7 , 8 3 5 5 6 , 1 3 0 1 3 1 , 2 3 7 6 6 , 2 4 5 1 2 5 , 5 2 3 6 8 , 7 9 3 12 9 , 13 1 74 , 84 5 1 2 6 , 8 2 3 8 3 , 9 3 9
1 , 5 3 3 , 8 1 8 8 0 9 , 1 7 6
PER ROOM PER DAY STATISTICS
2 8 . 3 3
2 0 5 . 2 4
5 8 . 8 7
Average Beverage Sales Per Room Per Day
Average Rooms Department Payroll Per Room Per Day
Average Room Rate Per Day
% OF OCCUPANCY
( COMPUTED) 6 0 . 2 3 % 64 . 2 2 % 62 . 97% 4 6 . 54 % 3 9 . 01% 4 3 . 19% 3 9 . 4 1% 4 7 . 63 % 5 0 . 4 8 % 54 . 8 1% 5 7 . 96% 6 6 . 19%
5 2 . 7 6 %
2 7 . 5 8
2 1 . 2 2
5 8 . 8 0

PER SQUARE FOOT ANALYSIS AND RATIOS 2 - 1 0 3 Fiscal Year 2 0 1 3 Washoe County - Reno/Sparks With Gaming Revenue of $12 , 0 0 0 , 0 0 0 to $36 , 0 0 0 , 0 0 0
Amounts Represent 8 Locations .
GAMING REVENUE PER SQUARE FOOT OF FLOOR SPACE
NO . OF CASINOS AVERAGE AREA GAMING REVENUE AREA OPERATING IN SQUARE FEET PER SQUARE FOOT
Pit { Includes Bingo and Keno ) 7 6 , 8 92 Coin Operated Devices 8 3 1 , 3 94 Poker and Pan 4 9 3 8 Race and Sports 3 762
TOTAL CASINO 8 3 8 , 1 7 9
RATIOS
TOTAL CURRENT ASSETS TO TOTAL CURRENT LIABILITIES . . . . . . . . .
TOTAL CAPITAL TO TOTAL LIABILITIES . . . . . . . . . . . . . . . . . . . . . . . .
TOTAL CAPITAL TO TOTAL CURRENT LIABILITIES . . . . . . . . . . . . . . . .
TOTAL CURRENT LIABILITIES TO TOTAL LIABILITIES . . . . . . . . . . . .
TOTAL COMPLIMENTARY EXPENSE TO GAMING REVENUE . . . . . . . . . . . . .
MUSIC AND ENTERTAINMENT EXPENSES TO GAMING REVENUE . . . . . . . .
TOTAL REVENUE TO AVERAGE TOTAL ASSETS . . . . . . . . . . . . . . . . . . . . .
TOTAL REVENUE LESS COMP SALES TO AVERAGE TOTAL ASSETS . . . . .
RETURN ON INVESTED CAPITAL* . . . . . . . . . . . . . . . . . . . . . . . . . . . . . . .
RETURN ON AVERAGE ASSETS* . . . . . . . . . . . . . . . . . . . . . . . . . . . . . . . . .
* - FORMULAS
Return on Invested Capital is equal to the total of net income {before federal income taxes and extraordinary items ) and interest expense divided by the total of average total assets less average current liabil ities .
PERCENT - 6 1 . 7%
982 . 3 %
- 3 3 8 . 4 %
- 2 9 0 . 3 %
2 1 . 0 %
1 . 0%
121 . 8 %
107 . 6 %
4 . 8 %
6 . 7 %
Return on Average Assets is equal to the total of net income {before federal income taxes and extraordinary items ) and interest expense divided by the average total assets .
4 7 5 6 6 1 2 2 6 6 2 7
6 2 6

2 - 1 0 4
THIS PAGE LEFT INTENTIONALLY BLANK

COMBINED BALANCE SHEET Fiscal Year 2 0 1 3 Washoe County - Reno/Sparks With Gaming Revenue of $36 , 0 0 0 , 0 0 0 and over
Amounts Represent 6 Locations .
ASSETS CURRENT ASSETS
Cash . . . . . . . . . . . . . . . . . . . . . . . . . . . . . . . . . . . . . . . . . . . . . . . . . . . .
Receivables TOTAL ALLOWANCE Casino 11 , 778 , 4 2 2 5 , 4 18 , 3 18 Trade 99 , 1 1 1 , 12 9 8 8 0 , 250 Sundry 5 , 8 5 1 , 055 0 Notes o 0
Prepaid Expenses . . . . . . . . . . . . . . . . . . . . . . . . . . . . . . . . . . . . . . . .
Other Current Assets . . . . . . . . . . . . . . . . . . . . . . . . . . . . . . . . . . . .
TOTAL CURRENT ASSETS . . . . . . . . . . . . . . . . . . . . . . . . . . . . . . . . . . . . . .
FIXED ASSETS COST DEPRECIATION Land 12 5 , 33 0 , 82 9 . . . . . . . . . . .
Land Improvements 5 , 2 3 2 , 0 9 0 3 , 185 , 7 3 7 Buildings & Improvements 1 , 174 , 9 96 , 4 8 0 4 3 5 , 2 8 9 , 8 7 0 Furniture & Equipment 610 , 6 0 6 , 0 8 7 4 8 9 , 1 0 0 , 551 Lease Improvements 3 , 984 , 4 6 9 2 , 3 8 3 , 0 2 3 Construction i n Progress 14 , 564 , 8 3 6 . . . . . . . . . . .
TOTAL FIXED ASSETS . . . . . . . . . . . . . . . . . . . . . . . . . . . . . . . . . . . . . . . .
OTHER ASSETS
TOTAL ASSETS
LIABILITIES AND CAPITAL CURRENT LIABILITIES
Accounts Payable - Trade . . . . . . . . . . . . . . . . . . . . . . . . . . . . . . . .
Accounts Payable - Other . . . . . . . . . . . . . . . . . . . . . . . . . . . . . . . . CUrrent Portion of Long-Term Debt . . . . . . . . . . . . . . . . . . . . . . .
Accrued Expenses . . . . . . . . . . . . . . . . . . . . . . . . . . . . . . . . . . . . . . . .
Other Current Liabilities . . . . . . . . . . . . . . . . . . . . . . . . . . . . . . .
TOTAL CURRENT LIABILITIES . . . . . . . . . . . . . . . . . . . . . . . . . . . . . . . . .
LONG-TERM DEBT TOTAL OWING CURRENT PORTION Mortgages 2 5 , 582 , 5 0 7 1 , 3 7 1 , 3 4 9 Debentures & Bonds 16 8 , 0 0 0 , 0 0 0 0 Notes 15 8 , 3 3 3 , 772 13 , 0 0 0 , 0 0 0 Contracts 567 , 074 3 8 4 , 44 2 Other 504 , 134 , 592 3 98 , 3 3 1
TOTAL LONG-TERM DEBT 856 , 6 17 , 945 15 , 154 , 122 OTHER LIABILITIES . . . . . . . . . . . . . . . . . . . . . . . . . . . . . . . . . . . . . . . . .
TOTAL LIABILITIES . . . . . . . . . . . . . . . . . . . . . . . . . . . . . . . . . . . . . . . . .
CAPITAL Owners Capital Accounts . . . . . . . . . . . . . . . . . . . . . . . . . . . . . . . . .
Capital Stock & Other Capital . . . . . . . . . . . . . . . . . . . . . . . . . . .
Retained Earnings . . . . . . . . . . . . . . . . . . . . . . . . . . . . . . . . . . . . . . .
TOTAL CAPITAL . . . . . . . . . . . . . . . . . . . . . . . . . . . . . . . . . . . . . . . . . . . . .
TOTAL LIABILITIES AND CAPITAL . . . . . . . . . . . . . . . . . . . . . . . . . . . . . .
Average Assets 234 , 0 2 9 , 94 9
Upper Quartile 254 , 0 0 7 , 9 0 1
Median 2 3 8 , 4 0 3 , 8 04 .
2 - 105
DOLLARS PERCENT 6 7 , 175 , 6 10
6 , 3 6 0 , 104 98 , 2 3 0 , 8 7 9
5 , 8 5 1 , 055 0
15 , 2 14 , 3 8 5 2 6 , 672 , 2 2 2
2 19 , 504 , 2 5 5
125 , 3 3 0 , 82 9 2 , 04 6 , 3 5 3
73 9 , 7 0 6 , 610 1 2 1 , 5 0 5 , 5 3 6
1 , 6 0 1 , 44 6 14 , 5 64 , 8 3 6
1 , 0 0 4 , 755 , 6 10
1 7 9 , 9 1 9 , 8 2 8
1 , 4 04 , 1 7 9 1 693
17 , 4 6 6 , 22 6 4 5 , 845 , 563 15 , 154 , 122 4 0 , 2 1 8 , 645 2 8 , 084 , 6 5 9
14 6 , 76 9 , 2 15
2 4 , 2 1 1 , 158 16 8 , 0 0 0 , 0 0 0 14 5 , 3 3 3 , 772
182 , 6 32 5 0 3 , 73 6 , 2 6 1 84 1 , 4 6 3 , 823
10 , 5 3 7 , 199 9 98 , 7 7 0 , 2 3 7
4 3 2 , 62 0 , 932 - 2 11 , 72 3 , 9 7 1
1 8 4 , 5 12 , 4 95 4 0 5 , 4 0 9 1 4 5 6
1 , 4 04 , 17 9 1 6 9 3
Lower Quartile 9 0 , 074 , 0 6 9
4 . 8 %'
0 . 5 \' 7 . 0 \' 0 . 4 \' 0 . 0 \' 1 . 1\' 1 . 9\'
15 . 6\'
8 . 9% 0 . 1%
52 . 7 % 8 . 7% 0 . 1\' 1 . 0 \'
7 1 . 6 \'
12 . 8%
100 . 0 \'
1 . 2 % 3 . 3 % 1 . 1% 2 . 9 % 2 . 0 %
10 . 5 %
1 . 7 % 12 . 0 % 10 . 4 %
0 . 0 % 35 . 9 % 59 . 9%
0 . 8 % 7 1 . 1%
3 0 . 8 % - 15 . 1\'
13 . 1%' 2 8 . 9%
100 . 0 %

2 - 1 0 6 COMBINED INCOME STATEMENT - SUMMARY
Fiscal Year 2 0 1 3 Washoe County - Reno/Sparks With Gaming Revenue of $ 3 6 , 0 0 0 , 0 0 0 and over
Amount s Represent 6 Locations .
REVENUE DOLLARS Gaming . . . . . . . . . . . . . . . . . . . . . . . . . . . . . . . . . . . . . . . . . . . . . . . . . . 4 2 1 , 1 64 , 8 0 8 Rooms . . . . . . . . . . . . . . . . . . . . . . . . . . . . . . . . . . . . . . . . . . . . . . . . . . . 1 7 3 , 4 3 1 , 6 9 0 Food . . . . . . . . . . . . . . . . . . . . . . . . . . . . . . . . . . . . . . . . . . . . . . . . . . . . 1 5 3 , 9 0 7 , 0 8 3 Beverage . . . . . . . . . . . . . . . . . . . . . . . . . . . . . . . . . . . . . . . . . . . . . . . . 6 4 , 94 0 , 4 3 5 Other . . . . . . . . . . . . . . . . . . . . . . . . . . . . . . . . . . . . . . . . . . . . . . . . . . . 4 7 , 1 0 2 , 14 1
8 6 0 , 54 6 , 1 5 7 TOTAL REVENUE . . . . . . . . . . . . . . . . . . . . . . . . . . . . . . . . . . . . . . . . . . · · ·----
������
COST OF SALES 8 6 , 84 1 , 1 7 2
GROSS MARGIN 7 7 3 , 7 0 4 , 9 8 5
DEPARTMENTAL EXPENSES . . . . . . . . . . . . . . . . . . . . . . . . . . . . . . . . . . . . . 4 5 9 , 04 6 , 1 0 0
DEPARTMENTAL INCOME ( LOS S ) 3 14 , 6 5 8 , 8 8 5 • • • • • • • • • • • • • • • • • • • • • • • • • • • • • • • • ----=...::::�...::...:o..:::....!......::...:o -=.
GENERAL AND ADMINISTRATIVE EXPENSES Advert is ing and Promotion . . . . . . . . . . . . . . . . . . . . . . . . . . . . . . . 2 2 , 1 94 , 8 0 5 Bad Debt Expense . . . . . . . . . . . . . . . . . . . . . . . . . . . . . . . . . . . . . . . . 1 , 7 0 9 Compl imentary Expense ( not reported i n department s ) . . . . . . 1 7 , 3 9 7 , 6 9 2 Depreciation - Buildings . . . . . . . . . . . . . . . . . . . . . . . . . . . . . . . . 3 5 , 174 , 7 2 6 Depreciation and Amort ization - Other . . . . . . . . . . . . . . . . . . . 4 2 , 0 8 0 , 2 4 6 Energy Expense ( electricity , gas , etc . ) . . . . . . . . . . . . . . . . . 2 2 , 3 7 9 , 6 9 5 Equipment Rental or Lease . . . . . . . . . . . . . . . . . . . . . . . . . . . . . . . 7 , 0 74 , 6 4 6 Interest Expense . . . . . . . . . . . . . . . . . . . . . . . . . . . . . . . . . . . . . . . . 4 5 , 8 12 , 2 7 9 Music and Entertainment . . . . . . . . . . . . . . . . . . . . . . . . . . . . . . . . . 5 , 5 15 , 0 1 1 Payroll Taxes . . . . . . . . . . . . . . . . . . . . . . . . . . . . . . . . . . . . . . . . . . . 4 , 75 3 , 3 3 7 Payroll - Employee Benefits . . . . . . . . . . . . . . . . . . . . . . . . . . . . . 6 , 62 8 , 3 8 1 Payroll - Officers . . . . . . . . . . . . . . . . . . . . . . . . . . . . . . . . . . . . . . 0 Payroll - Other Employees . . . . . . . . . . . . . . . . . . . . . . . . . . . . . . . 5 0 , 8 12 , 1 9 7 Rent o f Premises . . . . . . . . . . . . . . . . . . . . . . . . . . . . . . . . . . . . . . . . 1 , 3 4 5 , 9 7 2 Taxes - Real Estate . . . . . . . . . . . . . . . . . . . . . . . . . . . . . . . . . . . . . 9 , 162 , 3 8 5 Taxes and Licenses - Other . . . . . . . . . . . . . . . . . . . . . . . . . . . . . . 8 1 0 , 9 0 8 Uti l ities (Other than Energy Expense) . . . . . . . . . . . . . . . . . . . 5 , 98 0 , 8 9 4 Other General and Administrative Expenses . . . . . . . . . . . . . . . 4 9 , 5 8 2 , 144
3 2 6 , 7 0 7 , 0 2 7 TOTAL GENERAL AND ADMINISTRATIVE EXPENSES . . . . . . . . . . · · · · · · ·----
������
NET INCOME ( LOSS ) BEFORE FEDERAL INCOME TAXES AND EXTRAORDINARY ITEMS . . . . . . . . . . . . . . . . . . . . . . . . . . . . . . . . . . . .
Average Revenue 1 4 3 , 4 24 , 3 6 0
Upper Quartile 1 6 8 , 3 3 9 , 764
Median 132 , 3 22 , 2 95
- 12 , 04 8 , 142
Lower Quartile 12 0 , 7 8 0 , 8 94
PERCENT 4 8 . 9% 2 0 . 2 % 17 . 9 %
7 . 5 % 5 . 5 %
1 0 0 . 0 %
1 0 . 1%
8 9 . 9 %
53 . 3 %
3 6 . 6 %
2 . 6 % 0 . 0 % 2 . 0 % 4 . 1% 4 . 9 % 2 . 6 % 0 . 8 % 5 . 3 % 0 . 6 % 0 . 6 % 0 . 8 % 0 . 0 % 5 . 9% 0 . 2 % 1 . 1% 0 . 1% 0 . 7% 5 . 8 %
3 8 . 0 %
- 1 . 4 %

COMBINED INCOME STATEMENT - DETAIL 2 - 10 7 Fiscal Year 2 0 13 Washoe County - Reno/Sparks With Gaming Revenue of $ 3 6 , 0 0 0 , 0 0 0 and over
Amounts Represent 6 Locations .
CASINO DEPARTMENT
REVENUE DOLLARS PERCENT Pit Revenue ( Includes Keno and Bingo) . . . . . . . . . . . . . . . . . . . 8 8 , 999 , 8 9 7 2 1 . 1% Coin Operated Devices . . . . . . . . . . . . . . . . . . . . . . . . . . . . . . . . . . . 3 19 , 3 0 9 , 2 6 0 75 . 8 % Poker and Pan . . . . . . . . . . . . . . . . . . . . . . . . . . . . . . . . . . . . . . . . . . . 6 , 93 2 , 7 7 9 1 . 6 % Race Book . . . . . . . . . . . . . . . . . . . . . . . . . . . . . . . . . . . . . . . . . . . . . . . 2 , 3 94 , 84 9 0 . 6 % Sports Pool . . . . . . . . . . . . . . . . . . . . . . . . . . . . . . . . . . . . . . . . . . . . . 3 , 52 8 , 0 2 3 0 . 8 %
TOTAL REVENUE . . . . . . . . . . . . . . . . . . . . . . . . . . . . . . . . . . . . . . . . . . . . . 4 2 1 , 164 , 8 0 8 100 . 0 %
DEPARTMENTAL EXPENSES Bad Debt Expense . . . . . . . . . . . . . . . . . . . . . . . . . . . . . . . . . . . . . . . . 3 5 0 , 3 4 1 0 . 1% Commissions . . . . . . . . . . . . . . . . . . . . . . . . . . . . . . . . . . . . . . . . . . . . . 134 , 73 6 0 . 0 % Complimentary Expense . . . . . . . . . . . . . . . . . . . . . . . . . . . . . . . . . . . 103 , 8 0 7 , 0 3 5 24 . 6% Gaming Taxes and Licenses . . . . . . . . . . . . . . . . . . . . . . . . . . . . . . . 3 5 , 064 , 5 19 8 . 3 % Preferred Guest Expenses (no complimentaries ) . . . . . . . . . . . 0 0 . 0 % Payroll Taxes . . . . . . . . . . . . . . . . . . . . . . . . . . . . . . . . . . . . . . . . . . . 7 , 5 8 6 , 174 1 . 8 % Payrol l - Employee Benefits . . . . . . . . . . . . . . . . . . . . . . . . . . . . . 8 , 84 0 , 113 2 . 1% Payroll - Officers . . . . . . . . . . . . . . . . . . . . . . . . . . . . . . . . . . . . . . 0 0 . 0 % Payroll - Other Employees . . . . . . . . . . . . . . . . . . . . . . . . . . . . . . . 5 0 , 82 6 , 255 12 . 1% Race Wire Fees . . . . . . . . . . . . . . . . . . . . . . . . . . . . . . . . . . . . . . . . . . 22 0 , 180 0 . 1% Other Departmental Expenses . . . . . . . . . . . . . . . . . . . . . . . . . . . . . 3 7 , 4 6 2 , 934 8 . 9%
TOTAL DEPARTMENTAL EXPENSES . . . . . . . . . . . . . . . . . . . . . . . . . . . . . . . 244 , 2 92 , 2 8 7 58 . 0 %
DEPARTMENTAL INCOME (LOSS ) . . . . . . . . . . . . . . . . . . . . . . . . . . . . . . . . . 17 6 , 8 72 , 52 1 4 2 . 0 %
ROOMS DEPARTMENT
REVENUE DOLLARS PERCENT Room Sales . . . . . . . . . . . . . . . . . . . . . . . . . . . . . . . . . . . . . . . . . . . . . . 124 , 82 9 , 166 72 . 0 % Complimentary Rooms . . . . . . . . . . . . . . . . . . . . . . . . . . . . . . . . . . . . . 4 8 , 6 02 , 52 4 2 8 . 0 %
TOTAL REVENUE . . . . . . . . . . . . . . . . . . . . . . . . . . . . . . . . . . . . . . . . . . . . . 173 , 4 3 1 , 6 9 0 100 . 0 %
DEPARTMENTAL EXPENSES Bad Debt Expense . . . . . . . . . . . . . . . . . . . . . . . . . . . . . . . . . . . . . . . . 112 , 8 6 7 0 . 1% Complimentary Expense . . . . . . . . . . . . . . . . . . . . . . . . . . . . . . . . . . . 9 , 3 3 6 , 3 6 8 5 . 4 % Payroll - Taxes . . . . . . . . . . . . . . . . . . . . . . . . . . . . . . . . . . . . . . . . . 4 , 102 , 17 7 2 . 3 % Payroll - Employee Benefits . . . . . . . . . . . . . . . . . . . . . . . . . . . . . 5 , 356 , 58 9 3 . 0 % Payroll - Officers . . . . . . . . . . . . . . . . . . . . . . . . . . . . . . . . . . . . . . 0 0 . 0 % Payroll - Other Employees . . . . . . . . . . . . . . . . . . . . . . . . . . . . . . . 3 5 , 6 6 6 , 8 8 4 2 0 . 6 % Other Departmental Expenses . . . . . . . . . . . . . . . . . . . . . . . . . . . . . 2 2 , 82 6 , 0 2 0 13 . 2 %
TOTAL DEPARTMENTAL EXPENSES . . . . . . . . . . . . . . . . . . . . . . . . . . . . . . . 7 7 , 4 0 0 , 905 4 4 . 6 %
DEPARTMENTAL INCOME (LOSS) . . . . . . . . . . . . . . . . . . . . . . . . . . . . . . . . . 96 , 0 3 0 , 7 85 55 . 4 %

2 - 1 0 8 COMBINED INCOME STATEMENT - DETAIL ( CONTINUED)
Fis cal Year 2 0 1 3 Washoe County - Reno/Sparks With Gaming Revenue of $ 3 6 , 0 0 0 , 0 0 0 and over
Amounts Represent 6 Locations .
REVENUE Food Sales
FOOD DEPARTMENT
Complimentary Food Sales . . . . . . . . . . . . . . . . . . . . . . . . . . . . . . . . TOTAL REVENUE . . . . . . . . . . . . . . . . . . . . . . . . . . . . . . . . . . . . . . . . . . . . .
COST OF SALES
GROSS MARGIN
DEPARTMENTAL EXPENSES Bad Debt Expense . . . . . . . . . . . . . . . . . . . . . . . . . . . . . . . . . . . . . . . .
Compl imentary Expense . . . . . . . . . . . . . . . . . . . . . . . . . . . . . . . . . . . Payroll - Taxes . . . . . . . . . . . . . . . . . . . . . . . . . . . . . . . . . . . . . . . . . Payroll - Employee Benefits . . . . . . . . . . . . . . . . . . . . . . . . . . . . . Payroll - Officers . . . . . . . . . . . . . . . . . . . . . . . . . . . . . . . . . . . . . .
Payroll - Other Employees . . . . . . . . . . . . . . . . . . . . . . . . . . . . . . . Other Departmental Expenses . . . . . . . . . . . . . . . . . . . . . . . . . . . . .
TOTAL DEPARTMENTAL EXPENSES . . . . . . . . . . . . . . . . . . . . . . . . . . . . . . .
DEPARTMENTAL INCOME ( LOSS )
BEVERAGE DEPARTMENT REVENUE
Beverage Sales . . . . . . . . . . . . . . . . . . . . . . . . . . . . . . . . . . . . . . . . . . Complimentary Beverage Sales . . . . . . . . . . . . . . . . . . . . . . . . . . . .
TOTAL REVENUE . . . . . . . . . . . . . . . . . . . . . . . . . . . . . . . . . . . . . . . . . . . . .
COST OF SALES
GROSS MARGIN . . . . . . . . . . . . . . . . . . . . . . . . . . . . . . . . . . . . . . . . . . . . . .
DEPARTMENTAL EXPENSES Bad Debt Expense . . . . . . . . . . . . . . . . . . . . . . . . . . . . . . . . . . . . . . . .
Complimentary Expense . . . . . . . . . . . . . . . . . . . . . . . . . . . . . . . . . . . Payroll - Taxes . . . . . . . . . . . . . . . . . . . . . . . . . . . . . . . . . . . . . . . . .
Payrol l - Employee Benefits . . . . . . . . . . . . . . . . . . . . . . . . . . . . .
Payroll - Officers . . . . . . . . . . . . . . . . . . . . . . . . . . . . . . . . . . . . . .
Payroll - Other Employees . . . . . . . . . . . . . . . . . . . . . . . . . . . . . . .
Other Departmental Expenses . . . . . . . . . . . . . . . . . . . . . . . . . . . . . TOTAL DEPARTMENTAL EXPENSES . . . . . . . . . . . . . . . . . . . . . . . . . . . . . . .
DEPARTMENTAL INCOME ( LOSS ) . . . . . . . . . . . . . . . . . . . . . . . . . . . . . . . . .
DOLLARS 1 0 8 , 4 0 6 , 8 1 9
4 5 , 5 0 0 , 2 6 4 1 5 3 , 9 0 7 , 0 8 3
5 9 , 7 9 9 , 5 8 0
94 , 10 7 , 5 0 3
3 , 5 3 0 1 , 54 9 , 2 5 5 7 , 13 2 , 0 7 9 7 , 4 0 7 , 3 54
0 5 6 , 1 7 0 , 2 94
9 , 92 3 , 0 5 9 8 2 , 185 , 5 7 1
1 1 , 92 1 , 9 3 2
DOLLARS 2 9 , 4 5 9 , 1 0 8 3 5 , 4 8 1 , 3 2 7 6 4 , 94 0 , 4 3 5
1 7 , 0 5 7 , 3 72
4 7 , 8 8 3 , 0 6 3
4 2 98 7 , 7 9 0
1 , 74 9 , 4 7 7 2 , 0 2 3 , 5 94
0 1 1 , 142 , 93 9
3 , 8 3 0 , 3 1 9 1 9 , 734 , 1 6 1
2 8 , 14 8 , 9 0 2
PERCENT 7 0 . 4 % 2 9 . 6 %
1 0 0 . 0 %
3 8 . 9 %
6 1 . 1 %
0 . 0 % 1 . 0 % 4 . 6 % 4 . 8 % 0 . 0 %
3 6 . 5 % 6 . 4 %
5 3 . 4 %
7 . 7 %
PERCENT 4 5 . 4 % 54 . 6 %
1 0 0 . 0 %
2 6 . 3 %
73 . 7 %
0 . 0 % 1 . 5 % 2 . 7 % 3 . 1% 0 . 0 %
17 . 2 % 5 . 9 %
3 0 . 4 %
4 3 . 3 %
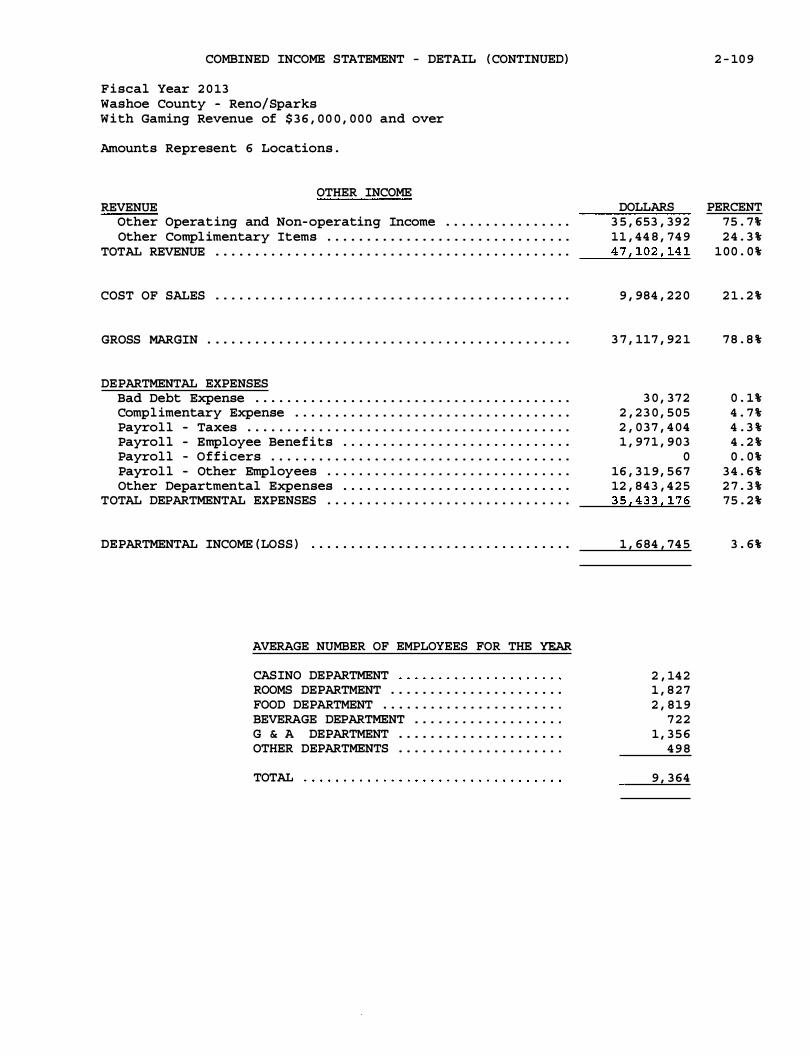
COMBINED INCOME STATEMENT - DETAIL ( CONTINUED)
Fiscal Year 2 0 13 Washoe County - Reno/Sparks With Gaming Revenue of $ 3 6 , 0 0 0 , 0 0 0 and over
Amounts Represent 6 Locations .
OTHER INCOME REVENUE
Other Operating and Non-operating Income . . . . . . . . . . . . . . . . Other Complimentary Items . . . . . . . . . . . . . . . . . . . . . . . . . . . . . . .
TOTAL REVENUE . . . . . . . . . . . . . . . . . . . . . . . . . . . . . . . . . . . . . . . . . . . . .
COST OF SALES . . . . . . . . . . . . . . . . . . . . . . . . . . . . . . . . . . . . . . . . . . . . .
GROSS MARGIN . . . . . . . . . . . . . . . . . . . . . . . . . . . . . . . . . . . . . . . . . . . . . .
DEPARTMENTAL EXPENSES Bad Debt Expense . . . . . . . . . . . . . . . . . . . . . . . . . . . . . . . . . . . . . . . . Complimentary Expense . . . . . . . . . . . . . . . . . . . . . . . . . . . . . . . . . . .
Payroll - Taxes . . . . . . . . . . . . . . . . . . . . . . . . . . . . . . . . . . . . . . . . .
Payroll - Employee Benefits . . . . . . . . . . . . . . . . . . . . . . . . . . . . .
Payroll - Officers . . . . . . . . . . . . . . . . . . . . . . . . . . . . . . . . . . . . . .
Payroll - Other Employees . . . . . . . . . . . . . . . . . . . . . . . . . . . . . . . Other Departmental Expenses . . . . . . . . . . . . . . . . . . . . . . . . . . . . .
TOTAL DEPARTMENTAL EXPENSES . . . . . . . . . . . . . . . . . . . . . . . . . . . . . . .
DEPARTMENTAL INCOME (LOSS ) . . . . . . . . . . . . . . . . . . . . . . . . . . . . . . . . .
AVERAGE NUMBER OF EMPLOYEES FOR THE YEAR
CASINO DEPARTMENT ROOMS DEPARTMENT . . . . . . . . . . . . . . . . . . . . . .
FOOD DEPARTMENT . . . . . . . . . . . . . . . . . . . . . . .
BEVERAGE DEPARTMENT . . . . . . . . . . . . . . . . . . .
G & A DEPARTMENT . . . . . . . . . . . . . . . . . . . . .
OTHER DEPARTMENTS . . . . . . . . . . . . . . . . . . . . .
TOTAL
DOLLARS 3 5 , 653 , 3 9 2 11 , 44 8 , 74 9 4 7 , 102 , 14 1
9 , 984 , 22 0
3 7 , 117 , 92 1
3 0 , 372 2 , 2 3 0 , 5 0 5 2 , 0 3 7 , 4 04 1 , 97 1 , 9 0 3
0 16 , 3 1 9 , 5 6 7 12 , 84 3 , 4 2 5 3 5 , 4 3 3 , 176
1 , 684 , 74 5
2 , 14 2 1 , 8 2 7 2 , 8 1 9
7 2 2 1 , 3 5 6
4 9 8
9 , 3 64
2 - 10 9
PERCENT 75 . 7% 2 4 . 3 %
1 0 0 . 0 %
2 1 . 2 %
7 8 . 8 %
0 . 1% 4 . 7 % 4 . 3 % 4 . 2 % 0 . 0 %
3 4 . 6 % 2 7 . 3 % 75 . 2 %
3 . 6%

2 - 1 1 0 ROOM OCCUPANCY AND PER ROOM PER DAY ANALYSIS
Fiscal Year 2 0 1 3 Washoe County - Reno/Sparks With Gaming Revenue of $ 3 6 , 0 0 0 , 0 0 0 and over
Amounts Represent 6 Locations .
RATE OF ROOM OCCUPANCY
MONTH JULY . . . . . . . . . . AUGUST . . . . . . . . SEPTEMBER . . . . . OCTOBER . . . . . . .
NOVEMBER . .. . . .. . DECEMBER . . . . . . JANUARY . . . . . . . FEBRUARY . . . . . .
MARCH . . . . . . . . . APRIL . . . . . . . . . MAY . . .. . . . . . . . . JUNE . . . . . . . . . .
TOTAL . . . . . . . . .
Average Pit Revenue Per Room Per Day
Average Slot Revenue Per Room Per Day
Average Food Sales Per Room Per Day
AVAILABLE ROOMS ROOMS OCCUPIED 2 3 9 , 6 0 1 2 0 5 , 0 7 7 2 3 9 , 6 6 1 2 04 , 5 8 7 2 4 4 , 6 0 9 2 02 , 1 3 7 2 3 7 , 4 94 176 , 4 5 3 2 2 9 , 3 3 6 13 7 , 8 6 8 2 4 8 , 2 9 9 155 , 5 1 9 2 3 7 , 545 155 , 6 0 1 2 2 0 , 6 1 3 148 , 8 8 6 2 5 0 , 0 7 3 1 8 1 , 8 1 7 2 3 2 , 3 2 9 1 7 1 , 74 0 2 3 9 , 1 0 8 1 9 0 , 177 2 4 4 , 5 8 9 2 12 , 2 7 3
2 , 8 6 3 , 2 5 7 2 , 14 2 , 1 3 5
PER ROOM PER DAY STATISTICS
4 1 . 5 5
1 4 9 . 0 6
7 1 . 8 5
Average Beverage Sales Per Room Per Day
Average Rooms Department Payrol l Per Room Per Day
Average Room Rate Per Day
% OF OCCUPANCY
( COMPUTED) 8 5 . 5 9 % 8 5 . 3 7 % 8 2 . 64 % 74 . 3 0 % 6 0 . 12 % 6 2 . 6 3 % 6 5 . 5 0 % 6 7 . 4 9 % 72 . 7 1 % 7 3 . 92 % 7 9 . 54 % 8 6 . 7 9 %
74 . 8 1 %
3 0 . 3 2
2 1 . 0 7
8 0 . 96

PER SQUARE FOOT ANALYSIS AND RATIOS 2 - 111 Fiscal Year 2 0 13 washoe County - Reno/Sparks With Gaming Revenue of $3 6 , 0 0 0 , 0 0 0 and over
Amounts Represent 6 Locations .
GAMING REVENUE PER SQUARE FOOT OF FLOOR SPACE
NO . OF CASINOS AVERAGE AREA GAMING REVENUE AREA OPERATING IN SQUARE FEET PER SQUARE FOOT
Pit ( Includes Bingo and Keno) 6 11 , 2 4 4 Coin Operated Devices 6 5 0 , 893 Poker and Pan 5 2 , 3 2 8 Race and Sports 4 3 , 187
TOTAL CASINO 6 6 6 , 2 0 2
RATIOS
TOTAL CURRENT ASSETS TO TOTAL CURRENT LIABILITIES . . . . . . . . .
TOTAL CAPITAL TO TOTAL LIABILITIES . . . . . . . . . . . . . . . . . . . . . . . .
TOTAL CAPITAL TO TOTAL CURRENT LIABILITIES . . . . . . . . . . . . . . . .
TOTAL CURRENT LIABILITIES TO TOTAL LIABILITIES . . . . . . . . . . . .
TOTAL COMPLIMENTARY EXPENSE TO GAMING REVENUE . . . . . . . . . . . . .
MUSIC AND ENTERTAINMENT EXPENSES TO GAMING REVENUE . . . . . . . .
TOTAL REVENUE TO AVERAGE TOTAL ASSETS . . . . . . . . . . . . . . . . . . . . .
TOTAL REVENUE LESS COMP SALES TO AVERAGE TOTAL ASSETS . . . . .
RETURN ON INVESTED CAPITAL* . . . . . . . . . . . . . . . . . . . . . . . . . . . . . . .
RETURN ON AVERAGE ASSETS * . . . . . . . . . . . . . . . . . . . . . . . . . . . . . . . . .
* - FORMULAS
Return on Invested Capital is equal to the total of net income (before federal income taxes and extraordinary items ) and interest expense divided by the total of average total assets less average current liabilities .
1 , 3 1 9 1 , 0 4 6
5 9 6 4 6 5
1 , 0 6 0
PERCENT 14 9 . 6 %
4 0 . 6%
2 7 6 . 2 %
14 . 7%
32 . 1%
1 . 3 %
6 0 . 1%
50 . 2 %
2 . 9%
2 . 4 %
Return on Average Assets is equal to the total o f net income (before federal income taxes and extraordinary items ) and interest expense divided by the average total assets .

2 - 1 12
THIS PAGE LEFT INTENTIONALLY BLANK

COMBINED BALANCE SHEET Fiscal Year 2 0 1 3 Washoe County - Balance o f County With Gaming Revenue of $ 1 , 0 0 0 , 0 0 0 and over
Amounts Represent 10 Locations .
ASSETS CURRENT ASSETS
Cash . . . . . . . . . . . . . . . . . . . . . . . . . . . . . . . . . . . . . . . . . . . . . . . . . . . .
Receivables TOTAL ALLOWANCE Casino 4 0 2 , 2 13 7 0 , 3 72 Trade 2 8 3 , 786 13 , 0 2 6 Sundry 4 0 6 , 922 0 Notes 8 9 9 , 565 0
Prepaid Expenses . . . . . . . . . . . . . . . . . . . . . . . . . . . . . . . . . . . . . . . . Other Current Assets . . . . . . . . . . . . . . . . . . . . . . . . . . . . . . . . . . . .
TOTAL CURRENT ASSETS . . . . . . . . . . . . . . . . . . . . . . . . . . . . . . . . . . . . . .
FIXED ASSETS COST DEPRECIATION Land 7 , 968 , 8 92 . . . . . . . . . . .
Land Improvements 3 , 8 6 5 , 5 0 1 2 , 184 , 4 85 Buildings & Improvements 4 0 , 3 9 3 , 171 14 , 4 9 9 , 929 Furniture & Equipment 4 4 , 742 , 546 3 5 , 0 2 6 , 0 4 9 Lease Improvements 9 , 3 04 , 824 4 , 2 9 9 , 9 0 9 Construction i n Progress 3 , 4 1 7 , 4 6 6 . . . . . . . . . . .
TOTAL FIXED ASSETS . . . . . . . . . . . . . . . . . . . . . . . . . . . . . . . . . . . . . . . .
OTHER ASSETS
TOTAL ASSETS
LIABILITIES AND CAPITAL CURRENT LIABILITIES
Accounts Payable - Trade . . . . . . . . . . . . . . . . . . . . . . . . . . . . . . . .
Accounts Payable - Other . . . . . . . . . . . . . . . . . . . . . . . . . . . . . . . . Current Portion of Long-Term Debt . . . . . . . . . . . . . . . . . . . . . . .
Accrued Expenses . . . . . . . . . . . . . . . . . . . . . . . . . . . . . . . . . . . . . . . .
Other Current Liabilities . . . . . . . . . . . . . . . . . . . . . . . . . . . . . . . TOTAL CURRENT LIABILITIES . . . . . . . . . . . . . . . . . . . . . . . . . . . . . . . . .
LONG-TERM DEBT Mortgages Debentures & Bonds
TOTAL OWING 7 , 618 , 422
0
CURRENT PORTION 6 5 1 , 043
0 Notes 8 , 24 9 , 17 9 3 3 , 532 Contracts 3 4 2 , 668 24 7 , 3 6 1 Other o 0
TOTAL LONG-TERM DEBT 16 , 2 10 , 2 6 9 9 3 1 , 9 3 6 OTHER LIABILITIES . . . . . . . . . . . . . . . . . . . . . . . . . . . . . . . . . . . . . . . . . TOTAL LIABILITIES . . . . . . . . . . . . . . . . . . . . . . . . . . . . . . . . . . . . . . . . .
CAPITAL Owners Capital Accounts . . . . . . . . . . . . . . . . . . . . . . . . . . . . . . . . .
Capital Stock & Other Capital . . . . . . . . . . . . . . . . . . . . . . . . . . . Retained Earnings . . . . . . . . . . . . . . . . . . . . . . . . . . . . . . . . . . . . . . .
TOTAL CAPITAL . . . . . . . . . . . . . . . . . . . . . . . . . . . . . . . . . . . . . . . . . . . . .
TOTAL LIABILITIES AND CAPITAL . . . . . . . . . . . . . . . . . . . . . . . . . . . . . .
Average Assets 10 , 03 8 , 555
Upper Quartile 12 , 3 9 9 , 13 1
Median 6 , 811 , 758
2 - 113
DOLLARS PERCENT 3 0 , 673 , 7 7 8
3 3 1 , 8 4 1 2 7 0 , 7 6 0 4 06 , 922 8 9 9 , 565
4 , 64 8 , 7 9 0 2 , 0 9 9 , 0 6 0
3 9 , 3 3 0 , 7 16
7 , 968 , 8 92 1 , 6 8 1 , 0 1 6
2 5 , 8 9 3 , 2 4 2 9 , 7 16 , 4 97 5 , 0 0 4 , 915 3 , 4 17 , 4 6 6
5 3 , 682 , 0 2 8
7 , 3 7 2 , 8 0 1
1 0 0 , 3 8 5 , 54 5
3 , 2 3 3 , 7 3 1 1 , 6 0 7 , 9 0 9
9 3 1 , 93 6 3 , 9 1 0 , 0 15 3 , 0 8 0 , 525
12 , 764 , 116
6 , 96 7 , 3 7 9 0
8 , 2 15 , 6 4 7 95 , 3 0 7
0 15 , 2 7 8 , 3 3 3
1 , 3 17 , 4 4 9 2 9 , 3 5 9 , 8 9 8
3 6 , 604 , 4 8 4 - 3 2 0 , 984
3 4 , 742 , 14 7 7 1 , 0 2 5 , 647
100 , 3 8 5 , 54 5
Lower Quartile 3 , 2 0 8 , 7 9 7
3 0 . 6 %
0 . 3 % 0 . 3 % 0 . 4 % 0 . 9% 4 . 6 % 2 . 1%
3 9 . 2 %
7 . 9% 1 . 7 %
25 . 8 % 9 . 7 % 5 . 0 % 3 . 4 %
53 . 5 %
7 . 3 %
1 0 0 . 0 %
3 . 2 % 1 . 6 % 0 . 9% 3 . 9 % 3 . 1%
12 . 7 %
6 . 9% 0 . 0 % 8 . 2 % O . H
0 . 0 % 15 . 2 %
1 . 3 % 2 9 . 2 %
3 6 . 5 % - 0 . 3 % 3 4 . 6 % 7 0 . 8 %
1 0 0 . 0 %
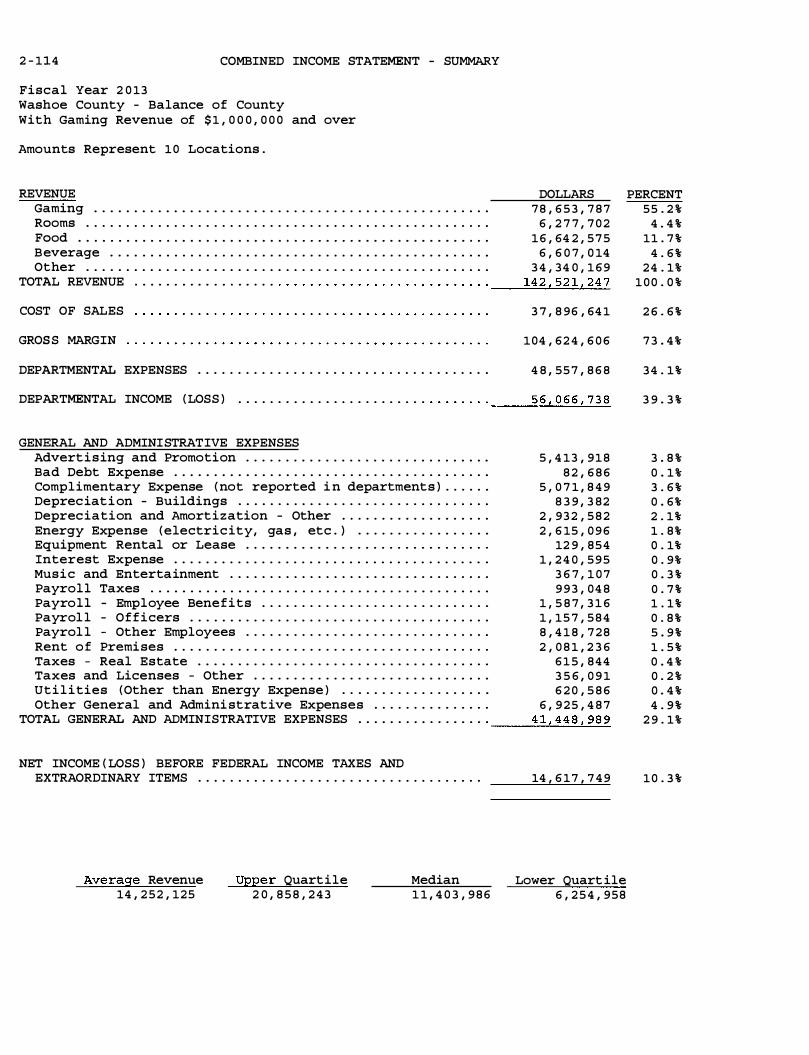
2 - 114 COMBINED INCOME STATEMENT - SUMMARY
Fiscal Year 2 0 13 Washoe County - Balance of County With Gaming Revenue of $ 1 , 0 0 0 , 0 0 0 and over
Amounts Represent 1 0 Locations .
REVENUE DOLLARS Gaming . . . . . . . . . . . . . . . . . . . . . . . . . . . . . . . . . . . . . . . . . . . . . . . . . . 7 8 , 6 5 3 , 7 8 7 Rooms . . . . . . . . . . . . . . . . . . . . . . . . . . . . . . . . . . . . . . . . . . . . . . . . . . . 6 , 2 7 7 , 7 0 2 Food . . . . . . . . . . . . . . . . . . . . . . . . . . . . . . . . . . . . . . . . . . . . . . . . . . . . 1 6 , 64 2 , 5 7 5 Beverage . . . . . . . . . . . . . . . . . . . . . . . . . . . . . . . . . . . . . . . . . . . . . . . . 6 , 6 0 7 , 0 14 Other . . . . . . . . . . . . . . . . . . . . . . . . . . . . . . . . . . . . . . . . . . . . . . . . . . . 3 4 , 34 0 , 1 6 9
142 , 52 1 , 2 4 7 TOTAL REVENUE . . . . . . . . . . . . . . . . . . · · · · · · · · · · · · · · · · · · · · · · · · · · ·
----
������
COST OF SALES 3 7 , 8 96 , 64 1
GROS S MARGIN 104 , 62 4 , 6 0 6
DEPARTMENTAL EXPENSES . . . . . . . . . . . . . . . . . . . . . . . . . . . . . . . . . . . . . 4 8 , 55 7 , 8 6 8
DEPARTMENTAL INCOME ( LOSS ) 5 6 , 0 6 6 , 7 3 8 • • • • • • • • • • • • • • • • • • • • • • • • · · · · · · · ·
----
--=...:::...L..::...:::...:::...L....:....::..::.
GENERAL AND ADMINISTRATIVE EXPENSES Advertising and Promotion . . . . . . . . . . . . . . . . . . . . . . . . . . . . . . . 5 , 4 13 , 9 1 8 Bad Debt Expense . . . . . . . . . . . . . . . . . . . . . . . . . . . . . . . . . . . . . . . . 8 2 , 6 8 6 Complimentary Expense ( not reported i n departments ) . . . . . . 5 , 0 7 1 , 8 4 9 Depreciati on - Buildings . . . . . . . . . . . . . . . . . . . . . . . . . . . . . . . . 8 3 9 , 3 82 Depreciation and Amortization - Other . . . . . . . . . . . . . . . . . . . 2 , 93 2 , 5 8 2 Energy Expense ( electricity, gas , etc . ) . . . . . . . . . . . . . . . . . 2 , 6 15 , 0 9 6 Equipment Rental or Lease . . . . . . . . . . . . . . . . . . . . . . . . . . . . . . . 12 9 , 854 Interest Expense . . . . . . . . . . . . . . . . . . . . . . . . . . . . . . . . . . . . . . . . 1 , 2 4 0 , 5 9 5 Music and Entertainment . . . . . . . . . . . . . . . . . . . . . . . . . . . . . . . . . 3 6 7 , 1 0 7 Payroll Taxes . . . . . . . . . . . . . . . . . . . . . . . . . . . . . . . . . . . . . . . . . . . 9 9 3 , 04 8 Payroll - Employee Benefits . . . . . . . . . . . . . . . . . . . . . . . . . . . . . 1 , 5 8 7 , 3 1 6 Payrol l - Officers . . . . . . . . . . . . . . . . . . . . . . . . . . . . . . . . . . . . . . 1 , 15 7 , 5 8 4 Payrol l - Other Employees . . . . . . . . . . . . . . . . . . . . . . . . . . . . . . . 8 , 4 1 8 , 7 2 8 Rent o f Premises . . . . . . . . . . . . . . . . . . . . . . . . . . . . . . . . . . . . . . . . 2 , 0 8 1 , 2 3 6 Taxes - Real Estate . . . . . . . . . . . . . . . . . . . . . . . . . . . . . . . . . . . . . 6 1 5 , 844 Taxes and Licenses - Other . . . . . . . . . . . . . . . . . . . . . . . . . . . . . . 3 5 6 , 0 9 1 Utilities (Other than Energy Expense ) . . . . . . . . . . . . . . . . . . . 6 2 0 , 5 8 6 Other General and Admini strative Expenses . . . . . . . . . . . . . . . 6 , 9 2 5 , 4 8 7
4 1 , 4 4 8 , 9 8 9 TOTAL GENERAL AND ADMINISTRATIVE EXPENSES . . . . . . . . . . . . . . . . ·----
���..:::...L��
NET INCOME ( LOSS ) BEFORE FEDERAL INCOME TAXES AND EXTRAORDINARY ITEMS . . . . . . . . . . . . . . . . . . . . . . . . . . . . . . . . . . . .
Average Revenue 14 , 2 5 2 , 125
Upper Quartile 2 0 , 8 5 8 , 2 4 3
Median 1 1 , 4 0 3 , 9 8 6
14 , 6 1 7 , 7 4 9
Lower Quart ile 6 , 2 5 4 , 958
PERCENT 55 . 2 %
4 . 4 % 11 . 7 %
4 . 6 % 2 4 . 1%
1 0 0 . 0 %
2 6 . 6 %
7 3 . 4 %
3 4 . 1%
3 9 . 3 %
3 . 8 % 0 . 1% 3 . 6 % 0 . 6% 2 . 1% 1 . 8 % 0 . 1% 0 . 9% 0 . 3 % 0 . 7 % 1 . 1% 0 . 8 % 5 . 9 % 1 . 5 % 0 . 4 % 0 . 2 % 0 . 4 % 4 . 9 %
2 9 . 1%
1 0 . 3 %

COMBINED INCOME STATEMENT - DETAIL 2 - 115 Fiscal Year 2 0 1 3 Washoe County - Balance of County With Gaming Revenue of $1 , 0 0 0 , 0 0 0 and over
Amounts Represent 10 Locations .
CASINO DEPARTMENT
REVENUE DOLLARS PERCENT Pit Revenue ( Includes Keno and Bingo) . . . . . . . . . . . . . . . . . . . 8 , 974 , 912 1 1 . 4 % Coin Operated Devices . . . . . . . . . . . . . . . . . . . . . . . . . . . . . . . . . . . 68 , 153 , 988 8 6 . 7 % Poker and Pan . . . . . . . . . . . . . . . . . . . . . . . . . . . . . . . . . . . . . . . . . . . 4 3 1 , 74 0 0 . 5 % Race Book . . . . . . . . . . . . . . . . . . . . . . . . . . . . . . . . . . . . . . . . . . . . . . . 1 1 , 196 0 . 0 % Sports Pool . . . . . . . . . . . . . . . . . . . . . . . . . . . . . . . . . . . . . . . . . . . . . 1 , 0 8 1 , 951 1 . 4 %
TOTAL REVENUE . . . . . . . . . . . . . . . . . . . . . . . . . . . . . . . . . . . . . . . . . . . . . 7 8 , 653 , 7 8 7 1 0 0 . 0 %
DEPARTMENTAL EXPENSES Bad Debt Expense . . . . . . . . . . . . . . . . . . . . . . . . . . . . . . . . . . . . . . . . - 6 , 124 0 . 0 % Commissions . . . . . . . . . . . . . . . . . . . . . . . . . . . . . . . . . . . . . . . . . . . . . . 1 , 7 3 6 , 896 2 . 2% Complimentary Expense . . . . . . . . . . . . . . . . . . . . . . . . . . . . . . . . . . . 7 , 74 7 , 181 9 . 8 % Gaming Taxes and Licenses . . . . . . . . . . . . . . . . . . . . . . . . . . . . . . . 6 , 515 , 588 8 . 3 % Preferred Guest Expenses (no complimentaries) . . . . . . . . . . . 168 , 5 7 1 0 . 2 % Payroll Taxes . . . . . . . . . . . . . . . . . . . . . . . . . . . . . . . . . . . . . . . . . . . 1 , 14 1 , 955 1 . 5% Payroll - Employee Benefits . . . . . . . . . . . . . . . . . . . . . . . . . . . . . 997 , 2 64 1 . 3 % Payroll - Officers . . . . . . . . . . . . . . . . . . . . . . . . . . . . . . . . . . . . . . 0 0 . 0 % Payroll - Other Employees . . . . . . . . . . . . . . . . . . . . . . . . . . . . . . . 8 , 073 , 8 0 8 10 . 3 % Race Wire Fees . . . . . . . . . . . . . . . . . . . . . . . . . . . . . . . . . . . . . . . . . . 3 62 0 . 0 % Other Departmental Expenses . . . . . . . . . . . . . . . . . . . . . . . . . . . . . 3 , 950 , 53 5 5 . 0 %
TOTAL DEPARTMENTAL EXPENSES . . . . . . . . . . . . . . . . . . . . . . . . . . . . . . . 3 0 , 3 2 6 , 0 3 6 3 8 . 6 %
DEPARTMENTAL INCOME (LOSS ) . . . . . . . . . . . . . . . . . . . . . . . . . . . . . . . . . 4 8 , 3 2 7 , 751 61 . 4 %
ROOMS DEPARTMENT
REVENUE DOLLARS PERCENT Room Sales . . . . . . . . . . . . . . . . . . . . . . . . . . . . . . . . . . . . . . . . . . . . . . 3 , 4 6 1 , 982 55 . 1% Complimentary Rooms . . . . . . . . . . . . . . . . . . . . . . . . . . . . . . . . . . . . . 2 , 815 , 7 2 0 4 4 . 9%
TOTAL REVENUE . . . . . . . . . . . . . . . . . . . . . . . . . . . . . . . . . . . . . . . . . . . . . 6 , 2 7 7 , 702 1 0 0 . 0 %
DEPARTMENTAL EXPENSES Bad Debt Expense . . . . . . . . . . . . . . . . . . . . . . . . . . . . . . . . . . . . . . . . 17 , 0 2 8 0 . 3 % Complimentary Expense . . . . . . . . . . . . . . . . . . . . . . . . . . . . . . . . . . . 14 , 7 9 7 0 . 2 % Payroll - Taxes . . . . . . . . . . . . . . . . . . . . . . . . . . . . . . . . . . . . . . . . . 116 , 9 3 3 1 . 8 % Payroll - Employee Benefits . . . . . . . . . . . . . . . . . . . . . . . . . . . . . 56 , 64 0 0 . 9% Payroll - Officers . . . . . . . . . . . . . . . . . . . . . . . . . . . . . . . . . . . . . . 0 0 . 0 % Payroll - Other Employees . . . . . . . . . . . . . . . . . . . . . . . . . . . . . . . 1 , 0 0 4 , 4 1 8 16 . 0 % Other Departmental Expenses . . . . . . . . . . . . . . . . . . . . . . . . . . . . . 1 , 8 2 5 , 574 2 9 . 1%
TOTAL DEPARTMENTAL EXPENSES . . . . . . . . . . . . . . . . . . . . . . . . . . . . . . . 3 , 035 , 3 9 0 4 8 . 4 %
DEPARTMENTAL INCOME (LOSS ) . . . . . . . . . . . . . . . . . . . . . . . . . . . . . . . . . 3 , 24 2 , 3 12 5 1 . 6 %

2 - 1 1 6 COMBINED INCOME STATEMENT - DETAIL ( CONTINUED)
Fiscal Year 2 0 1 3 Washoe County - Balance o f County With Gaming Revenue of $ 1 , 0 0 0 , 0 0 0 and over
Amounts Represent 10 Locations .
FOOD DEPARTMENT REVENUE DOLLARS PERCENT
Food Sales 13 , 4 0 4 , 0 72 8 0 . 5 % Complimentary Food Sales . . . . . . . . . . . . . . . . . . . . . . . . . . . . . . . . 3 , 2 3 8 , 5 0 3 1 9 . 5 %
TOTAL REVENUE . . . . . . . . . . . . . . . . . . . . . . . . . . . . . . . . . . . . . . . . . . . . . 16 , 64 2 , 5 7 5 1 0 0 . 0 %
COST OF SALES 8 , 2 7 2 , 4 0 4 4 9 . 7 %
GROSS MARGIN 8 , 3 7 0 , 1 7 1 5 0 . 3 %
DEPARTMENTAL EXPENSES Bad Debt Expense . . . . . . . . . . . . . . . . . . . . . . . . . . . . . . . . . . . . . . . . 544 0 . 0 % Complimentary Expense . . . . . . . . . . . . . . . . . . . . . . . . . . . . . . . . . . . 12 1 , 6 6 8 0 . 7 % Payroll - Taxes . . . . . . . . . . . . . . . . . . . . . . . . . . . . . . . . . . . . . . . . . 8 1 7 , 197 4 . 9% Payrol l - Employee Benefits . . . . . . . . . . . . . . . . . . . . . . . . . . . . . 3 94 , 5 6 9 2 . 4 % Payroll - Officers . . . . . . . . . . . . . . . . . . . . . . . . . . . . . . . . . . . . . . 0 0 . 0 % Payroll - Other Employees . . . . . . . . . . . . . . . . . . . . . . . . . . . . . . . 6 , 3 64 , 12 7 3 8 . 2 % Other Departmental Expenses . . . . . . . . . . . . . . . . . . . . . . . . . . . . . 1 , 9 92 , 2 9 9 12 . 0 %
TOTAL DEPARTMENTAL EXPENSES . . . . . . . . . . . . . . . . . . . . . . . . . . . . . . . 9 , 6 9 0 , 4 0 4 5 8 . 2 %
DEPARTMENTAL INCOME ( LOSS ) . . . . . . . . . . . . . . . . . . . . . . . . . . . . . . . . . - 1 , 3 2 0 , 2 3 3 - 7 . 9 %
BEVERAGE DEPARTMENT REVENUE DOLLARS PERCENT
Beverage Sales . . . . . . . . . . . . . . . . . . . . . . . . . . . . . . . . . . . . . . . . . . 1 , 74 5 , 7 8 0 2 6 . 4 % Complimentary Beverage Sales . . . . . . . . . . . . . . . . . . . . . . . . . . . . 4 , 8 6 1 , 2 3 4 7 3 . 6 %
TOTAL REVENUE . . . . . . . . . . . . . . . . . . . . . . . . . . . . . . . . . . . . . . . . . . . . . 6 , 6 0 7 , 0 14 1 0 0 . 0 %
COST OF SALES 1 , 92 8 , 1 2 8 2 9 . 2 %
GROSS MARGIN . . . . . . . . . . . . . . . . . . . . . . . . . . . . . . . . . . . . . . . . . . . . . . 4 , 6 7 8 , 8 8 6 7 0 . 8 %
DEPARTMENTAL EXPENSES Bad Debt Expense . . . . . . . . . . . . . . . . . . . . . . . . . . . . . . . . . . . . . . . . 3 8 9 0 . 0 % Complimentary Expense . . . . . . . . . . . . . . . . . . . . . . . . . . . . . . . . . . . 2 1 3 , 4 9 9 3 . 2 % Payrol l - Taxes . . . . . . . . . . . . . . . . . . . . . . . . . . . . . . . . . . . . . . . . . 185 , 2 3 6 2 . 8 % Payrol l - Employee Benefits . . . . . . . . . . . . . . . . . . . . . . . . . . . . . 1 0 7 , 7 5 8 1 . 6 % Payroll - Officers . . . . . . . . . . . . . . . . . . . . . . . . . . . . . . . . . . . . . . 0 0 . 0 % Payrol l - Other Employees . . . . . . . . . . . . . . . . . . . . . . . . . . . . . . . 1 , 2 8 8 , 14 5 1 9 . 5 % Other Departmental Expenses . . . . . . . . . . . . . . . . . . . . . . . . . . . . . 3 8 9 , 3 3 1 5 . 9 %
TOTAL DEPARTMENTAL EXPENSES . . . . . . . . . . . . . . . . . . . . . . . . . . . . . . . 2 , 1 84 , 3 5 8 3 3 . 1 %
DEPARTMENTAL INCOME ( LOSS ) . . . . . . . . . . . . . . . . . . . . . . . . . . . . . . . . . 2 , 4 94 , 5 2 8 3 7 . 8 %

COMBINED INCOME STATEMENT - DETAIL ( CONTINUED)
Fiscal Year 2 0 13 Washoe County - Balance of County With Gaming Revenue of $1 , 0 0 0 , 0 0 0 and over
Amounts Represent 10 Locations .
OTHER INCOME REVENUE
Other Operating and Non-operating Income . . . . . . . . . . . . . . . .
Other Complimentary Items . . . . . . . . . . . . . . . . . . . . . . . . . . . . . . .
TOTAL REVENUE . . . . . . . . . . . . . . . . . . . . . . . . . . . . . . . . . . . . . . . . . . . . .
COST OF SALES . . . . . . . . . . . . . . . . . . . . . . . . . . . . . . . . . . . . . . . . . . . . .
GROSS MARGIN . . . . . . . . . . . . . . . . . . . . . . . . . . . . . . . . . . . . . . . . . . . . . .
DEPARTMENTAL EXPENSES Bad Debt Expense . . . . . . . . . . . . . . . . . . . . . . . . . . . . . . . . . . . . . . . .
Complimentary Expense . . . . . . . . . . . . . . . . . . . . . . . . . . . . . . . . . . .
Payroll - Taxes . . . . . . . . . . . . . . . . . . . . . . . . . . . . . . . . . . . . . . . . .
Payroll - Employee Benefits . . . . . . . . . . . . . . . . . . . . . . . . . . . . .
Payrol l - Officers . . . . . . . . . . . . . . . . . . . . . . . . . . . . . . . . . . . . . . Payrol l - Other Employees . . . . . . . . . . . . . . . . . . . . . . . . . . . . . . .
Other Departmental Expenses . . . . . . . . . . . . . . . . . . . . . . . . . . . . .
TOTAL DEPARTMENTAL EXPENSES . . . . . . . . . . . . . . . . . . . . . . . . . . . . . . .
DEPARTMENTAL INCOME (LOSS) . . . . . . . . . . . . . . . . . . . . . . . . . . . . . . . . .
AVERAGE NUMBER OF EMPLOYEES FOR THE YEAR
CASINO DEPARTMENT ROOMS DEPARTMENT . . . . . . . . . . . . . . . . . . . . . .
FOOD DEPARTMENT . . . . . . . . . . . . . . . . . . . . . . .
BEVERAGE DEPARTMENT . . . . . . . . . . . . . . . . . . .
G & A DEPARTMENT . . . . . . . . . . . . . . . . . . . . .
OTHER DEPARTMENTS . . . . . . . . . . . . . . . . . . . . .
TOTAL
DOLLARS 3 3 , 961 , 9 79
3 7 8 , 190 3 4 , 34 0 , 169
2 7 , 6 9 6 , 109
6 , 64 4 , 0 6 0
1 , 855 2 5 , 552
14 1 , 175 6 0 , 2 2 3
0 1 , 2 5 6 , 573 1 , 836 , 3 02 3 , 3 2 1 , 680
3 , 3 22 , 3 8 0
3 3 9 5 7
328 95
246 62
1 , 12 7
2 - 117
PERCENT 98 . 9%'
1 . 1%' 100 . 0 %'
8 0 . 7%'
19 . 3 %'
0 . 0%' 0 . 1%' 0 . 4 %' 0 . 2 %' 0 . 0%' 3 . 7%'
5 . 3 %' 9 . 7%'
9 . 7%'

2 - 1 1 8 ROOM OCCUPANCY AND PER ROOM PER DAY ANALYSIS
Fi scal Year 2 0 13 Washoe County - Balance of County With Gaming Revenue of $ 1 , 0 0 0 , 0 0 0 and over
Amounts Represent 10 Locations .
RATE OF ROOM OCCUPANCY
MONTH JULY . . . . . . . . . . AUGUST . . . . . . . .
SEPTEMBER . . . . .
OCTOBER . . . . . . . NOVEMBER . . . . . . DECEMBER . . . . . .
JANUARY . . . . . . ..
FEBRUARY . . . .. . . MARCH . .. .. . . . .. . . APRIL . . . . . . . . . MAY . . . . . . . . . . . JUNE . . . . . . . . . .
TOTAL .. . . . . . . .. .
Average Pit Revenue Per Room Per Day
Average Slot Revenue Per Room Per Day
Average Food Sales Per Room Per Day
AVAILABLE ROOMS ROOMS OCCUPIED
18 , 3 1 9 11 , 2 18 1 6 , 7 1 0 1 0 , 7 3 9 1 6 , 170 1 0 , 995 1 6 , 7 2 1 9 , 1 9 1 16 , 0 7 1 7 , 0 2 9 1 6 , 6 3 0 8 , 7 9 9 1 6 , 6 1 7 8 , 3 1 8 15 , 115 7 , 8 6 6 16 , 6 92 9 , 4 0 4 1 6 , 1 3 9 8 , 5 5 6 16 , 6 4 6 9 , 4 75 1 6 , 0 62 1 1 , 7 6 7
1 9 7 , 8 92 113 , 3 5 7
PER ROOM PER DAY STATISTICS
7 9 . 17
6 0 1 . 2 3
1 4 6 . 82
Average Beverage Sales Per Room Per Day
Average Rooms Department Payroll Per Room Per Day
Average Room Rate Per Day
%" OF OCCUPANCY
( COMPUTED) 6 1 . 2 4 %" 64 . 2 7 %" 6 8 . 0 0 %" 54 . 9 7 %" 4 3 . 74 %" 5 2 . 9 1%" 5 0 . 0 6 %" 52 . 04 %" 5 6 . 3 4 %" 5 3 . 0 1%" 5 6 . 92 %" 73 . 2 6 %"
5 7 . 2 8 %"
5 8 . 2 9
1 0 . 3 9
5 5 . 3 8
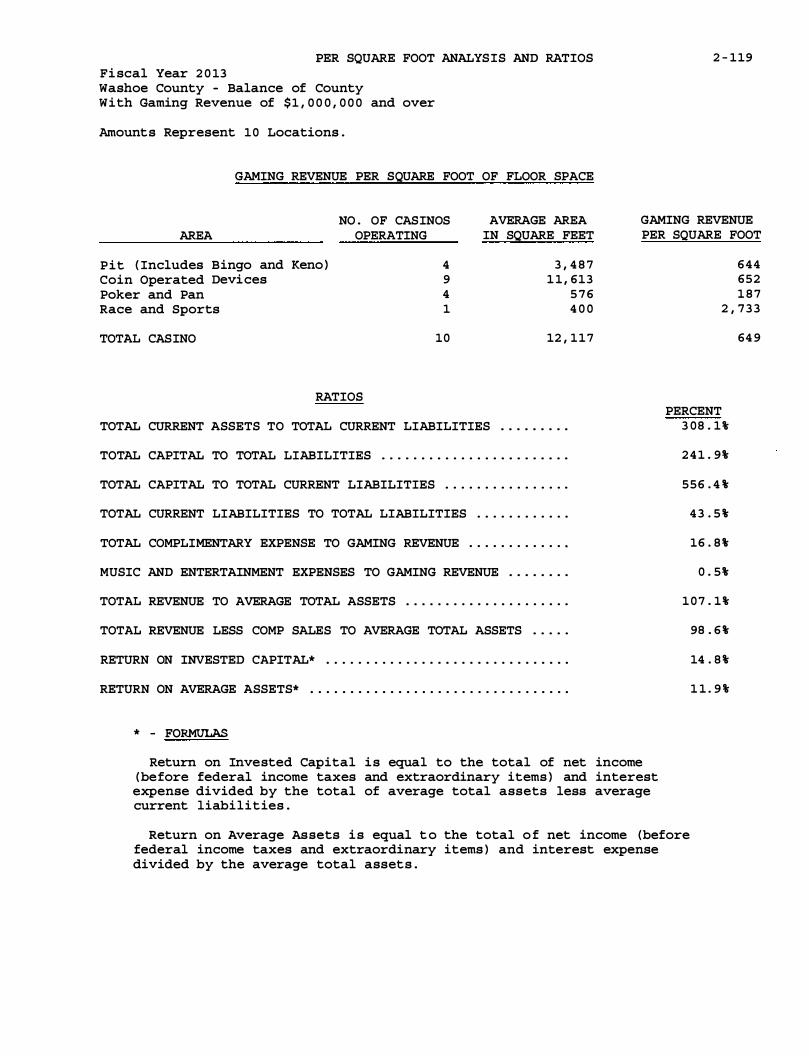
PER SQUARE FOOT ANALYSIS AND RATIOS 2 - 119 Fi scal Year 2 0 13 Washoe County - Balance of County With Gaming Revenue of $1 , 0 0 0 , 0 0 0 and over
Amounts Represent 10 Locations .
GAMING REVENUE PER SQUARE FOOT OF FLOOR SPACE
NO . OF CASINOS AVERAGE AREA GAMING REVENUE AREA OPERATING IN SQUARE FEET PER SQUARE FOOT
Pit ( Includes Bingo and Keno ) 4 3 , 4 8 7 644 Coin Operated Devices 9 1 1 , 613 652 Poker and Pan 4 5 7 6 1 8 7 Race and Sports 1 4 0 0 2 , 7 3 3
TOTAL CASINO 10 12 , 117
RATIOS
TOTAL CURRENT ASSETS TO TOTAL CURRENT LIABILITIES . . . . . . . . .
TOTAL CAPITAL TO TOTAL LIABILITIES . . . . . . . . . . . . . . . . . . . . . . . .
TOTAL CAPITAL TO TOTAL CURRENT LIABILITIES . . . . . . . . . . . . . . . .
TOTAL CURRENT LIABILITIES TO TOTAL LIABILITIES . . . . . . . . . . . .
TOTAL COMPLIMENTARY EXPENSE TO GAMING REVENUE . . . . . . . . . . . . .
MUSIC AND ENTERTAINMENT EXPENSES TO GAMING REVENUE . . . . . . . .
TOTAL REVENUE TO AVERAGE TOTAL ASSETS . . . . . . . . . . . . . . . . . . . . .
TOTAL REVENUE LESS COMP SALES TO AVERAGE TOTAL ASSETS . . . . .
RETURN ON INVESTED CAPITAL* . . . . . . . . . . . . . . . . . . . . . . . . . . . . . . .
RETURN ON AVERAGE ASSETS* . . . . . . . . . . . . . . . . . . . . . . . . . . . . . . . . .
* - FORMULAS
Return on Invested Capital is equal to the total of net income (before federal income taxes and extraordinary items ) and interest
expense divided by the total of average total assets less average current liabilities .
PERCENT 3 08 . 1%
2 4 1 . 9%'
556 . 4 %'
4 3 . 5 %'
16 . 8 %'
0 . 5%'
1 0 7 . 1%
98 . 6 %'
14 . 8 %'
1 1 . 9 %'
Return on Average Assets is equal t o the total o f net income (before federal income taxes and extraordinary items ) and interest expense divided by the average total assets .
64 9

2 - 12 0
THIS PAGE LEFT INTENTIONALLY BLANK
SECTION 3
DETAIL OF SELECTED GROUPS
INDEX
STATEWIDE - CASINOS WITH ROOMS FACILITIES With Gaming Revenue of $1.000,000 and Over
Combined Balance Sheet Combined Income Statement - Summary Combined Income Statement - Detail:
Casino Department Rooms Department Food Department Beverage Department Other Income
Average Number ofEmployees Rate ofRoom Occupancy Per Room Per Day Statistics Gaming Revenue per Square Foot Ratios
STATEWIDE - CASINOS WITH ROOMS FACILITIES With Gaming Revenue of $1,000.000 to $12,000,000
Combined Balance Sheet Combined Income Statement - Summary Combined Income Statement - Detail:
Casino Department Rooms Department Food Department Beverage Department Other Income
Average Number of Employees Rate ofRoom Occupancy Per Room Per Day Statistics Gaming Revenue per Square Foot Ratios
STATEWIDE - CASINOS WITH ROOMS FACILITIES With Gaming Revenue of $12,000,000 to $36.000,000
Combined Balance Sheet Combined Income Statement - Summary Combined Income Statement - Detail:
Casino Department Rooms Department Food Department Beverage Department Other Income
Average Number of Employees Rate of Room Occupancy Per Room Per Day Statistics Gaming Revenue per Square Foot Ratios
3-1 3-2
3-3 3-3 3-4 3-4 3-5 3-5 3-6 3-6 3-7 3-7
3-9 3-10
3-1 1 3-1 1 3-12 3-12 3-13 3-13 3-14 3-14 3-15 3- 15
3-17 3-18
3-19 3-19 3-20 3-20 3-21 3-2 1 3-22 3-22 3-23 3-23

SECTION 3 - CONTINUED
DETAIL OF SELECTED GROUPS
INDEX
STATEWIDE - CASINOS WITH ROOMS FACILITIES With Gaming Revenue of $36,000,000 to $72,000,000
Combined Balance Sheet Combined Income Statement - Summary Combined Income Statement - Detail :
Casino Department Rooms Department
Food Department
Beverage Department Other Income
Average Number of Employees Rate of Room Occupancy
Per Room Per Day Statistics
Gaming Revenue per Square Foot Ratios
STATEWIDE - CASINOS WITH ROOMS FACILITIES With Gaming Revenue of $72,000,000 and Over
Combined Balance Sheet
Combined Income Statement - Summary
Combined Income Statement - Detail: Casino Department
Rooms Department Food Department
Beverage Department
Other Income Average Number of Employees Rate of Room Occupancy Per Room Per Day Statistics
Gaming Revenue per Square Foot Ratios
STATEWIDE - PUBLICLY OWNED CASINO OPERATIONS With Gaming Revenue of $12,000,000 and Over
Combined Balance Sheet Combined Income Statement - Summary
Combined Income Statement - Detail:
Casino Department Rooms Department Food Department Beverage Department
Other Income Average Number of Employees Rate of Room Occupancy
Per Room Per Day Statistics Gaming Revenue per Square Foot
Ratios
3-25
3-26
3-27 3-27 3-28 3-28 3-29 3-29 3-30 3-30 3-3 1 3-3 1
3-33 3-34
3-35 3-35 3-36 3-36 3-37 3-37 3-3 8 3-3 8 3-39 3-39
3-4 1 3-42
3-43 3-43 3-44 3-44 3-45 3-45 3-46 3-46 3-47 3-47

COMBINED BALANCE SHEET Fiscal Year 2 0 1 3 Statewide Casinos with Rooms Facilities With Gaming Revenue of $1 , 0 0 0 , 0 0 0 and over
Amounts Represent 137 Locations .
ASSETS CURRENT ASSETS
Cash . . . . . . . . . . . . . . . . . . . . . . . . . . . . . . . . . . . . . . . . . . . . . . . . . . . . Receivables TOTAL ALLOWANCE
Casino 1 , 2 2 1 , 7 7 1 , 043 513 , 64 9 , 896 Trade 596 , 14 0 , 4 0 6 2 4 , 153 , 057 Sundry 7 , 18 7 , 8 4 9 , 155 7 0 0 , 554 Notes 9 9 , 7 12 , 865 10 , 0 0 0
Prepaid Expenses . . . . . . . . . . . . . . . . . . . . . . . . . . . . . . . . . . . . . . . .
Other Current Assets . . . . . . . . . . . . . . . . . . . . . . . . . . . . . . . . . . . . TOTAL CURRENT ASSETS . . . • . . . . . . . . . . . . . . . . . . . . . . . . . . . . . . . . . .
FIXED ASSETS COST DEPRECIATION Land 14 , 82 1 , 178 , 2 05 . . . . . . . . . . . Land Improvements 1 , 4 5 0 , 882 , 54 0 4 96 , 58 7 , 899 Buildings & Improvements 3 1 , 7 91 , 4 2 6 , 63 0 7 , 591 , 7 7 6 , 513 Furniture & Equipment 10 , 8 0 3 , 014 , 7 11 6 , 8 6 1 , 756 , 762 Lease Improvements 14 0 , 68 5 , 0 0 2 6 1 , 9 14 , 056 Construction in Progress 777 , 67 0 , 563 . . . . . . . . . . .
TOTAL FIXED ASSETS . . . . . . . . . . . . . . . . . . . . . . . . . . . . . . . . . . . . . . . .
OTHER ASSETS
TOTAL ASSETS
LIABILITIES AND CAPITAL CURRENT LIABILITIES
Accounts Payable - Trade . . . . . . . . . . . . . . . . . . . . . . . . . . . . . . . . Accounts Payable - Other . . . . . . . . . . . . . . . . . . . . . . . . . . . . . . . . Current Portion of Long-Term Debt . . . . . . . . . . . . . . . . . . . . . . . Accrued Expenses . . . . . . . . . . . . . . . . . . . . . . . . . . . . . . . . . . . . . . . .
Other Current Liabilities . . . . . . . . . . . . . . . . . . . . . . . . . . . . . . . TOTAL CURRENT LIABILITIES . . . . . . . . . . . . . . . . . . . . . . . . . . . . . . . . .
LONG-TERM DEBT TOTAL OWING CURRENT PORTION Mortgages 10 , 558 , 928 , 4 7 7 79 , 4 8 7 , 325 Debentures & Bonds 2 , 884 , 2 98 , 8 0 5 1 , 055 , 3 4 8 , 4 98 Notes 3 , 2 83 , 784 , 456 4 6 3 , 252 , 959 Contracts 15 , 6 3 6 , 114 7 , 34 8 , 822 Other 9 , 224 , 2 93 , 0 93 8 0 , 5 3 1 , 235
TOTAL LONG-TERM DEBT 2 5 , 966 , 940 , 945 1 , 685 , 968 , 8 3 9 OTHER LIABILITIES . . . . . . . . . . . . . . . . . . . . . . . . . . . . . . . . . . . . . . . . . TOTAL LIABILITIES
CAPITAL Owners Capital Accounts . . . . . . . . . . . . . . . . . . . . . . . . . . . . . . . . .
Capital Stock & Other Capital . . . . . . . . . . . . . . . . . . . . . . . . . . . Retained Earnings . . . . . . . . . . . . . . . . . . . . . . . . . . . . . . . . . . . . . . .
TOTAL CAPITAL . . . . . . . . . . . . . . . . . . . . . . . . . . . . . . . . . . . . . . . . . . . . .
TOTAL LIABILITIES AND CAPITAL . . . . . . . . . . . . . . . . . . . . . . . . . . . . . .
Average Assets 4 8 5 , 734 , 665
Upper Quartile 3 95 , 8 8 5 , 84 9
Median 6 1 , 6 0 2 , 0 3 2
3 - 1
DOLLARS PERCENT 2 , 24 0 , 784 , 4 6 7
7 0 8 , 12 1 , 14 7 5 7 1 , 987 , 3 4 9
7 , 187 , 14 8 , 6 0 1 9 9 , 702 , 865
4 10 , 568 , 045 4 , 244 , 4 78 , 561
15 , 4 6 2 , 7 9 1 , 035
14 , 82 1 , 17 8 , 2 0 5 954 , 2 94 , 641
24 , 199 , 650 , 117 3 , 94 1 , 2 5 7 , 949
7 8 , 7 7 0 , 946 7 7 7 , 6 70 , 563
4 4 , 772 , 822 , 42 1
6 , 3 10 , 0 3 5 , 7 0 3
6 6 , 54 5 , 64 9 , 15 9
3 5 0 , 845 , 678 2 , 7 7 8 , 605 , 2 05 1 , 68 5 , 968 , 83 9 1 , 0 4 0 , 4 75 , 665 4 , 6 0 1 , 2 0 8 , 955
10 , 45 7 , 10 4 , 3 4 2
10 , 4 7 9 , 44 1 , 152 1 , 8 2 8 , 950 , 3 0 7 2 , 8 2 0 , 53 1 , 4 9 7
8 , 2 8 7 , 2 92 9 , 143 , 76 1 , 858
2 4 , 2 8 0 , 972 , 10 6 10 , 3 75 , 854 , 785 4 5 , 1 13 , 93 1 , 2 3 3
- 2 , 8 7 8 , 7 9 7 , 672 22 , 256 , 665 , 6 06
2 , 053 , 84 9 , 992 2 1 , 4 3 1 , 717 , 926
6 6 , 545, 64 9 , 159
Lower Quartile 14 , 24 5 , 4 5 3
3 . 4 %
1 . 1% 0 . 9%
10 . 8 % 0 . 1% 0 . 6 % 6 . 4 %
2 3 . 2 %
22 . 3 % 1 . 4 %
3 6 . 4 % 5 . 9% 0 . 1% 1 . 2 %
6 7 . 3 %
9 . 5 %
100 . 0 %
0 . 5 % 4 . 2 % 2 . 5 % 1 . 6 % 6 . 9%
15 . 7 %
15 . 7% 2 . 7 % 4 . 2 % 0 . 0 %
13 . 7 % 3 6 . 5 % 15 . 6 % 67 . 8 %
-4 . 3 % 3 3 . 4 %
3 . 1% 3 2 . 2 %
100 . 0 %

3 - 2 COMBINED INCOME STATEMENT - SUMMARY
Fiscal Year 2 0 13 Statewide Casinos with Rooms Facilities With Gaming Revenue of $ 1 , 0 0 0 , 0 0 0 and over
Amount s Represent 137 Locat ions .
REVENUE Gaming . . . . . . . . . . . . . . . . . . . . . . . . . . . . . . . . . . . . . . . . . . . . . . . . . . Rooms . . . . . . . . . . . . . . . . . . . . . . . . . . . . . . . . . . . . . . . . . . . . . . . . . . . Food . . . . . . . . . . . . . . . . . . . . . . . . . . . . . . . . . . . . . . . . . . . . . . . . . . . . Beverage . . . . . . . . . . . . . . . . . . . . . . . . . . . . . . . . . . . . . . . . . . . . . . . . Other . . . . . . . . . . . . . . . . . . . . . . . . . . . . . . . . . . . . . . . . . . . . . . . . . . .
TOTAL REVENUE . . . . . . . . . . . . . . . . . . . . . . . . . . . . . . . . . . . . . . . . . . . . .
COST OF SALES
GROSS MARGIN
DEPARTMENTAL EXPENSES . . . . . . . . . . . . . . . . . . . . . . . . . . . . . . . . . . . . .
DOLLARS 9 , 82 0 , 0 0 7 , 0 7 2 4 , 7 75 , 4 0 4 , 5 3 4 3 , 3 6 3 , 2 2 9 , 3 3 0 1 , 6 04 , 8 2 4 , 3 8 9 2 , 7 18 , 1 1 3 , 24 3
2 2 , 2 8 1 , 5 7 8 , 5 6 8
1 , 72 0 , 1 6 5 , 62 2
2 0 , 5 6 1 , 4 12 , 94 6
1 1 , 6 7 1 , 9 9 1 , 2 5 1
8 , 8 8 9 , 4 2 1 , 6 95 DEPARTMENTAL INCOME ( LOSS ) . . . . . . . . . . . . . . . . . . . . . . . . . · · · · · · · --������=
GENERAL AND ADMINISTRATIVE EXPENSES Adverti sing and Promotion . . . . . . . . . . . . . . . . . . . . . . . . . . . . . . . Bad Debt Expense . . . . . . . . . . . . . . . . . . . . . . . . . . . . . . . . . . . . . . . . Compl imentary Expense ( not reported in departments ) . . . . . . Depreciat ion - Buildings . . . . . . . . . . . . . . . . . . . . . . . . . . . . . . . . Depreciat ion and Amorti zation - Other . . . . . . . . . . . . . . . . . . . Energy Expense ( electricity, gas , etc . ) . . . . . . . . . . . . . . . . . Equipment Rental or Lease . . . . . . . . . . . . . . . . . . . . . . . . . . . . . . . Interest Expense . . . . . . . . . . . . . . . . . . . . . . . . . . . . . . . . . . . . . . . . Music and Entertainment . . . . . . . . . . . . . . . . . . . . . . . . . . . . . . . . . Payrol l Taxes . . . . . . . . . . . . . . . . . . . . . . . . . . . . . . . . . . . . . . . . . . . Payrol l - Employee Benefits . . . . . . . . . . . . . . . . . . . . . . . . . . . . . Payrol l - Officers . . . . . . . . . . . . . . . . . . . . . . . . . . . . . . . . . . . . . . Payrol l - Other Employees . . . . . . . . . . . . . . . . . . . . . . . . . . . . . . . Rent of Premises . . . . . . . . . . . . . . . . . . . . . . . . . . . . . . . . . . . . . . . . Taxes - Real Estate . . . . . . . . . . . . . . . . . . . . . . . . . . . . . . . . . . . . . Taxes and Licenses - Other . . . . . . . . . . . . . . . . . . . . . . . . . . . . . . Uti l ities (Other than Energy Expense ) . . . . . . . . . . . . . . . . . . . Other General and Admini strative Expenses . . . . . . . . . . . . . . .
TOTAL GENERAL AND ADMINISTRATIVE EXPENSES . . . . . . . . . . . . . . · · · �������=
NET INCOME ( LOSS ) BEFORE FEDERAL INCOME TAXES AND EXTRAORDINARY ITEMS . . . . . . . . . . . . . . . . . . . . . . . . . . . . . . . . . . . . - 1 , 4 16 I 8 3 9 I 72 6
Average Revenue 162 , 6 3 9 , 2 6 0
Upper Quartile 1 6 2 , 3 94 , 0 8 9
Median 6 3 , 0 2 4 , 0 3 3
Lower Quartile 18 , 0 6 7 , 4 5 6
PERCENT 44 . 1 % 2 1 . 4 % 15 . 1%
7 . 2 % 12 . 2 %
1 0 0 . 0 %
7 . 7 %
92 . 3 %
5 2 . 4 %
3 9 . 9%
- 6 . 4 %

COMBINED INCOME STATEMENT - DETAIL Fiscal Year 2 0 1 3 Statewide Casinos with Rooms Facilities With Gaming Revenue of $ 1 , 0 0 0 , 0 0 0 and over
Amounts Represent 137 Locations .
CASINO DEPARTMENT
REVENUE
Pit Revenue ( Includes Keno and Bingo) . . . . . . . . . . . . . . . . . . . Coin Operated Devices . . . . . . . . . . . . . . . . . . . . . . . . . . . . . . . . . . . Poker and Pan . . . . . . . . . . . . . . . . . . . . . . . . . . . . . . . . . . . . . . . . . . . Race Book . . . . . . . . . . . . . . . . . . . . . . . . . . . . . . . . . . . . . . . . . . . . . . . Sports Pool . . . . . . . . . . . . . . . . . . . . . . . . . . . . . . . . . . . . . . . . . . . . .
TOTAL REVENUE . . . . . . . . . . . . . . . . . . . . . . . . . . . . . . . . . . . . . . . . . . . . .
DEPARTMENTAL EXPENSES Bad Debt Expense . . . . . . . . . . . . . . . . . . . . . . . . . . . . . . . . . . . . . . . . Commissions . . . . . . . . . . . . . . . . . . . . . . . . . . . . . . . . . . . . . . . . . . . . . Complimentary Expense . . . . . . . . . . . . . . . . . . . . . . . . . . . . . . . . . . . Gaming Taxes and Licenses . . . . . . . . . . . . . . . . . . . . . . . . . . . . . . . Preferred Guest Expenses (no complimentaries ) . . . . . . . . . . . Payroll Taxes . . . . . . . . . . . . . . . . . . . . . . . . . . . . . . . . . . . . . . . . . . . Payrol l - Employee Benefits . . . . . . . . . . . . . . . . . . . . . . . . . . . . . Payroll - Officers . . . . . . . . . . . . . . . . . . . . . . . . . . . . . . . . . . . . . . Payroll - Other Employees . . . . . . . . . . . . . . . . . . . . . . . . . . . . . . . Race. Wire Fees . . . . . . . . . . . . . . . . . . . . . . . . . . . . . . . . . . . . . . . . . . Other Departmental Expenses . . . . . . . . . . . . . . . . . . . . . . . . . . . . .
TOTAL DEPARTMENTAL EXPENSES . . . . . . . . . . . . . . . . . . . . . . . . . . . . . . .
DEPARTMENTAL INCOME (LOSS ) . . . . . . . . . . . . . . . . . . . . . . . . . . . . . . . . .
ROOMS DEPARTMENT
REVENUE Room Sales . . . . . . . . . . . . . . . . . . . . . . . . . . . . . . . . . . . . . . . . . . . . . . Complimentary Rooms . . . . . . . . . . . . . . . . . . . . . . . . . . . . . . . . . . . . .
TOTAL REVENUE . . . . . . . . . . . . . . . . . . . . . . . . . . . . . . . . . . . . . . . . . . . . .
DEPARTMENTAL EXPENSES Bad Debt Expense . . . . . . . . . . . . . . . . . . . . . . . . . . . . . . . . . . . . . . . . Complimentary Expense . . . . . . . . . . . . . . . . . . . . . . . . . . . . . . . . . . . Payroll - Taxes . . . . . . . . . . . . . . . . . . . . . . . . . . . . . . . . . . . . . . . . . Payrol l - Employee Benefits . . . . . . . . . . . . . . . . . . . . . . . . . . . . . Payroll - Officers . . . . . . . . . . . . . . . . . . . . . . . . . . . . . . . . . . . . . . Payroll - Other Employees . . . . . . . . . . . . . . . . . . . . . . . . . . . . . . . Other Departmental Expenses . . . . . . . . . . . . . . . . . . . . . . . . . . . . .
TOTAL DEPARTMENTAL EXPENSES . . . . . . . . . . . . . . . . . . . . . . . . . . . . . . .
DEPARTMENTAL INCOME (LOSS ) . . . . . . . . . . . . . . . . . . . . . . . . . . . . . . . . .
DOLLARS 3 , 2 62 , 522 , 4 5 5 6 , 2 44 , 4 8 9 , 8 5 1
15 1 , 754 , 4 3 4 5 7 , 3 5 9 , 7 15
1 0 3 , 8 8 0 , 6 1 7 9 , 82 0 , 0 0 7 , 0 7 2
144 , 18 1 , 199 5 7 , 596 , 2 50
2 , 111 , 4 2 9 , 4 18 7 55 , 2 9 1 , 9 8 3 2 3 1 , 92 8 , 164 17 0 , 970 , 6 60 2 94 , 14 7 , 4 3 9
2 0 , 722 , 3 2 8 1 , 14 4 , 3 0 8 , 626
1 0 , 32 9 , 652 8 4 5 , 6 14 , 8 7 0
5 , 7 86 , 52 0 , 5 8 9
4 ! 03 3 , 4 86 , 4 8 3
DOLLARS 3 , 7 9 9 , 754 , 0 8 5
9 75 , 6 5 0 , 44 9 4 ! 7 75 ! 4 04 , 5 3 4
15 , 3 54 , 3 3 9 134 , 4 9 1 , 8 5 8
98 , 4 94 , 1 4 1 2 6 9 , 6 0 7 , 0 6 7
7 , 117 , 94 0 9 2 9 , 0 97 , 6 9 0 5 9 6 , 5 5 9 , 973
2 ! 05 0 , 723 , 0 0 8
2 ! 724 , 6 8 1 , 526
3 - 3
PERCENT 3 3 . 2 %-63 . 6%-
1 . 5%-0 . 6 %-1 . 1%-
100 . 0 %-
1 . 5 %-0 . 6 %-
2 1 . 5%-7 . 7%-2 . 4 %-1 . 7 %-3 . 0 %-0 . 2 %-
1 1 . 7%-0 . 1%-8 . 6%-
5 8 . 9%-
4 1 . 1%-
PERCENT 7 9 . 6%-2 0 . 4 %-
100 . 0 %-
0 . 3 %-2 . 8 %-2 . 0 %-5 . 6%-0 . 1%-
19 . 5 %-12 . 5%-4 2 . 9%-
57 . 1%-

3 - 4 COMBINED INCOME STATEMENT - DETAIL ( CONTINUED )
Fiscal Year 2 0 1 3 Statewide Cas inos with Rooms Faci lities With Gaming Revenue of $ 1 , 0 0 0 , 0 0 0 and over
Amounts Represent 1 3 7 Locations .
REVENUE Food Sales
FOOD DEPARTMENT
Complimentary Food Sales . . . . . . . . . . . . . . . . . . . . . . . . . . . . . . . . TOTAL REVENUE . . . . . . . . . . . . . . . . . . . . . . . . . . . . . . . . . . . . . . . . . . . . .
COST OF SALES
GROSS MARGIN
DEPARTMENTAL EXPENSES Bad Debt Expense . . . . . . . . . . . . . . . . . . . . . . . . . . . . . . . . . . . . . . . . Complimentary Expense . . . . . . . . . . . . . . . . . . . . . . . . . . . . . . . . . . . Payrol l - Taxes . . . . . . . . . . . . . . . . . . . . . . . . . . . . . . . . . . . . . . . . . Payrol l - Employee Benefits . . . . . . . . . . . . . . . . . . . . . . . . . . . . . Payrol l - Officers . . . . . . . . . . . . . . . . . . . . . . . . . . . . . . . . . . . . . . Payroll - Other Employees . . . . . . . . . . . . . . . . . . . . . . . . . . . . . . . Other Departmental Expenses . . . . . . . . . . . . . . . . . . . . . . . . . . . . .
TOTAL DEPARTMENTAL EXPENSES . . . . . . . . . . . . . . . . . . . . . . . . . . . . . . .
DEPARTMENTAL INCOME ( LOSS )
BEVERAGE DEPARTMENT REVENUE
Beverage Sales . . . . . . . . . . . . . . . . . . . . . . . . . . . . . . . . . . . . . . . . . . Complimentary Beverage Sales . . . . . . . . . . . . . . . . . . . . . . . . . . . .
TOTAL REVENUE . . . . . . . . . . . . . . . . . . . . . . . . . . . . . . . . . . . . . . . . . . . . .
COST OF SALES
DOLLARS 2 , 7 16 , 0 2 6 , 5 7 0
647 , 2 0 2 , 7 6 0 3 , 3 6 3 , 2 2 9 , 3 3 0
1 , 0 6 8 , 5 9 3 , 4 93
2 , 2 94 , 6 3 5 , 8 3 7
3 , 0 3 0 , 0 5 0 3 1 , 9 9 1 , 8 0 8
15 1 , 3 1 9 , 7 8 2 3 5 0 , 5 3 9 , 6 5 5
3 2 , 2 1 8 , 9 7 8 1 , 2 1 0 , 8 11 , 4 2 8
2 04 , 6 7 3 , 5 93 1 , 9 84 , 5 8 5 , 2 94
3 1 0 , 0 5 0 , 5 4 3
DOLLARS 9 91 , 0 3 6 , 6 2 7 6 13 , 78 7 , 762
1 , 6 04 , 82 4 , 3 8 9
3 0 7 , 94 9 , 0 5 3
GROSS MARGIN . . . . . . . . . . . . . . . . . . . . . . . . . . . . . . . . . . . . . . . . . . . . . . 1 , 2 9 6 , 8 75 , 3 3 6
DEPARTMENTAL EXPENSES Bad Debt Expense . . . . . . . . . . . . . . . . . . . . . . . . . . . . . . . . . . . . . . . . 4 17 , 4 7 8 Compl imentary Expense . . . . . . . . . . . . . . . . . . . . . . . . . . . . . . . . . . . 3 0 , 6 7 7 , 5 6 9 Payroll - Taxes . . . . . . . . . . . . . . . . . . . . . . . . . . . . . . . . . . . . . . . . . 3 9 , 8 2 3 , 7 2 3 Payroll - Employee Benefits . . . . . . . . . . . . . . . . . . . . . . . . . . . . . 8 7 , 3 6 1 , 9 3 0 Payroll - Off icers . . . . . . . . . . . . . . . . . . . . . . . . . . . . . . . . . . . . . . 1 , 7 2 1 , 5 92 Payroll - Other Employees . . . . . . . . . . . . . . . . . . . . . . . . . . . . . . . 2 7 9 , 715 , 6 4 0 Other Departmental Expenses . . . . . . . . . . . . . . . . . . . . . . . . . . . . . 2 4 6 , 64 0 , 54 9
TOTAL DEPARTMENTAL EXPENSES . . . . . . . . . . . . . . . . . . . . . . . . . . . . . . . 6 8 6 , 3 5 8 , 4 8 1
DEPARTMENTAL INCOME ( LOSS ) 6 1 0 , 5 1 6 , 8 5 5
PERCENT 8 0 . 8 % 1 9 . 2 %
1 0 0 . 0 %
3 1 . 8 %
6 8 . 2 %
0 . 1 % 1 . 0 % 4 . 5 %
1 0 . 4 % 1 . 0 %
3 6 . 0 % 6 . 1%
5 9 . 0 %
9 . 2 %
PERCENT 6 1 . 8 % 3 8 . 2 %
1 0 0 . 0 %
1 9 . 2 %
8 0 . 8 %
0 . 0 % 1 . 9 % 2 . 5 % 5 . 4 % 0 . 1%
1 7 . 4 % 15 . 4 % 4 2 . 8 %
3 8 . 0 %

COMBINED INCOME STATEMENT - DETAIL ( CONTINUED)
Fiscal Year 2 0 1 3 Statewide Casinos with Rooms Facilities With Gaming Revenue of $ 1 , 0 0 0 , 0 0 0 and over
Amounts Represent 13 7 Locations .
OTHER INCOME REVENUE
Other Operating and Non-operating Income . . . . . . . . . . . . . . . . Other Complimentary Items . . . . . . . . . . . . . . . . . . . . . . . . . . . . . . .
TOTAL REVENUE . . . . . . . . . . . . . . . . . . . . . . . . . . . . . . . . . . . . . . . . . . . . .
COST OF SALES . . . . . . . . . . . . . . . . . . . . . . . . . . . . . . . . . . . . . . . . . . . . .
GROSS MARGIN . . . . . . . . . . . . . . . . . . . . . . . . . . . . . . . . . . . . . . . . . . . . . .
DEPARTMENTAL EXPENSES Bad Debt Expense . . . . . . . . . . . . . . . . . . . . . . . . . . . . . . . . . . . . . . . . Complimentary Expense . . . . . . . . . . . . . . . . . . . . . . . . . . . . . . . . . . . Payroll - Taxes . . . . . . . . . . . . . . . . . . . . . . . . . . . . . . . . . . . . . . . . . Payroll - Employee Benefits . . . . . . . . . . . . . . . . . . . . . . . . . . . . . Payroll - Officers . . . . . . . . . . . . . . . . . . . . . . . . . . . . . . . . . . . . . . Payroll - Other Employees . . . . . . . . . . . . . . . . . . . . . . . . . . . . . . . Other Departmental Expenses . . . . . . . . . . . . . . . . . . . . . . . . . . . . .
TOTAL DEPARTMENTAL EXPENSES . . . . . . . . . . . . . . . . . . . . . . . . . . . . . . .
DEPARTMENTAL INCOME (LOSS ) . . . . . . . . . . . . . . . . . . . . . . . . . . . . . . . . .
AVERAGE NUMBER OF EMPLOYEES FOR THE YEAR
CASINO DEPARTMENT ROOMS DEPARTMENT . . . . . . . . . . . . . . . . . . . . . . FOOD DEPARTMENT . . . . . . . . . . . . . . . . . . . . . . . BEVERAGE DEPARTMENT . . . . . . . . . . . . . . . . . . . G & A DEPARTMENT . . . . . . . . . . . . . . . . . . . . . OTHER DEPARTMENTS . . . . . . . . . . . . . . . . . . . . .
TOTAL
DOLLARS 2 , 58 1 , 877 , 98 1
136 , 2 3 5 , 2 6 2 2 , 718 , 113 , 24 3
3 4 3 , 62 3 , 0 7 6
2 , 3 74 , 4 9 0 , 167
4 , 177 , 2 8 3 4 0 , 768 , 5 0 8 4 4 , 3 0 7 , 6 7 0 7 8 , 348 , 902
3 , 589 , 9 3 6 4 3 0 , 842 , 163 5 6 1 , 76 9 , 4 1 7
1 , 163 , 8 0 3 , 8 7 9
1 , 2 1 0 , 686 , 2 8 8
3 9 , 4 7 5 2 9 , 674 4 1 , 2 0 4 10 , 864 2 8 , 0 6 8 12 , 674
161 , 95 9
3 - 5
PERCENT 95 . 0 %
5 . 0 % 1 0 0 . 0 %
12 . 6 %
8 7 . 4 %
0 . 2 % 1 . 5 % 1 . 6 % 2 . 9% 0 . 1%
15 . 9% 2 0 . 7% 4 2 . 8 %
4 4 . 5%

3 - 6 ROOM OCCUPANCY AND PER ROOM PER DAY ANALYSIS
Fiscal Year 2 0 13 Statewide Casinos with Rooms Faci lities With Gaming Revenue of $ 1 , 0 0 0 , 0 0 0 and over
Amounts Represent 1 3 7 Locations .
RATE OF ROOM OCCUPANCY
MONTH JULY .. . . . . . . . . . AUGUST . . . . . . . . SEPTEMBER . . . . . OCTOBER . . . . . . . NOVEMBER . . . . . .
DECEMBER . . . . . . JANUARY . . . . . . . FEBRUARY . . . . . . MARCH . . . . . . . . . APRIL . . . . . . . . . MAY . . . . . . . . . . .
JUNE . . . . . . . . . .
TOTAL . . . . . . . . .
Average Pit Revenue Per Room Per Day
Average Slot Revenue Per Room Per Day
Average Food Sales Per Room Per Day
AVAILABLE ROOMS ROOMS OCCUPIED
4 , 4 2 6 , 634 3 , 844 , 13 7 4 , 4 0 2 , 92 0 3 , 6 8 4 , 7 1 1 4 , 2 7 6 , 3 64 3 , 6 3 2 , 0 8 6 4 , 4 0 1 , 6 6 9 3 , 7 6 9 , 0 6 5 4 , 2 18 , 72 3 3 , 2 3 1 , 8 8 7 4 , 3 3 6 , 13 3 3 , 1 9 7 , 9 7 8 4 , 3 9 7 , 4 7 0 3 , 3 6 7 , 5 3 6 3 , 9 7 2 , 8 5 9 3 , 24 7 , 622 4 , 44 5 , 4 7 8 3 , 8 3 8 , 7 9 3 4 , 2 7 9 , 6 9 7 3 , 6 6 1 , 4 7 9 4 , 3 9 7 , 984 3 , 7 3 9 , 4 4 2 4 , 2 7 6 , 952 3 , 742 , 73 4
5 1 , 8 3 2 , 8 8 3 4 2 , 957 , 4 7 0
PER ROOM PER DAY STATISTICS
7 5 . 95
1 4 5 . 3 6
7 8 . 2 9
Average Beverage Sales Per Room Per Day
Average Rooms Department Payroll Per Room Per Day
Average Room Rate Per Day
% OF OCCUPANCY
(COMPUTED ) 8 6 . 8 4 % 8 3 . 6 9 % 84 . 9 3 % 8 5 . 63 % 7 6 . 6 1 % 7 3 . 75 % 7 6 . 5 8 % 8 1 . 75% 8 6 . 3 5 % 8 5 . 5 5 % 8 5 . 0 3 % 8 7 . 51%
8 2 . 8 8 %
3 7 . 3 6
3 0 . 3 6
111 . 1 7

PER SQUARE FOOT ANALYSIS AND RATIOS Fiscal Year 2 0 1 3 Statewide Casinos with Rooms Facilities With Gaming Revenue of $ 1 , 0 0 0 , 0 0 0 and over
Amounts Represent 137 Locations .
GAMING REVENUE PER SQUARE FOOT OF FLOOR SPACE
3 - 7
NO . OF CASINOS AVERAGE AREA GAMING REVENUE AREA OPERATING IN SQUARE FEET PER
Pit ( Includes Bingo and Keno) 124 10 , 754 Coin Operated Devices 1 3 7 4 1 , 4 0 1 Poker and Pan 7 7 2 , 152 Race and Sports 65 5 , 2 3 9
TOTAL CASINO 13 7 54 , 8 3 0
RATIOS
TOTAL CURRENT ASSETS TO TOTAL CURRENT LIABILITIES . . . . . . . . .
TOTAL CAPITAL TO TOTAL LIABILITIES . . . . . . . . . . . . . . . . . . . . . . . .
TOTAL CAPITAL TO TOTAL CURRENT LIABILITIES . . . . . . . . . . . . . . . .
TOTAL CURRENT LIABILITIES TO TOTAL LIABILITIES . . . . . . . . . . . .
TOTAL COMPLIMENTARY EXPENSE TO GAMING REVENUE . . . . . . . . . . . . .
MUSIC AND ENTERTAINMENT EXPENSES TO GAMING REVENUE . . . . . . . .
TOTAL REVENUE TO AVERAGE TOTAL ASSETS . . . . . . . . . . . . . . . . . . . . .
TOTAL REVENUE LESS COMP SALES TO AVERAGE TOTAL ASSETS . . . . .
RETURN ON INVESTED CAPITAL* . . . . . . . . . . . . . . . . . . . . . . . . . . . . . . .
RETURN ON AVERAGE ASSETS* . . . . . . . . . . . . . . . . . . . . . . . . . . . . . . . . .
* - FORMULAS
Return on Invested Capital is equal to the total of net income (before federal income taxes and extraordinary items ) and interest expense divided by the total of average total assets less average current liabilities .
SQUARE FOOT
2 , 4 3 9 1 , 1 0 1
912 4 7 1
1 , 3 0 7
PERCENT 147 . 9%
4 7 . 5%
2 0 4 . 9%
2 3 . 2 %
25 . 8 %
3 . 1%
3 1 . 0 %
2 7 . 7%
2 . 8 %
2 . 1%
Return on Average Assets i s equal to the total of net income (before federal income taxes and extraordinary items ) and interest expense divided by the average total assets .

3 - 8
THIS PAGE LEFT INTENTIONALLY BLANK

COMBINED BALANCE SHEET Fiscal Year 2 0 1 3 Statewide Casinos with Rooms Faci lities With Gaming Revenue of $1 , 0 0 0 , 0 0 0 to $12 , 0 0 0 , 0 0 0
Amounts Represent 34 Locations .
ASSETS CURRENT ASSETS
Cash . . . . . . . . . . . . . . . . . . . . . . . . . . . . . . . . . . . . . . . . . . . . . . . . . . . .
Receivables TOTAL ALLOWANCE Casino 4 08 , 4 6 9 15 9 , 382 Trade 1 , 8 8 0 , 515 1 6 1 , 3 94 Sundry 6 , 0 8 1 , 3 3 7 6 , 5 0 0 Notes 2 , 0 8 7 , 0 3 1 10 , 0 0 0
Prepaid Expenses . . . . . . . . . . . . . . . . . . . . . . . . . . . . . . . . . . . . . . . .
Other Current Assets . . . . . . . . . . . . . . . . . . . . . . . . . . . . . . . . . . . .
TOTAL CURRENT ASSETS . . . . . . . . . . . . . . . . . . . . . . . . . . . . . . . . . . . . . .
FIXED ASSETS COST DEPRECIATION Land 55 , 7 3 7 , 156 . . . . . . . . . . .
Land Improvements 11 , 2 3 4 , 972 8 , 135 , 2 0 1 Buildings & Improvements 1 3 8 , 2 55 , 524 7 7 , 5 6 7 , 0 11 Furniture & Equipment 13 7 , 3 9 8 , 102 98 , 822 , 7 0 1 Lease Improvements 8 , 584 , 4 8 6 6 , 4 3 5 , 7 2 7 Construction i n Progress 6 , 645 , 512 . . . . . . . . . . .
TOTAL FIXED ASSETS . . . . . . . . . . . . . . . . . . . . . . . . . . . . . . . . . . . . . . . .
OTHER ASSETS
TOTAL ASSETS
LIABILITIES AND CAPITAL CURRENT LIABILITIES
Accounts Payable - Trade . . . . . . . . . . . . . . . . . . . . . . . . . . . . . . . . Accounts Payable - Other . . . . . . . . . . . . . . . . . . . . . . . . . . . . . . . . Current Portion of Long-Term Debt . . . . . . . . . . . . . . . . . . . . . . . Accrued Expenses . . . . . . . . . . . . . . . . . . . . . . . . . . . . . . . . . . . . . . . . Other Current Liabilities . . . . . . . . . . . . . . . . . . . . . . . . . . . . . . .
TOTAL CURRENT LIABILITIES . . . . . . . . . . . . . . . . . . . . . . . . . . . . . . . . .
LONG-TERM DEBT TOTAL OWING CURRENT PORTION Mortgages 2 9 , 0 97 , 3 8 9 9 0 9 , 6 4 9 Debentures & Bonds 0 0 Notes 2 6 , 9 7 1 , 115 608 , 142 Contracts 3 , 3 8 3 , 14 8 1 , 0 5 7 , 645 Other 1 1 , 762 , 2 91 62 0 , 4 2 7
TOTAL LONG-TERM DEBT 7 1 , 2 13 , 94 3 3 , 195 , 863 OTHER LIABILITIES . . . . . . . . . . . . . . . . . . . . . . . . . . . . . . . . . . . . . . . . .
TOTAL LIABILITIES
CAPITAL Owners Capital Accounts . . . . . . . . . . . . . . . . . . . . . . . . . . . . . . . . . Capital Stock & Other Capital . . . . . . . . . . . . . . . . . . . . . . . . . . . Retained Earnings . . . . . . . . . . . . . . . . . . . . . . . . . . . . . . . . . . . . . . .
TOTAL CAPITAL . . . . . . . . . . . . . . . . . . . . . . . . . . . . . . . . . . . . . . . . . . . . .
TOTAL LIABILITIES AND CAPITAL . . . . . . . . . . . . . . . . . . . . . . . . . . . . . .
Average Assets 7 , 7 9 8 , 453
Upper Quartile 13 , 6 8 0 , 775
Median 4 , 883 , 182
3 - 9
DOLLARS PERCENT 54 , 24 1 , 7 8 1
24 9 , 0 8 7 1 , 7 19 , 1 2 1 6 , 0 74 , 8 3 7 2 , 0 7 7 , 0 3 1 6 , 3 96 , 4 4 3
10 , 5 6 1 , 3 4 5 8 1 , 3 1 9 , 645
55 , 7 3 7 , 156 3 , 0 99 , 7 7 1
6 0 , 6 8 8 , 513 3 8 , 575 , 4 0 1
2 , 14 8 , 7 5 9 6 , 64 5 , 5 12
166 , 8 9 5 , 112
16 , 9 3 2 , 655
2 65 , 14 7 , 4 12
9 , 14 7 , 7 5 9 - 4 , 0 1 0 , 050
3 , 195 , 8 63 14 , 13 0 , 4 3 1 8 0 , 114 , 966
102 , 5 7 8 , 969
2 8 , 18 7 , 74 0 0
2 6 , 3 6 2 , 973 2 , 3 2 5 , 5 03
1 1 , 14 1 , 864 6 8 , 0 1 8 , 0 8 0
2 , 0 6 0 , 4 82 172 , 65 7 , 5 3 1
1 19 , 059 , 7 54 74 , 74 9 , 7 6 8
- 10 1 , 3 19 , 64 1 92 , 4 8 9 , 8 8 1
2 6 5 , 14 7 , 412
Lower Quartile 2 , 4 5 7 , 064
2 0 . 5 %
0 . 1% 0 . 6% 2 . 3 % 0 . 8 % 2 . 4 % 4 . 0 %
3 0 . 7 %
2 1 . 0 % 1 . 2 %
22 . 9% 14 . 5 %
0 . 8 % 2 . 5%
62 . 9 %
6 . 4 %
1 0 0 . 0 %
3 . 5% - 1 . 5 %
1 . 2 % 5 . 3 %
3 0 . 2 % 3 8 . 7 %
10 . 6 % 0 . 0 % 9 . 9% 0 . 9% 4 . 2 %
25 . 7 % 0 . 8 %
65 . H
4 4 . 9% 28 . 2 %
- 3 8 . 2 % 34 . 9%
100 . 0 %

3 - 1 0 COMBINED INCOME STATEMENT - SUMMARY
Fiscal Year 2 0 13 Statewide Casinos with Rooms Faci lities With Gaming Revenue of $ 1 , 0 0 0 , 0 0 0 to $12 , 0 0 0 , 0 0 0
Amount s Represent 3 4 Locations .
REVENUE DOLLARS Gaming . . . . . . . . . . . . . . . . . . . . . . . . . . . . . . . . . . . . . . . . . . . . . . . . . . 17 8 , 3 0 9 , 382 Rooms . . . . . . . . . . . . . . . . . . . . . . . . . . . . . . . . . . . . . . . . . . . . . . . . . . . 64 , 8 13 , 4 2 1 Food . . . . . . . . . . . . . . . . . . . . . . . . . . . . . . . . . . . . . . . . . . . . . . . . . . . . 5 0 , 4 4 3 , 4 1 9 Beverage . . . . . . . . . . . . . . . . . . . . . . . . . . . . . . . . . . . . . . . . . . . . . . . . 24 , 5 0 2 , 526 Other . . . . . . . . . . . . . . . . . . . . . . . . . . . . . . . . . . . . . . . . . . . . . . . . . . . 2 2 , 644 , 933
3 4 0 , 7 13 , 6 8 1 TOTAL REVENUE . . . . . . . . . . . . . . . . . . . . . . . . . . . . . . . . . . . . . . . . . . . . . __ .;:;...;:...;:...<......:....=::=...!.....::....::. .=
COST OF SALES 45 , 5 6 1 , 578
GROSS MARGIN 2 95 , 152 , 10 3
DEPARTMENTAL EXPENSES . . . . . . . . . . . . . . . . . . . . . . . . . . . . . . . . . . . . . 16 9 , 6 6 7 , 674
DEPARTMENTAL INCOME ( LOSS ) 12 5 , 4 8 4 , 4 2 9 • • • • • • • • • • • • • • • • • • • • • • • • • • • • • • • • __ ...:;;;..;::....o....<.....;;..�-'-"'=-=-
GENERAL AND ADMINISTRATIVE EXPENSES Advert ising and Promotion . . . . . . . . . . . . . . . . . . . . . . . . . . . . . . . 5 , 8 95 , 282 Bad Debt Expense . . . . . . . . . . . . . . . . . . . . . . . . . . . . . . . . . . . . . . . . 2 0 3 , 8 9 0 Compl imentary Expense ( not reported i n departments ) . . . . . . 5 , 6 8 1 , 176 Depreciation - Buildings . . . . . . . . . . . . . . . . . . . . . . . . . . . . . . . . 6 , 14 5 , 744 Depreciation and Amorti zation - Other . . . . . . . . . . . . . . . . . . . 9 , 2 1 6 , 718 Energy Expense ( electricity, gas , etc . ) . . . . . . . . . . . . . . . . . 10 , 8 0 3 , 622 Equipment Rental or Lease . . . . . . . . . . . . . . . . . . . . . . . . . . . . . . . 2 0 4 , 0 8 9 Interest Expense . . . . . . . . . . . . . . . . . . . . . . . . . . . . . . . . . . . . . . . . 5 , 2 2 5 , 112 Music and Entertainment . . . . . . . . . . . . . . . . . . . . . . . . . . . . . . . . . 74 8 , 4 9 7 Payrol l Taxes . . . . . . . . . . . . . . . . . . . . . . . . . . . . . . . . . . . . . . . . . . . 2 , 8 6 6 , 5 58 Payrol l - Employee Benefits . . . . . . . . . . . . . . . . . . . . . . . . . . . . . 4 , 0 64 , 2 5 6 Payrol l - Officers . . . . . . . . . . . . . . . . . . . . . . . . . . . . . . . . . . . . . . 2 , 0 8 3 , 8 3 9 Payroll - Other Employees . . . . . . . . . . . . . . . . . . . . . . . . . . . . . . . 2 5 , 4 6 9 , 587 Rent of Premises . . . . . . . . . . . . . . . . . . . . . . . . . . . . . . . . . . . . . . . . 6 , 968 , 015 Taxes - Real Estate . . . . . . . . . . . . . . . . . . . . . . . . . . . . . . . . . . . . . 2 , 5 3 3 , 6 5 0 Taxes and Licenses - Other . . . . . . . . . . . . . . . . . . . . . . . . . . . . . . 1 , 105 , 422 Ut i l ities (Other than Energy Expense ) . . . . . . . . . . . . . . . . . . . 2 , 8 73 , 8 0 1 Other General and Administrative Expenses . . . . . . . . . . . . . . . 3 3 , 953 , 2 35
12 6 , 04 2 , 4 9 3 TOTAL GENERAL AND ADMINISTRATIVE EXPENSES . . . . . . . . . . . . . . . . · --���:::....!...��
NET INCOME ( LOSS ) BEFORE FEDERAL INCOME TAXES AND EXTRAORDINARY ITEMS . . . . . . . . . . . . . . . . . . . . . . . . . . . . . . . . . . . .
Average Revenue 10 , 02 0 , 991
Upper Quarti le 13 , 1 93 , 2 3 1
Median 8 , 8 9 0 , 0 0 9
- 5 5 8 , 0 64
Lower Quartile 5 , 4 2 5 , 931
PERCENT 52 . 3 % 19 . 0 % 14 . 8 %
7 . 2 % 6 . 6 %
1 0 0 . 0 %
13 . 4 %
8 6 . 6 %
4 9 . 8 %
3 6 . 8 %
1 . 7% 0 . 1% 1 . 7 % 1 . 8 % 2 . 7 % 3 . 2 % 0 . 1% 1 . 5 % 0 . 2 % 0 . 8 % 1 . 2 % 0 . 6 % 7 . 5 % 2 . 0 % 0 . 7 % 0 . 3 % 0 . 8 %
10 . 0 % 3 7 . 0 %
- 0 . 2 %

COMBINED INCOME STATEMENT - DETAIL 3 - 11 Fiscal Year 2 0 1 3 Statewide Casinos with Rooms Facilities With Gaming Revenue of $1 , 0 0 0 , 0 0 0 to $12 , 0 0 0 , 0 0 0
Amounts Represent 34 Locations .
CASINO DEPARTMENT
REVENUE DOLLARS PERCENT Pit Revenue ( Includes Keno and Bingo ) . . . . . . . . . . . . . . . . . . . 13 , 9 93 , 7 6 8 7 . 8 % Coin Operated Devices . . . . . . . . . . . . . . . . . . . . . . . . . . . . . . . . . . . 16 3 , 3 7 8 , 3 4 5 91 . 6% Poker and Pan . . . . . . . . . . . . . . . . . . . . . . . . . . . . . . . . . . . . . . . . . . . 113 , 112 0 . 1% Race Book . . . . . . . . . . . . . . . . . . . . . . . . . . . . . . . . . . . . . . . . . . . . . . . 163 , 5 14 0 . 1% Sports Pool . . . . . . . . . . . . . . . . . . . . . . . . . . . . . . . . . . . . . . . . . . . . . 66 0 , 6 4 3 0 . 4 %
TOTAL REVENUE . . . . . . . . . . . . . . . . . . . . . . . . . . . . . . . . . . . . . . . . . . . . . 178 , 3 0 9 , 3 8 2 100 . 0 %
DEPARTMENTAL EXPENSES Bad Debt Expense . . . . . . . . . . . . . . . . . . . . . . . . . . . . . . . . . . . . . . . . 112 , 24 8 0 . 1% Commissions . . . . . . . . . . . . . . . . . . . . . . . . . . . . . . . . . . . . . . . . . . . . . 5 , 132 , 6 94 2 . 9% Complimentary Expense . . . . . . . . . . . . . . . . . . . . . . . . . . . . . . . . . . . 2 3 , 3 3 7 , 4 1 7 13 . 1% Gaming Taxes and Licenses . . . . . . . . . . . . . . . . . . . . . . . . . . . . . . . 14 , 72 8 , 6 5 1 8 . 3 % Preferred Guest Expenses (no complimentaries ) . . . . . . . . . . . 4 2 2 , 622 0 . 2 % Payrol l Taxes . . . . . . . . . . . . . . . . . . . . . . . . . . . . . . . . . . . . . . . . . . . 3 , 17 7 , 3 7 4 1 . 8 % Payrol l - Employee Benefits . . . . . . . . . . . . . . . . . . . . . . . . . . . . . 2 , 3 1 8 , 3 8 4 1 . 3 % Payrol l - Officers . . . . . . . . . . . . . . . . . . . . . . . . . . . . . . . . . . . . . . 52 5 , 22 9 0 . 3 % Payrol l - Other Employees . . . . . . . . . . . . . . . . . . . . . . . . . . . . . . . 2 3 , 892 , 8 4 8 13 . 4 % Race Wire Fees . . . . . . . . . . . . . . . . . . . . . . . . . . . . . . . . . . . . . . . . . . 6 3 6 , 704 0 . 4 % Other Departmental Expenses . . . . . . . . . . . . . . . . . . . . . . . . . . . . . 14 , 6 8 1 , 0 6 0 8 . 2 %
TOTAL DEPARTMENTAL EXPENSES . . . . . . . . . . . . . . . . . . . . . . . . . . . . . . . 8 8 , 965 , 2 3 1 4 9 . 9%
DEPARTMENTAL INCOME (LOSS ) . . . . . . . . . . . . . . . . . . . . . . . . . . . . . . . . . 8 9 , 344 , 151 50 . 1%
ROOMS DEPARTMENT
REVENUE DOLLARS PERCENT Room Sales . . . . . . . . . . . . . . . . . . . . . . . . . . . . . . . . . . . . . . . . . . . . . . 60 , 14 3 , 5 19 92 . 8 % Complimentary Rooms . . . . . . . . . . . . . . . . . . . . . . . . . . . . . . . . . . . . . 4 , 6 6 9 , 902 7 . 2 %
TOTAL REVENUE . . . . . . . . . . . . . . . . . . . . . . . . . . . . . . . . . . . . . . . . . . . . . 64 , 8 13 , 42 1 100 . 0 %
DEPARTMENTAL EXPENSES Bad Debt Expense . . . . . . . . . . . . . . . . . . . . . . . . . . . . . . . . . . . . . . . . 10 8 , 663 0 . 2 % Complimentary Expense . . . . . . . . . . . . . . . . . . . . . . . . . . . . . .
. · . . . . 6 0 3 , 7 0 9 0 . 9%
Payrol l - Taxes . . . . . . . . . . . . . . . . . . . . . . . . . . . . . . . . . . . . . . . . . 1 , 863 , 065 2 . 8 % Payrol l - Employee Benefits . . . . . . . . . . . . . . . . . . . . . . . . . . . . . 1 , 7 7 2 , 6 8 6 2 . 7 % Payroll - Officers . . . . . . . . . . . . . . . . . . . . . . . . . . . . . . . . . . . . . . 0 0 . 0 % Payroll - Other Employees . . . . . . . . . . . . . . . . . . . . . . . . . . . . . . . 15 , 76 1 , 2 0 6 2 4 . 3 % Other Departmental Expenses . . . . . . . . . . . . . . . . . . . . . . . . . . . . . 11 , 8 6 7 , 1 0 0 18 . 3 %
TOTAL DEPARTMENTAL EXPENSES . . . . . . . . . . . . . . . . . . . . . . . . . . . . . . . 3 1 , 976 , 4 2 9 4 9 . 3 %
DEPARTMENTAL INCOME (LOSS ) . . . . . . . . . . . . . . . . . . . . . . . . . . . . . . . . . 3 2 , 8 3 6 , 992 s o . 7 %

3 - 12 COMBINED INCOME STATEMENT - DETAIL ( CONTINUED)
Fi s cal Year 2 0 1 3 Statewide Casinos with Rooms Facilities With Gaming Revenue of $ 1 , 0 0 0 , 0 0 0 to $ 12 , 0 0 0 , 0 0 0
Amounts Represent 3 4 Locations .
FOOD DEPARTMENT REVENUE DOLLARS PERCENT
Food Sales 4 1 , 4 5 8 , 9 5 6 8 2 . 2 % Complimentary Food Sales . . . . . . . . . . . . . . . . . . . . . . . . . . . . . . . . 8 , 984 , 4 6 3 1 7 . 8 %
TOTAL REVENUE . . . . . . . . . . . . . . . . . . . . . . . . . . . . . . . . . . . . . . . . . . . . . 5 0 , 44 3 , 4 19 1 0 0 . 0 %
COST OF SALES 2 4 , 0 5 0 , 8 1 9 4 7 . 7 %
GROSS MARGIN 2 6 , 3 92 , 6 0 0 5 2 . 3 %
DEPARTMENTAL EXPENSES Bad Debt Expense . . . . . . . . . . . . . . . . . . . . . . . . . . . . . . . . . . . . . . . . 0 0 . 0 % Compl imentary Expense . . . . . . . . . . . . . . . . . . . . . . . . . . . . . . . . . . . 4 3 4 , 4 9 5 0 . 9 % Payroll - Taxes . . . . . . . . . . . . . . . . . . . . . . . . . . . . . . . . . . . . . . . . . 3 , 172 , 2 4 7 6 . 3 % Payrol l - Employee Benefits . . . . . . . . . . . . . . . . . . . . . . . . . . . . . 2 , 3 1 1 , 8 4 5 4 . 6% Payrol l - Officers . . . . . . . . . . . . . . . . . . . . . . . . . . . . . . . . . . . . . . 0 0 . 0 % Payroll - Other Employees . . . . . . . . . . . . . . . . . . . . . . . . . . . . . . . 2 4 , 4 54 , 113 4 8 . 5 % Other Departmental Expenses . . . . . . . . . . . . . . . . . . . . . . . . . . . . . 4 , 3 9 1 , 1 6 1 8 . 7%
TOTAL DEPARTMENTAL EXPENSES . . . . . . . . . . . . . . . . . . . . . . . . . . . . . . . 3 4 , 7 6 3 , 8 6 1 6 8 . 9%
DEPARTMENTAL INCOME ( LOSS ) . . . . . . . . . . . . . . . . . . . . . . . . . . . . . . . . . - 8 , 3 7 1 , 2 6 1 - 16 . 6 %
BEVERAGE DEPARTMENT REVENUE DOLLARS PERCENT
Beverage Sales . . . . . . . . . . . . . . . . . . . . . . . . . . . . . . . . . . . . . . . . . . 8 , 0 7 5 , 9 2 3 3 3 . 0 % Complimentary Beverage Sales . . . . . . . . . . . . . . . . . . . . . . . . . . . . 16 , 4 2 6 , 6 0 3 6 7 . 0 %
TOTAL REVENUE . . . . . . . . . . . . . . . . . . . . . . . . . . . . . . . . . . . . . . . . . . . . . 2 4 , 5 0 2 , 5 2 6 1 0 0 . 0 %
COST OF SALES 8 , 2 4 6 , 2 8 6 3 3 . 7 %
GROS S MARGIN . . . . . . . . . . . . . . . . . . . . . . . . . . . . . . . . . . . . . . . . . . . . . . 1 6 , 2 5 6 , 2 4 0 6 6 . 3 %
DEPARTMENTAL EXPENSES Bad Debt Expense . . . . . . . . . . . . . . . . . . . . . . . . . . . . . . . . . . . . . . . . 0 0 . 0 % Complimentary Expense . . . . . . . . . . . . . . . . . . . . . . . . . . . . . . . . . . . 14 9 , 9 8 1 0 . 6 % Payroll - Taxes . . . . . . . . . . . . . . . . . . . . . . . . . . . . . . . . . . . . . . . . . 754 , 5 93 3 . 1% Payroll - Employee Benefits . . . . . . . . . . . . . . . . . . . . . . . . . . . . . 7 7 3 , 744 3 . 2 % Payrol l - Officers . . . . . . . . . . . . . . . . . . . . . . . . . . . . . . . . . . . . . . 0 0 . 0 % Payroll - Other Employees . . . . . . . . . . . . . . . . . . . . . . . . . . . . . . . 4 , 94 3 , 2 6 1 2 0 . 2 % Other Departmental Expenses . . . . . . . . . . . . . . . . . . . . . . . . . . . . . 1 , 1 7 7 , 5 5 5 4 . 8 %
TOTAL DEPARTMENTAL EXPENSES . . . . . . . . . . . . . . . . . . . . . . . . . . . . . . . 7 , 7 9 9 , 1 3 4 3 1 . 8 %
DEPARTMENTAL INCOME ( LOSS ) . . . . . . . . . . . . . . . . . . . . . . . . . . . . . . . . . 8 , 4 5 7 , 1 0 6 3 4 . 5 %

COMBINED INCOME STATEMENT - DETAIL ( CONTINUED)
Fiscal Year 2 0 1 3 Statewide Casinos with Rooms Facilities With Gaming Revenue of $1 , 0 0 0 , 0 0 0 to $ 12 , 0 0 0 , 0 0 0
Amounts Represent 34 Locations .
OTHER INCOME REVENUE
Other Operating and Non-operating Income . . . . . . . . . . . . . . . . Other Complimentary Items . . . . . . . . . . . . . . . . . . . . . . . . . . . . . . .
TOTAL REVENUE . . . . . . . . . . . . . . . . . . . . . . . . . . . . . . . . . . . . . . . . . . . . .
COST OF SALES . . . . . . . . . . . . . . . . . . . . . . . . . . . . . . . . . . . . . . . . . . . . .
GROSS MARGIN . . . . . . . . . . . . . . . . . . . . . . . . . . . . . . . . . . . . . . . . . . . . . .
DEPARTMENTAL EXPENSES Bad Debt Expense . . . . . . . . . . . . . . . . . . . . . . . . . . . . . . . . . . . . . . . .
Complimentary Expense . . . . . . . . . . . . . . . . . . . . . . . . . . . . . . . . . . .
Payroll - Taxes . . . . . . . . . . . . . . . . . . . . . . . . . . . . . . . . . . . . . . . . .
Payroll - Employee Benefits . . . . . . . . . . . . . . . . . . . . . . . . . . . . . Payroll - Officers . . . . . . . . . . . . . . . . . . . . . . . . . . . . . . . . . . . . . . Payroll - Other Employees . . . . . . . . . . . . . . . . . . . . . . . . . . . . . . . Other Departmental Expenses . . . . . . . . . . . . . . . . . . . . . . . . . . . . .
TOTAL DEPARTMENTAL EXPENSES . . . . . . . . . . . . . . . . . . . . . . . . . . . . . . .
DEPARTMENTAL INCOME (LOSS ) . . . . . . . . . . . . . . . . . . . . . . . . . . . . . . . . .
AVERAGE NUMBER OF EMPLOYEES FOR THE YEAR
CASINO DEPARTMENT ROOMS DEPARTMENT . . . . . . . . . . . . . . . . . . . . . .
FOOD DEPARTMENT . . . . . . . . . . . . . . . . . . . . . . . BEVERAGE DEPARTMENT . . . . . . . . . . . . . . . . . . . G & A DEPARTMENT . . . . . . . . . . . . . . . . . . . . .
OTHER DEPARTMENTS . . . . . . . . . . . . . . . . . . . . .
TOTAL
DOLLARS 2 1 , 9 6 6 , 9 8 0
6 7 7 , 953 2 2 , 644 , 93 3
13 , 2 64 , 4 7 3
9 , 3 8 0 , 4 6 0
3 5 , 4 1 0 153 , 5 53 4 4 3 , 24 7 3 3 2 , 6 9 0
0 3 , 3 3 2 , 3 2 7 1 , 865 , 792 6 , 163 , 0 19
3 , 2 1 7 , 44 1
1 , 191 716
1 , 2 94 3 4 5 8 0 7 172
4 , 525
3 - 13
PERCENT 97 . 0 %
3 . 0 % 1 0 0 . 0 %
58 . 6%
4 1 . 4 %
0 . 2 % 0 . 7 % 2 . 0 % 1 . 5 % 0 . 0 %
14 . 7% 8 . 2 %
2 7 . 2 %
14 . 2 %

3 - 14 ROOM OCCUPANCY AND PER ROOM PER DAY ANALYSIS
Fiscal Year 2 0 1 3 Statewide Casinos with Rooms Facilities With Gaming Revenue of $ 1 , 0 0 0 , 0 0 0 to $ 12 , 0 0 0 , 0 0 0
Amounts Represent 3 4 Locations .
RATE OF ROOM OCCUPANCY
MONTH JULY . . . . . . . . . . AUGUST . . . . . . . .
SEPTEMBER . . . . .
OCTOBER . . . . . . . NOVEMBER . . . . . . DECEMBER . . . . . . JANUARY . . . . . . . FEBRUARY . . . . . .
MARCH . . . . . . . . . APRIL . . . . . . . . .
MAY . . . . . . . . . . . JUNE . . . . . . . . . .
TOTAL . . . . . . . . .
Average Pit Revenue Per Room Per Day
Average Slot Revenue Per Room Per Day
Average Food Sales Per Room Per Day
AVAILABLE ROOMS ROOMS OCCUPIED 1 6 0 , 6 2 6 9 3 , 1 3 1 1 6 0 , 1 5 1 94 , 8 62 1 5 7 , 2 3 6 94 , 7 4 3 1 6 1 , 3 0 9 9 0 , 1 2 6 15 5 , 92 7 72 , 6 11 1 6 1 , 8 9 0 6 9 , 752 162 , 3 8 4 75 , 3 7 7 144 , 3 44 74 , 0 9 8 1 5 9 , 7 0 3 8 8 , 5 5 9 155 , 0 0 7 8 1 , 8 3 3 1 4 6 , 97 0 84 , 8 9 1 142 , 0 7 5 8 7 , 8 6 7
1 , 8 6 7 , 6 2 2 1 , 0 0 7 , 8 5 0
PER ROOM PER DAY STATISTICS
1 3 . 8 8
1 6 2 . 1 1
5 0 . 0 5
Average Beverage Sales Per Room Per Day
Average Rooms Department Payroll Per Room Per Day
Average Room Rate Per Day
% OF OCCUPANCY
(COMPUTED) 5 7 . 9 8 % 5 9 . 2 3 % 6 0 . 2 6 % 5 5 . 8 7 % 4 6 . 5 7 % 4 3 . 0 9 % 4 6 . 4 2 % 5 1 . 3 3 % 55 . 4 5 % 52 . 7 9 % 5 7 . 7 6 % 6 1 . 8 5 %
5 3 . 9 6 %
24 . 3 1
19 . 2 5
64 . 3 1

PER SQUARE FOOT ANALYSIS AND RATIOS 3 - 15 Fiscal Year 2 0 13 Statewide Casinos with Rooms Facilities With Gaming Revenue of $1 , 0 0 0 , 0 0 0 to $ 12 , 0 0 0 , 0 0 0
Amounts Represent 34 Locations .
GAMING REVENUE PER SQUARE FOOT OF FLOOR SPACE
NO . OF CASINOS AVERAGE AREA GAMING REVENUE AREA OPERATING IN SQUARE FEET PER SQUARE FOOT
Pit ( Includes Bingo and Keno) 2 3 1 , 84 5 Coin Operated Devices 3 4 1 1 , 3 2 8 Poker and Pan 5 2 2 1 Race and Sports 3 7 3 3
TOTAL CASINO 3 4 12 , 6 7 3
RATIOS
TOTAL CURRENT ASSETS TO TOTAL CURRENT LIABILITIES . . . . . . . . .
TOTAL CAPITAL TO TOTAL LIABILITIES . . . . . . . . . . . . . . . . . . . . . . . .
TOTAL CAPITAL TO TOTAL CURRENT LIABILITIES . . . . . . . . . . . . . . . .
TOTAL CURRENT LIABILITIES TO TOTAL LIABILITIES . . . . . . . . . . . .
TOTAL COMPLIMENTARY EXPENSE TO GAMING REVENUE . . . . . . . . . . . . .
MUSIC AND ENTERTAINMENT EXPENSES TO GAMING REVENUE . . . . . . . .
TOTAL REVENUE TO AVERAGE TOTAL ASSETS . . . . . . . . . . . . . . . . . . . . .
TOTAL REVENUE LESS COMP SALES TO AVERAGE TOTAL ASSETS . . . . .
RETURN ON INVESTED CAPITAL* . . . . . . . . . . . . . . . . . . . . . . . . . . . . . . .
RETURN ON AVERAGE ASSETS* . . . . . . . . . . . . . . . . . . . . . . . . . . . . . . . . .
* - FORMULAS
Return on Invested Capital is equal to the total of net income (before federal income taxes and extraordinary items ) and interest expense divided by the total of average total assets less average current liabilities .
PERCENT 7 9 . 3 %
53 . 6%
9 0 . 2 %
59 . 4 %
1 7 . 0%
0 . 4 %
129 . 2 %
117 . 5%
4 . 0%
1 . 8 %
Return on Average Assets is equal to the total of net income (before federal income taxes and extraordinary items ) and interest expense divided by the average total assets .
3 2 8 4 2 4 102 3 7 5
4 14

3 - 1 6
THIS PAGE LEFT INTENTIONALLY BLANK

COMBINED BALANCE SHEET Fi scal Year 2 0 13 Statewide Casinos with Rooms Facilities With Gaming Revenue of $ 12 , 0 0 0 , 0 0 0 to $ 3 6 , 0 0 0 , 0 0 0
Amounts Represent 3 3 Locations .
ASSETS CURRENT ASSETS
Cash . . . . . . . . . . . . . . . . . . . . . . . . . . . . . . . . . . . . . . . . . . . . . • . . . . . .
Receivables TOTAL ALLOWANCE Cas ino 7 , 64 9 , 4 0 7 1 , 94 2 , 675 Trade 18 , 87 1 , 3 5 8 1 , 115 , 22 7 Sundry 2 2 , 717 , 951 0 Notes 616 , 726 o
Prepaid Expenses . . . . . . . . . . . . . . . . . . . . . . . . . . . . . . . . . . . . . . . .
Other Current Assets . . . . . . . . . . . . . . . . . . . . . . . . . . . . . . . . . . . .
TOTAL CURRENT ASSETS . . . . . . . . . . . . . . . . . . . . . . . . . . . . . . . . . . . . . .
FIXED ASSETS COST DEPRECIATION Land 4 12 , 5 6 0 , 3 8 8 . . . . . . . . . . .
Land Improvements 4 3 , 8 3 4 , 5 4 8 5 , 225 , 964 Buildings & Improvements 742 , 13 9 , 590 2 2 9 , 93 6 , 113 Furniture & Equipment 4 8 0 , 85 9 , 0 7 0 3 64 , 3 5 0 , 5 3 1 Lease Improvements 4 0 , 6 92 , 3 5 6 15 , 194 , 511 Construction in Progress 4 5 , 2 3 3 , 92 1 . . . . . . . . . . .
TOTAL FIXED ASSETS . . . . . . . . . . . . . . . . . . . . . . . . . . . . . . . . . . . . . . . .
OTHER ASSETS
TOTAL ASSETS
LIABILITIES AND CAPITAL CURRENT LIABILITIES
Accounts Payable - Trade . . . . . . . . . . . . . . . . . . . . . . . . . . . . . . . .
Accounts Payable - Other . . . . . . . . . . . . . . . . . . . . . . . . . . . . . . . .
Current Portion of Long-Term Debt . . . . . . . . . . . . . . . . . . . . . . .
Accrued Expenses . . . . . . . . . . . . . . . . . . . . . . . . . . . . . . . . . . . . . . . .
Other Current Liabilities . . . . . . . . . . . . . . . . . . . . . . . . . . . . . . .
TOTAL CURRENT LIABILITIES . . . . . . . . . . . . . . . . . . . . . . . . . . . . . . . . .
LONG-TERM DEBT Mortgages Debentures & Bonds Notes Contracts Other
TOTAL LONG-TERM DEBT OTHER LIABILITIES TOTAL LIABILITIES
CAPITAL
TOTAL OWING 3 2 , 2 95 , 126
105 , 3 6 8 , 2 4 1 3 96 , 115 , 0 64
1 , 94 9 , 554 2 19 , 6 6 3 , 3 0 6 7 55 , 3 9 1 , 2 9 1
CURRENT PORTION 3 2 , 193 , 8 66 7 9 , 642 , 8 14 9 1 , 8 6 0 , 856
1 , 4 8 5 , 973 1 , 0 2 1 , 3 62
2 0 6 , 2 04 , 8 7 1
Owners Capital Accounts . . . . . . . . . . . . . . . . . . . . . . . . . . . . . . . . .
Capital Stock & Other Capital . . . . . . . . . . . . . . . . . . . . . . . . . . . Retained Earnings . . . . . . . . . . . . . . . . . . . . . . . . . . . . . . . . . . . . . . .
TOTAL CAPITAL . . . . . . . . . . . . . . . . . . . . . . . . . . . . . . . . . . . . . . . . . . . . .
TOTAL LIABILITIES AND CAPITAL . . . . . . . . . . . . . . . . . . . . . . . . . . . . . .
Average Assets 50 , 152 , 4 8 1
Upper Quarti le 5 9 , 52 5 , 0 0 3
Median 28 , 70 1 , 0 0 9
3 - 17
DOLLARS PERCENT 185 , 5 73 , 3 2 6
5 , 7 0 6 , 7 3 2 1 7 , 756 , 13 1 2 2 , 717 , 951
616 , 726 3 3 , 256 , 2 0 3 6 7 , 3 15 , 8 6 6
3 3 2 , 942 , 93 5
4 12 , 5 6 0 , 3 8 8 3 8 , 6 0 8 , 584
5 12 , 2 03 , 4 7 7 116 , 50 8 , 53 9
2 5 , 4 9 7 , 8 4 5 4 5 , 2 3 3 , 92 1
1 , 150 , 612 , 754
17 1 , 4 7 6 , 179
1 , 655 , 03 1 ! 8 6 8
3 0 , 2 0 2 , 2 1 9 - 118 , 2 12 , 013
2 0 6 , 2 0 4 , 8 7 1 6 9 , 553 , 925
- 2 1 , 3 7 6 , 3 7 4 166 , 3 7 2 , 628
101 , 2 6 0 2 5 , 725 , 42 7
3 0 4 , 254 , 2 08 4 6 3 , 5 8 1
2 18 , 64 1 , 944 5 4 9 , 186 , 42 0
4 5 , 63 0 , 1 8 0 7 6 1 , 18 9 ! 2 2 8
2 8 1 , 3 2 8 , 213 7 78 , 663 , 758
- 16 6 , 14 9 , 3 3 1 893 , 84 2 , 64 0
1 , 655 , 0 3 1 , 8 6 8
Lower Quartile 18 , 2 0 7 , 798
11 . 2 %
0 . 3 % l . l!!r
1 . 4 % 0 . 0 % 2 . 0 % 4 . l!!r
2 0 . l!!r
2 4 . 9%-2 . 3 %-
3 0 . 9%-7 . 0 %-1 . 5 %-2 . 7%-
69 . 5 %-
10 . 4 %-
100 . 0 %-
1 . 8 %-- 7 . 1%-12 . 5%-
4 . 2 %-- 1 . 3 %-10 . 1%-
0 . 0 %-1 . 6 %-
18 . 4 %-0 . 0 %-
13 . 2 %-3 3 . 2 %-
2 . 8 %-4 6 . 0 %-
17 . 0 %-4 7 . 0 %-
- 1 0 . 0 %-54 . 0 %-
100 . 0 %

3 - 1 8 COMBINED INCOME STATEMENT - SUMMARY
Fiscal Year 2 0 13 Statewide Casinos with Rooms Facilities With Gaming Revenue of $ 12 , 0 0 0 , 0 0 0 to $ 3 6 , 0 0 0 , 0 0 0
Amounts Represent 3 3 Locations .
REVENUE DOLLARS Gaming . . . . . . . . . . . . . . . . . . . . . . . . . . . . . . . . . . . . . . . . . . . . . . . . . . 7 8 1 , 14 8 , 1 7 1 Rooms . . . . . . . . . . . . . . . . . . . . . . . . . . . . . . . . . . . . . . . . . . . . . . . . . . . 2 13 , 0 64 , 8 5 0 Food . . . . . . . . . . . . . . . . . . . . . . . . . . . . . . . . . . . . . . . . . . . . . . . . . . . . 1 75 , 1 6 0 , 958 Beverage . . . . . . . . . . . . . . . . . . . . . . . . . . . . . . . . . . . . . . . . . . . . . . . . 1 0 8 , 6 7 5 , 132 Other . . . . . . . . . . . . . . . . . . . . . . . . . . . . . . . . . . . . . . . . . . . . . . . . . . . 12 1 , 152 , 154
1 , 3 99 , 2 0 1 , 2 6 5 TOTAL REVENUE . . . . . . . . . . . . . . . . . . . . . . . . . . . . . . . . . . . . . . . · · · · · ·
--
�������
COST OF SALES 1 6 1 , 3 9 5 , 0 9 0
GROSS MARGIN 1 , 2 3 7 , 8 0 6 , 1 7 5
DEPARTMENTAL EXPENSES . . . . . . . . . . . . . . . . . . . . . . . . . . . . . . . . . . . . . 7 2 0 , 8 8 3 , 4 3 6
5 16 , 9 2 2 , 7 3 9 DEPARTMENTAL INCOME ( LOSS ) . . . . . . . . . . . . . . . . . . . . . . . . . . . . · · · ·
----
������
GENERAL AND ADMINISTRATIVE EXPENSES Advertising and Promotion . . . . . . . . . . . . . . . . . . . . . . . . . . . . . . . 4 5 , 972 , 2 5 6 Bad Debt Expense . . . . . . . . . . . . . . . . . . . . . . . . . . . . . . . . . . . . . . . . 15 1 , 0 2 0 Complimentary Expense (not reported in departments ) . . . . . . 4 0 , 6 14 , 6 1 3 Depreciation - Buildings . . . . . . . . . . . . . . . . . . . . . . . . . . . . . . . . 2 6 , 8 3 9 , 7 6 9 Depreciation and Amorti zation - Other . . . . . . . . . . . . . . . . . . . 7 6 , 8 8 6 , 3 2 8 Energy Expense ( electricity , gas , etc . ) . . . . . . . . . . . . . . . . . 3 6 , 7 9 6 , 3 6 9 Equipment Rental or Lease . . . . . . . . . . . . . . . . . . . . . . . . . . . . . . . 1 , 9 0 2 , 2 7 8 Interest Expense . . . . . . . . . . . . . . . . . . . . . . . . . . . . . . . . . . . . . . . . 8 0 , 9 3 2 , 4 7 5 Music and Entertainment . . . . . . . . . . . . . . . . . . . . . . . . . . . . . . . . . 5 , 8 8 6 , 9 4 3 Payrol l Taxes . . . . . . . . . . . . . . . . . . . . . . . . . . . . . . . . . . . . . . . . . . . 1 1 , 3 5 9 , 9 7 3 Payrol l - Employee Benefits . . . . . . . . . . . . . . . . . . . . . . . . . . . . . 2 6 , 2 94 , 7 6 9 Payrol l - Officers . . . . . . . . . . . . . . . . . . . . . . . . . . . . . . . . . . . . . . 11 , 9 6 3 , 8 3 3 Payrol l - Other Employees . . . . . . . . . . . . . . . . . . . . . . . . . . . . . . . 1 0 3 , 64 4 , 743 Rent of Premises . . . . . . . . . . . . . . . . . . . . . . . . . . . . . . . . . . . . . . . . 2 1 , 67 7 , 2 7 3 Taxes - Real Estate . . . . . . . . . . . . . . . . . . . . . . . . . . . . . . . . . . . . . 8 , 84 5 , 2 2 4 Taxes and Licenses - Other . . . . . . . . . . . . . . . . . . . . . . . . . . . . . . 4 , 3 0 1 , 4 7 9 Uti l ities (Other than Energy Expense ) . . . . . . . . . . . . . . . . . . . 12 , 8 3 2 , 6 1 1 Other General and Administrative Expenses . . . . . . . . . . . . . . . 8 9 , 99 7 , 4 0 9
6 0 6 , 8 9 9 , 3 6 5 TOTAL GENERAL AND ADMINISTRATIVE EXPENSES . . . . . . . . . . . . . · · · ·
----
������
NET INCOME ( LOSS ) BEFORE FEDERAL INCOME TAXES AND EXTRAORDINARY ITEMS . . . . . . . . . . . . . . . . . . . . . . . . . . . . . . . . . . . .
Average Revenue 4 2 , 4 0 0 , 0 3 8
Upper Quartile 5 1 , 3 5 8 , 6 8 8
Median 44 , 2 92 , 5 6 6
- 8 9 , 9 7 6 , 6 2 6
Lower Quartile 2 9 , 7 6 3 , 4 12
PERCENT 55 . 8 % 15 . 2 % 12 . 5 %
7 . 8 % 8 . 7 %
1 0 0 . 0 %
11 . 5%
8 8 . 5 %
5 1 . 5 %
3 6 . 9%
3 . 3 % 0 . 0 % 2 . 9% 1 . 9% 5 . 5 % 2 . 6 % 0 . 1% 5 . 8 % 0 . 4 % 0 . 8 % 1 . 9 % 0 . 9% 7 . 4 % 1 . 5 % 0 . 6 % 0 . 3 % 0 . 9% 6 . 4 %
4 3 . 4 %
- 6 . 4 %

COMBINED INCOME STATEMENT - DETAIL Fiscal Year 2 0 13 Statewide Casinos with Rooms Facilities With Gaming Revenue of $ 12 , 0 0 0 , 0 0 0 to $36 , 0 0 0 , 0 0 0
Amounts Represent 3 3 Locations .
CASINO DEPARTMENT
REVENUE Pit Revenue ( Includes Keno and Bingo) . . . . . . . . . . . . . . . . . . .
Coin Operated Devices . . . . . . . . . . . . . . . . . . . . . . . . . . . . . . . . . . .
Poker and Pan . . . . . . . . . . . . . . . . . . . . . . . . . . . . . . . . . . . . . . . . . . .
Race Book . . . . . . . . . . . . . . . . . . . . . . . . . . . . . . . . . . . . . . . . . . . . . . .
Sports Pool . . . . . . . . . . . . . . . . . . . . . . . . . . . . . . . . . . . . . . . . . . . . . TOTAL REVENUE . . . . . . . . . . . . . . . . . . . . . . . . . . . . . . . . . . . . . . . . . . . . .
DEPARTMENTAL EXPENSES Bad Debt Expense . . . . . . . . . . . . . . . . . . . . . . . . . . . . . . . . . . . . . . . .
Commissions . . . . . . . . . . . . . . . . . . . . . . . . . . . . . . . . . . . . . . . . . . . . .
Complimentary Expense . . . . . . . . . . . . . . . . . . . . . . . . . . . . . . . . . . .
Gaming Taxes and Licenses . . . . . . . . . . . . . . . . . . . . . . . . . . . . . . .
Preferred Guest Expenses (no complimentaries ) . . . . . . . . . . .
Payrol l Taxes . . . . . . . . . . . . . . . . . . . . . . . . . . . . . . . . . . . . . . . . . . .
Payrol l - Employee Benefits . . . . . . . . . . . . . . . . . . . . . . . . . . . . .
Payrol l - Officers . . . . . . . . . . . . . . . . . . . . . . . . . . . . . . . . . . . . . . Payroll - Other Employees . . . . . . . . . . . . . . . . . . . . . . . . . . . . . . .
Race Wire Fees . . . . . . . . . . . . . . . . . . . . . . . . . . . . . . . . . . . . . . . . . .
Other Departmental Expenses . . . . . . . . . . . . . . . . . . . . . . . . . . . . .
TOTAL DEPARTMENTAL EXPENSES . . . . . . . . . . . . . . . . . . . . . . . . . . . . . . .
DEPARTMENTAL INCOME (LOS S ) . . . . . . . . . . . . . . . . . . . . . . . . . . . . . . . . .
ROOMS DEPARTMENT
REVENUE Room Sales . . . . . . . . . . . . . . . . . . . . . . . . . . . . . . . . . . . . . . . . . . . . . .
Complimentary Rooms . . . . . . . . . . . . . . . . . . . . . . . . . . . . . . . . . . . . . TOTAL REVENUE . . . . . . . . . . . . . . . . . . . . . . . . . . . . . . . . . . . . . . . . . . . . .
DEPARTMENTAL EXPENSES Bad Debt Expense . . . . . . . . . . . . . . . . . . . . . . . . . . . . . . . . . . . . . . . .
Complimentary Expense . . . . . . . . . . . . . . . . . . . . . . . . . . . . . . . . . . .
Payrol l - Taxes . . . . . . . . . . . . . . . . . . . . . . . . . . . . . . . . . . . . . . . . .
Payrol l - Employee Benefits . . . . . . . . . . . . . . . . . . . . . . . . . . . . . Payroll - Officers . . . . . . . . . . . . . . . . . . . . . . . . . . . . . . . . . . . . . . Payroll - Other Employees . . . . . . . . . . . . . . . . . . . . . . . . . . . . . . . Other Departmental Expenses . . . . . . . . . . . . . . . . . . . . . . . . . . . . .
TOTAL DEPARTMENTAL EXPENSES . . . . . . . . . . . . . . . . . . . . . . . . . . . . . . .
DEPARTMENTAL INCOME (LOSS ) . . . . . . . . . . . . . . . . . . . . . . . . . . . . . . . . .
DOLLARS 118 , 5 7 3 , 985 65 1 , 0 6 1 , 94 8
6 , 8 9 8 , 244 1 , 93 5 , 2 9 8 2 , 6 7 8 , 6 9 6
7 8 1 , 14 8 , 1 7 1
1 , 342 , 0 9 9 10 , 2 3 0 , 52 7
13 1 , 4 9 0 , 187 65 , 522 , 3 0 3
3 , 0 3 2 , 0 3 3 14 , 2 7 6 , 0 3 3 18 , 2 3 2 , 6 0 1
1 , 895 , 9 3 1 10 0 , 0 6 9 , 4 8 5
1 , 2 95 , 672 59 , 14 9 , 284
4 0 6 , 53 6 , 155
3 74 , 612 , 0 1 6
DOLLARS 163 , 4 14 , 44 9
4 9 , 65 0 , 4 0 1 2 13 , 064 , 8 5 0
1 , 0 3 8 , 0 1 9 3 , 12 8 , 344 6 , 64 6 , 852
12 , 8 0 1 , 2 6 7 7 0 8 , 1 2 1
5 8 , 4 8 2 , 9 9 7 3 6 , 174 , 556
1 18 , 98 0 , 156
94 , 0 84 , 6 94
3 - 19
PERCENT 15 . 2 % 83 . 3 %
0 . 9% 0 . 2 % 0 . 3 %
100 . 0 %
0 . 2 % 1 . 3 %
16 . 8 % 8 . 4 % 0 . 4 % 1 . 8 % 2 . 3 % 0 . 2 %
12 . 8 % 0 . 2 % 7 . 6 %
52 . 0 %
4 8 . 0 %
PERCENT 76 . 7% 2 3 . 3 %
1 0 0 . 0 %
0 . 5 % 1 . 5 % 3 . 1% 6 . 0 % 0 . 3 %
2 7 . 4 % 17 . 0 % 55 . 8 %
44 . 2 %

3 - 2 0 COMBINED INCOME STATEMENT - DETAIL ( CONTINUED)
Fiscal Year 2 0 13 Statewide Casinos with Rooms Facilities With Gaming Revenue of $ 12 , 0 0 0 , 0 0 0 to $ 3 6 , 0 0 0 , 0 0 0
Amounts Represent 3 3 Locations .
FOOD DEPARTMENT REVENUE DOLLARS PERCENT
Food Sales . . . . . . . . . . . . . . . . . . . . . . . . . . . . . . . . . . . . . . . . . . . . . . 12 9 , 6 0 3 , 6 1 0 74 . 0 % Complimentary Food Sales . . . . . . . . . . . . . . . . . . . . . . . . . . . . . . . . 4 5 , 5 5 7 , 3 4 8 2 6 . 0 %
TOTAL REVENUE . . . . . . . . . . . . . . . . . . . . . . . . . . . . . . . . . . . . . . . . . . . . . 1 7 5 , 1 6 0 , 9 5 8 1 0 0 . 0 %
COST OF SALES 8 0 , 4 7 0 , 2 98 4 5 . 9 %
GROSS MARGIN 94 , 6 9 0 , 6 6 0 54 . 1%
DEPARTMENTAL EXPENSES Bad Debt Expense . . . . . . . . . . . . . . . . . . . . . . . . . . . . . . . . . . . . . . . . 14 , 5 8 6 0 . 0 % Compl imentary Expense . . . . . . . . . . . . . . . . . . . . . . . . . . . . . . . . . . . 2 , 2 4 9 , 0 1 8 1 . 3 % Payroll - Taxes . . . . . . . . . . . . . . . . . . . . . . . . . . . . . . . . . . . . . . . . . 9 , 7 7 9 , 8 9 0 5 . 6 % Payroll - Employee Benefits . . . . . . . . . . . . . . . . . . . . . . . . . . . . . 1 3 , 94 3 , 5 3 3 8 . 0 % Payrol l - Officers . . . . . . . . . . . . . . . . . . . . . . . . . . . . . . . . . . . . . . 3 , 5 8 2 , 0 6 2 2 . 0 % Payroll - Other Employees . . . . . . . . . . . . . . . . . . . . . . . . . . . . . . . 7 4 , 8 5 0 , 8 7 9 4 2 . 7% Other Departmental Expenses . . . . . . . . . . . . . . . . . . . . . . . . . . . . . 14 , 16 3 , 9 3 7 8 . 1%
TOTAL DEPARTMENTAL EXPENSES . . . . . . . . . . . . . . . . . . . . . . . . . . . . . . . 118 , 5 8 3 , 905 6 7 . 7 %
DEPARTMENTAL INCOME ( LOSS) . . . . . . . . . . . . . . . . . . . . . . . . . . . . . . . . . - 2 3 , 8 93 , 2 4 5 - 1 3 . 6 %
BEVERAGE DEPARTMENT REVENUE DOLLARS PERCENT
Beverage Sales . . . . . . . . . . . . . . . . . . . . . . . . . . . . . . . . . . . . . . . . . . 4 2 , 5 6 3 , 0 8 1 3 9 . 2 % Complimentary Beverage Sales . . . . . . . . . . . . . . . . . . . . . . . . . . . . 6 6 , 112 , 0 5 1 6 0 . 8 %
TOTAL REVENUE . . . . . . . . . . . . . . . . . . . . . . . . . . . . . . . . . . . . . . . . . . . . . 1 0 8 , 6 7 5 , 132 1 0 0 . 0 %
COST OF SALES 3 0 , 2 3 1 , 5 9 7 2 7 . 8 %
GROSS MARGIN . . . . . . . . . . . . . . . . . . . . . . . . . . . . . . . . . . . . . . . . . . . . . . 7 8 , 4 4 3 , 5 3 5 72 . 2 %
DEPARTMENTAL EXPENSES Bad Debt Expense . . . . . . . . . . . . . . . . . . . . . . . . . . . . . . . . . . . . . . . . 6 6 7 0 . 0 % Complimentary Expense . . . . . . . . . . . . . . . . . . . . . . . . . . . . . . . . . . . 2 4 1 , 172 0 . 2 % Payroll - Taxes . . . . . . . . . . . . . . . . . . . . . . . . . . . . . . . . . . . . . . . . . 3 , 2 8 7 , 2 44 3 . 0 % Payroll - Employee Benefits . . . . . . . . . . . . . . . . . . . . . . . . . . . . . 6 , 12 0 , 8 3 2 5 . 6 % Payroll - Officers . . . . . . . . . . . . . . . . . . . . . . . . . . . . . . . . . . . . . . 6 0 0 , 4 3 7 0 . 6 % Payroll - Other Employees . . . . . . . . . . . . . . . . . . . . . . . . . . . . . . . 2 0 , 6 1 7 , 5 6 8 1 9 . 0 % Other Departmental Expenses . . . . . . . . . . . . . . . . . . . . . . . . . . . . . 6 , 7 7 2 , 5 18 6 . 2 %
TOTAL DEPARTMENTAL EXPENSES . . . . . . . . . . . . . . . . . . . . . . . . . . . . . . . 3 7 , 64 0 , 4 3 8 3 4 . 6 %
DEPARTMENTAL INCOME (LOSS ) . . . . . . . . . . . . . . . . . . . . . . . . . . . . . . . . . 4 0 , 8 0 3 , 0 9 7 3 7 . 5 %

COMBINED INCOME STATEMENT - DETAIL ( CONTINUED )
Fiscal Year 2013 Statewide Casinos with Rooms Facilities With Gaming Revenue of $12 , 0 0 0 , 0 0 0 to $ 3 6 , 0 0 0 , 0 0 0
Amounts Represent 3 3 Locations .
OTHER INCOME REVENUE
Other Operating and Non-operating Income . . . . . . . . . . . . . . . .
Other Complimentary Items . . . . . . . . . . . . . . . . . . . . . . . . . . . . . . . TOTAL REVENUE . . . . . . . . . . . . . . . . . . . . . . . . . . . . . . . . . . . . . . . . . . . . .
COST OF SALES . . . . . . . . . . . . . . . . . . . . . . . . . . . . . . . . . . . . . . . . . . . . .
GROSS MARGIN . . . . . . . . . . . . . . . . . . . . . . . . . . . . . . . . . . . . . . . . . . . . . .
DEPARTMENTAL EXPENSES Bad Debt Expense . . . . . . . . . . . . . . . . . . . . . . . . . . . . . . . . . . . . . . . .
Complimentary Expense . . . . . . . . . . . . . . . . . . . . . . . . . . . . . . . . . . .
Payroll - Taxes . . . . . . . . . . . . . . . . . . . . . . . . . . . . . . . . . . . . . . . . .
Payroll - Employee Benefits . . . . . . . . . . . . . . . . . . . . . . . . . . . . .
Payroll - Officers . . . . . . . . . . . . . . . . . . . . . . . . . . . . . . . . . . . . . .
Payroll - Other Employees . . . . . . . . . . . . . . . . . . . . . . . . . . . . . . .
Other Departmental Expenses . . . . . . . . . . . . . . . . . . . . . . . . . . . . .
TOTAL DEPARTMENTAL EXPENSES . . . . . . . . . . . . . . . . . . . . . . . . . . . . . . .
DEPARTMENTAL INCOME (LOSS ) . . . . . . . . . . . . . . . . . . . . . . . . . . . . . . . . .
AVERAGE NUMBER OF EMPLOYEES FOR THE YEAR
CASINO DEPARTMENT . . . . . . . . . . . . . . . . . . . . .
ROOMS DEPARTMENT . . . . . . . . . . . . . . . . . . . . . .
FOOD DEPARTMENT . . . . . . . . . . . . . . . . . . . . . . .
BEVERAGE DEPARTMENT . . . . . . . . . . . . . . . . . . .
G & A DEPARTMENT . . . . . . . . . . . . . . . . . . . . . OTHER DEPARTMENTS . . . . . . . . . . . . . . . . . . . . .
TOTAL . . . . . . . . . . . . . . . . . . . . . . . . . . . . . . . . .
DOLLARS 109 , 18 5 , 8 8 0
1 1 , 9 6 6 , 274 121 , 152 , 154
50 , 69 3 , 195
70 , 4 5 8 , 959
10 , 14 6 1 , 612 , 7 5 0 2 , 0 9 3 , 908 2 , 584 , 3 0 4
68 8 , 6 94 16 , 54 3 , 013 15 , 6 0 9 , 967 3 9 , 142 , 782
3 1 , 3 1 6 , 177
4 , 4 3 0 2 , 578 4 , 115 1 , 2 7 5 3 , 2 8 1
8 1 9
16 , 4 9 8
3 -2 1
PERCENT 9 0 . 1%
9 . 9 %' 100 . 0 %'
4 1 . 8 %'
5 8 . 2 %'
0 . 0 %' 1 . 3 %' 1 . 7%'
2 . 1%' 0 . 6%'
13 . 7%'
12 . 9%' 32 . 3 %'
2 5 . 8 %'

3 - 2 2 ROOM OCCUPANCY AND PER ROOM PER DAY ANALYSIS
Fiscal Year 2 0 1 3 Statewide Casinos with Rooms Facil ities With Gaming Revenue of $ 12 , 0 0 0 , 0 0 0 to $ 3 6 , 0 0 0 , 0 0 0
Amounts Represent 3 3 Locat ions .
MONTH JVLY . . . . . . . . . . AUGUST . . . . . . . . SEPTEMBER . . . . . OCTOBER . . . . . . . NOVEMBER . . . . . . DECEMBER . . . . . . JANUARY . . . . . . .
FEBRUARY . . . . . . MARCH . . . . . . . . .
APRIL . . . . . . . . . MAY . . . . . . . . . . . JUNE . . . . . . . . . .
TOTAL . . . . . . . . .
Average Pit Revenue Per Room Per Day
Average Slot Revenue Per Room Per Day
Average Food Sales Per Room Per Day
RATE OF ROOM OCCUPANCY
AVAILABLE ROOMS ROOMS OCCUPIED 5 8 6 , 3 6 7 4 10 , 7 2 7 5 8 4 , 04 5 3 8 4 , 0 92 5 5 3 , 142 3 72 , 9 8 8 5 7 1 , 4 1 1 3 64 , 952 5 3 9 , 6 6 9 2 9 9 , 0 6 9 5 2 5 , 6 8 2 2 8 3 , 0 1 6 5 7 0 , 774 2 9 1 , 0 9 5 5 0 3 , 7 5 8 3 02 , 3 4 2 5 6 5 , 9 7 0 3 6 9 , 0 8 8 5 4 7 , 34 0 3 4 9 , 3 9 1 5 5 8 , 12 1 3 4 6 , 9 6 6 54 1 , 5 7 3 3 6 3 , 4 0 9
6 , 64 7 , 8 5 2 4 , 1 3 7 , 1 3 5
PER ROOM PER DAY STATISTICS
2 8 . 6 6
1 5 7 . 3 7
4 2 . 3 4
Average Beverage Sales Per Room Per Day
Average Rooms Department Payrol l Per Room Per Day
Average Room Rate Per Day
% OF OCCUPANCY
( COMPUTED ) 7 0 . 0 5 % 6 5 . 7 6 % 6 7 . 4 3 % 63 . 8 7 % 55 . 4 2 % 5 3 . 84 % 5 1 . 0 0 % 6 0 . 0 2 % 6 5 . 2 1 % 6 3 . 8 3 % 62 . 1 7 % 6 7 . 1 0 %
6 2 . 2 3 %
2 6 . 2 7
19 . 0 1
51 . 5 0

PER SQUARE FOOT ANALYSIS AND RATIOS 3 - 2 3 Fiscal Year 2 0 1 3 Statewide Casinos with Rooms Facilities With Gaming Revenue of $12 , 0 0 0 , 0 0 0 to $3 6 , 0 0 0 , 0 0 0
Amounts Represent 3 3 Locations .
GAMING REVENUE PER SQUARE FOOT OF FLOOR SPACE
NO . OF CASINOS AVERAGE AREA GAMING REVENUE AREA OPERATING IN SQUARE FEET PER SQUARE FOOT
Pit ( Includes Bingo and Keno) 3 1 6 , 5 9 1 Coin Operated Devices 3 3 2 9 , 04 3 Poker and Pan 2 1 934 Race and Sports 7 1 , 3 2 9
TOTAL CASINO 3 3 3 6 , 111
RATIOS
TOTAL CURRENT ASSETS TO TOTAL CURRENT LIABILITIES . . . . . . . . .
TOTAL CAPITAL TO TOTAL LIABILITIES . . . . . . . . . . . . . . . . . . . . . . . .
TOTAL CAPITAL TO TOTAL CURRENT LIABILITIES . . . . . . . . . . . . . . . .
TOTAL CURRENT LIABILITIES TO TOTAL LIABILITIES . . . . . . . . . . . .
TOTAL COMPLIMENTARY EXPENSE TO GAMING REVENUE . . . . . . . . . . . . .
MUSIC AND ENTERTAINMENT EXPENSES TO GAMING REVENUE . . . . . . . .
TOTAL REVENUE TO AVERAGE TOTAL ASSETS . . . . . . . . . . . . . . . . . . . . .
TOTAL REVENUE LESS COMP SALES TO AVERAGE TOTAL ASSETS . . . . .
RETURN ON INVESTED CAPITAL* . . . . . . . . . . . . . . . . . . . . . . . . . . . . . . .
RETURN ON AVERAGE ASSETS* . . . . . . . . . . . . . . . . . . . . . . . . . . . . . . . . .
* - FORMULAS
Return on Invested Capital is equal to the total of net income (before federal income taxes and extraordinary items ) and interest
expense divided by the total of average total assets less average current liabilities .
PERCENT 2 0 0 . 1%
117 . 4 %-
5 3 7 . 3 %-
2 1 . 9%
2 3 . 0 %-
0 . 8%
8 5 . 9%
75 . 2 %
- 0 . 7%
- 0 . 6%
Return on Average Assets is equal to the total of net income (before federal income taxes and extraordinary items ) and interest expense divided by the average total assets .
5 3 3 6 7 9 3 2 3 4 64
656

3 - 2 4
THIS PAGE LEFT INTENTIONALLY BLANK

COMBINED BALANCE SHEET Fiscal Year 2 0 1 3 Statewide Casinos with Rooms Facilities With Gaming Revenue of $ 3 6 , 0 0 0 , 0 0 0 to $72 , 0 0 0 , 0 0 0
Amounts Represent 3 0 Locations .
ASSETS CURRENT ASSETS
Cash . . . . . . . . . . . . . . . . . . . . . . . . . . . . . . . . . . . . . . . . . . . . . . . . . . . .
Receivables TOTAL ALLOWANCE Casino 2 3 , 652 , 7 14 12 , 2 13 , 2 7 8 Trade 4 5 , 83 8 , 055 3 , 0 0 2 , 0 7 7 Sundry 5 9 , 995 , 921 5 0 0 Notes 94 , 0 7 9 , 0 0 8 0
Prepaid Expenses . . . . . . . . . . . . . . . . . . . . . . . . . . . . . . . . . . . . . . . .
Other Current Assets . . . . . . . . . . . . . . . . . . . . . . . . . . . . . . . . . . . .
TOTAL CURRENT ASSETS . . . . . . . . . . . . . . . . . . . . . . . . . . . . . . . . . . . . . .
FIXED ASSETS COST DEPRECIATION Land 1 , 998 , 96 0 , 442 . . . . . . . . . . .
Land Improvements 59 , 0 68 , 0 9 9 2 1 , 6 8 0 , 9 4 9 Buildings & Improvements 2 , 7 65 , 6 7 5 , 4 2 8 8 19 , 2 8 0 , 118 Furniture & Equipment 1 , 193 , 2 7 1 , 8 1 0 948 , 3 95 , 2 3 9 Lease Improvements 3 5 , 160 , 626 1 9 , 7 0 1 , 134 Construction in Progress 7 9 , 2 16 , 190 . . . . . . . . . . .
TOTAL FIXED ASSETS . . . . . . . . . . . . . . . . . . . . . . . . . . . . . . . . . . . . . . . .
OTHER ASSETS
TOTAL ASSETS
LIABILITIES AND CAPITAL CURRENT LIABILITIES
Accounts Payable - Trade . . . . . . . . . . . . . . . . . . . . . . . . . . . . . . . .
Accounts Payable - Other . . . . . . . . . . . . . . . . . . . . . . . . . . . . . . . . Current Portion of Long-Term Debt . . . . . . . . . . . . . . . . . . . . . . .
Accrued Expenses . . . . . . . . . . . . . . . . . . . . . . . . . . . . . . . . . . . . . . . .
Other Current Liabilities . . . . . . . . . . . . . . . . . . . . . . . . . . . . . . .
TOTAL CURRENT LIABILITIES . . . . . . . . . . . . . . . . . . . . . . . . . . . . . . . . .
LONG-TERM DEBT TOTAL OWING CURRENT PORTION Mortgages 7 0 , 594 , 968 4 6 , 3 8 3 , 8 1 0 Debentures & Bonds 168 , 0 0 0 , 0 0 0 0 Notes 1 , 2 1 6 , 5 9 7 , 4 7 8 3 4 , 1 3 6 , 8 7 0 Contracts 2 , 3 7 9 , 751 924 , 4 97 Other 625 , 3 53 , 106 12 , 953 , 0 7 7
TOTAL LONG-TERM DEBT 2 , 0 82 , 92 5 , 3 0 3 94 , 3 98 , 254 OTHER LIABILITIES . . . . . . . . . . . . . . . . . . . . . . . . . . . . . . . . . . . . . . . . .
TOTAL LIABILITIES
CAPITAL Owners Capital Accounts . . . . . . . . . . . . . . . . . . . . . . . . . . . . . . . . .
Capital Stock & Other Capital . . . . . . . . . . . . . . . . . . . . . . . . . . .
Retained Earnings . . . . . . . . . . . . . . . . . . . . . . . . . . . . . . . . . . . . . . . TOTAL CAPITAL . . . . . . . . . . . . . . . . . . . . . . . . . . . . . . . . . . . . . . . . . . . . .
TOTAL LIABILITIES AND CAPITAL . . . . . . . . . . . . . . . . . . . . . . . . . . . . . .
Average Assets 2 05 , 0 5 5 , 554
Upper Quartile 254 , 0 0 7 , 9 0 1
Median 94 , 73 6 , 8 1 8
3 - 25
DOLLARS PERCENT 2 65 , 53 7 , 9 0 5
1 1 , 4 3 9 , 4 3 6 4 2 , 835 , 978 5 9 , 995 , 4 2 1 94 , 0 7 9 , 0 0 8 63 , 4 8 5 , 5 6 1
4 4 6 , 0 7 1 , 532 983 , 44 4 , 8 4 1
1 , 9 98 , 96 0 , 4 4 2 3 7 , 3 8 7 , 1 5 0
1 , 9 4 6 , 3 9 5 , 3 1 0 2 44 , 8 76 , 5 7 1
15 , 45 9 , 4 92 7 9 , 216 , 190
4 , 3 2 2 ! 2 9 5 ! 155
84 5 ! 92 6 , 622
6 ! 15 1 ! 666, 6 1 8
52 , 723 , 9 5 1 3 5 1 , 252 , 124
94 , 3 98 , 254 14 5 , 0 4 6 , 2 53
9 0 , 84 0 , 0 64 734 , 2 6 0 , 646
2 4 , 2 1 1 , 158 168 , 0 0 0 , 0 0 0
1 , 182 , 4 60 , 608 1 , 455 , 254
6 12 , 4 0 0 , 0 2 9 1 , 98 8 , 52 7 , 0 4 9
- 12 0 , 3 0 1 , 3 7 4 2 , 6 0 2 , 4 8 6 , 3 2 1
2 , 6 2 3 , 174 , 0 7 5 947 , 0 84 , 94 0 - 2 1 , 078 , 718
3 , 5 4 9 , 180 , 2 97
6 , 151 , 66 6 , 618
Lower Quartile 52 , 122 , 2 91
4 . 3 %
0 . 2 % 0 . 7 % 1 . 0 % 1 . 5 % 1 . 0 % 7 . 3 %
16 . 0 %
3 2 . 5 % 0 . 6 %
3 1 . 6% 4 . 0 % 0 . 3 % 1 . 3 %
7 0 . 3 %
13 . 8 %
1 0 0 . 0 %
0 . 9% 5 . 7 % 1 . 5 % 2 . 4 % 1 . 5 %
11 . 9%
0 . 4 % 2 . 7 %
19 . 2 % 0 . 0 %
10 . 0 % 32 . 3 % - 2 . 0% 4 2 . 3 %
4 2 . 6 % 15 . 4 % - 0 . 3 % 5 7 . 7%
1 0 0 . 0 %

3 - 2 6 COMBINED INCOME STATEMENT - SUMMARY
Fiscal Year 2 0 13 Statewide Casinos with Rooms Facilities With Gaming Revenue of $ 3 6 , 0 0 0 , 0 0 0 to $ 72 , 0 0 0 , 0 0 0
Amount s Represent 3 0 Locations .
REVENUE Gaming . . . . . . . . . . . . . . . . . . . . . . . . . . . . . . . . . . . . . . . . . . . . . . . . . .
Rooms . . . . . . . . . . . . . . . . . . . . . . . . . . . . . . . . . . . . . . . . . . . . . . . . . . .
Food . . . . . . . . . . . . . . . . . . . . . . . . . . . . . . . . . . . . . . . . . . . . . . . . . . . .
Beverage . . . . . . . . . . . . . . . . . . . . . . . . . . . . . . . . . . . . . . . . . . . . . . . .
Other . . . . . . . . . . . . . . . . . . . . . . . . . . . . . . . . . . . . . . . . . . . . . . . . . . .
TOTAL REVENUE . . . . . . . . . . . . . . . . . . . . . . . . . . . . . . . . . . . . . . . . . . . . · --�������
COST OF SALES
GROSS MARGIN
DEPARTMENTAL EXPENSES . . . . . . . . . . . . . . . . . . . . . . . . . . . . . . . . . . . . .
DEPARTMENTAL INCOME ( LOSS ) • • • • • • • • • • • • • • • • • • • • • • • • • • • • • • • • -...=..1�:....=..!....:=...=:...::..!.....:.-=..=.
GENERAL AND ADMINISTRATIVE EXPENSES Advertising and Promotion . . . . . . . . . . . . . . . . . . . . . . . . . . . . . . . 6 1 , 9 4 1 , 7 3 9 Bad Debt Expense . . . . . . . . . . . . . . . . . . . . . . . . . . . . . . . . . . . . . . . . 74 7 , 1 5 0 Compl imentary Expense ( not reported i n departments ) . . . . . . 5 5 , 4 5 2 , 7 6 5 Depreciation - Buildings . . . . . . . . . . . . . . . . . . . . . . . . . . . . . . . . 9 3 , 4 9 4 , 4 12 Depreciation and Amorti zation - Other . . . . . . . . . . . . . . . . . . . 1 3 7 , 2 6 7 , 3 6 3 Energy Expense ( electricity , gas , etc . ) . . . . . . . . . . . . . . . . . 6 7 , 4 9 9 , 8 1 0 Equipment Rental or Lease . . . . . . . . . . . . . . . . . . . . . . . . . . . . . . . 1 0 , 8 7 0 , 5 0 4 Interest Expense . . . . . . . . . . . . . . . . . . . . . . . . . . . . . . . . . . . . . . . . 2 7 5 , 3 5 2 , 9 8 8 Music and Entertainment . . . . . . . . . . . . . . . . . . . . . . . . . . . . . . . . . 14 , 044 , 1 0 9 Payrol l Taxes . . . . . . . . . . . . . . . . . . . . . . . . . . . . . . . . . . . . . . . . . . . 1 9 , 6 2 3 , 744 Payrol l - Employee Benefits . . . . . . . . . . . . . . . . . . . . . . . . . . . . . 5 0 , 8 2 8 , 4 14 Payroll - Officers . . . . . . . . . . . . . . . . . . . . . . . . . . . . . . . . . . . . . . 9 , 0 7 6 , 7 2 5 Payroll - Other Employees . . . . . . . . . . . . . . . . . . . . . . . . . . . . . . . 2 0 7 , 4 2 2 , 2 54 Rent of Premises . . . . . . . . . . . . . . . . . . . . . . . . . . . . . . . . . . . . . . . . 14 , 172 , 2 0 9 Taxes - Real Estate . . . . . . . . . . . . . . . . . . . . . . . . . . . . . . . . . . . . . 18 , 8 8 7 , 6 1 7 Taxes and Licenses - Other . . . . . . . . . . . . . . . . . . . . . . . . . . . . . . 7 , 3 58 , 54 5 Utilities ( Other than Energy Expense) . . . . . . . . . . . . . . . . . . . 1 9 , 3 1 8 , 5 7 4 Other General and Administrative Expenses . . . . . . . . . . . . . . . 2 6 1 , 8 6 9 , 7 8 8
1 , 3 2 5 , 2 2 8 , 7 1 0 TOTAL GENERAL AND ADMINISTRATIVE EXPENSES . . . . . . · · · · · · · · · · ·--
������=
NET INCOME ( LOSS ) BEFORE FEDERAL INCOME TAXES AND EXTRAORDINARY ITEMS . . . . . . . . . . . . . . . . . . . . . . . . . . . . . . . . . . . .
Average Revenue 9 6 , 2 7 0 , 3 2 8
Upper Quartile 12 0 , 676 , 8 7 9
Median 8 2 , 3 6 0 , 13 9
- 2 52 , 3 3 7 , 9 9 2
Lower Quartile 6 9 , 02 0 , 94 0
2 . 1% 0 . 0 % 1 . 9% 3 . 2 % 4 . 8 % 2 . 3 % 0 . 4 % 9 . 5 % 0 . 5 % 0 . 7 % 1 . 8 % 0 . 3 % 7 . 2 % 0 . 5 % 0 . 7% 0 . 3 % 0 . 7 % 9 . 1%
4 5 . 9 %
- 8 . 7 %

COMBINED INCOME STATEMENT - DETAIL 3 - 2 7 Fiscal Year 2 0 13 Statewide Casinos with Rooms Facilities With Gaming Revenue of $36 , 0 0 0 , 0 0 0 to $72 , 0 0 0 , 0 0 0
Amounts Represent 3 0 Locations .
CASINO DEPARTMENT
REVENUE DOLLARS PERCENT Pit Revenue ( Includes Keno and Bingo) . . . . . . . . . . . . . . . . . . . 2 63 , 052 , 0 7 0 17 . 2 %" Coin Operated Devices . . . . . . . . . . . . . . . . . . . . . . . . . . . . . . . . . . . 1 , 22 6 , 53 2 , 7 4 1 8 0 . 3 %" Poker and Pan . . . . . . . . . . . . . . . . . . . . . . . . . . . . . . . . . . . . . . . . . . . 10 , 274 , 4 7 2 0 . 7%"
Race Book . . . . . . . . . . . . . . . . . . . . . . . . . . . . . . . . . . . . . . . . . . . . . . . 8 , 74 7 , 614 0 . 6 %" Sports Pool . . . . . . . . . . . . . . . . . . . . . . . . . . . . . . . . . . . . . . . . . . . . . 1 7 , 965 , 3 3 4 1 . 2 %"
TOTAL REVENUE . . . . . . . . . . . . . . . . . . . . . . . . . . . . . . . . . . . . . . . . . . . . . 1 , 52 6 , 5 72 , 2 3 1 100 . 0 %"
DEPARTMENTAL EXPENSES Bad Debt Expense . . . . . . . . . . . . . . . . . . . . . . . . . . . . . . . . . . . . . . . . 2 , 02 7 , 2 0 0 0 . 1%" Commissions . . . . . . . . . . . . . . . . . . . . . . . . . . . . . . . . . . . . . . . . . . . . . 17 , 4 0 3 , 8 8 4 1 . 1%" Complimentary Expense . . . . . . . . . . . . . . . . . . . . . . . . . . . . . . . . . . . 2 2 6 , 4 75 , 4 4 6 14 . 8 %" Gaming Taxes and Licenses . . . . . . . . . . . . . . . . . . . . . . . . . . . . . . . 124 , 0 14 , 150 8 . 1%" Preferred Guest Expenses (no complimentaries ) . . . . . . . . . . . 13 , 5 60 , 54 7 0 . 9%" Payroll Taxes . . . . . . . . . . . . . . . . . . . . . . . . . . . . . . . . . . . . . . . . . . . 2 5 , 906 , 74 0 1 . 7 % Payrol l - Employee Benefits . . . . . . . . . . . . . . . . . . . . . . . . . . . . . 4 7 , 2 3 9 , 0 8 3 3 . 1%" Payrol l - Officers . . . . . . . . . . . . . . . . . . . . . . . . . . . . . . . . . . . . . . 4 , 18 0 , 2 3 1 0 . 3 %" Payroll - Other Employees . . . . . . . . . . . . . . . . . . . . . . . . . . . . . . . 1 7 7 , 03 6 , 5 8 6 11 . 6 %" Race Wire Fees . . . . . . . . . . . . . . . . . . . . . . . . . . . . . . . . . . . . . . . . . . 1 , 4 3 3 , 52 3 0 . 1%" Other Departmental Expenses . . . . . . . . . . . . . . . . . . . . . . . . . . . . . 12 9 , 122 , 2 0 0 8 . 5 %"
TOTAL DEPARTMENTAL EXPENSES . . . . . . . . . . . . . . . . . . . . . . . . . . . . . . . 7 6 8 , 3 9 9 , 5 9 0 50 . 3 %"
DEPARTMENTAL INCOME (LOSS) . . . . . . . . . . . . . . . . . . . . . . . . . . . . . . . . . 758 , 172 1 64 1 4 9 . 7 %"
ROOMS DEPARTMENT
REVENUE DOLLARS PERCENT Room Sales . . . . . . . . . . . . . . . . . . . . . . . . . . . . . . . . . . . . . . . . . . . . . . 3 8 6 , 4 3 6 , 3 9 4 79 . 2 %" Complimentary Rooms . . . . . . . . . . . . . . . . . . . . . . . . . . . . . . . . . . . . . 10 1 , 4 7 8 , 7 9 0 2 0 . 8 %"
TOTAL REVENUE . . . . . . . . . . . . . . . . . . . . . . . . . . . . . . . . . . . . . . . . . . . . . 4 8 7 , 915 , 184 100 . 0 %"
DEPARTMENTAL EXPENSES Bad Debt Expense . . . . . . . . . . . . . . . . . . . . . . . . . . . . . . . . . . . . . . . . 1 , 059 , 8 96 0 . 2 %" Complimentary Expense . . . . . . . . . . . . . . . . . . . . . . . . . . . . . . . . . . . 9 , 3 92 , 0 8 7 1 . 9 % Payrol l - Taxes . . . . . . . . . . . . . . . . . . . . . . . . . . . . . . . . . . . . . . . . . 14 , 0 83 , 3 14 2 . 8 %" Payroll - Employee Benefits . . . . . . . . . . . . . . . . . . . . . . . . . . . . . 3 9 , 4 12 , 7 9 9 8 . 0 %" Payroll - Officers . . . . . . . . . . . . . . . . . . . . . . . . . . . . . . . . . . . . . . 924 , 3 2 0 0 . 2 %" Payroll - Other Employees . . . . . . . . . . . . . . . . . . . . . . . . . . . . . . . 1 2 7 , 98 1 , 5 8 3 2 6 . 2 %" Other Departmental Expenses . . . . . . . . . . . . . . . . . . . . . . . . . . . . . 7 9 , 904 , 8 5 3 16 . 4 %"
TOTAL DEPARTMENTAL EXPENSES . . . . . . . . . . . . . . . . . . . . . . . . . . . . . . . 2 7 2 , 758 1 8 52 55 . 9 %"
DEPARTMENTAL INCOME (LOSS ) . . . . . . . . . . . . . . . . . . . . . . . . . . . . . . . . . 2 15 , 156 , 3 3 2 44 . 1%"

3 - 2 8 COMBINED INCOME STATEMENT - DETAIL { CONTINUED)
Fiscal Year 2 0 1 3 Statewide Casinos with Rooms Facilities With Gaming Revenue of $ 3 6 , 0 0 0 , 0 0 0 to $ 72 , 0 0 0 , 0 0 0
Amounts Represent 3 0 Locations .
FOOD DEPARTMENT REVENUE
Food Sales Complimentary Food Sales . . . . . . . . . . . . . . . . . . . . . . . . . . . . . . . .
TOTAL REVENUE . . . . . . . . . . . . . . . . . . . . . . . . . . . . . . . . . . . . . . . . . . . . .
COST OF SALES
GROSS MARGIN
DEPARTMENTAL EXPENSES Bad Debt Expense . . . . . . . . . . . . . . . . . . . . . . . . . . . . . . . . . . . . . . . .
Complimentary Expense . . . . . . . . . . . . . . . . . . . . . . . . . . . . . . . . . . . Payrol l - Taxes . . . . . . . . . . . . . . . . . . . . . . . . . . . . . . . . . . . . . . . . .
Payroll - Employee Benefits . . . . . . . . . . . . . . . . . . . . . . . . . . . . . Payrol l - Off icers . . . . . . . . . . . . . . . . . . . . . . . . . . . . . . . . . . . . . .
Payroll - Other Employees . . . . . . . . . . . . . . . . . . . . . . . . . . . . . . .
Other Departmental Expenses . . . . . . . . . . . . . . . . . . . . . . . . . . . . . TOTAL DEPARTMENTAL EXPENSES . . . . . . . . . . . . . . . . . . . . . . . . . . . . . . .
DEPARTMENTAL INCOME {LOSS ) . . . . . . . . . . . . . . . . . . . . . . . . . . . . . . . . .
BEVERAGE DEPARTMENT REVENUE
B everage Sales . . . . . . . . . . . . . . . . . . . . . . . . . . . . . . . . . . . . . . . . . .
Compl imentary Beverage Sales . . . . . . . . . . . . . . . . . . . . . . . . . . . . TOTAL REVENUE . . . . . . . . . . . . . . . . . . . . . . . . . . . . . . . . . . . . . . . . . . . . .
COST OF SALES
GROSS MARGIN . . . . . . . . . . . . . . . . . . . . . . . . . . . . . . . . . . . . . . . . . . . . . .
DEPARTMENTAL EXPENSES Bad Debt Expense . . . . . . . . . . . . . . . . . . . . . . . . . . . . . . . . . . . . . . . .
Complimentary Expense . . . . . . . . . . . . . . . . . . . . . . . . . . . . . . . . . . .
Payroll - Taxes . . . . . . . . . . . . . . . . . . . . . . . . . . . . . . . . . . . . . . . . . Payrol l - Employee Benefits . . . . . . . . . . . . . . . . . . . . . . . . . . . . . Payroll - Officers . . . . . . . . . . . . . . . . . . . . . . . . . . . . . . . . . . . . . .
Payrol l - Other Employees . . . . . . . . . . . . . . . . . . . . . . . . . . . . . . . Other Departmental Expenses . . . . . . . . . . . . . . . . . . . . . . . . . . . . .
TOTAL DEPARTMENTAL EXPENSES . . . . . . . . . . . . . . . . . . . . . . . . . . . . . . .
DEPARTMENTAL INCOME {LOSS ) . . . . . . . . . . . . . . . . . . . . . . . . . . . . . . . . .
DOLLARS 3 11 , 7 3 6 , 3 8 5
9 8 , 5 94 , 5 7 1 4 1 0 , 3 3 0 , 9 5 6
162 , 6 7 6 , 9 4 8
2 4 7 , 6 54 , 0 0 8
3 6 , 5 5 6 4 , 44 2 , 9 9 5
2 1 , 6 5 1 , 1 8 2 5 1 , 6 1 3 , 3 8 6
3 , 0 6 6 , 2 2 6 1 7 7 , 2 14 , 9 5 7
1 7 , 0 6 7 , 1 3 2 2 7 5 , 0 9 2 , 4 3 4
- 2 7 , 4 3 8 , 4 2 6
DOLLARS 1 0 2 , 6 18 , 7 3 3
9 3 , 0 0 1 , 7 0 1 1 95 , 6 2 0 , 4 3 4
4 8 , 0 7 3 , 5 6 0
147 , 54 6 , 8 74
5 2 7 3 , 6 1 6 , 9 0 3 6 , 54 6 , 1 8 6
14 , 2 4 6 , 3 0 9 2 5 1 , 8 8 5
4 6 , 0 3 1 , 9 5 5 1 9 , 0 8 0 , 7 3 8 8 9 , 7 74 , 5 0 3
5 7 , 772 , 3 7 1
PERCENT 76 . 0 % 24 . 0 %
1 0 0 . 0 %
3 9 . 6 %
6 0 . 4 %
0 . 0 % 1 . 1% 5 . 3 %
12 . 6 % 0 . 7 %
4 3 . 2 % 4 . 2 %
6 7 . 0 %
- 6 . 7 %
PERCENT 52 . 5 % 4 7 . 5 %
1 0 0 . 0 %
24 . 6 %
75 . 4 %
0 . 0 % 1 . 8 % 3 . 3 % 7 . 3 % 0 . 1 %
2 3 . 5 % 9 . 8 %
4 5 . 9 %
2 9 . 5 %
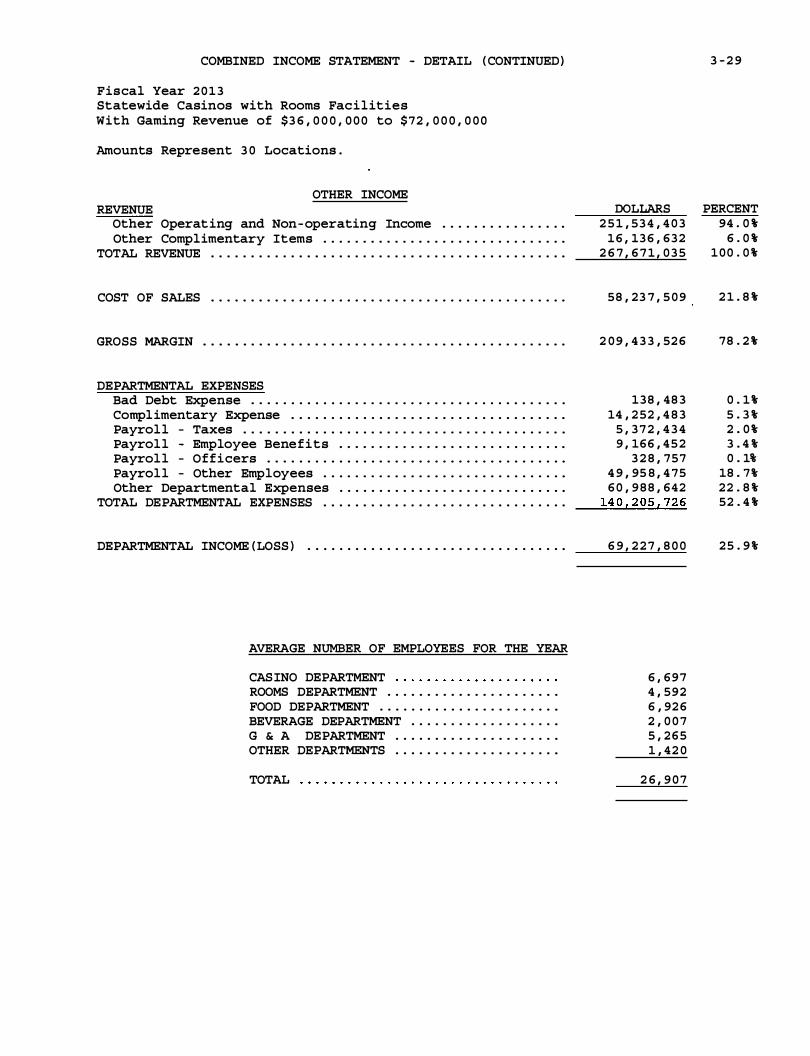
COMBINED INCOME STATEMENT - DETAIL ( CONTINUED)
Fiscal Year 2 0 1 3 Statewide Casinos with Rooms Facilities With Gaming Revenue of $3 6 , 0 0 0 , 0 0 0 to $72 , 0 0 0 , 0 0 0
Amounts Represent 3 0 Locations .
OTHER INCOME REVENUE
Other Operating and Non-operating Income . . . . . . . . . . . . . . . .
Other Complimentary Items . . . . . . . . . . . . . . . . . . . . . . . . . . . . . . .
TOTAL REVENUE . . . . . . . . . . . . . . . . . . . . . . . . . . . . . . . . . . . . . . . . . . . . .
COST OF SALES . . . . . . . . . . . . . . . . . . . . . . . . . . . . . . . . . . . . . . . . . . . . .
GROSS MARGIN . . . . . . . . . . . . . . . . . . . . . . . . . . . . . . . . . . . . . . . . . . . . . .
DEPARTMENTAL EXPENSES Bad Debt Expense . . . . . . . . . . . . . . . . . . . . . . . . . . . . . . . . . . . . . . . . Complimentary Expense . . . . . . . . . . . . . . . . . . . . . . . . . . . . . . . . . . .
Payroll - Taxes . . . . . . . . . . . . . . . . . . . . . . . . . . . . . . . . . . . . . . . . .
Payroll - Employee Benefits . . . . . . . . . . . . . . . . . . . . . . . . . . . . .
Payroll - Officers . . . . . . . . . . . . . . . . . . . . . . . . . . . . . . . . . . . . . .
Payroll - Other Employees . . . . . . . . . . . . . . . . . . . . . . . . . . . . . . .
Other Departmental Expenses . . . . . . . . . . . . . . . . . . . . . . . . . . . . .
TOTAL DEPARTMENTAL EXPENSES . . . . . . . . . . . . . . . . . . . . . . . . . . . . . . .
DEPARTMENTAL INCOME (LOSS ) . . . . . . . . . . . . . . . . . . . . . . . . . . . . . . . . .
AVERAGE NUMBER OF EMPLOYEES FOR THE YEAR
CASINO DEPARTMENT ROOMS DEPARTMENT . . . . . . . . . . . . . . . . . . . . . . FOOD DEPARTMENT . . . . . . . . . . . . . . . . . . . . . . .
BEVERAGE DEPARTMENT . . . . . . . . . . . . . . . . . . .
G & A DEPARTMENT . . . . . . . . . . . . . . . . . . . . .
OTHER DEPARTMENTS . . . . . . . . . . . . . . . . . . . . .
TOTAL
DOLLARS 2 5 1 , 53 4 , 4 0 3
16 , 13 6 , 632 2 6 7 , 6 7 1 , 0 3 5
58 , 23 7 , 5 0 9
2 0 9 , 4 3 3 , 52 6
138 , 48 3 14 , 2 52 , 4 8 3
5 , 3 7 2 , 4 3 4 9 , 166 , 452
3 2 8 , 757 4 9 , 95 8 , 4 75 6 0 , 9 8 8 , 642
14 0 , 2 0 5 , 726
6 9 , 2 2 7 , 8 0 0
6 , 697 4 , 592 6 , 92 6 2 , 0 0 7 5 , 265 1 , 42 0
2 6 , 9 0 7
3 - 2 9
PERCENT 94 . 0 %-
6 . 0 %-100 . 0 %-
2 1 . 8 %-
78 . 2 %-
0 . 1%-5 . 3 % 2 . 0 % 3 . 4 % 0 . 1%-
18 . 7% 22 . 8 % 52 . 4 %-
25 . 9 %

3 - 3 0 ROOM OCCUPANCY AND PER ROOM PER DAY ANALYS IS
Fiscal Year 2 0 13 Statewide Cas inos with Rooms Facilities With Gaming Revenue of $ 3 6 , 0 0 0 , 0 0 0 to $ 72 , 0 0 0 , 0 0 0
Amounts Represent 3 0 Locations .
MONTH JULY . . . . . . . . . . AUGUST . . . . . . . . SEPTEMBER . . . . . OCTOBER . . . . . . . NOVEMBER . . . . . . DECEMBER . . . . . . JANUARY . . . . . . . FEBRUARY . . . . . . MARCH . . . . . . . . . APRIL . . . . . . . . . MAY . . . . . . .. . . . . JUNE . . . . . . . . . .
TOTAL . . . . . . . . .
Average Pit Revenue Per Room Per Day
Average Slot Revenue Per Room Per Day
Average Food Sales Per Room Per Day
RATE OF ROOM OCCUPANCY .
AVAILABLE ROOMS ROOMS OCCUPIED 8 52 , 7 5 5 718 , 9 19 8 5 3 , 3 8 1 6 8 7 , 9 9 2 8 3 1 , 2 4 3 6 7 9 , 8 0 8 8 5 1 , 7 8 4 6 8 9 , 7 2 8 815 , 94 3 55 7 , 5 6 1 842 , 8 65 55 6 , 0 5 7 8 4 1 , 6 3 1 5 7 0 , 2 94 7 7 1 , 7 7 2 5 6 8 , 5 0 7 8 6 0 , 74 3 7 0 5 , 9 7 8 8 2 0 , 14 1 6 5 3 , 8 8 4 844 , 7 2 9 6 7 7 , 4 5 5 8 2 6 , 7 0 2 6 9 1 , 7 9 2
1 0 , 0 13 , 6 8 9 7 , 75 7 , 9 7 5
PER ROOM PER DAY STATISTICS
3 3 . 9 1
1 5 8 . 1 0
52 . 8 9
Average Beverage Sales Per Room Per Day
Average Rooms Department Payroll Per Room Per Day
Average Room Rate Per Day
% OF OCCUPANCY
( COMPUTED ) 8 4 . 3 1% 8 0 . 62 % 8 1 . 7 8 % 8 0 . 9 7 % 6 8 . 3 3 % 6 5 . 9 7 % 6 7 . 7 6 % 7 3 . 6 6 % 8 2 . 0 2 % 7 9 . 7 3 % 8 0 . 2 0 % 8 3 . 6 8 %
7 7 . 4 7 %
2 5 . 2 2
2 3 . 5 1
62 . 8 9

PER SQUARE FOOT ANALYSIS AND RATIOS 3 - 3 1 Fiscal Year 2 0 1 3 Statewide Casinos with Rooms Facilities With Gaming Revenue of $ 3 6 , 0 0 0 , 0 0 0 to $72 , 0 0 0 , 0 0 0
Amounts Represent 3 0 Locations .
GAMING REVENUE PER SQUARE FOOT OF FLOOR SPACE
NO . OF CASINOS AVERAGE AREA GAMING REVENUE AREA OPERATING IN SQUARE FEET PER SQUARE FOOT
Pit ( Includes Bingo and Keno) 3 0 8 , 55 1 1 , 0 2 5 Coin Operated Devices 3 0 4 6 , 832 Poker and Pan 16 1 , 3 84 Race and Sports 18 . 4 , 5 3 7
TOTAL CASINO 3 0 58 , 844
RATIOS
TOTAL CURRENT ASSETS TO TOTAL CURRENT LIABILITIES . . . . . . . . .
TOTAL CAPITAL TO TOTAL LIABILITIES . . . . . . . . . . . . . . . . . . . . . . . .
TOTAL CAPITAL TO TOTAL CURRENT LIABILITIES . . . . . . . . . . . . . . . .
TOTAL CURRENT LIABILITIES TO TOTAL LIABILITIES . . . . . . . . . . . .
TOTAL COMPLIMENTARY EXPENSE TO GAMING REVENUE . . . . . . . . . . . . .
MUSIC AND ENTERTAINMENT EXPENSES TO GAMING REVENUE . . . . . . . .
TOTAL REVENUE TO AVERAGE TOTAL ASSETS . . . . . . . . . . . . . . . . . . . . .
TOTAL REVENUE LESS COMP SALES TO AVERAGE TOTAL ASSETS . . . . .
RETURN ON INVESTED CAPITAL* . . . . . . . . . . . . . . . . . . . . . . . . . . . . . . .
RETURN ON AVERAGE ASSETS* . . . . . . . . . . . . . . . . . . . . . . . . . . . . . . . . .
* - FORMULAS
Return on Invested Capital is equal to the total of net income (before federal income taxes and extraordinary items ) and interest
expense divided by the total of average total assets less average current liabilities .
PERCENT 133 . 9%'
136 . 4 %'
4 8 3 . 4%'
2 8 . 2 %'
2 0 . 5%'
0 . 9%
4 5 . 9%
4 1 . 0 %
0 . 5%
0 . 4!ir
Return on Average Assets is equal to the total of net income (before federal income taxes and extraordinary items ) and interest expense divided by the average total assets .
8 7 3 4 6 2 3 1 8
8 6 5

3 - 3 2
THIS PAGE LEFT INTENTIONALLY BLANK

COMBINED BALANCE SHEET Fiscal Year 2 0 1 3 Statewide Casinos with Rooms Facilities With Gaming Revenue of $ 72 , 0 0 0 , 0 0 0 and over
Amounts Represent 4 0 Locations .
ASSETS CURRENT ASSETS
Cash . . . . . . . . . . . . . . . . . . . . . . . . . . . . . . . . . . . . . . . . . . . . . . . . . . . . Receivables TOTAL ALLOWANCE
Casino Trade Sundry Notes
1 , 190 , 0 6 0 , 453 529 , 5 5 0 , 4 7 8
7 , 0 99 , 053 , 946 2 , 93 0 , 100
4 9 9 , 3 3 4 , 5 6 1 19 , 8 74 , 3 5 9
6 9 3 , 554 0
Prepaid Expenses . . . . . . . . . . . . . . . . . . . . . . . . . . . . . . . . . . . . . . . . Other Current Assets . . . . . . . . . . . . . . . . . . . . . . . . . . . . . . . . . . . .
TOTAL CURRENT ASSETS . . . . . . . . . . . . . . . . . . . . . . . . . . . . . . . . . . . . . .
FIXED ASSETS COST DEPRECIATION Land 12 , 3 53 , 92 0 , 219 . . . . . . . . . . . Land Improvements 1 , 3 3 6 , 74 4 , 921 4 6 1 , 54 5 , 7 85 Buildings & Improvements 2 8 , 14 5 , 3 5 6 , 0 8 8 , 6 , 4 64 , 9 93 , 2 7 1 Furniture & Equipment 8 , 9 91 , 4 8 5 , 7 2 9 5 , 4 5 0 , 18 8 , 2 9 1 Lease Improvements 56 , 24 7 , 534 2 0 , 582 , 684 Construction in Progress 6 4 6 , 574 , 940 . . . . . . . . . . .
TOTAL FIXED ASSETS . . . . . . . . . . . . . . . . . . . . . . . . . . . . . . . . . . . . . . . .
OTHER ASSETS
TOTAL ASSETS
LIABILITIES AND CAPITAL CURRENT LIABILITIES
Accounts Payable - Trade . . . . . . . . . . . . . . . . . . . . . . . . . . . . . . . . Accounts Payable - Other . . . . . . . . . . . . . . . . . . . . . . . . . . . . . . . . current Portion of Long-Term Debt . . . . . . . . . . . . . . . . . . . . . . . Accrued Expenses . . . . . . . . . . . . . . . . . . . . . . . . . . . . . . . . . . . . . . . . Other Current Liabil ities . . . . . . . . . . . . . . . . . . . . . . . . . . . . . . .
TOTAL CURRENT LIABILITIES . . . . . . . . . . . . . . . . . . . . . . . . . . . . . . . . .
LONG-TERM DEBT Mortgages Debentures & Bonds Notes Contracts Other
TOTAL LONG-TERM DEBT OTHER LIABILITIES TOTAL LIABILITIES
CAPITAL
TOTAL OWING 10 , 4 2 6 , 94 0 , 9 94
2 , 6 1 0 , 93 0 , 564 1 , 64 4 , 100 , 799
7 , 92 3 , 6 6 1 8 , 3 6 7 , 5 14 , 3 90
2 3 , 0 5 7 , 4 10 , 4 0 8
CURRENT PORTION 0
975 , 70 5 , 684 3 3 6 , 64 7 , 0 9 1
3 , 8 8 0 , 7 0 7 65 , 93 6 , 3 6 9
1 , 3 82 , 16 9 , 851
Owners Capital Accounts . . . . . . . . . . . . . . . . . . . . . . . . . . . . . . . . . Capital Stock & Other Capital . . . . . . . . . . . . . . . . . . . . . . . . . . . Retained Earnings . . . . -· . . . . . . . . . . . . . . . . . . . . . . . . . . . . . . . . . .
TOTAL CAPITAL . . . . . . . . . . . . . . . . . . . . . . . . . . . . . . . . . . . . . . . . . . . . .
TOTAL LIABILITIES AND CAPITAL . . . . . . . . . . . . . . . . . . . . . . . . . . . . . .
Average Assets 1 , 4 6 1 , 8 4 5 , 082
Upper Quartile 1 , 563 , 34 5 , 568
Median 8 16 , 75 8 , 22 2
3 - 3 3
DOLLARS PERCENT 1 , 7 3 5 , 4 3 1 , 455
6 90 , 72 5 , 8 92 5 0 9 , 676 , 119
7 , 0 98 , 3 6 0 , 3 92 2 , 93 0 , 100
3 0 7 , 4 2 9 , 8 3 8 3 , 7 2 0 , 52 9 , 818
14 , 0 65 , 0 83 , 6 14
12 , 3 53 , 920 , 2 19 875 , 19 9 , 136
2 1 , 6 8 0 , 3 62 , 8 1 7 3 , 541 , 2 97 , 4 3 8
3 5 , 6 64 , 85 0 64 6 , 574 , 940
3 9 , 13 3 , 0 19 , 4 00
5 , 2 7 5 , 7 0 0 ! 24 7
5 8 , 4 73 , 8 0 3 , 2 6 1
2 5 8 , 7 7 1 , 7 4 9 2 , 54 9 , 575 , 144 1 , 3 82 , 16 9 , 851
8 1 1 , 74 5 , 056 4 , 45 1 , 63 0 , 2 9 9 9 , 4 5 3 , 8 92 , 0 9 9
10 , 42 6 , 94 0 , 994 1 , 6 3 5 , 224 , 8 80 1 , 3 0 7 , 453 , 7 0 8
4 , 042 , 954 8 , 3 0 1 , 578 , 0 2 1
2 1 , 6 7 5 , 24 0 , 557 10 , 44 8 , 4 6 5 , 4 9 7 4 1 , 5 7 7 , 598 , 153
- 5 , 9 0 2 , 3 5 9 , 7 14 2 0 , 45 6 , 167 , 14 0
2 , 3 4 2 , 3 97 , 6 8 2 1 6 , 8 9 6 , 2 05 , 1 0 8
5 8 , 4 7 3 , 8 0 3 , 2 6 1
Lower Quartile 3 95 , 885 , 849
3 . 0 %-
1 . 2 %-0 . 9%-
12 . 1%-0 . 0 %-0 . 5 %-6 . 4 %-
2 4 . 1%-
2 1 . 1%-1 . 5 %-
3 7 . 1%-6 . 1%-0 . 1%-1 . 1%-
6 6 . 9%-
9 . 0 %-
1 0 0 . 0 %-
0 . 4 %-4 . 4 %-2 . 4 %-1 . 4 % 7 . 6 %-
1 6 . 2 %
1 7 . 8 %-2 . 8 % 2 . 2 %-0 . 0 %-
14 . 2 %-3 7 . 1% 17 . 9%-7 1 . 1%-
- 10 . 1%-3 5 . 0 %
4 . 0 % 2 8 . 9%-
1 0 0 . 0 %

3 - 3 4 COMBINED INCOME STATEMENT - SUMMARY
Fiscal Year 2 0 1 3 Statewide Casinos with Rooms Facilities With Gaming Revenue of $ 72 , 0 0 0 , 0 0 0 and over
Amounts Represent 4 0 Locat ions .
REVENUE Gaming . . . . . . . . . . . . . . . . . . . . . . . . . . . . . . . . . . . . . . . . . . . . . . . . . . Rooms . . . . . . . . . . . . . . . . . . . . . . . . . . . . . . . . . . . . . . . . . . . . . . . . . . . Food . . . . . . . . . . . . . . . . . . . . . . . . . . . . . . . . . . . . . . . . . . . . . . . . . . . . Beverage . . . . . . . . . . . . . . . . . . . . . . . . . . . . . . . . . . . . . . . . . . . . . . . . Other . . . . . . . . . . . . . . . . . . . . . . . . . . . . . . . . . . . . . . . . . . . . . . . . . . .
TOTAL REVENUE . . . . . . . . . . . . . . . . . . . . . . . . . . . . . . . . . . . . . . . . . . . . .
COST OF SALES
GROSS MARGIN
DEPARTMENTAL EXPENSES . . . . . . . . . . . . . . . . . . . . . . . . . . . . . . . . . . . . .
DEPARTMENTAL INCOME ( LOSS) • • • • • • • • • • • • • • • • • • • • • • • • • • • • • • • • ---"_;;:o...;_..::...:..=;;;;..;;;.�..:....:...
GENERAL AND ADMINISTRATIVE EXPENSES Adverti sing and Promotion . . . . . . . . . . . . . . . . . . . . . . . . . . . . . . . Bad Debt Expense . . . . . . . . . . . . . . . . . . . . . . . . . . . . . . . . . . . . . . . . Complimentary Expense ( not reported in departments ) . . . . . . Depreciat ion - Bui ldings . . . . . . . . . . . . . . . . . . . . . . . . . . . . . . . . Depreciati on and Amorti zation - Other . . . . . . . . . . . . . . . . . . . Energy Expense ( electricity , gas , etc . ) . . . . . . . . . . . . . . . . . Equipment Rental or Lease . . . . . . . . . . . . . . . . . . . . . . . . . . . . . . . Interest Expense . . . . . . . . . . . . . . . . . . . . . . . . . . . . . . . . . . . . . . . . Music and Entertainment . . . . . . . . . . . . . . . . . . . . . . . . . . . . . . . . . Payrol l Taxes . . . . . . . . . . . . . . . . . . . . . . . . . . . . . . . . . . . . . . . . . . . Payrol l - Employee Benefits . . . . . . . . . . . . . . . . . . . . . . . . . . . . . Payroll - Officers . . . . . . . . . . . . . . . . . . . . . . . . . . . . . . . . . . . . . . Payroll - Other Employees . . . . . . . . . . . . . . . . . . . . . . . . . . . . . . . Rent of Premises . . . . . . . . . . . . . . . . . . . . . . . . . . . . . . . . . . . . . . . . Taxes - Real Estate . . . . . . . . . . . . . . . . . . . . . . . . . . . . . . . . . . . . . Taxes and Licenses - Other . . . . . . . . . . . . . . . . . . . . . . . . . . . . . . Ut il ities (Other than Energy Expense ) . . . . . . . . . . . . . . . . . . . Other General and Admini strative Expenses . . . . . . . . . . . . . . .
TOTAL GENERAL AND ADMINISTRATIVE EXPENSES . . . . . . · · · · · · · · · · · --�������
NET INCOME ( LOSS ) BEFORE FEDERAL INCOME TAXES AND EXTRAORDINARY ITEMS . . . . . . . . . . . . . . . . . . . . . . . . . . . . . . . . . . . . - 1 , 0 7 3 , 9 6 7 , 0 4 4
Average Revenue 4 4 1 , 3 3 8 , 8 4 5
Upper Quartile 4 3 3 , 8 2 8 , 5 4 9
Median 2 8 0 , 0 72 , 3 12
Lower Quartile 16 6 , 7 0 7 , 732
- 6 . 1 %

COMBINED INCOME STATEMENT - DETAIL Fiscal Year 2 0 1 3 Statewide Casinos with Rooms Facilities With Gaming Revenue of $ 72 , 0 0 0 , 0 0 0 and over
Amounts Represent 4 0 Locations .
CASINO DEPARTMENT
REVENUE Pit Revenue ( Includes Keno and Bingo) • • . • • . • . . • • • . . • . • • .
Coin Operated Devices . • . . . . • • . • . • • . • • . . . • . . . . . . . . . . . • • • .
Poker and Pan . . • . . . • • • • . . . • • . . . . • . • . . • • • • • . . • . . . . . . . . • • •
Race Book . • . . . . . • . . • . • . . • . . • • . • . . . • . • . . • • • . . . . . • . • . . . . • •
Sports Pool . . . . . . • • . . . . . . . . • . . . . . . • . . . . • . • . . • . . . . • . . . . . .
TOTAL REVENUE . • . • • . . • . . . . . . • . • . . . . • • . . . . . . . . . . • . . . . . • . • • • .
DEPARTMENTAL EXPENSES Bad Debt Expense . . . . . . . . • • . . . . . . • • . . • • • • . . • • • . • . • • • . • . . .
Commissions . . . . . • . . . • • • • • • . • • • • • • • . . . . • . . . . . . . . • . . . • • • • .
Compl imentary Expense • • • • • . • • • • • • . • . • • . . • . . . . . . • • • • . . • . •
Gaming Taxes and Licenses . . . . . . • • . . . • • . • • • . . • . . • • . . . . • . .
Preferred Guest Expenses (no complimentaries ) . • . • • . • • • • •
Payroll Taxes • • . • . . • . . . . • . . • . . . . . . . • . . . . . . . . . . . . . • . • • • • •
Payroll - Employee Benefits . . • • . . . • • . . . . • • • • • • . • . . • • . • . .
Payroll - Officers • . . . . • . . . • . . . . . . • • . . . . • . • . . . . . . . • • • • • .
Payroll - Other Employees • . • . • . . . . • • • • . . . . • • • . • • . . . . . . • .
Race Wire Fees . • • . . . . • . . • • • • • . . . • . . . • • • . . . . . . . . . . . • • . • • .
Other Departmental Expenses • • • . . . . • . • • . . . . . . . . . . • . • . . • . .
TOTAL DEPARTMENTAL EXPENSES • • . . . • . . . . . • • . . . . . . . . . • • • • . • • . .
DEPARTMENTAL INCOME (LOSS) . . . . • • • . . • . . . . . . • • . • • • . • • . . • • • . . •
ROOMS DEPARTMENT
REVENUE Room Sales . . . . . . • • . . • . . . . • . • • . . . • . . • . . . . . . . . . . . . . . . • • • • •
Complimentary Rooms • . . . . . . . • • • . . • . . . . . . . . . . • . . . . . . . • • . . .
TOTAL REVENUE . . . . . . . . . . • . . . • . • . • . . . . • . . . • . . . . . . • . . . . . • . . • .
DEPARTMENTAL EXPENSES Bad Debt Expense . . • . • • • • . • • . . . . • • • . . . • . . • • . . • . . • • . • . • • . .
Complimentary Expense . . . . . . . • . . . • • . . • • . • • • • • • . • . • • • • • • . .
Payroll - Taxes . . . . • . . . . . . • . . • . . . . . . . . . • . . • • • . • . . • . • • . . .
Payroll - Employee Benefits • • • • • . . • • . . . . . . . . . . . . . . . . . . • •
Payroll - Officers . • . . . . . • . . . . . . . . • . . . . . . . . . . . • . . . . • . . • .
Payroll - Other Employees . • . . . . . . • • • . • . . . . . . . . • . . . . . . . • .
Other Departmental Expenses • . • . • • • • • . . . . . . . . . . . . . . . . . • . .
TOTAL DEPARTMENTAL EXPENSES . • . . • . . . . . . • • • . • • . . . . . . . • • • • • • .
DEPARTMENTAL INCOME (LOSS) . . . . . . • . • . . • . • • . • • • . . • . . • . . . . • • . •
DOLLARS 2 , 8 6 6 , 902 , 63 2 4 , 2 0 3 , 516 , 8 1 7
134 , 4 6 8 , 6 0 6 4 6 , 5 13 , 2 8 9 82 , 5 75 , 94 4
7 , 3 3 3 , 9 7 7 , 2 8 8
14 0 , 699 , 652 2 4 , 8 2 9 , 1 4 5
1 , 73 0 , 12 6 , 3 6 8 5 51 , 026 , 8 7 9 2 14 , 912 , 962 12 7 , 610 , 5 13 2 2 6 , 3 5 7 , 3 7 1
14 , 12 0 , 9 3 7 843 , 3 0 9 , 7 0 7
6 , 963 , 753 6 42 , 662 , 3 2 6
4 , 52 2 , 6 1 9 , 6 13
2 , 8 1 1 , 3 5 7 L 6 7 5
DOLLARS 3 , 1 8 9 , 75 9 , 723
8 1 9 , 8 5 1 , 3 5 6 4 , 0 0 9 , 6 1 1 , 0 7 9
13 , 14 7 , 7 6 1 12 1 , 3 6 7 , 718
75 , 90 0 , 910 2 15 , 62 0 , 3 15
5 , 4 85 , 4 99 726 , 8 7 1 , 904 4 68 , 613 , 4 64
1 , 62 7 , 0 0 7 , 571
2 , 3 82 , 6 0 3 , 5 0 8
3 - 35
PERCENT 3 9 . 1% 5 7 . 3 %
1 . 8 % 0 . 6 % 1 . 1%
1 0 0 . 0 %
1 . 9% 0 . 3 %
2 3 . 6% 7 . 5 % 2 . 9% 1 . 7 % 3 . 1% 0 . 2 %
11 . 5% 0 . 1% 8 . 8 %
6 1 . 7 %
38 . 3 %
PERCENT 7 9 . 6 % 2 0 . 4 %
100 . 0 %
0 . 3 % 3 . 0 % 1 . 8 % 5 . 3 % 0 . 1%
18 . 1% 11 . 7% 4 0 . 6 %
59 . 4 %

3 - 3 6 COMBINED INCOME STATEMENT - DETAIL ( CONTINUED)
Fi s cal Year 2 0 13 Statewide Casinos with Rooms Faci lities With Gaming Revenue of $ 72 , 0 0 0 , 0 0 0 and over
Amounts Represent 4 0 Locations .
FOOD DEPARTMENT REVENUE
Food Sales Compl imentary Food Sales . . . . . . . . . . . . . . . . . . . . . . . . . . . . . . . .
TOTAL REVENUE . . . . . . . . . . . . . . . . . . . . . . . . . . . . . . . . . . . . . . . . . . . . .
COST OF SALES
GROSS MARGIN
DEPARTMENTAL EXPENSES Bad Debt Expense . . . . . . . . . . . . . . . . . . . . . . . . . . . . . . . . . . . . . . . . Complimentary Expense . . . . . . . . . . . . . . . . . . . . . . . . . . . . . . . . . . . Payrol l - Taxes . . . . . . . . . . . . . . . . . . . . . . . . . . . . . . . . . . . . . . . . . Payrol l - Employee Benefits . . . . . . . . . . . . . . . . . . . . . . . . . . . . . Payrol l - Officers . . . . . . . . . . . . . . . . . . . . . . . . . . . . . . . . . . . . . . Payrol l - Other Employees . . . . . . . . . . . . . . . . . . . . . . . . . . . . . . . Other Departmental Expenses . . . . . . . . . . . . . . . . . . . . . . . . . . . . .
TOTAL DEPARTMENTAL EXPENSES . . . . . . . . . . . . . . . . . . . . . . . . . . . . . . .
DEPARTMENTAL INCOME ( LOSS) . . . . . . . . . . . . . . . . . . . . . . . . . . . . . . . . .
BEVERAGE DEPARTMENT REVENUE
B everage Sales . . . . . . . . . . . . . . . . . . . . . . . . . . . . . . . . . . . . . . . . . . Complimentary Beverage Sales . . . . . . . . . . . . . . . . . . . . . . . . . . . .
'l'OTAL REVENUE . . . . . . . . . . . . . . . . . . . . . . . . . . . . . . . . . . . . . . . . . . . . .
COST OF SALES
GROSS MARGIN . . . . . . . . . . . . . . . . . . . . . . . . . . . . . . . . . . . . . . . . . . . . . .
DEPARTMENTAL EXPENSES Bad Debt Expense . . . . . . . . . . . . . . . . . . . . . . . . . . . . . . . . . . . . . . . . Complimentary Expense . . . . . . . . . . . . . . . . . . . . . . . . . . . . . . . . . . . Payroll - Taxes . . . . . . . . . . . . . . . . . . . . . . . . . . . . . . . . . . . . . . . . . Payrol l - Employee Benefits . . . . . . . . . . . . . . . . . . . . . . . . . . . . . Payrol l - Officers . . . . . . . . . . . . . . . . . . . . . . . . . . . . . . . . . . . . . . Payrol l - Other Employees . . . . . . . . . . . . . . . . . . . . . . . . . . . . . . . Other Departmental Expenses . . . . . . . . . . . . . . . . . . . . . . . . . . . . .
TOTAL DEPARTMENTAL EXPENSES . . . . . . . . . . . . . . . . . . . . . . . . . . . . . . .
DEPARTMENTAL INCOME ( LOSS) . . . . . . . . . . . . . . . . . . . . . . . . . . . . . . . . .
DOLLARS 2 , 2 3 3 , 2 2 7 , 6 1 9
4 94 , 0 6 6 , 3 7 8 2 , 7 2 7 , 2 93 , 9 9 7
8 0 1 , 3 95 , 4 2 8
1 , 92 5 , 8 9 8 , 5 6 9
2 , 97 8 , 9 0 8 2 4 , 8 6 5 , 3 0 0
1 1 6 , 7 16 , 4 63 2 8 2 , 6 7 0 , 8 9 1
2 5 , 5 7 0 , 6 9 0 9 3 4 , 2 9 1 , 4 7 9 1 6 9 , 0 5 1 , 3 6 3
1 , 5 5 6 , 145 , 0 94
3 6 9 , 7 5 3 , 4 75
DOLLARS 8 3 7 , 7 7 8 , 8 9 0 4 3 8 , 2 4 7 , 4 0 7
1 , 2 7 6 , 0 2 6 , 2 9 7
2 2 1 , 3 9 7 , 6 1 0
1 , 0 5 4 , 62 8 , 6 8 7
4 1 6 , 2 8 4 2 6 , 6 6 9 , 5 13 2 9 , 2 3 5 , 7 0 0 6 6 , 2 2 1 , 0 4 5
8 6 9 , 2 7 0 2 0 8 , 12 2 , 8 5 6 2 1 9 , 6 0 9 , 7 3 8 5 5 1 , 144 , 4 0 6
5 0 3 , 4 84 , 2 8 1
PERCENT 8 1 . 9% 18 . 1%
1 0 0 . 0 %
2 9 . 4 %
7 0 . 6 %
0 . 1 % 0 . 9 % 4 . 3 %
10 . 4 % 0 . 9 %
3 4 . 3 % 6 . 2 %
5 7 . 1%
13 . 6 %
PERCENT 6 5 . 7 % 3 4 . 3 %
1 0 0 . 0 %
17 . 4 %
8 2 . 6 %
0 . 0 % 2 . 1% 2 . 3 % 5 . 2 % 0 . 1 %
16 . 3 % 1 7 . 2 % 4 3 . 2 %
3 9 . 5 %

COMBINED INCOME STATEMENT - DETAIL ( CONTINUED)
Fiscal Year 2 0 1 3 Statewide Casinos with Rooms Facilities With Gaming Revenue of $72 , 0 0 0 , 0 0 0 and over
Amounts Represent 4 0 Locations .
OTHER INCOME REVENUE
Other Operating and Non-operating Income . . . . . . . . . . . . . . . . Other Complimentary Items . . . . . . . . . . . . . . . . . . . . . . . . . . . . . . .
TOTAL REVENUE . . . . . . . . . . . . . . . . . . . . . . . . . . . . . . . . . . . . . . . . . . . . .
COST OF SALES . . . . . . . . . . . . . . . . . . . . . . . . . . . . . . . . . . . . . . . . . . . . .
GROSS MARGIN . . . . . . . . . . . . . . . . . . . . . . . . . . . . . . . . . . . . . . . . . . . . . .
DEPARTMENTAL EXPENSES Bad Debt Expense . . . . . . . . . . . . . . . . . . . . . . . . . . . . . . . . . . . . . . . . Complimentary Expense . . . . . . . . . . . . . . . . . . . . . . . . . . . . . . . . . . . Payroll - Taxes . . . . . . . . . . . . . . . . . . . . . . . . . . . . . . . . . . . . . . . . . Payroll - Employee Benefits . . . . . . . . . . . . . . . . . . . . . . . . . . . . . Payroll - Officers . . . . . . . . . . . . . . . . . . . . . . . . . . . . . . . . . . . . . . Payroll - Other Employees . . . . . . . . . . . . . . . . . . . . . . . . . . . . . . . Other Departmental Expenses . . . . . . . . . . . . . . . . . . . . . . . . . . . . .
TOTAL DEPARTMENTAL EXPENSES . . . . . . . . . . . . . . . . . . . . . . . . . . . . . . .
DEPARTMENTAL INCOME (LOS S ) . . . . . . . . . . . . . . . . . . . . . . . . . . . . . . . . .
AVERAGE NUMBER OF EMPLOYEES FOR THE YEAR
CASINO DEPARTMENT . . . . . . . . . . . . . . . . . . . . . ROOMS DEPARTMENT . . . . . . . . . . . . . . . . . . . . . . FOOD DEPARTMENT . . . . . . . . . . . . . . . . . . . . . . . BEVERAGE DEPARTMENT . . . . . . . . . . . . . . . . . . . G & A DEPARTMENT . . . . . . . . . . . . . . . . . . . . . OTHER DEPARTMENTS . . . . . . . . . . . . . . . . . . . . .
TOTAL
DOLLARS 2 , 199 , 19 0 , 718
10 7 , 454 , 4 0 3 2 , 3 0 6 , 64 5 , 12 1
2 2 1 , 42 7 , 899
2 , 0 8 5 , 2 1 7 , 222
3 , 993 , 24 4 2 4 , 74 9 , 722 3 6 , 3 98 , 0 8 1 6 6 , 265 , 456
2 , 572 , 4 8 5 3 6 1 , 0 0 8 , 3 4 8 4 8 3 , 3 0 5 , 016 978 , 2 92 , 352
1 , 10 6 , 924 , 8 7 0
2 7 , 157 2 1 , 788 2 8 , 8 6 9
7 , 2 3 7 18 , 715 10 , 2 6 3
114 , 02 9
3 - 3 7
PERCENT 95 . 3 %-
4 . 7 %-1 0 0 . 0 %-
9 . 6 %-
90 . 4 %-
0 . 2 %-1 . 1%-1 . 6 %-2 . 9%-0 . 1%-
15 . 7%-2 1 . 0 %-4 2 . 4 %-
4 8 . 0 %-

3 - 3 8 ROOM OCCUPANCY AND PER ROOM PER DAY ANALYSIS
Fiscal Year 2 0 1 3 Statewide Casinos with Rooms Facilities With Gaming Revenue of $ 72 , 0 0 0 , 0 0 0 and over
Amounts Represent 4 0 Locations .
RATE OF ROOM OCCUPANCY
MONTH JULY . . . . . . . . . .
AUGUST . . . . . . . . SEPTEMBER . . . . . OCTOBER . .. . . . . . NOVEMBER . . . . . . DECEMBER . . . . . . JANUARY . . . . . . . FEBRUARY . . . . . . MARCH . . . . . . . . .
APRIL . . . . . . . . .
MAY . . . . . . . . . . . JUNE . . . . . . . . . .
TOTAL . . . . . . . . .
Average Pit Revenue Per Room Per Day
Average Slot Revenue Per Room Per Day
Average Food Sales Per Room Per Day
AVAILABLE ROOMS ROOMS OCCUPIED
2 , 8 2 6 , 8 8 6 2 , 62 1 , 3 6 0 2 , 8 0 5 , 3 4 3 2 , 5 17 , 765 2 , 7 3 4 , 7 4 3 2 , 4 8 4 , 54 7 2 , 8 1 7 , 1 6 5 2 , 62 4 , 2 5 9 2 , 7 0 7 , 184 2 , 3 02 , 64 6 2 , 8 0 5 , 6 9 6 2 , 2 8 9 , 1 5 3 2 , 8 2 2 , 6 8 1 2 , 4 3 0 , 7 7 0 2 , 5 5 2 , 9 8 5 2 , 3 02 , 6 7 5 2 , 8 5 9 , 0 6 2 2 , 6 7 5 , 1 6 8 2 , 7 5 7 , 2 0 9 2 , 5 7 6 , 3 7 1 2 , 84 8 , 164 2 , 6 3 0 , 1 3 0 2 , 7 6 6 , 6 0 2 2 , 5 9 9 , 6 6 6
3 3 , 3 0 3 , 72 0 3 0 , 0 54 , 5 1 0
PER ROOM PER DAY STATISTICS
9 5 . 3 9
1 3 9 . 8 6
9 0 . 74
Average Beverage Sales Per Room Per Day
Average Rooms Department Payrol l Per Room Per Day
Average Room Rate Per Day
%- OF OCCUPANCY
( COMPUTED ) 92 . 7 3 %-8 9 . 7 5 % 9 0 . 8 5 % 93 . 15 %-8 5 . 0 6 %-8 1 . 5 9 % 8 6 . 12 % 9 0 . 2 0 % 93 . 5 7 % 93 . 4 4 % 92 . 3 4 % 9 3 . 9 7 %
9 0 . 2 4 %
4 2 . 4 6
3 4 . 0 7
1 3 3 . 4 1

PER SQUARE FOOT ANALYSIS AND RATIOS Fiscal Year 2 0 13 Statewide Casinos with Rooms Facil ities With Gaming Revenue of $ 72 , 0 0 0 , 0 0 0 and. over
Amounts Represent 4 0 Locations .
GAMING REVENUE PER SQUARE FOOT OF FLOOR SPACE
3 - 3 9
NO . OF CASINOS AVERAGE AREA GAMING REVENUE AREA OPERATING IN SQUARE FEET PER
Pit ( Includes Bingo and Keno) 4 0 2 0 , 756 Coin Operated Devices 4 0 7 3 , 0 8 5 Poker and Pan 3 5 3 , 5 0 9 Race and Sports 3 7 6 , 6 8 6
TOTAL CASINO 4 0 103 , 0 95
RATIOS
TOTAL CURRENT ASSETS TO TOTAL CURRENT LIABILITIES . . . . . . . . .
TOTAL CAPITAL TO TOTAL LIABILITIES . . . . . . . . . . . . . . . . . . . . . . . .
TOTAL CAPITAL TO TOTAL CURRENT LIABILITIES . . . . . . . . . . . . . . . .
TOTAL CURRENT LIABILITIES TO TOTAL LIABILITIES . . . . . . . . . . . .
TOTAL COMPLIMENTARY EXPENSE TO GAMING REVENUE . . . . . . . . . . . . .
MUSIC AND ENTERTAINMENT EXPENSES TO GAMING REVENUE . . . . . . . .
TOTAL REVENUE TO AVERAGE TOTAL ASSETS . . . . . . . . . . . . . . . . . . . . .
TOTAL REVENUE LESS COMP SALES TO AVERAGE TOTAL ASSETS . . . . .
RETURN ON INVESTED CAPITAL* . . . . . . . . . . . . . . . . . . . . . . . . . . . . . . .
RETURN ON AVERAGE ASSETS* . . . . . . . . . . . . . . . . . . . . . . . . . . . . . . . . .
* - FORMULAS
Return on Invested Capital is equal to the total of net income (before federal income taxes and extraordinary items ) and interest expense divided by the total of average total assets less average current liabilities .
SQUARE FOOT
3 , 4 5 3 1 , 4 3 8 1 , 0 95
522
1 , 7 7 8
PERCENT 148 . 8 %-
4 0 . 6%-
178 . 7%-
22 . 7%-
2 7 . 4%-
3 . 9%-
2 7 . 7 %-
24 . 8 %-
3 . 2 %-
2 . 3 %-
Return on Average Assets is equal to the total o f net income (before federal income taxes and extraordinary items ) and interest expense divided by the average total assets .

3 - 4 0
THIS PAGE LEFT INTENTIONALLY BLANK

COMBINED BALANCE SHEET Fiscal Year 2 0 1 3 Publicly Owned Casino Operations With Gaming Revenue of $ 12 , 0 0 0 , 0 0 0 and over
Amounts Represent 6 6 Locations .
ASSETS CURRENT ASSETS
Cash . . . . . . . . . . . . . . . . . . . . . . . . . . . . . . . . . . . . . . . . . . . . . . . . . . . . Receivables TOTAL ALLOWANCE
Casino 1 , 188 , 115 , 2 7 4 4 9 9 , 859 , 567 Trade 534 , 950 , 6 3 5 19 , 14 7 , 4 91 Sundry 7 , 0 9 9 , 6 10 , 910 694 , 054 Notes 96 , 0 4 6 , 2 7 1 0
Prepaid Expenses . . . . . . . . . . . . . . . . . . . . . . . . . . . . . . . . . . . . . . . . Other Current Assets . . . . . . . . . . . . . . . . . . . . . . . . . . . . . . . . . . . .
TOTAL CURRENT ASSETS . . . . . . . . . . . . . . . . . . . . . . . . . . . . . . . . . . . . . .
FIXED ASSETS COST DEPRECIATION Land 14 , 17 0 , 0 92 , 6 8 4 . . . . . . . . . . . Land Improvements 1 , 2 8 7 , 6 94 , 13 6 4 3 1 , 960 , 2 18 Buildings & Improvements 2 7 , 5 9 8 , 602 , 3 7 2 6 , 4 6 3 , 6 7 7 , 799 Furniture & Equipment 9 , 0 04 , 4 5 7 , 717 5 , 4 6 3 , 6 7 5 , 118 Lease Improvements 6 6 , 7 95 , 0 0 5 2 7 , 2 7 7 , 2 18 Construction in Progress 72 0 , 6 4 1 , 56 0 . . . . . . . . . . .
TOTAL FIXED ASSETS . . . . . . . . . . . . . . . . . . . . . . . . . . . . . . . . . . . . . . . .
OTHER ASSETS
TOTAL ASSETS
LIABILITIES AND CAPITAL CURRENT LIABILITIES
Accounts Payable - Trade . . . . . . . . . . . . . . . . . . . . . . . . . . . . . . . . Accounts Payable - Other . . . . . . . . . . . . . . . . . . . . . . . . . . . . . . . . Current Portion of Long-Term Debt . . . . . . . . . . . . . . . . . . . . . . . Accrued Expenses . . . . . . . . . . . . . . . . . . . . . . . . . . . . . . . . . . . . . . . . Other Current Liabilities . . . . . . . . . . . . . . . . . . . . . . . . . . . . . . .
TOTAL CURRENT LIABILITIES . . . . . . . . . . . . . . . . . . . . . . . . . . . . . . . . .
LONG-TERM DEBT Mortgages Debentures & Bonds Notes Contracts Other
TOTAL LONG-TERM DEBT OTHER LIABILITIES TOTAL LIABILITIES
CAPITAL
TOTAL OWING 10 , 4 7 1 , 953 , 4 55
2 , 7 16 , 2 9 8 , 8 0 5 1 , 3 7 1 , 7 2 8 , 184
9 , 7 14 , 3 2 3 8 , 4 92 , 907 , 176
2 3 , 062 , 6 0 1 , 943
CURRENT PORTION 4 5 , 0 12 , 4 6 1
1 , 055 , 3 4 8 , 4 98 12 , 6 1 1 , 547
4 , 4 11 , 3 6 3 73 , 4 7 8 , 2 0 6
1 , 190 , 8 62 , 0 7 5
Owners Capital Accounts . . . . . . . . . . . . . . . . . . . . . . . . . . . . . . . . . Capital Stock & Other Capital . . . . . . . . . . . . . . . . . . . . . . . . . . . Retained Earnings . . . . . . . . . . . . . . . . . . . . . . . . . . . . . . . . . . . . . . .
TOTAL CAPITAL . . . . . . . . . . . . . . . . . . . . . . . . . . . . . . . . . . . . . . . . . . . . .
TOTAL LIABILITIES AND CAPITAL . . . . . . . . . . . . . . . . . . . . . . . . . . . . . .
Average Assets 922 , 3 0 9 , 825
Upper Quartile 1 , 0 95 , 919 , 3 3 8
Median 352 , 3 7 0 , 599
3 - 4 1
DOLLARS PERCENT 1 , 7 6 7 , 0 6 7 , 2 6 2
6 8 8 , 2 5 5 , 7 0 7 5 15 , 8 0 3 , 144
7 , 0 98 , 916 , 8 5 6 96 , 04 6 , 2 7 1
3 3 2 , 858 , 254 4 , 152 , 92 3 , 960
14 , 651 , 8 7 1 , 4 5 4
14 , 17 0 , 0 92 , 684 8 55 , 73 3 , 918
2 1 , 134 , 924 , 5 73 3 , 54 0 , 7 8 2 , 5 9 9
3 9 , 5 1 7 , 7 8 7 7 2 0 , 64 1 , 5 6 0
4 0 , 4 6 1 , 6 93 1 12 1
5 , 75 8 , 8 8 3 ! 8 7 6
6 0 1 8 72 , 4 4 8 1 45 1
2 82 , 63 2 , 3 9 1 2 , 4 63 , 4 2 7 , 719 1 , 19 0 , 8 6 2 , 075
8 3 9 , 985 , 5 3 2 4 , 32 9 , 8 0 3 , 92 6 9 , 10 6 , 7 1 1 , 643
10 , 42 6 , 94 0 , 994 1 , 6 6 0 , 95 0 , 3 0 7 1 , 3 5 9 , 116 , 63 7
5 , 3 0 2 , 9 6 0 8 , 4 19 , 4 2 8 , 970
2 1 , 8 71 , 73 9 , 8 6 8 10 , 4 8 8 , 0 0 1 , 0 0 1 4 1 , 4 6 6 1 452 , 512
- 4 , 754 , 24 8 , 2 4 9 2 2 , 0 8 6 , 0 3 0 , 2 0 0
2 , 0 74 , 213 , 9 8 8 19 , 4 0 5 , 995 , 93 9
6 0 , 872 , 44 8 ! 4 5 1
Lower Quartile 74 , 3 17 , 130
2 . 9%
1 . 1% 0 . 8 %
11 . 7% 0 . 2 % 0 . 5 % 6 . 8 %
24 . 1%
2 3 . 3 % 1 . 4 %
3 4 . 7 % 5 . 8 % 0 . 1% 1 . 2 %
6 6 . 5%
9 . 5%
100 . 0 %
0 . 5 % 4 . 0 % 2 . 0 % 1 . 4 % 7 . 1%
15 . 0 %
17 . 1% 2 . 7 % 2 . 2 % 0 . 0 %
13 . 8 % 35 . 9% 17 . 2 % 6 8 . 1%
- 7 . 8 % 3 6 . 3 %
3 . 4 % 3 1 . 9%
1 0 0 . 0 %

3 - 4 2 COMBINED INCOME STATEMENT - SUMMARY
Fiscal Year 2 0 13 Publ icly Owned Casino Operations With Gaming Revenue of $ 12 , 0 0 0 , 0 0 0 and over
Amounts Represent 6 6 Locations .
REVENUE DOLLARS PERCENT Gaming . . . . . . . . . . . . . . . . . . . . . . . . . . . . . . . . . . . . . . . . . . . . . . . . . . 7 , 9 65 , 0 4 0 , 3 4 3 Rooms . . . . . . . . . . . . . . . . . . . . . . . . . . . . . . . . . . . . . . . . . . . . . . . . . . . 4 , 1 0 2 , 4 15 , 2 2 0 Food . . . . . . . . . . . . . . . . . . . . . . . . . . . . . . . . . . . . . . . . . . . . . . . . . . . . 2 , 7 8 3 , 1 1 7 , 7 7 5 Beverage . . . . . . . . . . . . . . . . . . . . . . . . . . . . . . . . . . . . . . . . . . . . . . . . 1 , 3 12 , 7 9 1 , 5 4 5 Other . . . . . . . . . . . . . . . . . . . . . . . . . . . . . . . . . . . . . . . . . . . . . . . . . . . 2 , 3 94 , 5 8 8 , 7 3 5
TOTAL REVENUE . . . . . . . . . . . . . . . . . . . . . . . . . . . . . . . . . . . . . . . . . . . . . 1 8 , 5 5 7 , 9 5 3 , 6 1 8
COST O F SALES 1 , 3 6 1 , 0 7 6 , 5 8 8
GROSS MARGIN 1 7 , 1 96 , 8 7 7 , 0 3 0
DEPARTMENTAL EXPENSES . . . . . . . . . . . . . . . . . . . . . . . . . . . . . . . . . . . . . 9 , 6 8 7 , 55 3 , 8 1 9
DEPARTMENTAL INCOME ( LOS S ) 7 , 5 0 9 , 3 2 3 , 2 11
GENERAL AND ADMINISTRATIVE EXPENSES Adverti s ing and Promotion . . . . . . . . . . . . . . . . . . . . . . . . . . . . . . . 2 5 9 , 5 0 0 , 3 1 0 Bad Debt Expense . . . . . . . . . . . . . . . . . . . . . . . . . . . . . . . . . . . . . . . . 2 , 6 8 4 , 0 2 8 Compl imentary Expense ( not reported in departments ) . . . . . . 1 17 , 62 5 , 4 2 7 Depreciation - Buildings . . . . . . . . . . . . . . . . . . . . . . . . . . . . . . . . 1 , 1 3 9 , 0 0 6 , 2 7 9 Depreciation and Amorti zation - Other . . . . . . . . . . . . . . . . . . . 8 7 9 , 1 0 0 , 4 5 6 Energy Expense ( electric ity , gas , etc . ) . . . . . . . . . . . . . . . . . 2 6 7 , 5 7 5 , 7 6 3 Equipment Rental or Lease . . . . . . . . . . . . . . . . . . . . . . . . . . . . . . . 6 , 5 0 5 , 7 2 3 Interest Expense . . . . . . . . . . . . . . . . . . . . . . . . . . . . . . . . . . . . . . . . 2 , 7 13 , 0 2 2 , 34 0 Music and Entertainment . . . . . . . . . . . . . . . . . . . . . . . . . . . . . . . . . 2 8 5 , 4 9 0 , 2 98 Payroll Taxes . . . . . . . . . . . . . . . . . . . . . . . . . . . . . . . . . . . . . . . . . . . 7 8 , 0 4 7 , 0 2 9 Payroll - Employee Benefits . . . . . . . . . . . . . . . . . . . . . . . . . . . . . 2 98 , 994 , 8 7 1 Payroll - Officers . . . . . . . . . . . . . . . . . . . . . . . . . . . . . . . . . . . . . . 2 0 , 1 9 1 , 7 3 6 Payrol l - Other Employees . . . . . . . . . . . . . . . . . . . . . . . . . . . . . . . 8 82 , 5 6 1 , 7 9 8 Rent o f Premises . . . . . . . . . . . . . . . . . . . . . . . . . . . . . . . . . . . . . . . . 3 4 , 3 1 7 , 6 6 5 Taxes - Real Estate . . . . . . . . . . . . . . . . . . . . . . . . . . . . . . . . . . . . . 1 8 1 , 2 4 7 , 8 7 3 Taxes and Licenses - Other . . . . . . . . . . . . . . . . . . . . . . . . . . . . . . 3 6 , 6 5 8 , 8 5 9 Utilities ( Other than Energy Expense) . . . . . . . . . . . . . . . . . . . 95 , 8 3 2 , 4 8 2 Other General and Administrative Expenses . . . . . . . . . . . . . . . 1 , 5 3 0 , 7 6 9 , 6 8 2
8 , 8 2 9 , 13 2 , 6 1 9 TOTAL GENERAL AND ADMINISTRATIVE EXPENSES . . . . . . . . . . . . · · · · ·--
�������
NET INCOME ( LOSS) BEFORE FEDERAL INCOME TAXES AND EXTRAORDINARY ITEMS . . . . . . . . . . . . . . . . . . . . . . . . . . . . . . . . . . . . - 1 , 3 19 , 8 0 9 , 4 0 8
Average Revenue 2 8 1 , 18 1 , 115
Upper Quartile 2 94 , 8 8 8 , 8 7 1
Median 1 3 4 , 1 73 , 82 7
Lower Quartile 6 9 , 0 2 0 , 94 0
4 2 . 9 % 22 . 1% 15 . 0 %
7 . 1% 12 . 9%
1 0 0 . 0 %
7 . 3 %
92 . 7 %
52 . 2 %
4 0 . 5 %
1 . 4 % 0 . 0 % 0 . 6 % 6 . 1% 4 . 7% 1 . 4 % 0 . 0 %
14 . 6 % 1 . 5 % 0 . 4 % 1 . 6 % 0 . 1 % 4 . 8 % 0 . 2 % 1 . 0 % 0 . 2 % 0 . 5 % 8 . 2 %
4 7 . 6 %
- 7 . 1%

COMBINED INCOME STATEMENT - DETAIL Fiscal Year 2 0 1 3 Publicly Owned Casino Operations With Gaming Revenue of $12 , 0 0 0 , 0 0 0 and over
Amounts Represent 66 Locations .
CASINO DEPARTMENT
REVENUE
Pit Revenue ( Includes Keno and Bingo) . . . . . . . . . . . . . . . . . . . Coin Operated Devices . . . . . . . . . . . . . . . . . . . . . . . . . . . . . . . . . . . Poker and Pan . . . . . . . . . . . . . . . . . . . . . . . . . . . . . . . . . . . . . . . . . . . Race Book . . . . . . . . . . . . . . . . . . . . . . . . . . . . . . . . . . . . . . . . . . . . . . . Sports Pool . . . . . . . . . . . . . . . . . . . . . . . . . . . . . . . . . . . . . . . . . . . . .
TOTAL REVENUE . . . . . . . . . . . . . . . . . . . . . . . . . . . . . . . . . . . . . . . . . . . . .
DEPARTMENTAL EXPENSES Bad Debt Expense . . . . . . . . . . . . . . . . . . . . . . . . . . . . . . . . . . . . . . . . Commis sions . . . . . . . . . . . . . . . . . . . . . . . . . . . . . . . . . . . . . . . . . . . . . Complimentary Expense . . . . . . . . . . . . . . . . . . . . . . . . . . . . . . . . . . . Gaming Taxes and Licenses . . . . . . . . . . . . . . . . . . . . . . . . . . . . . . . Preferred Guest Expenses (no complimentaries ) . . . . . . . . . . . Payroll Taxes . . . . . . . . . . . . . . . . . . . . . . . . . . . . . . . . . . . . . . . . . . . Payroll - Employee Benefits . . . . . . . . . . . . . . . . . . . . . . . . . . . . . Payrol l - Officers . . . . . . . . . . . . . . . . . . . . . . . . . . . . . . . . . . . . . . Payroll - Other Employees . . . . . . . . . . . . . . . . . . . . . . . . . . . . . . . Race Wire Fees . . . . . . . . . . . . . . . . . . . . . . . . . . . . . . . . . . . . . . . . . . Other Departmental Expenses . . . . . . . . . . . . . . . . . . . . . . . . . . . . .
TOTAL DEPARTMENTAL EXPENSES . . . . . . . . . . . . . . . . . . . . . . . . . . . . . . .
DEPARTMENTAL INCOME (LOSS ) . . . . . . . . . . . . . . . . . . . . . . . . . . . . . . . . .
ROOMS DEPARTMENT
REVENUE
Room Sales . . . . . . . . . . . . . . . . . . . . . . . . . . . . . . . . . . . . . . . . . . . . . . Complimentary Rooms . . . . . . . . . . . . . . . . . . . . . . . . . . . . . . . . . . . . .
TOTAL REVENUE . . . . . . . . . . . . . . . . . . . . . . . . . . . . . . . . . . . . . . . . . . . . .
DEPARTMENTAL EXPENSES Bad Debt Expense . . . . . . . . . . . . . . . . . . . . . . . . . . . . . . . . . . . . . . . . Complimentary Expense . . . . . . . . . . . . . . . . . . . . . . . . . . . . . . . . . . . Payroll - Taxes . . . . . . . . . . . . . . . . . . . . . . . . . . . . . . . . . . . . . . . . . Payroll - Employee Benefits . . . . . . . . . . . . . . . . . . . . . . . . . . . . . Payroll - Officers . . . . . . . . . . . . . . . . . . . . . . . . . . . . . . . . . . . . . . Payroll - Other Employees . . . . . . . . . . . . . . . . . . . . . . . . . . . . . . . Other Departmental Expenses . . . . . . . . . . . . . . . . . . . . . . . . . . . . .
TOTAL DEPARTMENTAL EXPENSES . . . . . . . . . . . . . . . . . . . . . . . . . . . . . . .
DEPARTMENTAL INCOME (LOSS ) . . . . . . . . . . . . . . . . . . . . . . . . . . . . . . . . .
DOLLARS 2 , 92 6 , 082 , 8 5 5 4 , 7 8 0 , 5 7 9 , 155
1 2 8 , 03 9 , 3 4 0 4 6 , 24 9 , 8 2 7 84 , 0 8 9 , 1 6 6
7 , 965 , 04 0 , 3 4 3
142 , 634 , 1 7 9 3 5 , 912 , 5 2 4
1 , 7 95 , 8 76 , 6 0 1 6 0 2 , 4 73 , 14 9 2 2 2 , 792 , 5 8 4 1 3 9 , 173 , 7 7 3 2 5 3 , 813 , 1 2 6
16 , 152 , 0 6 1 922 , 8 94 , 2 94
7 , 6 16 , 42 7 6 98 , 0 75 , 3 1 0
4 , 8 3 7 , 4 14 , 0 2 8
3 , 12 7 , 6 2 6 , 3 15
DOLLARS 3 , 24 2 , 760 , 2 15
85 9 , 655 , 0 0 5 4 , 102 , 4 15 , 2 2 0
12 , 93 6 , 2 8 5 113 , 0 9 5 , 6 5 3
8 0 , 94 6 , 7 7 8 2 3 1 , 4 7 0 , 8 3 1
5 , 910 , 05 1 7 6 8 , 5 5 9 , 2 6 2 5 0 0 , 3 9 5 , 4 2 4
1 , 7 13 , 3 14 , 2 8 4
2 , 3 8 9 , 10 0 , 9 3 6
3 - 4 3
PERCENT 3 6 . 7 % 6 0 . 0 %
1 . 6 % 0 . 6 % 1 . 1%
100 . 0 %
1 . 8 % 0 . 5%
22 . 5% 7 . 6% 2 . 8 % 1 . 7 % 3 . 2 % 0 . 2 %
1 1 . 6 % 0 . 1% 8 . 8 %
6 0 . 7%
3 9 . 3 %
PERCENT 7 9 . 0 % 2 1 . 0 %
100 . 0 %
0 . 3 % 2 . 8 % 1 . 9 % 5 . 6% 0 . 1%
18 . 7% 12 . 2 % 4 1 . 8 %
5 8 . 2 %

3 -4 4 COMBINED INCOME STATEMENT - DETAIL ( CONTINUED)
Fiscal Year 2 0 13 Publicly Owned Cas ino Operations With Gaming Revenue of $12 , 0 0 0 , 0 0 0 and over
Amounts Represent 6 6 Locations .
FOOD DEPARTMENT REVENUE DOLLARS PERCENT
Food Sales 2 , 2 6 5 , 3 14 , 9 6 3 8 1 . 4 % Complimentary Food Sales . . . . . . . . . . . . . . . . . . . . . . . . . . . . . . . . 5 1 7 , 8 0 2 , 8 1 2 18 . 6 %
TOTAL REVENUE . . . . . . . . . . . . . . . . . . . . . . . . . . . . . . . . . . . . . . . . . . . . . 2 , 7 8 3 , 117 , 7 7 5 1 0 0 . 0 %
COST OF SALES 8 5 0 , 4 6 7 , 1 0 6 3 0 . 6 %
GROSS MARGIN 1 , 9 3 2 , 65 0 , 6 6 9 6 9 . 4 %
DEPARTMENTAL EXPENSES Bad Debt Expense . . . . . . . . . . . . . . . . . . . . . . . . . . . . . . . . . . . . . . . . 3 , 0 0 8 , 7 0 4 0 . 1 % Complimentary Expense . . . . . . . . . . . . . . . . . . . . . . . . . . . . . . . . . . . 24 , 2 9 1 , 5 0 7 0 . 9% Payrol l - Taxes . . . . . . . . . . . . . . . . . . . . . . . . . . . . . . . . . . . . . . . . . 122 , 6 92 , 15 1 4 . 4 % Payrol l - Employee Benefits . . . . . . . . . . . . . . . . . . . . . . . . . . . . . 2 9 8 , 544 , 3 5 8 1 0 . 7% Payrol l - Officers . . . . . . . . . . . . . . . . . . . . . . . . . . . . . . . . . . . . . . 2 7 , 7 9 9 , 3 3 8 1 . 0 % Payrol l - Other Employees . . . . . . . . . . . . . . . . . . . . . . . . . . . . . . . 9 75 , 3 2 7 , 6 7 9 3 5 . 0 % Other Departmental Expenses . . . . . . . . . . . . . . . . . . . . . . . . . . . . . 1 5 7 , 8 6 2 , 2 5 9 5 . 7 %
TOTAL DEPARTMENTAL EXPENSES . . . . . . . . . . . . . . . . . . . . . . . . . . . . . . . 1 , 6 0 9 , 52 5 , 9 9 6 5 7 . 8 %
DEPARTMENTAL INCOME ( LOSS) . . . . . . . . . . . . . . . . . . . . . . . . . . . . . . . . . 3 2 3 , 124 , 6 7 3 1 1 . 6 %
BEVERAGE DEPARTMENT REVENUE DOLLARS PERCENT
Beverage Sales . . . . . . . . . . . . . . . . . . . . . . . . . . . . . . . . . . . . . . . . . . 8 3 9 , 4 5 0 1 7 1 8 63 . 9% Complimentary Beverage Sales . . . . . . . . . . . . . . . . . . . . . . . . . . . . 4 73 , 34 0 , 8 2 7 3 6 . 1%
TOTAL REVENUE . . . . . . . . . . . . . . . . . . . . . . . . . . . . . . . . . . . . . . . . . . . . . 1 , 3 12 , 7 9 1 , 5 4 5 1 0 0 . 0 %
COST OF SALES 2 3 4 , 2 2 8 , 7 9 9 17 . 8 %
GROSS MARGIN . . . . . . . . . . . . . . . . . . . . . . . . . . . . . . . . . . . . . . . . . . . . . . 1 , 0 7 8 , 56 2 , 74 6 82 . 2 %
DEPARTMENTAL EXPENSES Bad Debt Expense . . . . . . . . . . . . . . . . . . . . . . . . . . . . . . . . . . . . . . . . 4 17 , 3 92 0 . 0 % Complimentary Expense . . . . . . . . . . . . . . . . . . . . . . . . . . . . . . . . . . . 2 6 , 6 2 8 , 3 18 2 . 0 % Payrol l - Taxes . . . . . . . . . . . . . . . . . . . . . . . . . . . . . . . . . . . . . . . . . 3 1 , 6 6 1 , 8 8 3 2 . 4 % Payrol l - Employee Benefits . . . . . . . . . . . . . . . . . . . . . . . . . . . . . 72 , 5 04 , 64 3 5 . 5 % Payrol l - Off icers . . . . . . . . . . . . . . . . . . . . . . . . . . . . . . . . . . . . . . 3 6 6 , 1 7 5 0 . 0 % Payrol l - Other Employees . . . . . . . . . . . . . . . . . . . . . . . . . . . . . . . 222 , 0 3 4 , 152 16 . 9 % Other Departmental Expenses . . . . . . . . . . . . . . . . . . . . . . . . . . . . . 2 1 9 , 3 3 4 , 4 1 9 1 6 . 7 %
TOTAL DEPARTMENTAL EXPENSES . . . . . . . . . . . . . . . . . . . . . . . . . . . . . . . 5 72 , 94 6 , 9 8 2 4 3 . 6 %
DEPARTMENTAL INCOME ( LOSS ) . . . . . . . . . . . . . . . . . . . . . . . . . . . . . . . . . 5 0 5 , 6 1 5 , 764 3 8 . 5 %

COMBINED INCOME STATEMENT - DETAIL ( CONTINUED)
Fiscal Year 2 0 13 Publicly Owned Casino Operations With Gaming Revenue of $ 12 , 0 0 0 , 0 0 0 and over
Amounts Represent 6 6 Locations .
OTHER INCOME REVENUE
Other Operating and Non-operating Income . . . . . . . . . . . . . . . .
Other Complimentary Items . . . . . . . . . . . . . . . . . . . . . . . . . . . . . . .
TOTAL REVENUE . . . . . . . . . . . . . . . . . . . . . . . . . . . . . . . . . . . . . . . . . . . . .
COST OF SALES . . . . . . . . . . . . . . . . . . . . . . . . . . . . . . . . . . . . . . . . . . . . .
GROSS MARGIN . . . . . . . . . . . . . . . . . . . . . . . . . . . . . . . . . . . . . . . . . . . . . .
DEPARTMENTAL EXPENSES Bad Debt Expense . . . . . . . . . . . . . . . . . . . . . . . . . . . . . . . . . . . . . . . .
Complimentary Expense . . . . . . . . . . . . . . . . . . . . . . . . . . . . . . . . . . .
Payrol l - Taxes . . . . . . . . . . . . . . . . . . . . . . . . . . . . . . . . . . . . . . . . .
Payroll - Employee Benefits . . . . . . . . . . . . . . . . . . . . . . . . . . . . .
Payroll - Officers . . . . . . . . . . . . . . . . . . . . . . . . . . . . . . . . . . . . . .
Payroll - Other Employees . . . . . . . . . . . . . . . . . . . . . . . . . . . . . . .
Other Departmental Expenses . . . . . . . . . . . . . . . . . . . . . . . . . . . . .
TOTAL DEPARTMENTAL EXPENSES . . . . . . . . . . . . . . . . . . . . . . . . . . . . . . .
DEPARTMENTAL INCOME (LOSS ) . . . . . . . . . . . . . . . . . . . . . . . . . . . . . . . . .
AVERAGE NUMBER OF EMPLOYEES FOR THE YEAR
CASINO DEPARTMENT . . . . . . . . . . . . . . . . . . . . .
ROOMS DEPARTMENT . . . . . . . . . . . . . . . . . . . . . .
FOOD DEPARTMENT . . . . . . . . . . . . . . . . . . . . . . .
BEVERAGE DEPARTMENT . . . . . . . . . . . . . . . . . . .
G & A DEPARTMENT . . . . . . . . . . . . . . . . . . . . .
OTHER DEPARTMENTS . . . . . . . . . . . . . . . . . . . . .
TOTAL
DOLLARS 2 , 2 8 1 , 178 , 590
113 , 4 10 , 145 2 , 3 94 , 5 88 , 7 3 5
2 76 , 3 8 0 , 6 8 3
2 , 118 , 208 , 052
3 , 7 8 0 , 8 84 2 3 , 822 , 13 3 3 7 , 342 , 2 5 0 7 0 , 52 7 , 2 2 1
2 , 892 , 2 0 8 3 6 8 , 2 7 7 , 54 3 4 4 7 , 7 10 , 2 9 0 954 , 3 52 , 52 9
1 , 163 , 855 , 523
2 9 , 7 8 3 22 , 8 7 0 3 0 , 4 0 6
7 , 622 2 0 , 0 95 1 0 , 7 2 0
12 1 , 4 9 6
3 - 4 5
PERCENT 95 . 3 %
4 . 7 % 1 0 0 . 0 %
11 . 5 %
8 8 . 5%
0 . 2 % 1 . 0 % 1 . 6 % 2 . 9% 0 . 1%
15 . 4 % 18 . 7 % 3 9 . 9%
4 8 . 6 %
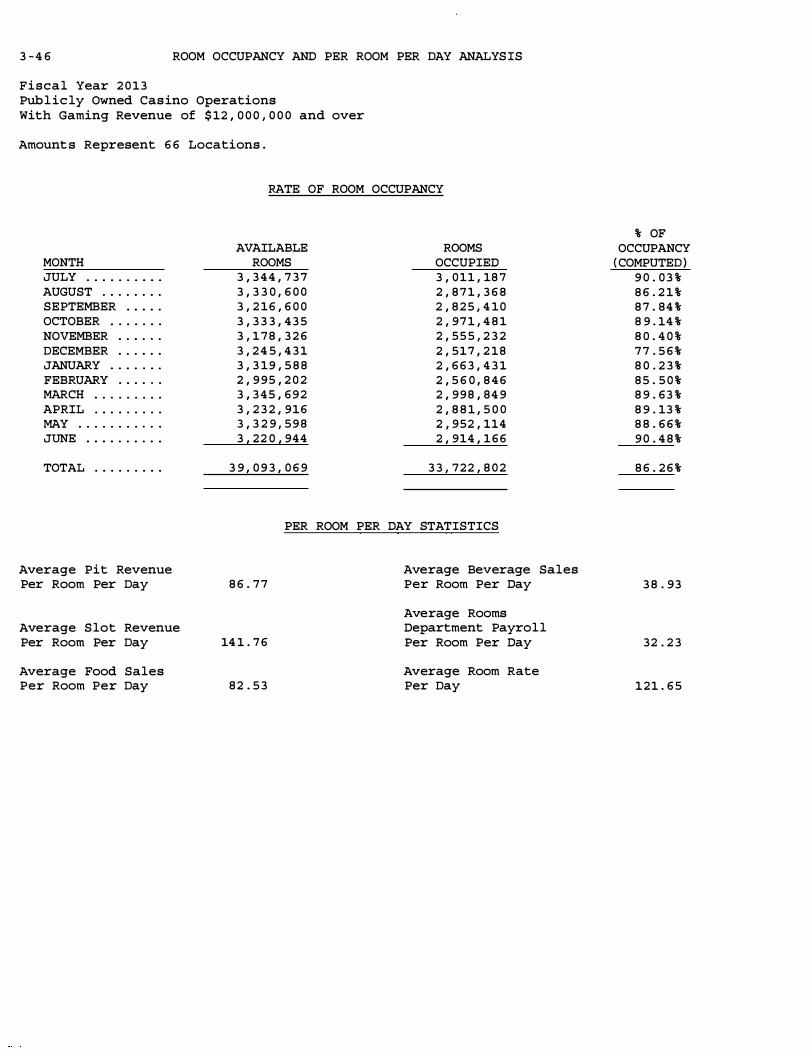
3 - 4 6 ROOM OCCUPANCY AND PER ROOM PER DAY ANALYSIS
Fiscal Year 2 0 13 Pub l ic ly Owned Casino Operations With Gaming Revenue of $ 12 , 0 0 0 , 0 0 0 and over
Amount s Represent 6 6 Locations .
RATE OF ROOM OCCUPANCY
MONTH JULY . . . . . . . . . . AUGUST . . . . . . . . SEPTEMBER . . . . . OCTOBER . . . . . . . NOVEMBER . . . . . . DECEMBER . . . . . . JANUARY . . . . . . . FEBRUARY . . . . . . MARCH . . . . . . . . . APRIL . . . . . . . . . MAY . . . . . . . . . . .
JUNE . . . . . . . . . .
TOTAL . . . . . . . . .
Average Pit Revenue Per Room Per Day
Average Slot Revenue Per Room Per Day
Average Food Sales Per Room Per Day
AVAILABLE ROOMS ROOMS OCCUPIED
3 , 3 4 4 , 7 3 7 3 , 0 11 , 18 7 3 , 3 3 0 , 6 0 0 2 , 8 7 1 , 3 6 8 3 , 2 16 , 6 0 0 2 , 8 2 5 , 4 10 3 , 3 3 3 , 4 3 5 2 , 97 1 , 4 8 1 3 , 1 7 8 , 3 2 6 2 , 55 5 , 2 3 2 3 , 2 4 5 , 4 3 1 2 , 5 17 , 2 18 3 , 3 19 , 5 8 8 2 , 6 6 3 , 4 3 1 2 , 9 95 , 2 0 2 2 , 5 6 0 , 8 4 6 3 , 3 4 5 , 6 9 2 2 , 998 , 84 9 3 , 2 3 2 , 916 2 , 8 8 1 , 5 0 0 3 , 3 2 9 , 5 9 8 2 , 952 , 114 3 , 22 0 , 944 2 , 914 , 1 6 6
3 9 , 0 9 3 , 0 6 9 3 3 , 722 , 8 0 2
PER ROOM PER DAY STATISTICS
8 6 . 7 7
14 1 . 7 6
8 2 . 5 3
Average Beverage Sales Per Room Per Day
Average Rooms Department Payroll Per Room Per Day
Average Room Rate Per Day
% OF OCCUPANCY
( COMPUTED ) 9 0 . 0 3 % 8 6 . 2 1 % 8 7 . 84 % 8 9 . 14 % 8 0 . 4 0 % 7 7 . 5 6 % 8 0 . 2 3 % 8 5 . 5 0 % 8 9 . 63 % 8 9 . 13 % 8 8 . 6 6 % 9 0 . 4 8 %
8 6 . 2 6 %
3 8 . 93
32 . 2 3
1 2 1 . 6 5
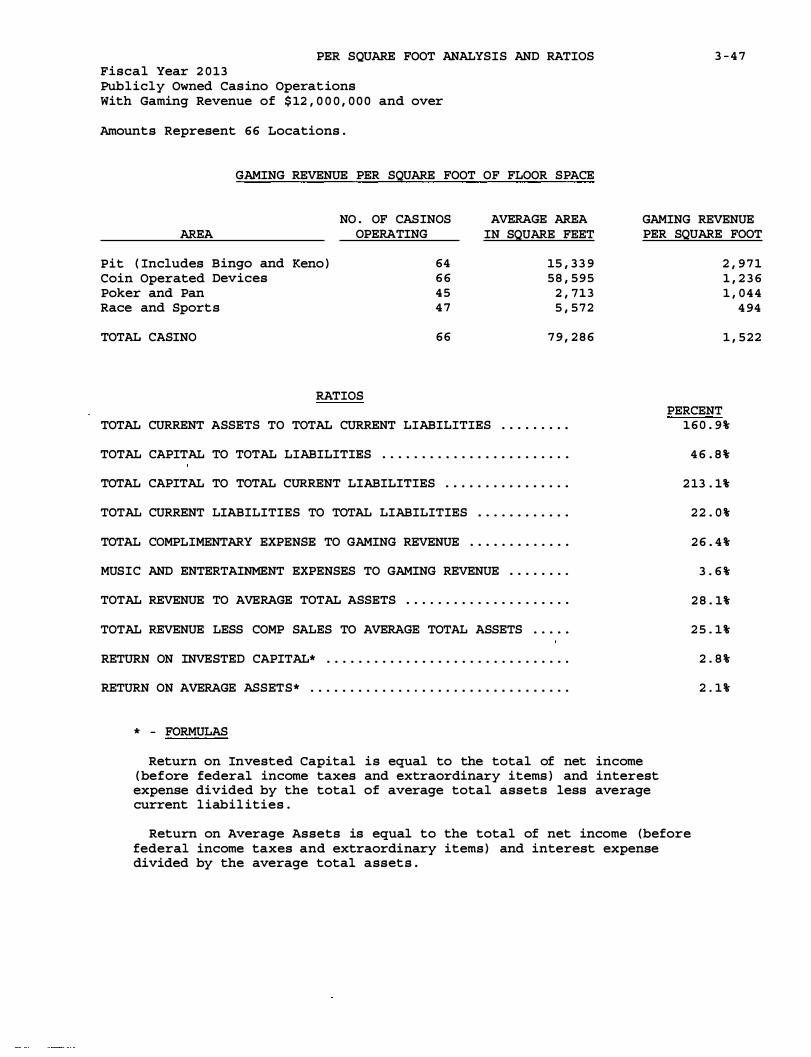
PER SQUARE FOOT ANALYSIS AND RATIOS 3 - 4 7 Fiscal Year 2 0 13 Publicly Owned Casino Operations With Gaming Revenue of $ 12 , 0 0 0 , 0 0 0 and over
Amounts Represent 66 Locations .
GAMING REVENUE PER SQUARE FOOT OF FLOOR SPACE
NO . OF CASINOS AVERAGE AREA GAMING REVENUE AREA OPERATING IN SQUARE FEET PER SQUARE FOOT
Pit ( Includes Bingo and Keno ) 64 15 , 3 3 9 Coin Operated Devices 6 6 58 , 595 Poker and Pan 45 2 , 713 Race and Sports 4 7 5 , 572
TOTAL CASINO 66 7 9 , 2 8 6
RATIOS
TOTAL CURRENT ASSETS TO TOTAL CURRENT LIABILITIES . . . . . . . . .
TOTAL CAPITAL TO TOTAL LIABILITIES . . . . . . . . . . . . . . . . . . . . . . . .
TOTAL CAPITAL TO TOTAL CURRENT LIABILITIES . . . . . . . . . . . . . . . .
TOTAL CURRENT LIABILITIES TO TOTAL LIABILITIES . . . . . . . . . . . .
TOTAL COMPLIMENTARY EXPENSE TO GAMING REVENUE . . . . . . . . . . . . .
MUSIC AND ENTERTAINMENT EXPENSES TO GAMING REVENUE . . . . . . . .
TOTAL REVENUE TO AVERAGE TOTAL ASSETS . . . . . . . . . . . . . . . . . . . . .
TOTAL REVENUE LESS COMP SALES TO AVERAGE TOTAL ASSETS . . . . .
RETURN ON INVESTED CAPITAL* . . . . . . . . . . . . . . . . . . . . . . . . . . . . . . .
RETURN ON AVERAGE ASSETS* . . . . . . . . . . . . . . . . . . . . . . . . . . . . . . . . .
* - FORMULAS
Return on Invested Capital is equal to the total of net income ( before federal income taxes and extraordinary items ) and interest expense divided by the total of average total assets less average current liabil ities .
2 , 9 7 1 1 , 2 3 6 1 , 0 4 4
4 94
1 , 522
PERCENT 160 . 9%
4 6 . 8 %
2 13 . 1%
2 2 . 0 %
2 6 . 4 %
3 . 6 %
2 8 . 1%
2 5 . 1%
2 . 8 %
2 . 1%
Return on Average Assets is equal to the total of net income (before federal income taxes and extraordinary items ) and interest expense divided by the average total assets .

3 - 4 8
THIS PAGE LEFT INTENTIONALLY BLANK