Neutron star cooling and the symmetry energy
34
Neutron star cooling and the symmetry energy Questions from yesterday’s discussion Why is R nearly constant? What would R < 11 km and M max > 2 M sun imply? Cooling neutron stars Cooling with large and small proton fractions Isolated neutron stars Transient neutron stars Tuesday, July 30, 13
Transcript of Neutron star cooling and the symmetry energy

Neutron star cooling and the symmetry energy
Questions from yesterday’s discussion
Why is R nearly constant?
What would R < 11 km and Mmax > 2 Msun imply?
Cooling neutron stars
Cooling with large and small proton fractions
Isolated neutron stars
Transient neutron stars
Tuesday, July 30, 13
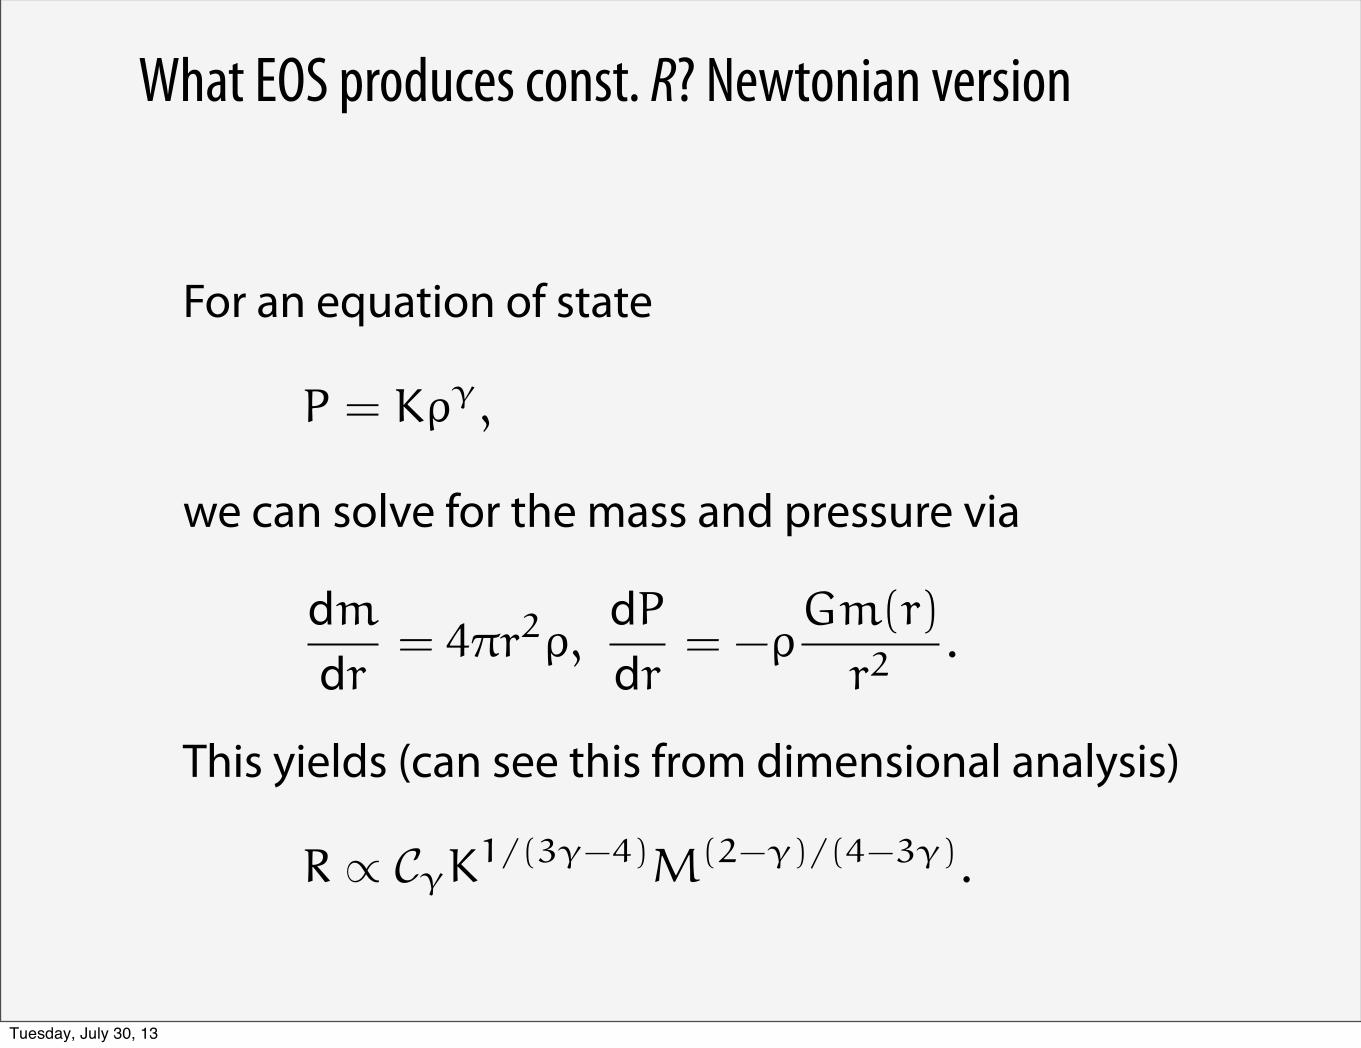
What EOS produces const. R? Newtonian version
P = K��,
m
r= 4�r2�,
P
r= ��
Gm(r)
r2.
R � C�K1/(3��4)M(2��)/(4�3�).
Tuesday, July 30, 13

What EOS produces const. R? Newtonian version
P = K��,
m
r= 4�r2�,
P
r= ��
Gm(r)
r2.
R � C�K1/(3��4)M(2��)/(4�3�).
Tuesday, July 30, 13

What EOS produces const. R? Relativistic version
120 J.M. Lattimer, M. Prakash / Physics Reports 442 (2007) 109–165
Fig. 4. Empirical demonstration of the constancy Rp−1/4∗ , for 1 M# (upper panel) and 1.4 M# (lower panel) stars. For each mass, 3 fiducial number
densities are selected. Figure and EOS labels are from Ref. [6].
This correlation is significant because the pressure of degenerate neutron-star matter near the nuclear saturationdensity ns is, in large part, determined by the symmetry properties of the EOS. For the present discussion, we introducethe incompressibility K and the skewness K ′, and expand the nucleonic energy per particle about its values at ns andx = 1/2, where x is the proton fraction:
E(n, x) = −16 + K
18
(1 − n
ns
)2
+ K ′
27
(1 − n
ns
)3
+ Esym(n)(1 − 2x)2 . . . . (20)
Here, Esym is the symmetry energy function, approximately the energy difference at a given density between symmetricand pure neutron matter. The symmetry energy parameter is defined as Sv ≡ Esym(ns). For the total energy, leptoniccontributions (mainly from electrons as that from muons is small in the vicinity of the nuclear equilibrium density)
Ee = (3/4)hcx(3!2nx4)1/3 (21)
must be added to E(n, x). Because catalyzed matter in neutron stars is in beta equilibrium, i.e., "e ="n−"p =−!E/!x,the equilibrium proton fraction at ns is
xs & (3!2ns)−1(4Sv/hc)3 & 0.04 . (22)
This small value of xs enables the pressure at ns to be expressed as
P(ns, xs) =(
n2 ![E(n, x) + Ee(n, x)]!n
)
ns,xs
= ns(1 − 2xs)[nsS′v(1 − 2xs) + Svxs] & n2
s S′v , (23)
where S′v ≡ (!Esym/!n)ns
. The pressure depends primarily upon S′v , because the terms proportional to xs are relatively
small. The equilibrium pressure at moderately larger densities is similarly insensitive to K and K ′. Experimental con-straints to the compression modulus K, most importantly from analyses of giant monopole resonances give K!220 MeV[72]. The skewness parameter K ′ has been estimated to lie in the range (1780–2380) MeV [73]. Evaluating the pressurefor n = 1.5ns ,
P(1.5ns) = 2.25ns[K/18 − K ′/216 + ns(1 − 2x)2(!Esym/!n)1.5ns]. (24)
Tuesday, July 30, 13

Near saturation, P ~ ρ2 and is dominated by L
�0 x = �p/(�n + �p) = 1/2
E(�, x) = E0+K
18
��
�0� 1
�2
+
�S0 +
L
3
��
�0� 1
��(1�2x)2.
P = �2 �E
��
� � �0 x � 1
P(� � �0, x � 1) � L
3�0�2.
Tuesday, July 30, 13

Questions
1. A realistic E(ρ,x) is !t to nuclear masses, scattering, etc. at ρ around ρ0. How large a prior does this place on NS models? What happens if the Mmax > 2.0 Msun result is added?
2. If we want to have substantially smaller radii, how does E (ρ,x) have to change? Is this in an experimentally accessible range?
Tuesday, July 30, 13

AV14+UVII (Wiringa, Fiks, & Fabrocini 1988)2.5 I
0.5—
AVI4 UVII
U V14+TN
PA
. UV14+UVII
MXB1636-536
I
IIIII11l1I11I
I1III1
l0 I
lOR (km)
I
20
Tuesday, July 30, 13

AV14+UVII (Wiringa, Fiks, & Fabrocini 1988)2.5 I
0.5—
AVI4 UVII
U V14+TN
PA
. UV14+UVII
MXB1636-536
I
IIIII11l1I11I
I1III1
l0 I
lOR (km)
I
20
I I I I I 1 l 1 I I ] t ] I I
80- UVI4+UV I I
60-
LU 40-
20-
0 I I I I [ ] I I I il I I I I I
0 0.2 0.4 0.6 0.8 ~,0 I.2 l.4p (fm )
Tuesday, July 30, 13

AV14+UVII (Wiringa, Fiks, & Fabrocini 1988):proton fraction and thermal properties
OI41 I I I I I I I I I I I I I I I
O.I2-
O. IO-
0.08-
0.06-
0.04—
I I I I I I I I I I I I I I I
2000-l000-
& (p)500-200-IOO-'E50-20-IO—
0.02-
0 I I I I I I I I ~L I I I I I I I
0 0.2 0.4 0.6 0.8 I.O I.2 I.4 I.6p(fm )
I I
0 0.2 0.4 0.6 0.8 I.O l.2 l.4p (fm~)
CjIO
Tuesday, July 30, 13

Cooling: the Urca (aka direct Urca, aka dUrca) process(just electron capture–β-decay equilibrium)
n � p + e + �e
p + e � n + �e
T6
L�(T) � 105 L�
�T
108
�6
.
Tuesday, July 30, 13

But this is blocked (Chiu & Salpeter, Bahcall & Wolff)...
pF,n < pF,e + pF,p,
� µe = µn � µp,
ne = np
x > 0.11.
Tuesday, July 30, 13

If it’s blocked the modi"ed Urca (mUrca) can still proceed
n + n � n + p + e + �e
n + p + e � n + n + �e
T8
L�(T) � 10�2 L�
�T
108
�8
.
Tuesday, July 30, 13

Isolated neutron stars: no enhanced cooling in modelsPage, Lattimer, Prakash, & Steiner 2009
COOLING OF NEUTRON STARS 9
Cooling without PBF vector channel suppression Cooling with PBF vector chanel suppression
Neutron P gap = 0
32
32Neutron P gap = "b"Neutron P gap = "b"2
3
2
Heavy
3Neutron P gap = "a"
Neutron P gap = 023Light element
envelopes
element envelopesHeavy
Light elementenvelopes
element envelopes
32
Neutron P gap = "a"
Fig. 9.— Comparison of predictions of the minimal cooling scenario with data; all models are for 1.4 M! stars built using the EOS ofAPR (Akmal, Pandharipande & Ravenhall 1998). In the right panels the suppression of the vector channel in the Cooper-pair neutrinoemission is fully taken into account whereas, for comparison, in the left panels the supression has been omitted. In each row, the two panelshave the same neutron 3P2 gap, from a vanishing gap in the upper row to our model gaps ”a” and ”b” (following the notations of Figure10 in Paper I) in the next two rows. In each panel two sets of cooling trajectories, either with light or with heavy element envelopes, areshown which include 25 curves corresponding to 5 choices of the neutron 1S0 and of the proton 1S0 gaps covering the range of predictionsabout the sizes of these gaps.
equation 13), as in our models “b” and “c”. In the extreme case that the neutron 3P2 gap is vanishingly small and alsothat all observed young cooling neutron stars have light element envelopes, then nearly all of them, with the possibleexception of PSR B0538+2817, are observed to be too cold to be compatible with minimal cooling predictions. Inthe less extreme possibility of a heterogeneity in chemical composition and a vanishingly small neutron 3P2 gap, westill find that more than half (seven out of twelve) of the observed young cooling neutron stars are too cold to becompatible with minimal cooling. (Notice that among the remaining five, out of twelve stars, the compact objects inCas A and the Crab still have only upper limits.) If these conditions on the Tc curve are not satisfied for a particularmodel of superfluidity in dense matter, then that model also requires enhanced cooling beyond the minimal coolingparadigm. These results highlight the importance of the n 3P2 gap in more precise terms than discussed in Paper I.
Our conclusion regarding the need for heterogenity in the chemical composition of the atmosphere is consistent withthe results of Kaminker, et al. (2006), who had to employ both light and heavy element atmospheres in their coolingmodels to match the data of most stars.
That it is apparently possible to explain the majority of thermally-emitting neutron stars with the minimal cooling
Tuesday, July 30, 13

Tuesday, July 30, 13

accretion
Tuesday, July 30, 13

unstable 12C+12C (years)
rp-process (hours–days)
accretion
Tuesday, July 30, 13

unstable 12C+12C (years)
rp-process (hours–days)
accretion
deep crust electron captures,
pycnonuclear reactions
(centuries–millenia)
Tuesday, July 30, 13

910 1010 1110 1210 13100
20406080
100120140
)3 (g/cm�
<Z>
<A>
05
10152025303540
<Q>
Hea
ting
(MeV
)
0
0.5
1
1.5
2
deep crustal heatingcrust reactions deposit ≈ 2 MeV/u in the inner crust (Sato, Haensel & Zdunik, Gupta et al., Steriner)
1. core temperature set by balance of heating, neutrino cooling
2. crust is not in thermal equilibrium with core
1.8 MeV/u released
Q = 〈Z2〉– 〈Z〉2
plot courtesy A. Steiner
Tuesday, July 30, 13

NS luminosity LNS < 1:1 ; 1031 ergs s!1. Choosing a NS radiusof 12 km, or a mass of 2.0M", varies this constraint by only 3%.The rather tight distance limits of Galloway & Cumming (2006;3:5 # 0:1 kpc) produce only a 6% uncertainty. Allowing the NH
to float freely permits a thermal 0.01Y10 keV NS luminosityLNS < 1:0 ; 1032 ergs s!1 (for NH ¼ 1:7 ; 1021 cm!2).
4. RAMIFICATIONS
We have estimated the time-averaged mass transfer rates for1808 and several other transient LMXBs (Aql X-1, Cen X-4, 4U1608!52, KS 1731!260, RX 1709!2639, MXB 1659!29,XTE 2123!058, SAX 1810.8!2609, and those in Terzan 5 andNGC 6440) from the RXTE All-Sky Monitor (ASM) record(1996 to November 2006), under the assumption that the time-averaged mass accretion rate over the last 10 yr reflects the time-averaged mass transfer rate (Table 2). We use PIMMS and apower law of photon index 2 to convert the ASM count rates dur-ing outbursts into 0.1Y20 keV fluxes.9 This is, of course, a roughapproximation, as the spectral shapes of LMXBs in outburstvary substantially. Additional sources of potential error includepoor ASM time coverage of some outbursts, uncertainty in theNS mass and radius (affecting the energy released per accretedgram and thus the conversion from LX to mass accretion rate),variability in themass transfer rate, and uncertain distances (whichwill equally affect the quiescent luminosity). We plot an arbitraryuncertainty of 50% in both mass transfer rate and quiescent lumi-nosity for each point in Figure 2. For Cen X-4 we use the lowestmeasured quiescent luminosity and the mass transfer rate limitinferred if CenX-4 undergoes outbursts every 40 yrwith a fluencesimilar to its 1969 outburst (Chen et al. 1997). The NS componentflux for Aquila X-1 is somewhat uncertain and possibly variable(Rutledge et al. 2002; Campana & Stella 2003). We assumethat all outbursts fromNGC 6440 since 1971 have been detected.For KS 1731!260, we assume that the average flux seen withRXTE/ASM during outburst was the average flux during the
entire 12.5 yr outburst. For KS 1731!260 and the transient inTerzan 1 (for which we take a 12 yr outburst), we take a mini-mum recurrence time of 30 yr.For 1808 we derive a time-averaged mass transfer rate of 1:0 ;
10!11 M" yr!1, an excellent match to the prediction of generalrelativity of 0:95 ; 10!11(M2/0:05 M") M" yr!1 (Bildsten &Chakrabarty 2001).We note that the truemass transfer rate cannot
TABLE 2
Luminosities and Mass Transfer Rates
Source
NH
(1022 cm!2)
kT
(eV)
D
(kpc) Outbursts Years
M
(M" yr!1)
LNS(ergs s!1) References
Aql X-1 ............................... 4:2 ; 1021 %94 5 8 10.7 4 ; 10!10 5:3 ; 1033 1, 2, 3, 4
Cen X-4 .............................. 5:5 ; 1020 76 1.2 . . . . . . <3:3 ; 10!11 4:8 ; 1032 5, 3
4U 1608!522 ..................... 8 ; 1021 170 3.6 4 10.7 3:6 ; 10!10 5:3 ; 1033 6, 3, 4KS 1731!260 ..................... 1:3 ; 1022 70 7 1 30 <1:5 ; 10!9 5 ; 1032 7, 4
MXB 1659!29 ................... 2:0 ; 1021 55 %10? 2 10.7 1:7 ; 10!10 2:0 ; 1032 7, 4
EXO 1747!214.................. 4 ; 1021 <63 <11 . . . . . . <3 ; 10!11 <7 ; 1031 8Terzan 5 .............................. 1:2 ; 1022 <131 8.7 2 10.7 3 ; 10!10 <2:1 ; 1033 9, 10, 4
NGC 6440........................... 7 ; 1021 87 8.5 3 35 1:8 ; 10!10 3:4 ; 1032 11, 4
Terzan 1 .............................. 1:4 ; 1022 74 5.2 . . . . . . <1:5 ; 10!10 <1:1 ; 1033 12
XTE 2123!058 .................. 6 ; 1020 <66 8.5 1 10.7 <2:3 ; 10!11 <1:4 ; 1032 3, 4SAX J1810.8!2609............ 3:3 ; 1021 <72 4.9 1 10.7 <1:5 ; 10!11 <2:0 ; 1032 13, 3, 4
RX J1709!2639 ................. 4:4 ; 1021 122 8.8 2 10.7 1:8 ; 10!10 2:2 ; 1033 14, 15, 4
1H 1905+000 ...................... 1:9 ; 1021 <50 10 . . . . . . <1:1 ; 10!10 <4:8 ; 1031 16, 15
SAX J1808.4!3658............ 1:3 ; 1021 <34 3.5 5 10.7 1:0 ; 10!11 <1:1 ; 1031 17, 4, 15
Notes.—Estimates of quiescent thermal luminosities from neutron star transients, and mass transfer rates (inferred from RXTE ASM observations for systems withRXTE-era outbursts). Quiescent thermal luminosities are computed for the unabsorbedNS component in the 0.01Y10 keVrange.Outbursts and years columns give the numberof outbursts and the time baseline used to compute M , if this calculation was performed in this work (indicated by referring to reference 4).
References.— (1) Rutledge et al. 2001b; (2) Campana & Stella 2003; (3) Tomsick et al. 2004; (4) Mass transfer rate computed in this work; (5) Rutledge et al.2001a; (6) Rutledge et al. 1999; (7) Cackett et al. 2006a; (8) Tomsick et al. 2005; (9) Wijnands et al. 2005; (10) Heinke et al. 2006b; (11) Cackett et al. 2005; (12) Cackettet al. 2006b; (13) Jonker et al. 2004b; (14) Jonker et al. 2004a; (15) Quiescent bolometric luminosity computed in this work; (16) Jonker et al. 2006; (17) Galloway &Cumming 2006.
Fig. 2.—Cooling curves for various NS interior neutrino emission scenarios,compared with measurements (or 95% confidence upper limits) of the quiescent0.01Y10 keV NS luminosity and time-averaged mass transfer rate for several NStransients (see Table 2). The cooling curves are taken from Yakovlev & Pethick(2004); the dotted curve represents a low-mass NS, while the lower curves rep-resent high-mass NSs with kaon or pion condensates or direct Urca (Durca) pro-cessesmediated by nucleons or hyperons. Limits on the quiescent NS luminosity ofSAX J1808.4!3658 are given for the 2001 and 2006 observations. The effect of adistance error as large as a factor of 1.5 is also indicated (upper left).
9 We have verified that this conversion is correct to within 50% for outburstsof the transients EXO 1745!245 and Aquila X-1.
HEINKE ET AL.1426 Vol. 660
Lq=
Q〈M〉
Tcore ≈ 2×10⁷ K(
〈M〉
10−10 M& yr−1
)1/6
Tcore ≈ 2 × 10⁸ K
(
〈M〉
10−10 M& yr−1
)1/8
sets crustal heating
indi
cate
s Tco
rePlot from Heinke et al. ’07
Tuesday, July 30, 13

NS luminosity LNS < 1:1 ; 1031 ergs s!1. Choosing a NS radiusof 12 km, or a mass of 2.0M", varies this constraint by only 3%.The rather tight distance limits of Galloway & Cumming (2006;3:5 # 0:1 kpc) produce only a 6% uncertainty. Allowing the NH
to float freely permits a thermal 0.01Y10 keV NS luminosityLNS < 1:0 ; 1032 ergs s!1 (for NH ¼ 1:7 ; 1021 cm!2).
4. RAMIFICATIONS
We have estimated the time-averaged mass transfer rates for1808 and several other transient LMXBs (Aql X-1, Cen X-4, 4U1608!52, KS 1731!260, RX 1709!2639, MXB 1659!29,XTE 2123!058, SAX 1810.8!2609, and those in Terzan 5 andNGC 6440) from the RXTE All-Sky Monitor (ASM) record(1996 to November 2006), under the assumption that the time-averaged mass accretion rate over the last 10 yr reflects the time-averaged mass transfer rate (Table 2). We use PIMMS and apower law of photon index 2 to convert the ASM count rates dur-ing outbursts into 0.1Y20 keV fluxes.9 This is, of course, a roughapproximation, as the spectral shapes of LMXBs in outburstvary substantially. Additional sources of potential error includepoor ASM time coverage of some outbursts, uncertainty in theNS mass and radius (affecting the energy released per accretedgram and thus the conversion from LX to mass accretion rate),variability in themass transfer rate, and uncertain distances (whichwill equally affect the quiescent luminosity). We plot an arbitraryuncertainty of 50% in both mass transfer rate and quiescent lumi-nosity for each point in Figure 2. For Cen X-4 we use the lowestmeasured quiescent luminosity and the mass transfer rate limitinferred if CenX-4 undergoes outbursts every 40 yrwith a fluencesimilar to its 1969 outburst (Chen et al. 1997). The NS componentflux for Aquila X-1 is somewhat uncertain and possibly variable(Rutledge et al. 2002; Campana & Stella 2003). We assumethat all outbursts fromNGC 6440 since 1971 have been detected.For KS 1731!260, we assume that the average flux seen withRXTE/ASM during outburst was the average flux during the
entire 12.5 yr outburst. For KS 1731!260 and the transient inTerzan 1 (for which we take a 12 yr outburst), we take a mini-mum recurrence time of 30 yr.For 1808 we derive a time-averaged mass transfer rate of 1:0 ;
10!11 M" yr!1, an excellent match to the prediction of generalrelativity of 0:95 ; 10!11(M2/0:05 M") M" yr!1 (Bildsten &Chakrabarty 2001).We note that the truemass transfer rate cannot
TABLE 2
Luminosities and Mass Transfer Rates
Source
NH
(1022 cm!2)
kT
(eV)
D
(kpc) Outbursts Years
M
(M" yr!1)
LNS(ergs s!1) References
Aql X-1 ............................... 4:2 ; 1021 %94 5 8 10.7 4 ; 10!10 5:3 ; 1033 1, 2, 3, 4
Cen X-4 .............................. 5:5 ; 1020 76 1.2 . . . . . . <3:3 ; 10!11 4:8 ; 1032 5, 3
4U 1608!522 ..................... 8 ; 1021 170 3.6 4 10.7 3:6 ; 10!10 5:3 ; 1033 6, 3, 4KS 1731!260 ..................... 1:3 ; 1022 70 7 1 30 <1:5 ; 10!9 5 ; 1032 7, 4
MXB 1659!29 ................... 2:0 ; 1021 55 %10? 2 10.7 1:7 ; 10!10 2:0 ; 1032 7, 4
EXO 1747!214.................. 4 ; 1021 <63 <11 . . . . . . <3 ; 10!11 <7 ; 1031 8Terzan 5 .............................. 1:2 ; 1022 <131 8.7 2 10.7 3 ; 10!10 <2:1 ; 1033 9, 10, 4
NGC 6440........................... 7 ; 1021 87 8.5 3 35 1:8 ; 10!10 3:4 ; 1032 11, 4
Terzan 1 .............................. 1:4 ; 1022 74 5.2 . . . . . . <1:5 ; 10!10 <1:1 ; 1033 12
XTE 2123!058 .................. 6 ; 1020 <66 8.5 1 10.7 <2:3 ; 10!11 <1:4 ; 1032 3, 4SAX J1810.8!2609............ 3:3 ; 1021 <72 4.9 1 10.7 <1:5 ; 10!11 <2:0 ; 1032 13, 3, 4
RX J1709!2639 ................. 4:4 ; 1021 122 8.8 2 10.7 1:8 ; 10!10 2:2 ; 1033 14, 15, 4
1H 1905+000 ...................... 1:9 ; 1021 <50 10 . . . . . . <1:1 ; 10!10 <4:8 ; 1031 16, 15
SAX J1808.4!3658............ 1:3 ; 1021 <34 3.5 5 10.7 1:0 ; 10!11 <1:1 ; 1031 17, 4, 15
Notes.—Estimates of quiescent thermal luminosities from neutron star transients, and mass transfer rates (inferred from RXTE ASM observations for systems withRXTE-era outbursts). Quiescent thermal luminosities are computed for the unabsorbedNS component in the 0.01Y10 keVrange.Outbursts and years columns give the numberof outbursts and the time baseline used to compute M , if this calculation was performed in this work (indicated by referring to reference 4).
References.— (1) Rutledge et al. 2001b; (2) Campana & Stella 2003; (3) Tomsick et al. 2004; (4) Mass transfer rate computed in this work; (5) Rutledge et al.2001a; (6) Rutledge et al. 1999; (7) Cackett et al. 2006a; (8) Tomsick et al. 2005; (9) Wijnands et al. 2005; (10) Heinke et al. 2006b; (11) Cackett et al. 2005; (12) Cackettet al. 2006b; (13) Jonker et al. 2004b; (14) Jonker et al. 2004a; (15) Quiescent bolometric luminosity computed in this work; (16) Jonker et al. 2006; (17) Galloway &Cumming 2006.
Fig. 2.—Cooling curves for various NS interior neutrino emission scenarios,compared with measurements (or 95% confidence upper limits) of the quiescent0.01Y10 keV NS luminosity and time-averaged mass transfer rate for several NStransients (see Table 2). The cooling curves are taken from Yakovlev & Pethick(2004); the dotted curve represents a low-mass NS, while the lower curves rep-resent high-mass NSs with kaon or pion condensates or direct Urca (Durca) pro-cessesmediated by nucleons or hyperons. Limits on the quiescent NS luminosity ofSAX J1808.4!3658 are given for the 2001 and 2006 observations. The effect of adistance error as large as a factor of 1.5 is also indicated (upper left).
9 We have verified that this conversion is correct to within 50% for outburstsof the transients EXO 1745!245 and Aquila X-1.
HEINKE ET AL.1426 Vol. 660
Lq=
Q〈M〉
Tcore ≈ 2×10⁷ K(
〈M〉
10−10 M& yr−1
)1/6
Tcore ≈ 2 × 10⁸ K
(
〈M〉
10−10 M& yr−1
)1/8
M28
NGC 6397
M13ω CenNGC 6304
Plot from Heinke et al. ’07
from G
uillot et al. ’13
Tuesday, July 30, 13

quasi-persistent transientsRutledge et al. 2002, Shternin et al.2007, Brown & Cumming 2009, Page & Reddy
Tuesday, July 30, 13

quasi-persistent transientsRutledge et al. 2002, Shternin et al.2007, Brown & Cumming 2009, Page & Reddy
Tuesday, July 30, 13

quasi-persistent transientsRutledge et al. 2002, Shternin et al.2007, Brown & Cumming 2009, Page & Reddy
●
●
●
●
●● ●
●
●
●
●●●●
●
●
t (d)
kT1 e↵
(eV
)
10
2
10
3
50
60
70
80
90
100
110
120
MXB 1659-29 obs.
KS 1731-260 obs.
MXB 1659-29 model
KS 1731-260 model
data from Cackett et al. 2008#ts from Brown & Cumming 2009
Tuesday, July 30, 13

Why is cooling a broken power-law in time? Consider a cooling slab
a
�T
�t= D
�2T
�x2,
D = 0
���
t
�1/2 �1 �
��
�
t
��,
� = a2/(4D)
Tuesday, July 30, 13
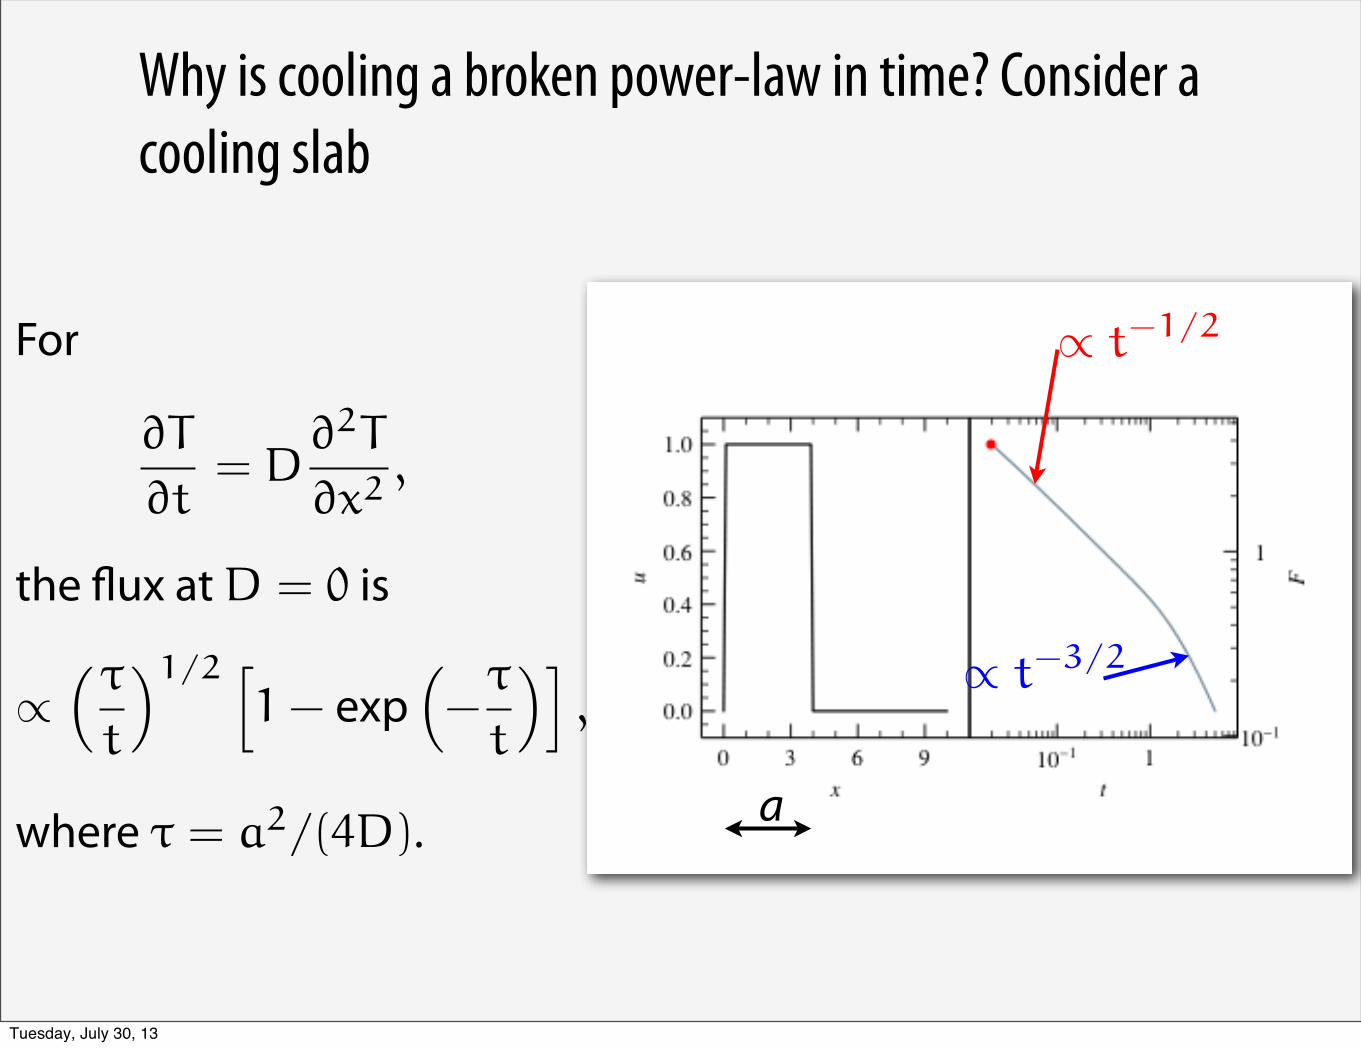
Why is cooling a broken power-law in time? Consider a cooling slab
a
� t�1/2
� t�3/2
�T
�t= D
�2T
�x2,
D = 0
���
t
�1/2 �1 �
��
�
t
��,
� = a2/(4D)
Tuesday, July 30, 13

� (d)
T(K
)
1 10 102 103
108
T(K
)108
P/g (g cm�2)
�(d
)
1013 1014 1015 1016 1017 1018
1
10
102
103
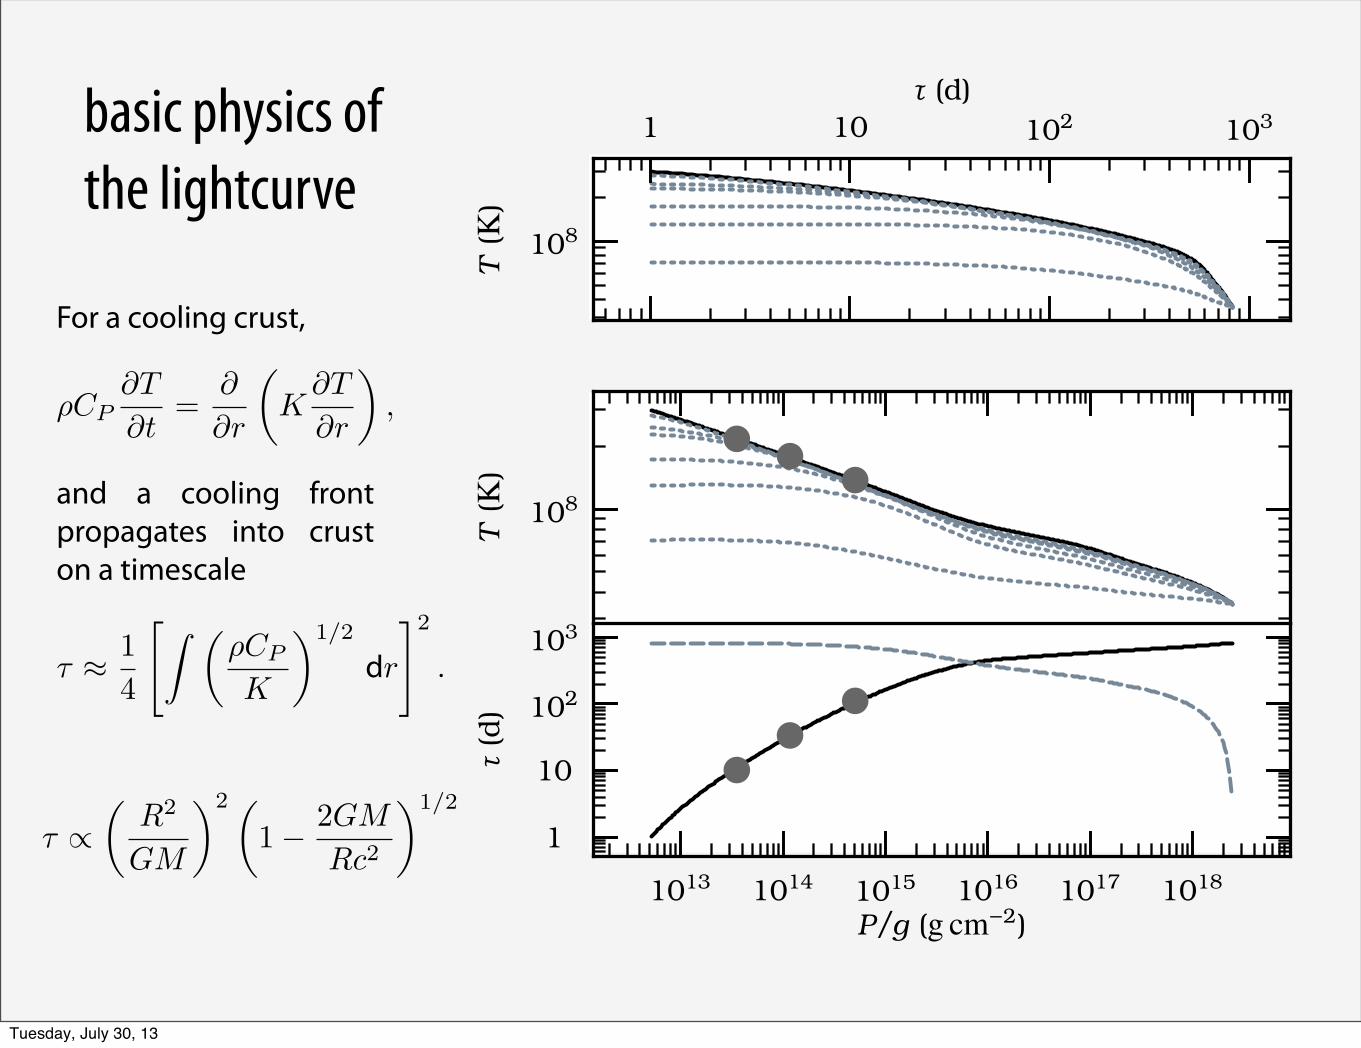
�CP⇧T
⇧t=
⇧
⇧r
�K
⇧T
⇧r
⇥,
⇥ � 14
⇤⇧ ��CP
K
⇥1/2
r
⌅2
.
� ⇥�
R2
GM
⇥2 �1� 2GM
Rc2
⇥1/2
basic physics of the lightcurve
Tuesday, July 30, 13

� (d)
T(K
)
1 10 102 103
108
T(K
)108
P/g (g cm�2)
�(d
)
1013 1014 1015 1016 1017 1018
1
10
102
103
�CP⇧T
⇧t=
⇧
⇧r
�K
⇧T
⇧r
⇥,
⇥ � 14
⇤⇧ ��CP
K
⇥1/2
r
⌅2
.
� ⇥�
R2
GM
⇥2 �1� 2GM
Rc2
⇥1/2
basic physics of the lightcurve
Tuesday, July 30, 13

� (d)
T(K
)
1 10 102 103
108
T(K
)108
P/g (g cm�2)
�(d
)
1013 1014 1015 1016 1017 1018
1
10
102
103
�CP⇧T
⇧t=
⇧
⇧r
�K
⇧T
⇧r
⇥,
⇥ � 14
⇤⇧ ��CP
K
⇥1/2
r
⌅2
.
� ⇥�
R2
GM
⇥2 �1� 2GM
Rc2
⇥1/2
basic physics of the lightcurve
Tuesday, July 30, 13
� (d)
T(K
)
1 10 102 103
108
T(K
)108
P/g (g cm�2)
�(d
)
1013 1014 1015 1016 1017 1018
1
10
102
103
�CP⇧T
⇧t=
⇧
⇧r
�K
⇧T
⇧r
⇥,
⇥ � 14
⇤⇧ ��CP
K
⇥1/2
r
⌅2
.
� ⇥�
R2
GM
⇥2 �1� 2GM
Rc2
⇥1/2
basic physics of the lightcurve
Tuesday, July 30, 13

Effects of super#uidity
a greater CP causes a longer diffusion timescale (Shternin et al. 2007; Brown & Cumming 2009; Page & Reddy)
⌧(d
)
0
300
600
900
1S 0(CCDK)
1S 0(GC)
P/g (g cm�2)
CP
(erg
sg�1
K�1
)
1015 1016 1017 1018
103
104
105
106
Tuesday, July 30, 13

20
µe � kT,mec2
Z2e2
a� kT
MD simulatons by Horowitz & collaborators
Tuesday, July 30, 13

Pasta/transition to core as functions of LOyamatsu & Iida ’07
SYMMETRY ENERGY AT SUBNUCLEAR DENSITIES AND . . . PHYSICAL REVIEW C 75, 015801 (2007)
the nucleon part nw + mnc2nn + mpc2np [see Eq. (1)] and
the electron part (15). By comparing the resultant six energydensities, we can determine the equilibrium phase.
III. EQUILIBRIUM SIZE AND SHAPE OF NUCLEI
We proceed to show the results for the equilibrium nuclearmatter configuration obtained for various sets of the EOSparameters L and K0 as shown in Fig. 1. These parameters arestill uncertain because they are little constrained from the massand radius data for stable nuclei [2]. As we shall see, the chargenumber of spherical nuclei and the density region containingbubbles and nonspherical nuclei have a strong correlationwith L.
We first focus on spherical nuclei, which constitute anequilibrium state in the low-density region. We calculate thecharge number of the equilibrium nuclide as a function of nb forthe EOS models A–I as depicted in Fig. 2. Note that the recentGFMC calculations of the energy of neutron matter based onthe Argonne v8’ potential [15] are close to the behavior ofthe model E. Hereafter we will thus call the model E as atypical one. The result is shown in Fig. 3. For densities below∼0.01 fm−3, the calculated density dependence of the chargenumber Z is almost flat, a feature consistent with the resultsin earlier investigations [1]. More important, the calculatedcharge number is larger for the EOS models having smaller L,and this difference in Z is more remarkable at higher densities.
As we shall see later in this section, this property ofZ is related to the tendency that with increasing L, thenuclear density decreases while the density of the neutrongas increases. Note that Z is, within a liquid-drop model [1],determined by the size equilibrium condition relating theCoulomb and surface energies in such a way that Z increaseswith increasing surface tension. Because the Thomas-Fermimodel adopted here can be mapped onto a compressible liquid-drop model [2], the present results may well be interpreted interms of the liquid-drop model. In fact we shall estimate thesurface tension from the Thomas-Fermi model as a function ofL and discuss how the surface tension depends on the nucleardensity and the neutron sea density.
We also note that the density at which the phase withspherical nuclei ceases to be in the ground state is between0.05 and 0.07 fm−3. This result, consistent with the results
100
80
60
40
20
0
prot
on n
umbe
r
5 60.001
2 3 4 5 60.01
2 3 4 5 60.1
nb (fm-3)
inner crustproton number Z I
HG
F
E
D
C
AB
FIG. 3. (Color online) The charge number of spherical nuclei asa function of nb, calculated for the EOS models A–I.
0.20
0.15
0.10
0.05
0.00
prot
on fr
actio
n
5 60.001
2 3 4 5 60.01
2 3 4 5 60.1
nb (fm-3)
inner crustaverage proton fraction
CF
BE
A
DIHG
FIG. 4. (Color online) The average proton fraction as a functionof nb, calculated for the EOS models A–I.
obtained in earlier investigations [1,7,10], will be discussedbelow in terms of fission instability.
The average proton fraction, which is the charge numberdivided by the total nucleon number in the cell, is plotted inFig. 4. We observe that the dependence of the average protonfraction on the EOS models is similar to that of Z. We alsofind that the average proton fraction basically decreases withbaryon density. This is a feature coming from the fact that asthe baryon density increases, the electron chemical potentialincreases under charge neutrality and then the nuclei becomemore neutron-rich under weak equilibrium.
We next consider the density region where bubbles andnonspherical nuclei appear in equilibrium, i.e., the densityregion of the “pasta” phases. We start with such a densityregion calculated for the EOS models A–I. The results areplotted in Fig. 5. Except for the model C, we obtain thesuccessive first order transitions with increasing density:sphere → cylinder → slab → cylindrical hole → sphericalhole → uniform matter. A marked correlation of the upper endof the density region with the parameter L can be observed by
0.14
0.12
0.10
0.08
0.06
0.04
nucl
eon
num
ber d
ensi
ty (f
m-3
)
160140120100806040200
L (MeV)
pasta nuclei fission instability proton clustering
GH
I
A
DE
B F
C
FIG. 5. (Color online) The density region containing bubbles andnonspherical nuclei as a function of L, calculated for the EOS modelsA–I. For comparison, the density corresponding to u = 1/8 in thephase with spherical nuclei and the onset density, n(Q), of protonclustering in uniform nuclear matter, which will be discussed inSec. IV, are also plotted by circles and crosses, respectively.
015801-5
Tuesday, July 30, 13

Continued cooling in KS 1731 (Cackett et al. ’10)No. 2, 2010 CRUSTAL COOLING OF KS 1731−260 L139
Figure 1. Effective temperature for an observer at infinity for KS 1731−260 over approximately 3000 days from the end of the last outburst. The solid line shows apower-law fit to these temperatures, while the dashed line shows the best-fitting exponential decay to a constant level. The dotted line shows the best-fitting modelusing the crustal cooling simulations from Brown & Cumming (2009).
Figure 2. 0.5–10 keV count rates for all Chandra observations of KS 1731−260. The solid line shows a power-law fit to these count rates.
(we assume a spectral index, Γ = 2), and (3) a neutron staratmosphere plus power-law (Γ = 2) model where the power-law flux always contributes 40% of the unabsorbed 0.5–10 keVflux (note that all three models assume Galactic absorption ofNH = 1.3 × 1022 cm−2). The data points are most consistentwith a simple cooling neutron star atmosphere, but model (2),where there is a small contribution from a power law, cannot beruled out. Any power-law contribution increases the color (fora given count rate) compared to the color from a neutron staratmosphere only. A harder power-law spectrum (with a slopecloser to 1 than 2) would also lead to an increased color. Thus,any contributions from a power-law component must be at a lowlevel (less than a few tens of percent). Therefore, there must still
be significant neutron star cooling. Also note that this count rateanalysis does not take into account any change in the effectivearea of the detector over time. There has been a known increasein contaminant on the Chandra ACIS detector since the missionlaunch, leading to a decrease in the sensitivity at lowest energiesover time (Marshall et al. 2004). This would artificially hardenthe color used here, thus the colors shown here should be takenas maximum values.
To further test the affect of a constant fraction of power-lawflux, we fit the spectra with an absorbed neutron star atmosphereplus power-law model. We fix the power law with slope Γ = 2,and the normalization for each observation is set to give a0.5–10 keV unabsorbed flux that is 20% of the value found
power-law! hard to explain
Tuesday, July 30, 13
Neutron star cooling and the symmetry energy
1. Need to understand how much our prior knowledge of low-density nuclear matter is factored into the high-density EOS
2. A given EOS makes predictions for cooling
3. To what extent can we assign transport properties (e.g., viscosity, speci!c heat, super"uidity) to a given EOS? Currently these are treated independently.
Tuesday, July 30, 13