Neuroscience and neuromythology John Geake School of Education The University of New England...
81
Neuroscience and neuromythology John Geake School of Education The University of New England Armidale, NSW Australian Guidance Counsellors Association Annual Conference Hobart, April 2009
-
Upload
scott-johnson -
Category
Documents
-
view
216 -
download
3
Transcript of Neuroscience and neuromythology John Geake School of Education The University of New England...

Neuroscience and neuromythology
John GeakeSchool of Education
The University of New England
Armidale, NSW
Australian Guidance Counsellors Association Annual ConferenceHobart, April 2009

Daily Telegraph, December 1997

1 neuroimage = 1K words?
+ve media and political recognition of a role for neuroscience in social policy: education, criminology, age-care ...
-ve misinterpretations that these areas which ‘light up’ are solely responsible for a particular type of mental activity

General Limitations of Neuroimaging
1. Structure – function mappings are not one to one [no unambiguous neural correlates of learning difficulties, styles]
2. Surrogate measures of brain activation [activation models may be incomplete ]
3. Individual differences in brain structure – function [activation maps are statistical]
4. The brain is structurally very complex; brain function is nonlinear [ it’s a tough problem]

Posner & Raichle, 1994
PET images metabolism in active areas of the brain using emissions of a radioactive tracer (oxygen in glucose) in the blood.
Positron Emission Tomography (PET)

Fischbach, Scientific American, 1992, courtesy M. Raichle
all of which we do simultaneously and in synchrony

EEG measures electrical activity of active areas of the brain using multiple electrodes placed over the scalp
Quik-Cap, NeuroMedical Supplies

Event-related potentials (ERP)
ERP data consist of changes in the EEG in response to experimental stimuli.
The waveforms of interest typically occur 100, 300 or 400 milliseconds after the stimulus onset. In other words, ERP data is temporally sensitive.
However, as the extra-scalp electrical field is a result of widespread neural activity, the technique is insensitive to spatial correlates.

MEG Aston University neuroimaging lab
CTF 151 channel system
The SQUIDs operate at superconducting temperatures. The sensors are therefore placed in a dewar containing liquid helium.
The tiny magnetic fields produced by brain activity can be measured using Superconducting Quantum Interference Devices or SQUIDs

The first half-second of visual word recognition
Morten Kringelbach in collaboration with Kristen Pammer, Peter Hansen, Piers Cornelissen, Gareth Barnes, Krish Singh & Arjan Hillebrand, Neuroimage, (2004).

Functional magnetic resonance imaging (fMRI) images blood oxygen level changes in active areas of the brain using the interaction of pulsed (RF) resonant energy with a very strong magnetic field (3.0 T)
FMRIB Centre, Oxford
Ecological validity: inside a scanner vs. inside a classroom

Insert time fmri series
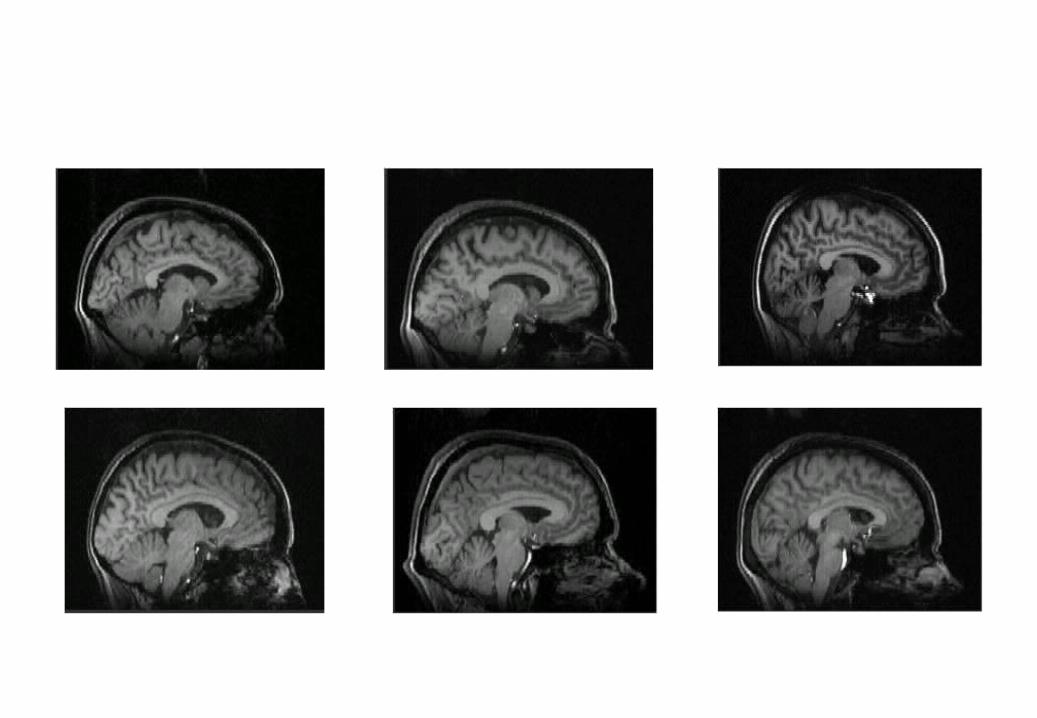
MRI creates structural brain images

Foetal brain growth


(ADR high) (ADR lowest)
The red areas are statistical mountain peaks (histograms)
Z = 2.3
Experimental areas of interest found by contrasting criterion with control activations

BOLD signal vs stimulus change in one active voxel
fMRI data are mostly group averages
MRI - sagittal orientation ~ 2-3mm off the midline left hemisphere

fMRI - individual activation vs group map
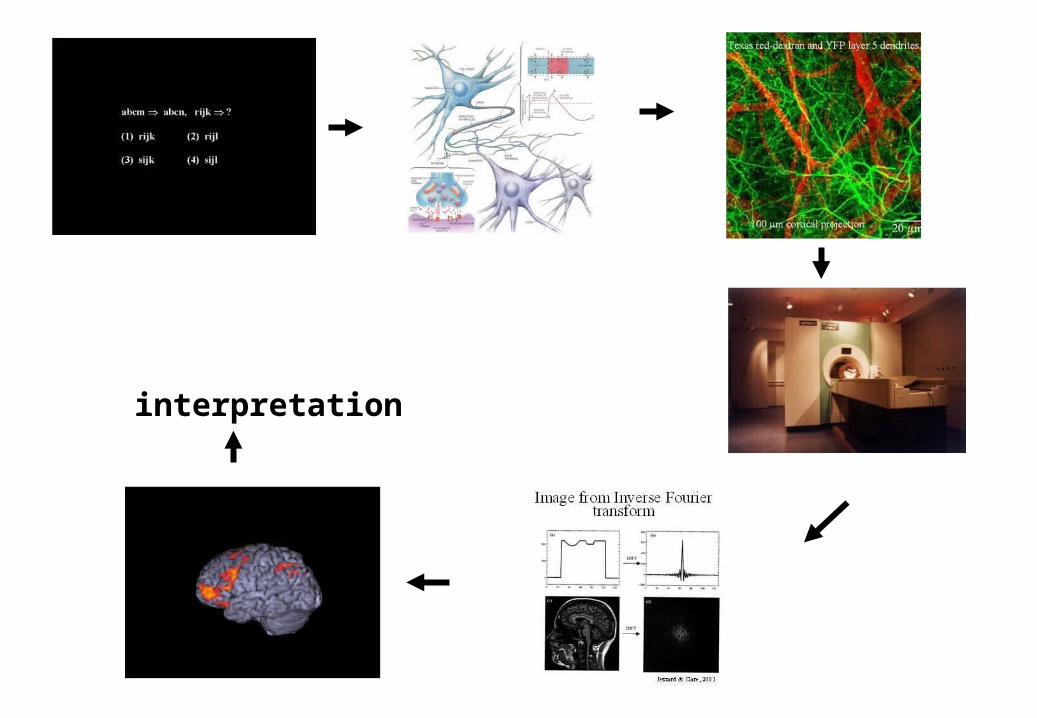
interpretation

When a brain ‘lights up’ in response to a task X ...
... a statistical map (coloured histogram, z > 2.3) on an ideal brain image (computer generated) of a group average (N = 12 – 15) of right-handed subjects (not too old, not too young, not too big, not myopic, not pregnant, not claustrophobic, no metal, no pacemaker ...)doing multiple X (variations or repeats > 40 times )differential activation (X vs control task, X – control task) measured by BOLD (blood oxygen level dependent) signal (% reduction in deoxygenated haemoglobin concentration) from (assumed) neurally-induced local increased blood flow due to enhanced vasculature dilation in contiguous clusters of most (?) (but not all of) the voxels (1 - 3 mm3) of brain tissue (2.5 – 7 x 10⁶ neurons) where the majority of neurons are active (excitatory and/or inhibitory) assumed to be associated with task X.

Cognitive neuroscience as bootstrapping
There is no
Users’ Manual of the Brain

The mapping problem
Relationships between brain functional modularity
and cognitive behavioural
categories are not one to one

Abandonment of old phrenology
To suppose the roof-brain consists of point to point centres identified each with a particular item of intelligent concrete behaviour is a scheme over simplified and to be abandoned.
Rather, the contributions which the roof-brain … makes toward integrated behaviour will … resolve into components for which we at present have no names.
Sir Charles Sherrington, Man on His Nature,1938

fMRI of subtraction - interconnectivity
Dehaene, 1997Dehaene & Naccache, Cognition, 2001

Common brain functions for all acts of intelligence: NB school learning
• Working memory <= lateral frontal cortex
• Long term memory <= hippocampus + …
• Decision making <= orbitofrontal cortex
• Emotional mediation <= limbic subcortex + ofc
• Sequencing of symbolic representation <= fusiform gyrus + temporal lobe
• Conceptual inter-relationships <= parietal lobe
• Conceptual rehearsal <= cerebellum
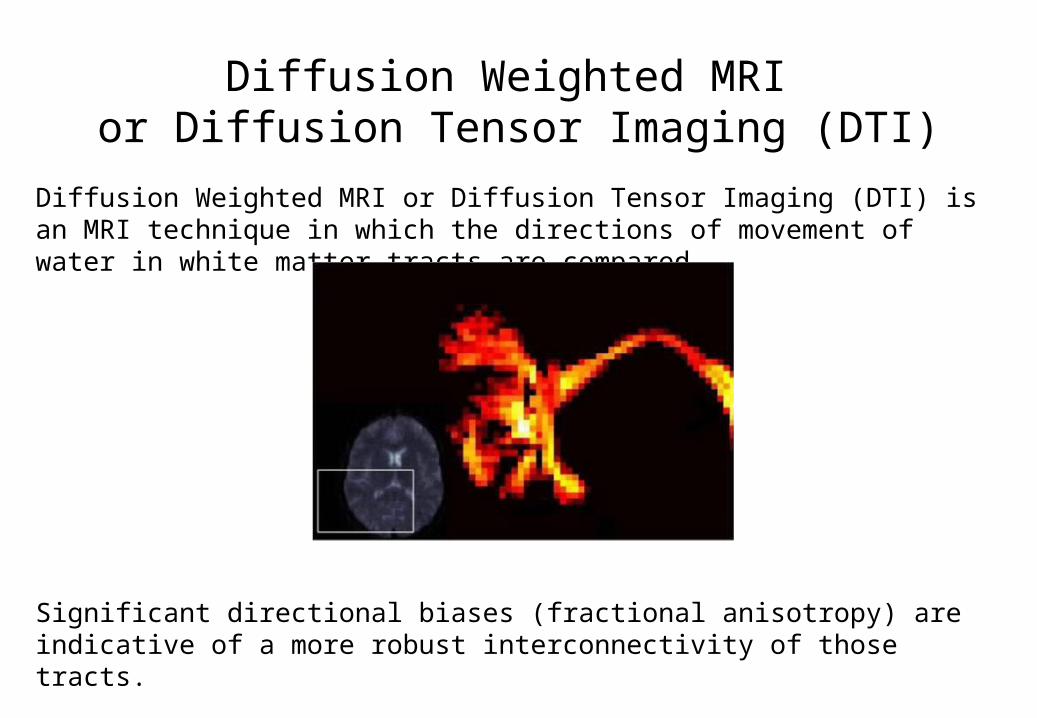
Diffusion Weighted MRI or Diffusion Tensor Imaging (DTI)
Diffusion Weighted MRI or Diffusion Tensor Imaging (DTI) is an MRI technique in which the directions of movement of water in white matter tracts are compared.
Significant directional biases (fractional anisotropy) are indicative of a more robust interconnectivity of those tracts.
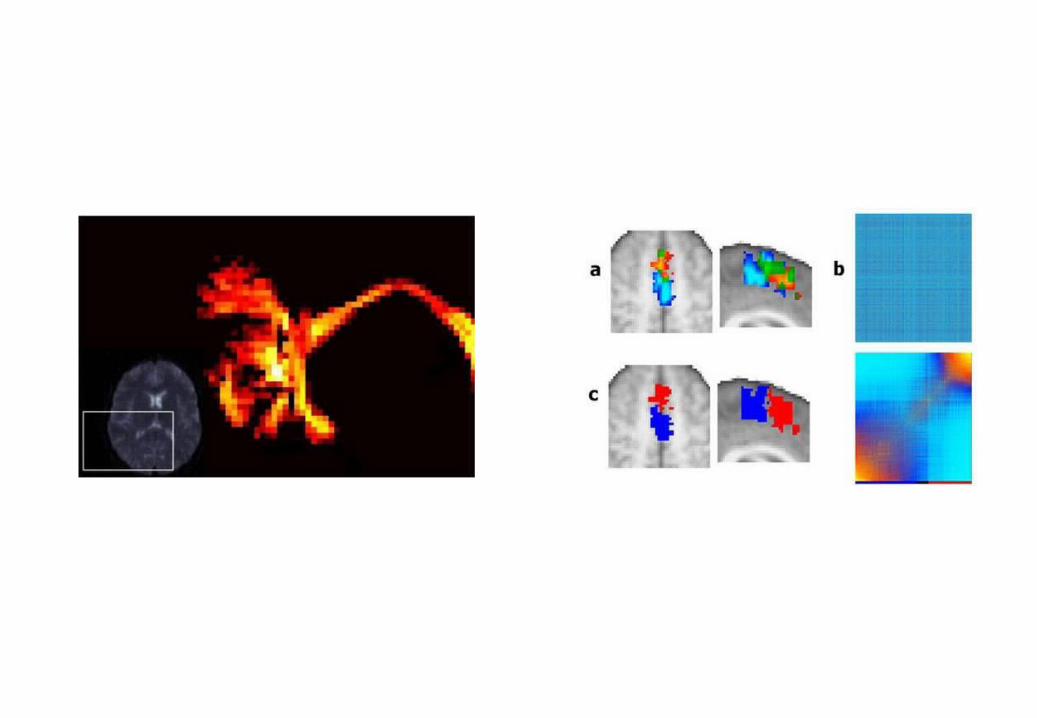
Fibre connectivity from Diffusion Weighted MRI
Connectivity maps of grey matter in pre-motor and motor cortex Johansen-Berg & Behrens, FMRIB Oxford
Function is determined by input and output connectivity
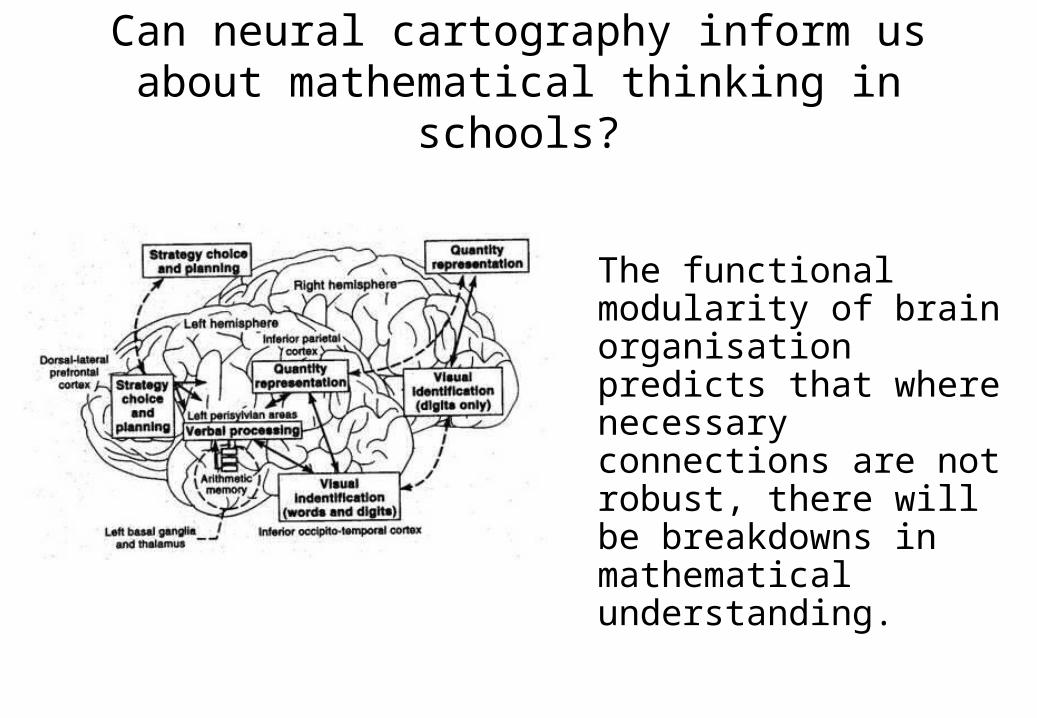
Can neural cartography inform us about mathematical thinking in schools?
The functional modularity of brain organisation predicts that where necessary connections are not robust, there will be breakdowns in mathematical understanding.

Correlation vs Causation
Most neuroimaging data (fMRI) inform correlations between levels of neural activation and behaviour.
Opportunistic neuropsychological analyses of neural lesions or trauma inform necessity conjectures of causation.
But, the location and extent of lesions is obviously uncontrolled, and due to the distribution of major vasculature tracts, spare some areas of brain more than others.
And, functional interconnectivity and plasticity in recovery can limit interpretation of lesion data.

Transcranial Magnetic Stimulation (TMS)
TMS temporarily disables a small area of brain to test its necessity for an aspect of behaviour.

TMS + fMRI => interconnectivity
Mapping causal interregional influences with concurrent TMS–fMRI. Bestmann, Ruff, Blankenburg, Weiskopf, Driver, Rothwell Exp Brain Res (2008) 191:383–402
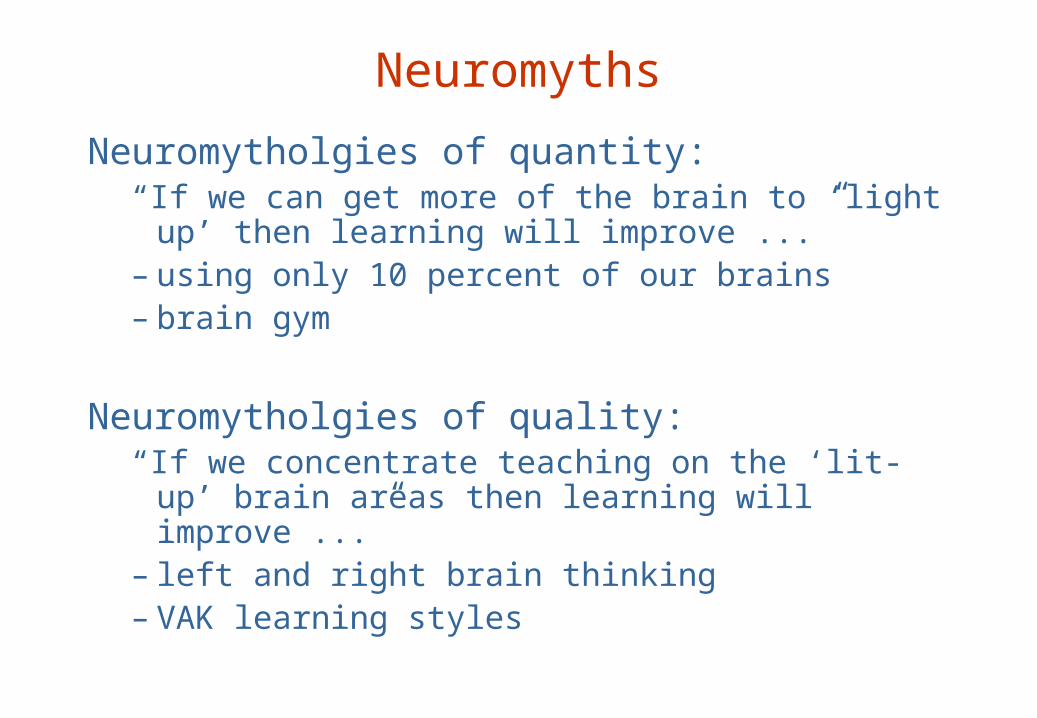
Neuromyths
Neuromytholgies of quantity:“If we can get more of the brain to ‘light up’ then
learning will improve ...”– using only 10 percent of our brains– brain gym
Neuromytholgies of quality:“If we concentrate teaching on the ‘lit-up’ brain areas
then learning will improve ...”– left and right brain thinking– VAK learning styles

AGCA 2009Neuroscience and neuromythology
“We only use 10% of our brains”

Sources of the 10% myth
• Italian neuro-surgery removing scoops of brains of psychiatric patients (1890)
• Einstein imploring us to think more (1920)
• American advertisers of home-help manuals (1930)
• Wishful thinking educationists (1980 - 2000)

The absurdity of the 10% myth
Evolution does not produce excess, much less 90% excess.
In the millions of neurological studies ever conducted, no one has ever found an unused portion of the brain!
Beyerstein, 2004

AGCA 2009Neuroscience and neuromythology
“There is left- and right-brain thinking, and left- and right-brained people”

Kolb & Wishaw, 1996

Semantic system is left lateralised
language = left hemisphere graphic & emotional = right hemisphere
“A significant quantitative bias found in the brains of extremely right-handed subjects.”
“It is dangerous to suppose that language processing only occurs in the left hemisphere of all people.”
Thierry, Giraud & Price, Neuron, 2003

AGCA 2009Neuroscience and neuromythology
“There are individual sensory learning styles: visual, auditory, kinaesthetic”
Brain interconnectivity includes the senses
• All primates are V A K
– including humans
• All primates construct spatial maps – including blind humans!

Visual-auditory cross-modal binding
reinforcing = additive interfering = subtractive

5 year olds can reliably distinguish different sized groups (V x V)
vs ?

?
5 year olds can reliably distinguish different sized groups (V x V)
What happens when one group is replaced by as many sounds (V x A)?
vs ?
vs

?
5 year olds can reliably distinguish different sized groups (V x V)
What happens when one group is replaced by as many sounds (V x A)?
No change in accuracy!
vs ?
vs

VAK not learning styles but pre-learning perceptual acuities
• Input modalities in the brain are inter-linked visual auditory
visual motor
motor auditory
visual taste
• Input information is abstracted to be processed and learnt, mostly unconsciously, through the brain’s interconnectivity
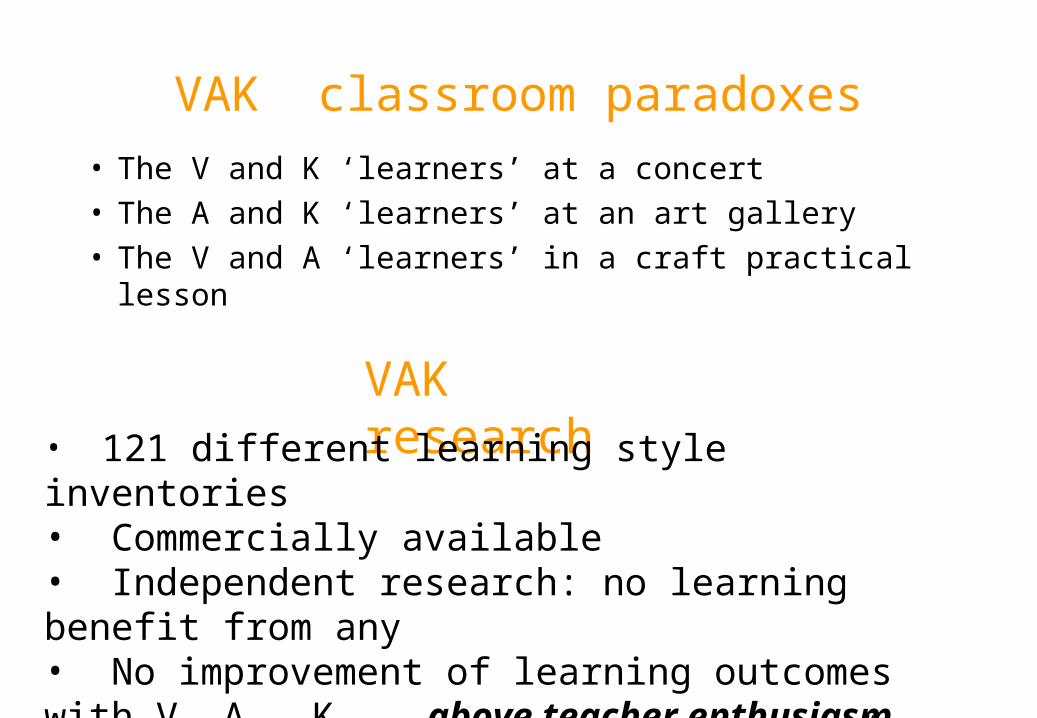
VAK classroom paradoxes
• The V and K ‘learners’ at a concert• The A and K ‘learners’ at an art gallery• The V and A ‘learners’ in a craft practical lesson
VAK research• 121 different learning style inventories • Commercially available• Independent research: no learning benefit from any• No improvement of learning outcomes with V, A, K above teacher enthusiasm“attempts to focus on learning styles were wasted effort” Kratzig & Arbuthnott (2006)

Why do VAK and other ‘learning-styles’ seem so attractive?
• folk psychology: we seem to learn differently from each other, and we have 5 senses …
… has created• folk neuroscience: the working of our brains directly
reflects our folk psychology …
… BUT …• … if our brains were that simple we wouldn’t be here
today!

Visual ‘learners’ convert words to pictures in the brain, and vice versa
Picture problem Word problem
Self-rated visual ‘learners’
Fusiform gyrus
Self-rated verbal ‘learners’
Supra-marginal gyrus
Kraemer et al, 2009, University Pennsylvania

AGCA 2009Neuroscience and neuromythology
“There are multiple intelligences”
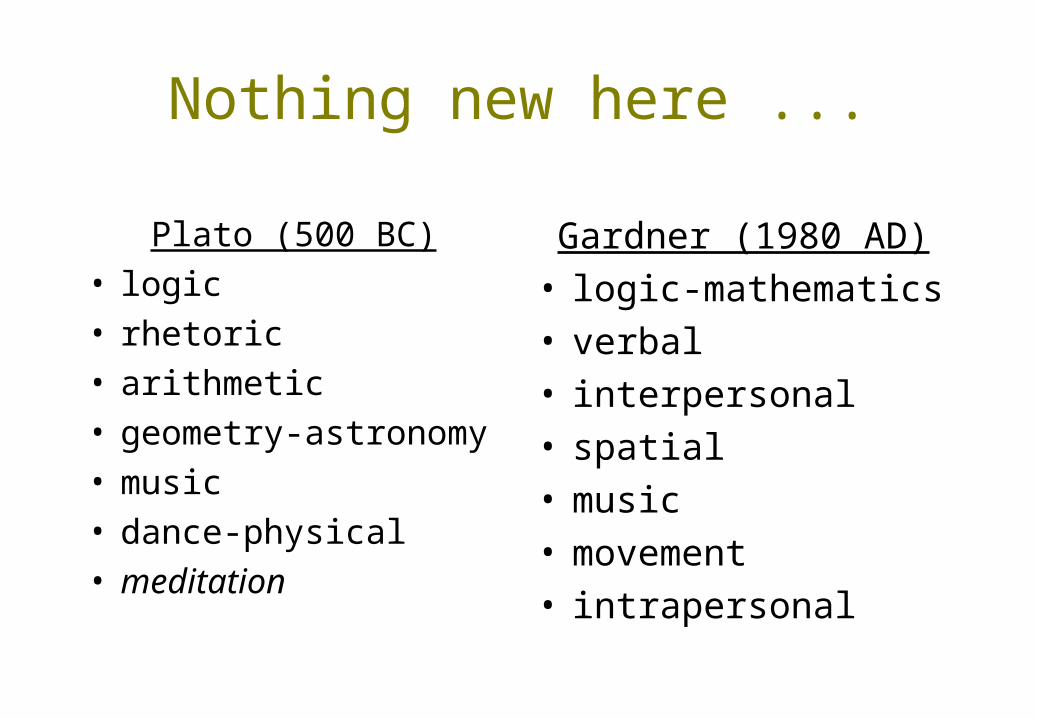
Nothing new here ...
Plato (500 BC)• logic• rhetoric• arithmetic• geometry-astronomy• music• dance-physical• meditation
Gardner (1980 AD)• logic-mathematics• verbal• interpersonal • spatial• music• movement• intrapersonal

Nothing new here ...
Plato (500 BC)• logic• rhetoric• arithmetic• geometry-astronomy• music• dance-physical• meditation
Gardner (1980 AD)• logic-mathematics• verbal• interpersonal • spatial• music• movement• intrapersonal

Common brain functions for all acts of intelligence: NB school learning
• Working memory <= lateral frontal cortex
• Long term memory <= hippocampus + …
• Decision making <= orbitofrontal cortex
• Emotional mediation <= limbic subcortex + ofc
• Sequencing of symbolic representation <= fusiform gyrus + temporal lobe
• Conceptual inter-relationships <= parietal lobe
• Conceptual rehearsal <= cerebellum

AGCA 2009Neuroscience and neuromythology
“There are structural and functional differences between male and female
brains”

Sex differences in neurogenesis
Differing relative concentrations of testosterone and oestrogen as neurotaxic agents produce sex differences in neuroanatomy
e.g. females - larger corpus callosum
males - denser parietal areas

Posner & Raichle, 1994
Males – larger parietal areasFemales - larger corpus callosum
Sex-linked preferences for processing different types of information
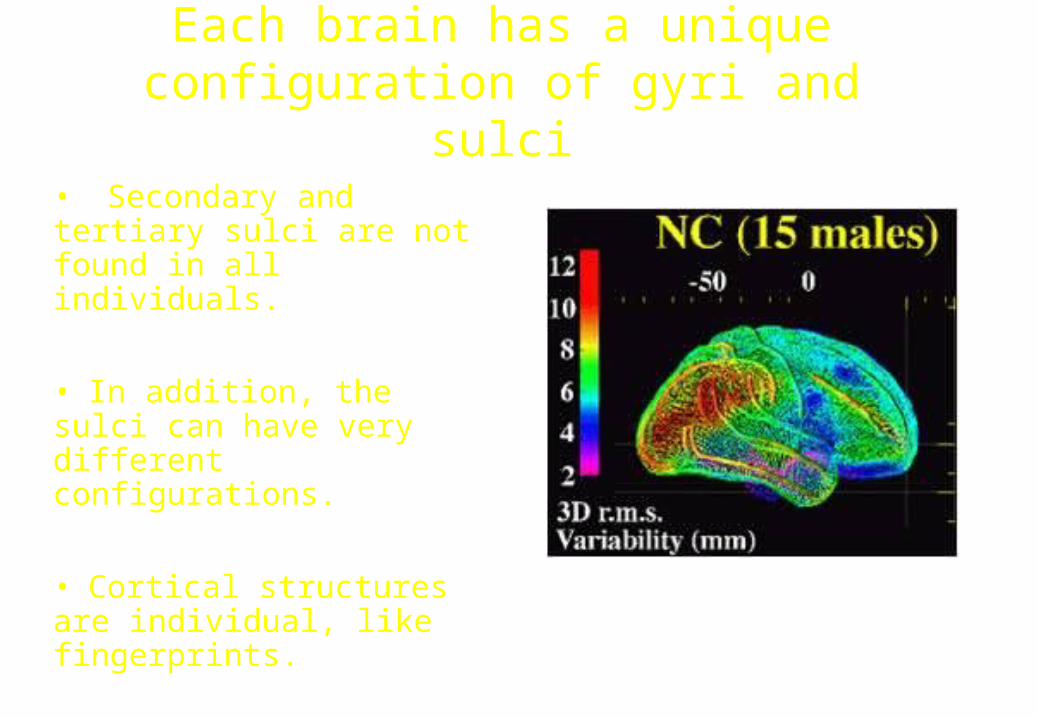
Each brain has a unique configuration of gyri and sulci
• Secondary and tertiary sulci are not found in all individuals.
• In addition, the sulci can have very different configurations.
• Cortical structures are individual, like fingerprints.
Rorden & Brett, MRC Brain and Cognition Unit Cambridge, UK, 2005

AGCA 2009Neuroscience and neuromythology
“There are specific physical activities which cause enhanced activation of specific
brain functions”

Brain vasculature is bilateral and fractal
Exercise that increases blood flow anywhere,
increases blood flow everywhere.
Close


If anyone approaches your school with an offer of a ‘brain-based’ learning
programme, ask them which neuroscience laboratory they are associated with.
(You don’t necessarily want a brain scientist, but you do need someone who understands brain science, and the best way to understand brain
science is to work with brain scientists.)

Educational neuroscience:curriculum sequencing
Australian Guidance Counsellors Association Annual ConferenceHobart, April 2009

Does abstract mathematical thinking develop
from concrete mathematical thinking?
Provocative answer: NO!
The watershed of fractions
The important analogies for understanding fractions are initially between abstract quantity ratios, not blocks of chocolate.
Hence the dissociation between concrete and abstract performance, e.g., street sellers.
The converse dissociation of kids who get the abstract but not the concrete is probably very rare since making post hoc analogies with concrete examples would be easy once you have the abstract.

Neural representations of abstract symbols
The function of a specific sub-region of the left fusiform gyrus (LFG) is the detection of generic symbolic sequences.
Contrast with the function of specific sub-regions of the right fusiform gyrus (RFG) to detect faces, and familiar objects.

Educational neuroscience:executive attention
Australian Guidance Counsellors Association Annual ConferenceHobart, April 2009
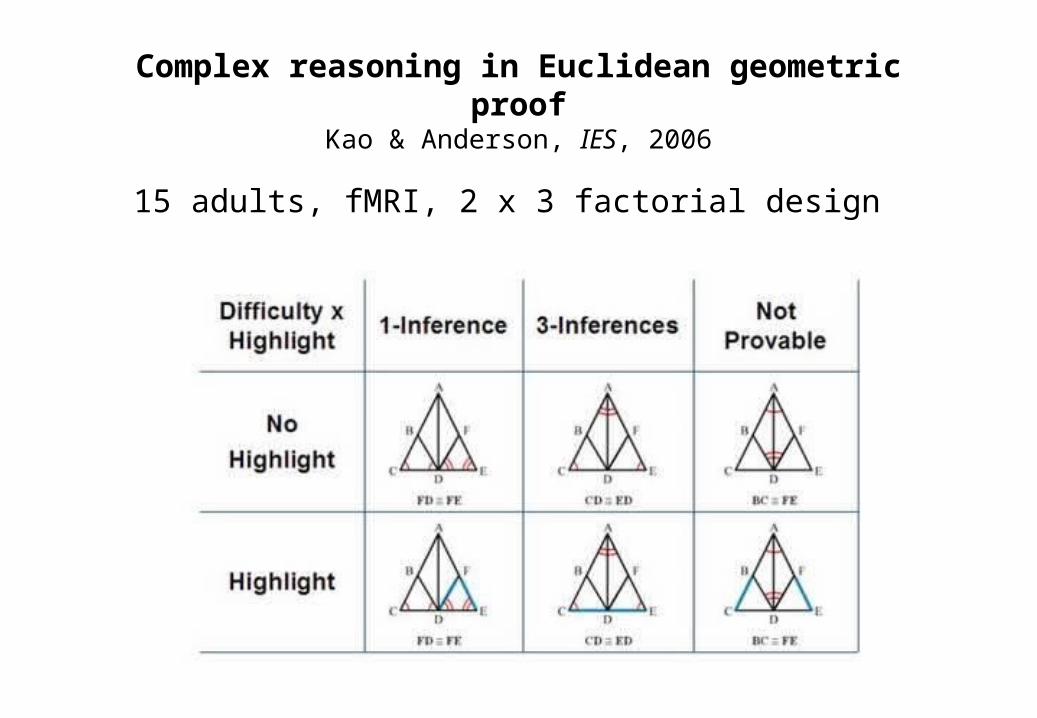
Complex reasoning in Euclidean geometric proofKao & Anderson, IES, 2006
15 adults, fMRI, 2 x 3 factorial design

Complex reasoning in Euclidean geometric proofKao & Anderson, IES, 2006
The critical process to understand appears to be how proficient problem-solvers integrate problem givens and diagram information to support their logical inferences, and how this process differs in experts, proficient problem solvers, and novices
Educational neuroscience:pedagogy
Australian Guidance Counsellors Association Annual ConferenceHobart, April 2009

Intraparietal cortex as a potential substrate for a number sense Eger et al, Neuron, 2003
In an event-related fMRI study, we presented numbers, letters, and colours in the visual and auditory modality, asking subjects to respond to target items within each category.
In the absence of explicit magnitude processing, numbers compared with letters and colours across modalities activated a bilateral region in the horizontal intraparietal sulcus.
This stimulus-driven number-specific intraparietal response supports the idea of a supramodal number representation that is automatically accessed by presentation of numbers and may code magnitude information.

Why the parietal cortex for magnitude AND visualisation?
Path integration in mammals and its interaction with visual landmarksEtienne, Maurer and Seguinot, Journal of Experimental Biology, 1996
During locomotion, mammals update their position with respect to a fixed point of reference, such as their point of departure, by processing inertial cues, proprioceptive feedback and stored motor commands generated
during locomotion. This so-called path integration system (dead reckoning) allows the animal to return to its home, or to a familiar feeding place, even when external cues are absent or novel.
However, without the use of external cues, the path integration process leads to rapid accumulation of errors involving both the direction and distance of the goal. Therefore, even nocturnal species such as hamsters and mice rely more on previously learned visual references than on the path integration system when the two types of information are in conflict. Recent studies investigate the extent to which path integration and familiar visual cues cooperate to optimize the navigational performance.

Why the parietal cortex for magnitude AND visualisation?
Parietal cortex evolved to help us find our way home
Whole-body propriocentrism
Geometry and trigonometry in the real world
Classroom application: LOGO Turtle!
Educational neuroscience:assessment
Australian Guidance Counsellors Association Annual ConferenceHobart, April 2009

Nuclear Magnetic Resonance MObile Universal Surface Explorer
NMR-MOUSE

Wearable (near) optical topography headsets

Chinese dyslexia: differences in brain structure and function
Conclusion: structural and functional basis for dyslexia varies between alphabetic and nonalphabetic languages.
Wai Ting Siok , Zhendong Niu , Zhen Jin , Charles A. Perfetti, and Li Hai Tan, 2008

Educational neuroscience:interdisciplinary engagement
Australian Guidance Counsellors Association Annual ConferenceHobart, April 2009

Importance of involving educators in helping set the educational neuroscience
research agenda
• Is there a critical period for learning a second language? Music? Physics?
• Should boys and girls be taught separately in some subjects?
• Are the brains of children today different from those of previous eras due to high levels of IT usage?
• Are there any predictive correlations between differences in brain structure and school outcomes?

Establishment of a methodology for educational neuroscience
– education problem … – science research question … – science finding … – education implication / application
Professional Development in Educational NeuroscienceGloucestershire Advanced Skills TeachersInstitute for the Future of the Mind, 21st Century School, University of Oxford

McGraw-Hill / Open University Press, 2009
References: academic articles
Byrnes, JP & Fox, NA (1998) The educational relevance of research in cognitive neuroscience, Educational Psychology Review, 10(3), 297-342 (and following commentaries to p412).
Coffield, F., Moseley, D., Hall, E., & Ecclestone, K. (2004).. Learning styles and pedagogy in post-16 learning: A systematic and critical review (Report No. 041543). London: Learning and Skills Research Centre.
Geake, JG (2004) Cognitive neuroscience and education: two-way traffic or one-way street? Westminster Studies in Education, 27(1), 87-98.
Geake, JG (2005) Educational neuroscience and neuroscientific education: In search of a mutual middle way. Research Intelligence, 92, 10-13.
Geake, JG & Cooper, PW (2003) Implications of cognitive neuroscience for education. Westminster Studies in Education, 26(10), 7-20.
Goswami, U (2004) Neuroscience and education. British Journal of Educational Psychology, 74, 1-14.
Goswami, U (2006) Neuroscience and education: from research to practice? Nature Reviews Neuroscience, 7, 406-413
Gura, T (2005) Big plans for little brains. Nature, 435, 1156-1158.
Kratzig, G.P. & Arbuthnott, K.D. (2006) Perceptual learning style and learning proficiency: A test of the hypothesis, Journal of Educational Psychology, 98(1), p238-246.
OECD (2002) Understanding The Brain: Towards a New Learning Science.
OECD (2007) Understanding The Brain: Birth of a Learning Science.
Sharp, JG, Byrne, J & Bowker, R. (2007) VAK or VAK-uous? Lessons in the trivialisation of learning and the death of scholarship. Research Papers in Education (in press)
Kayser, C. (2007) Listening with Your Eyes. Scientific American Mind, April.

References: for teachers
Beyerstein, BL (2004) Ask the Experts: Do we really use only 10% of our brains? Scientific American, 290(6), 86.
Blakemore, S-J & Frith, U (2005) The Learning Brain: Lessons for Education, Blackwell Publishing.
British Neuroscience Association & European Dana Alliance For The Brain (2003) Neuroscience: Science of the Brain: An Introduction for Young Students. Liverpool, BNA.
Byrnes, JP (2001) Minds, Brains, and Learning: Understanding the Psychological and Educational Relevance of Neuroscientific Research, Guilford Press.
Geake, JG (2000) Knock down the fences: Implications of brain science for education. Principal Matters, April, 41-43.
Geake, JG (2003) Adapting Middle Level educational practices to current research on brain functioning. Journal of the New England League of Middle Schools, 15(2), 6-12.
Geake, JG (2004) How Children’s Brains Think: Not left or right but both together. Education 3-13, 32(3), 65-72.
Geake, JG (2006) The neurological basis of intelligence: A contrast with 'brain-based' education. Education-Line, www.leeds.ac.uk/educol/documents/156074.htm.
Geake, JG (2007) A Brainy School Of The Future? Learning Matters (in press)