Neuronal firing and waveform alterations through ictal ...
53
Copyright © 2020 the authors Research Articles: Neurobiology of Disease Neuronal firing and waveform alterations through ictal recruitment in humans https://doi.org/10.1523/JNEUROSCI.0417-20.2020 Cite as: J. Neurosci 2020; 10.1523/JNEUROSCI.0417-20.2020 Received: 18 February 2020 Revised: 29 October 2020 Accepted: 11 November 2020 This Early Release article has been peer-reviewed and accepted, but has not been through the composition and copyediting processes. The final version may differ slightly in style or formatting and will contain links to any extended data. Alerts: Sign up at www.jneurosci.org/alerts to receive customized email alerts when the fully formatted version of this article is published.
Transcript of Neuronal firing and waveform alterations through ictal ...

Copyright © 2020 the authors
Research Articles: Neurobiology of Disease
Neuronal firing and waveform alterationsthrough ictal recruitment in humans
https://doi.org/10.1523/JNEUROSCI.0417-20.2020
Cite as: J. Neurosci 2020; 10.1523/JNEUROSCI.0417-20.2020
Received: 18 February 2020Revised: 29 October 2020Accepted: 11 November 2020
This Early Release article has been peer-reviewed and accepted, but has not been throughthe composition and copyediting processes. The final version may differ slightly in style orformatting and will contain links to any extended data.
Alerts: Sign up at www.jneurosci.org/alerts to receive customized email alerts when the fullyformatted version of this article is published.

Abbreviated title: NEURONAL ACTIVITY IN HUMAN SEIZURES 1
Neuronal firing and waveform alterations through ictal recruitment in humans
Edward M. Merricks1, Elliot H. Smith1,2, Ronald G. Emerson3, Lisa M. Bateman1, Guy M. McKhann II4,
Robert R. Goodman5, Sameer A. Sheth6, Bradley Greger7, Paul A. House8, Andrew J. Trevelyan9,
Catherine A. Schevon1*
1. Department of Neurology, Columbia University Medical Center, New York NY 2. Department of Neurosurgery, University of Utah, Salt Lake City UT 3. Department of Neurology, Weill Cornell Medical Center, New York, NY 4. Department of Neurosurgery, Columbia University Medical Center, New York NY 5. Department of Neurosurgery, Lenox Hill Hospital, New York NY 6. Department of Neurosurgery, Baylor College of Medicine, Houston TX 7. School of Biology and Health Systems Engineering, Arizona State University, Tempe AZ 8. Intermountain Healthcare, Murray UT 9. Newcastle University Biosciences Institute, Newcastle upon Tyne, UK
* Corresponding author: [email protected] Number of figures: 10 Number of tables: 3 Number of movies: 2 Words in Abstract: 242 Words in Introduction: 518 Words in Discussion: 1,499
Funding:
NIH R01 NS084142; CRCNS R01 NS095368
Conflicts of interest:
GMM is an investigator and on the publication committee for the "Stereotactic Laser Ablation in Temporal Epilepsy" (SLATE) trial funded by Medtronic, plc.; RRG serves on the Surgical Advisory Board of NeuroPace, Inc.; RGE is co-founder of Ice Neurosystems, Inc., and reports an ownership interest in Amgen, Inc., Bristol Myers Squibb, Eli Lilly & Company, General Electric, Johnson & Johnson, Inc., NeuroPace, Inc., Pfizer, Quality Care Properties, Thermo Fisher Scientific.

NEURONAL ACTIVITY IN HUMAN SEIZURES 2
2
ABSTRACT 1
Analyzing neuronal activity during human seizures is pivotal to understanding mechanisms of 2
seizure onset and propagation. These analyses, however, invariably using extracellular 3
recordings, are greatly hindered by various phenomena that are well established in animal 4
studies: changes in local ionic concentration, changes in ionic conductance, and intense, 5
hypersynchronous firing. The first two alter the action potential waveform, whereas the third 6
increases the “noise”; all three factors confound attempts to detect and classify single neurons. 7
To address these analytical difficulties, we developed a novel template-matching based spike 8
sorting method, which enabled identification of 1,239 single neurons in 27 patients (13 female) 9
with intractable focal epilepsy, that were tracked throughout multiple seizures. These new 10
analyses showed continued neuronal firing with widespread intense activation and stereotyped 11
action potential alterations in tissue that was invaded by the seizure: neurons displayed increased 12
waveform duration (p < 0.001) and reduced amplitude (p < 0.001), consistent with prior animal 13
studies. By contrast, neurons in “penumbral” regions (those receiving intense local synaptic drive 14
from the seizure but without neuronal evidence of local seizure invasion) showed stable 15
waveforms. All neurons returned to their pre-ictal waveforms after seizure termination. We 16
conclude that the distinction, between “core” territories invaded by the seizure, versus 17
“penumbral” territories, is evident at the level of single neurons. Furthermore, the increased 18
waveform duration and decreased waveform amplitude are neuron-intrinsic hallmarks of seizure 19
invasion that impede traditional spike sorting and could be used as defining characteristics of 20
local recruitment. 21
22

NEURONAL ACTIVITY IN HUMAN SEIZURES 3
3
SIGNIFICANCE STATEMENT 23
Animal studies consistently show marked changes in action potential waveform during epileptic 24
discharges, but acquiring similar evidence in humans has proven difficult. Assessing neuronal 25
involvement in ictal events is pivotal to understanding seizure dynamics and in defining clinical 26
localization of epileptic pathology. Using a novel method to track neuronal firing, we analyzed 27
microelectrode array recordings of spontaneously occurring human seizures, and here report two 28
dichotomous activity patterns. In cortex that is recruited to the seizure, neuronal firing rates 29
increase and waveforms become longer in duration and shorter in amplitude as the neurons are 30
recruited to the seizure, while penumbral tissue shows stable action potentials, in keeping with 31
the “dual territory” model of seizure dynamics. 32

NEURONAL ACTIVITY IN HUMAN SEIZURES 4
4
Introduction 33
A complete understanding of the mechanisms underlying seizure pathology and dynamics 34
depends on knowledge of the local neuronal activity, and what is driving that activity. 35
Comparative animal models have long been used to gain insights into the underlying neuronal 36
activity during seizures (Purpura et al., 1972; Fariello et al., 1976; Grone & Baraban, 2015), with 37
the paroxysmal depolarizing shift (PDS), for more than half a century, being regarded as the 38
intracellular correlate of ictal discharges in animal models (Kandel & Spencer, 1961a, 1961b; 39
Matsumoto & Marsan, 1964; Traub & Wong, 1982). 40
More recently, early PDSs have been shown to evolve into seizures in vivo (Steriade & 41
Amzica, 1999), and PDSs have been recorded in resected human cortical tissue (Marcuccilli et 42
al., 2010; Eissa et al., 2016). The PDS causes a decrease in action potential amplitude and an 43
increase in half width – features that should impede standard spike sorting methods – and yet this 44
phenomenon has not been reported in several studies of single unit activity during spontaneous 45
human seizures (Wyler et al., 1982; Babb et al., 1987; Stead et al., 2010; Truccolo et al., 2011, 46
2014; Bower et al., 2012). In fact, beyond the PDS, altered action potential waveforms could be 47
expected following seizure invasion of the recording site, which we refer to as “recruitment”. 48
Due to the intense bursts of neural firing, alterations to Na+ and K+ concentrations are present in 49
the intracellular and extracellular space, which impact action potential wave shapes (Harris et al., 50
2000). 51
We have shown preliminary evidence of such potential alterations (Merricks et al., 2015). 52
In tissue recruited to the seizure, traditional spike sorting methods can fail to cluster single units 53
in human ictal recordings from neocortical layers 4/5, where neuronal cell body density is 54
particularly high (Keller et al., 2018), thereby hindering the ability to track evidence of wave 55

NEURONAL ACTIVITY IN HUMAN SEIZURES 5
5
shape alterations or neuronal firing patterns during and after ictal recruitment, with zero clusters 56
surviving detection during the seizure (Merricks et al., 2015; Fig. 1). However, whether this 57
originated from alterations to neurons’ intrinsic action potential shapes or simply from 58
destructive interference of waveforms from nearby, highly active cells recorded on the same 59
electrode has been unclear. 60
Here, we present analyses of neuronal activity in the human brain during focal seizures 61
using novel template matching methods in order to characterize action potential waveform 62
alterations and single unit firing patterns, as the seizure approaches, recruits, and passes through 63
the local cortical territory. We hypothesize that, similar to observations in animal models, human 64
focal seizures consistently display alteration of intrinsic action potential shapes upon ictal 65
recruitment. Meanwhile, we have shown previously that unrecruited tissue can show the 66
characteristic, rhythmic EEG activity of seizures because of intense, local synaptic activity, 67
despite being outside the recruited tissue due to maintained feedforward inhibition: a situation 68
we define as “penumbral” tissue (Schevon et al., 2012). We hypothesize that the distinction 69
between recruited and penumbral tissue is maintained at the level of single neurons, with 70
recruited cells displaying reduced waveform amplitude, and increased duration, an effect that is 71
absent in penumbral sites demonstrating increased firing rates, but lacking typical seizure 72
hallmarks. 73
Materials and Methods 74
Human recordings 75
Adult patients (13 female, 14 male) undergoing surgical evaluation for pharmacoresistant 76
focal epilepsy at Columbia University Irving Medical Center (CUIMC) and University of Utah 77
were implanted with either a 96 channel, 4 x 4 mm “Utah”-style microelectrode array (UMA; 78

NEURONAL ACTIVITY IN HUMAN SEIZURES 6
6
Blackrock Microsystems, Salt Lake City, UT) or Behnke-Fried style microwires (BF array; Ad-79
tech Medical Equipment Corp, Oak Creek, WI) simultaneous to standard clinical 80
electrocorticography (ECoG) or stereo-electroencephalography (sEEG) respectively. UMAs were 81
implanted into neocortical gyri based on presurgical estimation of the ictogenic region, with 82
electrode tips reaching layer 4/5 (1.0 mm electrode length; layer confirmed via histology in 83
Schevon et al. (2012)), while BF arrays consisted of 8 microwires protruding ~4 mm from the 84
tips of clinical depth electrodes (Misra et al., 2014). 85
Neural data were recorded at a sampling rate of 30 kHz on each microelectrode with a 86
range of ± 8 mV at 16-bit precision, with a 0.3 Hz to 7.5 kHz bandpass filter on a Neuroport 87
Neural Monitoring System (Blackrock Microsystems, Salt Lake City, UT). ECoG data from 88
subdural or depth arrays were collected with a sampling rate of either 500 Hz or 2 kHz, with 24-89
bit precision and a bandpass filter of 0.5 Hz to ¼ the sampling rate. In UMAs, the reference was 90
either subdural or epidural, chosen based on recording quality. In BF arrays, the reference was 91
the ninth microwire within the bundle. 92
All procedures were approved by the Institutional Review Boards of CUIMC and 93
University of Utah, and all patients provided informed consent prior to surgery, as described 94
previously. Clinical determination of seizure onset zone (SOZ) and seizure spread was made 95
initially by the treating physicians and confirmed prior to analysis by two board-certified 96
neurologists (CAS & LMB). BF arrays were localized using Brainlab (BrainLAB AG, Munich, 97
Germany). 98
Statistical analyses 99
All analyses were performed offline using custom scripts and toolboxes written in 100
MATLAB (MathWorks, Natick MA). Code is available at https://github.com/edmerix. All 101
NEURONAL ACTIVITY IN HUMAN SEIZURES 7
7
statistical tests for significance were performed using the Mann-Whitney U test unless otherwise 102
noted, due to the non-Gaussian distributions of data requiring non-parametric testing. For all 103
tests, the level for statistical significance (α) was set to 0.05, and Holm-Bonferroni correction 104
was applied in all instances of multiple tests. 105
Local recruitment to the seizure 106
We have previously proposed that focal seizures are comprised of two co-existing 107
neuronal behavior patterns in regions that exhibit abnormal EEG activity during the seizure, 108
characterizing distinct territories that are unique to each individual. Full ictal recruitment features 109
aberrant local firing and synaptic activity. “Penumbral” activity is characterized by rhythmic 110
EEG activity due to intense synaptic barrage from the seizure, but heterogeneous neural firing 111
(Schevon et al., 2012; 2019). Local ictal recruitment occurs when the leading edge of the seizure 112
activity (the “ictal wavefront”) successfully propagates into the local tissue (Trevelyan et al., 113
2006; 2007; Schevon et al., 2012; Liou et al., 2020). The hallmark of this ictal wavefront is a 114
transient “tonic” firing pattern, characterized by a high firing rate and lack of oscillatory 115
organization (asterisk in Fig. 1B). This event defines recruitment to the seizure, while the “burst” 116
firing that follows is the extracellular correlate of the PDS across a neuronal population that has 117
been recruited to the seizure (Matsumoto & Marsan, 1964; Trybba et al., 2019; Liou et al., 2020). 118
Note that unlike the SOZ, which is the region of earliest ictal activity, ictal recruitment 119
and the penumbra are spatially and temporally dynamic, as the seizure wavefront propagates 120
through brain tissue (Smith et al., 2016). As such, a fixed location, unless at the true origin of the 121
initial ictal activity, may receive the synaptic input of the upstream seizure but remain 122
unrecruited (“penumbral”) initially, prior to the transition to the ictal state which may occur at 123
any point during the seizure. 124

NEURONAL ACTIVITY IN HUMAN SEIZURES 8
8
UMAs detect relatively large numbers of single neurons from nearby space, allowing for 125
analysis of multi-unit activity and its spatial organization across the sampled territory (MUA; 126
Table 1). Therefore, the timing of the passage of the ictal wavefront at individual electrodes was 127
calculated based on the MUA firing rate in UMAs. A Gaussian kernel of 500 ms duration was 128
convolved with the timings of all detected waveforms in the MUA, and a sustained, significant 129
increase in the resultant instantaneous firing rate was determined as the moment of local 130
recruitment to the seizure as previously defined (Smith et al., 2016). Ictal recordings without this 131
signature of tonic to burst MUA firing were classified as penumbral. 132
BF arrays, meanwhile, record from relatively few disparately located neurons (Table 2), 133
and thus MUA firing cannot be readily detected for use in defining ictal recruitment (see 134
Discussion). Therefore, we used these cases instead as a robustness test of UMA population 135
findings relative to clinical information, making use of the spatial distribution of BF array 136
implants. 137
Preliminary single unit discrimination 138
Initial spike sorting was performed on the period before and after the seizure (“peri-139
ictal”) as per Merricks et al. (2015). Briefly, neural signals were symmetrically bandpass filtered 140
between 300 Hz and 5 kHz (1000th order FIR1) to extract MUA, from which extracellular action 141
potential waveforms were detected using a voltage threshold of 4.5 , where 142 = | |. , and x is the MUA from that channel. This method avoids the biasing effect 143
of large waveforms on channels with units with high firing rates (Quian Quiroga et al., 2004). 144
Ictal periods were blanked so that spike sorting was only performed on stable waveforms from 145
the peri-ictal period. 146

NEURONAL ACTIVITY IN HUMAN SEIZURES 9
9
Matrices of waveforms from each channel were created from 0.6 ms prior to 1 ms post 147
each detection, and principal component based semi-automatic cluster cutting was performed 148
using a modified version of the “UltraMegaSort2000” MATLAB toolbox (Hill et al., 2011; Fee 149
et l., 1996). We devised a novel method for removing non-physiological artifacts by calculating 150
the FFT on all detected spikes in the MUA, and removing those with power > 5 SD above the 151
mean in frequencies above 2.5 kHz or below 500 Hz. While these frequencies are found in 152
physiological signals, higher power in these bands corresponded to electrical and/or motion 153
artifact, being faster and slower than the main components of extracellular action potentials 154
respectively, with a complete period of < 0.4 ms or > 2 ms. Spikes removed in this manner were 155
visually inspected to ensure correct classification as artifact (2.06% total, n = 3,317 of 160,887 156
spikes). Clusters that satisfied the following criteria were accepted: (i) clean separation from all 157
other clusters in the Fisher’s linear discriminant in principal component space; (ii) less than 1% 158
contamination of the 2 ms absolute refractory period; (iii) no clear outliers based on the 159
anticipated chi-squared distribution of Mahalanobis distances; and (iv) less than 1% of estimated 160
false negatives as estimated by the amount of a Gaussian fit to the detected voltages fell below 161
the threshold for detection, as described in Hill et al. (2011). 162
Template matching through seizures 163
We developed novel methods in order to match waveforms from the ictal period, 164
regardless of recruitment, to their putative neuronal source based on templates derived from the 165
peri-ictal units. In contrast to standard spike sorting methods, our aim with these methods was to 166
minimize false negatives at the expense of increasing a limited number of false positives so as to 167
avoid missing potential matches and make it possible to distinguish between neurons ceasing 168
firing as opposed to becoming un-trackable by the method. To template match waveforms, 169

NEURONAL ACTIVITY IN HUMAN SEIZURES 10
10
principal components were calculated separately for each channel, on a matrix of all waveforms 170
from the previously defined units from both the pre- and post-ictal period recorded at that 171
electrode. Cluster boundaries were then defined as the 3-dimensional convex hull surrounding 172
the scores for the three principal components that contained the largest variance of the original 173
data for that channel, using the MATLAB function “convhull” (Fig. 2). The first three 174
components were chosen as convhull functions in up to 3-dimensional space, and while 175
“convhulln” could be used to increase specificity at the expense of sensitivity in future analyses, 176
here we wished to avoid potential false negatives from a more restricted approach, which would 177
result from using higher dimensions. Using only the first three components accounted for 96.5% 178
± 1.82% (mean ± SD) of the total variance in all original units, and 93.0% ± 2.95% of the 179
variance in the matched waveforms. 180
This method accounts for two situations: that neurons within recruited cortex maintain 181
their wave shape but are obscured by interference from other nearby cells; or that there are 182
occasional or consistent alterations to a neuron’s intrinsic waveform that are minor enough to be 183
maintained within the convex hull of feature space. The convex hull allows for alterations to 184
wave shape in any dimension (any direction away from the cluster’s centroid). 185
To avoid ictal results being biased through differing methods, template matching was 186
performed on waveforms that were extracted from a period from 10 minutes prior to 10 minutes 187
post seizures, including the ictal activity that had been blanked in the original peri-ictal spike 188
sorting. Channels with unstable units during interictal periods were excluded. Units with no 189
waveforms in either the pre-ictal or ictal time period after template matching and artifact removal 190
were excluded from further analyses (n = 77), and units with mean firing rates of less than 0.1 191
spikes s-1 during the seizure were treated as being “untracked”. 192

NEURONAL ACTIVITY IN HUMAN SEIZURES 11
11
Principal component scores were calculated on these waveforms based on the previously 193
defined principal components, and waveforms that occurred within a peri-ictal unit’s convex hull 194
were assigned to that cell. Mahalanobis distances were calculated for all matches, between their 195
location in principal component space and all peri-ictal waveforms from that unit, on the first n 196
principal components that explained > 95% of the variance in the data set (Fig. 2C). The 197
expected distribution of Mahalanobis distances was calculated as the chi-squared probability 198
distribution with n degrees of freedom. Waveforms that had < 0.1% chance of occurring in the 199
chi-squared distribution were excluded. 200
Waveform metrics 201
For analyses of waveform shape after template matching, the full-width at half maximum 202
(FWHM) and amplitude were used. The FWHM was calculated by interpolating each waveform 203
by a factor of 4 to avoid quantization, and calculating the waveform’s duration at half its 204
amplitude. When calculating waveform amplitude changes through the ictal transition, only units 205
whose mean voltage at detection was at least 2.5 SD away from that channel’s threshold for 206
detection were used, to minimize the floor effect from small units that dropped below threshold. 207
Timing of FWHM alteration relative to the earliest ictal activity was determined by the 208
earliest timepoint during the seizure that the mean FWHM remained above the pre-ictal mean 209
plus the pre-ictal standard deviation for at least 1 second, calculated in a sliding window of 5 s 210
duration with a time step of 50 ms, discarding windows with fewer than 5 waveforms. 211
For analyses involving the probability that each waveform arose from its assigned peri-212
ictal unit, match confidences were calculated by fitting a separate Gaussian curve (with a 213
maximum amplitude of 1) to the distribution of voltages at each data point in the original unit, 214
and calculating the mean probability across all time samples. As such, a waveform passing 215

NEURONAL ACTIVITY IN HUMAN SEIZURES 12
12
through the most likely voltage at each separate time point for that unit would have a match 216
probability of 1 (Fig. 3). 217
Firing rate calculations 218
Instantaneous firing rates were calculated by convolving the unit firing times with a 219
Gaussian kernel (200 ms SD) with the amplitude scaled to each waveform’s probability of 220
matching the original unit, thereby creating probabilistic firing rates for each unit through time, 221
by probability of when the action potential occurred and probability that the waveform originated 222
from the putative neuronal source. As such, a waveform that had an average probability of 20% 223
across all fitted Gaussians from each data point would contribute only 0.2 spikes s-1 at its most 224
likely time point, while an exact match to the most likely voltage at each time point would 225
contribute 1 spike s-1. Weighting the firing rates in this manner served to reduce the impact of 226
false positives from the necessarily inclusive spike sorting methods. Thresholds for significant 227
increases and decreases in firing rate were calculated as 3 times the square root of the firing rate 228
divided by the duration of the epoch, which approximates 3 SD for a Poisson distribution and 229
allows for analysis of significant changes in firing rates of spike trains (Vajda et al., 2008). 230
Results 231
We analyzed ictal recordings from 27 patients undergoing invasive EEG monitoring as 232
part of the presurgical evaluation for intractable focal epilepsy (Tables 1 & 2; age range = 19 to 233
55; 13 female, 14 male). Six patients were implanted with Utah microelectrode arrays (UMA; 234
Blackrock Microsystems Inc, Salt Lake City, UT), and the remaining 21 patients were implanted 235
with between 1 and 4 Behnke-Fried depth arrays with incorporated microwire bundles (BF 236
arrays; Ad-tech Medical Equipment Corp, Oak Creek, WI). A total of 41 seizures were reviewed 237
(10 UMA; 31 BF array), of which 27 demonstrated ictal recruitment through MUA firing rate 238

NEURONAL ACTIVITY IN HUMAN SEIZURES 13
13
calculation in UMAs, or subsequent waveform alterations in BF arrays (see Methods; UMA: 6 239
seizures from 3 patients; BF arrays: 21 seizures from 13 patients). 240
Tracking neurons through seizures 241
To assess the presence of physiological waveform shape changes across populations of 242
neurons, we employed template matching using convex hulls (Fig. 2, see Methods) on each 243
seizure. This allows for assigning unit identities without the need for spatially separated cluster 244
boundaries in the data required for standard spike sorting, while accepting waveform alterations 245
that may occur as a consequence of the intense firing that accompanies seizure invasion. In total, 246
1,239 units were isolated from the pre- and post-ictal period using traditional spike sorting, with 247
the ictal time period blanked as described in the Methods section “Preliminary single unit 248
discrimination”. Of these units derived from traditional spike sorting, 938 of the 1,107 units 249
recorded on UMAs and 120 of 132 units on BF arrays were tracked through seizures using this 250
method. This is in contrast to previous abilities to spike sort through seizures in similar layer 4/5 251
recordings, where the requirement for stable clusters resulted in a retention rate of 37.7% across 252
all recordings, and 0% in recruited tissue (Merricks et al., 2015). The 14.6% of “lost” units in the 253
template matched data here may have arisen either from cessation of firing, or deformation of 254
wave shape beyond the defined convex hull for that unit; we therefore analyzed the rate of 255
untracked neurons with reference to whether there was multiunit activity evidence of seizure 256
invasion, defined as the arrival of the ictal wavefront (limited to UMA recordings; see Methods). 257
While units were lost at similar rates regardless of location (mean ± SD lost in recruited vs. 258
penumbral recordings: 15.8% ± 9.5% vs. 14.5% ± 12.0%), the stage of analysis during which the 259
units were lost differed by location. In recordings from recruited tissue, 104 of 105 (99.0%) 260
neurons that were untracked were rejected due to too low firing rate in the pre-ictal period to 261
NEURONAL ACTIVITY IN HUMAN SEIZURES 14
14
build templates, while 1 (0.95%) neuron was untracked due to too low firing rate during the 262
seizure (< 0.1 spikes s-1). In contrast, in penumbral recordings, 37 of 64 (57.8%) neurons were 263
untracked due to too low firing rate in the pre-ictal period to build templates and the remaining 264
27 (42.2%) were rejected due to too low firing rates during the seizure, highlighting the role of 265
quiescence in penumbral recordings but not in recruited tissue. 266
As the focus of this study was maximizing unit detection despite waveform deformations, 267
our method was designed to maximize the likelihood of detecting ictal activity of the identified 268
units. However, accepting all waveforms that fell within the convex hull of a previously defined 269
unit’s principal component space increases the probability of false detections. With no ground 270
truth, we therefore weighted each waveform’s probability of being a match to their assigned unit 271
by their waveform similarities (Fig. 3; “Waveform Metrics” in Methods). To assess the effect of 272
this probabilistic method, we tested it on the pre-ictal epochs in the population data from UMA 273
recordings. Without the probabilistic weighting, the method substantially overestimated pre-ictal 274
firing rates (original vs. matched mean ± SD: 0.436 ± 0.723 vs. 0.798 ± 1.615 spikes s-1; p < 275
0.001). After weighting by waveform match confidence, the overestimation was greatly reduced 276
(original vs. matched mean ± SD: 0.436 ± 0.723 vs. 0.487 ± 0.925 spikes s-1; p = 0.695). 277
Furthermore, waveform matches from the convex hull method were found to be more 278
likely to arise from their assigned peri-ictal units than by chance, as calculated by the 279
aforementioned waveform similarities. The “null” distribution for expected match probabilities 280
by chance was calculated through comparing each waveform’s similarity to the peri-ictal 281
voltage-time distributions of all other units. Comparing intra- to inter-unit similarities in this way 282
found a higher similarity between template matched units and their presumed peri-ictal unit than 283
to the “null” distribution of matches to other units (p < 0.001; Mann-Whitney U test; Fig. 3B). 284

NEURONAL ACTIVITY IN HUMAN SEIZURES 15
15
While waveforms from other channels would plausibly appear in the same convex hull 285
space as a given single unit due to the similarity in action potential morphology, we wished to 286
ensure these higher similarities were not purely a result of more waveforms occurring outside the 287
hull in other channels. To assess this, we compared the matched waveforms to all waveforms 288
from other electrodes that occurred within the unit’s convex hull. The matched data were found 289
to have lower Mahalanobis distances within the convex hull and higher waveform match values 290
than waveforms from other channels within the convex hull (p < 0.0001 in both cases). 291
Neuronal firing rates through the ictal transition 292
We analyzed the firing rates of template matched unit populations throughout ictal 293
activity in UMA recordings and related these to multiunit activity evidence of seizure invasion, 294
defined as the time of arrival of the ictal wavefront (Patients 3–5; see Methods). Single unit 295
firing rate increased following ictal recruitment in all seizures with 446 (79.5%) of 561 units 296
showing greater than 3 SD increase in firing rate, and only 1 unit in the entire population 297
showing a greater than 3 SD decrease in firing rate (range of single units with > 3 SD increase 298
per seizure: 70% – 96%; see Table 3). An example seizure demonstrating these trends is shown 299
in Fig. 4, highlighting both the raw results from the convex hull matching (blue) and the 300
weighted values to minimize the impact of false positives (purple). 301
To contextualize firing rates in seizures using these methods, we sought to gain further 302
insight into the underlying signal to noise composition of single neuron recordings in recruited 303
versus penumbral tissue. To do so, we analyzed the proportion of spike detections that were 304
classified as action potentials from a single neuron in channels with only one single unit using 305
the template matched data. In recordings from recruited tissue there was a large decrease in the 306
signal to noise ratio, with 47.7% ± 26.7% of waveforms attributable to the single neuron in the 307

NEURONAL ACTIVITY IN HUMAN SEIZURES 16
16
pre-ictal period, versus 11.9% ± 8.1% of waveforms during the seizure (p < 0.001; Wilcoxon 308
signed rank test, n = 94 neurons). In contrast, recordings from penumbral tissue were stable, with 309
44.4% ± 27.3% of waveforms being attributed to single neurons in the pre-ictal period versus 310
36.8% ± 26.7% (p = 0.09; Wilcoxon signed rank test, n = 33 neurons). These values correspond 311
to no significant difference between regions in the pre-ictal period (p = 0.4799; Mann-Whitney U 312
test) and a significant decrease in signal to noise ratio in single neuron recordings in recruited 313
tissue in comparison to penumbral recordings (p < 0.0001; Mann-Whitney U test). 314
Dual effects of seizures on single unit waveforms 315
Single neuron studies in acute mouse seizure models show increases in action potential 316
duration (Codadu et al., 2019) and decreases in action potential amplitude (c.f. Supplementary 317
Fig. 4 in Merricks et al., 2015; 0 Mg2+ in vitro cell-attached mouse slice model). We therefore 318
predicted that wave shapes in recruited tissue would change in one direction in each metric, so if 319
the convex hull method worked, we should see not a random change in waveform shape, but a 320
consistent finding of increased duration and decreased amplitude. Individually, results from the 321
template matching method in recordings from recruited tissue (see Methods; Patients 3, 4 & 5) 322
showed decreases in waveform amplitude and increases in waveform full-width at half maximum 323
(FWHM; Fig. 5, ictal waveforms in red), and were stereotyped across seizures within patient ( 324

NEURONAL ACTIVITY IN HUMAN SEIZURES 17
17
Fig. 6). At the population level, units in recruited cortex displayed a significant global 325
increase in FWHM (Fig. 7A; pre-ictal vs. ictal mean ± SD: 0.470 ± 0.137 ms vs. 0.611 ± 0.194 326
ms), with 457 (81.5%) of 561 single units showing a significant increase in FWHM during the 327
seizure (Holm-Bonferroni corrected Mann-Whitney U test; range across seizures: 79% – 97%; 328
see Table 3). Meanwhile, units in penumbral cortex, i.e. where no ictal wavefront was detected, 329
showed only a minor increase in FWHM at the population level (Fig. 7B; pre-ictal vs. ictal mean 330
± SD: 0.414 ± 0.009 ms vs. 0.429 ± 0.099 ms) with only 9 (5.8%) of 156 single units showing a 331
significant (p < 0.05) increase in FWHM during the seizure (Holm-Bonferroni corrected Mann-332
Whitney U test; range across seizures: 4% – 16%; see Table 3). In a single case (Patient 6), the 333
UMA was at the edge of ictal spread based on clinical and EEG assessment, and in this patient 334
105 (47.5%) of 221 units showed a significant increase in FWHM (pre-ictal vs. ictal mean ± SD: 335
0.408 ± 0.111 ms vs. 0.421 ± 0.152 ms). These waveform shape alterations co-existed with stable 336
wave shapes elsewhere on the UMA at the same time (Fig. 8), and this patient’s recordings were 337
incorporated into the penumbral dataset for population representation in the figures (Fig. 7). 338
FWHM increases in recruited tissue were significantly larger than those in penumbral/edge case 339
recordings (p < 0.001; one-tailed Mann-Whitney U test). 340
Similarly, units in recruited cortex showed a decrease in waveform amplitude during the 341
seizure (Fig. 7C; pre-ictal vs. ictal mean ± SD: 48.82 ± 30.91 μV vs. 34.96 ± 19.54 μV), while 342
penumbral recordings maintained their peri-ictal amplitude (Fig. 7D; pre-ictal vs. ictal mean ± 343
SD: 46.69 ± 16.59 μV vs. 45.08 ± 15.05 μV in fully penumbral cases; 47.00 ± 21.18 μV vs 45.57 344
± 20.93 μV in the semi-recruited UMA). The amplitude reduction in recruited tissue was greater 345
than in penumbral/edge case recordings (p < 0.001; one-tailed Mann-Whitney U test), with 346
recruited recordings showing significant decreases in amplitude during the seizure in 49.3% of 347

NEURONAL ACTIVITY IN HUMAN SEIZURES 18
18
units versus 6.4% of units in the penumbra and 38.9% in semi-recruited tissue (Holm-Bonferroni 348
corrected Mann-Whitney U test). The direction of these changes–a decrease in amplitude and an 349
increase in FWHM–was consistent throughout the combined dataset of recruited cortex, and seen 350
in all recruited seizures, with only 1 neuron in recruited cortex showing the inverse effect of a 351
significant decrease in FWHM (0.18%) and 13 (2.32%) showing an increase in amplitude. 352
To confirm that these findings were not a result of the template matching method 353
introducing an unknown variable that affected our waveform measurements, results from the 354
original spike sorted data and those originating from the convex hull method on the pre-ictal 355
period were compared, finding little difference between the traditional cluster cutting results and 356
the convex hull matched results (Fig. 7A-D i, inset cumulative histograms). 357
To ensure that these results were not biased by outlier effects in any individual seizure, all 358
analyses were subjected to a “leave-one-out” robustness test. In recruited cortex, the mean ± SD 359
results for FWHM across all permutations while leaving one seizure out were 0.462 ± 0.0054 ms 360
in the pre-ictal period and 0.600 ± 0.013 ms in the ictal period, with 82.3% ± 1.4% of units 361
showing significant changes. Similarly, the amplitude results were maintained with pre-ictal 362
values of 48.59 ± 5.91 μV and ictal values of 35.06 ± 2.61 μV across all permutations. 363
Similarly, we sought to confirm that outliers in the penumbral group were a result of the 364
edge case recording in Patient 6. In total, 8 units were found to contribute more than 1 standard 365
deviation above the mean to the ictal distribution of short FWHMs (Fig. 7B i), accounting for 366
66.6% of all waveforms in this range. Of these, no difference in FWHM was found between the 367
pre-ictal and ictal time points (p = 0.35), and all were found to increase their firing rate 368
substantially during the seizure (mean increase in firing rate of 17.0 SD above pre-ictal levels, 369
range: 10.5 – 27.1 SD increase), confirming that this distribution shift was a result of increased 370

NEURONAL ACTIVITY IN HUMAN SEIZURES 19
19
firing in a subset of neurons, rather than waveform alterations. Furthermore, we found that 371
86.1% and 85.4% of significant changes in FWHM and amplitude respectively in the 372
penumbral/edge case group were attributable to that single patient. 373
Action potential changes in deep structures 374
To assess the spatiotemporal relationship between waveform alterations and seizure 375
recruitment within patients, beyond the capabilities of the 4 mm2 UMA and in deep structures 376
such as the hippocampus, we analyzed BF array recordings with the equivalent template 377
matching, blind to the clinically-defined seizure onset zone and areas of propagation. In BF array 378
recordings, 30 of 120 single units (25.0%) showed increases beyond a cut-off significance level 379
of p < 0.05 (Holm-Bonferroni corrected Mann-Whitney U test) in FWHM (17 seizures from 13 380
patients), and 30 units (25.0%; 16 seizures from 11 patients) showed reduction in waveform 381
amplitude below the same significance cut-off (p < 0.05; Table 2). In 9 seizures from 6 patients, 382
single units were simultaneously present on multiple separate BF arrays (on different bundles of 383
microwires, as opposed to different microwires within a single BF). Of these, 2 seizures (2 384
patients) showed significant waveform alterations in dual locations, indicative of recruitment in 385
multiple locations (Patients 14 and 15; Fig. 9; Table 2), while 5 seizures (4 patients) showed both 386
activity types simultaneously, indicative of recruitment in one location while a second recorded 387
location remained outside the seizure-invaded region (Patients 11, 12, 16 and 21; Movie 1). 388
Five of the 13 patients with significant waveform alterations had a clinically defined SOZ 389
in the mesial temporal lobe, and simultaneously recorded single units in the ipsilateral 390
hippocampus demonstrated significant waveform alterations (Patients 8, 15, 16, 26 & 27; Table 391
2). In 7 further patients, significant waveform alterations were found in tissue consistent with 392
putative seizure spread. In one case (Patient 10) we found waveform alterations in the 393

NEURONAL ACTIVITY IN HUMAN SEIZURES 20
20
contralateral hippocampal body, consistent with clinical observations of contralateral seizure 394
spread in this case. Conversely, in the 8 patients showing no significant waveform alterations, the 395
clinically defined SOZ was anatomically distant in all cases (Patients 9, 13, 17–20, 24 & 25; 396
Table 2). 397
In one instance of a patient recorded with BF arrays in the hippocampal head and body, a 398
peculiarly discrete unit cluster due to a very large amplitude waveform (mean = 354 μV; 399
background noise level = 25 μV) enabled us to follow its action potential through the ictal 400
transition by visual inspection alone, despite marked changes to wave shape and increases in 401
other unit activity (Fig. 9; Movie 2; Schevon et al., 2019). In this example, the firing rate of the 402
high amplitude unit increased abruptly approximately 8 s after seizure initiation (Patient 15; 403
Table 2). Both the action potential amplitude and FWHM were stable prior to this time and pre-404
ictally, but amplitude reduced and FWHM increased sharply upon the abrupt increase in firing 405
rate (Fig. 9; pre-ictal vs. ictal mean ± SD amplitude and FWHM: 354.2 μV ± 45.7 μV vs. 265.7 406
μV ± 33.4 μV and 0.33 ms ± 0.04 ms vs. 0.40 ms ± 0.05 ms; both p < 0.001, Mann-Whitney U 407
test). 408
A simultaneously recorded single unit on a separate BF microwire bundle located in the 409
same hippocampus around 1 cm away demonstrated the same changes in amplitude and FHWM 410
developing around 1 second later (Fig. 9B ii; Table 2). The distinct time course of these two 411
physically disparate units shows that the alterations are unit-specific and are unlikely to be 412
caused by physiological changes as a result of the seizure that affect large regions, or by 413
movement artifacts (the seizure had a bland semiology, with no observed stress on the recording 414
device). Taken together, these findings are suggestive of a slowly propagating seizure through the 415
hippocampus, with waveform amplitude and FWHM timings echoing the template matched 416

NEURONAL ACTIVITY IN HUMAN SEIZURES 21
21
results in the UMA (note the similarity between Fig. 5B and Fig. 9D), and occurring in tandem 417
(Fig. 9D, blue through red transition, colors maintained from panel A). 418
Action potential changes in relation to seizure recruitment 419
To assess whether the classification of ictal recruitment via waveform alterations was 420
consistent with the clinically defined SOZ and regions of spread, the time from earliest ictal 421
activity to a consistent (≥ 1 s duration) increase in FWHM ≥ 1 SD above the mean pre-ictal level 422
for each unit was calculated. These analyses were split by recording type to assess different 423
recruitment properties: BF array recordings allow for multiple spatial sampling, comparing 424
waveform changes in different regions; while UMA recordings allow for analysis of the ictal 425
wavefront propagation in a single location with many simultaneously recorded neurons. 426
In BF arrays, recordings determined to be in the SOZ showed a mean (± SD) delay of 427
10.23 ± 3.03 s (n = 6 seizures from 5 patients), while those deemed to be in regions of spread 428
showed a mean (± SD) delay of 22.96 ± 12.59 s (n = 8 seizures, 8 patients; p < 0.05, Mann-429
Whitney U test). The two cases showing recruitment in dual locations showed anatomically 430
feasible recruitment times (right hippocampal head to right hippocampal body in 1.1 s in Patient 431
15, and left mid-cingulate to left hippocampus in 10.3 s in Patient 14). In one case, single unit 432
waveforms remained stable throughout a focal to bilateral tonic-clonic seizure (right mesial 433
cingulate, Patient 18; Table 2). 434
In UMA recordings with clearly defined ictal wavefront propagation (4 seizures, 2 435
patients; Smith et al., 2016), the timings of FWHM increases correlated with the ictal wavefront 436
timing across the arrays, with significantly higher correlation than values derived from a 437
bootstrapping approach, shuffling the FWHM timing locations randomly 10,000 times (mean ± 438
SD 2D correlation, observed data: r = 0.76 ± 0.12; shuffled data: r = -0.0007 ± 0.0012; Fig. 10). 439
NEURONAL ACTIVITY IN HUMAN SEIZURES 22
22
The FWHM increases preceded the tonic firing associated with ictal recruitment by an average of 440
1.85 seconds (± 1.94 s SD), and the propagation speed of FWHM changes across the arrays 441
(mean ± SD: 0.64 mm/s ± 0.24 mm/s) corresponded with the speeds calculated previously for the 442
ictal wavefront propagation in these patients (Schevon et al., 2012; Smith et al., 2016). 443
Discussion 444
In animal models, it is possible to isolate neurons experimentally, by guiding electrodes 445
onto cells (Trevelyan et al., 2006). This is not possible in human recordings, and consequently, 446
there is a dearth of rigorous evidence about the firing patterns of human neurons through seizures. 447
Instead, previous studies have either identified the ictal wavefront in terms of multi-unit activity 448
(Schevon et al., 2012; Smith et al., 2016), used standard spike-sorting methods despite the 449
limitations we have described (Truccolo et al., 2011; Bower & Buckmaster, 2008; Bower et al., 450
2012), or limited assessment to the time prior to seizure invasion (Misra et al., 2018). 451
Here, we sought to overcome these limitations, exploring the impact of action potential 452
alterations in spontaneously occurring human seizures, how these alterations relate to underlying 453
ictal territories, and the neuronal basis of ictal phenomena previously described in terms of 454
multi-unit activity such as the ictal wavefront. We previously showed that traditional spike 455
sorting fails upon ictal invasion of the recording site (Merricks et al., 2015), however, it was not 456
possible to differentiate if this was due to intrinsic waveform alterations or hypersynchronous 457
activity (Trevelyan et al., 2006, 2007; Schevon et al., 2012; Weiss et al., 2013). Here, we 458
developed novel methods to track units through seizures, retaining identities of putative 459
individual neurons. We hypothesized that temporary loss of clusters was due in part to transient 460
alterations to action potential shapes, as opposed solely to obfuscation of stable waveforms by 461
the sudden increase in MUA, and that neurons not demonstrating evidence of ictal recruitment 462
NEURONAL ACTIVITY IN HUMAN SEIZURES 23
23
would remain stable. The method proved remarkably effective, enabling us to define 463
probabilistic firing rates for the majority of units throughout the seizure. This enabled us to 464
establish that neurons only rarely become quiescent during seizures. 465
Units during the seizure displayed two types of activity: deformation of wave shapes across 466
the population, or largely stable waveforms. UMA recordings afforded the ability to detect local 467
ictal recruitment through characteristic MUA firing, and these types of activity corresponded to 468
recruitment and penumbra respectively (Fig. 7), with all neurons that were untracked due to low 469
ictal firing occurring in penumbra. Waveforms recovered after seizure termination and showed 470
stereotyped responses across seizures, highlighting that a neuron’s wave shape change, in 471
response to the synaptic barrage of ictal activity, is maintained across multiple seizures. 472
The template-matching method would equally favor waveform alterations in any 473
dimension, so if changes were a result of the methodology, we would expect the template to 474
capture waveforms with larger amplitude and decreased FWHM at an equal rate. In such a case, 475
we would anticipate a broadening of the distribution of these features during the ictal period. 476
Instead, we see a clear shift in the distributions to the right and left in the FWHM and amplitude 477
respectively, arguing for a consistent physiological cause. 478
Detection of the ictal wavefront is generally not possible in BF arrays, due to lower 479
neuronal density in mesial structures relative to layer 4/5 neocortex (Pakkenberg & Gundersen, 480
1997; Keller et al., 2018), and reduced “listening spheres” due to higher impedance (BF: 50-500 481
k ; UMA: 80-150 k ; Tóth et al., 2016). Therefore, we used these recordings to evaluate the 482
robustness of these findings, allowing for sampling of multiple sites in a given patient. Both the 483
presence and timing of waveform alterations correlated well with clinical observations (Table 2). 484
Seizure spread locations showed delayed waveform changes compared to recordings from SOZ 485

NEURONAL ACTIVITY IN HUMAN SEIZURES 24
24
regions (22.96 vs. 10.23 s), and the longest delay occurred after spread to the contralateral 486
hippocampus (Patient 10; 42.7 s). The only case with discordance between waveform and 487
clinical data showed an increase in FWHM during the seizure, but at no point did the mean 488
FWHM surpass the threshold of 1 SD above the pre-ictal mean (Patient 21). In this instance, the 489
SOZ was in the right insula and somatosensory cortex, with waveform alterations in the right 490
hippocampus. While hippocampal recruitment is plausible, this may represent a false positive in 491
the temporally coarse statistical test. 492
In a subset of recordings, stable waveforms were found simultaneously with waveform 493
changes both in separate BF arrays (5 seizures) and on the same UMA (1 seizure), clinical 494
correlation matched these observations in all cases. Furthermore, in 2 seizures, recruitment was 495
found at multiple BF arrays, consistent with clinical observations, along with relative delays in 496
keeping with anatomical distance (Fig. 9; Patients 14 & 15). In the UMA, clinical observations 497
were consistent with the array located at the outer boundary of seizure spread; we posit this is a 498
simultaneous recording of both recruited and penumbral cortex (Fig. 8). 499
Note also, that in Patient 6 there is an increase in firing rate of waveforms of brief duration 500
during the ictal period (Fig. 7B). Given the UMA’s proximity to the oncoming ictal wavefront, 501
this increase may be explained by an increase in firing of fast-spiking interneurons, which have 502
been shown to exhibit brief waveforms (McCormick & Feeser, 1990; Csicsvari et al., 1999; 503
Peyrache et al., 2012) and would corroborate the penumbral feedforward inhibition model 504
(Trevelyan et al., 2007; Cammarota et al., 2013; Parrish et al., 2019). 505
The waveform changes found in recruited tissue are in keeping with those observed in 506
animal models, being indicative of the shortening and broadening of action potentials associated 507
with PDS (Traub & Wong, 1982). This was especially evident in a unique BF array recording 508

NEURONAL ACTIVITY IN HUMAN SEIZURES 25
25
wherein a neuron was able to be tracked without need for extra methods due to its amplitude 509
being 14 times that of the background noise (Patient 15; Fig. 9), with feature alterations 510
strikingly reminiscent of the UMA population data (Fig. 5B & Fig. 9D), and timing in keeping 511
with recruitment during tonic firing (Fig. 8 & Fig. 9). 512
Even so, the extent to which waveforms alter is likely underrepresented in population data, 513
due to changing detection sensitivity from interference between synchronous action potentials or 514
reduction of amplitude of some waveforms below the noise threshold. The template-matching 515
method was designed to minimize false negatives in order to capture as much single unit activity 516
during seizures as possible, but it is likely that waveforms undergo large enough changes to be 517
lost outside the convex hull, or below threshold; even physiological bursting has been shown to 518
result in substantial alterations to extracellularly recorded action potentials (Harris et al., 2000; 519
Henze et al., 2000). As such, these results are necessarily a snapshot of the total activity of any 520
individual neuron during the seizure, and yet still show significant waveform changes. 521
Together, the UMA and BF array recordings provide evidence supporting the dual-territory 522
model of seizures: a “core” with waveform changes, coexisting with “penumbral” tissue with 523
stable waveforms. These indicate that waveform change can be considered a defining feature of 524
recruitment to the seizure, and the definition of recruitment is maintained at the level of single 525
neurons. 526
Finally, our data demonstrate that seizures propagating through cortex are marked by tonic, 527
local neuronal firing (Fig. 4), as opposed to the wavefront being composed of subthreshold 528
activity due to, for example, increased K+ concentration limiting concomitant firing. Studies of 529
neuronal activity recorded in humans have rarely reported such a finding. Our findings in this 530
paper suggest that extreme, rapid waveform alterations may obscure the presence of the 531

NEURONAL ACTIVITY IN HUMAN SEIZURES 26
26
wavefront when standard spike sorting methods are used. Despite the greatly increased 532
sensitivity for units provided by our method, 14.6% of neurons were lost at the ictal transition – 533
whether these ceased firing or underwent waveform changes too extreme to remain in the convex 534
hull cannot be determined. 535
The method of tracking single units across the ictal transition was designed to minimize 536
false negatives in order to track waveform deformations, and although firing rates were 537
calculated in a probabilistic manner to minimize the impact of false positives, related template-538
matching methods, such as a Gaussian-mixture model of principal component scores may prove 539
useful in analyses of firing patterns. Going further, modeling of ionic currents in pathological 540
conditions may allow anticipation of how the waveform of each neuron should change during 541
seizures, permitting “personalized” tracking of neurons via cell-intrinsic features that have 542
proven useful in non-pathological time points (Trainito et al., 2019; Mosher et al., 2020) but are 543
disrupted during seizures. 544
These methods enable the use of both human and animal recordings to address open 545
questions regarding the mechanism of seizure spread. An immediate application, given the 546
activity presented here, is how cell-types relate to the propagation of pathological activity; 547
considerable debate has focused on the role of interneurons in seizure spread (Grasse et al., 548
2013; Elahian et al., 2018; Magloire et al., 2018; Miri et al., 2018; Weiss et al., 2018). Several of 549
these prior studies addressing cell-type specific ictal activity derived from extracellular 550
recordings have not reported waveform alterations, suggesting that these were either recordings 551
from penumbral territories, or firing may have been substantially underestimated. We anticipate 552
elucidation of these mechanisms will come from data confirmed to be in recruited tissue – these 553

NEURONAL ACTIVITY IN HUMAN SEIZURES 27
27
methods lay important groundwork for analyses into how ictal propagation relates to the 554
underlying firing of local inhibitory and excitatory cells. 555

NEURONAL ACTIVITY IN HUMAN SEIZURES 28
28
REFERENCES 556
Babb TL, Wilson CL & Isokawa-Akesson M (1987). Firing patterns of human limbic neurons 557 during stereoencephalography (SEEG) and clinical temporal lobe seizures. 558 Electroencephalogr Clin Neurophysiol 66, 467–482. 559
Bower MR, Buckmaster PS (2008) Changes in granule cell firing rates precede locally recorded 560 spontaneous seizures by minutes in an animal model of temporal lobe epilepsy. J 561 Neurophysiol 99:2431–2442. 562
Bower MR, Stead M, Meyer FB, Marsh WR & Worrell GA (2012). Spatiotemporal neuronal 563 correlates of seizure generation in focal epilepsy. Epilepsia 53, 807–816. 564
Cammarota M, Losi G, Chiavegato A, Zonta M & Carmignoto G (2013). Fast spiking 565 interneuron control of seizure propagation in a cortical slice model of focal epilepsy. The 566 Journal of Physiology 591, 807–822. 567
Codadu NK, Graham RT, Burman RJ, Jackson‐Taylor RT, Raimondo JV, Trevelyan AJ, Parrish 568 RR (2019) Divergent paths to seizure‐like events. Physiol Rep 7 569
Csicsvari J, Hirase H, Czurkó A, Mamiya A & Buzsaki G (1999). Oscillatory coupling of 570 hippocampal pyramidal cells and interneurons in the behaving Rat. Journal of 571 Neuroscience 19, 274–287. 572
Eissa TL, Tryba AK, Marcuccilli CJ, Ben-Mabrouk F, Smith EH, Lew SM, Goodman RR, 573 McKhann GM, Frim DM, Pesce LL, Kohrman MH, Emerson RG, Schevon CA & van 574 Drongelen W (2016). Multiscale Aspects of Generation of High-Gamma Activity during 575 Seizures in Human Neocortex. eneuro 3, ENEURO.0141–15.2016–17. 576
Elahian B, Lado NE, Mankin E, Vangala S, Misra A, Moxon K, Fried I, Sharan A, Yeasin M, 577 Staba R, Bragin A, Avoli M, Sperling MR, Engel J & Weiss SA (2018). Low-voltage fast 578 seizures in humans begin with increased interneuron firing. Annals of neurology 84, 588–579 600. 580
Fariello RG, Portera A & Scheffner D (1976). Parenteral Penicillin in Rats: An Experimental 581 Model of Multifocal Epilepsy. Epilepsia 17, 217–222. 582
Fee MS, Mitra PP, Kleinfeld D (1996). Automatic sorting of multiple unit neuronal signals in the 583 presence of anisotropic and non-Gaussian variability. Journal of Neuroscience Methods 584 69:175–188. 585
Grasse DW, Karunakaran S & Moxon KA (2013). Neuronal synchrony and the transition to 586 spontaneous seizures. Experimental Neurology 248, 72–84. 587
Grone BP & Baraban SC (2015). Animal models in epilepsy research: legacies and new 588 directions. Nature neuroscience 18, 339–343. 589

NEURONAL ACTIVITY IN HUMAN SEIZURES 29
29
Harris KD, Henze DA, Csicsvari J, Hirase H & Buzsaki G (2000). Accuracy of tetrode spike 590 separation as determined by simultaneous intracellular and extracellular measurements. 591 Journal of Neurophysiology 84, 401–414. 592
Henze DA, Borhegyi Z, Csicsvari J, Mamiya A, Harris KD & Buzsaki G (2000). Intracellular 593 features predicted by extracellular recordings in the hippocampus in vivo. Journal of 594 Neurophysiology 84, 390–400. 595
Hill DN, Mehta SB & Kleinfeld D (2011). Quality metrics to accompany spike sorting of 596 extracellular signals. The Journal of Neuroscience 31, 8699–8705. 597
Kandel ER & Spencer WA (1961a). The pyramidal cell during hippocampal seizure. Epilepsia 2, 598 63–69. 599
Kandel ER & Spencer WA (1961b). Electrophysiology of hippocampal neurons. II. After-600 potentials and repetitive firing. J Neurophysiol 24, 243–259. 601
Keller D, Erö C & Markram H (2018). Cell Densities in the Mouse Brain: A Systematic Review. 602 Frontiers in Neuroanatomy 12, 506–21. 603
Liou J, Smith EH, Bateman LM, Bruce SL, McKhann GM, Goodman RR, Emerson RG, 604 Schevon CA, Abbott L (2020) A model for focal seizure onset, propagation, evolution, 605 and progression. eLife 9:e50927. 606
Magloire V, Mercier MS, Kullmann DM & Pavlov I (2018). GABAergic Interneurons in 607 Seizures: Investigating Causality With Optogenetics. The Neuroscientist 35, 608 107385841880500–15. 609
Marcuccilli CJ, Tryba AK, van Drongelen W, Koch H, Viemari JC, Peña-Ortega F, Doren EL, 610 Pytel P, Chevalier M, Mrejeru A, Kohrman MH, Lasky RE, Lew SM, Frim DM & 611 Ramirez J-M (2010). Neuronal Bursting Properties in Focal and Parafocal Regions in 612 Pediatric Neocortical Epilepsy Stratified by Histology: Journal of Clinical 613 Neurophysiology 27, 387–397. 614
Matsumoto H & Marsan CA (1964). Cortical cellular phenomena in experimental epilepsy: Ictal 615 manifestations. Exp Neurol 9, 305–326. 616
McCormick DA & Feeser HR (1990). Functional implications of burst firing and single spike 617 activity in lateral geniculate relay neurons. Neuroscience; DOI: 10.1016/0306-618 4522(90)90225-S. 619
Merricks EM, Smith EH, McKhann GM, Goodman RR, Bateman LM, Emerson RG, Schevon 620 CA & Trevelyan AJ (2015). Single unit action potentials in humans and the effect of 621 seizure activity. Brain : a journal of neurology 138, 2891–2906. 622
Miri ML, Vinck M, Pant R & Cardin JA (2018). Altered hippocampal interneuron activity 623 precedes ictal onset. eLife 7, 1277. 624
NEURONAL ACTIVITY IN HUMAN SEIZURES 30
30
Misra A, Burke JF, Ramayya AG, Jacobs J, Sperling MR, Moxon KA, Kahana MJ, Evans JJ, 625 Sharan AD (2014) Methods for implantation of micro-wire bundles and optimization of 626 single/multi-unit recordings from human mesial temporal lobe. J Neural Eng 11:026013. 627
Misra A, Long X, Sperling MR, Sharan AD, Moxon KA (2018) Increased neuronal synchrony 628 prepares mesial temporal networks for seizures of neocortical origin. Epilepsia 3:219–14. 629
Mosher CP, Wei Y, Kamiński J, Nandi A, Mamelak AN, Anastassiou CA, Rutishauser U (2020) 630 Cellular Classes in the Human Brain Revealed In Vivo by Heartbeat-Related Modulation 631 of the Extracellular Action Potential Waveform. Cell Reports 30:3536-3551.e6. 632
Pakkenberg B & Gundersen HJ (1997). Neocortical neuron number in humans: effect of sex and 633 age. The Journal of comparative neurology 384, 312–320. 634
Parrish RR, Codadu NK, Mackenzie Gray Scott C & Trevelyan AJ (2019). Feedforward 635 inhibition ahead of ictal wavefronts is provided by both parvalbumin- and somatostatin-636 expressing interneurons. The Journal of physiology 597, 2297–2314. 637
Peyrache A, Dehghani N, Eskandar EN, Madsen JR, Anderson WS, Donoghue JA, Hochberg 638 LR, Halgren E, Cash SS & Destexhe A (2012). Spatiotemporal dynamics of neocortical 639 excitation and inhibition during human sleep. Proceedings of the National Academy of 640 Sciences of the United States of America 109, 1731–1736. 641
Purpura DP, Penry JK, Tower DB & Woodbury DM eds. (1972). Experimental models of 642 epilepsy: A manual for the laboratory worker. Raven Press, New York. 643
Quian Quiroga R, Nadasdy Z & Ben-Shaul Y (2004). Unsupervised Spike Detection and Sorting 644 with Wavelets and Superparamagnetic Clustering. Neural Computation 16, 1661–1687. 645
Schevon CA, Tobochnik S, Eissa T, Merricks E, Gill B, Parrish RR, Bateman LM, McKhann 646 GM, Emerson RG & Trevelyan AJ (2019). Multiscale recordings reveal the dynamic 647 spatial structure of human seizures. Neurobiology of disease 127, 303–311. 648
Schevon CA, Weiss SA, McKhann G, Goodman RR, Yuste R, Emerson RG & Trevelyan AJ 649 (2012). Evidence of an inhibitory restraint of seizure activity in humans. Nature 650 Communications 3, 1060–11. 651
Smith EH, Liou J, Davis TS, Merricks EM, Kellis SS, Weiss SA, Greger B, House PA, McKhann 652 GM, Goodman RR, Emerson RG, Bateman LM, Trevelyan AJ & Schevon CA (2016). 653 The ictal wavefront is the spatiotemporal source of discharges during spontaneous human 654 seizures. Nat Commun 7, 11098. 655
Stead M, Bower M, Brinkmann BH, Lee K, Marsh WR, Meyer FB, Litt B, Van Gompel J & 656 Worrell GA (2010). Microseizures and the spatiotemporal scales of human partial 657 epilepsy. Brain 133, 2789–2797. 658
Steriade M & Amzica F (1999). Intracellular study of excitability in the seizure-prone neocortex 659 in vivo. Journal of Neurophysiology 82, 3108–3122. 660

NEURONAL ACTIVITY IN HUMAN SEIZURES 31
31
Tóth E, Fabó D, Entz L, Ulbert I & Erőss L (2016). Intracranial neuronal ensemble recordings 661 and analysis in epilepsy. Journal of Neuroscience Methods 260, 261–269. 662
Trainito C, von Nicolai C, Miller EK, Siegel M (2019) Extracellular Spike Waveform 663 Dissociates Four Functionally Distinct Cell Classes in Primate Cortex. Current Biology 664 29:2973-2982.e5. 665
Traub RD & Wong RK (1982). Cellular mechanism of neuronal synchronization in epilepsy. 666 Science 216, 745–747. 667
Trevelyan AJ, Sussillo D, Watson BO & Yuste R (2006). Modular propagation of epileptiform 668 activity: evidence for an inhibitory veto in neocortex. The Journal of Neuroscience 26, 669 12447–12455. 670
Trevelyan AJ, Sussillo D & Yuste R (2007). Feedforward inhibition contributes to the control of 671 epileptiform propagation speed. The Journal of Neuroscience 27, 3383–3387. 672
Truccolo W, Ahmed OJ, Harrison MT, Eskandar EN, Cosgrove GR, Madsen JR, Blum AS, Potter 673 NS, Hochberg LR & Cash SS (2014). Neuronal ensemble synchrony during human focal 674 seizures. The Journal of Neuroscience 34, 9927–9944. 675
Truccolo W, Donoghue JA, Hochberg LR, Eskandar EN, Madsen JR, Anderson WS, Brown EN, 676 Halgren E & Cash SS (2011). Single-neuron dynamics in human focal epilepsy. Nature 677 neuroscience 14, 635–641. 678
Tryba AK, Merricks EM, Lee S, Pham T, Cho S, Nordli DR, Eissa TL, Goodman RR, McKhann 679 GM, Emerson RG, Schevon CA, van Drongelen W (2019) Role of paroxysmal 680 depolarization in focal seizure activity. Journal of Neurophysiology 122:1861–1873. 681
Weiss SA, Banks GP, McKhann GM, Goodman RR, Emerson RG, Trevelyan AJ & Schevon CA 682 (2013). Ictal high frequency oscillations distinguish two types of seizure territories in 683 humans. Brain 136, 3796–3808. 684
Vajda I, van Pelt J, Wolters P, Chiappalone M, Martinoia S, van Someren E, van Ooyen A 685 (2008) Low-frequency stimulation induces stable transitions in stereotypical activity in 686 cortical networks. Biophysical Journal 94:5028–5039. 687
Weiss SA, Staba R, Bragin A, Moxon K, Sperling M, Avoli M & Engel J (2018). Interneurons 688 and principal cell firing in human limbic areas at focal seizure onset. Neurobiology of 689 disease 124, 183–188. 690
Wyler AR, Ojemann GA & Ward AA (1982). Neurons in human epileptic cortex: correlation 691 between unit and EEG activity. Annals of neurology 11, 301–308. 692
693

NEURONAL ACTIVITY IN HUMAN SEIZURES 32
32
FIGURE LEGENDS 694
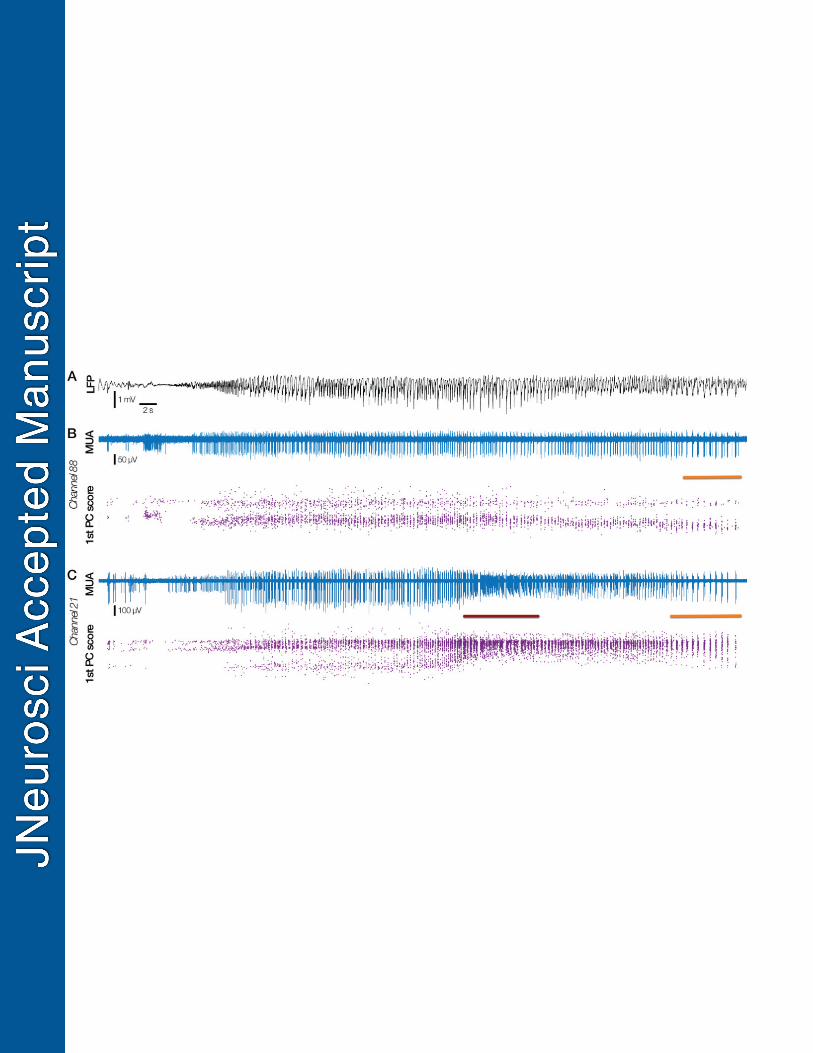
Fig. 1 Effects of ictal recruitment on traditional spike sorting methods 695
Spike sorting relies on stable waveforms from nearby neurons, but ictal activity disrupts features 696
used to cluster single units. A. Example broadband LFP from a single channel of a UMA 697
implanted in the posterior temporal lobe of a patient with pharmacoresistant epilepsy (Patient 4, 698
seizure 1). Dashed red line denotes “global” seizure onset. B. Bandpass filtered signal between 699
300 Hz and 5 kHz of the same signal in A, showing stable single unit activity in the pre-ictal 700
period, and characteristic “tonic” firing (asterisk), followed by bursting. C. First principal 701
component score versus time (i) of all detected waveforms in the multi-unit activity shown in B, 702
with three clearly separable clusters highlighted, along with the multi-unit cluster from 703
background distal cells (black). (ii) Equivalent first versus second principal component scores 704
from the pre-ictal period showing well-isolated clusters, and (iii), during the seizure, showing 705
loss of well-defined clusters in principal component space and inability to spike sort using 706
traditional methods. 707
708
Fig. 2 Template match spike sorting via convex hulls 709
A. Well-isolated neurons form distinct clusters in principal component space during interictal 710
time points (i), around which a convex hull can be fitted to define boundaries in 3D space within 711
which waveforms that match that unit should exist (ii). Despite a lack of defined clusters during 712
ictal activity in recruited cortex, this convex hull can be used to select waveforms that are likely 713
to correspond to the pre-ictal unit (iii; black), amongst distributed noise (grey). B(i) Waveforms 714
from the pre-ictal cluster shown in A(i). (ii) Waveforms matched using the convex hull shown in 715
A(iii) (black) from the large distribution of waveforms during a seizure (grey). C. Outliers in the 716

NEURONAL ACTIVITY IN HUMAN SEIZURES 33
33
chi-squared distribution for n degrees of freedom (red line) denote likely incorrect matches, and 717
were automatically removed to minimize false positives (see Methods). 718
719
Fig. 3 Waveform match probabilities 720
A(i). All waveforms from a traditionally spike sorted unit in a 10 minute pre-ictal epoch. The raw 721
probability distribution of each voltage at each time point for these waveforms is shown in (ii), 722
and the scaled waveform match confidence for ictal waveforms matching this unit are shown in 723
(iii), with the distribution of these probabilities inset. Waveform match confidences were 724
calculated with each time/voltage probability scaled to have a maximum value of 1, such that a 725
waveform going through the peak of each data point’s fitted Gaussian would have a match 726
probability of 1. B. Upper panel shows the probability distribution of all matched waveforms 727
(red), compared to the probability distribution for the original waveforms in the pre-ictal time 728
point (orange) for an example template-matched single unit. A bootstrap estimate of waveform 729
matches expected by chance by comparing against waveforms from other electrodes is shown in 730
blue. The lower panel shows the equivalent distributions across the full population. Mean ± SD is 731
shown above the distributions. 732
733
Fig. 4 Neuronal firing through ictal recruitment in an example focal seizure 734
A. Local field potential (LFP) from an example channel during seizure 1 in Patient 3, with the 735
calculated passage of ictal wavefront marked by red dashed line, with ± 2 seconds shaded red. B. 736
Raster plot of all units found using convex hull template matching in this seizure, ordered by 737
firing rate, and plotted relative to the moment of ictal recruitment at that channel. C. Weighted 738
(purple) and unadjusted (blue) instantaneous firing rate of the population of single units as 739
estimated by convolving a Gaussian kernel (200 ms SD) over the spike times. The firing rate 740

NEURONAL ACTIVITY IN HUMAN SEIZURES 34
34
shown in purple is probabilistic by scaling the Gaussian kernel’s amplitude by the likelihood of 741
each individual waveform originating from its assigned pre-ictal unit, as calculated by its 742
voltage-time probabilities (see Methods & Fig. 3). As such, the firing rate has not been biased by 743
excessive matching of dissimilar waveforms during the ictal activity. Note the intense, tonic 744
firing during the seizure invasion, and sustained, above baseline firing until seizure termination. 745
746
Fig. 5 Example waveform changes at ictal recruitment in template matched data 747
A. Waveforms from a convex hull-matched unit in Patient 5, seizure 2, showing reduction in 748
amplitude and increase in FWHM during the seizure (red shaded waveforms, fading from black 749
to red through the seizure; color maintained throughout figure). B. Waveform amplitude versus 750
FWHM in the unit in A, showing equivalent relationship to the high amplitude BF single unit in 751
Fig. 9D. C. Wideband LFP from this channel through time (broken x-axis), showing time of 752
earliest ictal activity (blue triangle) and moment of local ictal recruitment (purple triangle), with 753
(D) time-locked raster plots for original spike sorted unit (top) and convex hull matched data 754
(bottom), showing high similarity in non-ictal time points (peri-ictal firing rates: original = 2.63 755
spikes s-1; convex hull = 2.92 spikes s-1; note that the 25 seconds after recruitment is blanked in 756
the original spike sorting due to a lack of distinguishable clusters). E & F. Time-locked FWHM 757
and amplitude, respectively, showing temporal relationship of wave shape changes through the 758
seizure. Note the return to pre-ictal values after seizure termination, and the lack of changes 759
towards decreased FWHM or increased amplitude during the seizure despite the convex hull 760
being equally permissive of alterations in any direction. 761
762
763

NEURONAL ACTIVITY IN HUMAN SEIZURES 35
35
Fig. 6 Stereotypy of waveform changes within neurons across seizures 764
Example waveforms from a single unit in patient 5 showing stereotypy of response of 765
extracellularly recorded action potentials during ictal recruitment in 2 seizures separated by 22 766
hours (A and B respectively). All waveforms from the 6 seconds prior to ictal recruitment are 767
shown overlaid in (i), and plotted relative to time in (ii), scales maintained throughout. Saturation 768
of color fades from black at -6 seconds, to brightest at the moment of maximal firing rate of 769
MUA at that electrode. 770
771
Fig. 7 Population wave shape alterations in recruited cortex versus penumbral territories 772
A & B (i) Probability density plots of waveform FWHM (full-width at half maximum) for every 773
detected waveform in the pre-ictal (blue) and ictal time periods for all seizures in recruited cortex 774
(A; n = 136,421 pre-ictal waveforms vs. 128,845 ictal waveforms from 625 units across 6 775
seizures in 3 patients) and penumbral tissue (B; n = 133,424 pre-ictal waveforms vs. 36,900 ictal 776
waveforms from 405 units across 4 seizures in 3 patients). Note the shift in distribution in 777
recruited tissue, while changes in penumbral tissue were minimal, remaining in the same 778
footprint. An increase in firing rate in waveforms of brief FWHM from units that did not change 779
shape resulted in an increase in the values in the left-tail of the penumbral data, originating from 780
the edge-case and likely corresponding to fast-spiking interneuronal firing (see “Dual effects of 781
seizures on single unit waveforms” in Results). Cumulative probability densities show same 782
calculation on pre-ictal, original data (black), (ii) Paired mean FWHM for each unit in the pre-783
ictal (blue), ictal (red), and post-ictal (pink) epochs. Note return to pre-ictal ranges after seizure 784
termination. (iii) Waveform FWHM of the population through time (10 second window, sliding 785
every 100 ms). Brighter indicates more density, blue line shows the mean through time, purple 786
line shows the mean value in the pre-ictal period, red dashed line denotes “global” seizure onset. 787

NEURONAL ACTIVITY IN HUMAN SEIZURES 36
36
C & D. Same format as A & B, showing waveform amplitude in place of FWHM, for recruited 788
cortex and penumbra respectively. 789
790
Fig. 8 Simultaneous recruitment and penumbral recording 791
Two types of activity pattern recorded simultaneously in a patient with the UMA at the edge of 792
the clinically defined seizure spread (Patient 6). A. LFP from the closest macro-electrode to the 793
UMA, with time-locked MUA (blue) and first principal component score (purple) through time 794
from channels 88 and 21 in B & C respectively. Note the stability of waveform and principal 795
component score throughout the seizure in channel 88, with no evidence of tonic firing, while 796
there is a large wave shape change at the same time in channel 21, at the moment of tonic firing 797
(maroon bar, C). Paired orange bars in B and C denote burst firing at the end of the seizure in 798
both locations. These dual activity types both occurred immediately next to the LFP in A, and 799
thus these patterns cannot be differentiated at the macro LFP level. 800
801
Fig. 9 Ictal recruitment in the mesial temporal lobe recorded with BF electrodes 802
A. (i) Broadband LFP from the closest macro contact to the microwires in a BF electrode in the 803
mesial temporal lobe during a spontaneous seizure, and (ii) the bandpass filtered MUA from one 804
of the microwires in the temporal pole. “Global” seizure onset is denoted by the red dashed line, 805
with subsequent local recruitment to the seizure at the pink dashed line. B. Magnification of the 806
region denoted by the grey bar in A, showing seizure onset through passage of the ictal 807
wavefront in LFP and MUA (colors maintained) in the same microwire (i), and a microwire from 808
a nearby separate BF in the hippocampal body (ii). Note the pre-recruitment stability in the 809
waveform amplitude, which is immediately reduced upon ictal invasion, and the simultaneous 810
quiescence in the hippocampal body, followed by a similar, time-delayed amplitude change after 811

NEURONAL ACTIVITY IN HUMAN SEIZURES 37
37
recruitment. C. Mean ± SD of waveforms prior to ictal invasion (blue) and after recruitment 812
during the seizure (red), showing reduction in amplitude and increase in FWHM in A(ii). D. 813
Waveform amplitude versus FWHM for the defined unit, with color maintained from A, 814
transitioning from blue to red through seizure invasion. Note the bimodal clusters that 815
correspond to pre- and post-recruitment, and the similarity waveform changes to those seen in 816
Fig. 5B. 817
818
Fig. 10 Wave shape changes predict the oncoming ictal wavefront 819
A. Example spatial fits of the first sustained FWHM increase across the UMA (magenta-cyan, 820
raw data in blue) and the ictal wavefront as calculated by tonic firing (black-red-yellow, raw data 821
in orange). Note the correlation of the spatial fit across the 2D array between the two values, 822
with FWHM increases occurring moments before the tonic firing of recruitment. B. Time of first 823
sustained FWHM increase in each single unit across the population relative to the arrival of the 824
ictal wavefront (red dashed line) at that neuron’s recording channel (n = 330 units, 4 seizures, 2 825
patients; gray triangle and bar show mean ± SD of all units). C. Propagation speeds of FWHM 826
increases spreading across the UMA, calculated from the linear regression of delays vs. distance 827
from the first electrode to show significant waveform alterations for each patient. 828

NEURONAL ACTIVITY IN HUMAN SEIZURES 38
38
TABLES 829
PPatientt
DDemographicss PPathology IImplant location
SSeizuree type SSeizure onset
SSeizures analyzed # units
1 30 M N/A (multiple subpial transections performed)
Frontal (Left frontal convexity) FIA
Left supplementary motor area 1 79
2 39 M Non-specific Frontal (Left dorsolateral frontal lobe)
FIA Left frontal operculum 2 [61, 61]
3 25 F Mild CA1 neuronal loss; lateral temporal non-specific
Temporal (Left inferior temporal gyrus)
FIA Left basal/ anterior temporal 3 [111, 101, 91]
4 19 F Non-specific Temporal (Right posterior temporal)
FTBTC Right posterior lateral temporal
1 110
5 24 M Mesial temporal sclerosis; non-specific
Temporal (Left inferior temporal gyrus)
FIA
Left mesial temporal with spread to lateral temporal
2 [120, 133]
6 30 M Mild astrocytosis Temporal (Right mesial temporal gyrus)
FA Right subtemporal 1 240
Table 1. Demographics and data for patients implanted with UMAs 830
Individual patient demographics for grid/UMA implant cases, including the number of isolated 831
single units found for each seizure in each patient. FIA: focal with impaired awareness; FTBTC: 832
focal to bilateral tonic-clonic. 833
834
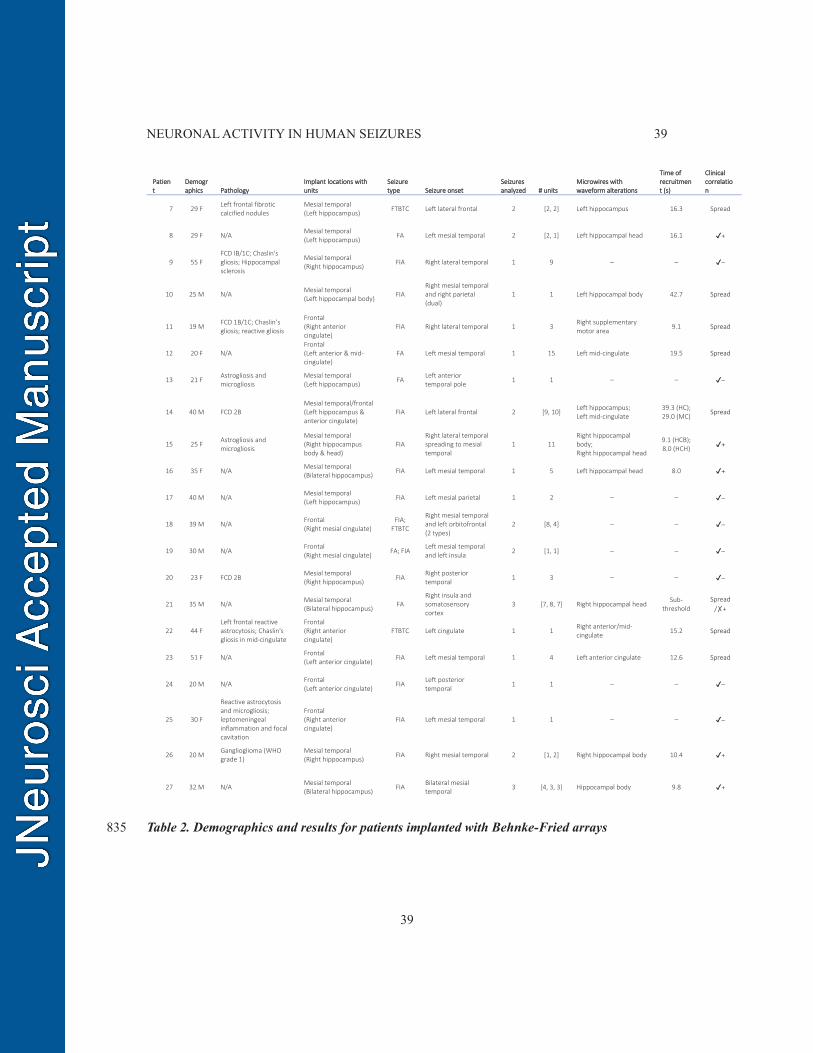
NEURONAL ACTIVITY IN HUMAN SEIZURES 39
39
PPatientt
DDemograaphics PPathology
IImplant locations with uunits
SSeizure ttype SSeizure onset
SSeizures aanalyzed ## units
MMicrowires with wwaveform alterations
TTime of rrecruitmentt (s)
CClinical ccorrelationn
7 29 F Left frontal fibrotic calcified nodules
Mesial temporal (Left hippocampus)
FTBTC Left lateral frontal 2 [2, 2] Left hippocampus 16.3 Spread
8 29 F N/A Mesial temporal (Left hippocampus)
FA Left mesial temporal 2 [2, 1] Left hippocampal head 16.1 ✔+
9 55 F FCD IB/1C; Chaslin's gliosis; Hippocampal sclerosis
Mesial temporal (Right hippocampus)
FIA Right lateral temporal 1 9 – – ✔–
10 25 M N/A Mesial temporal (Left hippocampal body)
FIA Right mesial temporal and right parietal (dual)
1 1 Left hippocampal body 42.7 Spread
11 19 M FCD 1B/1C; Chaslin’s gliosis; reactive gliosis
Frontal (Right anterior cingulate)
FIA Right lateral temporal 1 3 Right supplementary motor area
9.1 Spread
12 20 F N/A Frontal (Left anterior & mid-cingulate)
FA Left mesial temporal 1 15 Left mid-cingulate 19.5 Spread
13 21 F Astrogliosis and microgliosis
Mesial temporal (Left hippocampus)
FA Left anterior temporal pole
1 1 – – ✔–
14 40 M FCD 2B Mesial temporal/frontal (Left hippocampus & anterior cingulate)
FIA Left lateral frontal 2 [9, 10] Left hippocampus; Left mid-cingulate
39.3 (HC); 29.0 (MC)
Spread
15 25 F Astrogliosis and microgliosis
Mesial temporal (Right hippocampus body & head)
FIA Right lateral temporal spreading to mesial temporal
1 11 Right hippocampal body; Right hippocampal head
9.1 (HCB); 8.0 (HCH) ✔+
16 35 F N/A Mesial temporal (Bilateral hippocampus)
FIA Left mesial temporal 1 5 Left hippocampal head 8.0 ✔+
17 40 M N/A Mesial temporal (Left hippocampus)
FIA Left mesial parietal 1 2 – – ✔–
18 39 M N/A Frontal (Right mesial cingulate)
FIA; FTBTC
Right mesial temporal and left orbitofrontal (2 types)
2 [8, 4] – – ✔–
19 30 M N/A Frontal (Right mesial cingulate)
FA; FIA Left mesial temporal and left insula
2 [1, 1] – – ✔–
20 23 F FCD 2B Mesial temporal (Right hippocampus)
FIA Right posterior temporal
1 3 – – ✔–
21 35 M N/A Mesial temporal (Bilateral hippocampus)
FA Right insula and somatosensory cortex
3 [7, 8, 7] Right hippocampal head Sub-
threshold Spread
/✗+
22 44 F Left frontal reactive astrocytosis; Chaslin's gliosis in mid-cingulate
Frontal (Right anterior cingulate)
FTBTC Left cingulate 1 1 Right anterior/mid-cingulate
15.2 Spread
23 51 F N/A Frontal (Left anterior cingulate)
FIA Left mesial temporal 1 4 Left anterior cingulate 12.6 Spread
24 20 M N/A Frontal (Left anterior cingulate)
FIA Left posterior temporal
1 1 – – ✔–
25 30 F
Reactive astrocytosis and microgliosis; leptomeningeal inflammation and focal cavitation
Frontal (Right anterior cingulate)
FIA Left mesial temporal 1 1 – – ✔–
26 20 M Ganglioglioma (WHO grade 1)
Mesial temporal (Right hippocampus)
FIA Right mesial temporal 2 [1, 2] Right hippocampal body 10.4 ✔+
27 32 M N/A Mesial temporal (Bilateral hippocampus)
FIA Bilateral mesial temporal
3 [4, 3, 3] Hippocampal body 9.8 ✔+
Table 2. Demographics and results for patients implanted with Behnke-Fried arrays 835

NEURONAL ACTIVITY IN HUMAN SEIZURES 40
40
Individual patient demographics for stereo-EEG/Behnke-Fried array cases, including the number 836
of isolated single units found for each seizure in each patient, implant locations that showed 837
significant wave shape alterations, the delay until waveforms surpassed > 1 SD beyond the pre-838
ictal mean, and whether clinical observations matched these findings. FTBTC: focal to bilateral 839
tonic-clonic; FA: focal aware; FIA: focal with impaired awareness; HC: hippocampus; MC: mid-840
cingulate; “Spread”: matches clinical observations of seizure spread; ✔+: true positive match for 841
clinical observations; ✔–: true negative match for clinical observations; ✗+: false positive match 842
for clinical observations; FCD=focal cortical dysplasia; pathology N/A in some cases that were 843
not resected, or that were treated with laser ablation or an implanted device. 844
845

NEURONAL ACTIVITY IN HUMAN SEIZURES 41
41
PPatient SSeizure # RRecruited?
UUnits ffrom convex hhull [n]
Units showing FR increase
in ictal wavefront [n ((%)]
Units showing significant
FWHM increase [n (%)]
Units showing significant
amplitude decrease [n ((%)]
1 1 ✗ 52 N/A 2 (4%) 3 (6%)
2 1 ✗ 55 N/A 9 (16%) 8 (15%)
2 ✗ 49 N/A 3 (6%) 2 (4%)
3 1 ✔ 80 77 (96%) 63 (79%) 20 (25%)
2 ✔ 80 70 (88%) 68 (85%) 38 (48%)
3 ✔ 79 67 (85%) 66 (84%) 40 (51%)
4 1 ✔ 101 77 (76%) 93 (92%) 45 (45%)
5 1 ✔ 117 82 (70%) 114 (97%) 103 (88%)
2 ✔ 104 73 (70%) 85 (82%) 63 (61%)
6 1 ✗ 221 N/A 105 (48%) 86 (39%)
Table 3. Single unit data from UMA population analyses 846
Total number of units found in each patient and seizure for population analyses in UMA cases 847
via the convex hull template-matching method, along with the number of units showing 848
significant increases in firing rate, waveform full-width-at-half-maximum (FWHM), and 849
decreases in amplitude during the seizure. 850
851

NEURONAL ACTIVITY IN HUMAN SEIZURES 42
42
MOVIE LEGENDS 852
Movie 1. Location specific waveform changes during a spontaneous human seizure 853
Local field potential (top) and amplitudes for three units in three different locations (middle; red, 854
blue and purple), with associated waveforms shown to the right. Shading shows the mean ± 2 SD 855
for these units’ pre-ictal waveform amplitudes. The locations of the BF microwires that recorded 856
these units are shown below, with colors maintained. Note the three activity patterns: cessation 857
of firing at seizure onset in the anterior temporal lobe (blue), stability followed by loss of 858
waveform amplitude in the anterior cingulate (red), and stability throughout in the mid-cingulate 859
(purple). 860
Movie 2. Single unit waveform alterations in an ictal Behnke-Fried recording 861
Single units undergo wave shape changes upon recruitment to the seizure, shown in real-time. 862
Upper trace: MUA bandpassed signal (300 Hz to 5 kHz; white), with current time shown in red, 863
earliest electrographic ictal activity in the patient occurs at dashed magenta line, with local 864
recruitment occurring at blue dashed line. Lower panels: shaded regions show mean ± 2 SD for 865
pre-ictal single units in red and blue, and lower amplitude multiunit activity in yellow (left). 866
Waveforms are displayed in real-time, with colors matching their assigned unit, and color 867
saturation showing the probability of a true match to that unit. The first two principal component 868
scores for these waveforms are shown on the right, with colors maintained. Note the stability of 869
waveforms prior to local recruitment, including after seizure onset, followed by marked loss of 870
amplitude at the moment of recruitment with associated tonic firing. These data show another 871
example of quiescence in one neuron, as the blue unit stops firing after seizure onset, which 872
cannot be attributed to dropping below threshold as the background multi-unit activity (yellow) 873
continues. 874