Neuron, Vol. 36, 855–868, December 5, 2002, Copyright … · Adenosine: A Neuron-Glial...
14
Neuron, Vol. 36, 855–868, December 5, 2002, Copyright 2002 by Cell Press Adenosine: A Neuron-Glial Transmitter Promoting Myelination in the CNS in Response to Action Potentials ing cell adhesion molecules, extracellular potassium, and the release of a soluble axonal signal (Demerens et al., 1996; Zalc and Fields, 2000), but the axonal signals inducing myelination during development are unknown. Indeed, few differentiation factors for OPCs have been Beth Stevens, Stefania Porta, Laurel L. Haak, Vittorio Gallo, 2 and R. Douglas Fields 1 Laboratory of Cellular and Synaptic Neurophysiology National Institutes of Health, NICHD Bethesda, Maryland 20892 described. Thyroid hormone (Barres et al., 1994; Toku- moto et al., 1999; Calza et al., 2002; Baas et al., 2002), neuregulins (Park et al., 2001a; Canoll et al., 1996, 1999; Calaora et al., 2001), growth factors (Park et al., 2001b), Summary and Notch signaling (Wang et al. 1998) are important for controlling OPC differentiation, but they have not been Neuronal activity influences myelination of the brain, shown to regulate OPC development in an activity- but the molecular mechanisms involved are largely dependent manner. unknown. Here, we report that oligodendrocyte pro- The opposite effect of neural impulse activity on my- genitor cells (OPCs) express functional adenosine re- elination has been reported in the PNS, and two molecu- ceptors, which are activated in response to action lar mechanisms have been identified. Neural impulse potential firing. Adenosine acts as a potent neuron- activity can inhibit PNS myelination by changing mem- glial transmitter to inhibit OPC proliferation, stimulate brane properties of developing axons (Stevens et al., differentiation, and promote the formation of myelin. 1998) and via release of a soluble signaling molecule This neuron-glial signal provides a molecular mecha- (Stevens and Fields, 2000). Myelination of dorsal root nism for promoting oligodendrocyte development and ganglion (DRG) axons by Schwann cells is inhibited fol- myelination in response to impulse activity and may lowing electrical stimulation of axons at a low frequency help resolve controversy on the opposite effects of (0.1 Hz) via downregulating mRNA and protein levels of impulse activity on myelination in the central and pe- the cell adhesion molecule L1 on axons (Itoh et al.,1995; ripheral nervous systems. Stevens et al., 1998). Homophilic interactions between L1 on axons and Schwann cells is essential for the initia- Introduction tion of myelination (Seilheimer et al., 1989; Wood et al., 1990). Action potential activity can also influence myelina- Rapid impulse conduction in the nervous system is de- tion by Schwann cells directly through the release of pendent upon electrical insulation from layers of myelin activity-dependent signals from premyelinated axons. membrane synthesized and wrapped around large di- Recent experiments showed that ATP is released by ameter axons by glial cells. Myelin formation by oligo- electrically active DRG axons in vitro, and it acts as dendrocytes in the CNS and Schwann cells in the PNS an activity-dependent axon-glial transmitter to inhibit involves a highly regulated sequence of molecular inter- Schwann cell proliferation, differentiation, and myelina- actions with axons. The signals inducing myelination tion through activation of P2Y receptors on Schwann during development are largely unknown, but there are cells (Stevens and Fields, 2000). This inhibitory mecha- several lines of evidence from the central and peripheral nism may help coordinate Schwann cell development nervous systems that the onset of neural impulse activity with the onset of functional activity in the nervous sys- can affect initiation of myelination. tem and prevent premature Schwann cell differentiation Experiments on CNS neurons have shown that electri- (Stevens and Fields, 2000). The functional effects of cal activity can promote myelination via an unknown ATP on myelinating glia of the CNS are unknown. How- mechanism. Blockade of sodium-dependent action po- ever, both mechanisms (release of ATP and reduction tentials with tetrodotoxin (TTX) significantly inhibited of L1 expression) inhibit myelination in the PNS, sug- myelination in vitro and in developing optic nerve in vivo, gesting that different signaling molecules and receptors whereas increasing neuronal firing with -scorpion toxin may underlie the positive effects of impulse activity in enhanced myelination (Demerens et al., 1996). These the CNS. results are consistent with earlier studies in the optic It is not known if OPCs can respond directly to action nerve in which mice reared in the dark developed fewer potentials in premyelinating axons, or whether ATP or myelinated axons compared with control mice (Gyllen- other activity-dependent signaling molecules regulate sten and Malmfors, 1963). Hypomyelination is also ob- OPC development and myelination in the CNS. Calcium served in optic nerve of the naturally blind cape-mole transients have been reported in optic nerve glia in re- rat (Omlin, 1997), whereas myelination is accelerated by sponse to action potentials, but whether these re- premature eye opening in rabbit optic nerves (Tauber et sponses derive from astrocytes or oligodendrocytes is al., 1980). The molecular mechanisms underlying these unclear, and the activity-dependent signal has not been activity-dependent effects on myelination are not identified (Kriegler and Chiu, 1993). There are a large known. A number of molecules were proposed, includ- number of potential signaling molecules, considering that oligodendroglial lineage cells in vitro and in situ 1 Correspondence: [email protected] can respond to a wide range of neuroligands linked to 2 Present address: Center for Neuroscience Research, Children’s calcium mobilization including glutamate, norepineph- Research Institute, Children’s National Medical Center, Washington, DC 20010. rine, histamine, carbachol, GABA, serototonin, angio-
Transcript of Neuron, Vol. 36, 855–868, December 5, 2002, Copyright … · Adenosine: A Neuron-Glial...

Neuron, Vol. 36, 855–868, December 5, 2002, Copyright 2002 by Cell Press
Adenosine: A Neuron-Glial TransmitterPromoting Myelination in the CNSin Response to Action Potentials
ing cell adhesion molecules, extracellular potassium,and the release of a soluble axonal signal (Demerens etal., 1996; Zalc and Fields, 2000), but the axonal signalsinducing myelination during development are unknown.Indeed, few differentiation factors for OPCs have been
Beth Stevens, Stefania Porta, Laurel L. Haak,Vittorio Gallo,2 and R. Douglas Fields1
Laboratory of Cellular and SynapticNeurophysiology
National Institutes of Health, NICHDBethesda, Maryland 20892 described. Thyroid hormone (Barres et al., 1994; Toku-
moto et al., 1999; Calza et al., 2002; Baas et al., 2002),neuregulins (Park et al., 2001a; Canoll et al., 1996, 1999;Calaora et al., 2001), growth factors (Park et al., 2001b),Summaryand Notch signaling (Wang et al. 1998) are important forcontrolling OPC differentiation, but they have not beenNeuronal activity influences myelination of the brain,shown to regulate OPC development in an activity-but the molecular mechanisms involved are largelydependent manner.unknown. Here, we report that oligodendrocyte pro-
The opposite effect of neural impulse activity on my-genitor cells (OPCs) express functional adenosine re-elination has been reported in the PNS, and two molecu-ceptors, which are activated in response to actionlar mechanisms have been identified. Neural impulsepotential firing. Adenosine acts as a potent neuron-activity can inhibit PNS myelination by changing mem-glial transmitter to inhibit OPC proliferation, stimulatebrane properties of developing axons (Stevens et al.,differentiation, and promote the formation of myelin.1998) and via release of a soluble signaling moleculeThis neuron-glial signal provides a molecular mecha-(Stevens and Fields, 2000). Myelination of dorsal rootnism for promoting oligodendrocyte development andganglion (DRG) axons by Schwann cells is inhibited fol-myelination in response to impulse activity and maylowing electrical stimulation of axons at a low frequencyhelp resolve controversy on the opposite effects of(0.1 Hz) via downregulating mRNA and protein levels ofimpulse activity on myelination in the central and pe-the cell adhesion molecule L1 on axons (Itoh et al.,1995;ripheral nervous systems.Stevens et al., 1998). Homophilic interactions betweenL1 on axons and Schwann cells is essential for the initia-Introductiontion of myelination (Seilheimer et al., 1989; Wood et al.,1990). Action potential activity can also influence myelina-Rapid impulse conduction in the nervous system is de-tion by Schwann cells directly through the release ofpendent upon electrical insulation from layers of myelinactivity-dependent signals from premyelinated axons.membrane synthesized and wrapped around large di-Recent experiments showed that ATP is released byameter axons by glial cells. Myelin formation by oligo-electrically active DRG axons in vitro, and it acts asdendrocytes in the CNS and Schwann cells in the PNSan activity-dependent axon-glial transmitter to inhibitinvolves a highly regulated sequence of molecular inter-Schwann cell proliferation, differentiation, and myelina-actions with axons. The signals inducing myelinationtion through activation of P2Y receptors on Schwannduring development are largely unknown, but there arecells (Stevens and Fields, 2000). This inhibitory mecha-several lines of evidence from the central and peripheralnism may help coordinate Schwann cell developmentnervous systems that the onset of neural impulse activitywith the onset of functional activity in the nervous sys-can affect initiation of myelination.tem and prevent premature Schwann cell differentiationExperiments on CNS neurons have shown that electri-(Stevens and Fields, 2000). The functional effects ofcal activity can promote myelination via an unknownATP on myelinating glia of the CNS are unknown. How-mechanism. Blockade of sodium-dependent action po-ever, both mechanisms (release of ATP and reductiontentials with tetrodotoxin (TTX) significantly inhibitedof L1 expression) inhibit myelination in the PNS, sug-myelination in vitro and in developing optic nerve in vivo,gesting that different signaling molecules and receptorswhereas increasing neuronal firing with �-scorpion toxinmay underlie the positive effects of impulse activity inenhanced myelination (Demerens et al., 1996). Thesethe CNS.results are consistent with earlier studies in the optic
It is not known if OPCs can respond directly to actionnerve in which mice reared in the dark developed fewerpotentials in premyelinating axons, or whether ATP ormyelinated axons compared with control mice (Gyllen-other activity-dependent signaling molecules regulatesten and Malmfors, 1963). Hypomyelination is also ob-OPC development and myelination in the CNS. Calciumserved in optic nerve of the naturally blind cape-moletransients have been reported in optic nerve glia in re-rat (Omlin, 1997), whereas myelination is accelerated bysponse to action potentials, but whether these re-premature eye opening in rabbit optic nerves (Tauber etsponses derive from astrocytes or oligodendrocytes isal., 1980). The molecular mechanisms underlying theseunclear, and the activity-dependent signal has not beenactivity-dependent effects on myelination are notidentified (Kriegler and Chiu, 1993). There are a largeknown. A number of molecules were proposed, includ-number of potential signaling molecules, consideringthat oligodendroglial lineage cells in vitro and in situ1Correspondence: [email protected] respond to a wide range of neuroligands linked to2Present address: Center for Neuroscience Research, Children’scalcium mobilization including glutamate, norepineph-Research Institute, Children’s National Medical Center, Washington,
DC 20010. rine, histamine, carbachol, GABA, serototonin, angio-

Neuron856
Figure 1. A Diverse Range of Purinergic Re-ceptors Was Detected in OPCs
(A) mRNAs for all major classes of adenosinereceptors were detected by RT-PCR in ratOPCs after 2 days in culture (a) and in mouseOPCs freshly isolated by fluorescence acti-vated cell sorting (b). Species-specific prim-ers yielded different size products as well asdouble bands for rat A2b due to alternatesplicing (Kreisberg et al., 1997).(B) Functional purinergic receptors linked toCa2� signaling were detected by intracellularCa2� imaging in response to ATP receptoragonists (�S-ATP and 2MeS-ATP, 100�M)and adenosine receptor agonists (NECA, 100�M and adenosine [data not shown]) in indi-vidual rat OPCs in culture (a) and OPCsfreshly isolated from mice expressing theCNP-GFP transgene (b). Indo-1 was used tomeasure Ca2� responses in acutely isolatedcells to avoid fluorescence from GFP. Note:Indo-1 is less sensitive than fluo-3. Scale �
10 �F/F/2 min.(C) Oligodendroglial cells at both the imma-ture NG2� stage and more differentiatedO4� stage showed intracellular calcium re-sponses to ATP and adenosine receptor ago-nists, and often responses to both receptoragonists were seen in the same cell. Cellswere filled with fluo-3, a calcium-sensitive flu-orescent dye (a), and responses to a specificadenosine receptor agonist (b and c) and anATP receptor agonist (d and e) were recordedin the same cells using time-lapse confocalmicroscopy. (Higher concentrations of intra-cellular calcium are indicated in warmer col-ors.) At the completion of the calcium-imag-ing experiment, the identical cells were doublestained with antibodies against NG2 (green)and O4 (red), and examined by confocal
microscopy (f). All the cells in this field were either NG2 and/or O4� oligodendroglial cells. Of the 17 cells in this microscope field, 11 respondedto the adenosine receptor agonist NECA (100 �M), 13/17 responded to the ATP receptor agonist 2MeS-ATP (100 �M), 11/17 cells respondedto both agonists, and 4/17 cells showed no measurable response to either agonist.
tensin II, bradykinin, substance P, and ATP (e.g., Kas- that extracellular ATP can induce Ca2� responses inoligodendroglial cells in vitro and in situ (He and McCar-tritsis and McCarthy, 1993; Bernstein et al., 1996).
It is not known whether ATP receptor activation can thy, 1994; Kirischuk et al., 1995; Takeda et al., 1995;Bernstein et al., 1996). Using Ca2� imaging, RT-PCR,regulate OPC development. Many types of purinergic
receptors activated by ATP or its reaction products have and purinergic receptor agonists, our studies revealedthe presence of several subtypes of ATP and adenosinebeen described in other cells (Burnstock, 1997), but the
expression of specific purinergic receptor subtypes on receptors on OPCs in culture and in OPCs acutely disso-ciated from mouse brain. Messenger RNA for all fourOPCs has not been adequately explored (for review see
Fields and Stevens, 2000). These questions were studied subtypes of adenosine receptors (A1, A2a, A2b, A3) wasdetected by RT-PCR in cultures of OPCs (Figure 1Aa).in OPCs cocultured with dorsal root ganglion (DRG) neu-
rons. DRG neurons have been shown to release ATP in Functional purinergic receptors were shown in individ-ual OPCs by recording Ca2� responses using confocalan activity-dependent manner, and in vivo these neu-
rons have bipolar axons that are myelinated by oligoden- imaging to measure intracellular Ca2� transients inducedby purinergic receptor agonists (Figure 1Ba). Robustdrocytes in the spinal cord and by Schwann cells in the
peripheral nerve. Our results show that ATP does not responses to ATP and adenosine receptor agonists wereobserved, often in the same cell (Figure 1Ba). Doublehave the same effects on oligodendrocytes and
Schwann cells and that a different signaling molecule, immunostaining with antibodies specific for the oligo-dendrocyte lineage cells following calcium imagingadenosine, promoted differentiation and myelination in
the CNS. demonstrated that the same cells that responded to thegeneral adenosine agonist NECA (Figure 1Cc) or the
Results ATP receptor agonist 2MeS-ATP (Figure 1Ce) were ei-ther NG2� OPCs or O4� immature oligodendrocytes(Figure 1Cf).OPCs Express Multiple Types of Functional
Purinergic Receptors To determine whether expression of these receptorshad been induced artificially by cell culture conditions,Purinergic receptors in OPCs are largely unexplored
(Fields and Stevens, 2000), although there is evidence OPCs were freshly isolated by fluorescence-activated

Action Potential Regulation of CNS Myelination857
Figure 2. Communication between DRG Ax-ons and OPCs Is Revealed by Time-LapseConfocal Ca2� Imaging (Higher Levels of Ca2�
Are Displayed in Warmer Colors)
(A) Prior to action potential firing, Ca2� levelswere low in DRG neurons (white arrow) andOPCs (yellow arrow) in coculture (a). Scalebar � 50 �m. Action potentials were inducedin DRG axons by electrical stimulation (10 Hz),causing an instantaneous rise in cytoplasmicCa2� in the cell body and axons of DRG neu-rons (b). This was followed by responses inmany OPCs (yellow arrows) after several sec-onds (c). The fluorescence intensity of indi-vidual DRG neurons and OPCs in (A) is plottedin (B). 10 Hz electrical stimulation (red bar),cytoplasmic Ca2� in DRG neurons (blacktrace), Ca2� response in OPCs (color traces).No responses to electrical stimulation wereseen in OPCs in cultures made without neu-rons. (C) Incubation with a combination ofantagonists of ATP (30 �M suramin) andadenosine receptors (30 �M MRS-1191 and200 �M DPCPX) inhibited action-potential in-duced Ca2� responses in OPCs. A poststimu-lus time histogram, summarizing the propor-tion of OPCs responding to action potentialfiring in the presence (light blue) and absence(dark blue) of these purinergic receptor inhibi-tors, indicates a significant reduction in shortlatency (�0.5 min; p � 0.001, �2, n � 455) andlong-latency OPC responses (0.5–5 min; p �
0.02, �2, n � 455) when purinergic receptorswere blocked.
cell sorting from forebrain of transgenic mice selectively cells responded to action potentials in DRG axons (Fig-ure 3).expressing the green fluorescent protein (EGFP) in cells
of the oligodendroglial lineage (Yuan et al., 2002; Bela- Action potential firing has been shown to release sev-eral substances nonsynaptically from axons, includingchew et al., 2001). RT-PCR (Figure 1Ab) and Ca2� im-
aging (Figure 1Bb) showed similar purinergic receptor ATP (Stevens and Fields, 2000) and adenosine (Maire etal., 1984; Kuperman et al., 1964), which could potentiallyexpression in acutely isolated OPCs and cultured OPCs.
The ratio of cells responding to adenosine receptor ver- mediate neuron-glial communication. Electrical stimula-tion of axons in the presence of 30 �M suramin, 10 �Msus ATP receptor agonists was not significantly different
in acutely isolated and cultured OPCs (47.5% versus MRS-1191, and 200 �M DPCPX, which in combinationblock metabotropic ATP receptors and all major classes35.7%; p 0.5, �2; n � 125 cells). It is likely that adeno-
sine receptor expression is higher than revealed with of adenosine receptors, significantly inhibited OPC re-sponses to action potentials (Figure 2C). These antago-calcium imaging because the A2a and A2b subtypes act
through cAMP rather than calcium. nists did not affect the number of DRG neurons re-sponding to electrical stimulation, but reduced thenumber of OPCs responding from 36% in controls toOPCs Detect Action Potentials in Axons
Time-lapse confocal Ca2� imaging was used to deter- 6% in the presence of the purinergic receptor inhibitorswithin the first 30 s of axonal stimulation (p � 0.001,mine whether OPCs could detect action potentials in
premyelinated axons (see supplemental movie online at n � 455 cells). Responses within 0.5–5 min of axonalstimulation were reduced from 18% in controls to 9%www.neuron.org/cgi/content/full/36/5/855/DC1). Co-
cultures of DRG neurons and OPCs were prepared in in the presence of the inhibitors (p � 0.009, �2, n �455). This indicates that purinergic receptors mediatecell culture chambers equipped with electrodes for stim-
ulating axons. DRG neurons are not spontaneously ac- a substantial portion of activity-dependent axon-OPCcommunication.tive in culture (Fields et al., 1992), and only those DRG
neurons that extend axons under the high-resistant bar-riers into the central compartment are electrically stimu- Adenosine, but Not ATP, Inhibits OPC Proliferation
OPCs stop proliferating as they differentiate (Gao etlated (Li et al., 1996). Within seconds of evoking actionpotentials in neurons, large increases in intracellular al., 1998), and activity-dependent release of ATP might
coordinate OPC proliferation with functional activity inCa2� were recorded in OPCs (Figures 2A and 2B). Immu-nostaining for the O4 antigen in cells loaded with fluo-3 developing axons as shown for Schwann cells (Stevens
and Fields, 2000). Tritiated thymidine and 5-bromo-2-demonstrated that both bipolar O4� and multipolar O4�

Neuron858
Figure 4. Adenosine Receptor Activation Selectively Inhibits OPCProliferation
(A) Treatment of OPCs with PDGF�ATP (1–300 �M) for 24 hr resultedin a weak, concentration-dependent inhibition of OPC proliferation(triangles) (p � 0.0001, ANOVA, n � 15 cultures); however, the nonhy-drolyzable P2 agonist 2MeS-ATP had no effect (circles).(B) Adenosine (circles), which can be generated by the breakdownof extracellular ATP, strongly inhibited OPC proliferation in a con-centration-dependent manner (p � 0.001; ANOVA; n � 68 cultures).This inhibition was mimicked by the adenosine receptor agonistNECA (triangles) (p � 0.0001; ANOVA; n � 23 cultures).(C) Electrical stimulation of DRG axons (10 Hz for 24 hr) inhibitedthe proliferation rate of cocultured OPCs as determined by BrdUincorporation assay (p � 0.005, n � 18 cultures). The activity-depen-
Figure 3. OPCs at O4� and O4� Stages Respond to Action Poten- dent inhibition of OPC proliferation occurred in the presence of thetials in DRG Axons non-NMDA glutamate receptor antagonist CNQX (20 �M), but it was
blocked when all major adenosine receptor subtypes were inhibitedImmunocytochemical staining for the O4 antigen (A) was used afterconfocal calcium imaging (B–D) to determine the developmental with a combination of adenosine receptor antagonists DPCPX (200
�M) and MRS-1191 (10 �M) (*p � 0.006, ANOVA; n � 27 cultures).stage at which OPCs responded to action potentials in DRG axons.Three OPCs in this microscope field (a, b, and c) responded toaction potentials induced in DRG axons by electrical stimulation.
able ATP analog 2MeS-ATP failed to affect OPC prolifer-Examination of the same field after O4 staining (A) indicated thatOPCs at both the bipolar/O4� stage (cell b and also shown in (D) ation over a wide range of concentrations (Figure 4A).inset) and O4� stage (cells a and c in [A] and [C]) responded to These findings were replicated with a BrdU/Hoechstaxonal firing with large increases in intracellular calcium. Changes assay, an independent method of assessing prolifera-in intracellular calcium in cell b are plotted with respect to the time tion rate and total cell number, following treatment withof axonal stimulation in (E). The inset in (D) is an enlargement of cell
two different ATP receptor agonists (2MeS-ATP and �S-b filled with the calcium sensitive dye fluo-3, which shows the bipolarATP). Taken together, these results suggest that thecellular morphology more clearly than in the pseudocolor image.inhibition of OPC proliferation might not be mediated byATP itself since extracellular ATP is rapidly hydrolyzed toadenosine by ectoenzymes (Zimmermann et al., 1998).deoxy-uridine (BrdU) incorporation assays were used to
determine whether activating purinergic receptors could Consistent with this hypothesis, treatment with adeno-sine (1–300 �M) and the general adenosine receptoraffect OPC proliferation in the presence of the mitogen
platelet-derived growth factor (PDGF). Treatment of agonist NECA (1–300 �M) caused a substantial, concen-tration-dependent decrease in OPC proliferation afterOPCs in monoculture with ATP for 24 hr produced a
relatively weak, concentration-dependent decrease in 24 hr treatment (Figure 4B). TUNEL assay showed noeffect of ATP, 2MeS-ATP, or adenosine on apoptosis.proliferation (Figure 4A). However, in contrast to studies
on Schwann cells (p � 0.002, n � 10), the nonhydrolyz- We next determined whether action potential activity

Action Potential Regulation of CNS Myelination859
could inhibit OPC proliferation, and if so, whether this ure 6A). Chronic treatment (48 hr) of cerebellar sliceswith adenosine (100 �M) significantly decreased the per-involved activation of adenosine receptors. Stimulation
of DRG axons at 10 Hz for 24 hr significantly reduced centage of LB1� or NG2� OPCs that incorporated BrdUas compared with untreated slices (53.1% � 7.47% ver-the proliferation rate of cocultured OPCs despite the
known mitogenic activity of axons (Figure 4C). The inhib- sus 80.5% � 6.46%; p � 0.02, n � 11 slices). Consistentwith results in cell culture, adenosine also promoteditory effect of action potentials on OPC proliferation was
blocked when stimulation was performed in the pres- OPC differentiation in cerebellar slice preparations (Fig-ure 6B). The percentage of O4� OPCs was increasedence of adenosine receptor antagonists inhibiting all
major subtypes of adenosine receptors (5 �M MRS 1191 by 160% in slices treated for 48 hr with adenosine (100�M), as compared with untreated controls (p � 0.028,and 200 �M DPCPX). These antagonists do not inhibit
ATP receptors and these effects were not blocked by n � 15 slices).CNQX (20 �M), a non-NMDA glutamate receptor antago-nist. This points to a critical role for adenosine receptor Adenosine Receptor Activation Selectively Altersactivation in the activity-dependent inhibition of OPC OPC Morphologyproliferation. These results show that action potential Oligodendroglial cells progress through a series of de-firing increases the concentration of extracellular adeno- velopmental stages characterized by dramatic changessine sufficiently to activate adenosine receptors on in cell morphology (Baumann and Pham-Dinh, 2001). WeOPCs and to inhibit cell cycle progression. observed that OPCs treated with adenosine appeared
more mature and highly developed with respect to con-trols. In order to quantify whether purinergic signalingAdenosine Promotes OPC Differentiation
and Lineage Progression molecules induce morphological changes in OPCs, weperformed a morphometric analysis on OPCs treatedBoth intrinsic and environmental signals have been im-
plicated in controlling OPC cell cycle exit and lineage for 48 hr with either adenosine or 2MeS-ATP and immu-nostained for the surface antigen O4. A quantitative mor-progression, but the axonal signals involved in promot-
ing differentiation into mature oligodendrocytes have phometric analysis showed statistically significant in-creases in cell surface area (p � 0.0001), perimeterremained elusive (Barres and Raff, 1999; Rogister et al.,
1999). We next addressed whether inhibition of OPC cell length (p � 0.0001), outer cell radius (p � 0.0001), andbranching (area of holes within cell boundaries) (p �cycle progression by adenosine receptor activation was
followed by arrest or promotion of OPC differentiation. 0.0001) in cells treated with adenosine for 48 hr (ANOVA,n � 517 cells). With the exception of cell perimeter,A sharp increase in the number and relative proportion
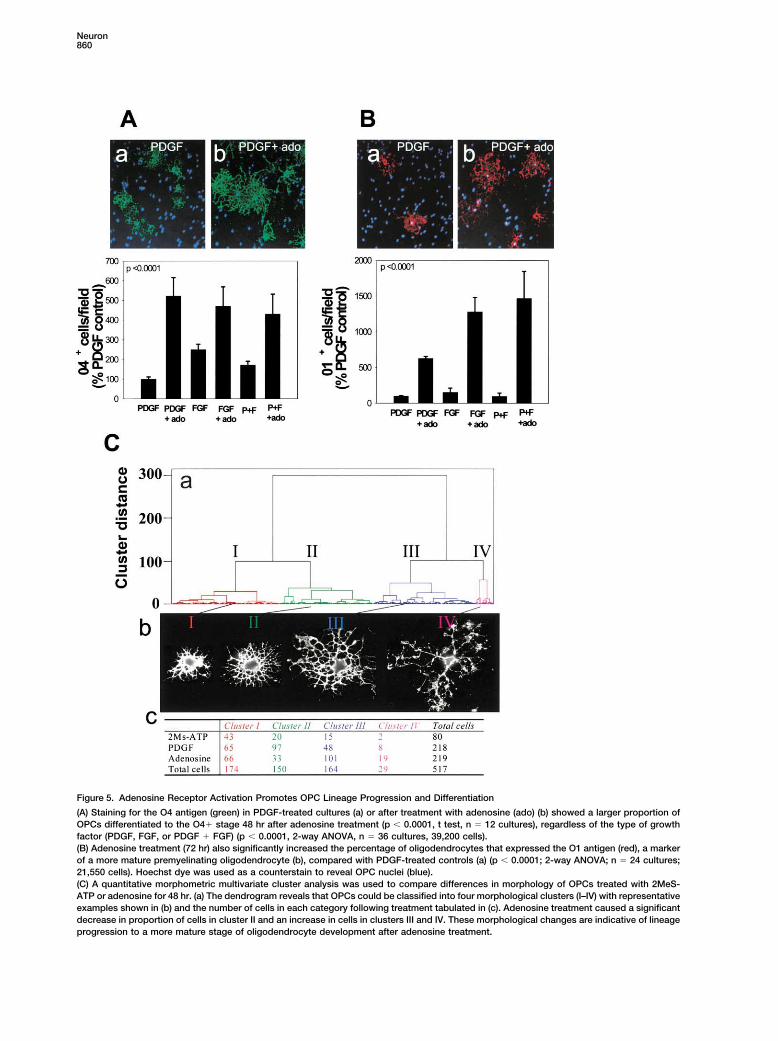
of OPCs expressing the O4 antigen, a marker of transi- which was slightly increased (p � 0.05), these morpho-logical features were not affected significantly by 2MeS-tion from progenitor to a later stage of oligodendroglial
development, was seen in cultures treated for 48 hr with ATP treatment. A cluster analysis using a multivariatestatistical comparison of five morphometric parametersadenosine (100 �M) as compared with growth factors
alone (Figure 5A). This increase in OPC differentiation showed that the cells could be grouped into four majormorphological classes (Figure 5C). The frequency distri-was mimicked by the adenosine receptor agonist NECA
(300 �M) (280% increase; p � 0.001, t test, n � 6). In bution of cells in these classes differed significantly aftertreatment (p � 0.0001, �2, n � 517) (Figure 5Cc). Aftercontrast, treatment with the ATP analog (100 �M) 2MeS-
ATP had no effect, but the effect of adenosine in promot- adenosine treatment, there was a significant decreasein proportion of cells in cluster II and an increase ining OPC differentiation was seen in the presence of
PDGF and/or bFGF (Figure 5A). Moreover, the number proportion of cells in clusters III and IV (p � 0.0001, �2,n � 306) relative to controls, but not after treatment withof cells expressing the galactocerebroside O1 antigen,
an indicator of a subsequent stage of maturation into 2MeS-ATP (p 0.5, �2, n � 190). Cells in clusters IIIand IV are characterized by numerous, large cellulara premyelinating oligodendrocyte, was increased after
further incubation with adenosine for a total of 72 hr processes indicative of maturing oligodendrocytes (Fig-ure 5Cb). These pronounced changes in cell morphology(Figure 5B).
It is important to note that the inhibitory effect of following adenosine treatment were indicative of moremature stages of oligodendrocyte development andadenosine on OPC proliferation is not a secondary con-
sequence of promoting differentiation to a postmitotic were consistent with our findings that adenosine pro-moted OPC lineage progression to the O4� and O1�stage. The majority of OPCs in the proliferation assays
were in the bipolar, NG2� stage of the oligodendrocyte stages.lineage (90% of the cells), and the assays were per-formed before the cells could have differentiated sub- Adenosine Promotes OPC-Axon Interactionsstantially. Double staining for BrdU and oligodendrocyte and Myelinationlineage markers confirmed that adenosine significantly Our results suggest that electrical activity might pro-inhibited the proliferation rate of OPCs while in the O4�, mote CNS myelination by activating adenosine recep-bipolar stage (7.8% versus 15.7% proliferation rates in tors on OPCs. Our analysis focused on the early phasesadenosine versus PDGF; p � 0.04, n � 4). of myelination since previous work had shown that
�-scorpion toxin increased myelination of CNS axonsonly when used to stimulate action potentials during thisEffects of Adenosine on OPC Proliferation
and Differentiation in Cerebellar Slice narrow developmental period (Demerens et al., 1996).DRG/OPC cocultures were treated with 500 �M adeno-The inhibitory effect of adenosine on OPC proliferation
was confirmed in an intact slice culture preparation (Fig- sine for 14 days and stained for myelin basic protein
Neuron860
Figure 5. Adenosine Receptor Activation Promotes OPC Lineage Progression and Differentiation
(A) Staining for the O4 antigen (green) in PDGF-treated cultures (a) or after treatment with adenosine (ado) (b) showed a larger proportion ofOPCs differentiated to the O4� stage 48 hr after adenosine treatment (p � 0.0001, t test, n � 12 cultures), regardless of the type of growthfactor (PDGF, FGF, or PDGF � FGF) (p � 0.0001, 2-way ANOVA, n � 36 cultures, 39,200 cells).(B) Adenosine treatment (72 hr) also significantly increased the percentage of oligodendrocytes that expressed the O1 antigen (red), a markerof a more mature premyelinating oligodendrocyte (b), compared with PDGF-treated controls (a) (p � 0.0001; 2-way ANOVA; n � 24 cultures;21,550 cells). Hoechst dye was used as a counterstain to reveal OPC nuclei (blue).(C) A quantitative morphometric multivariate cluster analysis was used to compare differences in morphology of OPCs treated with 2MeS-ATP or adenosine for 48 hr. (a) The dendrogram reveals that OPCs could be classified into four morphological clusters (I–IV) with representativeexamples shown in (b) and the number of cells in each category following treatment tabulated in (c). Adenosine treatment caused a significantdecrease in proportion of cells in cluster II and an increase in cells in clusters III and IV. These morphological changes are indicative of lineageprogression to a more mature stage of oligodendrocyte development after adenosine treatment.

Action Potential Regulation of CNS Myelination861
notype (Figure 7C). We found that the percentage ofMBP� oligodendrocytes with multiple parallel pro-cesses was significantly lower in cocultures treated withadenosine receptor antagonists for 3–4 days in cocul-ture (p � 0.0001, n � 26 cultures) (5 �M MRS 1191, 500nM ZM241385, and 10 �M DPCPX), suggesting thatendogenous sources of adenosine are sufficient to pro-mote these biological effects. Electrical stimulation for24 hr increased the number of OPCs with multiple-paral-lel processes after 3 days in coculture (p � 0.01, n �28) compared with controls (Figure 7C). The positiveeffect of electrical stimulation was blocked by stimula-tion in the presence of adenosine receptor antagonists(p � 0.00001, n � 31), but applying the antagonistsafter the 24 hr period of electrical stimulation was noteffective (p � 0.0001, n � 27) (Figure 7C). This resultis consistent with blockade of receptor activation by
Figure 6. The Effects of Adenosine in Cell Culture Are Confirmed in adenosine released in an activity-dependent mannerBrain Slice Preparation
from axons. The antagonists applied in the absence ofIn cerebellar slice culture, adenosine receptor activation inhibited
axons had no effect on viability or differentiation ofproliferation of LB1� or NG2� OPCs (A) and stimulated differentia-OPCs. After 3 days exposure to the antagonists in mono-tion (B), consistent with results in cell culture. *p � 0.03, n � 11 andculture, the number of OPCs was not significantly differ-n � 15 slices in (A) and (B), respectively.ent from controls (357.6 versus 291.6 cells/field in antag-onists versus control; p 0.2), and differentiation of
(MBP), which is highly expressed in the processes of OPCs to a premyelinating phenotype (O1�) was notmature myelinating oligodendrocytes (Figure 7Ab ver- affected by the antagonists when applied in the absencesus Figure 7Aa). Adenosine treatment induced a 292% of axons (2.82% versus 2.54% in antagonists versusincrease in MBP� oligodendrocytes undergoing myelin- control; p 0.7).ation (51.4% � 6.3% versus 17.6% � 5.3%; p � 0.002, These results are consistent with the activity-depen-n � 14) (Figure 7B). dent release of adenosine from DRG axons promoting
In addition, endogenous adenosine and adenosine OPC differentiation and early myelination. The effectsreleased from electrically stimulated DRG axons pro- were not due to activation of non-NMDA glutamate re-
ceptors because the inhibitor CNQX (20 �M) was in-moted differentiation of OPCs into the myelinating phe-
Figure 7. Exogenous Adenosine and Adeno-sine Released from Electrically StimulatedAxons Promote Myelination of DRG Axons byOPCs
(A) Immunocytochemical staining for MBPwas used to compare the effects of chronicadenosine treatment on myelination after 14days in coculture. In contrast to control cul-tures (a), OPCs in adenosine-treated culturesdisplayed multiple parallel processes en-riched in MBP (green) and undergoing earlystages of myelin formation (b).(B) The number of MBP� oligodendrocyteswith multiple parallel processes in adenosine-treated cultures increased 292% as com-pared with controls (p � 0.004, t test, n �
14 cultures). Data shown are normalized withrespect to the total number of MBP� cells/field. Similar results were obtained when ex-pressed as the percentage of total OPCs/field(426% increase with adenosine treatment;7.8% � 1.3% versus 1.8% � 0.69%; p �
0.004, n � 14).(C) Cocultures treated with adenosine recep-
tor antagonists (AdoA) (5 �M MRS 1191, 500 nM ZM241385, and 10 �M DPCPX) developed significantly fewer MPB� oligodendrocytes withmultiple parallel processes after 3–4 days in coculture (p � 0.0001, n � 26 cultures). Electrical stimulation for 24 hr (10 Hz) increased thenumber of MBP� oligodendrocytes with multiple parallel processes as compared with controls (0 Hz) after 3–4 days in coculture (p � 0.01;n � 28), and this effect was blocked by stimulation in the presence of adenosine receptor antagonists (10 Hz with AdoA) (p � 0.00001, n �
31). Adding the antagonists after the 24 hr stimulus (10 Hz before AdoA) resulted in significantly more MBP� cells with multiple parallelprocesses than when the antagonists were added during the stimulus (10 Hz with AdoA) (p � 0.0001, n � 27 cultures), indicating an effectof the antagonist in antagonizing an activity-dependent axon-derived signal. All conditions contained the non-NMDA glutamate receptorantagonist CNQX (20 �M), thus excluding the possible involvement of these glutamate receptors. Similar results were obtained in the absenceof CNQX (see Results). *p � 0.0001 versus 0 Hz; **p � 0.01 versus 0 Hz; ***p � 0.00001 versus 10 Hz; ****p � 0.0001 versus AdoA.

Neuron862
Figure 8. Adenosine Priming Promotes My-elination by OPCs
Brief exposure to adenosine was sufficient topromote OPC differentiation and alignmentwith axons. OPCs were primed by a 48 hr expo-sure to adenosine, replated onto 3-week-oldDRG cultures, and stained for O1. In markedcontrast to controls (A), adenosine-primedOPCs expressing the O1 antigen (red) formedmultiple parallel processes that were closelyassociated with axons after only 1 day in co-culture (B). The proportion of O1� cells withmultiple parallel processes increased 402%in cocultures prepared with adenosine-primed OPCs as compared with coculturesof OPCs primed with PDGF or N1, a culturecondition known to promote OPC differentia-tion and increase O1 expression (C) (p �
0.0001; ANOVA, n � 18 cultures). Data shownare normalized to the total number of O1�
cells/field. Similar results were obtainedwhen expressed as the percentage of totalOPCs/field (3.5% � 0.37% versus 0.33% �
0.12%; adenosine versus control, p � 0.000,n � 15). After 10–12 days in coculture, thedegree of myelination was compared in con-trol (D) and cocultures prepared with adeno-sine-primed OPCs (E) using immunocyto-chemical staining for MBP. (F) A 633%increase in the number of MBP� myelin pro-files/field was seen in cocultures made fromadenosine primed OPCs, as compared withcontrols (E) (p � 0.0001, t test, n � 20 cul-tures). *Significantly different from control.
cluded in all conditions in these experiments. Similar increase in MBP� OPCs with multiple parallel processes2 days after priming with adenosine versus PDGF (88.0 �results were obtained when adenosine receptor antago-
nists were added without CNQX (5 �M MRS 1191; 500 10.1 versus 9.44 � 2.06; p � 0.004, n � 8). When suchcultures were allowed to develop 10–12 days after tran-nM ZM241385, and 200 mM DPCPX). Under these condi-
tions, electrical stimulation increased the number of sient treatment with adenosine, the number of myelinprofiles identified by MBP staining was 633% greaterMBP� oligodendrocytes with multiple parallel pro-
cesses (p � 0.0001, n � 30 cultures), and adenosine than with PDGF primed OPCs (22.15 profiles � 2.1 ver-sus 3.5 � 1.3; p � 0.0001, n � 20) (Figures 8D–8F).receptor antagonists without CNQX blocked the in-
crease in early myelination due to stimulation (p � Electron microscopy confirmed that our cultures of DRGneurons and adenosine-primed OPCs contained several0.00001, n � 46).
We wanted to eliminate unknown effects of adenosine large diameter axons with multiple wraps of myelin sepa-rated by interperiod lines, which is indicative of compacton DRG neurons themselves and determine whether
transient exposure to a lower concentration of adeno- myelin (Figures 9B–9E). Collectively, these findingsindicate that relatively brief exposure to adenosine pro-sine could trigger differentiation of OPCs into mature
myelinating oligodendrocytes. Therefore, OPCs were motes the association of OPCs with axons, their differ-entiation into mature oligodendrocytes, and substan-cultured without axons for 48 hr in PDGF with 100 �M
adenosine, then harvested and replated onto three- tially increases myelination.These effects were not due solely to adenosine in-week-old DRG cultures in standard culture medium
without adenosine. After only 1 day in coculture, adeno- creasing the absolute number of differentiated oligoden-drocytes expressing the O1 antigen. Although equalsine-primed OPCs exhibited striking morphological dif-
ferences compared to cells primed with PDGF alone numbers of OPCs were plated on axons in all conditions,there were significantly fewer OPCs in adenosine-(Figure 8B versus Figure 8A). In the initial stages of
myelination, oligodendrocytes lose their stellate mor- primed cultures 2 days after coculture compared toPDGF alone, consistent with the antiproliferative effectsphology as multiple glial processes align with axons
(Lubetzki et al., 1993; Bunge and Wood, 1987) (Figure of adenosine (71.0 � 2.2 versus 125 � 2.2; p � 0.0001,n � 8, counts of Hoechst-stained nuclei). Although pro-8B versus Figure 8A). The number of oligodendrocytes
immunopositive for O1 and with multiple parallel pro- portionately higher after adenosine priming, the abso-lute number of OPCs at the O1� stage was not signifi-cesses increased 454% in cocultures prepared from
OPCs primed with adenosine as compared with PDGF cantly different in cocultures made from OPCs primedwith adenosine or PDGF (5.2 � 1.9 versus 4.8 � 1.4;(56.4% � 8.9% versus 12.4% � 5.1%; p � 0.001, n �
15) (Figure 8C). The effect of adenosine priming per- p � 0.9, n � 15).Adenosine was more effective in promoting differenti-sisted after the cells became MBP�, resulting in a 936%

Action Potential Regulation of CNS Myelination863
Figure 9. Electron Microscopy of Myelin Formation on DRG Axons after 12 Days in Coculture with Oligodendrocytes Derived from Adenosine-Primed OPCs (48 hr Treatment with 100 �M Adenosine)
At this stage in culture, oligodendrocytes are actively myelinating large diameter axons. (A) An oligodendrocyte (white asterisk) extending acellular process between small, unmyelinated axons to ensheath a large-diameter axon (arrowhead), while extending another process formingcompact myelin around a different axon (black asterisk). (B) Most large diameter axons are in the process of becoming myelinated. (C)Ultrastructure of compact myelin seen in oblique long section. (D) Higher magnification of an axon undergoing early myelination; four completewraps of membrane can be seen. (E) A detailed view of the myelin sheath reveals the interperiodal line (arrow) indicative of compact myelin.Scale bars � 1 �m in (A) and (D), 0.5 �m in (B), and 100 nm in (C) and (E).
ation of OPCs to a myelinating stage than priming cells lowing adenosine treatment. 1 day after adenosine prim-ing, a significantly higher proportion of cells expressedwith N1, a defined medium known to promote differenti-
ation of OPCs (p � 0.0007, n � 11) (Gallo et al., 1996) myelin basic protein (MBP), a marker for terminally differ-entiated oligodendrocytes (15.2% versus 5.3%; adenosine(Figure 8C). N1-priming resulted in a higher proportion
of O1� oligodendrocytes as compared with adenosine versus PDGF; n � 4, p � 0.002) (Figure 10A versusFigure 10B), when cultured in the absence of axons. 2(12.6% versus 7.2%; N1 versus adenosine; p � 0.008,
t test, n � 10), but despite this, N1-primed cells failed days after adenosine priming, the majority of MBP�oligodendrocytes in monoculture had reduced MBP ex-to align with axons, as seen after adenosine treatment
(Figure 8C). This suggests that adenosine promotes dif- pression in the soma and enhanced expression in largerafts of membrane along their processes as comparedferentiation to a stage competent to initiate myelination.
This is consistent with changes in MBP expression fol- with PDGF-primed controls (11.5% versus 1.15%; aden-
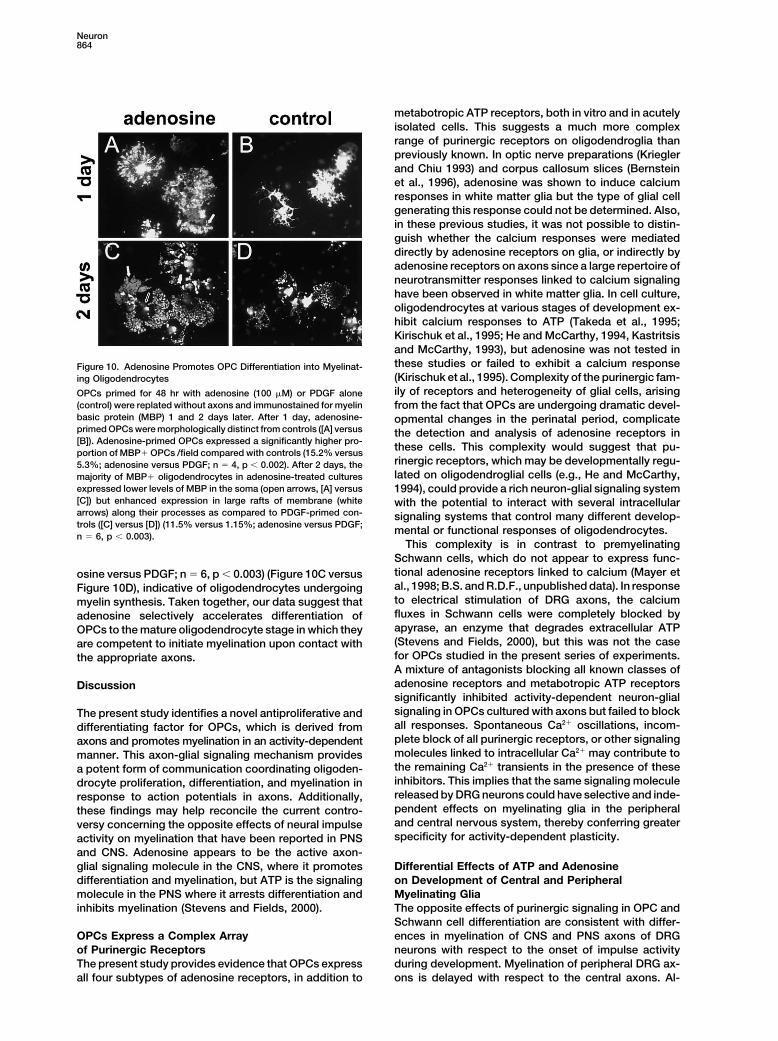
Neuron864
metabotropic ATP receptors, both in vitro and in acutelyisolated cells. This suggests a much more complexrange of purinergic receptors on oligodendroglia thanpreviously known. In optic nerve preparations (Krieglerand Chiu 1993) and corpus callosum slices (Bernsteinet al., 1996), adenosine was shown to induce calciumresponses in white matter glia but the type of glial cellgenerating this response could not be determined. Also,in these previous studies, it was not possible to distin-guish whether the calcium responses were mediateddirectly by adenosine receptors on glia, or indirectly byadenosine receptors on axons since a large repertoire ofneurotransmitter responses linked to calcium signalinghave been observed in white matter glia. In cell culture,oligodendrocytes at various stages of development ex-hibit calcium responses to ATP (Takeda et al., 1995;Kirischuk et al., 1995; He and McCarthy, 1994, Kastritsisand McCarthy, 1993), but adenosine was not tested inthese studies or failed to exhibit a calcium responseFigure 10. Adenosine Promotes OPC Differentiation into Myelinat-(Kirischuk et al., 1995). Complexity of the purinergic fam-ing Oligodendrocytesily of receptors and heterogeneity of glial cells, arisingOPCs primed for 48 hr with adenosine (100 �M) or PDGF alone
(control) were replated without axons and immunostained for myelin from the fact that OPCs are undergoing dramatic devel-basic protein (MBP) 1 and 2 days later. After 1 day, adenosine- opmental changes in the perinatal period, complicateprimed OPCs were morphologically distinct from controls ([A] versus the detection and analysis of adenosine receptors in[B]). Adenosine-primed OPCs expressed a significantly higher pro- these cells. This complexity would suggest that pu-portion of MBP� OPCs /field compared with controls (15.2% versus
rinergic receptors, which may be developmentally regu-5.3%; adenosine versus PDGF; n � 4, p � 0.002). After 2 days, thelated on oligodendroglial cells (e.g., He and McCarthy,majority of MBP� oligodendrocytes in adenosine-treated cultures
expressed lower levels of MBP in the soma (open arrows, [A] versus 1994), could provide a rich neuron-glial signaling system[C]) but enhanced expression in large rafts of membrane (white with the potential to interact with several intracellulararrows) along their processes as compared to PDGF-primed con- signaling systems that control many different develop-trols ([C] versus [D]) (11.5% versus 1.15%; adenosine versus PDGF; mental or functional responses of oligodendrocytes.n � 6, p � 0.003).
This complexity is in contrast to premyelinatingSchwann cells, which do not appear to express func-tional adenosine receptors linked to calcium (Mayer etosine versus PDGF; n � 6, p � 0.003) (Figure 10C versusal., 1998; B.S. and R.D.F., unpublished data). In responseFigure 10D), indicative of oligodendrocytes undergoingto electrical stimulation of DRG axons, the calciummyelin synthesis. Taken together, our data suggest thatfluxes in Schwann cells were completely blocked byadenosine selectively accelerates differentiation ofapyrase, an enzyme that degrades extracellular ATPOPCs to the mature oligodendrocyte stage in which they(Stevens and Fields, 2000), but this was not the caseare competent to initiate myelination upon contact withfor OPCs studied in the present series of experiments.the appropriate axons.A mixture of antagonists blocking all known classes ofadenosine receptors and metabotropic ATP receptorsDiscussionsignificantly inhibited activity-dependent neuron-glialsignaling in OPCs cultured with axons but failed to blockThe present study identifies a novel antiproliferative andall responses. Spontaneous Ca2� oscillations, incom-differentiating factor for OPCs, which is derived fromplete block of all purinergic receptors, or other signalingaxons and promotes myelination in an activity-dependentmolecules linked to intracellular Ca2� may contribute tomanner. This axon-glial signaling mechanism providesthe remaining Ca2� transients in the presence of thesea potent form of communication coordinating oligoden-inhibitors. This implies that the same signaling moleculedrocyte proliferation, differentiation, and myelination inreleased by DRG neurons could have selective and inde-response to action potentials in axons. Additionally,pendent effects on myelinating glia in the peripheralthese findings may help reconcile the current contro-and central nervous system, thereby conferring greaterversy concerning the opposite effects of neural impulsespecificity for activity-dependent plasticity.activity on myelination that have been reported in PNS
and CNS. Adenosine appears to be the active axon-glial signaling molecule in the CNS, where it promotes Differential Effects of ATP and Adenosine
on Development of Central and Peripheraldifferentiation and myelination, but ATP is the signalingmolecule in the PNS where it arrests differentiation and Myelinating Glia
The opposite effects of purinergic signaling in OPC andinhibits myelination (Stevens and Fields, 2000).Schwann cell differentiation are consistent with differ-ences in myelination of CNS and PNS axons of DRGOPCs Express a Complex Array
of Purinergic Receptors neurons with respect to the onset of impulse activityduring development. Myelination of peripheral DRG ax-The present study provides evidence that OPCs express
all four subtypes of adenosine receptors, in addition to ons is delayed with respect to the central axons. Al-

Action Potential Regulation of CNS Myelination865
though myelination begins at about birth in both the Raff, 1993). Conversely, glutamate receptor activationhas been shown to inhibit OPC proliferation (Gallo etcentral and peripheral axons, DRG axons do not enter
the CNS extensively until after the peripheral axons have al., 1996; Yuan et al., 1998). In the present study, theactivity-dependent activation of adenosine receptorsreached their peripheral targets and stopped growing
(Scott, 1992). The developmental arrest of Schwann selectively inhibited OPC proliferation in the presenceof several types of growth factors, including PDGF (and/cells induced by ATP in the PNS may prevent premature
Schwann cell differentiation into a nonmyelinating phe- or bFGF) and when cocultured with axons. This suggeststhat adenosine is able to overcome the potential effectsnotype while having no apparent developmental effect
on OPCs along the central axons at the same time in of these mitogens under the appropriate conditions dur-ing development.development. Despite the fact that 2MeS-ATP induced
robust Cai2� responses in OPCs (Figure 1B), selective
ATP agonists failed to affect OPC proliferation and dif- Adenosine Is a Novel Differentiation Factorferentiation. Adenosine, but not ATP, promoted differen- Promoting Myelinationtiation and myelination of oligodendrocytes in an activ- Our results identify adenosine as a potent axonal signality-dependent manner. Adenosine has no known effects promoting OPC differentiation into myelinating oligo-on Schwann cell differentiation, and in contrast to ATP dendrocytes. Importantly, our results show that only a(Stevens and Fields, 2000), adenosine did not inhibit brief exposure of OPCs to adenosine was sufficient toO4 expression in Schwann cells cocultured with DRG induce significant morphological changes in OPCs,neurons (B.S. and R.D.F., unpublished data). These dif- which subsequently accelerated OPC-axon interactionsferent responses of central and peripheral myelinating and myelination at later stages. The diverse array ofglia to ATP and adenosine are consistent with the occur- adenosine receptors on OPCs identified in this study,rence of myelination in the CNS during a period of devel- which act through multiple intracellular signaling path-opment when the nervous system is already functionally ways, opens new areas of research on signals regulatingactive. oligodendrocyte development and interactions with
neurons. Possibly, the ability of adenosine to promoteRegulation of OPC Proliferation by Purinergic OPC differentiation and increase myelination throughSignaling in the Context of Other activation of adenosine receptors may offer new ap-Activity-Dependent Signals proaches to the treatment of demyelinating diseases inImpulse activity is inhibitory for proliferation of both the CNS, such as multiple sclerosis.Schwann cells (Stevens and Fields, 2000) and OPCs incoculture with DRG neurons, but this involves activation Experimental Proceduresof different purinergic receptors (ATP versus adenosine,
Cell Culture and Electrical Stimulationrespectively). It would appear that different intracellularDRG neurons were dissected from the spinal cords of embryonicsignaling pathways inhibit cell cycle in OPCs andday (E)13.5 mice as described (Stevens et al., 1998). DRG cultures
Schwann cells because activation of ATP receptors with were grown for �3 weeks in MEM medium supplemented with N32MeS-ATP or �S-ATP caused large increases in intracel- containing 50 ng/ml of nerve growth factor and 5% horse serumlular calcium in OPCs but failed to inhibit their mitotic before the addition of OPCs into the side compartments of three-
compartment chambers equipped with stimulating electrodesrate. The inhibitory effects of neural impulse activity on(Fields et al., 1992). Purified cultures of OPCs were prepared fromboth OPCs and SCs are consistent with the requirementcerebral cortices of E20 rats and postnatal day (P)1 mice as de-that these cells exit the cell cycle prior to differentiation.scribed (Gallo and Armstrong, 1995; Yuan et al., 1998; Ghiani et al.,
In the PNS, the onset of high-frequency action potential 1999). This method yields a pure population (99%) of cells of theactivity (Fitzgerald, 1987) corresponds to a period of oligodendrocyte lineage with trace amounts (�0.05%) of GFAP�synchronized cell cycle withdrawal (Stewart et al., 1993; astrocytes and undetectable amounts of OX-42� microglial cells.
Immunocytochemical characterization determined that approxi-Mirsky and Jessen, 1996), which is requisite for myelina-mately 95% of these freshly isolated cells were NG2� or LB1�tion to begin. Acting through these distinct receptors,(OPCs), 4% were O4� (preoligodendroblasts), and �1% were O1�the effect of impulse activity on proliferation could be(preoligodendrocytes). OPCs were plated in N1 medium with 0.5%
timed and independently regulated along central and FBS on poly-L-ornithine coated coverslips (200,000 cells), or intoperipheral axons by spatial and developmental regula- the side compartments of DRG cultures (10,000–20,000 cells/side)tion of ectoenzymes that synthesize extracellular adeno- in the absence of exogenous PDGF or FGF in 10% CO2 at 37 C.
Action potentials were induced in DRG axons by 200 �s 5V bipha-sine from ATP (Zimmermann et al., 1998). In addition,sic pulses through platinum electrodes in three-compartment cham-the expression of specific purinergic receptor subtypesbers (Fields et al., 1992). Axons grew into the central compartmenton CNS and PNS myelinating glia may be develop-beneath high-resistant barriers. Only those neurons with axons tra-
mentally regulated (e.g., see He and McCarthy 1994; versing the barrier are stimulated to fire action potentials, and DRGKirischuk et al., 1995). Although the mechanism for the neurons are not spontaneously active and do not form synapses inactivity-dependent release of ATP from nonsynaptic re- these cultures ( Li et al., 1996).gions of DRG axons is unknown, it also may be subjectto developmental regulation, limiting the effects to ap- Calcium Imaging
After 24 hr in culture, OPCs were treated for 24 hr with PDGF-ABpropriate developmental periods.(10 ng/ml), loaded with 10 �g/ml fluo-3AM (Molecular Probes), andThere are likely multiple activity-dependent signalsimaged on a Bio-Rad MRC1024 as described (Fields and O’Dono-regulating OPC development in different regions of thevan, 1997). Solutions were applied locally through a multibarrel pi-
nervous system (Gallo and Ghiani, 2000). For example, pette using electronically controlled valves (Harvard Apparatus). Flu-activity-dependent release of PDGF in optic nerve has orescence intensity from the soma of every cell in the field was
plotted as �F/Fo. OPCs were acutely isolated from cortices of P0–been shown to stimulate OPC proliferation (Barres and
Neuron866
P14 mice expressing the green fluorescence protein (GFP) under Morphometric AnalysisImages of 517 OPCs fluorescently labeled for the O4 antigen werethe control of 2,3cyclic-nucleotide 3-phosphodiesterase (CNP)
oligodendrocyte-specific promoter (Belachew et al., 2001). Cells acquired using a digital camera from random fields in three replicateexperiments. Eighteen morphological parameters were measuredwere analyzed for light forward- and side-scatter using a FACS
Vantage SE instrument (Becton Dickinson, San Jose, CA). 100% on each cell by automated computerized morphometry (MetaMorph,Universal Imaging Corp.). Five measurements were determined toof the cells collected were GFP� oligodendroglial cells and were
comprised of 45% NG2�, 49% O4� and 7.5% O1� cells. The FACS- be most discriminating and used for further analysis including: totalcell area, area of holes within cell boundaries, cell perimeter, outer cellpurified GFP� fraction did not contain GFAP� astrocyes or NeuN�
neuronal contaminants (Yuan et al., 2002). Cells isolated from P0–P4 radius (distance from centroid to most distant edge of cell), and cellshape factor (4�A/P2); P � perimeter, A � area. Measurements wereanimals were loaded with 20 �g/mL indo-1AM (Molecular Probes)
and imaged within 2 hr using UV laser excitation of both GFP (488 compared by ANOVA, and a multivariate agglomerative hierarchicalcluster analysis using Ward linkage method of Euclidean distancenm) and indo-1 (351 nm) through a double dichroic filter with emis-
sion collected at 460 nm and 405 � 35 nm (respectively). was performed (Minitab, Inc., State College, PA).
Cerebellar Organotypic Slice CulturesMolecular BiologyCerebella were dissected from P2 rats and sagittally sliced (300 �m)RNA was isolated using TRIzol (Invitrogen) from cultured rat OPCsusing a tissue chopper. Slices were cultured on 0.5 �m LCR sterileor acutely isolated OPCs from mice carrying the CNP-GFP trans-membrane filters in 24 mm sterilized mesh sieves as described (Yuangene, and RT-PCR was performed using 1 �g RNA in a Retroscriptet al., 1998). Adenosine (100 �M) was added to the slices in N1kit (Ambion), and 5 �l of RT product was amplified using SuperTaqmedium containing 10% FBS for 48 hr. BrdU (50 �M) was added to(Ambion) in 30 cycles of 94 C (1 min)/60 C (1 min) with 72 C (7 min)the slices for the last 24 hr. After 48 hr in culture, slices were treatedafter the final cycle. PCR primers for rat A1, A2a, and A2b receptorswith protease (1.5 mg/ml) for 5 min at 37 followed by treatmentwere as described (Kreisberg et al., 1997) for A3: 5-TGTGTCwith a trypsin inhibitor (0.65ug/ml) for 5 min at 4 . Cells were thenCTCCAGGTTATCAGG-3 and 5-AGGCATAGAAGTGCATCTGGA-3dissociated mechanically (35 times) through a pasteur pipet and(500 bp). Primers for mouse: A1, 5-ACCATGTGATTGCTTGAAplated on poly-D-ornithine coated coverslips at a density of 1–2AGG-3 and 5-ACGATGAAGCAGAAGGTAGCA-3, (700 bp); A2a:million cells/ml. Cells were immunostained for O4, LB1, or NG2 and5-CTCACGCAGAGTTCCATCTTC-3 and 5-GAAGCAGTTGATGATfixed for BrdU assay.GTGCAG-3; (500 bp); A2b: 5-CAGACCCCCACCAACTACTTT-3
and 5-TGTCAGAGGACAGCAGCTTTT-3 (396 bp); A3: 5-ACCTGCATCCTCCAGGTTAAT-3 and 5-TAGGTGATGTTCAGCCAGTCC-3 Myelination(298bp). Products were resolved by electrophoresis on a 2% aga- Purified OPCs were cocultured at a low density (100,000 cells/ml)rose gel. The A1 receptor PCR product was eluted from the gel and with DRG neurons and treated 1–2 hr later with 500 �M of adenosinesequence verified using an ABI Prism 310 Genetic Analyzer (PE/ in standard DRG culture medium without exogenous PDGF or bFGF.Applied Biosystems). Cocultures were fed every 3–4 days with medium containing adeno-
sine. 14 days later, cultures were fixed and incubated with mono-clonal antibodies against MBP (Boehringer Mannheim) as describedProliferation and Apoptosis(Stevens and Fields, 2000; Stevens et al., 1998). The effects of elec-[3H] thymidine assays were performed in OPCs grown in DMEM-N1trical stimulation on early stages of myelination was assessed bymedium with 0.5% FBS in 24-well plates (3 � 104 cells/cm2). 24 hrMBP immunostaining 2–3 days following electrical stimulation (10after plating, OPCs were treated with growth factors (10 ng/mL ofHz for 24 hr beginning 2–3 hr after coculture). The percentage ofPDGF and/or bFGF) � purinergic drugs and incubated with methyl-premyelinating or myelinating oligodendrocytes was determined by[3H] thymidine for 20 hr. Cells were harvested, and [3H]-Thymidinecalculating the ratio of MBP� cells with multiple parallel processesincorporation was measured by precipitation with 10% trichloraceticto the total number of oligodendrocytes/microscope field.acid and scintillation counting.
In priming experiments, OPCs were first plated on 60 mm dishesFor the BrDU assay, OPCs were labeled with BrdU (Boehringerprecoated with poly-L-ornithine (1 � 106 cells/dish in DMEM-N1 �Mannheim) for 6 hr, fixed and stained according to manufacturer0.5% FBS) and treated 24 hr later with 10 ng/mL PDGF � 100 �Minstructions, and counterstained with Hoechst nuclear stain (Molec-adenosine for 48 hr. OPCs were resuspended by gentle rinsing andular Probes) (1:2000 for 10 min). Proliferation rate was calculatedbrief exposure (5 min) to trypsin (0.05%). Adenosine-, PDGF-, andas the ratio of BrdU/Hoechst� OPC nuclei/microscope field. 10–15N1-primed cells were counted, and equal numbers of cells (10,000randomly chosen fields per coverslip were sampled to obtain acells/side) were replated onto 3-week-old DRG cultures. Coculturesmean for each culture well. In statistical analysis, n � number ofwere maintained in DMEM-N1 � 0.5% FBS in the absence of adeno-wells. For electrical stimulation experiments, OPCs were coculturedsine through the remainder of the experiment.with DRG neurons in standard DRG growth medium without NGF.
The following day, DRG neurons were stimulated at 10 Hz for 24 hrand incubated with BrdU during the last 6 hr of stimulation. Cocul- Electron Microscopytures were then fixed and stained for BrdU as described above. 12 days after coculture of OPCs primed (48 hr with 100 �M adeno-
For the apoptosis assay, OPCs were fixed with 4% paraformalde- sine), cultures were rinsed in PBS, fixed in 2.5% gluteraldehyde inhyde 24 hr after treatment with adenosine, ATP, or 2MeS-ATP (100 0.015 M sodium cacodylate (pH 7.4) for 60 min, and postfixed for 1and 300 �M). Cells were stained for TUNEL according to manufactur- hr in 1% osmium tetroxide and embedded for EM as describeder’s protocol (Roche), and the percentage of TUNEL� cells was (Stevens et al., 1998). After hardening, blocks were cut from cocul-determined from the ratio of TUNEL/Hoechst� cells/microscope tures and mounted for cross and longitudinal sectioning. Ultrathinfield. sections were cut with a diamond knife and stained with uranyl
acetate and lead citrate, and examined by transmission electronmicroscopy.OPC Differentiation
Purified OPCs were plated on poly-L ornithine-coated coverslips(200,000 cells/coverslip) in DMEM-N1 medium with 0.5% FBS and Data Analysis
All experimental treatments were represented in each experimentaltreated 24 hr later with growth factors (10 ng/mL of PDGF and/or bFGF) � adenosine or 2MeS-ATP (100 �M). Differentiation was set, keeping the number of cultures as balanced as possible. For
each statistical comparison, the results of replicate experimentalassessed by immunostaining with antibodies against the cell surfaceantigens O4 and O1, 48 and 72 hr after treatment, respectively. Live sets were pooled from multiple independent trials. Counts were
made of cells or myelinated profiles from randomly selected micro-cultures were incubated with monoclonal O4 or O1 antibodies (1:10for 1 hr), and antigens were detected using a fluorescein-conjugated scope fields (8–15) in each preparation. Results were represented
as the mean of each independent culture preparation (dish, covergoat anti-mouse IgM antibody (Jackson Immunoresearch). Cultureswere counterstained with Hoechst, and the ratio of O4� or O1� slip, or side compartment, depending on the experiment). With the
exception of the morphometric analysis (see above), the sampleOPCs/Hoechst nuclei per field was calculated.
Action Potential Regulation of CNS Myelination867
size represented the number of independent experimental trials, not Fields, R.D., and O’Donovan, M.J. (1997). In Current Protocols inNeuroscience (New York: Wiley Press) pp. 2.3.1–2.3.12.microscope fields. The statistical significance of differences was
tested by two-sample t test, ANOVA for multiple comparisons data Fields, R.D., and Stevens, B. (2000). ATP: an extracellular signalingsets, and �2 for frequency data. molecule between neurons and glia. Trends Neurosci. 23, 625–633.
Fields, R.D., Yu, C., Neale, E.A., and Nelson, P.G. (1992). ChronicAcknowledgments electrical stimulation of multicompartment cell cultures. In Practical
Electrophysiological Methods, H. Kettenmann and R. Grantyn eds.We thank X. Yuan for generating the CNP-EGFP mice and for assis- (New York: Wiley press), pp. 67–76.tance with the slice culture preparations and E.A. Neale for providing
Fitzgerald, M. (1987). Spontaneous and evoked activity of fetal pri-full use of her electron microscopy laboratory and offering helpfulmary afferents in vivo. Nature 326, 603–607.advice. We also thank S. Belachew and C.A. Ghiani for helpful dis-Gallo, V., and Armstrong, R.C. (1995). Developmental and growth-cussions and reading the manuscript and R.H. Quarles, J.T. Russell,factor induced regulation of nestin in oligodendrocyte lineage cells.and C.J. McBain for critical comments. We thank B. Weinberg forJ. Neurosci. 15, 394–406.assistance with confocal microscopy and M. Chelan and J. Novitch
for assistance with digital imaging. B.S. is concurrently enrolled in Gallo, V., and Ghiani, C.A. (2000). Glutamate receptors in glia: newthe Neuroscience and Cognitive Science (NACS) doctoral program cells, new inputs and new functions. Trends Pharmacol. Sci. 21,at the University of Maryland, College Park. 252–258.
Gallo, V., Zhou, J.M., McBain, C.J., Wright, P., Knutson, P.L., andReceived: March 21, 2002 Armstrong, R.C. (1996). Oligodendrocyte cell progenitor proliferationRevised: October 1, 2002 and lineage progression are regulated by glutamate receptor-medi-
ated K� channel block. J. Neurosci. 16, 2659–2670.References Gao, F.B., Apperly, J., and Raff, M. (1998). Cell-intrinsic timers and
thyroid hormone regulate the probability of cell-cycle withdrawalBaas, D., Legrand, C., Samarut, J., and Flamant, F. (2002). Persis- and differentiation of oligodendrocyte precursor cells. Dev. Biol.tence of oligodendrocyte precursor cells and altered myelination in 197, 54–66.optic nerve associated to retina degeneration in mice devoid of all
Ghiani, C.A., Eisen, A.M., Yuan, X., DePinho, R.A., McBain, C.J.,thyroid hormone receptors. Proc. Natl. Acad. Sci. USA 99, 2907–and Gallo, V. (1999). Neurotransmitter receptor activation triggers2911.p27(Kip1) and p21(CIP1) accumulation and G1 cell cycle arrest in
Barres, B.A., and Raff, M.C. (1993). Proliferation of oligodendrocyte oligodendrocyte progenitors. Development 126, 1077–1090.precursor cells depends on electrical activity in axons. Nature 361,
Gyllensten, L., and Malmfors, T. (1963). Myelination of the optic258–260.nerve and its dependence on visual function: a quantitative investi-
Barres, B.A., and Raff, M.C. (1999). Axonal control of oligodendro- gation in mice. J. Embryol. Exp. Morphol. 11, 255–256.cyte development. J. Cell Biol. 147, 1123–1128.
He, M., and McCarthy, K.D. (1994). Oligodendroglial signal transduc-Barres, B.A., Lazar, M.A., and Raff, M.C. (1994). A novel role for tion systems are regulated by neuronal contact. J. Neurochem. 63,thyroid hormone, glucocorticoids and retinoic acid in timing oligo- 501–508.dendrocyte development. Development 120, 1097–1108.
Itoh, K., Stevens, B., Schachner, M., and Fields, R.D. (1995). Regu-Baumann, N., and Pham-Dinh, D. (2001). Biology of oligodendrocyte lated expression of the neural cell adhesion molecule L1 by specificand myelin in the mammalian central nervous system. Physiol. Rev. patterns of neural impulses. Science 270, 1369–1372.81, 871–927.
Kastritsis, C.H., and McCarthy, K.D. (1993). Oligodendroglial lineageBelachew, S., Yuan, X., and Gallo, V. (2001). Unraveling oligodendro- cells express neuroligand receptors. Glia 8, 106–113.cyte origin and function by cell-specific transgenesis. Dev. Neurosci.
Kirischuk, S., Scherer, J., Kettenmann, H., and Verkhratsky, A.23, 287–298.(1995). Activation of P2-purinoreceptors triggered calcium release
Bernstein, M., Lyons, S.A., Moller, T., and Kettenman, H. (1996). from InsP3-sensitive internal stores in mammalian oligodendro-Receptor-mediated calcium signaling in glial cells from mouse cor- cytes. J. Physiol. (Lond.) 483, 41–57.pus collosum slices. J. Neurosci. Res. 46, 152–163.
Kreisberg, M.S., Silldorff, E.P., and Pallone, T.L. (1997). LocalizationBurnstock, G. (1997). The past, present and future of purine nucleo- of adenosine-receptor subtype mRNA in rat outer medullary de-tides as signaling molecules. Neuropharmacology 36, 127–139. scending vasa recta by RT-PCR. Am. J. Physiol. 272, H1231–1238.Bunge, R.P., and Wood, P.M. (1987). Tissue culture studies of inter- Kriegler, S., and Chiu, S.Y. (1993). Calcium signaling of glial cellsactions between axons and myelinating cells of the central and along mammalian axons. J. Neurosci. 13, 4229–4245.peripheral nervous system. Prog. Brain Res. 71, 143–152.
Kuperman, A.S., Volpert, W.A., and Okamoto, M. (1964). Release ofCalaora, V., Rogister, B., Bismuth, K., Murray, K., Brandt, H., Le- adenine nucleotides from nerve axons. Nature 204, 1000–1001.prince, P., Marchionni, M., and Dubois-Dalcq, M. (2001). Neuregulin
Li, M., Jia, M., Fields, R.D., and Nelson, P.G. (1996). Modulation ofsignaling regulates neural precursor growth and the generation ofcalcium currents by electrical activity. J. Neurophysiol. 76, 2595–oligodendrocytes in vitro. J. Neurosci. 21, 4740–4751.2607.
Calza, L., Fernandez, M., Giuliani, A., Aloe, L., and Giardino, L. (2002).Lubetzki, C., Demerens, C., Anglade, P., Villarroya, H., Frankfurter,Thyroid hormone activates oligodendrocyte precursors and in-A., Lee, V.M., and Zalc, B. (1993). Even in culture, oligodendrocytescreases a myelin-forming protein and NGF content in the spinalmyelinate solely axons. Proc. Natl. Acad. Sci. USA 90, 6820–6824.cord during experimental allergic encephalomyelitis. Proc. Natl.Maire, J.C., Medilanski, J., and Straub, R.W. (1984). Release of aden-Acad. Sci. USA 99, 3258–3263.osine, inosine, hypoxanthine from rabbit non-myelinated nerve fi-Canoll, P.D., Musacchio, J.M., Hardy, R., Reynolds, R., Marchionni,bers at rest and during activity. J. Physiol. (Lond.) 357, 67–77.M.A., and Salzer, J.L. (1996). GGF/neuregulin is a neuronal signalMayer, C., Quasthoff, S., and Grafe, P. (1998). Differences in thethat promotes the proliferation and survival and inhibits the differen-sensitivity to purinergic stimulation of myelinating and non-myelinat-tiation of oligodendrocyte progenitors. Neuron 17, 229–243.ing Schwann cells in peripheral human and rat nerve. Glia 23,Canoll, P.D., Kraemer, R., Teng, K.K., Marchionni, M.A., and Salzer,374–382.J.L. (1999). GGF/neuregulin induces a phenotypic reversion of oligo-Mirsky, R., and Jessen, K.R. (1996). Schwann cell development,dendrocytes. Mol. Cell. Neurosci. 13, 79–94.differentiation, and myelination. Curr. Opin. Neurobiol. 6, 89–96.Demerens, C., Stankoff, B., Logak, M., Anglade, P., Allinquant, B.,
Couraud, F., Zalc, B., and Lubetzki, C. (1996). Induction of myelina- Omlin, F.X. (1997). Optic disc and optic nerve of the blind cape mole-rat (Georychus capensis): a proposed model for naturally occurringtion in the central nervous system by electrical activity. Proc. Natl.
Acad. Sci. USA 93, 9887–9892. reactive gliosis. Brain Res. Bull. 44, 627–632.

Neuron868
Park, S.K., Miller, R., Krane, I., and Vartanian, T. (2001a). The erbB2gene is required for the development of terminally differentiatedspinal cord oligodendrocytes. J. Cell Biol. 154, 1245–1258.
Park, S.K., Solomon, D., and Vartanian, T. (2001b). Growth factorcontrol of CNS myelination. Dev. Neurosci. 23, 327–337.
Rogister, B., Ben-Hur, T., and Dubois-Dalcq, M. (1999). From neuralstem cells to myelinating oligodendrocytes. Mol. Cell. Neurosci. 14,287–300.
Scott, S.A. (1992). Sensory Neurons (New York: Oxford UniversityPress).
Seilheimer, B., Persohn, E., and Schachner, M. (1989). Antibodiesto the L1 adhesion molecule inhibit Schwann cell ensheathment ofneurons in vitro. J. Cell Biol. 109, 3095–3103.
Stevens, B., and Fields, R.D. (2000). Response of Schwann cells toaction potentials in development. Science 287, 2267–2271.
Stevens, B., Tanner, S., and Fields, R.D. (1998). Control of myelina-tion by specific patterns of neural impulses. J. Neurosci. 18, 9303–9311.
Stewart, H.J., Morgan, L., Jessen, K.R., and Mirsky, R. (1993).Changes in DNA synthesis rate in the Schwann cell lineage in vivoare correlated with the precursor-Schwann cell transition myelina-tion. Eur. J. Neurosci. 5, 1136–1144.
Takeda, M., Nelson, D.J., and Soliven, B. (1995). Calcium signalingin cultured rat oligodendrocytes. Glia 14, 225–236.
Tauber, H., Waehneldt, T.V., and Neuhoff, V. (1980). Myelination inrabbit optic nerves is accelerated by artificial eye opening. Neurosci.Lett. 16, 235–238.
Tokumoto, Y.M., Durand, B., and Raff, M.C. (1999). An analysis ofthe early events when oligodendrocyte precursor cells are triggeredto differentiate by thyroid hormone, retinoic acid or PDGF with-drawal. Dev. Biol. 213, 327–339.
Wang, S., Sdrulla, A.D., diSibio, G., Bush, G., Nofziger, D., Hicks, C.,Weinmaster, G., and Barres, B.A. (1998). Notch receptor activationinhibits oligodendrocyte differentiation. Neuron 21, 63–75.
Wood, P.M., Schachner, M., and Bunge, R.P. (1990). Inhibition ofSchwann cell myelination in vitro by antibody to the L1 adhesionmolecule. J. Neurosci. 10, 3635–3645.
Yuan, X., Eisen, A.M., McBain, C.J., and Gallo, V. (1998). A role forglutamate and its receptors in the regulation of oligodendrocytedevelopment in cerebellar tissue slices. Development 125, 2901–2914.
Yuan, X., Chittajallu, R., Belachew, S., Anderson, S., McBain, C.J.,and Gallo, V. (2002). Expression of the green fluorescent protein inthe oligodendrocyte lineage: a transgenic mouse model for develop-mental and physiological studies J. Neurosci. Res. 70, 529–545.
Zalc, B., and Fields, R.D. (2000). Do action potentials regulate my-elination? The Neuroscientist 6, 1–9.
Zimmermann, H., Braun, N., Kegal, B., and Heine, P. (1998). Newinsights into molecular structure and function of ectonucleotidasesin the nervous system. Neurochem. Int. 32, 421–425.


![Oligodendroglial myelination requires astrocyte … 5...Accordingly, genetic impairment of endogenous lipid synthesis in Schwann cells (SC) interferes with the acute phase of PNS myelination[5].](https://static.fdocuments.in/doc/165x107/5ca0fba988c9932f098b64ec/oligodendroglial-myelination-requires-astrocyte-5accordingly-genetic-impairment.jpg)