Neuroimaging in Acute Stroke Shazia Mirza and Sankalp Gokhale
38
1 Neuroimaging | www.smgebooks.com Copyright Mirza S.This book chapter is open access distributed under the Creative Commons Attribution 4.0 International License, which allows users to download, copy and build upon published articles even for commercial purposes, as long as the author and publisher are properly credited. Gr up SM Neuroimaging in Acute Stroke INTRODUCTION Every year, about 795000 people experience a new or a recurrent stroke. Cerebrovascular disease ranks No. 4 among all causes of death and is the leading cause of serious long-term disability in the United States [1]. Hence the need for rapid diagnosis and management is vital. The diagnosis of acute stroke is made on the basis of patient history, clinical examination and neuroimaging. Temporally, stroke is defined as acute (24 hours), sub-acute (1-5 days) and chronic (weeks) [2]. The newer category hyper-acute stroke [3] refers to stroke within 6 hours of onset. NEED FOR IMAGING Imaging studies in acute stroke have the following aims: • Differentiate ischemia from hemorrhage which directs further therapy. • Assess the extent of brain injury (irreversible infarction) and potential complications such as herniation or midline shift. Shazia Mirza 1 * and Sankalp Gokhale 1 1 UT Southwestern Medical Center, USA *Corresponding author: Shazia Mirza, UT Southwestern Medical Center, USA, Email: Shazia. [email protected] Published Date: July 25, 2016
Transcript of Neuroimaging in Acute Stroke Shazia Mirza and Sankalp Gokhale
1Neuroimaging | www.smgebooks.comCopyright Mirza S.This book chapter is open access distributed under the Creative Commons Attribution 4.0 International License, which allows users to download, copy and build upon published articles even for commercial purposes, as long as the author and publisher are properly credited.
Gr upSM
Neuroimaging in Acute Stroke
INTRODUCTIONEvery year, about 795000 people experience a new or a recurrent stroke. Cerebrovascular
disease ranks No. 4 among all causes of death and is the leading cause of serious long-term disability in the United States [1]. Hence the need for rapid diagnosis and management is vital. The diagnosis of acute stroke is made on the basis of patient history, clinical examination and neuroimaging.
Temporally, stroke is defined as acute (24 hours), sub-acute (1-5 days) and chronic (weeks) [2]. The newer category hyper-acute stroke [3] refers to stroke within 6 hours of onset.
NEED FOR IMAGINGImaging studies in acute stroke have the following aims:
• Differentiate ischemia from hemorrhage which directs further therapy.
• Assess the extent of brain injury (irreversible infarction) and potential complications such as herniation or midline shift.
Shazia Mirza1* and Sankalp Gokhale1
1UT Southwestern Medical Center, USA
*Corresponding author: Shazia Mirza, UT Southwestern Medical Center, USA, Email: [email protected]
Published Date: July 25, 2016

2Neuroimaging | www.smgebooks.comCopyright Mirza S.This book chapter is open access distributed under the Creative Commons Attribution 4.0 International License, which allows users to download, copy and build upon published articles even for commercial purposes, as long as the author and publisher are properly credited.
• Identify at-risk,under-perfused tissue which can undergo infarction if perfusion is not restored.
• Identify the possible etiology, type and location of the vascular lesion responsible for the deficit.
• Rule out stroke–mimics such as tumors or hematomas.
Time is brain! Every minute of an untreated large vessel stroke results in the loss of 1.9 million neurons, 13.8 billion synapses, and 12 km (7 miles) of axonal fibers [4]. Since recombinant tissue plasminogen activator (rt-PA) is the only treatment option approved by the Food and Drug Administration for acute ischemic stroke; within the first 3-4.5 hours of onset [5-7], it is imperative to rapidly image the patient to exclude hemorrhagic stroke. As treatment modalities expand such as endovascular thrombectomy [8] neuroimaging continues to expand in its goals and scope. The American College of Radiology (ACR) continually provides updates to guidelines for imaging through the ACR Appropriateness Criteria.
COMPUTED TOMOGRAPHYThere are three key CT techniques—unenhanced imaging- NCCT, angiography- CTA, and
perfusion imaging-CTP. A key advantage of this multi-modal CT is rapid imaging (scan time is under 10 minutes [9]), and risks are related to radiation exposure and the contrast material used if any.
NON CONTRAST COMPUTED TOMOGRAPHY (NCCT) - BRAINNCCT is performed as a first line in neuroimaging as it is usually considered gold standard in
ruling out hemorrhage [10,11] despite MRI being equivalent to CT in this regard [12] due to the ease of availability [10], rapid results, and safety in both stable and unstable patients [13,14]. Advancements in technology enabling thinner slices (sub millimeter) and enhanced tissue differentiation [13] allows for a role of NCCT in arterial occlusion and early infarction with a variable detection rate of about 65% [15] in cases imaged within 6 hours. A description of these signs is below.
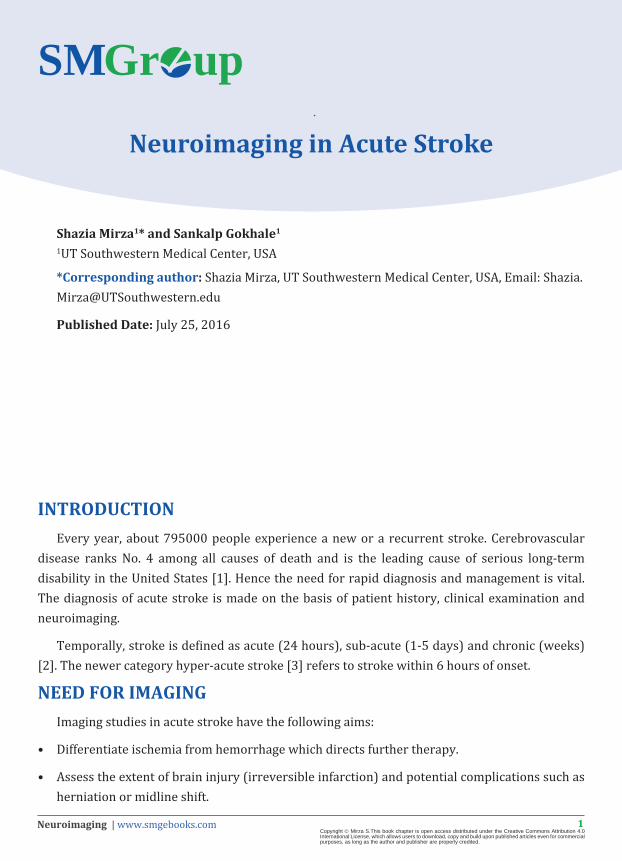
Hyper Dense Artery/MCA Sign
This is a result of a thrombus or embolus (usually in the MCA) resulting in an increased density of the blocked vessel. The prevalence ranges from about 27% in all types of strokes to 41% with MCA infarct with a specificity of 100%, but sensitivity of only 30% [16]. This sign disappears with resolution of the thrombus in a few days. False positives are due to calcification of the walls or a high hematocrit (Figure 1).
3Neuroimaging | www.smgebooks.comCopyright Mirza S.This book chapter is open access distributed under the Creative Commons Attribution 4.0 International License, which allows users to download, copy and build upon published articles even for commercial purposes, as long as the author and publisher are properly credited.
Figure 1: Hyperdense Artery Sign. The “Dense MCA or hyperdense vessel/artery sign” is one of the early signs of acute middle cerebral artery (MCA) territory infarction. This corresponds to a hyper-dense cord like MCA seen in the regionof the Sylvian fissure on non-contrast CT which
represents thrombotic material in main stem of the MCA.
Image source: With permission from Dr. Anvekar B., Neuroradiologycases.com , Neuroradiology unit, S P Institute of Neurosciences, Solapur, India.
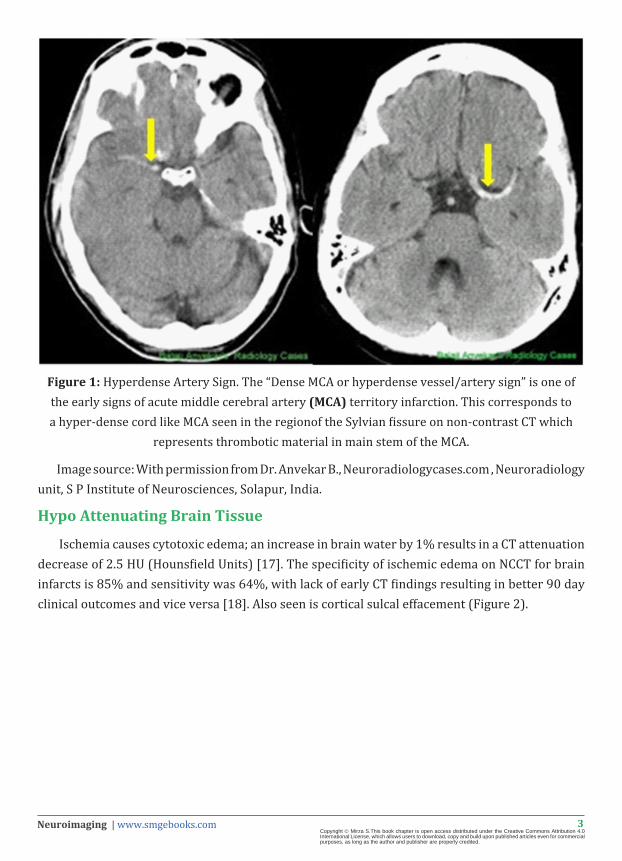
Hypo Attenuating Brain Tissue
Ischemia causes cytotoxic edema; an increase in brain water by 1% results in a CT attenuation decrease of 2.5 HU (Hounsfield Units) [17]. The specificity of ischemic edema on NCCT for brain infarcts is 85% and sensitivity was 64%, with lack of early CT findings resulting in better 90 day clinical outcomes and vice versa [18]. Also seen is cortical sulcal effacement (Figure 2).
4Neuroimaging | www.smgebooks.comCopyright Mirza S.This book chapter is open access distributed under the Creative Commons Attribution 4.0 International License, which allows users to download, copy and build upon published articles even for commercial purposes, as long as the author and publisher are properly credited.
Figure 2: Left middle cerebral artery (MCA) infarction. Axial nonenhanced computer tomography shows foci of hypoattenuation in the left parenchyma (arrows) and sulcal effacement in the left
MCA territory, consistent with infarction.
Image source: With permission from Dr. Birenbaum D., Imaging in Acute Stroke, Western Journal of Emergency Medicine, 2011. 12(1): p. 67-76.
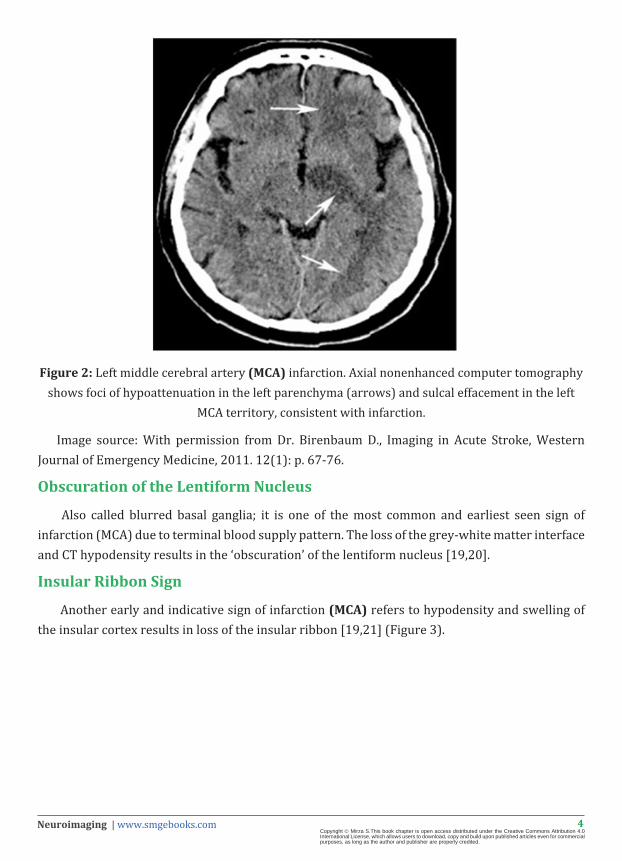
Obscuration of the Lentiform Nucleus
Also called blurred basal ganglia; it is one of the most common and earliest seen sign of infarction (MCA) due to terminal blood supply pattern. The loss of the grey-white matter interface and CT hypodensity results in the ‘obscuration’ of the lentiform nucleus [19,20].
Insular Ribbon Sign
Another early and indicative sign of infarction (MCA) refers to hypodensity and swelling of the insular cortex results in loss of the insular ribbon [19,21] (Figure 3).

5Neuroimaging | www.smgebooks.comCopyright Mirza S.This book chapter is open access distributed under the Creative Commons Attribution 4.0 International License, which allows users to download, copy and build upon published articles even for commercial purposes, as long as the author and publisher are properly credited.
Figure 3: Insular ribbon signrefers to loss of the normal grey-white matter differentiation in the insular cortex. It is one of the earliest imaging signs of middle cerebral artery territory infarction. The yellow arrow shows a normal insular cortex (ribbon visble). However upon infarction leading
to cytotoxic edema, this ribbon is lost (red arrow).
Image source: Adapted with permission from Dr. Anvekar B., Neuroradiologycases.com , Neuroradiology unit, S P Institute of Neurosciences, Solapur, India.
Hemorrhagic Infarct
There is usually a sharp contrast between blood (high attenuating- seen as brighter white areas) and CSF (low attenuating-dark areas) (Figure 4 A & B).
6Neuroimaging | www.smgebooks.comCopyright Mirza S.This book chapter is open access distributed under the Creative Commons Attribution 4.0 International License, which allows users to download, copy and build upon published articles even for commercial purposes, as long as the author and publisher are properly credited.
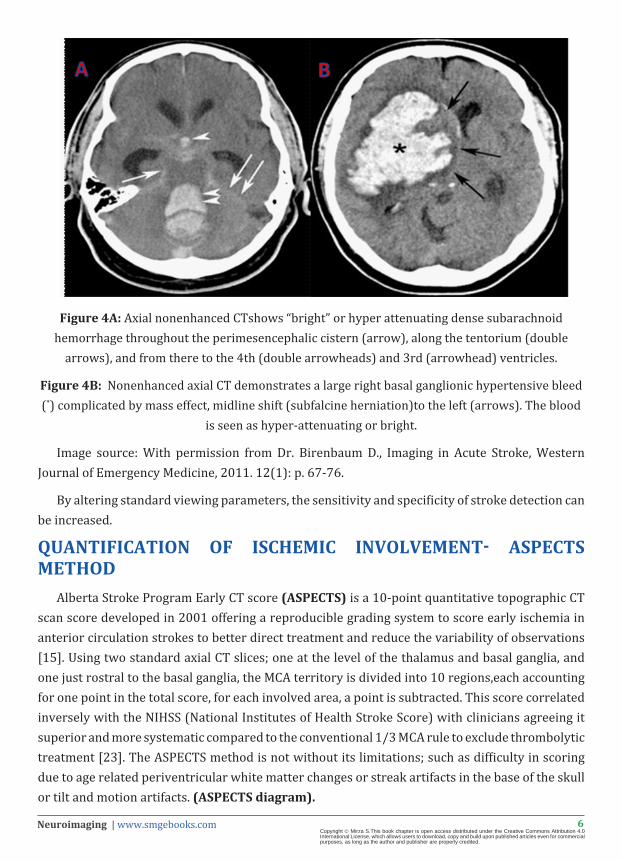
Figure 4A: Axial nonenhanced CTshows “bright” or hyper attenuating dense subarachnoid hemorrhage throughout the perimesencephalic cistern (arrow), along the tentorium (double
arrows), and from there to the 4th (double arrowheads) and 3rd (arrowhead) ventricles.
Figure 4B: Nonenhanced axial CT demonstrates a large right basal ganglionic hypertensive bleed (*) complicated by mass effect, midline shift (subfalcine herniation)to the left (arrows). The blood
is seen as hyper-attenuating or bright.
Image source: With permission from Dr. Birenbaum D., Imaging in Acute Stroke, Western Journal of Emergency Medicine, 2011. 12(1): p. 67-76.
By altering standard viewing parameters, the sensitivity and specificity of stroke detection can be increased.
QUANTIFICATION OF ISCHEMIC INVOLVEMENT- ASPECTS METHOD
Alberta Stroke Program Early CT score (ASPECTS) is a 10-point quantitative topographic CT scan score developed in 2001 offering a reproducible grading system to score early ischemia in anterior circulation strokes to better direct treatment and reduce the variability of observations [15]. Using two standard axial CT slices; one at the level of the thalamus and basal ganglia, and one just rostral to the basal ganglia, the MCA territory is divided into 10 regions,each accounting for one point in the total score, for each involved area, a point is subtracted. This score correlated inversely with the NIHSS (National Institutes of Health Stroke Score) with clinicians agreeing it superior and more systematic compared to the conventional 1/3 MCA rule to exclude thrombolytic treatment [23]. The ASPECTS method is not without its limitations; such as difficulty in scoring due to age related periventricular white matter changes or streak artifacts in the base of the skull or tilt and motion artifacts. (ASPECTS diagram).

7Neuroimaging | www.smgebooks.comCopyright Mirza S.This book chapter is open access distributed under the Creative Commons Attribution 4.0 International License, which allows users to download, copy and build upon published articles even for commercial purposes, as long as the author and publisher are properly credited.
Alberta Stroke Program Early Ct Score (ASPECTS). Schematic diagram showing various areas used for scoring on the ASPECTS. Level of internal capsule & insula: M1 - cortical area anterior to Sylvian fissure; M2 - cortical area just posterior to Sylvian fissure; M3 - more posterior cortical
area in MCA distribution at same level.
At cut near top of the lateral ventricles: M4 - anterior third of cortex; M5 - middle third of cortex; M6 - posterior third of cortex.
COMPUTED TOMOGRAPHY ANGIOGRAPHY-CTACTA is a minimally invasive study with an optimally timed rapid injection of iodinated
contrast through a peripheral IV (intravenous) line to cause vascular opacification, obtaining thin section CT images and using software to stitch the images allowing for a 3-dimensional image of cerebral and neck vasculature (from the aortic arch to the circle of Willis). This allows for identification of stenosis and occlusions; assisting therapeutic decisions such as IV or intra-arterial TPA, mechanical clot retrieval or in cases of carotid dissection, against such a therapy. CTA also identifies vascular abnormalities such as arterio-venous malformations and aneurysms. CTA demonstrated occlusion does correlate with the NIH Stroke Score and outcome of TPA [24] (Figure 4C, 5A, B, C, D).
8Neuroimaging | www.smgebooks.comCopyright Mirza S.This book chapter is open access distributed under the Creative Commons Attribution 4.0 International License, which allows users to download, copy and build upon published articles even for commercial purposes, as long as the author and publisher are properly credited.
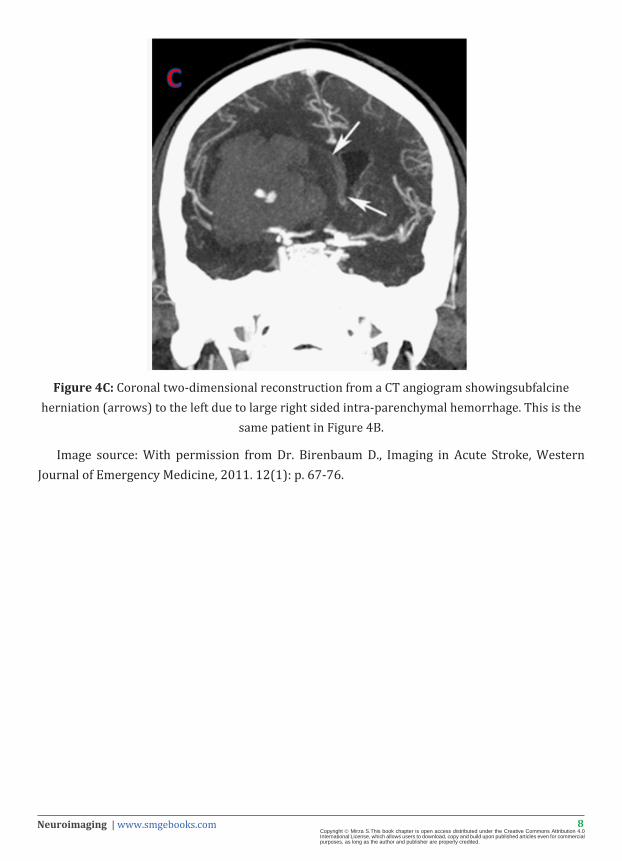
Figure 4C: Coronal two-dimensional reconstruction from a CT angiogram showingsubfalcine herniation (arrows) to the left due to large right sided intra-parenchymal hemorrhage. This is the
same patient in Figure 4B.
Image source: With permission from Dr. Birenbaum D., Imaging in Acute Stroke, Western Journal of Emergency Medicine, 2011. 12(1): p. 67-76.
9Neuroimaging | www.smgebooks.comCopyright Mirza S.This book chapter is open access distributed under the Creative Commons Attribution 4.0 International License, which allows users to download, copy and build upon published articles even for commercial purposes, as long as the author and publisher are properly credited.
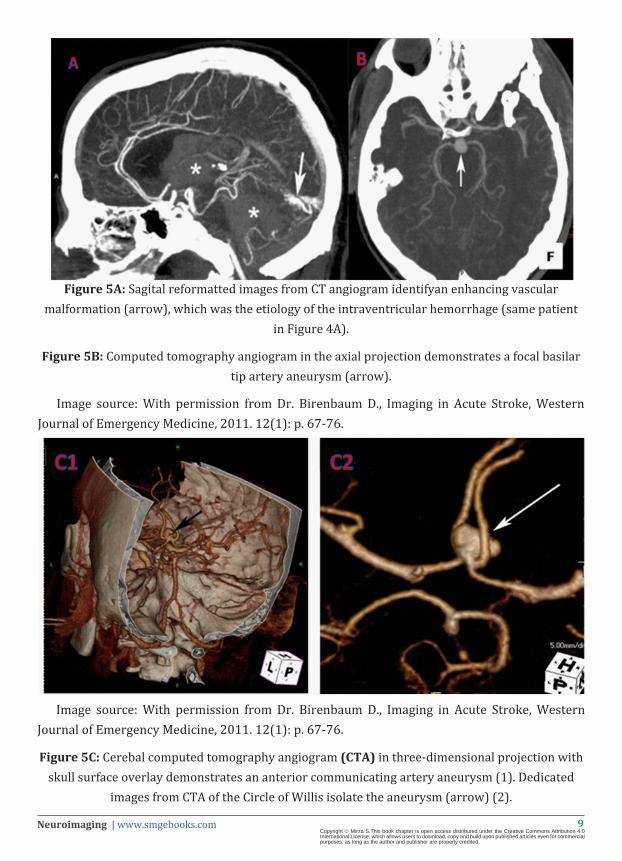
Figure 5A: Sagital reformatted images from CT angiogram identifyan enhancing vascular malformation (arrow), which was the etiology of the intraventricular hemorrhage (same patient
in Figure 4A).
Figure 5B: Computed tomography angiogram in the axial projection demonstrates a focal basilar tip artery aneurysm (arrow).
Image source: With permission from Dr. Birenbaum D., Imaging in Acute Stroke, Western Journal of Emergency Medicine, 2011. 12(1): p. 67-76.
Image source: With permission from Dr. Birenbaum D., Imaging in Acute Stroke, Western Journal of Emergency Medicine, 2011. 12(1): p. 67-76.
Figure 5C: Cerebal computed tomography angiogram (CTA) in three-dimensional projection with skull surface overlay demonstrates an anterior communicating artery aneurysm (1). Dedicated
images from CTA of the Circle of Willis isolate the aneurysm (arrow) (2).

10Neuroimaging | www.smgebooks.comCopyright Mirza S.This book chapter is open access distributed under the Creative Commons Attribution 4.0 International License, which allows users to download, copy and build upon published articles even for commercial purposes, as long as the author and publisher are properly credited.
Image source: With permission from Dr. Birenbaum D., Imaging in Acute Stroke, Western Journal of Emergency Medicine, 2011. 12(1): p. 67-76.
Figure 5D: This patient had subarachnoid hemorrhage on non-contrast CT scan. Images D1, D2, D3 are 3-D reconstructions from CTA (to identify source of hemorrhage) which show aneurysm like pouching (red arrows) in the PCOM (2) and ACOM (3,4). On conventional angiography (1),
these aneurysms were proved to be the infundibulum of vessels. The diagnosis of aneurysms <3 mm on CTA is often tenuous and requires angiographic confirmation.
Image source: copyright www.neuroangio.org -Used with permission from Dr. M. Shapiro.
11Neuroimaging | www.smgebooks.comCopyright Mirza S.This book chapter is open access distributed under the Creative Commons Attribution 4.0 International License, which allows users to download, copy and build upon published articles even for commercial purposes, as long as the author and publisher are properly credited.
CTA Source Images: CTA SI using the images in a CTA, cerebral perfusion can be assessed as low density/dark areas in contrast to hyper-attenuated contrast areas allowing for an estimation of tissue perfusion [25] and a better assessment of tissue at risk compared to NCCT [13] potentially removing the need for a separate CT perfusion study.
COMPUTED TOMOGRAPHY PERFUSION IMAGING -CTPCTP (like CTA) tracks an IV bolus of iodinated contrast over time with sections of the brain
imaged repeatedly. This allows the measurements of parameters such as cerebral blood volume, cerebral blood flow, mean transit time (time difference between arterial inflow and venous outflow), time to peak enhancement (time from the beginning of the contrast injection to the maximum concentration in a region of interest). These parameters can be extrapolated to delineate areas of hypo-perfusion and irreversible infarction by creating perfusion maps. CTP has shown incremental increased sensitivity and specificity in diagnosing acute ischemic stroke compared to NCCT or CTA [26]. CTP is easily available and can be performed on a standard helical CT after NCCT. Clinically, in acute stroke CTP provides information on the penumbra (increased mean transit time, moderately decreased cerebral blood flow and normal to high cerebral blood volume due to auto regulation or if blood flow is markedly decreased then decreased cerebral blood volume) and on the infarcted tissue (severe decrease in cerebral blood flow, and blood volume with increased mean transit time) with defined cut-offs for each criteria. A drawback of CTP is the need to analyze several brain slices for accurate flow data, requiring a multi detector CT with higher slice row, (currently at 2 slices, evolving to 64 slices) and high radiation exposure.
Different techniques are employed such as Dynamic Contrast-enhanced CT and Perfused-blood-volume Mapping [27]. Dynamic contrast enhanced CT consists of monitoring the passage of iodinated contrast bolus which causes a transient increase in attenuation which is in linear relation to the amount of contrast in the region used to generate curves for arterial and venous Regions of Interest which are converted using mathematical models into the perfusion parameters and color coded perfusion maps.
Perfusion maps can give a quick visual read for color changes indicative for perfusion deficits or through measurements (usually not required). Perfused-blood-volume Mapping consists of subtracting the unenhanced CT data from the CTA source image data giving cerebral blood volume data with the advantage of allowing evaluation of the whole brain. However, since it does not allow determination of the mean transit time, blood flow and hence the ischemic penumbra, it clinically has a lesser use (Figure 6A,B).

12Neuroimaging | www.smgebooks.comCopyright Mirza S.This book chapter is open access distributed under the Creative Commons Attribution 4.0 International License, which allows users to download, copy and build upon published articles even for commercial purposes, as long as the author and publisher are properly credited.
Figure 6A: (1) Regional cerebral blood flow map from computed tomography perfusion in a case of left middle cerebral artery infarct shows a large perfusion defect in the left frontal and temporal lobes, evidenced by a lack of color display. (2) Regional cerebral blood volume map demonstrates
a penumbra of decreased perfusion (indicated with arrows around blue areas) surrounding the defect (purple), indicating potentially reversible ischemia around the perfusion defect.
Image source: With permission from Dr. Birenbaum D., Imaging in Acute Stroke, Western Journal of Emergency Medicine, 2011. 12(1): p. 67-76.
13Neuroimaging | www.smgebooks.comCopyright Mirza S.This book chapter is open access distributed under the Creative Commons Attribution 4.0 International License, which allows users to download, copy and build upon published articles even for commercial purposes, as long as the author and publisher are properly credited.
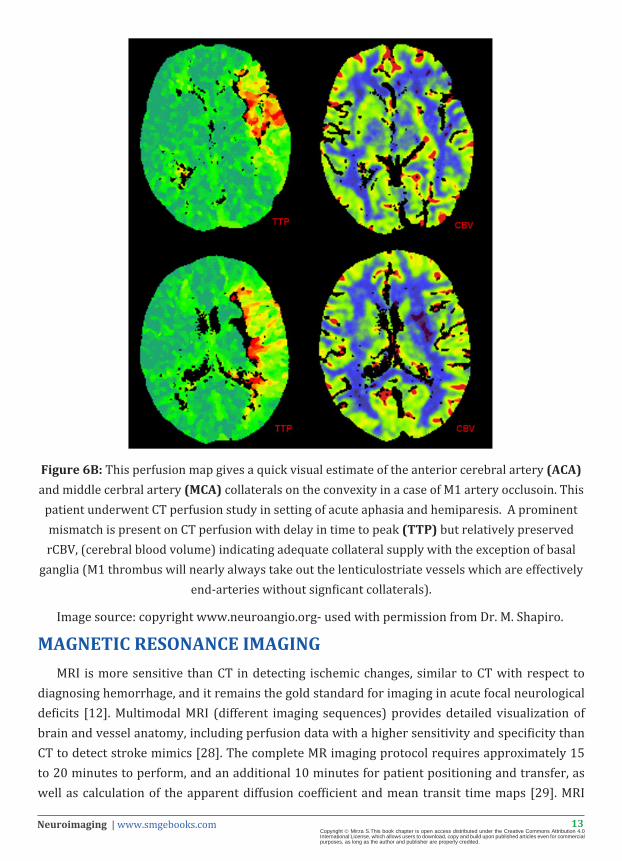
Figure 6B: This perfusion map gives a quick visual estimate of the anterior cerebral artery (ACA) and middle cerbral artery (MCA) collaterals on the convexity in a case of M1 artery occlusoin. This
patient underwent CT perfusion study in setting of acute aphasia and hemiparesis. A prominent mismatch is present on CT perfusion with delay in time to peak (TTP) but relatively preserved rCBV, (cerebral blood volume) indicating adequate collateral supply with the exception of basal
ganglia (M1 thrombus will nearly always take out the lenticulostriate vessels which are effectively end-arteries without signficant collaterals).
Image source: copyright www.neuroangio.org- used with permission from Dr. M. Shapiro.
MAGNETIC RESONANCE IMAGINGMRI is more sensitive than CT in detecting ischemic changes, similar to CT with respect to
diagnosing hemorrhage, and it remains the gold standard for imaging in acute focal neurological deficits [12]. Multimodal MRI (different imaging sequences) provides detailed visualization of brain and vessel anatomy, including perfusion data with a higher sensitivity and specificity than CT to detect stroke mimics [28]. The complete MR imaging protocol requires approximately 15 to 20 minutes to perform, and an additional 10 minutes for patient positioning and transfer, as well as calculation of the apparent diffusion coefficient and mean transit time maps [29]. MRI

14Neuroimaging | www.smgebooks.comCopyright Mirza S.This book chapter is open access distributed under the Creative Commons Attribution 4.0 International License, which allows users to download, copy and build upon published articles even for commercial purposes, as long as the author and publisher are properly credited.
comes with an advantage of decreased exposure to radiation with higher costs, lesser availability, claustrophobia experienced by patients as a drawback, along with absolute contraindications such as metallic implants or pacemakers.
CONVENTIONAL MRIMR sequences usually used in acute strokes are: T1-weighted spin echo, T2-weighted fast
spin-echo, fluid-attenuated inversion recovery-FLAIR, DWI for acute ischemia, MRA and PWI for penumbra. T2-weighted gradient-echo- GRE- for hemorrhage and gadolinium-enhanced T1-weighted spin-echo sequences. Typical findings in acute ischemia include: hyper-intense signal in white matter on T2-weighted images and fluid-attenuated inversion recovery images, and similar to CT findings; grey-white matter distinction loss, sulcal effacement and intravascular signal intensity changes due to occlusion. Hemorrhage is seen as abnormal blooming and while MRI is effective at detecting bleeds, thrombolytic guidelines utilize CT based evidence alone. With the onset of Diffusion weighted imaging, the conventional MR sequences play a minor role in acute stroke evaluation (Figure 7A,B,C).
Figure 7A: Fast spin echo T2-weighted fat suppressed image demonstrates increased signal intensity and effacement of the right temporal lobe, consistent with sub-acute infarct of the right
middle cerebral artery.
Image source: With permission from Dr. Birenbaum D., Imaging in Acute Stroke, Western Journal of Emergency Medicine, 2011. 12(1): p. 67-76.

15Neuroimaging | www.smgebooks.comCopyright Mirza S.This book chapter is open access distributed under the Creative Commons Attribution 4.0 International License, which allows users to download, copy and build upon published articles even for commercial purposes, as long as the author and publisher are properly credited.
Figure 7B: These are T1 weighted MRI images of a patient with bilateral cortical border zone infarcts (secondary to hypotension). T1 bright staining is seen along cortical grey matter
suggestive of Cortical Laminar Necrosis.
Figure 7C: MRI axial FLAIR images of brain show an infarct involving left frontal lobe anterior to the Sylvian fissure,an area which corresponds to the superior division of the left middle cerebral
artery.
Image source: With permission from Dr. Anvekar B., Neuroradiologycases.com , Neuroradiology unit, S P Institute of Neurosciences, Solapur, India.

16Neuroimaging | www.smgebooks.comCopyright Mirza S.This book chapter is open access distributed under the Creative Commons Attribution 4.0 International License, which allows users to download, copy and build upon published articles even for commercial purposes, as long as the author and publisher are properly credited.
MR ANGIOGRAPHY High resolution imaging of the cranial vasculature can be obtained using a non-contrast 3D
time-of-flight (TOF) MR angiography (MRA). The basis of this technique is that protons in tissue are saturated by repeated radiofrequency excitation and have low signal intensity but protons coming in through the vessels are unsaturated and have a high signal intensity producing flow dependent imaging. TOF can be 2D or 3D and does not expose the patient to radiation, or contrast. It is limited by both patient motion and flow artifact often resulting in over-estimation of the stenosis or occlusion. Since it obtains imaging over a short time period, it provides no data on the speed or direction of blood flow (important to study collateral supply). To overcome this, 4-D MRA (and CTA) have been developed. This involves reimaging the field of interest at several time points after the radiofrequency pulse (or contrast injection in CTA) with results similar to those of catheter angiography [30]. Several studies show that TOF is not as accurate as other modalities such as DSA or CTA with a sensitivity of 84.2% and specificity of 84.6% [31]. Contrast enhanced MRA (with gadolinium) is the technique used for extra-cranial vasculature imaging allowing improved anatomical details with an advantage of better diagnosis of arterial dissections to be balanced with side-effects of contrast in renally compromised patients and nephrogenic systemic fibrosis (Figure 8 A,B & C).
Figure 8A: 3-D Time Of Flight (TOF) Non contrast MR Angiography of brain shows severe right MCA proximal main stem (yellow arrow) with sparse cortical branches of right MCA compared to
left (green arrow).

17Neuroimaging | www.smgebooks.comCopyright Mirza S.This book chapter is open access distributed under the Creative Commons Attribution 4.0 International License, which allows users to download, copy and build upon published articles even for commercial purposes, as long as the author and publisher are properly credited.
Figure 8B: The same case as above shows faint serpiginous high signal on T2* axial FLAIR (due to sluggish flow in the sparse cortical branches of the MCA) known as the “ivy sign” in the right
perisylvian area (yellow arrows).
Image source: With permission from Dr. Anvekar B., Neuroradiologycases.com , Neuroradiology unit, S P Institute of Neurosciences, Solapur, India.
Figure 8C: An MR angiogram of a patient with bilateral internal carotid artery dissection showing narrowing of lumen. The lumen is black (blood imaging) and a white hematoma can be visualized
in the vessel wall.
Image source: copyright www.neuroangio.org -Used with permission from Dr. M. Shapiro.
DIFFUSION WEIGHTED MR IMAGING- DWIMR with diffusion is quickly becoming the gold standard in acute stroke imaging, as it can
be obtained within 10 minutes at certain centers [32]. DW MRI uses fast (echo-planar) imaging technology, and is resistant to patient motion artefacts with an imaging time of a few seconds to 2 minutes [33]. The sensitivities and specificities are 100% and 86%, respectively, for diffusion-weighted MRI versus 18% and 100% for conventional MRI [34]. Hence, DW MRI plays an essential role in the diagnosis of acute infarctions and to rule out stroke mimics.
18Neuroimaging | www.smgebooks.comCopyright Mirza S.This book chapter is open access distributed under the Creative Commons Attribution 4.0 International License, which allows users to download, copy and build upon published articles even for commercial purposes, as long as the author and publisher are properly credited.
Principle: is based on the random (Brownian) motion of water molecules in tissues. A change in the water content of cells affects the rate of molecular diffusion in these tissues. Using T2 weighted spin-echo MR imaging sequence with 2 extra gradient pulses (equal magnitude, opposite directions) results in signal changes: greater loss of signal is seen in tissues with higher rates of diffusion and vice versa. Hence, in acute stroke (cytotoxic edema with decreased rate of molecular diffusion in the affected tissue), ischemic tissue appears brighter than normal brain tissue. DW MRI cannot be used to calculate the diffusion coefficient, which is obtained from orthogonal diffusion weighted MR images in all 3 planes and is called Apparent Diffusion Coefficient ADC. ADC maps are used because occasionally areas on diffusion imaging have a high signal due to vasogenic edema, but will appear dark on ADC map proving it is not an acute infarct.
In humans restricted diffusion is seen as early as 30 minutes decreasing to reach a low at 3-5 days (hyper intense signal with reduced ADC values due to restricted diffusion), and reaches baseline at 1-4 weeks, explained by the development of vasogenic edema alongside the cytotoxic edema, replaced by gliosis which carries an increase in extracellular water (high intensity signal due to increased T2 signal: T2 shine through and variable ADC values for months). Hence DWI cannot be reliably used to estimate infarct age without the help of ADC maps.
DW imaging has high sensitivity and specificity with studies showing 94% accuracy for afinal diagnosis of stroke, compared with a yield of 71%-80% when using conventional MRI (T2W/PDW or FLAIR sequences) [35]. DWI demonstrated infarct volumes also correlate (with statistical significance) with NIH Stroke Score and other scales [36]. However false negatives with DWI can occur in small lacunar infarcts of the brainstem or deep nuclei [34]. False positives may be seen in abscesses, tumors but can be easily ruled out. Diffusion imaging may show no abnormality in the setting of ischemia, hence normal DWI with altered perfusion images indicate tissue at risk, and prompt initiation of therapy [33] (Figure 9).
19Neuroimaging | www.smgebooks.comCopyright Mirza S.This book chapter is open access distributed under the Creative Commons Attribution 4.0 International License, which allows users to download, copy and build upon published articles even for commercial purposes, as long as the author and publisher are properly credited.
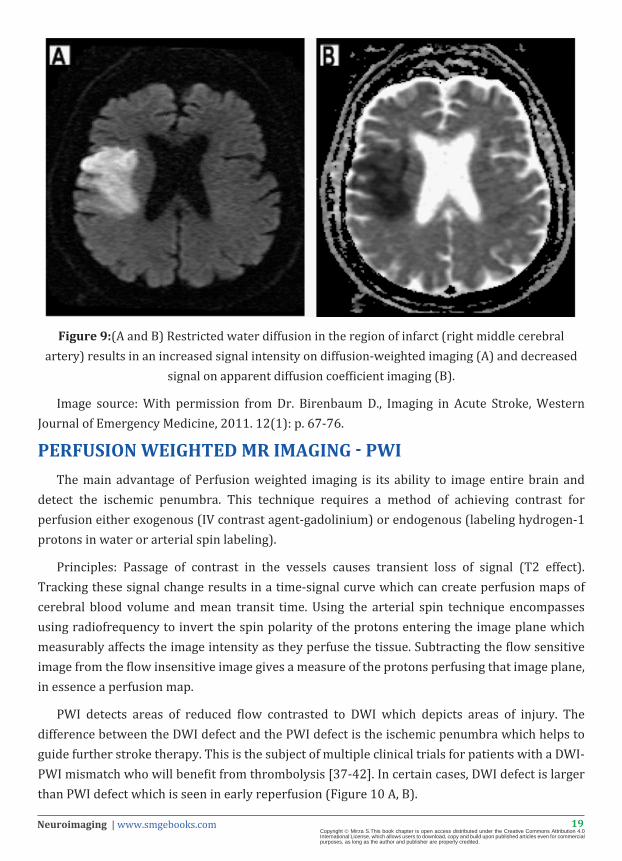
Figure 9:(A and B) Restricted water diffusion in the region of infarct (right middle cerebral artery) results in an increased signal intensity on diffusion-weighted imaging (A) and decreased
signal on apparent diffusion coefficient imaging (B).
Image source: With permission from Dr. Birenbaum D., Imaging in Acute Stroke, Western Journal of Emergency Medicine, 2011. 12(1): p. 67-76.
PERFUSION WEIGHTED MR IMAGING - PWIThe main advantage of Perfusion weighted imaging is its ability to image entire brain and
detect the ischemic penumbra. This technique requires a method of achieving contrast for perfusion either exogenous (IV contrast agent-gadolinium) or endogenous (labeling hydrogen-1 protons in water or arterial spin labeling).
Principles: Passage of contrast in the vessels causes transient loss of signal (T2 effect). Tracking these signal change results in a time-signal curve which can create perfusion maps of cerebral blood volume and mean transit time. Using the arterial spin technique encompasses using radiofrequency to invert the spin polarity of the protons entering the image plane which measurably affects the image intensity as they perfuse the tissue. Subtracting the flow sensitive image from the flow insensitive image gives a measure of the protons perfusing that image plane, in essence a perfusion map.
PWI detects areas of reduced flow contrasted to DWI which depicts areas of injury. The difference between the DWI defect and the PWI defect is the ischemic penumbra which helps to guide further stroke therapy. This is the subject of multiple clinical trials for patients with a DWI-PWI mismatch who will benefit from thrombolysis [37-42]. In certain cases, DWI defect is larger than PWI defect which is seen in early reperfusion (Figure 10 A, B).

20Neuroimaging | www.smgebooks.comCopyright Mirza S.This book chapter is open access distributed under the Creative Commons Attribution 4.0 International License, which allows users to download, copy and build upon published articles even for commercial purposes, as long as the author and publisher are properly credited.
Figure 10A: Patient presents with a stroke involving left middle cerebral artery. MR perfusion shows areas of increased time to peak (TTP) which correspond to decreased flow and volume.
Visual key:
For TTP, higher scale (red) means longer TTP (compromised), and lower scale (blue) means shorter TTP (intact).
For CBF (cerebral blood flow), higher scale (red) means faster flow (preserved), and lower scale (blue) means less flow (compromised).
For CBV (cerebral blood volume), higher scale (red) means more volume (generally preserved), and lower scale (blue) less volume (generally compromised).
21Neuroimaging | www.smgebooks.comCopyright Mirza S.This book chapter is open access distributed under the Creative Commons Attribution 4.0 International License, which allows users to download, copy and build upon published articles even for commercial purposes, as long as the author and publisher are properly credited.
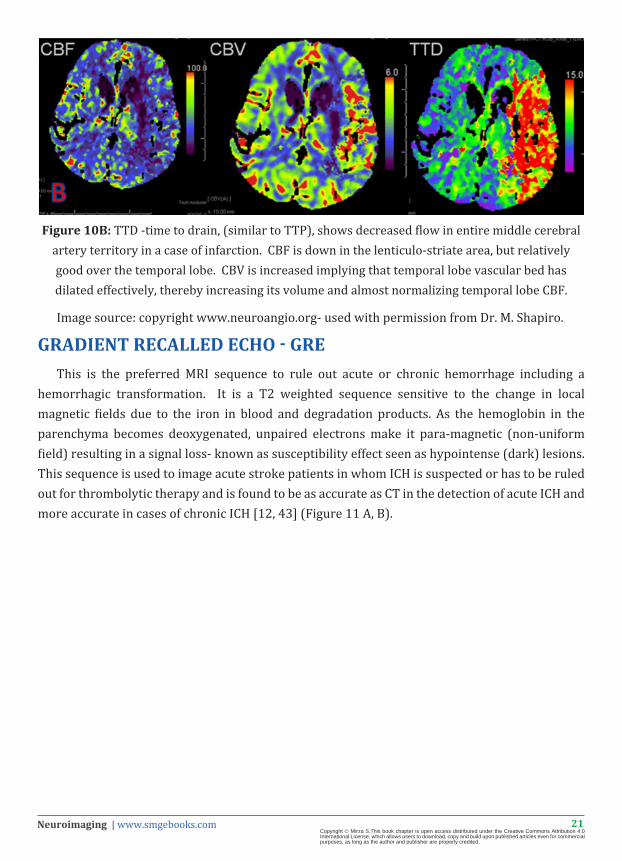
Figure 10B: TTD -time to drain, (similar to TTP), shows decreased flow in entire middle cerebral artery territory in a case of infarction. CBF is down in the lenticulo-striate area, but relatively good over the temporal lobe. CBV is increased implying that temporal lobe vascular bed has dilated effectively, thereby increasing its volume and almost normalizing temporal lobe CBF.
Image source: copyright www.neuroangio.org- used with permission from Dr. M. Shapiro.
GRADIENT RECALLED ECHO - GREThis is the preferred MRI sequence to rule out acute or chronic hemorrhage including a
hemorrhagic transformation. It is a T2 weighted sequence sensitive to the change in local magnetic fields due to the iron in blood and degradation products. As the hemoglobin in the parenchyma becomes deoxygenated, unpaired electrons make it para-magnetic (non-uniform field) resulting in a signal loss- known as susceptibility effect seen as hypointense (dark) lesions. This sequence is used to image acute stroke patients in whom ICH is suspected or has to be ruled out for thrombolytic therapy and is found to be as accurate as CT in the detection of acute ICH and more accurate in cases of chronic ICH [12, 43] (Figure 11 A, B).
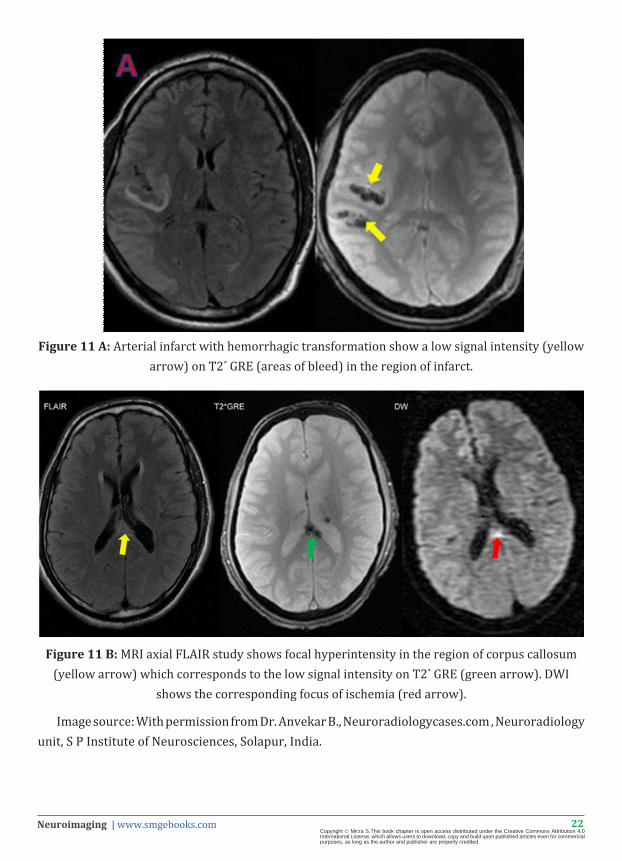
22Neuroimaging | www.smgebooks.comCopyright Mirza S.This book chapter is open access distributed under the Creative Commons Attribution 4.0 International License, which allows users to download, copy and build upon published articles even for commercial purposes, as long as the author and publisher are properly credited.
Figure 11 A: Arterial infarct with hemorrhagic transformation show a low signal intensity (yellow arrow) on T2* GRE (areas of bleed) in the region of infarct.
Figure 11 B: MRI axial FLAIR study shows focal hyperintensity in the region of corpus callosum (yellow arrow) which corresponds to the low signal intensity on T2* GRE (green arrow). DWI
shows the corresponding focus of ischemia (red arrow).
Image source: With permission from Dr. Anvekar B., Neuroradiologycases.com , Neuroradiology unit, S P Institute of Neurosciences, Solapur, India.
23Neuroimaging | www.smgebooks.comCopyright Mirza S.This book chapter is open access distributed under the Creative Commons Attribution 4.0 International License, which allows users to download, copy and build upon published articles even for commercial purposes, as long as the author and publisher are properly credited.
MRI – TIMING AND THERAPEUTIC WINDOWSTreatment with thrombolytics is time dependent (within 3-4.5 hours) hence strokes that
occur in sleep or unwitnessed pose a unique therapeutic challenge for which neuroimaging can provide decision making criteria. MRI sequences have been proposed to identify strokes in the therapeutic time window.
One imaging combination includes: DWI to detect lesions within minutes of ischemia and FLAIR which is sensitive for subacute ischemia. Hence a positive DWI with FLAIR negative mismatch (94% specific) is likely to provide a time window for safe thrombolysis [44].
An imaging combination of DW-PWI mismatch helps identify the tissue at risk, and potential benefit from interventions even if outside the 3-4.5 hour window.
Several studies have been conducted to determine the “best” imaging modality in acute stroke, but the reality is that both CT and MRI will co-exist and complement each other for a long time.
The main drawbacks to CT are that an ischemic brain stroke may not appear in a CT scan for up to 48 hours period, and that CT does not image the vertebra-basilar (up to 15% of strokes).
While the MRI does provide superior quality of images and anatomical details, in an acute setting its advantages address the above mentioned two drawbacks of CT. Important contraindications to MRI are patients with magnetic material in their body such as pacemakers, pins, a vital point to note as neurologically altered or aphasic patients may be unable to provide this information to their providers.
The sensitivities and specificities were 100% and 86%, respectively, for diffusion-weighted MR imaging versus 18% and 100% for conventional MR imaging and 45% and 100% for CT [34]. New guidelines from the American Academy of Neurology state that doctors should use a diffusion MRI scan to diagnose stroke instead of a CT scan which was published in the July 13, 2010, issue of Neurology®, the medical journal of the American Academy of Neurology.
The imaging modality of choice will depend upon the specific situation: cost, availability, clinical setting, contraindications etc. and it remains the purview of a well-educated provider to determine the imaging to effectively guide the therapeutic goals.

24Neuroimaging | www.smgebooks.comCopyright Mirza S.This book chapter is open access distributed under the Creative Commons Attribution 4.0 International License, which allows users to download, copy and build upon published articles even for commercial purposes, as long as the author and publisher are properly credited.
Abbreviations: ICH: Intracerebral hemorrhage, SAH: Sub arachnoid hemorrhage, EDH: Extradural hemorrhage, SDH: Subdural hemorrhage. AVM: Arterio-venous malformation, TCD: transcranial Doppler, CDUS: Carotid duplex ultrasound, DSA: Digital subtraction Angiography.
1. Srinivasan, A., et al., State-of-the-Art Imaging of Acute Stroke. RadioGraphics, 2006. 26(suppl_1): p. S75-S95.
2. Zimmerman, R.D., Stroke Wars: Episode IV CT Strikes Back. American Journal of Neuroradiology, 2004. 25(8): p. 1304-1309.
CHARACTERISTIC [1, 2] CT MRI
Availability Easily available in the emergency department
Not available in all Emergency departments
Time 5 mins 15 mins
Perfusion study: volume assessed 2-4 cm Entire brain visualized
Side effects: ContrastIodinated contrast has toxic effects
on kidney, cannot be used in renally compromised patients, risk of anaphylaxis.
Gadolinium: minimal toxicity on kidneys, risk of nephrogenic and systemic fibrosis
Side effects: Ionizing radiation YES: increases risk of cancer No ionizing radiation
Side effects: Claustrophobia - +++
Drawback: motion artefact + +++
Contraindication: Pacemaker, shrapnel, metal plates - +++
PURPOSEChronic hemorrhage +/- +++
Acute ischemic stroke - ++
Angiography ++ +++
Vertebro-basilar visualization - ++
Table 1: CT vs MRI

25Neuroimaging | www.smgebooks.comCopyright Mirza S.This book chapter is open access distributed under the Creative Commons Attribution 4.0 International License, which allows users to download, copy and build upon published articles even for commercial purposes, as long as the author and publisher are properly credited.
ULTRASOUND METHODSCarotid Duplex ultrasound (CDUS) and transcranial Doppler (TCD) ultrasound are noninvasive,
adjunct methods for evaluation of the intra and extra cranial vasculature, used to assess patients with transient ischemic attacks (TIA) and ischemic strokes (large artery –carotid/vertebral origin). Their role in acute strokes is noted for their use in patients who are unstable, who have contraindications to standard CT MRI imaging [45]. They are best utilized for their visualization of the vessels at the base of the brain: middle cerebral artery, anterior cerebral artery, carotid siphon, vertebral and basilar artery and ophthalmic artery. A major drawback is that in 30% of patients, impedance from the temporal bone limits meaningful imaging [46].
TCD Ultrasound uses low frequency (2 MHz) pulsed sound to penetrate skull bone and visualize the intracranial vessels. It is widely accepted as a noninvasive means of assessing the patency of the intracranial vessels.In patients with acute stroke, TCD can detect occlusion, stenosis, collateral pathways, embolisms, reperfusion post thrombolysis and vasospasms especially after subarachnoid hemorrhage [47]. A major drawback similar to CDUS is the temporal bone impedance, examiner dependence and examiner dependence and low sensitivity in the vertebro-basilar system [46].
The combination of duplex and TCD in some studies has been shown to have 100% sensitivity and specificity as compared to digital subtraction angiography has a high in identifying arterial lesions amenable to treatment about 2 hours after stroke or TIA when done by skilled sonographers [48]. This method is limited mainly by the lack of easily available skilled personnel (Figure 12 A, B, C).
Figure 12A: A normal transcranial Doppler imaging of the left middle cerebral artery which demonstrates normal flow and waveforms, with a peak velocity of 1.28 m/s.

26Neuroimaging | www.smgebooks.comCopyright Mirza S.This book chapter is open access distributed under the Creative Commons Attribution 4.0 International License, which allows users to download, copy and build upon published articles even for commercial purposes, as long as the author and publisher are properly credited.
Figure 12B: Longitudinal color Doppler image through the internal carotid artery demonstrates a “string” sign, with very minimal flow through the ICA in a case of Acute high-grade internal carotid
artery (ICA) occlusion.
Figure12C: Longitudinal sonogram of the left internal carotid artery demonstrates complete flow void, with no perceptible waveforms in a case of acute complete internal carotid artery occlusion.
Image source: With permission from Dr. Birenbaum D., Imaging in Acute Stroke, Western Journal of Emergency Medicine, 2011. 12(1): p. 67-76.
27Neuroimaging | www.smgebooks.comCopyright Mirza S.This book chapter is open access distributed under the Creative Commons Attribution 4.0 International License, which allows users to download, copy and build upon published articles even for commercial purposes, as long as the author and publisher are properly credited.
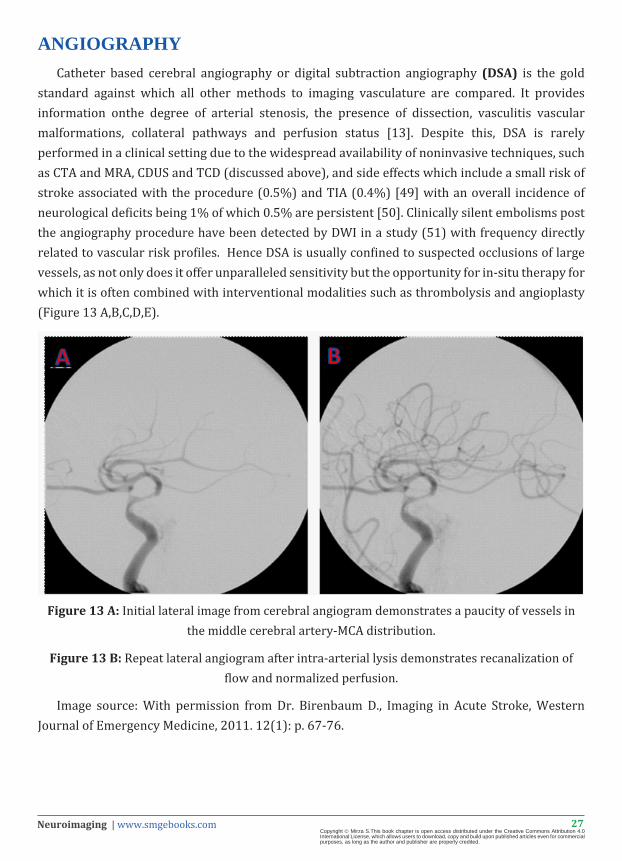
ANGIOGRAPHYCatheter based cerebral angiography or digital subtraction angiography (DSA) is the gold
standard against which all other methods to imaging vasculature are compared. It provides information onthe degree of arterial stenosis, the presence of dissection, vasculitis vascular malformations, collateral pathways and perfusion status [13]. Despite this, DSA is rarely performed in a clinical setting due to the widespread availability of noninvasive techniques, such as CTA and MRA, CDUS and TCD (discussed above), and side effects which include a small risk of stroke associated with the procedure (0.5%) and TIA (0.4%) [49] with an overall incidence of neurological deficits being 1% of which 0.5% are persistent [50]. Clinically silent embolisms post the angiography procedure have been detected by DWI in a study (51) with frequency directly related to vascular risk profiles. Hence DSA is usually confined to suspected occlusions of large vessels, as not only does it offer unparalleled sensitivity but the opportunity for in-situ therapy for which it is often combined with interventional modalities such as thrombolysis and angioplasty (Figure 13 A,B,C,D,E).
Figure 13 A: Initial lateral image from cerebral angiogram demonstrates a paucity of vessels in the middle cerebral artery-MCA distribution.
Figure 13 B: Repeat lateral angiogram after intra-arterial lysis demonstrates recanalization of flow and normalized perfusion.
Image source: With permission from Dr. Birenbaum D., Imaging in Acute Stroke, Western Journal of Emergency Medicine, 2011. 12(1): p. 67-76.

28Neuroimaging | www.smgebooks.comCopyright Mirza S.This book chapter is open access distributed under the Creative Commons Attribution 4.0 International License, which allows users to download, copy and build upon published articles even for commercial purposes, as long as the author and publisher are properly credited.
Figure 13 C: DSA showing sluggish distal filling of the internal carotid artery in a case of internal carotid artery ICA stenosis (yellow arrow).
Figure 13 D: DSA showing complete cut off of ICA at its origin (yellow arrow), without any distal filling implies to occlusion rather than stenosis.
Image source: With permission from Dr. Anvekar B., Neuroradiologycases.com , Neuroradiology unit, S P Institute of Neurosciences, Solapur, India.
29Neuroimaging | www.smgebooks.comCopyright Mirza S.This book chapter is open access distributed under the Creative Commons Attribution 4.0 International License, which allows users to download, copy and build upon published articles even for commercial purposes, as long as the author and publisher are properly credited.
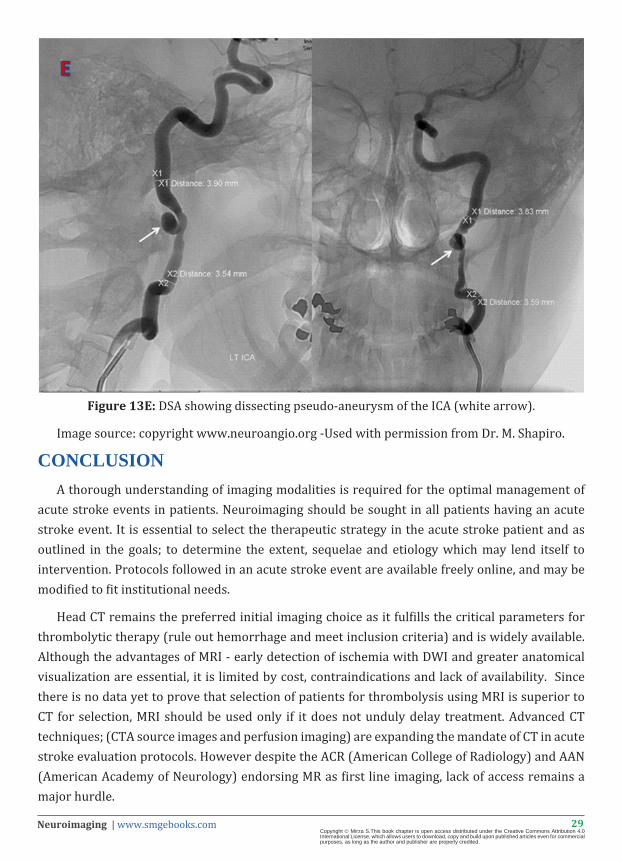
Figure 13E: DSA showing dissecting pseudo-aneurysm of the ICA (white arrow).
Image source: copyright www.neuroangio.org -Used with permission from Dr. M. Shapiro.
CONCLUSION A thorough understanding of imaging modalities is required for the optimal management of
acute stroke events in patients. Neuroimaging should be sought in all patients having an acute stroke event. It is essential to select the therapeutic strategy in the acute stroke patient and as outlined in the goals; to determine the extent, sequelae and etiology which may lend itself to intervention. Protocols followed in an acute stroke event are available freely online, and may be modified to fit institutional needs.
Head CT remains the preferred initial imaging choice as it fulfills the critical parameters for thrombolytic therapy (rule out hemorrhage and meet inclusion criteria) and is widely available. Although the advantages of MRI - early detection of ischemia with DWI and greater anatomical visualization are essential, it is limited by cost, contraindications and lack of availability. Since there is no data yet to prove that selection of patients for thrombolysis using MRI is superior to CT for selection, MRI should be used only if it does not unduly delay treatment. Advanced CT techniques; (CTA source images and perfusion imaging) are expanding the mandate of CT in acute stroke evaluation protocols. However despite the ACR (American College of Radiology) and AAN (American Academy of Neurology) endorsing MR as first line imaging, lack of access remains a major hurdle.
30Neuroimaging | www.smgebooks.comCopyright Mirza S.This book chapter is open access distributed under the Creative Commons Attribution 4.0 International License, which allows users to download, copy and build upon published articles even for commercial purposes, as long as the author and publisher are properly credited.
Noninvasive methods of vascular imaging (MRA, CTA, and Ultrasound) are generally preferred over conventional DSA unless therapeutic intervention is planned or previous studies remained inconclusive; and should never delay the decision of thrombolysis. Use of CTA after rapid (creatinine) testing to exclude compromised renal function can be performed after the 3 hour window to identify potential occlusion/stenosis which may be amenable to intra-arterial or mechanical thrombolysis. CT or MR perfusion imaging is used to identify the salvageable tissue- the ischemic penumbra and is performed if findings may allow extending the time window for the various interventions in demonstrated “tissue at risk”.
(Refer to Table 2 Summary of Imaging Modalities, summary of stroke protocols, and imaging stroke protocols)
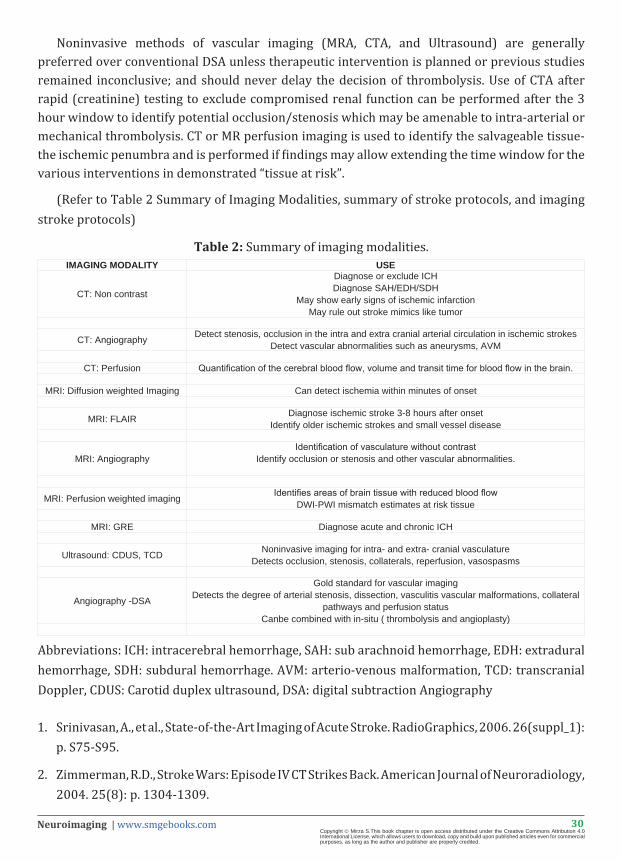
Table 2: Summary of imaging modalities.
1. Srinivasan, A., et al., State-of-the-Art Imaging of Acute Stroke. RadioGraphics, 2006. 26(suppl_1): p. S75-S95.
2. Zimmerman, R.D., Stroke Wars: Episode IV CT Strikes Back. American Journal of Neuroradiology, 2004. 25(8): p. 1304-1309.
IMAGING MODALITY USE
CT: Non contrast
Diagnose or exclude ICHDiagnose SAH/EDH/SDH
May show early signs of ischemic infarctionMay rule out stroke mimics like tumor
CT: Angiography Detect stenosis, occlusion in the intra and extra cranial arterial circulation in ischemic strokesDetect vascular abnormalities such as aneurysms, AVM
CT: Perfusion Quantification of the cerebral blood flow, volume and transit time for blood flow in the brain.
MRI: Diffusion weighted Imaging Can detect ischemia within minutes of onset
MRI: FLAIR Diagnose ischemic stroke 3-8 hours after onsetIdentify older ischemic strokes and small vessel disease
MRI: AngiographyIdentification of vasculature without contrast
Identify occlusion or stenosis and other vascular abnormalities.
MRI: Perfusion weighted imaging Identifies areas of brain tissue with reduced blood flowDWI-PWI mismatch estimates at risk tissue
MRI: GRE Diagnose acute and chronic ICH
Ultrasound: CDUS, TCD Noninvasive imaging for intra- and extra- cranial vasculatureDetects occlusion, stenosis, collaterals, reperfusion, vasospasms
Angiography -DSA
Gold standard for vascular imagingDetects the degree of arterial stenosis, dissection, vasculitis vascular malformations, collateral
pathways and perfusion statusCanbe combined with in-situ ( thrombolysis and angioplasty)
Abbreviations: ICH: intracerebral hemorrhage, SAH: sub arachnoid hemorrhage, EDH: extradural hemorrhage, SDH: subdural hemorrhage. AVM: arterio-venous malformation, TCD: transcranial Doppler, CDUS: Carotid duplex ultrasound, DSA: digital subtraction Angiography

31Neuroimaging | www.smgebooks.comCopyright Mirza S.This book chapter is open access distributed under the Creative Commons Attribution 4.0 International License, which allows users to download, copy and build upon published articles even for commercial purposes, as long as the author and publisher are properly credited.
FUTURE DIRECTIONSAdvances in neuroimaging techniques and availability may change the IV Alteplase criteria
from a fixed time cut off criteria to more fluid imaging parameters which may not only lower the rate of complications by identifying patients with higher risk of hemorrhagic conversions but also broaden the population which is eligible for thrombolysis with enhanced clinical outcomes [38,52].
A new technique; MR permeability imaging allows the quantitative determination of blood brain barrier disruption (increased permeability) which allows identification of patients more likely to have a hemorrhagic conversion after thrombolytic therapy and as an extension, identify those outside the time window with an intact blood brain barrier, who may still benefit from thrombolysis. This may help reduce the morbidity and mortality associated with IV TPA and may be a useful addition to an acute stroke evaluation protocol [53,54].
With fast paced technological advances, the mandate of imaging will soon encompass functional recovery and prognostication. Neuroimaging continues to rapidly evolve to provide more comprehensive imaging, bettering its achievements continuously; not only in visual quality, ease and availability, speed, accuracy, time of detection of ischemia, detection of potential and occurred complications, prognosis and recovery all with the goal of improved neurological outcomes.
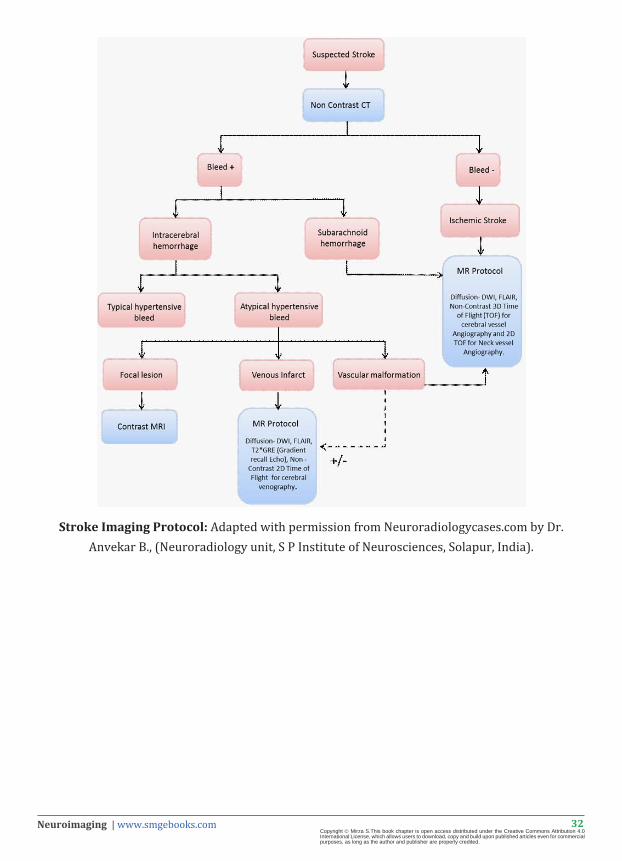
32Neuroimaging | www.smgebooks.comCopyright Mirza S.This book chapter is open access distributed under the Creative Commons Attribution 4.0 International License, which allows users to download, copy and build upon published articles even for commercial purposes, as long as the author and publisher are properly credited.
Stroke Imaging Protocol: Adapted with permission from Neuroradiologycases.com by Dr. Anvekar B., (Neuroradiology unit, S P Institute of Neurosciences, Solapur, India).
33Neuroimaging | www.smgebooks.comCopyright Mirza S.This book chapter is open access distributed under the Creative Commons Attribution 4.0 International License, which allows users to download, copy and build upon published articles even for commercial purposes, as long as the author and publisher are properly credited.
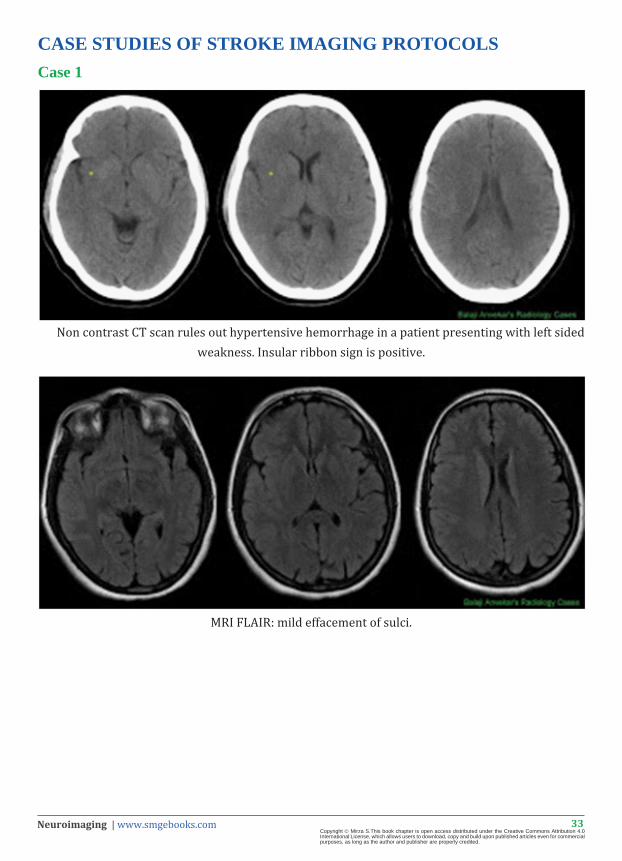
CASE STUDIES OF STROKE IMAGING PROTOCOLSCase 1
Non contrast CT scan rules out hypertensive hemorrhage in a patient presenting with left sided weakness. Insular ribbon sign is positive.
MRI FLAIR: mild effacement of sulci.
34Neuroimaging | www.smgebooks.comCopyright Mirza S.This book chapter is open access distributed under the Creative Commons Attribution 4.0 International License, which allows users to download, copy and build upon published articles even for commercial purposes, as long as the author and publisher are properly credited.
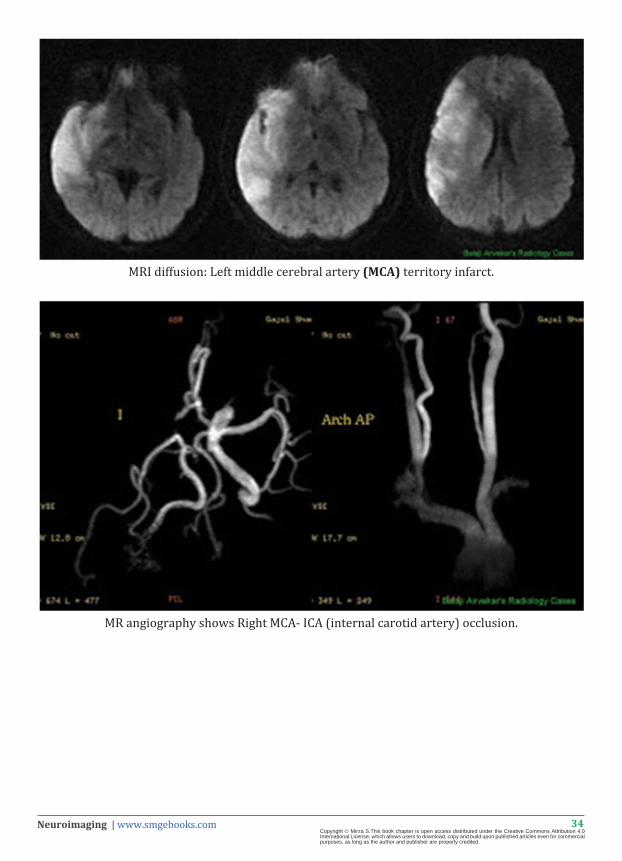
MRI diffusion: Left middle cerebral artery (MCA) territory infarct.
MR angiography shows Right MCA- ICA (internal carotid artery) occlusion.
35Neuroimaging | www.smgebooks.comCopyright Mirza S.This book chapter is open access distributed under the Creative Commons Attribution 4.0 International License, which allows users to download, copy and build upon published articles even for commercial purposes, as long as the author and publisher are properly credited.
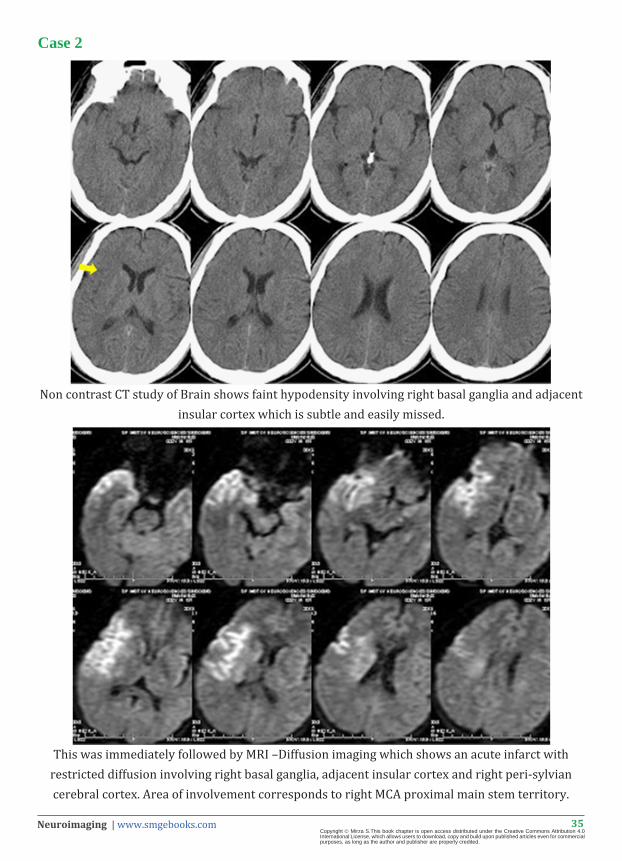
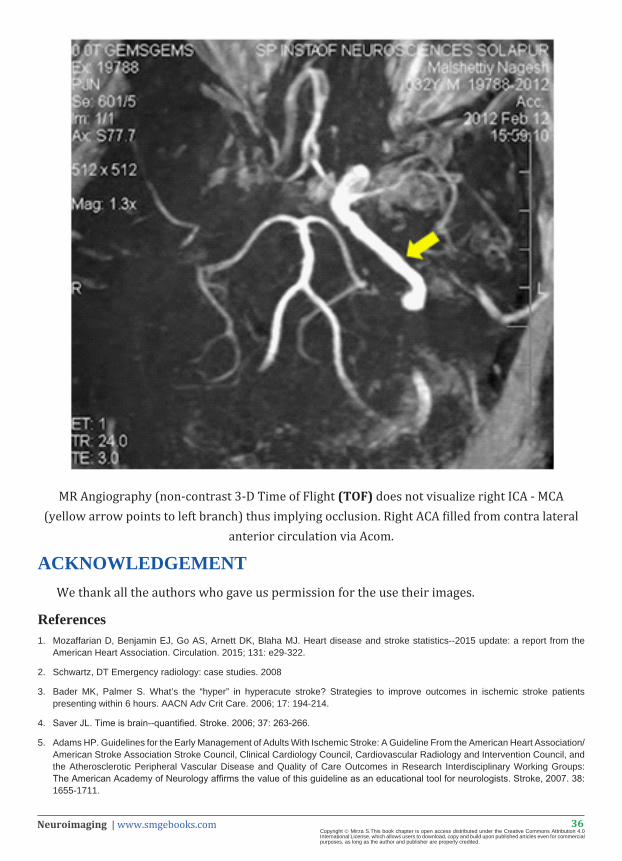
Case 2
Non contrast CT study of Brain shows faint hypodensity involving right basal ganglia and adjacent insular cortex which is subtle and easily missed.
This was immediately followed by MRI –Diffusion imaging which shows an acute infarct with restricted diffusion involving right basal ganglia, adjacent insular cortex and right peri-sylvian cerebral cortex. Area of involvement corresponds to right MCA proximal main stem territory.
36Neuroimaging | www.smgebooks.comCopyright Mirza S.This book chapter is open access distributed under the Creative Commons Attribution 4.0 International License, which allows users to download, copy and build upon published articles even for commercial purposes, as long as the author and publisher are properly credited.
MR Angiography (non-contrast 3-D Time of Flight (TOF) does not visualize right ICA - MCA (yellow arrow points to left branch) thus implying occlusion. Right ACA filled from contra lateral
anterior circulation via Acom.
ACKNOWLEDGEMENTWe thank all the authors who gave us permission for the use their images.
References1. Mozaffarian D, Benjamin EJ, Go AS, Arnett DK, Blaha MJ. Heart disease and stroke statistics--2015 update: a report from the
American Heart Association. Circulation. 2015; 131: e29-322.
2. Schwartz, DT Emergency radiology: case studies. 2008
3. Bader MK, Palmer S. What’s the “hyper” in hyperacute stroke? Strategies to improve outcomes in ischemic stroke patients presenting within 6 hours. AACN Adv Crit Care. 2006; 17: 194-214.
4. Saver JL. Time is brain--quantified. Stroke. 2006; 37: 263-266.
5. Adams HP. Guidelines for the Early Management of Adults With Ischemic Stroke: A Guideline From the American Heart Association/ American Stroke Association Stroke Council, Clinical Cardiology Council, Cardiovascular Radiology and Intervention Council, and the Atherosclerotic Peripheral Vascular Disease and Quality of Care Outcomes in Research Interdisciplinary Working Groups: The American Academy of Neurology affirms the value of this guideline as an educational tool for neurologists. Stroke, 2007. 38: 1655-1711.

37Neuroimaging | www.smgebooks.comCopyright Mirza S.This book chapter is open access distributed under the Creative Commons Attribution 4.0 International License, which allows users to download, copy and build upon published articles even for commercial purposes, as long as the author and publisher are properly credited.
6. Disorders, TNIoN and Sr-PSS Group, Tissue Plasminogen Activator for Acute Ischemic Stroke. New England Journal of Medicine, 1995. 333: 1581-1588.
7. Hacke W, Kaste M, Bluhmki E, Brozman M, Dávalos A. Thrombolysis with alteplase 3 to 4.5 hours after acute ischemic stroke. N Engl J Med. 2008; 359: 1317-1329.
8. Badhiwala JH, Nassiri F, Alhazzani W, Selim MH, Farrokhyar F. Endovascular Thrombectomy for Acute Ischemic Stroke: A Meta-analysis. JAMA. 2015; 314: 1832-1843.
9. Scharf J. Improvement of sensitivity and interrater reliability to detect acute stroke by dynamic perfusion computed tomography and computed tomography angiography. J Comput Assist Tomogr, 2006. 30: 105-110.
10. Adams HP Jr. Guidelines for the management of patients with acute ischemic stroke. A statement for healthcare professionals from a special writing group of the Stroke Council, American Heart Association. Circulation, 1994. 90: 1588-1601.
11. Paxton R, Ambrose J. The EMI scanner. A brief review of the first 650 patients. Br J Radiol. 1974; 47: 530-565.
12. Chalela JA. Magnetic resonance imaging and computed tomography in emergency assessment of patients with suspected acute stroke: a prospective comparison. Lancet, 2007; 369:293-298.
13. Latchaw RE, Alberts MJ, Lev MH, Connors JJ, Harbaugh RE. Recommendations for imaging of acute ischemic stroke: a scientific statement from the American Heart Association. Stroke. 2009; 40: 3646-3678.
14. Leiva-Salinas C, Wintermark M, Kidwell CS. Neuroimaging of cerebral ischemia and infarction. Neurotherapeutics. 2011; 8: 19-27.
15. Wardlaw JM, Dorman PJ, Lewis SC, Sandercock PA. Can stroke physicians and neuroradiologists identify signs of early cerebral infarction on CT? J Neurol Neurosurg Psychiatry. 1999; 67: 651-653.
16. Leys D, Pruvo JP, Godefroy O, Rondepierre P, Leclerc X. Prevalence and significance of hyperdense middle cerebral artery in acute stroke. Stroke. 1992; 23: 317-324.
17. Unger E, Littlefield J, Gado M. Water content and water structure in CT and MR signal changes: possible influence in detection of early stroke. AJNR Am J Neuroradiol. 1988; 9: 687-691.
18. von Kummer R, Bourquain H, Bastianello S, Bozzao L. Early prediction of irreversible brain damage after ischemic stroke at CT. Radiology. 2001; 219: 95-100.
19. Sarikaya B and J Provenzale. Frequency of various brain parenchymal findings of early cerebral ischemia on unenhanced CT scans. Emerg Radiol, 2010; 17: 381-390.
20. Tomura N, Uemura K, Inugami A, Fujita H, Higano S. Early CT finding in cerebral infarction: obscuration of the lentiform nucleus. Radiology. 1988; 168: 463-467.
21. Truwit CL, Barkovich AJ, Gean-Marton A, Hibri N, Norman D. Loss of the insular ribbon: another early CT sign of acute middle cerebral artery infarction. Radiology. 1990; 176: 801-806.
22. Lev MH. Acute stroke: improved nonenhanced CT detection--benefits of soft-copy interpretation by using variable window width and center level settings. Radiology, 1999; 213: 150-155.
23. Pexman JH, Barber PA, Hill MD, Sevick RJ, Demchuk AM. Use of the Alberta Stroke Program Early CT Score (ASPECTS) for assessing CT scans in patients with acute stroke. AJNR Am J Neuroradiol. 2001; 22: 1534-1542.
24. Sims JR, Rordorf G, Smith EE, Koroshetz WJ, Lev MH. Arterial occlusion revealed by CT angiography predicts NIH stroke score and acute outcomes after IV tPA treatment. AJNR Am J Neuroradiol. 2005; 26: 246-251.
25. Schramm P, Schellinger PD, Fiebach JB, Heiland S, Jansen O. Comparison of CT and CT angiography source images with diffusion-weighted imaging in patients with acute stroke within 6 hours after onset. Stroke. 2002; 33: 2426-2432.
26. Hopyan J, Ciarallo A, Dowlatshahi D, Howard P, John V. Certainty of stroke diagnosis: incremental benefit with CT perfusion over noncontrast CT and CT angiography. Radiology. 2010; 255: 142-153.
27. Eastwood JD, Lev MH, Provenzale JM. Perfusion CT with iodinated contrast material. AJR Am J Roentgenol. 2003; 180: 3-12.
28. Xavier AR, Qureshi AI, Kirmani JF, Yahia AM, Bakshi R. Neuroimaging of stroke: a review. South Med J. 2003; 96: 367-379.
29. Schellinger PD, Jansen O, Fiebach JB, Pohlers O, Ryssel H. Feasibility and practicality of MR imaging of stroke in the management of hyperacute cerebral ischemia. AJNR Am J Neuroradiol. 2000; 21: 1184-1189.
30. Eddleman CS. 4D Radial Acquisition Contrast-Enhanced MR Angiography and Intracranial Arteriovenous Malformations: Quickly Approaching Digital Subtraction Angiography. Stroke, 2009. 40: 2749-2753.
31. Tomanek AI, Coutts SB, Demchuk AM, Hudon ME, Morrish WE. MR angiography compared to conventional selective angiography in acute stroke. Can J Neurol Sci. 2006; 33: 58-62.
32. Birenbaum D, Bancroft LW, Felsberg GJ. Imaging in acute stroke. West J Emerg Med. 2011; 12: 67-76.
38Neuroimaging | www.smgebooks.comCopyright Mirza S.This book chapter is open access distributed under the Creative Commons Attribution 4.0 International License, which allows users to download, copy and build upon published articles even for commercial purposes, as long as the author and publisher are properly credited.
33. Schaefer PW, Grant PE, Gonzalez RG. Diffusion-weighted MR imaging of the brain. Radiology. 2000; 217: 331-345.
34. González RG, Schaefer PW, Buonanno FS, Schwamm LH, Budzik RF. Diffusion-weighted MR imaging: diagnostic accuracy in patients imaged within 6 hours of stroke symptom onset. Radiology. 1999; 210: 155-162.
35. Lansberg MG. Advantages of adding diffusion-weighted magnetic resonance imaging to conventional magnetic resonance imaging for evaluating acute stroke. Arch Neurol, 2000; 57: 1311-1316.
36. Schwamm LH. Time course of lesion development in patients with acute stroke: serial diffusion- and hemodynamic-weighted magnetic resonance imaging. Stroke, 1998. 29: 2268-2276.
37. Furlan AJ, Eyding D, Albers GW, Al-Rawi Y, Lees KR. Dose Escalation of Desmoteplase for Acute Ischemic Stroke (DEDAS): evidence of safety and efficacy 3 to 9 hours after stroke onset. Stroke. 2006; 37: 1227-1231.
38. Hacke W, Albers G, Al-Rawi Y, Bogousslavsky J, Davalos A. The Desmoteplase in Acute Ischemic Stroke Trial (DIAS): a phase II MRI-based 9-hour window acute stroke thrombolysis trial with intravenous desmoteplase. Stroke. 2005; 36: 66-73.
39. Hacke W. Intravenous desmoteplase in patients with acute ischaemic stroke selected by MRI perfusion-diffusion weighted imaging or perfusion CT (DIAS-2): a prospective, randomised, double-blind, placebo-controlled study. Lancet Neurol, 2009; 8: 141-150.
40. Mishra NK, Albers GW, Davis SM, Donnan GA, Furlan AJ. Mismatch-based delayed thrombolysis: a meta-analysis. Stroke. 2010; 41: 25-33.
41. Albers GW. Magnetic resonance imaging profiles predict clinical response to early reperfusion: the diffusion and perfusion imaging evaluation for understanding stroke evolution (DEFUSE) study. Ann Neurol, 2006; 60: 508-517.
42. Davis SM. Effects of alteplase beyond 3 h after stroke in the Echoplanar Imaging Thrombolytic Evaluation Trial (EPITHET): a placebo-controlled randomised trial. Lancet Neurol, 2008; 7: 299-309.
43. Kidwell CS, Chalela JA, Saver JL, Starkman S, Hill MD. Comparison of MRI and CT for detection of acute intracerebral hemorrhage. JAMA. 2004; 292: 1823-1830.
44. Witkowski G. The usefulness of diffusion-weighted/fluid-attenuated inversion recovery imaging in the diagnostics and timing of lacunar and nonlacunar stroke. Neuroradiology, 2014; 56: 825-831.
45. Grolimund P, Seiler RW, Aaslid R, Huber P, Zurbruegg H. Evaluation of cerebrovascular disease by combined extracranial and transcranial Doppler sonography. Experience in ,039 patients. Stroke. 1987; 18: 1018-1024.
46. Valaikiene J, Schuierer G, Ziemus B, Dietrich J, Bogdahn U. Transcranial color-coded duplex sonography for detection of distal internal carotid artery stenosis. AJNR Am J Neuroradiol. 2008; 29: 347-353.
47. Alexandrov AV, Demchuk AM, Wein TH, Grotta JC. Yield of transcranial Doppler in acute cerebral ischemia. Stroke. 1999; 30: 1604-1609.
48. Chernyshev OY, Garami Z, Calleja S, Song J, Campbell MS. Yield and accuracy of urgent combined carotid/transcranial ultrasound testing in acute cerebral ischemia. Stroke. 2005; 36: 32-37.
49. Johnston DC, Chapman KM, Goldstein LB. Low rate of complications of cerebral angiography in routine clinical practice. Neurology. 2001; 57: 2012-2014.
50. Heiserman JE, Dean BL, Hodak JA, Flom RA, Bird CR. Neurologic complications of cerebral angiography. AJNR Am J Neuroradiol. 1994; 15: 1401-1407.
51. Bendszus M, Koltzenburg M, Burger R, Warmuth-Metz M, Hofmann E. Silent embolism in diagnostic cerebral angiography and neurointerventional procedures: a prospective study. Lancet. 1999; 354: 1594-1597.
52. Furlan AJ, Eyding D, Albers GW, Al-Rawi Y, Lees KR. Dose Escalation of Desmoteplase for Acute Ischemic Stroke (DEDAS): evidence of safety and efficacy 3 to 9 hours after stroke onset. Stroke. 2006; 37: 1227-1231.
53. Kassner A. Recombinant tissue plasminogen activator increases blood-brain barrier disruption in acute ischemic stroke: an MR imaging permeability study. AJNR Am J Neuroradiol, 2009; 30: 1864-1869.
54. Kassner A, Mandell DM, Mikulis DJ. Measuring permeability in acute ischemic stroke. Neuroimaging Clin N Am. 2011; 21: 315-325.