
Neurography Supplement to Issue 50
24
The Magazine of MRI MAGNETOM Flash Supplement to Issue Number 2/2012 RSNA Edition MR Neurography Techniques and Interpretation Page 4 MR Neurography Diagnostic Criteria to Determine Lesions of Peripheral Nerves Page 10 High-Resolution DWI in Brain and Spinal Cord with syngo RESOLVE Page 16
-
Upload
jhon-arriaga-cordova -
Category
Documents
-
view
119 -
download
2
description
Neurography Supplement to Issue 50
Transcript of Neurography Supplement to Issue 50

The Magazine of MRI
MAGNETOM Flash
Supplement to Issue Number 2/2012 RSNA Edition
MR NeurographyTechniques and InterpretationPage 4
MR NeurographyDiagnostic Criteria to DetermineLesions of Peripheral NervesPage 10
High-Resolution DWI in Brain and Spinal Cord with syngo RESOLVEPage 16
2 MAGNETOM Flash · 2/2012 · www.siemens.com/magnetom-world
Editorial
Avneesh Chhabra, M.D.Assistant Professor
Radiology and Orthopedic Surgery
The Russel H. Morgan Department of Radiology and Radiological Science
Johns Hopkins University School of Medicine
Baltimore, Maryland, USA
Dear Reader,
I am pleased to edit this exciting MAGNETOM Flash issue on Magnetic Resonance Neuro-graphy (MRN). Incorporation in the RSNA edition of the magazine also makes it special as it will have a wider audience and multi-specialty reach.
This edition has three articles covering different aspects of the peripheral nervous system from spinal cord to peripheral nerves. Latest 2D and 3D techniques in practice and future directions in both anatomic and functional domains of peripheral nerve imaging are addressed in detail.
Current high field technology depicts high resolution intra-neural fascicular detail in both normal and abnormal states as described in the article by Philipp Bäumer et al. (Heidelberg University Hospital, Germany). The high resolution imaging is important for diagnosis and surgical plan-ning of nerve injuries, entrapments and for further evaluation of diffuse or polyneuropa-thies. Various technological developments, interpretation criteria, and future directions Avneesh Chhabra, M.D.
towards technique improvement are high-lighted in my article from the work I have performed at Johns Hopkins University Hos-pital. Finally, there is an important article on diffusion tensor imaging improvement using syngo RESOLVE technique for func-tional spinal cord and brain imaging.
A bright future lies ahead for MRN with rapid deployment of this technology in current clinical setting for a variety of neuropathy diagnoses encompassing referrals from a number of providers, including neurosur-geons, neurologists, peripheral nerve sur-geons, hand or foot and ankle specialists, plastic surgeons, and rehabilitation special-ists. We will see further improvements in coming years in both anatomic and func-tional techniques, while user friendly ana-lytic software becomes available.
Please enjoy reading the latest and inspiring RSNA issue of MAGNETOM Flash!

Content
MAGNETOM Flash · 2/2012 · www.siemens.com/magnetom-world 3
MR Neurography 4 Magnetic Resonance Neurography –
Techniques and InterpretationAvneesh Chhabra, et al.
4 16
The information presented in MAGNETOM Flash is for illustration only and is not intended to be relied upon by the reader for instruction as to the practice of medicine. Any health care practitioner reading this information is reminded that they must use their own learning, training and expertise in dealing with their individual patients. This material does not substitute for that duty and is not intended by Siemens Medical Solutions to be used for any purpose in that regard. The treating physician bears the sole responsibility for the diagnosis and treatment of patients, including drugs and doses prescribed in connection with such use. The Operating Instructions must always be strictly followed when operating the MR System. The source for the technical data is the corresponding data sheets.The MRI restrictions (if any) of the metal implant must be considered prior to patient undergoing MRI exam. MR imaging of patients with metallic implants brings specific risks. However, certain implants are approved by the governing regulatory bodies to be MR conditionally safe. For such implants, the previously mentioned warning may not be applicable. Please contact the implant manufacturer for the specific conditional information. The conditions for MR safety are the responsibility of the implant manufacturer, not of Siemens.
1 The software is pending 510(k) clearance, and is not yet commercially available in the United States and in other countries.
10
10 MR Neurography – Diagnostic Criteria to Determine Lesions of Peripheral NervesPhilipp Bäumer, et al.
16 High-Resolution DWI in Brain and Spinal Cord with syngo RESOLVE1
Julien Cohen-Adad

4 MAGNETOM Flash · 2/2012 · www.siemens.com/magnetom-world
Clinical Neurology
Magnetic Resonance Neurography – Techniques and Interpretation Avneesh Chhabra, M.D.1; Abraham Padua Jr., Ph.D.2; Aaron Flammang, MBA2; Wesley Gilson, Ph.D.2; John A. Carrino, M.D., M.P.H.1
1 Department of Radiology & Radiological Science, Johns Hopkins University, Baltimore, MD, USA2 Siemens Healthcare, Malvern, PA, USA and Erlangen, Germany
IntroductionMagnetic resonance neurography (MRN), akin to angiography, is an ever-advanc-ing technology for multiplanar depiction of normal and abnormal peripheral nerves. This article will highlight various 2D and 3D pulse sequences available for non-selective and selective nerve visualization as well as their functional evaluation. Related interpretation pearls and pitfalls are discussed.
TechniquesMRN is best performed on 3 Tesla (T) scanners with dedicated extremity or wrap around flex coils as they can pro-vide higher signal-to-noise ratio (SNR), which is essential to enhance the small-est structure in the neurovascular bun-dle, namely the peripheral nerves [1].
(fsT2w), short tau inversion recovery (STIR), and spectral adiabatic inversion recovery (SPAIR), or 2-point or 3-point Dixon techniques. fsT2w is often limited due to loss of fat saturation along the curvatures of extremities, especially in large subjects. STIR works well for 3D imaging with excellent fat suppression, however for 2D imaging it is often marred by poor SNR, excessive SAR (specific absorption rate) deposition and pulsation artifacts. SPAIR works well as it provides better fat suppression than fsT2w and higher SNR than STIR. It has virtually no pulsation artifacts and is also relatively SAR favorable (Fig. 1). It comes in weak and strong contrast versions. The authors prefer the strong version as it provides isointense signal in normal nerves [2].
On current 1.5T scanners (MAGNETOM Aera, MAGNETOM Avanto), 2D (dimen-sional) imaging can be performed with near-similar resolution as on 3T scanners, however 3D imaging is often limited, especially if smaller voxels are used or fat suppression is applied. On the other hand, if there is metal in the field-of-view, in order to mitigate susceptibility arti-facts and for superior nerve visualization, 1.5T imaging is often favored.2D pulse sequences include high resolu-tion (base resolution 256 or higher, in plane resolution 0.3–0.4 mm) T1-weighted and fat suppressed T2w images. Uniform fat suppression is essential to avoid artifactual increase in nerve signal intensity. Options include frequency selective fat suppression
1 Meralgia Paresthetica. Young woman with right anterolateral thigh pain and suspected lateral femoral cutaneous (LFCN) nerve abnormality. Axial T2 SPAIR image shows uniform fat suppression and abnormally hyperintense right LFCN (arrow) in keeping with clinical diagnosis of meralgia paresthetica.
2 T2 SPACE. Coronal non-fat suppressed T2 SPACE image through the pelvis shows bilaterally split sciatic nerves (arrows) in this patient with no symptoms of sciatica.
1 2

Dixon technique applied with T2w imag-ing gives separate water and fat images and also provides excellent fat suppres-sion with higher SNR and contrast-to-noise ratio than STIR or SPAIR. 3D pulse sequences can be divided into anatomic and functional techniques. Anatomic techniques are further divided into nerve non-selective and nerve selec-tive sequences. Nerve non-selective tech-niques include T1w imaging, namely VIBE (volume interpolated breathhold exami-nation, T1 3DGRE) or MPRAGE (3D GRE); and T2w multislab acquisition, namely SPACE (sampling perfection with applica-tion optimized contrasts using varying flip angle evolutions) [3]. SPACE is heavily used in MRN examinations as isotropic spine echo type imaging can obtained using SPACE in a variety of contrasts (T1, PD, T2, STIR, and SPAIR) with constant or variable echo times (Fig. 2). The authors use VIBE for pre- and post-contrast imag-ing, and otherwise mostly use 3D imag-ing with fluid sensitive contrast. 3D STIR SPACE provides best fat suppression for the brachial and LS plexus while 3D SPAIR SPACE provides higher SNR along with good fat suppression for extremity imag-ing (Figs. 3, 4). Dixon T2w imaging also provides excellent images of the brachial plexus, however currently can be acquired in 2D mode only (Fig. 5). Others such as 3D PD SPACE with variable echo time can produce similar image quality and allows multiplanar reconstruction (Fig. 6). Cur-rently, 3D STIR SPACE and SPAIR SPACE sequences are most widely used and are time tested. Maximum intensity projec-tions (MIP) of acquired images or their curved planar reformats produce excel-lent quality nerve images along their long axis. It remains to be seen if other tech-niques, such as Dixon with SPACE, can be obtained within acceptable time peri-ods and provide the necessary isotropic spatial and good contrast resolution. 3D nerve selective imaging includes diffusion-weighting (DW) with a small b-value (80–200 s/mm2) to suppress flow-ing blood. It is a fine balance as one adds diffusion gradient to the 3D imaging, as it reduces SNR and can degrade image quality while providing the benefit of vascular flow signal suppression for selec-
3 3D STIR SPACE. 24-year-old man with recent motor vehicle accident and flail right arm. MIP image from coronal 3D STIR SPACE sequence shows transected right L5 nerve (large arrow). Notice torn, retracted and bunched up remaining right brachial plexus (small arrows).
4 SPAIR SPACE. MIP image from coronal 3D SPAIR SPACE sequence shows multifocal nodular enlarge-ment of bilateral sciatic nerves, infiltrated by numerous neurofi-bromas (arrows) in this known case of NF type I.
5 T2 Dixon. MIP image from coro-nal 2D T2 Dixon sequence shows excellent depiction of normal bilat-eral brachial plexuses (arrows) in a healthy volunteer.
6 PD variable 3D SPACE. MIP image from coronal PD variable 3D SPACE sequence shows excellent depiction of normal bilateral bra-chial plexuses (arrows) in a healthy volunteer.
3
4
5
6

6 MAGNETOM Flash · 2/2012 · www.siemens.com/magnetom-world
Clinical Neurology
7 3D DW PSIF. Young woman with persistent carpal tunnel symptoms following a prior transverse carpal ligament release. Notice normal median (large arrow) and ulnar nerves (medium arrow) proximal to the carpal tunnel. A neuroma in continuity is seen along the distal aspect of the carpal tun-nel (smallest arrow). Notice selective nerve depiction with excellent vascular signal sup-pression
8 3D DW SPACE. MIP image from coronal DW 3D STIR SPACE sequence shows selec-tive depiction of normal bilat-eral brachial plexuses (arrows) in a healthy volunteer. How-ever note decreased SNR due to added diffusion compo-nent.
tive nerve imaging. The sequences include 3D DW PSIF (reversed steady state free precession) and DW STIR SPACE. 3D DW PSIF is very susceptible to local inho-mogeneity, motion artifacts, breathing artifacts, and poor fat suppression. Water selective fat suppression currently works well with PSIF [4, 5]. With appropriate technique, it provides excellent nerve selective images (Fig. 7). MIP images from DW PSIF and DW SPACE provide good nerve selective depiction (Fig. 8). With further pulse sequence development, one can look at adding Dixon to DW PSIF or try to improve DW SPACE sequence that can be obtained in acceptable time peri-ods while keep the advantages of nerve selectivity. A typical lumbosacral plexus protocol has been highlighted in Table 1.Normal nerves do not enhance as they are outside the blood-nerve barrier. Contrast imaging (gadolinium based agent) does not add much in trauma or entrapment neuropathy cases as these are mostly subacute cases. In these cases, only denervated muscles enhance, the demonstration of which is already visible on T1w and fat suppressed fluid sensi-tive images. Contrast administration is, however, recommended in other cases, such as suspected neural and perineural mass lesions, polyneuropathy conditions including lymphoma, amyloidosis, demyelinating neuropathies, hereditary neuropathies, etc.Functional imaging of the peripheral nerves primarily includes diffusion ten-sor imaging (DTI). It has been exploited in various extremity and plexus periph-eral nerves in the last few years and continuous refinements are being made. Single shot echo planar imaging (EPI) is the technique used in most centers and multiple diffusion moments (b-values) are applied to obtain functional parame-ter of apparent diffusion coefficient (ADC) [6]. At least 6 directions of interrogation are needed for DTI, although most authors have used 12–20 directions to obtain reproducible data. The authors use 3 diffusion moments (0, 800, 1000 s/mm2) and 12 directions of interrogation. Tight echo spacing, frequency selective fat suppression, auto-shimming before image acquisition and no motion degradation
9 DTI. MIP coronal tensor image with inverted grey scale from axial DTI sequence shows enlarged ulnar nerve with abnor-mally low FA and high ADC val-ues in this case of re-entrapped ulnar nerve at the site of prior anterior transposition (large arrows). Notice normal median nerve (small arrows).
7
8
9
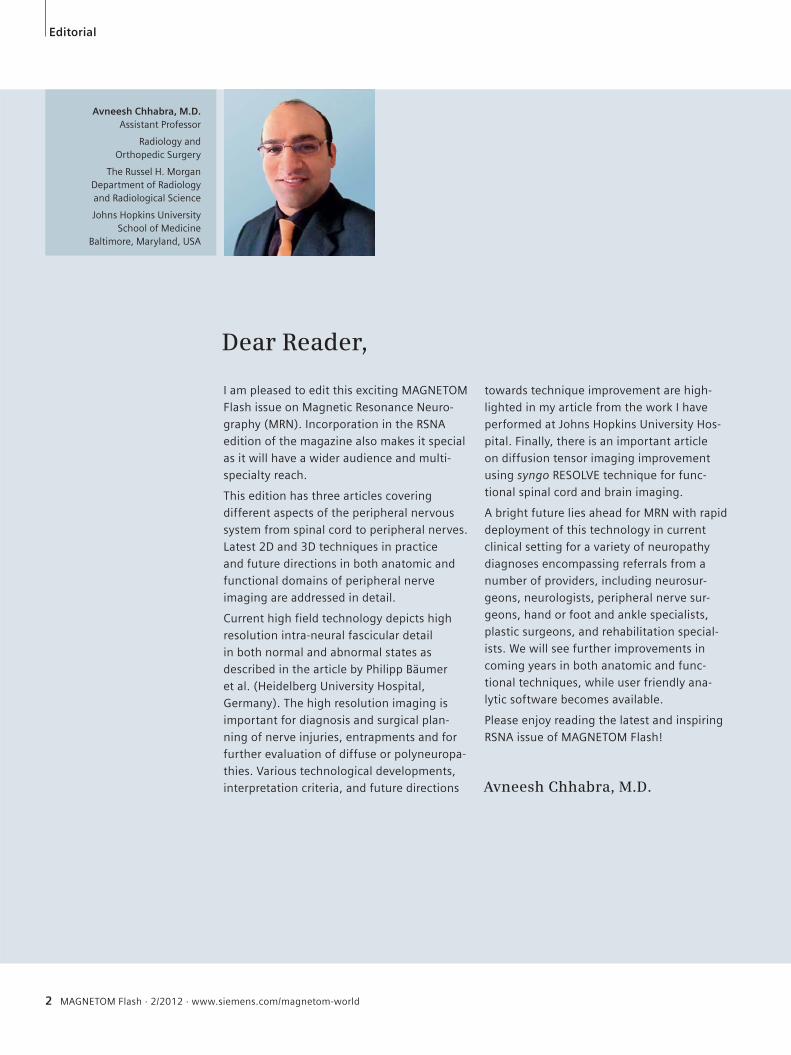
10 3D STIR SPACE and DTI. MIP image from coronal 3D STIR SPACE sequence (10A) shows normal depiction of normal bilateral brachial plexuses in a 39-year-old woman with incidentally detected lesion on chest CT (not shown). A peripheral nerve sheath tumor (large arrow) is nicely depicted in close relation to paraspinal T1 and T2 ganglia (small arrows). The lesion showed high ADC values in keeping with a benign lesion. Tractography image from DTI (10B) shows the nerve roots (small arrows) draped over the lesion (large arrow) without involvement.
MAGNETOM Flash · 2/2012 · www.siemens.com/magnetom-world 7
Neurology Clinical
are essential to obtain good and repro-ducible DTI data. Axial images obtained with 4–5 mm slice thickness with 0 gap can be reconstructed in multiple planes without artifacts (Fig. 9). These images then allow accurate tensor calculation, fractional anisotropy (FA) measurements and tractography. DTI has proven useful in non-invasive pre- and post-operative evaluation of carpal tunnel syndrome patients and peripheral nerve sheath tumors (PNST) as the involved nerves show reduced FA values that improve over time with treatment [7]. The benign
PNSTs show higher ADC values than their malignant counterparts and tractography differences exist among different tumor types depending upon internal fascicular involvement or mere displacement [8] (Fig. 10). Further investigations are under-way to evaluate the role of DTI in other types of neuropathies.
Interpretation pearls and pitfallsWhile image generation is getting easier with high field MR techniques, the radi-ologists should learn to correctly interpret
these high quality examinations. There is a steep learning curve for those who spend time with attention to detail, since nerve architecture is easily visible to the fascicular and perineurium level. One should learn normal nerve anat-omy, variations, diagnostic pearls and pitfalls while obtaining all the informa-tion possible from clinical findings and available electrodiagnostic test results. Electrodiagnostic tests are also limited by false negative or indeterminate results, especially in deeply located nerves. So, while these results are helpful, one
Table 1: The imaging protocol employed in the magnetic resonance neurography examination for the LS plexus.
MR sequence Slice thickness (mm) TR / TE (ms) TF Base resolution (pixels)
Axial T1 4 800 / 12 6 832
Coronal T1 4 960 / 12 5 384
Axial T2 SPAIR 4 4890 / 80 22 256
Sagittal T2 3D SPACE 1 1000 / 97 81 256
Sagittal STIR 4 3700 / 18 22 256
Coronal STIR 3D SPACE 1.5 1500 / 91 41 256
10A 10B

should not get biased by negative results. The reader should follow a step-wise approach to imaging diagnosis:1. Image quality – is it adequate and is
fat suppression uniform? Are the nerves visible adequately and can the nerves be separately evaluated from adjacent vessels or compared side to side if the contralateral portion of body is available, such as in pelvic imaging. Recognize normal nerves and their variations (bifid nerve, split nerve with muscle belly intervening, intramuscu-lar course of the nerve, etc.)
2. Look for orthopedic internal derange-ments which can mimic similar neuro-pathic symptoms or are potential cause of traction neuropathy, such as spondylosis, plantar fasciitis, tibialis posterior dysfunction, etc.
3. Look for clues of disseminated or sys-temic causes of neuropathy: one nerve abnormal over long distance away from entrapment sites or multiple regional nerves abnormal. This may happen in diabetic neuropathy, demyelinating neuropathies, hereditary neuropathy, vasculitis or toxic metabolic condi-tions. Usually hereditary neuropathy results in symmetric disease as com-pared to acquired conditions. Clinical findings should be correlated for insights into above diagnoses.
4. Look for focal area of nerve abnormal-ity, abnormal T2 hyperintensity (approaching adjacent venous signal intensity) and / or fascicular abnor-mality (enlargement / effacement from edema / discontinuity) indicating entrapment or injury in the correct clinical scenario. If the nerve is really abnormal, the signal intensity will per-sist over few to many sections along its length versus signal change from a magic angle artifact. The nerve further enlarges with worsening neu-ropathy forming a pseudoneuroma in entrapment and neuroma in injury (lost partial or complete fascicular continuity with heterogeneous appear-ance) [9]. The nerve abnormality is generally worst at the site of insult and it fades gradually proximally and distally. Abrupt change in nerve inten-sity from bright-black-bright signal
(Triple B sign) usually means severe focal neuropathy and a potential sur-gical case. Painful neuroma in conti-nuity and nerve discontinuity in func-tionally important nerves also require surgical repair/reconstruction. Long standing neuropathy, such as in dia-betes, can lead to atrophic appearance of the nerve with fascicular atrophy and intra-epineurial fatty proliferation / replacement.
5. Evaluate regional muscles. As a rule, the muscle denervation changes are distal to the site of insult. If muscle changes are patchy or widespread in different nerve territories or associ-ated with fascial edema, the diagnosis could be myopathy / myositis rather than denervation change. The diagno-sis can be made with confidence if regional nerves are normal.
6. In case of a mass lesion, further char-acterize the lesion into neural or peri-neural masses. Age, clinical findings and anatomic MRN plus DTI are useful in the imaging evaluation of neural masses. Perineural lesions are further evaluated based on anatomic imaging and contrast evaluation into lipoma, ganglion cyst, hematoma, and abscess etc.
7. Finally, look for prior local surgical changes or nerve repair/reconstruction changes. The signal alteration may persist but in successful cases, the sig-nal decreases within the nerves and denervation changes in the muscle resolve. In worsening nerve degenera-tion cases, the nerve signal approaches fluid signal and persists till the nerve atrophy starts, while the regional muscles undergo continued fatty replacement and atrophy [10]. Corre-lation with prior imaging studies is essential in these cases.
To conclude, magnetic resonance neu-rography is an exciting imaging tech-nique that affords multiplanar anatomic and functional depiction of peripheral nerves and their related lesions. Appro-priate imaging and accurate interpreta-tion are essential components of success-ful performance of this ever advancing technique.
References 1 Chhabra A, Lee PP, Bizzell C, Soldatos T. 3 Tesla
MR neurography-technique, interpretation, and pitfalls. Skeletal Radiol 2011; 40:1249-1260.
2 Chhabra A, Andreisek G, Soldatos T, et al. MR neurography: past, present, and future. AJR Am J Roentgenol 2011; 197:583-591.
3 Vargas MI, Viallon M, Nguyen D, Beaulieu JY, Delavelle J, Becker M. New approaches in imaging of the brachial plexus. Eur J Radiol. 2010 May;74(2):403-10.
4 Zhang Z, Song L, Meng Q, et al. Morphological analysis in patients with sciatica: a magnetic res-onance imaging study using three-dimensional high-resolution diffusion-weighted magnetic resonance neurography techniques. Spine (Phila Pa 1976) 2009; 34:E245-250.
5 Chhabra A, Soldatos T, Subhawong TK, Machado AJ, Thawait SK, Wang KC, Padua A Jr, Flammang AJ, Williams EH, Carrino JA. The application of three-dimensional diffusion-weighted PSIF technique in peripheral nerve imaging of the distal extremities. J Magn Reson Imaging. 2011 Oct;34(4):962-7.
6 Viallon M, Vargas MI, Jlassi H, Lovblad KO, Delavelle J. High-resolution and functional mag-netic resonance imaging of the brachial plexus using an isotropic 3D T2 STIR (Short Term Inver-sion Recovery) SPACE sequence and diffusion tensor imaging. Eur Radiol 2008; 18:1018-1023.
7 Guggenberger R, Eppenberger P, Markovic D, Nanz D, Chhabra A, Pruessmann KP, Andreisek G. MR neurography of the median nerve at 3.0T: Optimization of diffusion tensor imaging and fiber tractography. Eur J Radiol. 2012 Apr 19. [Epub ahead of print]
8 Chhabra A, Thakkar RS, Gustav A et al. Anatomic MR imaging and functional diffusion tensor imaging of peripheral nerve tumor and tumor like conditions. AJNR 2012 (in press).
9 Chhabra A, Williams EH, Wang KC, Dellon AL, Carrino JA. MR neurography of neuromas related to nerve injury and entrapment with surgical cor-relation. AJNR Am J Neuroradiol; 31:1363-1368.
10 Chhabra A, Subhawong TK, Williams EH, Wang KC, Hashemi S, Thawait SK, Carrino JA. High-reso-lution MR neurography: evaluation before repeat tarsal tunnel surgery. AJR Am J Roentgenol. 2011 Jul;197(1):175-83.
Contact Avneesh Chhabra, M.D.Assistant Professor Radiology & Orthopedic SurgeryRussell H Morgan Department of Radiology & Radiological ScienceJohns Hopkins University, Baltimore, [email protected]
Clinical Neurology
8 MAGNETOM Flash · 2/2012 · www.siemens.com/magnetom-world

Missing information?
To make sure you have all the information you need, register for our free monthly newsletter on clinical MRI information. Check out case reports from MAGNETOM users around the world and stay up-to-date with Siemens software applications.
Register at www.siemens.com/magnetom-worldGo to Publications > Subscriptions

10 MAGNETOM Flash · 2/2012 · www.siemens.com/magnetom-world
Clinical Neurology
MR Neurography – Diagnostic Criteria to Determine Lesions of Peripheral NervesPhilipp Bäumer, M.D., M.Sc.1; Sabine Heiland, Ph.D.2; Martin Bendszus, M.D.1; Mirko Pham, M.D.1
1 Department of Neuroradiology, Heidelberg University Hospital, Germany 2 Section of Experimental Radiology, Department of Neuroradiology, Heidelberg University Hospital, Germany
I) Introduction with potential clinical indications
Clinical examination and electrodiagnos-tic testing comprise the traditional meth-ods of diagnostic investigation in periph-eral nerve disease. These are excellent tools to assess function of peripheral nerves but can be limited in localizing
visualization of peripheral nerves at the fascicular level – the fascicle being the first order subunit of a peripheral nerve. The major limitation of clinical and elec-trophysiological examination is precisely the strength of MRN: the exact localiza-tion of nerve lesions. Lesion localization and spatial lesion patterns in the periph-
a lesion. Recent developments in MR scanner and coil technology and the refinement of pulse sequences for increasing structural resolution have allowed imaging of fine details in healthy and diseased peripheral nerve [1, 2]. MR Neurography (MRN) at high magnetic field strength of 3 Tesla allows for the
1 T2-weighted sequence with fat saturation at high resolution allows for imaging of peripheral nerves at the fascicular level. The sciatic nerve is shown here in hereditary NF2 polyneuropathy with various lesions ranging in size from pretumorous microlesions affecting only individual fascicles with no significant caliber change (lower row) to severe caliber thickening and enlargement of the entire nerve cross-section as in true, full-blown schwannomas (upper row, right panel). Modified from Baumer P. et al. Accumulation of non-compressive fascicular lesions underlies NF2 polyneuropathy. J Neurol. 2012, with permission.
1
MAGNETOM Flash · 2/2012 · www.siemens.com/magnetom-world 11
Neurology Clinical
eral nervous system are, as in many diseases of the CNS, arguably among the most important pieces of diagnostic information. One typical example for the use of MRN is the differentiation between spinal nerve root compression (radiculopathy), plexus affection and peripheral nerve lesion (peripheral neuropathy). Another frequent and important situation is the differentiation of a focal mononeuropa-thy, which is potentially surgically ame-nable, from neuropathies with involve-ment of more than one nerve. These oligo- or polyneuropathies almost exclu-sively exhibit a disseminated lesion pat-tern stemming from an inflammatory,
immune-mediated, metabolic or heredi-tary origin, so that nerve surgery is not a primary therapeutic option.In traumatic nerve injuries, exact lesion localization is the central diagnostic step in pre-surgical work-up. The assessment of nerve continuity and the identification of potential scar tissue within and around the nerve yield essential diagnostic infor-mation. In cases of true neuroma with discontinuity of the nerve, early indica-tion for reconstructive nerve surgery by MRN can improve outcome. However, in instances where MRN shows a neu-roma in continuity, surgery may become unnecessary since spontaneous recovery may occur under clinical monitoring.
II) How I do it
a) MRN protocolA magnetic field strength of 3 Tesla is advisable to achieve high-resolution images at the fascicular level of peripheral nerves. We perform clinical examinations on a Siemens MAGNETOM Verio 3 Tesla MR System (Siemens Healthcare, Erlan-gen, Germany) which allows comfortable positioning due to its wide bore diame-ter. The MRN protocol varies depending on the body region of interest and the clinical-diagnostic question. In the vast majority of patients, T2-weighted fat-saturated sequences are acquired, which show high contrast of nerve lesions to
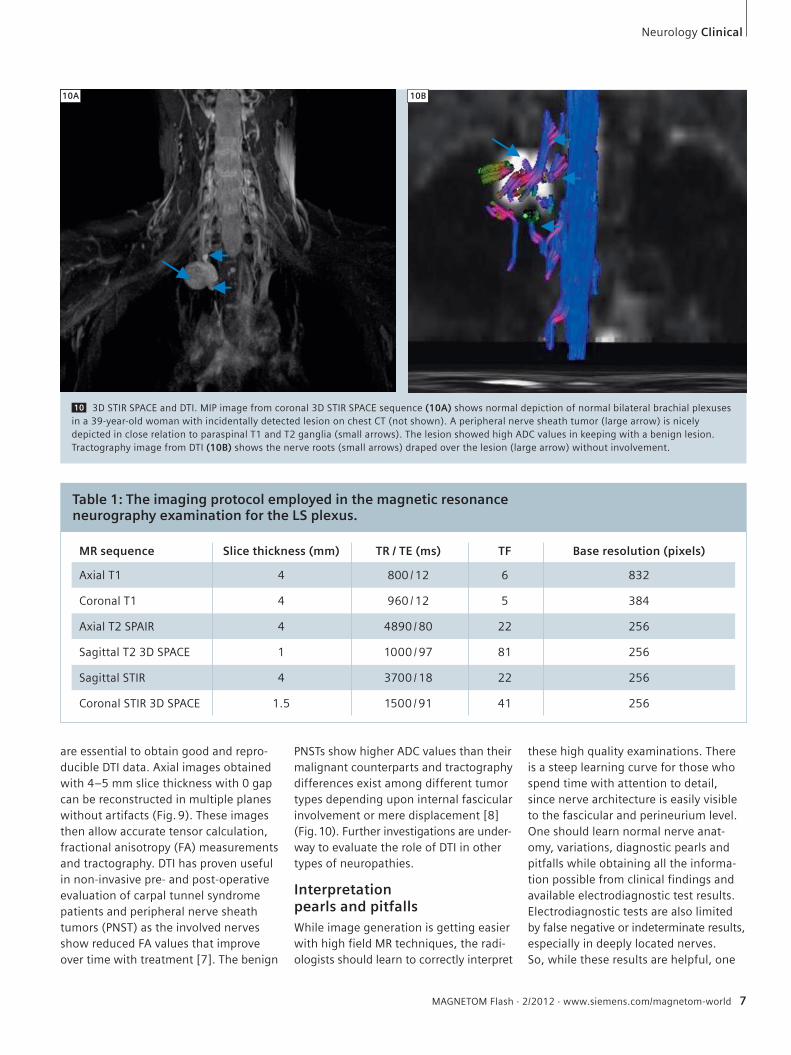
2 Typical findings in cubital tunnel syndrome, a common entrapment neuropathy. The upper row depicts a typical compressive focal ulnar nerve lesion at the elbow from proximal (2A) to distal (2C). Nerve T2w signal and caliber are severely increased compared with healthy control (lower row). Modified from Baumer P. et al. Ulnar neuropathy at the elbow: MR neurography-nerve T2 signal increase and caliber. Radiology. 2011;260(1):199-206, with permission.
2A 2B 2C
2D 2E 2F

3 Inferring the site of nerve lesion from the comprehensive evaluation of muscle denervation patterns. (3A) The denervation pattern in a patient with an L5 lesion addition-ally includes the posterior tibial muscle and the popliteal muscle. (3B) Patient with a lesion of the common peroneal nerve (NPC). The denervation is confined to the extensor com-partment (here shown the anterior tibial mus-cle and extensor digitorum muscle) and the peroneal compartment (long and short pero-neal muscle). Both compartments are known to harbor exactly the target muscles of the common peroneal nerve.
12 MAGNETOM Flash · 2/2012 · www.siemens.com/magnetom-world
Clinical Neurology
4 The magic angle effect occurs in tissue which is densely composed of collagen, such as in tendons, but also peripheral nerve. On the left the increase in T2 relaxation time can be seen as a function of angular deviation of nerve from the main static magnetic field (B0). The first maximum of this cosine type function is reached at 55°. The T2 signal increase is visually apparent (zoomed inserts above graph) at the maximum magic angle position of 55° in comparison with the neutral position (0°). However, true nerve lesions in neuropa-thies of various origins can usually be discrim-inated easily by the much stronger T2 signal increase (right column, traumatic, compres-sive and inflammatory true nerve lesions). Modified from Kaestel et al. AJNR Am J Neuroradiol. 2011 May;32(5):821-7, with permission.
4
surrounding tissue (Fig. 1). This may be complemented by T1-weighted sequences, with and without contrast administration, and T1-VIBE or TrueFISP for 3D reconstruction. T2-weighted SPACE STIR sequences at isotropic voxel size allow for imaging at submillimeter resolution of brachial and lumbosacral plexus structures. CISS may be added for imaging of intradural filaments in cases of trauma. Choosing appropriate radio-frequency coils is crucial for image qual-ity and diagnostic performance. For extremities, we use an 8-channel knee
coil (Siemens Healthcare, Erlangen, Germany) for most regions. For brachial plexus structures, we additionally acquire high-resolution sequences using dedi-cated surface coils (multichannel phased-array 2 element coil, NORAS GmbH, Höchberg, Germany). The applicability of diffusion tensor imaging (DTI) by echo-planar-imaging (EPI) has been investigated for many years [3]. It is currently not used in rou-tine clinical examinations and its diag-nostic accuracy has so far only been studied for carpal tunnel syndrome [4].
Various technical issues may limit the clinical significance of application of EPI DTI in the near future, most importantly its structural resolution, which is signifi-cantly inferior to T2-weighted sequences and constrains its use to large peripheral nerves of the extremities. Segmented EPI could help to overcome these limitations. Extent of coverage of an MRN examina-tion is decided on a case-by-case basis. In the setting of focal nerve damage, the examination can be targeted to one region by different sequences. Occasion-ally, larger coverage of an entire extrem-
3A 3B
Ext
Per
TP P
L5
Ext
Per
NPC
Artificial T2 signalincrease (Magic Angle Effect)
True T2 signalincrease (Lesions)
Trauma
Entrapment
Inflammatory
min. max.
Angle dependent increase of nerve T2 signal
0° 55°

MAGNETOM Flash · 2/2012 · www.siemens.com/magnetom-world 13
Neurology Clinical
5
ity including the plexus and at the same time high resolution may be useful. One such example is the hereditary polyneu-ropathy in neurofibromatosis type II [5] where a large number of microlesions may lead to motor and sensory loss but a single, surgically removable macrolesion must be ruled out. Also, large coverage MRN is able to characterize the spatial pattern of polyneuropathies such as dia-betic polyneuropathy [6].
b) Diagnostic criteriaNerve T2 signal is a highly sensitive and specific diagnostic sign for the presence of neuropathy [7]. Increased T2 signal as a parameter of high pathomorphogical contrast is readily assessed by qualitative visual evaluation. Nerve caliber is a sec-ond important diagnostic sign and, when clearly increased, usually indicates the presence of a more severe neuropathy. Looking beyond the nerves, the denerva-tion pattern of muscles adds crucial infor-
mation [8]. It can help establish the site of a nerve lesion, as in L5 radiculopathy compared to common peroneal neurop-athy (Fig. 3).Contrast enhancement of peripheral nerves is observed in cases of peripheral nerve sheath tumors such as neurofibro-mas, schwannomas and perineuriomas. Whether contrast uptake can discriminate between different tumor entities and dig-nities has not been formally investigated. In cases of potential nerve trauma, nerve continuity is a straightforward but essen-tial criterion when a ‘true’ neuroma has to be discriminated from a neuroma-in-continuity.
c) PitfallsThe magic angle effect causes an increase in T2 of fibrous tissue densely packed with collagen which results in artificially bright signal in T2w images. The magic angle effect depends on the angular orientation of the main longitudinal axis of the inves-
tigated structure (e.g. a tendon or periph-eral nerve) relative to the field direction of the main static magnetic field (B0) and reaches its maximum at 55°. It is related to the interaction of collage bound protons and can also be observed in the peripheral nervous system [9, 10]. Below an angle of < 30° the artifact becomes negligible so that correct positioning of limbs in an MRN examination can usually avoid its occurrence [10]. There are two regions where an oblique anatomical orientation of nerves cannot be avoided in the scan-ner: the supraclavicular brachial plexus and the proximal common peroneal nerve. Hence, in these regions, the magic angle must always be considered in image interpretation.A second pitfall in MRN image interpre-tation is the presence of small epineural (outside the epineurium as the outer nerve sheath), epineurial (inside the epi-neurium), and intraneural vessels (within the interfascicular space). Small veins
5 Traumatic lumbosacral plexus injury. (5A) Coronal SPACE STIR gives an overview of lumbosacral plexus and proximal sciatic nerve. Pseudo-meningoceles of L4 – S 2/3 indicate root avulsions on the right side. (5B) Additional CISS of the lumbosacral spinal canal in coronal reconstruc-tion confirms roots avulsions of L5 – S2. (5C) Axial reconstruction of CISS. Dorsal portions of the right L4 root appear intact at least in their intra-spinal course. (5D) Coronal SPACE STIR maximum intensity projection (MIP) of a normal lumbosacral plexus including the proximal sciatic nerve.
5A 5B 5D
5C
L5
S1
L3
L4
L5
S1
Sciaticnerve
and nerve lesions can have a similar T2 signal intensity. In most cases, small veins are readily discriminated from nerve lesions due to their winded course, strong and relatively homogeneous T2w hyperintense signal, and their eventual anatomical entry or exit into the nerve via its epineurial surface. When in doubt, one proposed method to discriminate the two is to acquire an SSFP sequence [11, 12]. Another approach is to acquire T1-weighted images with fat saturation after administration of contrast media since nerve lesions do not enhance as strongly as vessels.
III) Useful applications of MR Neurographya) Focal compressive and traumatic lesionsTypical frequent referrals for an MRN exam include suspected compressive neuro-pathies such as ulnar neuropathy at the elbow or at the wrist. MRN has a high diagnostic accuracy in confirming or excluding these [7, 13]. Main diagnostic criteria are T2 signal and caliber increase. Other frequent focal neuropathies are traumatic nerve injuries. For patients in whom the region of the nerve lesion is known, MRN is most useful in determin-
ing whether continuity of the nerve is intact as well as the precise localization of neuroma (Fig. 6).In other cases, the exact lesion localiza-tion and pattern can only be established by MRI. This is often the case in plexus injuries where electrodiagnostics are limited (Fig. 5). Precise determination of lesion pattern and lesion localization by MRN allows targeted surgery.
Clinical Neurology
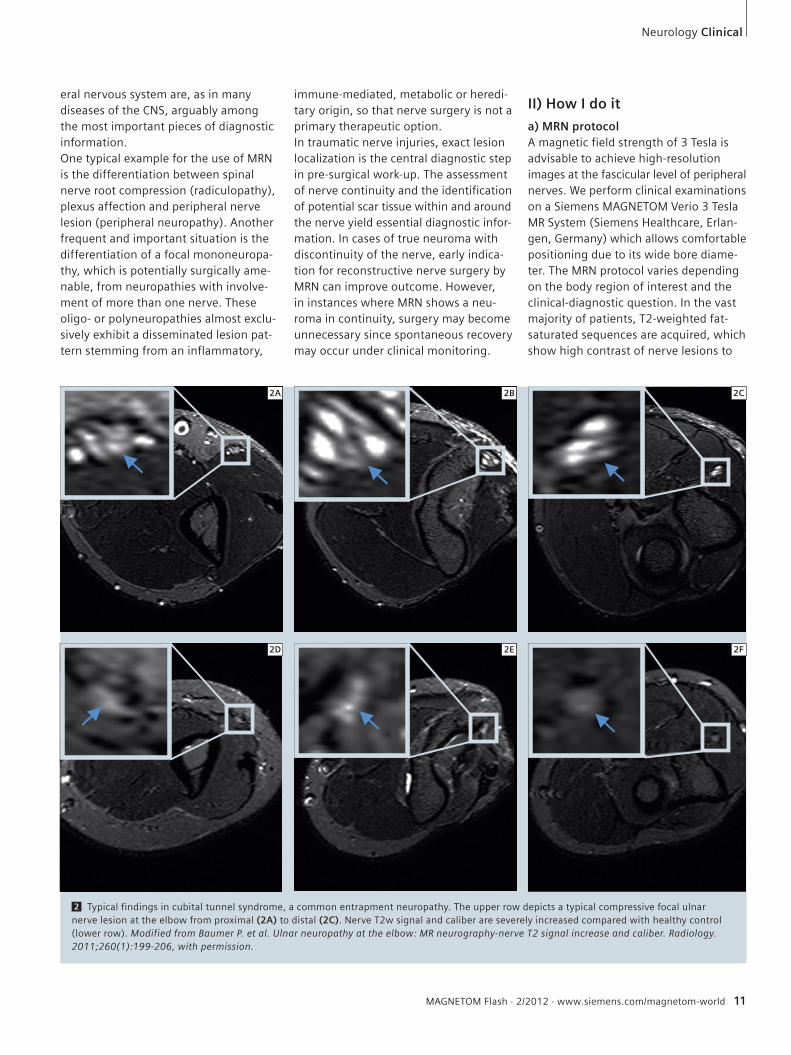
6 Neuroma of sciatic nerve. (6A) Patient with severe trauma and complete disrup-tion of sciatic nerve continu-ity. Proximal neuroma stump with severely swollen, T2w hyperintense fascicles. (6B) Distal neuroma stump with pronounced swelling of epi-neural tissue.
7 Confirmation and local-ization of inflammatory neu-ropathy. (7A) Composed cor-onal SPACE STIR sequence in maximum intensity projec-tion (MIP) provides an over-view of the brachial plexus on both sides. Spinal nerves are well delineated and can be differentiated from each other. Note the severe distal plexus enlargement on the right side. (7B) Additional coronal T2-weighted TIRM gives a high resolution image of the more distal plexus por-tions of truncs and cords. (7C) Sagittal-oblique TIRM through the cords allows pre-cise localization of lesions. In this case the posterior cord is severely enlarged with minor involvement of the lateral and medial cord.
6A 6B
7A
7B
7C
Ifa
v
pf
mf
14 MAGNETOM Flash · 2/2012 · www.siemens.com/magnetom-world

MAGNETOM Flash · 2/2012 · www.siemens.com/magnetom-world 15
b) Disseminated inflammatory lesionsKnown or suspected disseminated nerve lesions require an examination tailored to the needs of the individual patient. In suspected inflammatory neuropathy, the precise spatial pattern of involvement of nerves is diagnostically important for classification and treatment. MRN is an excellent method to investigate this even in the most complex nerve structures like the brachial plexus. Figure 7 illus-trates the precision of the method.
References 1 Bendszus M, Stoll G. Technology insight:
visualizing peripheral nerve injury using MRI. Nat Clin Pract Neurol. 2005;1(1):45-53.
2 Filler AG, Howe FA, Hayes CE, et al. Magnetic resonance neurography. Lancet. 1993;341(8846):659-61.
3 Hiltunen J, Suortti T, Arvela S, Seppa M, Joensuu R, Hari R. Diffusion tensor imaging and tractography of distal peripheral nerves at 3 T. Clin Neurophysiol. 2005;116(10):2315-23.
4 Hiltunen J, Kirveskari E, Numminen J, Lindfors N, Goransson H, Hari R. Pre- and post-operative diffusion tensor imaging of the median nerve in carpal tunnel syndrome. Eur Radiol. 2012;22(6):1310-9.
5 Baumer P, Mautner VF, Baumer T, et al. Accumula-tion of non-compressive fascicular lesions underlies NF2 polyneuropathy. J Neurol. 2012.
6 Pham M, Oikonomou D, Baumer P, et al. Proximal neuropathic lesions in distal symmetric diabetic polyneuropathy: findings of high-resolution magnetic resonance neurography. Diabetes Care. 2011;34(3):721-3.
Contact Philipp Bäumer, M.D., M.Sc.Department of NeuroradiologyHeidelberg University HospitalIm Neuenheimer Feld 40069120 HeidelbergGermanyPhone: +49-6221-56-39670Fax: [email protected]
7 Baumer P, Dombert T, Staub F, et al. Ulnar Neuro-pathy at the Elbow: MR Neurography-Nerve T2 Signal Increase and Caliber. Radiology. 2011;260(1):199-206.
8 Bendszus M, Wessig C, Reiners K, Bartsch AJ, Solymosi L, Koltzenberg M. MR imaging in the differential diagnosis of neurogenic foot drop. AJNR Am J Neuroradiol. 2003;24(7):1283-9.
9 Bydder M, Rahal A, Fullerton GD, Bydder GM. The magic angle effect: a source of artifact, determinant of image contrast, and technique for imaging. J Magn Reson Imaging. 2007;25(2):290-300.
10 Kastel T, Heiland S, Baumer P, Bartsch AJ, Bendszus M, Pham M. Magic Angle Effect: A Relevant Artifact in MR Neurography at 3T? AJNR Am J Neuroradiol. 2011;32(5):821-7.
11 Zhang ZW, Song LJ, Meng QF, et al. High-reso-lution diffusion-weighted MR imaging of the human lumbosacral plexus and its branches based on a steady-state free precession imaging technique at 3T. AJNR Am J Neuroradiol. 2008;29(6):1092-4.
Neurology Clinical
Table 1: Exemplary MRN sequences.
Sequence TR TE TI Slice thickness
Pixel spacing
FOV Matrix Slices Averages Coil
SPACE STIR coronal
3800 267 180 0.8 0.781 x 0.781 250 320/314 72 2 neck (Siemens)
T2 SPAIR sagittal-oblique
5530 45 3.0 0.469 x 0.469 150 320/198 51 4dedicated
surface coil (NORAS GmbH)
T2 fat-saturated axial
7020 52 3.0 0.300 x 0.300 130 512/358 45 3knee 8-channel
phased-array (Siemens)
c) Distal symmetric polyneuropathies such as diabetes mellitus associated PNPIn addition to its manifold clinical appli-cations, MRN contains immense potential for understanding and monitoring the evolution of peripheral nerve disease. In diabetic neuropathy for example, as a typical symmetric polyneuropathy with mainly distal symptoms, the MRN find-ings of a largely proximal lesion pattern are enhancing our understanding of the pathophysiology of the disease. MRN
could for the first time document proxi-mal nerve lesions in-vivo [6]. These find-ings promise a useful research purpose for MRN: to monitor the evolution of nerve lesions in diffuse polyneuropathies and better understand if proximal nerve lesions cumulate to cause distal symp-toms, an intriguing pathomechanisms which so far has not been proven by any other clinical-diagnostic or scientific method of investigating nerve pathology.
12 Chhabra A, Soldatos T, Subhawong TK, et al. The application of three-dimensional diffusion-weighted PSIF technique in peripheral nerve imaging of the distal extremities. J Magn Reson Imaging. 2011;34(4):962-7.
13 Kollmer J, Bäumer P, Milford D, et al. T2 signal of ulnar nerve branches at the wrist in guyon’s canal syndrome. PLoS One. Accepted.

16 MAGNETOM Flash · 2/2012 · www.siemens.com/magnetom-world
Clinical Neurology
High-Resolution DWI in Brain and Spinal Cord with syngo RESOLVE1
Julien Cohen-Adad
Department of Electrical Engineering, Ecole Polytechnique de Montreal, QC, CanadaA. A. Martinos Center for Biomedical Imaging, Massachusetts General Hospital, Harvard Medical School, Charlestown, MA, USA
AbstractIn this paper we present some applica-tions of the syngo RESOLVE1 sequence that enable high-resolution diffusion-weighted imaging. The sequence is based on a readout-segmented EPI strat-egy, allowing susceptibility distortions and T2* blurring to be minimized. The RESOLVE1 sequence can be combined with other acquisition strategies such as reduced field-of-view (FOV) and parallel imaging, to provide state-of-the-art trac-tography of the full brain and cervical spinal cord. The RESOLVE1 sequence could be of particular interest for ultra high field systems where artifacts due to susceptibility and reduced T2 values are more severe. At all field strengths,
pulse sequence introduced by Stejskal and Tanner in 1965 [29], it is possible to quantify the extent of water displacement in a given direction. This sequence con-sists of magnetic field gradient pulses (diffusion-encoding gradients) that are applied before and after a 180° radiofre-quency (RF) refocusing pulse. The first gradient pulse dephases the precessing nuclear spins that generate the signal in MRI. In the theoretical case of static molecules, the second gradient pulse completely rephases the spins and there is no attenuation due to the application of the gradients. However, if water mol-ecules move during the application of this pair of gradients, spins are dephased and signal decreases as a function of the magnitude of the displacement, leading to a so-called diffusion-weighted signal. The magnitude by which the signal is weighted by diffusion is dictated by the so-called b-value, which depends on the length and amplitude of the applied diffusion-encoding gradients, as well as the duration between the first and the second gradient pulse (also called diffusion time). By applying diffusion gradients in various directions (e.g., 20 directions equally sampled on a sphere), it is possi-ble to estimate the rate and direction of water diffusion. For example in pure water, molecules diffuse equally in all directions, hence the diffusion is described as isotropic. Conversely, in mesenchymal structures such as the white matter or muscles, water diffuses preferentially along the direction of the fiber. In such a case, the diffusion is anisotropic [3].
the sequence promises to be useful in a number of clinical applications to characterize the diffusion properties of pathology with high resolution and a low level of image artifact.
1. Introduction1.1. Diffusion-weighted imagingDiffusion-weighted MRI makes it possible to map white matter architecture in the central nervous system based on the mea-surement of water diffusion [11]. The technique works by using MRI sequences that are sensitized to the microscopic motion of water molecules, which are in constant motion in biological tissues (Brownian motion). Using the well-known
1 Tractography in a healthy subject, overlaid on a distortion-free anatomical image (fast spin echo). (1A) shows tractography performed on the raw data (i.e., without correction). (1B) shows tractography performed on the same dataset, after distortion correction using the reversed-gradient technique [13]. A false apparent interruption of the tracts is observed on the data hampered by susceptibility distortions. Acquisition was performed using the standard EPI sequence with the following parameters: sagittal orientation, TR/TE = 4000/86 ms, 1.8 mm isotropic, R = 2 acceleration. Tractography was seeded from a slice located at C1 vertebral level.
1ARaw data Corrected data
1B
1 The software is pending 510(k) clearance, and is not yet commercially available in the United States and in other countries.

1.2. DTI and tractographyAfter acquiring a set of diffusion-weighted data, it is possible to compute a parametric model representing the main diffusion direction at each voxel [2]. This type of model is described by a ten-sor and is usually represented graphically as a 3D ellipsoid. This technique is known as Diffusion Tensor Imaging (DTI) and makes it possible to derive metrics such as fractional anisotropy (FA), mean dif-fusivity and axial and radial diffusivities. These metrics are relevant as they have been shown to correlate with demyelin-ation and axonal degeneration [28] and can therefore be used to obtain markers of demyelination in multiple sclerosis [26], spinal cord injury [7] or amyotrophic lateral sclerosis [8]. Having modeled the diffusion tensor, it is possible to reconstruct global axonal pathways by linking every voxel with a similar eigenvector (principal axis of the diffusion tensor) to its neighbors. This procedure is called fiber tracking or trac-tography [18]. It should be mentioned however that the reconstructed fiber bun-dles do not represent real axonal tracts but rather represent the path where water diffuses preferentially. It is there-fore an indirect measure of axon orien-tation. Hence, tractography results should be handled with care since they may not represent the real pathway of axons [14]. For instance, false negatives could be induced by the presence of crossing fibers, which would artificially
decrease the FA and stop the tracking procedure. Inversely, false positives could be induced by fibrous structures such as scar tissue, in which water diffusion also has anisotropic properties [27]. In such cases, fiber tracking can become fiber tricking.To illustrate the need for caution, Fig-ure 1 shows an example of tractography performed in a healthy subject, before and after correction for susceptibility artifacts, which can induce strong image distortions in the phase-encoding direc-tion (antero-posterior in this example). On the ‘raw data’ (1A), a false apparent interruption of the tracts is clearly observed, and can be misinterpreted as an interruption of the white matter tracts. However, this apparent interrup-tion is simply due to susceptibility distor-tions, as can be seen on the ‘corrected data’ (1B). This result suggests two things: (I) a careful assessment of the image data is essential before further process-ing is applied and (II) susceptibility-induced distortions should be minimized by an appropriate choice of data acquisi-tion technique. This might ultimately reduce the need for quality assessment, which is not often possible in clinical rou-tine. This brings us to the next section on how to reduce susceptibility artifact during the acquisition.
1.3. Artifacts in diffusion-weighted imagingIn this section we will mostly focus on susceptibility artifacts and T2* blurring. Other artifacts exist in diffusion-weighted imaging [15], but are not in the scope of the presence article.Single-shot echo planar imaging (ss-EPI) is an ultra-fast imaging sequence that makes it possible to acquire a full slice within a single repetition time (TR) [16]. To achieve this, spatial encoding gradi-ents are played out rapidly along two gradient axes (e.g. X and Y) in order to sample all raw data (or k-space) points in a ‘single shot’ after an RF excitation pulse. By applying the EPI readout directly after the excitation pulse, a gradient echo image can be generated. Alterna-tively, an RF refocusing pulse can be inserted between the excitation and EPI readout to produce a spin echo image, which has reduced susceptibility-induced signal loss, but has the same sensitivity to susceptibility-based distor-tions. An oscillating readout gradient is applied along one axis (e.g. X), con-sisting of a series of gradient pulses with alternating polarity and each of these readout gradient pulses is used to sam-ple a single line of k-space. A short phase-encoding gradient or ‘blip’ is applied along an orthogonal gradient axis (e.g. Y), so that each readout gradi-ent corresponds to a different line of k-space in the Y direction. While acquisi-tion of a full line a k-space in the read-
MAGNETOM Flash · 2/2012 · www.siemens.com/magnetom-world 17
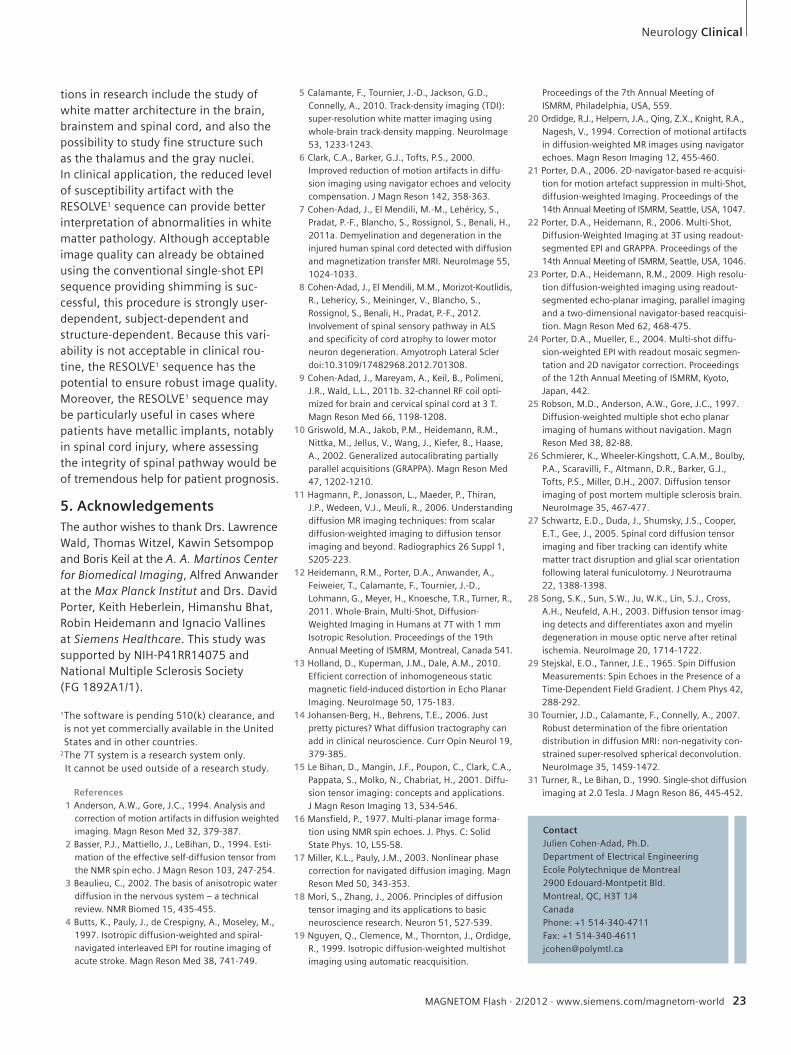
2 The left panel illustrates the origin of the T2* blurring effect, which is caused by T2* dephasing during k-space (raw data) sampling. The right panel illustrates the consequence of a long TE due to the combination of the diffusion-encoding gradients and the extended data sampling interval, resulting in low SNR data.
2
Neurology Clinical
T2* blurring Long TE
RF pulses
Data sampling
180º
90º
MR signalT2*
180º
90º
RF pulses
Data sampling
MR signalT2
TE
18 MAGNETOM Flash · 2/2012 · www.siemens.com/magnetom-world
Clinical Neurology
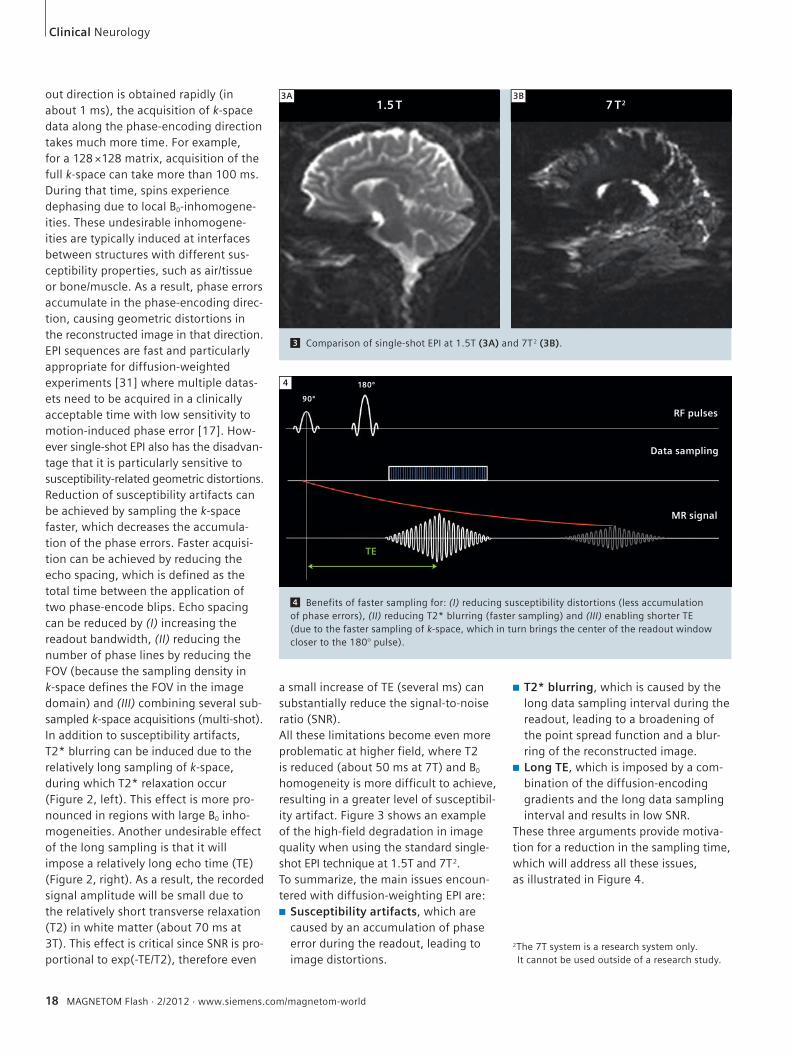
a small increase of TE (several ms) can substantially reduce the signal-to-noise ratio (SNR). All these limitations become even more problematic at higher field, where T2 is reduced (about 50 ms at 7T) and B0 homogeneity is more difficult to achieve, resulting in a greater level of susceptibil-ity artifact. Figure 3 shows an example of the high-field degradation in image quality when using the standard single-shot EPI technique at 1.5T and 7T2.To summarize, the main issues encoun-tered with diffusion-weighting EPI are:■ Susceptibility artifacts, which are
caused by an accumulation of phase error during the readout, leading to image distortions.
■ T2* blurring, which is caused by the long data sampling interval during the readout, leading to a broadening of the point spread function and a blur-ring of the reconstructed image.
■ Long TE, which is imposed by a com-bination of the diffusion-encoding gradients and the long data sampling interval and results in low SNR.
These three arguments provide motiva-tion for a reduction in the sampling time, which will address all these issues, as illustrated in Figure 4.
out direction is obtained rapidly (in about 1 ms), the acquisition of k-space data along the phase-encoding direction takes much more time. For example, for a 128 ×128 matrix, acquisition of the full k-space can take more than 100 ms. During that time, spins experience dephasing due to local B0-inhomogene-ities. These undesirable inhomogene-ities are typically induced at interfaces between structures with different sus-ceptibility properties, such as air/tissue or bone/muscle. As a result, phase errors accumulate in the phase-encoding direc-tion, causing geometric distortions in the reconstructed image in that direction. EPI sequences are fast and particularly appropriate for diffusion-weighted experiments [31] where multiple datas-ets need to be acquired in a clinically acceptable time with low sensitivity to motion-induced phase error [17]. How-ever single-shot EPI also has the disadvan-tage that it is particularly sensitive to susceptibility-related geometric distortions. Reduction of susceptibility artifacts can be achieved by sampling the k-space faster, which decreases the accumula-tion of the phase errors. Faster acquisi-tion can be achieved by reducing the echo spacing, which is defined as the total time between the application of two phase-encode blips. Echo spacing can be reduced by (I) increasing the readout bandwidth, (II) reducing the number of phase lines by reducing the FOV (because the sampling density in k-space defines the FOV in the image domain) and (III) combining several sub-sampled k-space acquisitions (multi-shot).In addition to susceptibility artifacts, T2* blurring can be induced due to the relatively long sampling of k-space, during which T2* relaxation occur (Figure 2, left). This effect is more pro-nounced in regions with large B0 inho-mogeneities. Another undesirable effect of the long sampling is that it will impose a relatively long echo time (TE) (Figure 2, right). As a result, the recorded signal amplitude will be small due to the relatively short transverse relaxation (T2) in white matter (about 70 ms at 3T). This effect is critical since SNR is pro-portional to exp(-TE/T2), therefore even
4 Benefits of faster sampling for: (I) reducing susceptibility distortions (less accumulation of phase errors), (II) reducing T2* blurring (faster sampling) and (III) enabling shorter TE (due to the faster sampling of k-space, which in turn brings the center of the readout window closer to the 180° pulse).
4
3 Comparison of single-shot EPI at 1.5T (3A) and 7T2 (3B).
2The 7T system is a research system only. It cannot be used outside of a research study.
3A1.5 T
180º
90º
RF pulses
Data sampling
MR signal
TE
7 T23B

MAGNETOM Flash · 2/2012 · www.siemens.com/magnetom-world 19
Neurology Clinical
2. Multi-shot techniques and syngo RESOLVE1
As described in the previous section, susceptibility artifacts and T2* blurring can be reduced by decreasing the sam-pling time (or the effective echo spac-ing). In EPI, this can be done by skipping lines of k-space in the phase-encoding direction (also called interleaved EPI). Multi-shot techniques consist of acquir-ing several sub-sampled images and combining them to reconstruct a full k-space data set. An example of a 2-shot interleaved EPI acquisition is illustrated in Figure 5. In this approach, the first image is acquired by only filling even lines of k-space, while the second image is acquired by filling the odd lines. Then, both data sets are combined in order to obtain the full k-space data that is required for image reconstruction. The key aspect is that each of the sub-sampled data sets is acquired twice as fast as in the single-shot case, which reduces the effective echo spacing by a factor two, and hence also reduces the distortions by a factor of 2. However, one disadvantage of the interleaved EPI approach is that the overall acquisition time is longer than single-shot techniques (because multiple TR intervals are required acquire all data required to form an image). Another disadvantage is that phase errors due to motion (from subject or physiology) can occur between the acquisition of different interleaves, which can lead to severe ghosting arti-facts [6]. To overcome the mismatch between different data interleaves, one can acquire navigator echoes that monitor phase errors and correct them before image reconstruction. At their introduc-tion, navigator echoes consisted in sin-gle line of k-space acquired at the cen-ter, which was used to apply a linear phase correction in the readout direction [1, 20]. Later, 2D navigator echoes enabled linear phase correction both in the readout- and in the phase-encoding directions [4]. More recently, non-linear approaches have been introduced [17], which is particularly important for diffu-sion-weighted imaging of the brain, where cerebrospinal fluid pulsation leads
6 Schematic of k-space acquired using a conventional single-shot EPI (left), phase-segmented or interleaved EPI (middle) and readout-segmented EPI (right). In the phase-segmented EPI, the data for each shot is sub-sampled in the phase-encoding direction, which induces aliasing and therefore difficulties in correcting for phase-to-phase errors using advanced 2D non-linear tech-niques. However in readout-segmented EPI, all phase-encode lines are acquired in each shot, therefore there is no aliasing.
to non-rigid-body brain motion that results in non-linear phase errors if the motion occurs during the application of the diffusion-encoding gradients. 2D non-linear phase correction is most easily applied when each shot in the multi-shot data acquisition samples a contiguous set of data points from a sub-region of k-space. In this case, the Nyquist sampling condition is fulfilled and the phase correction can be applied as a complex multiplication in image space. The interleaved EPI sampling scheme does not fulfill this local Nyquist sampling condition and results in aliased signal contributions that complicate the phase correction procedure.
2.1. Readout-segmented EPIAn alternative to the interleaved approach is to perform readout-segmented EPI [25]. In readout-segmented EPI, k-space
is filled with a series of concatenated segments in the readout direction (Fig-ure 6), corresponding to shorter readout gradient pulses and an overall reduction in the length of the EPI readout As with interleaved EPI, the shorter readout time results in a reduction in the level of susceptibility-based distortion.
2.2. Diffusion-weighted readout-segmented EPIOne advantage of readout-segmented EPI compared to phase-segmented (or interleaved) EPI is that each segment consists of a Nyquist-sampled region of k-space that is well suited to the applica-tion of 2D non-linear phase correction, as described above. This property of the readout-segmented EPI sampling scheme was first exploited by Porter et al. [24] who proposed the sequence shown in figure 7 for application to diffusion-
5 Segmented EPI along the phase-encode direction (interleaved EPI). (I) Acquire several shots of sub-sampled k-space, (II) concatenate all shots and (III) reconstruct image. Each shot is sub-sampled, resulting in a shorter data sampling interval and reduced distortion.
5First shot Second shot Combined shots
single-shot EPI phase-segmented readout-segmented6
under-sampled phase (aliasing) fully sampled phase

20 MAGNETOM Flash · 2/2012 · www.siemens.com/magnetom-world
weighted imaging. The sequence con-sists of an imaging echo, which is used to sample the standard readout-seg-mented EPI data, and a 2D navigator echo, in which a low resolution EPI read-out is used to sample the center of k-space at each shot. The sequence was subsequently modified to support paral-lel imaging [22] using GRAPPA [10]. This made it possible to further shorten the readout time with a corresponding addi-tional reduction in the level of suscepti-bility artifact. The resulting sequence has been given the acronym RESOLVE1 (Readout Segmentation Of Long Variable Echo-trains).
2.3. Reacquisition techniqueIn some cases, the level of motion-induced phase error can be too severe for a reli-able phase correction due to signal voids in the navigator images. Although physi-ological gating strategies can be employed to mitigate these effects, they do not address all sources of motion and can significantly increase acquisition time. To avoid the residual artifacts associated with these occasional extreme phase errors, the RESOLVE1 sequence uses a reacquisition strategy to identify and re-measure corrupt readout segments that cannot be reliably phase corrected. This method is based on an original concept that was proposed for interleaved EPI and 1D navigator echoes [19], but uses
an adapted real-time algorithm, which has been optimized for the combination of 2D navigator data and the readout-segmented EPI sampling scheme [21].For a comprehensive description of the RESOLVE1 sequence, including the adap-tions for parallel imaging and data reac-quisition, the reader is referred to [23].
3. Application of the RESOLVE1 sequenceTo illustrate the benefits of the RESOLVE1 sequence, Figure 8 shows a comparison between the conventional single-shot EPI (8A) and RESOLVE1 (8B). Acquisition parameters were: RESOLVE: Axial slices, TR 3800 ms, TE 80 ms, 4 nex, 12-4 mm thick slices with 0.4 mm gap, 320 × 256 matrix, b=700 s/mm2 only in slice direction (S-I), GRAPPA x 2, segment 21, FOV 163 mm, acquisition time 6–7 min (depending on reacquisition). Single-shot EPI: Axial slices, TR 3800 ms, TE 102 ms, 32 nex, 12–4 mm thick slices with 0.4 mm gap, 192 × 192 matrix, b=700 s/mm2 only in slice direction (S-I), GRAPPA x 2, FOV 220 mm, acquisition time 2 min 15 sec. All scans were performed at 3T using a 32-channel array head coil.Images represent an axial mean diffu-sion-weighted image located in the lower brain region, which is well-known for its susceptibility artifacts due to the
Clinical Neurology
sinuses and temporal poles. In the ss-EPI image, strong susceptibility artifacts can be observed as image and signal distortions. For example, the temporal region not only shows image distortion along the phase-encoding direction (antero-posterior), but also shows increase of signal intensity caused by the overlap of distorted voxels (arrow). This spurious signal increase could be falsely interpreted as pathological. Conversely in the RESOLVE1 image, the same region shows a substantial reduction in this susceptibility artifact. In addition, an overall blurring can be observed on the ss-EPI image, which is caused by the relatively long k-space sampling relative to the T2* decay. Reducing the sampling time also reduces this T2* blurring, as can be seen on the RESOLVE1 image, where the image appears sharper, making it possible to delineated white and gray matter with greater precision.
3.1. 1×1×1 mm3 resolution full brain at 7TWith the RESOLVE1 sequence it is possible to acquire high-resolution images with-out the large increase in susceptibility and T2* artifacts that would affect an ss-EPI acquisition. In one study at 7T, the sequence was used to perform full brain diffusion-weighted imaging at 1×1×1 mm3 resolution [12]. The study was performed on a whole-body scanner (MAGNETOM 7T2, Siemens Healthcare, Erlangen, Germany) with a 24-channel RF receive coil (Nova Medical, Wilmington, MA, USA). Acquisition parameters were: 104 axial slices, matrix 220×220, FOV 220 mm, slice thickness 1 mm (no gap), TR 7500 ms, TE 76 ms, 7 readout seg-ments, 30 diffusion-weighting directions at a b-value of 1000 s/mm2, acquisition time was 78 min. The diffusion-weighted images were filtered with a two-stage hybrid image restoration procedure, cor-rected for subject motion and registered to a T1-weighted anatomical image (1 mm resolution) of the same partici-pant. For each voxel, multiple fiber ori-entations were modeled by constrained spherical deconvolution [30] followed by whole-brain fiber-tracking using
7
7 Simplified pulse diagram of the RESOLVE sequence (gradients are not represented).
7
RF
180º
90º
180º
ADC
Echo
Stejskal-Tanner spinn echo EPI
imaging echo navigator echo

MAGNETOM Flash · 2/2012 · www.siemens.com/magnetom-world 21
Neurology Clinical
MRtrix (http://www.brain.org.au/soft-ware)3. Figure 9 shows results of the fiber orien-tation distribution function (ODF) and tractography centered over the pre-motor cortex. The spatial consistency of the fiber ODF demonstrates the high SNR of the data (Figure 9B). Tractography suc-cessfully demonstrated intersection of the corpus callosum (CC, pink), the corona radiata (CR, blue) and the supe-rior longitudinal fasciculus (SLF, green, tracks not shown).The same data were processed using track-density imaging [5], which makes it possible to reconstruct fiber bundles at 200 µm resolution. Figure 10 shows the results at the three orientations in order to appreciate the 1 mm isotropic resolution. The views are centered over the thalamus. The ultra-high resolution in combination with high SNR and low susceptibility artifacts provide an unprecedented level of detail about the anatomical organization of the thala-mus. The ability of the sequence to pro-vide full brain coverage at an isotropic resolution of 1 mm made it possible to reconstruct track density images of the whole brain with no orientation bias.
3.2. Spinal cord DTI at 3TAnother powerful application of the RESOLVE sequence is the spinal cord. Indeed, spinal cord DTI is particularly challenging due to (I) the small cross-sectional size of the spinal cord, which requires high spatial resolution, result-ing in low SNR at standard imaging times; (II) susceptibility artifacts, which are caused by inhomogeneous magnetic field in the spinal region due to the close proximity of tissue with very different magnetic susceptibility (tissue, bone, air, cartilage) and (III) physiological-related motion due to respiration, heart beat, cerebrospinal fluid pulsation. The first two arguments (small size and suscepti-bility artifacts) are particularly well suited for the RESOLVE1 sequence, as this
10 Track density image with 200 µm resolution. Fine details of the structure of the thalamus are visible. Image courtesy of Drs. Robin Heidemann and Alfred Anwander, MPI Leipzig, Germany.
10Full brain @
1 mm resolution
sagittal coronal axial
9 High angular resolution diffusion imaging results from 1 mm isotropic resolution. (9A) Coronal view centered in the pre-motor region at the intersection between corpus callo-sum (CC), superior longitudinal fasciculus (SLF) and corona radiate (CR). (9B) Orientation distribution functions (ODF) showing crossing of the major pathways. (9C) Tractography results showing intersection of the CC (pink) and CR (blue). Images courtesy of Drs. Robin Heidemann and Alfred Anwander, MPI Leipzig, Germany.
9A 9B 9C
8 Comparison of standard single-shot EPI sequence (8A) and syngo RESOLVE1 (8B). Susceptibility distortions are substantially reduced on the RESOLVE1 image. For example, the temporal region of the ss-EPI image not only shows image distortion along the phase-encoding direction (antero-posterior), but also shows an increase in signal intensity caused by the over-lap of distorted voxels (arrow). Sharper image with RESOLVE1 also comes from faster sampling, via reduction of T2* blurring. Images courtesy of Professor Naganawa, Nagoya University School of Medicine, Japan.
87
8A
ss-EPI DWI
8B
syngo RESOLVE1
3MRtrix is not a Siemens Healthcare product. Siemens bears no responsibility for this product including, but not limited to, its regulatory status. Further information about the software can be found at the website listed.

11
sequence provides high SNR and enables reduction of susceptibility distortions. The last challenge (physiological motion) is a typical cause of failure for segmented approaches, however the non-linear 2D phase correction com-bined with the reacquisition scheme enabled in the RESOLVE1 sequence ensures low sensitivity to physiological motion. An example of the RESOLVE1 in the spinal cord is shown in Figure 11. To further improve image quality, the RESOLVE1 sequence was used with parallel imag-ing using the GRAPPA algorithm [10] to further reduce susceptibility artifacts and shorten the TE. To maximize the capabilities of parallel imaging, a dedi-cated 32-channel head/spine coil was used, which enables up to 4× accelera-tion [9]. Acquisition parameters were: 1.7 mm isotropic, 3 shots, R = 3 acceler-ation (iPAT3), TE 74 ms, Cardiac gating, b 800 s/mm2, 30 directions, acquisition time 8 min. The sequence only used 3 shots (i.e., 3 segments per k-space), therefore the acquisition was relatively short. Although minor distortions are still visible on the b = 0 image at the level of each intervertebral disk, the spi-nal cord itself is not affected by these intervertebral distortions as assessed by the mean diffusion-weighted image, the fractional anisotropy (FA) map and the
FA color map. Note the particularly high spatial resolution (1.7 mm isotropic, 4.9 mm3 voxel volume), which is rarely achieved in spinal cord imaging.One particularly difficult acquisition is when one wants to image the full brain and spinal cord. The challenge of B0-inhomogeneity can be partially overcome when only the spinal cord is imaged by adjusting the shim volume within an elongated box that nicely encompasses the spinal cord. However, when the FOV includes both the brain and spinal cord, it is a difficult for the shimming algorithm to find appropriate fitting coefficients for ensuring B0-homogeneity both in the brain and spinal cord, due to the complex geometry and the presence of several susceptibil-ity interfaces (sinuses, temporal poles, brainstem, intervertebral disks and lungs). This type of acquisition is there-fore particularly well-suited to the RESOLVE1 sequence.Images were acquired with the following parameters: 2.2 mm isotropic resolution, matrix 138 × 104, TR ~ 15000 ms (car-diac gating), TE 66 ms, 3 shots, R = 3 acceleration, b 800 s/mm2, 30 diffusion-weighting directions, acquisition time 10:45 min. Images were further corrected for residual susceptibility-distortions in the thoracic region (due to the close prox-imity with the lungs), using the reversed
gradient technique [13]. Tractography was performed using the Diffusion Tool-kit3 (deterministic FACT algorithm) and displayed with TrackVis3 (http://www.trackvis.org/). Diffusion-weighted images were then registered to the 1 mm isotro-pic anatomical image (MPRAGE). Results are shown in Figure 12 and demonstrate reduction of susceptibility artifacts, enabling to explore connections within and between the brain, brainstem and cervical spinal cord.
4. Conclusionsyngo RESOLVE1 is a useful sequence for acquiring high-quality diffusion-weighted images thanks to the reduction of sus-ceptibility distortion, reduction of T2* blurring, shorter TE (and hence high SNR) and robust correction for motion-induced artifacts. The RESOLVE sequence has shown promising tractography results in the brain and spinal cord, the latter being known for suffering from severe susceptibility artifacts using standard sequences. The RESOLVE sequence can be combined with other acquisition strategies such as reduced field-of-view and parallel imaging. Potential applica-
11 Human cervical spinal cord. 1.7 mm isotropic, 3 shots, R = 3, TE 74 ms, Cardiac gating, b 800 s/mm2, 30 directions in 8 min.
12 Sagittal view of the mean diffusion-weighted images (12A) and fiber tractography overlaid on the anatomical image (12B). Almost no distortions are observed, which makes it possible to explore white matter connections from cortical areas down to the spinal cord without spurious interruptions.
22 MAGNETOM Flash · 2/2012 · www.siemens.com/magnetom-world
b = 0 Mean DWI Tractography
12A 12B11A 11B
mean DWI
11C
FA
11D
colormap
3Diffusion Toolkit and TrackVis are not Siemens Healthcare products. Siemens bears no responsibility for these products including, but not limited to, their regulatory status. Further information about the software can be found at the website listed.
tions in research include the study of white matter architecture in the brain, brainstem and spinal cord, and also the possibility to study fine structure such as the thalamus and the gray nuclei. In clinical application, the reduced level of susceptibility artifact with the RESOLVE1 sequence can provide better interpretation of abnormalities in white matter pathology. Although acceptable image quality can already be obtained using the conventional single-shot EPI sequence providing shimming is suc-cessful, this procedure is strongly user-dependent, subject-dependent and structure-dependent. Because this vari-ability is not acceptable in clinical rou-tine, the RESOLVE1 sequence has the potential to ensure robust image quality. Moreover, the RESOLVE1 sequence may be particularly useful in cases where patients have metallic implants, notably in spinal cord injury, where assessing the integrity of spinal pathway would be of tremendous help for patient prognosis.
5. AcknowledgementsThe author wishes to thank Drs. Lawrence Wald, Thomas Witzel, Kawin Setsompop and Boris Keil at the A. A. Martinos Center for Biomedical Imaging, Alfred Anwander at the Max Planck Institut and Drs. David Porter, Keith Heberlein, Himanshu Bhat, Robin Heidemann and Ignacio Vallines at Siemens Healthcare. This study was supported by NIH-P41RR14075 and National Multiple Sclerosis Society (FG 1892A1/1).
References 1 Anderson, A.W., Gore, J.C., 1994. Analysis and
correction of motion artifacts in diffusion weighted imaging. Magn Reson Med 32, 379-387.
2 Basser, P.J., Mattiello, J., LeBihan, D., 1994. Esti-mation of the effective self-diffusion tensor from the NMR spin echo. J Magn Reson 103, 247-254.
3 Beaulieu, C., 2002. The basis of anisotropic water diffusion in the nervous system – a technical review. NMR Biomed 15, 435-455.
4 Butts, K., Pauly, J., de Crespigny, A., Moseley, M., 1997. Isotropic diffusion-weighted and spiral-navigated interleaved EPI for routine imaging of acute stroke. Magn Reson Med 38, 741-749.
Contact Julien Cohen-Adad, Ph.D.Department of Electrical EngineeringEcole Polytechnique de Montreal2900 Edouard-Montpetit Bld.Montreal, QC, H3T 1J4CanadaPhone: +1 514-340-4711Fax: +1 [email protected]
5 Calamante, F., Tournier, J.-D., Jackson, G.D., Connelly, A., 2010. Track-density imaging (TDI): super-resolution white matter imaging using whole-brain track-density mapping. NeuroImage 53, 1233-1243.
6 Clark, C.A., Barker, G.J., Tofts, P.S., 2000. Improved reduction of motion artifacts in diffu-sion imaging using navigator echoes and velocity compensation. J Magn Reson 142, 358-363.
7 Cohen-Adad, J., El Mendili, M.-M., Lehéricy, S., Pradat, P.-F., Blancho, S., Rossignol, S., Benali, H., 2011a. Demyelination and degeneration in the injured human spinal cord detected with diffusion and magnetization transfer MRI. NeuroImage 55, 1024-1033.
8 Cohen-Adad, J., El Mendili, M.M., Morizot-Koutlidis, R., Lehericy, S., Meininger, V., Blancho, S., Rossignol, S., Benali, H., Pradat, P.-F., 2012. Involvement of spinal sensory pathway in ALS and specificity of cord atrophy to lower motor neuron degeneration. Amyotroph Lateral Scler doi:10.3109/17482968.2012.701308.
9 Cohen-Adad, J., Mareyam, A., Keil, B., Polimeni, J.R., Wald, L.L., 2011b. 32-channel RF coil opti-mized for brain and cervical spinal cord at 3 T. Magn Reson Med 66, 1198-1208.
10 Griswold, M.A., Jakob, P.M., Heidemann, R.M., Nittka, M., Jellus, V., Wang, J., Kiefer, B., Haase, A., 2002. Generalized autocalibrating partially parallel acquisitions (GRAPPA). Magn Reson Med 47, 1202-1210.
11 Hagmann, P., Jonasson, L., Maeder, P., Thiran, J.P., Wedeen, V.J., Meuli, R., 2006. Understanding diffusion MR imaging techniques: from scalar diffusion-weighted imaging to diffusion tensor imaging and beyond. Radiographics 26 Suppl 1, S205-223.
12 Heidemann, R.M., Porter, D.A., Anwander, A., Feiweier, T., Calamante, F., Tournier, J.-D., Loh mann, G., Meyer, H., Knoesche, T.R., Turner, R., 2011. Whole-Brain, Multi-Shot, Diffusion-Weighted Imaging in Humans at 7T with 1 mm Isotropic Resolution. Proceedings of the 19th Annual Meeting of ISMRM, Montreal, Canada 541.
13 Holland, D., Kuperman, J.M., Dale, A.M., 2010. Efficient correction of inhomogeneous static magnetic field-induced distortion in Echo Planar Imaging. NeuroImage 50, 175-183.
14 Johansen-Berg, H., Behrens, T.E., 2006. Just pretty pictures? What diffusion tractography can add in clinical neuroscience. Curr Opin Neurol 19, 379-385.
15 Le Bihan, D., Mangin, J.F., Poupon, C., Clark, C.A., Pappata, S., Molko, N., Chabriat, H., 2001. Diffu-sion tensor imaging: concepts and applications. J Magn Reson Imaging 13, 534-546.
16 Mansfield, P., 1977. Multi-planar image forma-tion using NMR spin echoes. J. Phys. C: Solid State Phys. 10, L55-58.
17 Miller, K.L., Pauly, J.M., 2003. Nonlinear phase correction for navigated diffusion imaging. Magn Reson Med 50, 343-353.
18 Mori, S., Zhang, J., 2006. Principles of diffusion tensor imaging and its applications to basic neuroscience research. Neuron 51, 527-539.
19 Nguyen, Q., Clemence, M., Thornton, J., Ordidge, R., 1999. Isotropic diffusion-weighted multishot imaging using automatic reacquisition.
Proceedings of the 7th Annual Meeting of ISMRM, Philadelphia, USA, 559.
20 Ordidge, R.J., Helpern, J.A., Qing, Z.X., Knight, R.A., Nagesh, V., 1994. Correction of motional artifacts in diffusion-weighted MR images using navigator echoes. Magn Reson Imaging 12, 455-460.
21 Porter, D.A., 2006. 2D-navigator-based re-acquisi-tion for motion artefact suppression in multi-Shot, diffusion-weighted Imaging. Proceedings of the 14th Annual Meeting of ISMRM, Seattle, USA, 1047.
22 Porter, D.A., Heidemann, R., 2006. Multi-Shot, Diffusion-Weighted Imaging at 3T using readout-segmented EPI and GRAPPA. Proceedings of the 14th Annual Meeting of ISMRM, Seattle, USA, 1046.
23 Porter, D.A., Heidemann, R.M., 2009. High resolu-tion diffusion-weighted imaging using readout-segmented echo-planar imaging, parallel imaging and a two-dimensional navigator-based reacquisi-tion. Magn Reson Med 62, 468-475.
24 Porter, D.A., Mueller, E., 2004. Multi-shot diffu-sion-weighted EPI with readout mosaic segmen-tation and 2D navigator correction. Proceedings of the 12th Annual Meeting of ISMRM, Kyoto, Japan, 442.
25 Robson, M.D., Anderson, A.W., Gore, J.C., 1997. Diffusion-weighted multiple shot echo planar imaging of humans without navigation. Magn Reson Med 38, 82-88.
26 Schmierer, K., Wheeler-Kingshott, C.A.M., Boulby, P.A., Scaravilli, F., Altmann, D.R., Barker, G.J., Tofts, P.S., Miller, D.H., 2007. Diffusion tensor imaging of post mortem multiple sclerosis brain. NeuroImage 35, 467-477.
27 Schwartz, E.D., Duda, J., Shumsky, J.S., Cooper, E.T., Gee, J., 2005. Spinal cord diffusion tensor imaging and fiber tracking can identify white matter tract disruption and glial scar orientation following lateral funiculotomy. J Neurotrauma 22, 1388-1398.
28 Song, S.K., Sun, S.W., Ju, W.K., Lin, S.J., Cross, A.H., Neufeld, A.H., 2003. Diffusion tensor imag-ing detects and differentiates axon and myelin degeneration in mouse optic nerve after retinal ischemia. NeuroImage 20, 1714-1722.
29 Stejskal, E.O., Tanner, J.E., 1965. Spin Diffusion Measurements: Spin Echoes in the Presence of a Time-Dependent Field Gradient. J Chem Phys 42, 288-292.
30 Tournier, J.D., Calamante, F., Connelly, A., 2007. Robust determination of the fibre orientation distribution in diffusion MRI: non-negativity con-strained super-resolved spherical deconvolution. NeuroImage 35, 1459-1472.
31 Turner, R., Le Bihan, D., 1990. Single-shot diffusion imaging at 2.0 Tesla. J Magn Reson 86, 445-452.
MAGNETOM Flash · 2/2012 · www.siemens.com/magnetom-world 23
Neurology Clinical
1 The software is pending 510(k) clearance, and is not yet commercially available in the United States and in other countries.
2The 7T system is a research system only. It cannot be used outside of a research study.

On account of certain regional limitations of sales rights and service availability, we cannot guarantee that all products included in this brochure are available through the Siemens sales organization worldwide. Availability and packaging may vary by country and is subject to change without prior notice. Some/All of the features and products described herein may not be available in the United States.
The information in this document contains general technical descriptions of specifications and options as well as standard and optional features which do not always have to be present in individual cases.
Siemens reserves the right to modify the design, packaging, specifications and options described herein without prior notice. Please contact your local Siemens sales representative for the most current information.
Note: Any technical data contained in this document may vary within defined tolerances. Original images always lose a certain amount of detail when reproduced.
www.siemens.com/healthcare-magazine
Global Business Unit
Siemens AGMedical SolutionsMagnetic ResonanceHenkestr. 127DE-91052 ErlangenGermanyPhone: +49 9131 84-0www.siemens.com/healthcare
Local Contact Information
AsiaSiemens Pte LtdThe Siemens Center60 MacPherson RoadSingapore 348615Phone: +65 6490-8096
CanadaSiemens Canada LimitedMedical Solutions2185 Derry Road WestMississauga ON L5N 7A6CanadaPhone: +1 905 819-5800
Europe/Africa/Middle EastSiemens AGMedical SolutionsHenkestr. 12791052 ErlangenGermanyPhone: +49 9131 84-0
Latin AmericaSiemens S.A.Medical SolutionsAvenida de Pte. Julio A. Roca No 516, Piso 7C1067ABN Buenos Aires ArgentinaPhone: +54 11 4340-8400
USASiemens Medical Solutions U.S.A., Inc.51 Valley Stream ParkwayMalvern, PA 19355 -1406USAPhone: +1-888-826-9702
Global SiemensHealthcare Headquarters
Siemens AGHealthcare SectorHenkestrasse 12791052 ErlangenGermanyPhone: +49 9131 84-0www.siemens.com/healthcare
Global Siemens Headquarters
Siemens AGWittelsbacherplatz 280333 MuenchenGermany
Order No. A91MR-1000-92C-7600 | Printed in Germany | CC 170 111230. | © 11.12, Siemens AG