
Neurobiology of Aging, 51: 178.e1-178.e9 ATXN2...
10
http://www.diva-portal.org This is the published version of a paper published in Neurobiology of Aging. Citation for the original published paper (version of record): Sproviero, W., Shatunov, A., Stahl, D., Shoai, M., van Rheenen, W. et al. (2017) ATXN2 trinucleotide repeat length correlates with risk of ALS. Neurobiology of Aging, 51: 178.e1-178.e9 https://doi.org/10.1016/j.neurobiolaging.2016.11.010 Access to the published version may require subscription. N.B. When citing this work, cite the original published paper. Permanent link to this version: http://urn.kb.se/resolve?urn=urn:nbn:se:umu:diva-134980
Transcript of Neurobiology of Aging, 51: 178.e1-178.e9 ATXN2...
http://www.diva-portal.org
This is the published version of a paper published in Neurobiology of Aging.
Citation for the original published paper (version of record):
Sproviero, W., Shatunov, A., Stahl, D., Shoai, M., van Rheenen, W. et al. (2017)ATXN2 trinucleotide repeat length correlates with risk of ALS.Neurobiology of Aging, 51: 178.e1-178.e9https://doi.org/10.1016/j.neurobiolaging.2016.11.010
Access to the published version may require subscription.
N.B. When citing this work, cite the original published paper.
Permanent link to this version:http://urn.kb.se/resolve?urn=urn:nbn:se:umu:diva-134980

lable at ScienceDirect
Neurobiology of Aging 51 (2017) 178.e1e178.e9
Contents lists avai
Neurobiology of Aging
journal homepage: www.elsevier .com/locate/neuaging
ATXN2 trinucleotide repeat length correlates with risk of ALS
William Sproviero a, Aleksey Shatunov a, Daniel Stahl b, Maryam Shoai c,Wouter van Rheenen d, Ashley R. Jones a, Safa Al-Sarraj e, Peter M. Andersen f,Nancy M. Bonini g, Francesca L. Conforti h, Philip Van Damme i,j,k, Hussein Daoud l,Maria Del Mar Amadorm, Isabella Fogh a, Monica Forzan n, Ben Gaastra a, Cinzia Gellera o,Aaron D. Gitler p, John Hardy c, Pietro Fratta q, Vincenzo La Bella r, Isabelle Le Ber s,t,Tim Van Langenhove u,v,w, Serena Lattante s, Yi-Chung Lee x,y,z, Andrea Malaspina aa,Vincent Meininger bb,cc, Stéphanie Millecamps s, Richard Orrell dd, Rosa Rademakers ee,Wim Robberecht j,k, Guy Rouleau l, Owen A. Ross ee, Francois Salachasm,s, Katie Sidle c,Bradley N. Smith a, Bing-Wen Soong x,y,z, Gianni Sorarù ff, Giovanni Stevanin s,gg,Edor Kabashi s, Claire Troakes a, Christine van Broeckhoven u,v, Jan H. Veldink d,Leonard H. van den Berg d, Christopher E. Shawa, John F. Powell a, Ammar Al-Chalabi a,*aDepartment of Basic and Clinical Neuroscience, King’s College London, Maurice Wohl Clinical Neuroscience Institute, London, UKbDepartment of Biostatistics, King’s College London, Institute of Psychiatry, Psychology and Neuroscience, London, UKcDepartment of Molecular Neuroscience, University College London (UCL) Institute of Neurology, London, UKdDepartment of Neurology, Brain Center Rudolf Magnus Institute of Neuroscience, University Medical Centre Utrecht, Utrecht, the NetherlandseDepartment of Clinical Neuropathology, King’s College Hospital NHS Foundation Trust, London, UKfDepartment of Pharmacology and Clinical Neuroscience, Umeå University, Umeå, SwedengDepartment of Biology, University of Pennsylvania, Philadelphia, PA, USAh Institute of Neurological Sciences, National Research Council, Cosenza, ItalyiNeurology Department, University Hospitals Leuven, Leuven, BelgiumjVesalius Research Center, VIB, Leuven, BelgiumkDisease (LIND), KU Leuven - University of Leuven, Leuven, BelgiumlMontreal Neurological Institute, McGill University, Montreal, Quebec, CanadamDepartment of Nervous System Diseases, ALS Paris ALS Center for Rare Diseases, Groupe Hospitalier Pitié Salpêtrière, APHP, Paris, FrancenClinical Genetics Unit, Department of Woman and Child Health, University of Padova, Padova, Italyo Fondazione IRCCS Istituto Neurologico Carlo Besta, Milan, ItalypDepartment of Genetics, Stanford University School of Medicine, Stanford, CA, USAq Sobell Department of Motor Neuroscience and Movement Disorders, University College London (UCL) Institute of Neurology, London, UKrALS Clinical Research Center, Bio. Ne. C., University of Palermo, Palermo, Italys Institut du Cerveau et de la Moelle épinière (ICM), Inserm U1127, CNRS UMR 7225, Sorbonne Universités, UPMC Univ Paris 06 UMRS1127, Paris, FrancetAP-HP, Hôpitaux Universitaires La Pitié Salpêtrière-Charles Foix, Centre de Référence des Démences Rares, Departement de Neurologie, Paris, FranceuNeurodegenerative Brain Diseases Group, Department of Molecular Genetics, VIB, Antwerp, Belgiumv Laboratory of Neurogenetics, Insititute Born-Bunge, University of Antwerp, Antwerp, BelgiumwDepartment of Neurology, Antwerp University Hospital, Edegem, BelgiumxDepartment of Neurology, Taipei Veterans General Hospital, Taipei, TaiwanyDepartment of Neurology, National Yang-Ming University School of Medicine, Taipei, TaiwanzBrain Research Center, National Yang-Ming University, Taipei, TaiwanaaNorth-East London and Essex MND Care Centre - Neuroscience and Trauma Centre, Blizard, Institute of Cell and Molecular Medicine, Barts & theLondon School of Medicine & Dentistry, Barts Health NHS Trust, London, UKbbHôpital de la Pitié-Salpêtrière, institut de recherche translationnelle en neurosciences (A-ICM), Paris, FranceccHôpital de la Pitié-Salpêtrière, réseau SLA IdF, Paris, FranceddDepartment of Clinical Neuroscience, University College London (UCL) Institute of Neurology, London, UKeeDepartment of Neuroscience, Mayo Clinic, Jacksonville, FL, USAffDepartment of Neurosciences, University of Padova, Padova, ItalyggNeurogenetics team, Ecole Pratique des Hautes Etudes, Paris, France
* Corresponding author at: Department of Basic and Clinical Neuroscience, King’sCollege London, Maurice Wohl Clinical Neuroscience Institute, 5 Cutcombe Road,Camberwell, London SE5 9RX, UK. Tel.: 020 7848 5192; fax: 020 7848 5190.
E-mail address: [email protected] (A. Al-Chalabi).
0197-4580/� 2016 The Author(s). Published by Elsevier Inc. This is an open access article under the CC BY license (http://creativecommons.org/licenses/by/4.0/).http://dx.doi.org/10.1016/j.neurobiolaging.2016.11.010
W. Sproviero et al. / Neurobiology of Aging 51 (2017) 178.e1e178.e9178.e2
a r t i c l e i n f o
Article history:Received 1 September 2016Received in revised form 14 November 2016Accepted 16 November 2016Available online 24 November 2016
Keywords:ATXN2SCA2ALSCAGExpansionIntermediate expansionTrinucleotide repeatAmyotrophic lateral sclerosisAge of onsetRiskExponential riskTriplet
a b s t r a c t
We investigated a CAG trinucleotide repeat expansion in the ATXN2 gene in amyotrophic lateral sclerosis(ALS). Two new case-control studies, a British dataset of 1474 ALS cases and 567 controls, and a Dutchdataset of 1328 ALS cases and 691 controls were analyzed. In addition, to increase power, we system-atically searched PubMed for case-control studies published after 1 August 2010 that investigated theassociation between ATXN2 intermediate repeats and ALS. We conducted a meta-analysis of the new andexisting studies for the relative risks of ATXN2 intermediate repeat alleles of between 24 and 34 CAGtrinucleotide repeats and ALS. There was an overall increased risk of ALS for those carrying intermediatesized trinucleotide repeat alleles (odds ratio 3.06 [95% confidence interval 2.37e3.94]; p ¼ 6 � 10�18),with an exponential relationship between repeat length and ALS risk for alleles of 29e32 repeats (R2 ¼0.91, p ¼ 0.0002). No relationship was seen for repeat length and age of onset or survival. In contrast totrinucleotide repeat diseases, intermediate ATXN2 trinucleotide repeat expansion in ALS does not predictage of onset but does predict disease risk.� 2016 The Author(s). Published by Elsevier Inc. This is an open access article under the CC BY license
(http://creativecommons.org/licenses/by/4.0/).
1. Introduction
Spinocerebellar ataxia type 2 is a trinucleotide repeat diseasein which neurodegeneration is a consequence of expansion of arepeated CAG sequence in the ATXN2 gene. All trinucleotiderepeat diseases show neurological features and include Hunting-ton’s disease (Paulsen et al., 2014), the spinocerebellar ataxias(Tezenas du Montcel et al., 2014), Friedreich’s ataxia (Koeppen,2011), fragile X syndrome (Jin and Warren, 2000), myotonic dys-trophy (Khoshbakht et al., 2014), and Kennedy’s disease (Yang andYamamoto, 2014) among others. The mechanism by which therepeated sequence causes disease remains unknown, but afrequently observed feature is a relationship between age ofsymptom onset, severity of phenotype, and repeat size, with largerrepeats associated with younger onset and more severe disease(Nestor and Monckton, 2011).
Intriguingly, trinucleotide repeat expansion in the ATXN2 gene isalso a risk factor for amyotrophic lateral sclerosis (ALS), a neuro-degenerative disease of upper and lower motor neurons, but thisassociation is only seen for repeats of intermediate size, below therange usually associated with spinocerebellar ataxia (34 repeats ormore) but above the normal range (Elden et al., 2010). Suchpleiotropy is not seen in other trinucleotide repeat diseases andmeans that the usually observed relationship between repeat size,age of onset, and severity, might not be straightforward. Here, weinvestigate the size range defining ALS risk and test the relationshipof phenotype with repeat size.
2. Methods
2.1. Unpublished case-control studies
A total of 1474 UK DNA samples of unrelated ALS patients(29 with an affected first degree relative) were collected from aconsecutive clinical case series obtained from King’s College Hos-pital (n ¼ 116), from the Motor Neurone Disease Association DNABiobank (n¼ 1051), and fromQueenMary University of London andUCL Institute of Neurology (n¼ 307). All patients were diagnosed ashaving definite or probable ALS according to the El Escorial criteria.The DNA samples of 567 neurologically normal controls, matched topatients for gender, age, and geographical region, were obtainedfrom the MRC London Neurodegenerative Diseases Brain Bank, theInstitute of Psychiatry, Psychology and Neuroscience (n ¼ 68), from
the National Institute for Health Research Mental Health Biomed-ical Research Centre and the Dementia Unit at South London andMaudsley NHS Foundation Trust and the Institute of Psychiatry,King’s College London (n ¼ 306), and from the Motor NeuroneDisease Association (n ¼ 193).
A second case-control population-based set was obtained incollaboration with the University Medical Center Utrecht, theNetherlands, with a total of 1328 unrelated ALS cases (23 with afamily history in a first degree relative) and 691 neurologicallynormal controls, matched to patients for gender, age, andgeographical region (Liberati et al., 2009). Samples used did notoverlap with previous studies of ATXN2 repeat size.
2.2. Standard protocol approvals, registrations, and patientconsents
Informed consent was obtained from all included in the study.The study was approved by the Trent Research Ethics Committee08/HO405/60 and by the Medical Ethics Review Board at the Uni-versity Medical Center Utrecht 05_067/E.
2.3. Genetic analysis
The DNA samples of 1167 ALS cases and 567 controls wereanalyzed at the Institute of Psychiatry, Psychology and Neurosci-ence, King’s College London, and DNA samples of 307 ALS casesunderwent analysis at the Institute of Neurology, UCL. The ATXN2CAG trinucleotide repeat region was amplified according to a pre-viously published PCR protocol (Pulst et al., 1996). PCR products atKing’s College London were run on an Applied Biosystems 3130xlGenetic Analyzer, and those at UCL on an Applied Biosystems3730xl Genetic Analyzer. PCR fragments were analyzed usingGeneMapper V 4.0 software (Applied Biosystems) to determineCAG trinucleotide repeat size. Electropherogram peaks were sizedusing GeneScanTM 500 LIZ as reference dye labeled standard.Sequenced samples of known CAG trinucleotide repeat size wereused as internal controls for both PCR and GeneScan analysis. PCRproducts of cases and controls with more than 26 repeats wereregenotyped to validate the obtained results.
The DNA samples of 1328 Dutch ALS cases and 691 controlsunderwent ATXN2 CAG trinucleotide repeat amplification accordingto a previously reported PCR protocol (Van Damme et al., 2011). PCRproducts were analyzed using an Applied Biosystems 3130xl

B A
Fig. 1. Distribution of ATXN2 alleles with trinucleotide repeat size 24 or more in the (A) British and (B) Dutch datasets. (A) The British dataset included 1474 ALS individuals and574 controls. There were 2867 alleles of size 23 or less in cases and 1105 in controls. (B) The Dutch dataset included 1328 ALS individuals and 691 controls. There were 2596 alleles ofsize 23 or less in cases and 1344 in controls.
W. Sproviero et al. / Neurobiology of Aging 51 (2017) 178.e1e178.e9 178.e3
Genetic Analyzer. PCR fragments were analyzed using GeneMapperV 4.0 software (Applied Biosystems) to determine CAG trinucleotiderepeat size. Electropherogram peaks were sized using GeneScanTM500 LIZ as reference dye labeled standard. Sequenced samples ofknown CAG trinucleotide repeat size were used as internal controlsfor both PCR and GeneScan analysis. PCR products of cases andcontrols with more than 26 repeats were regenotyped to validatethe obtained results.
Samples were also genotyped for C9orf72 expansion as describedpreviously (See Supplementary Material).
2.4. Inclusion criteria for published studies
Systematic review and meta-analysis were conducted in accor-dance with the PRISMA (Huisman et al., 2011; Preferred ReportingItems for Systematic reviews and Meta-Analyses) group guidelinesand Cochrane Collaboration. The types of studies included werecase-control studies designed to evaluate the minimum number ofCAG repeats in the ATXN2 gene conferring risk for ALS. Series ofcases and descriptive reports were excluded from study selection.Repeats of size 23 or less were regarded as normal given their highcontrol frequency in several populations (Laffita-Mesa et al., 2012).
2.5. Study design, data extraction, and control of bias
This was not an interventional study and therefore was notrandomized or blinded. Study selection was restricted to case-control studies published after 1 August 2010, the date of the firstreported association between ATXN2 variation and ALS. The exactfrequencies of each allele with 24 repeats or greater, and the pooledcounts of alleles frequencies with less than 24 repeats wereextracted for both cases and controls from published papers. ALSdiagnostic criteria, control recruitment information, and case-control matching for age and geographical region were extractedto ensure comparability between studies. Where ATXN2 allele fre-quencies or information about control selection and case-controlage matching were incomplete, study authors were contacted.Data extraction was performed in duplicate by 2 independent in-vestigators (William Sproviero, Aleksey Shatunov). The new case-control studies from UK and Dutch populations were included inthe analysis. Bias in individual studies was evaluated using theNewcastle-Ottawa Scale questionnaire for Quality Assessment ofNonrandomized Studies (Stang, 2010). The questionnaire contains
8 items subdivided into 3 categories (selection, comparability, andexposure), with a maximum overall score of 8. Studies with totalscore equal or greater than 6 were considered at low risk of bias.
2.6. Statistical methods
Relative risks (RRs) were approximated by the odds ratio,generated with corresponding 95% confidence intervals (CIs), bymeta-analysis using a Cochran-Mantel-Haenszel chi-square testcomparing the case-control counts for a specific allele with thepooled counts for alleles of 23 repeats or fewer across the differentpublished and unpublished studies. RR was then estimatedcomparing pooled counts of risk alleles with counts of alleles of23 repeats or fewer. Where a cell contained zero observations, acontinuity correction of 0.5 was applied. The sample size wasconsidered adequate to measure the effect size since each indi-vidual study in the meta-analysis measured the effect, and theaddition of further samples would increase power further. Weassumed that all studies were estimating the same common effectand estimates varied only because of chance differences in sam-pling patients. To assess our assumption, heterogeneity betweenstudies was estimated using the I2 statistic (% of variability due tobetween-study heterogeneity) and Cochrane’s Q-test of heteroge-neity. I2 > 50% or p < 0.05 for the Q-test were taken as indicative ofsignificant heterogeneity. We used a fixed effects model followingthe assumption that all studies had a common genetic effect andthat specific findings of each study were due to random sampling.However, to control for any possible difference across studies, thefixed effect model RR estimates at each threshold were comparedwith RR estimates assessed using a random effects model. Asensitivity analysis, leaving out one study at a time, was performedto test the robustness of the meta-analysis and assess the influenceof individual studies on the overall result for each allele. Possiblesources of heterogeneity across studies were explored usingsubgroup analysis using source of the control group (populationbased vs. nonpopulation based) and geographic location (China,Europe, Turkey, USA) as covariates. Meta-regression was used tofurther investigate differences between population-based andnonpopulation-based subgroups. Funnel plots were generated foreach intermediate repeat allele to analyze the intervention effectfrom individual studies against study size. A resulting p < 0.05 wasconsidered as indicative of the presence of small-study effects.Correlation between age at onset and the CAG trinucleotide repeat

249 Records identified through PubMed database searchingbetween August 1, 2010 and November 30, 2014. Search words: ALS, amyotrophic lateral sclerosis, SCA2, ATXN2, Ataxin 2, CAG repeats, intermediate expansion.
63 Records retained and reviewed by title screening
186 Records excluded because duplicates
21 Full-text articles assessed for eligibility
21 Articles excluded: 3 Meta-analysis 5 Case series 7 Editorial or Review5 Mechanism studies1 Screening study
7 Studies included in qualitative synthesis
16 Studies included in qualitative synthesis.
14 Article excluded:10 Case-control studies with
insufficient published information
3 Studies used published data 1 Case-control study included
only cases with C9ORF72 expansions
9 Articles included after First and Senior author provided missing Information
18 Studies included in qualitative synthesis.
2 Non-published case-control datasets with complete information included in the meta-analysis
42 Records reviewed by abstract screening
21 Records excluded because not relevant
15 Studies were included in quantitative synthesis. (Meta-analysis)
3 Published case-control datasets excluded according to NOS criteria.
Fig. 2. Flow chart of study selection according to the PRISMA protocol. Thirteen pre-viously published studies were selected for analysis, 7 from Europe (Conforti et al.,2012; Corrado et al., 2011; Daoud et al., 2011; Gispert et al., 2012; Lattante et al.,2014; Van Damme et al., 2011; Van Langenhove et al., 2012), 3 studies of Han Chi-nese (2 from China [Liu et al., 2013; Lu et al., 2015] and 1 from Taiwan [Soong et al.,2014]), 1 from Turkey (Lahut et al., 2012), and 2 studies from the USA (Elden et al.,2010; Ross et al., 2011).
W. Sproviero et al. / Neurobiology of Aging 51 (2017) 178.e1e178.e9178.e4
length of risk alleles was tested in the new British and Dutch ALScases, and in published data sets for which age at onset data wereavailable. Two-tailed Fisher exact tests were used to test for dif-ferences in demographic and clinical characteristics of patients byATXN2 repeat size. ANOVA was used to compare ages at onset fordifferent repeat sizes, as well as by using SNPs rs695871 andrs695872, previously shown to associate with age of onset. Kaplan-Meier survival analysis and a log-rank test were used to comparesurvival time between groups. We compared the fit of an expo-nential model with the fit of a linear model using Akaike infor-mation criteria and Bayesian information criteria. Comparison ofmodel values for either measure can be used to assess fit providedthe values differ by more than 10. The model with the larger valuehas less support (Burnham and Anderson, 2002; Raftery, 1995).Meta-analyses were performed using STATA version 12.0 (StataCorp, College Station, TX, USA). Chi-square tests, ANOVA, andKaplan-Meier survival analysis were performed using SPSS statis-tical package version 22 (IBM, Chicago, IL, USA). R language (http://www.R-project.org) was used to test the hypothesis that the rela-tionship between ATXN2 CAG repeat length and ALS risk fitted anexponential model.
3. Results
ATXN2 trinucleotide CAG repeats were analyzed in 1474 ALScases and 567 neurologically normal controls from the UK and in1328 ALS cases and 691 neurologically normal controls fromthe Netherlands. The distribution of allele frequencies is shownin Fig. 1.
All cases were tested for the copresence of ATXN2 intermediateexpansions and C9orf72 expansion. Six patients (2 UK, 4 Dutch) hadintermediate ATXN2 expansion and pathological expansion ofC9orf72. Exclusion of these patients from analyses did not changethe overall findings.
Based on literature searches (Fig. 2), we identified all knownstudies examining ATXN2 repeat expansion in ALS, contactingauthors for raw data where necessary, and including studies foranalysis based on strict criteria (Supplementary Table 1). Studiespassing inclusion criteria (Conforti et al., 2012; Corrado et al., 2011;Daoud et al., 2011; Elden et al., 2010; Gellera et al., 2012; Gispertet al., 2012; Lahut et al., 2012; Lattante et al., 2014; Lee et al.,2011; Liu et al., 2013; Lu et al., 2015; Ross et al., 2011; Soonget al., 2014; Sorarù et al., 2011; Van Damme et al., 2011; VanLangenhove et al., 2012) and the 2 novel datasets were used. OneChinese dataset (Chen et al., 2011) was excluded because theauthors were unable to provide information on the control group.We excluded studies that might show bias according to theNewcastle-Ottawa Scale criteria (Supplementary Table 2), leaving atotal of 15 studies for meta-analysis, comprising 10,888 cases and15,463 controls (Supplementary Fig. 1). The allele counts of pooledalleles <24 repeats and of each allele with 24 trinucleotide repeatsor greater are reported in Supplementary Table 3. No evidence ofsmall-study effect was found in any of the primary analysis studies(data not shown), although we acknowledge that the Funnel plotsare not independent of each other.
We first established the definitive size range ascribing risk forALS, investigating each allele from 24 repeats to 34 repeats byusing a fixed effects approach (Supplementary Table 4). Theexclusion of the study published by Liu et al. (2013) from analysisof the RR conferred by the 30 repeat allele lowered the initialsignificant heterogeneity (I2 ¼ 48.8%, heterogeneity p¼ 0.02) to anoverall I2 value of 0% (heterogeneity p¼ 0.51) but did not influencethe overall RR estimate. No study exclusion could explain thesignificant heterogeneity present in the analysis of the 24 repeatallele. No other studies had any effect on heterogeneity or
RR estimates, including 2 studies that used young controls belowthe age of risk (Corrado et al., 2011; Elden et al., 2010), and therewas no effect of ancestral background of the population studied.

Overall (I-squared = 48.8%, p = 0.021)
Dataset-NL
Conforti et al. 2012Corrado et al. 2011
Elden et al. 2010
Soong et al. 2014
Liu et al. 2013
Lahut et al. 2012
Lu et al. 2014
Van Langenhove et al. 2012
Gispert et al. 2012
Ross et al. 2011
Dataset-UK
Daoud et al. 2011
Lattante et al. 2014
Van Damme et al. 2011
2.02 (1.30, 3.15)
1.04 (0.19, 5.65)
4.33 (0.52, 35.87)0.57 (0.02, 13.91)
9.78 (0.53, 181.57)
1.28 (0.05, 31.32)
0.20 (0.05, 0.79)
(Excluded)
4.62 (0.42, 50.85)
23.27 (2.12, 255.00)
7.31 (0.76, 70.24)
9.30 (2.33, 37.15)
2.31 (0.28, 19.16)
2.57 (0.27, 24.70)
4.78 (0.60, 38.20)
1.35 (0.36, 5.02)
100.00
10.45
4.614.40
1.90
2.46
37.56
0.00
2.40
0.63
2.31
3.08
5.73
4.27
4.96
15.25
1.00392 1 255
Relative Risk Weight (95% CI) %
Overall (I-squared = 0.0%, p = 0.610)
Corrado et al. 2011
Lattante et al. 2014
Van Damme et al. 2011
Elden et al. 2010
Lu et al. 2014
Gispert et al. 2012
Soong et al. 2014
Van Langenhove et al. 2012
Dataset-UK
Lahut et al. 2012
Dataset-NL
Liu et al. 2013
Daoud et al. 2011
Conforti et al. 2012
Ross et al. 2011
1.68 (1.11, 2.54)
0.34 (0.04, 2.92)
1.40 (0.36, 5.40)
1.39 (0.52, 3.72)
2.18 (0.20, 23.99)
6.89 (1.39, 34.08)
0.49 (0.06, 4.18)
1.28 (0.05, 31.32)
3.91 (0.41, 37.35)
4.23 (0.23, 76.52)
0.60 (0.02, 14.61)
0.78 (0.22, 2.75)
6.16 (0.35, 109.29)
5.98 (0.74, 48.55)
2.89 (0.32, 25.83)
1.43 (0.50, 4.10)
100.00
10.44
10.61
19.04
2.71
3.43
8.21
1.75
1.33
2.04
3.04
14.90
1.92
3.05
3.28
14.24
1.02 255
A B Relative Risk Weight (95% CI) %
Study ID Study ID
gOverall (I = 0.0%, p=0.610)
R9
30 CAG29 CAG
Lahut et al. 2012Overall (I = 48.8%, p=0.021)
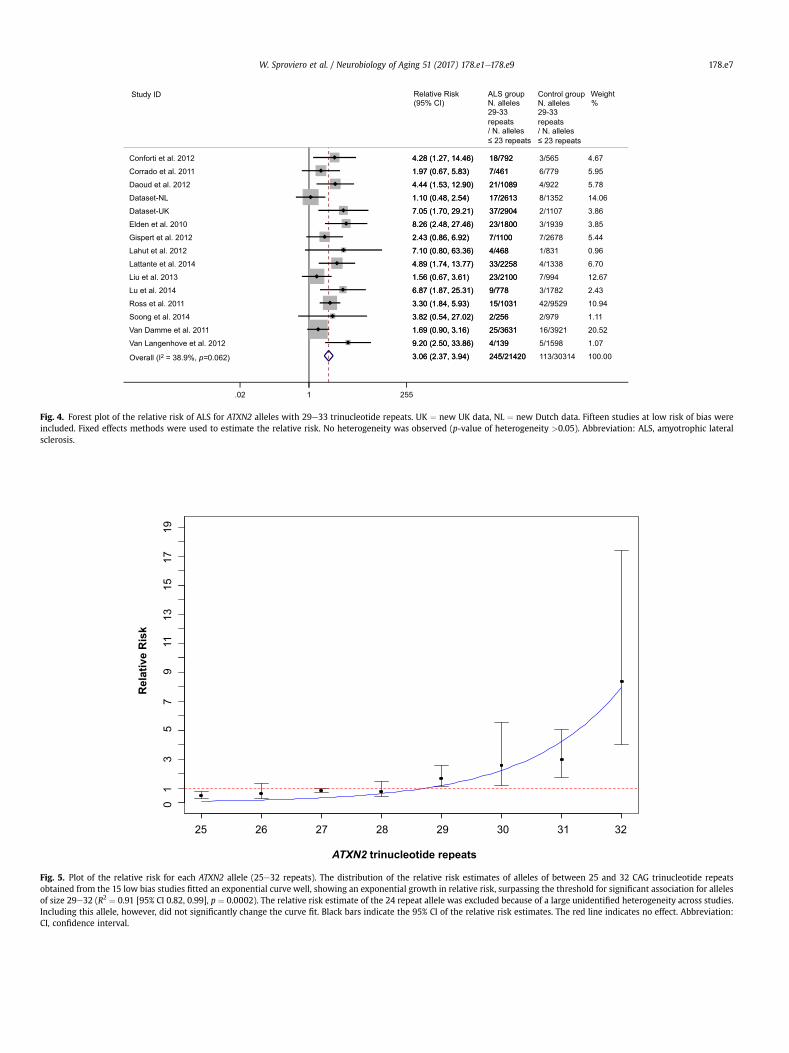
Fig. 3. Forest plots of individual alleles between 29 and 33 repeats. Primary analysis of the relative risk of ALS was conducted using low risk-bias case-control studies. UK ¼ new UKdata, NL ¼ new Dutch data. Relative risk (RR) was estimated using a fixed effects approach and by comparing individual counts of ATXN2 alleles with the pooled count of alleles with�23 repeats as baseline. (A) ATXN2 allele of 29 repeats, RR ¼ 1.68 (1.11, 2.54). No heterogeneity was observed (p-value of heterogeneity >0.05). (B) ATXN2 allele of 30 repeats, RR ¼2.02 (1.30, 3.15). One of 15 studies was excluded for absence of carriers of allele 30, both in cases and controls. Significant heterogeneity was observed (p-value of heterogeneity<0.05). (C) ATXN2 allele of 31 repeats, RR ¼ 2.96 (1.73, 5.05). One of 15 studies was excluded for absence of carriers of allele 31, both in cases and controls. No heterogeneity wasobserved (p-value of heterogeneity >0.05). (D) ATXN2 allele of 32 repeats, RR ¼ 8.37 (4.02, 17.43). Two of 15 studies were excluded for absence of carriers of allele 32, both in casesand controls. No heterogeneity was observed (p-value of heterogeneity >0.05). (E) ATXN2 allele of 33 repeats, RR ¼ 4.73 (1.92, 11.63). No heterogeneity was observed (p-value ofheterogeneity >0.05). Abbreviation: ALS, amyotrophic lateral sclerosis.
W. Sproviero et al. / Neurobiology of Aging 51 (2017) 178.e1e178.e9 178.e5
Using a random effects model did not change the findings(Supplementary Table 5).
We found that alleles with 29e33 repeats were associated withALS (Fig. 3). A meta-analysis of the pooled counts of the risk allelesshowed a RR of ALS of 3.06, 95% CI, 2.37e3.94, p¼ 6� 10�18 (Fig. 4).We performed a sensitivity analysis, reintroducing the 3 studiesexcluded for risk of bias, which did not affect the results (data notshown).
Investigating the effect size of each allele, we found that therisk increased exponentially with length for alleles of 29e32repeats (R2 ¼ 0.91 [95% CI 0.82, 0.99], p ¼ 0.0002; Fig. 5), onlydropping off at the boundary for risk of spinocerebellar ataxia type2, at 33 repeats. This is surprising and has not been reported forany trinucleotide repeat disease. The goodness-of-fit of theexponential model was compared with the fit of a linear model.The exponential model gave a better fit based on Akaike infor-mation criteria and Bayesian information criteria criteria(Supplementary Table 6).
Next, we tested the relationship between repeat length andage of ALS onset in the 4 different populations for which datawere available. In keeping with previous findings, and in contrastto trinucleotide repeat diseases, we found no evidence for such arelationship (UK [n ¼ 17] age at onset-repeat length regression,p ¼ 0.90; the Netherlands [n ¼ 37] age at onset-repeat lengthregression, p ¼ 0.08; Belgium [Van Damme et al., 2011; n ¼ 25]age at onset-repeat length regression, p ¼ 0.83; France [Lattanteet al., 2014; n ¼ 33] age at onset-repeat length regression, p ¼0.49; Flanders-Belgian [Van Langenhove et al., 2012; n ¼ 4] age atonset-repeat length regression, p ¼ 0.60; overall age at onset-repeat length regression, p ¼ 0.14). Nor were there any associa-tions when SNPs rs695871 and rs695872, previously shown toassociate with the age of onset, were tested.
We also assessed differences in demographic and clinical char-acteristics between patients with CAG repeats <29 and patientswith CAG repeats �29 in both British and Dutch cohorts. No sig-nificant difference was found in gender, age at onset, or site ofonset (Supplementary Table 7). No significant difference in survivalwas detected by Kaplan-Meier analysis in either the British(p-value ¼ 0.87) or Dutch (p-value ¼ 0.31) cohorts.
4. Discussion
We have found the risk range for ATXN2 trinucleotide repeatalleles in ALS is 29e33. An unexpected and important finding isthat the risk of ALS increases exponentially with allele repeat sizeuntil the border with spinocerebellar ataxia risk, even though theage of onset does not change. This may appear surprising but isentirely consistent with current hypotheses of ALS causation, inwhich the odds ratio conferred by genetic variants and age ofonset of first symptoms are not correlated, even within thesame family (e.g., TARDBP, FUS; Abel et al., 2012; Al-Chalabi andHardiman, 2013; van Rheenen et al., 2016). Our confidence in thefinding of an exponential increase in risk is high because this is thelargest study of ATXN2 alleles and ALS, our findings overall areconsistent with previous studies, and 4 different European pop-ulations gave identical results for the relationship of age of onsetwith trinucleotide allele repeat size. Furthermore, an exponentialfit is strongly supported statistically over a linear change in risk.The fact the risk drops off at 33 repeats can be interpreted as adilution in the case ascertainment, since a large proportion ofpeople with 33 repeats would develop spinocerebellar ataxia(Fernandez et al., 2000) rather than ALS, but we have ascertainedon disease state rather than repeat size. To ascertain repeat size,we used a method previously reported to include unrelated PCRproducts in the critical range of the gel (Pulst et al., 1996). Toovercome this limitation, we genotyped all samples twice.
The trinucleotide repeat size range we found associated withrisk of ALS overlappedwith but was larger than previously reportedranges, (probably because the increased sample size improved ourstatistical power), and has implications for genetic counseling ofindividuals carrying intermediate size repeats. Two publishedmeta-analyses, one of 12 and another of 13 studies, reported sig-nificant association with ALS for pooled analyses of ATXN2 allelesgreater than 30 trinucleotide repeats, a finding that remained sig-nificant when restricted to alleles sized between 30 and 33 repeats(Laffita-Mesa et al., 2012; Wang et al., 2014). Another meta-analysisof 9 studies found that individual ATXN2 allele frequencies of 31, 32,and 33 repeats were significantly higher in ALS cases than in con-trols (Neuenschwander et al., 2014).

E
Overall (I-squared = 0.0%, p = 0.562)
Lu et al. 2014
Daoud et al. 2011
Lahut et al. 2012
Dataset-UK
Corrado et al. 2011Conforti et al. 2012
Elden et al. 2010
Liu et al. 2013
Dataset-NL
Soong et al. 2014
Gispert et al. 2012
Van Damme et al. 2011
Lattante et al. 2014
Ross et al. 2011
Van Langenhove et al. 2012
2.96 (1.73, 5.05)
6.93 (0.28, 169.83)
3.43 (0.38, 30.63)
5.35 (0.22, 131.06)
4.99 (0.65, 38.12)
11.83 (0.61, 228.50)1.45 (0.13, 15.96)
3.80 (0.79, 18.28)
6.16 (0.35, 109.29)
0.26 (0.02, 2.86)
(Excluded)
0.81 (0.03, 19.98)
0.86 (0.23, 3.22)
12.54 (0.74, 213.79)
4.66 (1.17, 18.60)
3.91 (0.16, 95.50)
100.00
1.71
6.10
2.04
8.19
2.116.57
10.86
3.84
14.93
0.00
4.94
27.24
3.55
6.59
1.34
1.02 255
C D Relative Risk Weight (95% CI) %
Study ID Relative Risk Weight (95% CI) %
Study ID
Relative Risk Weight (95% CI) %
Study ID
gOverall (I2 = 0.0%, p=0.562) Overall (I-squared = 0.0%, p = 1.000)
Dataset-UK
Soong et al. 2014
Van Langenhove et al. 2012
Daoud et al. 2011
Van Damme et al. 2011
Ross et al. 2011
Conforti et al. 2012
Lattante et al. 2014
Lu et al. 2014
Lahut et al. 2012
Dataset-NL
Liu et al. 2013
Corrado et al. 2011
Elden et al. 2010Gispert et al. 2012
8.37 (4.02, 17.43)
8.84 (0.52, 149.81)
11.46 (0.47, 280.51)
(Excluded)
5.98 (0.74, 48.55)
11.87 (0.66, 214.55)
7.44 (2.00, 27.68)
6.50 (0.35, 120.57)
6.58 (0.36, 118.94)
(Excluded)
12.43 (0.64, 240.11)
4.65 (0.25, 86.38)
5.22 (0.29, 94.26)
5.09 (0.21, 124.74)
18.44 (1.06, 319.20)17.05 (0.88, 329.81)
100.00
9.63
2.76
0.00
14.37
6.41
12.93
7.73
8.34
0.00
4.80
8.78
9.04
4.94
6.393.88
1.02 255
Overall (I-squared = 0.0%, p = 0.989)
Liu et al. 2013
Lahut et al. 2012
Soong et al. 2014
Dataset-UK
Daoud et al. 2011
Ross et al. 2011
Corrado et al. 2011
Lattante et al. 2014
Conforti et al. 2012
Van Langenhove et al. 2012
Gispert et al. 2012
Elden et al. 2010
Dataset-NL
Lu et al. 2014
Van Damme et al. 2011
4.73 (1.92, 11.63)
3.32 (0.17, 64.28)
(Excluded)
11.46 (0.47, 280.51)
1.93 (0.09, 40.10)
(Excluded)
3.11 (0.13, 76.30)
8.47 (0.41, 176.00)
4.19 (0.22, 81.10)
3.62 (0.17, 75.32)
34.91 (1.43, 852.76)
(Excluded)
5.44 (0.26, 113.26)
2.59 (0.12, 53.86)
(Excluded)
5.40 (0.26, 112.42)
100.00
13.11
0.00
4.01
13.96
0.00
5.61
7.18
12.09
11.21
1.53
0.00
9.26
12.74
0.00
9.30
1.02 255
gOverall (I = 0.0%, p=1.000)
Overall (I = 0.0%, p=0.989)
R(
33 CAG
R9
32 CAG31 CAG
Fig. 3. (continued).
W. Sproviero et al. / Neurobiology of Aging 51 (2017) 178.e1e178.e9178.e6
It has been suggested that shorter intermediate repeats may beprotective for ALS (Neuenschwander et al., 2014). Our data areconsistent with this possibility, and indeed for alleles of 27 repeats,show a significant protective effect (Fig. 5, Supplementary Table 4).Previous studies of the ATXN2 repeat length in ALS have not showna relationship with age of onset (Laffita-Mesa et al., 2012;Neuenschwander et al., 2014; Wang et al., 2014). In this study,5 populations comprising 5703 cases of the 10,888 individualsstudied had age of onset data available. Despite this limitation innumbers, there is unlikely to be a major effect of allele size on theage of onset for ALS. A recent study reported a modifier effect ofATXN2 intermediate length repeats on ALS survival for those with31 or more repeats (Chiò et al., 2015). We did not replicate thisfinding.
The mechanism by which expanded trinucleotide repeats causedisease does not appear to be the same for all such diseases, eventhough all trinucleotide repeat expansions result in neurologicaldysfunction. In some cases, there is a loss of function, for examplethrough hypermethylation (Jin and Warren, 2000), whereas inothers, there is a toxic gain of function, for example throughaggregation following protein misfolding (Kayatekin et al., 2014).For toxic products of affected genes, larger expansions are likely toresult in increased toxicity, and since the products are present frombirth, an earlier age of onset or more severe phenotype is the likely
outcome of larger repeat sizes. Here, we can add a third outcome oflarger repeats: that the risk of disease increases. This can beexplained within the recently proposed multistep model of ALS ifthe toxic effect of intermediate expansions is one of the stepsrequired for ALS to develop, and the toxic effect shows a correlationwith repeat size (Al-Chalabi et al., 2014). It also allows for thepossibility of oligogenic inheritance, where multiple genetic riskfactors act in concert to cause ALS. The mechanism by which thismight happen without a concomitant reduction in age of onsetremains to be determined. A possible explanation lies in the exis-tence of CAA interruptions to the CAG trinucleotide repeatsequence. Aweakness of this study is that such interruptions wouldnot be detectable using our assay but would merely appear asadditional CAG repeats. Up to 3 such interruptions have beenobserved in the ATXN2 trinucleotide repeat by direct sequencingbut become less likely as the length of the repeat increases. WhenCAA interruptions occur in repeats of size 33e40, the phenotype isusually of a dopa-responsive Parkinsonism (Kim et al., 2007). Onemechanism for risk associated with CAG repeats is through RNAtoxicity, and CAA interruptions specifically alter RNA secondarystructure. The formation of a stable RNA hairpin structure could beassociated with the position and number of CAA triplets alongthe CAG expansion leading to an RNA toxic gain of function(Yu et al., 2011). Thus the interruptions can modify phenotype, and
Overall (I-squared = 38.9%, p = 0.062)
Lahut et al. 2012
Lu et al. 2014
Soong et al. 2014
Lattante et al. 2014
Dataset-NL
Van Langenhove et al. 2012
ID
Dataset-UK
Corrado et al. 2011
Gispert et al. 2012
Van Damme et al. 2011
Study
Conforti et al. 2012
Liu et al. 2013
Daoud et al. 2012
Elden et al. 2010
Ross et al. 2011
3.06 (2.37, 3.94)
7.10 (0.80, 63.36)
6.87 (1.87, 25.31)
3.82 (0.54, 27.02)
4.89 (1.74, 13.77)
1.10 (0.48, 2.54)
9.20 (2.50, 33.86)
RR (95% CI)
7.05 (1.70, 29.21)
1.97 (0.67, 5.83)
2.43 (0.86, 6.92)
1.69 (0.90, 3.16)
4.28 (1.27, 14.46)
1.56 (0.67, 3.61)
4.44 (1.53, 12.90)
8.26 (2.48, 27.46)
3.30 (1.84, 5.93)
245/21420
4/468
9/778
2/256
33/2258
17/2613
4/139
Treatment
37/2904
7/461
7/1100
25/3631
Events,
18/792
23/2100
21/1089
23/1800
15/1031
113/30314
1/831
3/1782
2/979
4/1338
8/1352
5/1598
Control
2/1107
6/779
7/2678
16/3921
Events,
3/565
7/994
4/922
3/1939
42/9529
100.00
0.96
2.43
1.11
6.70
14.06
1.07
Weight
3.86
5.95
5.44
20.52
%
4.67
12.67
5.78
3.85
10.94
3.06 (2.37, 3.94)
7.10 (0.80, 63.36)
6.87 (1.87, 25.31)
3.82 (0.54, 27.02)
4.89 (1.74, 13.77)
1.10 (0.48, 2.54)
9.20 (2.50, 33.86)
RR (95% CI)
7.05 (1.70, 29.21)
1.97 (0.67, 5.83)
2.43 (0.86, 6.92)
1.69 (0.90, 3.16)
4.28 (1.27, 14.46)
1.56 (0.67, 3.61)
4.44 (1.53, 12.90)
8.26 (2.48, 27.46)
3.30 (1.84, 5.93)
245/21420
4/468
9/778
2/256
33/2258
17/2613
4/139
Treatment
37/2904
7/461
7/1100
25/3631
Events,
18/792
23/2100
21/1089
23/1800
15/1031
1.02 255
Overall (I2 = 38.9%, p=0.062)
Relative Risk Weight (95% CI) %
Study ID ALS group N. alleles29-33 repeats / N. alleles 23 repeats
Control group N. alleles29-33 repeats / N. alleles 23 repeats
Fig. 4. Forest plot of the relative risk of ALS for ATXN2 alleles with 29e33 trinucleotide repeats. UK ¼ new UK data, NL ¼ new Dutch data. Fifteen studies at low risk of bias wereincluded. Fixed effects methods were used to estimate the relative risk. No heterogeneity was observed (p-value of heterogeneity >0.05). Abbreviation: ALS, amyotrophic lateralsclerosis.
Fig. 5. Plot of the relative risk for each ATXN2 allele (25e32 repeats). The distribution of the relative risk estimates of alleles of between 25 and 32 CAG trinucleotide repeatsobtained from the 15 low bias studies fitted an exponential curve well, showing an exponential growth in relative risk, surpassing the threshold for significant association for allelesof size 29e32 (R2 ¼ 0.91 [95% CI 0.82, 0.99], p ¼ 0.0002). The relative risk estimate of the 24 repeat allele was excluded because of a large unidentified heterogeneity across studies.Including this allele, however, did not significantly change the curve fit. Black bars indicate the 95% CI of the relative risk estimates. The red line indicates no effect. Abbreviation:CI, confidence interval.
W. Sproviero et al. / Neurobiology of Aging 51 (2017) 178.e1e178.e9 178.e7
W. Sproviero et al. / Neurobiology of Aging 51 (2017) 178.e1e178.e9178.e8
an interaction between repeat length and CAA interruption couldunderlie ALS risk and the lack of effect on the age of onset.Furthermore, although both Dutch and UK cohorts had individualswith more than 33 repeats, they did not have spinocerebellarataxia, a finding which might be related to CAA interruptions.
5. Conclusion
Our study increases the breadth of known effects of trinucleo-tide repeat expansion size, adding disease risk to the existing cor-relations with age of onset and disease severity. Thus, the mainfinding presented here is that trinucleotide repeat expansion in theATXN2 gene in the size range exclusively for ALS risk represents anexponentially increasing risk for each additional repeat.
Disclosure statement
The authors have no conflicts of interest to disclose.
Acknowledgements
This work was supported by the EU Joint Programme forNeurodegenerative Disease Research projects SOPHIA, STRENGTH,and NETCALS. Christopher E. Shaw, Ammar Al-Chalabi, and DanielStahl receive salary support from the National Institute for HealthResearch Dementia Biomedical Research Unit at South Londonand Maudsley NHS Foundation Trust and King’s College London.Philip Van Damme holds a senior clinical investigatorship ofFWO-Flanders and is supported by the Belgian ALS ligue. WilliamSproviero, Richard Orrell, John Hardy, and Maryam Shoai are fun-ded by the MND Association. The views expressed are those of theauthors and not necessarily those of the NHS, the National Institutefor Health Research, the Department of Health, the Belgian ALSligue, or the MNDA. The work leading up to this publication wasfunded by the European Community’s Health Seventh FrameworkProgramme (FP7/2007e2013; grant agreement number 259867,and the Programme d’investissement d’avenir [IHU-A-ICM]).Samples used in this research were in part obtained from the UKNational DNA Bank for MND Research, funded by the MND Asso-ciation and the Wellcome Trust, and by University Medical CenterUtrecht. The authors would like to thank people with MND andtheir families for their participation in this project. They alsoacknowledge sample management undertaken by BiobankingSolutions funded by the Medical Research Council at the Centre forIntegrated Genomic Medical Research, University of Manchester.
The associations which funded ATXN2 analyses in the FrenchALS/control cohorts are: the Association pour la Recherche sur laSclérose latérale amyotrophique et autres maladies du motoneurone(ARSla, France, contract R13132DD) and the Association françaisecontre les myopathies (AFM, France, contract R11038DD). Theresearch at the Antwerp site was in part funded by the Belgian Sci-ence Policy Office Interuniversity Attraction Poles program, theFlemish Government initiated Excellence Program Methusalem, theResearch Foundation Flanders, and the University of AntwerpResearch Fund; Belgium. The study published by Sorarù et al. (2011)was funded by Telethon Biobank (GTB12001D). The authors alsothank the authors of the “Ataxin-1 and ataxin-2 intermediate-lengthPolyQ expansions in amyotrophic lateral sclerosis” Neurology, 2012paper for their collaboration (Conforti et al., 2012) and all the con-tacted authors who shared their data.
Author’s contributions: All authors contributed to the finalmanuscript. William Sproviero, Aleksey Shatunov, and AmmarAl-Chalabi contributed to the literature search, figures, study design,data collection, data analysis, data interpretation, writing, and revi-sion of the manuscript. William Sproviero, Aleksey Shatunov,
Maryam Shoai, and Wouter van Rheenen did the genotyping anddata analysis. Daniel Stahl contributed to data interpretation,writing, and revision of the manuscript. Ashley R Jones, Ben Gaastra,and Isabella Fogh contributed to the revision of the manuscript andall authors approved the manuscript. Christopher E. Shaw, Bradley NSmith, John F Powell, Safa Al-Sarraj, Andrea Malaspina, Pietro Fratta,Katie Sidle, John Hardy, Richard Orrell, Claire Troakes, Jan H. Veldink,and Leonard H. van den Berg contributed samples or genotypes orboth. Peter M. Andersen, Nancy M. Bonini, Francesca L. Conforti,Philip Van Damme, Hussein Daoud, Maria Del Mar Amador, MonicaForzan, Cinzia Gellera, Aaron D. Gitler, Edor Kabashi, Vincenzo LaBella, Isabelle Le Ber, Tim Van Langenhove, Serena Lattante, Yi-ChungLee, Andrea Malaspina, Vincent Meininger, Stèphanie Millecamps,Rosa Rademakers, Wim Robberecht, Guy Rouleau, Owen A. Ross,Francois Salachas, Bing-Wen Soong, Gianni Sorarù, Giovanni Steva-nin, and Christine van Broeckhoven contributed genotypes data orinformation not reported in the manuscripts included in the sys-tematic review and meta-analysis.
Appendix A. Supplementary data
Supplementary data associated with this article can be found, inthe online version, at http://dx.doi.org/10.1016/j.neurobiolaging.2016.11.010.
References
Abel, O., Powell, J.F., Andersen, P.M., Al-Chalabi, A., 2012. ALSoD: a user-friendlyonline bioinformatics tool for amyotrophic lateral sclerosis genetics. Hum.Mutat. 33, 1345e1351.
Al-Chalabi, A., Calvo, A., Chio, A., Colville, S., Ellis, C.M., Hardiman, O., Heverin, M.,Howard, R.S., Huisman, M.H., Keren, N., Leigh, P.N., Mazzini, L., Mora, G.,Orrell, R.W., Rooney, J., Scott, K.M., Scotton, W.J., Seelen, M., Shaw, C.E.,Sidle, K.S., Swingler, R., Tsuda, M., Veldink, J.H., Visser, A.E., van den Berg, L.H.,Pearce, N., 2014. Analysis of amyotrophic lateral sclerosis as a multistep process:a population-based modelling study. Lancet Neurol. 13, 1108e1113.
Al-Chalabi, A., Hardiman, O., 2013. The epidemiology of ALS: a conspiracy of genes,environmental and time. Nat. Rev. Neurol. 9, 617e628.
Burnham, K.P., Anderson, D.R., 2002. Model Selection and Multimodel Inference: APractical Information-theoretic Approach. Springer-Verlag, New York.
Chen, Y., Huang, R., Yang, Y., Chen, K., Song, W., Pan, P., Li, J., Shang, H.F., 2011. Ataxin-2 intermediate-length polyglutamine: a possible risk factor for Chinese patientswith amyotrophic lateral sclerosis. Neurobiol. Aging 32, 1925.
Chiò, A., Calvo, A., Moglia, C., Canosa, A., Brunetti, M., Barberis, M., Restagno, G.,Conte, A., Bisogni, G., Marangi, G., Moncada, A., Lattante, S., Zollino, M.,Sabatelli, M., Bagarotti, A., Corrado, L., Mora, G., Bersano, E., Mazzini, L.,D’Alfonso, S. PARALS, 2015. ATXN2 polyQ intermediate repeats are a modifier ofALS survival. Neurology 84, 251e258.
Conforti, F.L., Spataro, R., Sproviero, W., Mazzei, R., Cavalcanti, F., Condino, F.,Simone, I.L., Logroscino, G., Patitucci, A., Magariello, A., Muglia, M., Rodolico, C.,Valentino, P., Bono, F., Colletti, T., Monsurrò, M.R., Gambardella, A., La Bella, V.,2012. Ataxin-1 and ataxin-2 intermediate-length PolyQ expansions in amyo-trophic lateral Sclerosis. Neurology 79, 2315e2320.
Corrado, L., Mazzini, L., Oggioni, G.D., Luciano, B., Godi, M., Brusco, A., D’Alfonso, S.,2011. ATXN-2 CAG repeat expansions are interrupted in ALS patients. Hum.Genet. 130, 575e580.
Daoud, H., Belzil, V., Martins, S., Sabbagh, M., Provencher, P., Lacomblez, L.,Meininger, V., Camu, W., Dupré, N., Dion, P.A., Rouleau, G.A., 2011. Association oflong ATXN2 CAG repeat sizes with increased risk of amyotrophic lateral scle-rosis. Arch. Neurol. 68, 739e742.
Elden, A.C., Kim, H.J., Hart, M.P., Chen-Plotkin, A.S., Johnson, B.S., Fang, X.,Armakola, M., Geser, F., Greene, R., Lu, M.M., Padmanabhan, A., Clay-Falcone, D.,McCluskey, L., Elman, L., Juhr, D., Gruber, P.J., Rüb, U., Auburger, G.,Trojanowski, J.Q., Lee, V.M., Van Deerlin, V.M., Bonini, N.M., Gitler, A.D., 2010.Ataxin-2 intermediate-length polyglutamine expansions are associated withincreased risk for ALS. Nature 466, 1069e1075.
Fernandez, M., McClain, M.E., Martinez, R.A., Snow, K., Lipe, H., Ravits, J., Bird, T.D., LaSpada, A.R., 2000. Late-onset SCA2: 33 CAG repeats are sufficient to causedisease. Neurology 55, 569e572.
Gellera, C., Ticozzi, N., Pensato, V., Nanetti, L., Castucci, A., Castellotti, B., Lauria, G.,Taroni, F., Silani, V., Mariotti, C., 2012. ATAXIN2 CAG-repeat length in Italianpatients with amyotrophic lateral sclerosis: risk factor or variant phenotype?Implication for genetic testing and counseling. Neurobiol. Aging 33, 1847.
Gispert, S., Kurz, A., Waibel, S., Bauer, P., Liepelt, I., Geisen, C., Gitler, A.D., Becker, T.,Weber, M., Berg, D., Andersen, P.M., Krüger, R., Riess, O., Ludolph, A.C.,Auburger, G., 2012. The modulation of Amyotrophic Lateral Sclerosis risk by

W. Sproviero et al. / Neurobiology of Aging 51 (2017) 178.e1e178.e9 178.e9
ataxin-2 intermediate polyglutamine expansions is a specific effect. Neurobiol.Dis. 45, 356e361.
Huisman, M.H., de Jong, S.W., van Doormaal, P.T., Weinreich, S.S., Schelhaas, H.J., vander Kooi, A.J., de Visser, M., Veldink, J.H., van den Berg, L.H., 2011. Populationbased epidemiology of amyotrophic lateral sclerosis using capture-recapturemethodology. J. Neurol. Neurosurg. Psychiatry 82, 1165e1170.
Jin, P., Warren, S.T., 2000. Understanding the molecular basis of fragile X syndrome.Hum. Mol. Genet. 9, 901e908.
Kayatekin, C., Matlack, K.E., Hesse, W.R., Guan, Y., Chakrabortee, S., Russ, J.,Wanker, E.E., Shah, J.V., Lindquist, S., 2014. Prion-like proteins sequester andsuppress the toxicity of huntingtin exon 1. Proc. Natl. Acad. Sci. U. S. A. 111,12085e12090.
Khoshbakht, R., Soltanzadeh, A., Zamani, B., Abdi, S., Gharagozli, K., Kahrizi, K.,Khoshbakht, R., Nafissi, S., 2014. Correlation between distribution of muscleweakness, electrophysiological findings and CTG expansion in myotonic dys-trophy. J. Clin. Neurosci. 21, 1123e1126.
Kim, J.M., Hong, S., Kim, G.P., Choi, Y.J., Kim, Y.K., Park, S.S., Kim, S.E., Jeon, B.S., 2007.Importance of low-range CAG expansion and CAA interruption in SCA2Parkinsonism. Arch. Neurol. 64, 1510e1518.
Koeppen, A.H., 2011. Friedreich’s ataxia: pathology, pathogenesis, and moleculargenetics. J. Neurol. Sci. 303, 1e12.
Laffita-Mesa, J.M., Velázquez-Pérez, L.C., Santos Falcón, N., Cruz-Mariño, T., GonzálezZaldívar, Y., Vázquez Mojena, Y., Almaguer-Gotay, D., Almaguer Mederos, L.E.,Rodríguez Labrada, R., 2012. Unexpanded and intermediate CAG poly-morphisms at the SCA2 locus (ATXN2) in the Cuban population: evidence aboutthe origin of expanded SCA2 alleles. Eur. J. Hum. Genet. 20, 41e49.
Lahut, S., Ömür, Ö., Uyan, Ö., A�gım, Z.S., Özo�guz, A., Parman, Y., Deymeer, F.,Oflazer, P., Koç, F., Özçelik, H., Auburger, G., Basak, A.N., 2012. ATXN2 and itsneighbouring gene SH2B3 are associated with increased ALS risk in the Turkishpopulation. PLoS One 7, e42956.
Lattante, S., Millecamps, S., Stevanin, G., Rivaud-Péchoux, S., Moigneu, C.,Camuzat, A., Da Barroca, S., Mundwiller, E., Couarch, P., Salachas, F.,Hannequin, D., Meininger, V., Pasquier, F., Seilhean, D., Couratier, P., Danel-Brunaud, V., Bonnet, A.M., Tranchant, C., LeGuern, E., Brice, A., Le Ber, I.,Kabashi, E. French Research Network on FTD and FTD-ALS, 2014. Contribution ofATXN2 intermediary polyQ expansions in a spectrum of neurodegenerativedisorders. Neurology 83, 990e995.
Lee, T., Li, Y.R., Ingre, C., Weber, M., Grehl, T., Gredal, O., de Carvalho, M., Meyer, T.,Tysnes, O.B., Auburger, G., Gispert, S., Bonini, N.M., Andersen, P.M., Gitler, A.D.,2011. Ataxin-2 intermediate-length polyglutamine expansions in European ALSpatients. Hum. Mol. Genet. 20, 1697e1700.
Liberati, A., Altman, D.G., Tetzlaff, J., Mulrow, C., Gøtzsche, P.C., Ioannidis, J.P.,Clarke, M., Devereaux, P.J., Kleijnen, J., Moher, D., 2009. The PRISMA statementfor reporting systematic reviews and meta-analyses of studies that evaluatehealth care interventions: explanation and elaboration. J. Clin. Epidemiol. 62,e1ee34.
Liu, X., Lu, M., Tang, L., Zhang, N., Chui, D., Fan, D., 2013. ATXN2 CAG repeat expansionsincrease the risk for Chinese patients with amyotrophic lateral sclerosis. Neuro-biol. Aging 34, 2236.
Lu, H.P., Gan, S.R., Chen, S., Li, H.F., Liu, Z.J., Ni, W., Wang, N., Wu, Z.Y., 2015. Inter-mediate-length polyglutamine in ATXN2 is a possible risk factor among EasternChinese patients with amyotrophic lateral sclerosis. Neurobiol. Aging 36,e11ee14.
Nestor, C.E., Monckton, D.G., 2011. Correlation of inter-locus polyglutamine toxicitywith CAG�CTG triplet repeat expandability and flanking genomic DNA GCcontent. PLoS One 6, e28260.
Neuenschwander, A.G., Thai, K.K., Figueroa, K.P., Pulst, S.M., 2014. Amyotrophiclateral sclerosis risk for spinocerebellar ataxia type 2 ATXN2 CAG repeat alleles:a meta-analysis. JAMA Neurol. 71, 1529e1534.
Paulsen, J.S., Long, J.D., Ross, C.A., Harrington, D.L., Erwin, C.J., Williams, J.K.,Westervelt, H.J., Johnson, H.J., Aylward, E.H., Zhang, Y., Bockholt, H.J., Barker, R.A.PREDICT-HD Investigators and Coordinators of the Huntington Study Group,2014. Prediction of manifest Huntington’s disease with clinical and imagingmeasures: a prospective observational study. Lancet Neurol. 13, 1193e1201.
Pulst, S.M., Nechiporuk, A., Nechiporuk, T., Gispert, S., Chen, X.N., Lopes-Cendes, I.,Pearlman, S., Starkman, S., Orozco-Diaz, G., Lunkes, A., DeJong, P., Rouleau, G.A.,Auburger, G., Korenberg, J.R., Figueroa, C., Sahba, S., 1996. Moderate expansionof a normally biallelic trinucleotide repeat in spinocerebellar ataxia type 2. Nat.Genet. 14, 269e276.
Raftery, A.E., 1995. Bayesian model selection in social research. Sociol. Methodol. 25,111e163.
Ross, O.A., Rutherford, N.J., Baker, M., Soto-Ortolaza, A.I., Carrasquillo, M.M., DeJesus-Hernandez, M., Adamson, J., Li, M., Volkening, K., Finger, E., Seeley, W.W.,Hatanpaa, K.J., Lomen-Hoerth, C., Kertesz, A., Bigio, E.H., Lippa, C.,Woodruff, B.K., Knopman, D.S., White 3rd, C.L., Van Gerpen, J.A., Meschia, J.F.,
Mackenzie, I.R., Boylan, K., Boeve, B.F., Miller, B.L., Strong, M.J., Uitti, R.J.,Younkin, S.G., Graff-Radford, N.R., Petersen, R.C., Wszolek, Z.K., Dickson, D.W.,Rademakers, R., 2011. Ataxin-2 repeat-length variation and neurodegeneration.Hum. Mol. Genet. 20, 3207e3212.
Soong, B.W., Lin, K.P., Guo, Y.C., Lin, C.C., Tsai, P.C., Liao, Y.C., Lu, Y.C., Wang, S.J.,Tsai, C.P., Lee, Y.C., 2014. Extensive molecular genetic survey of Taiwanese pa-tients with amyotrophic lateral sclerosis. Neurobiol. Aging 35, 2423.
Sorarù, G., Clementi, M., Forzan, M., Orsetti, V., D’Ascenzo, C., Querin, G., Palmieri, A.,Ermani, M., Angelini, C., Pegoraro, E., 2011. ALS risk but not phenotype isaffected by ataxin-2 intermediate length polyglutamine expansion. Neurology76, 2030e2031.
Stang, A., 2010. Critical evaluation of the Newcastle-Ottawa scale for the assessmentof the quality of nonrandomized studies in meta-analyses. Eur. J. Epidemiol. 25,603e605.
Tezenas du Montcel, S., Durr, A., Bauer, P., Figueroa, K.P., Ichikawa, Y., Brussino, A.,Forlani, S., Rakowicz, M., Schöls, L., Mariotti, C., van de Warrenburg, B.P.,Orsi, L., Giunti, P., Filla, A., Szymanski, S., Klockgether, T., Berciano, J.,Pandolfo, M., Boesch, S., Melegh, B., Timmann, D., Mandich, P., Camuzat, A.,Clinical Research Consortium for Spinocerebellar Ataxia (CRC-SCA); EUROSCANetwork, Goto, J., Ashizawa, T., Cazeneuve, C., Tsuji, S., Pulst, S.M., Brusco, A.,Riess, O., Brice, A., Stevanin, G., 2014. Modulation of the age at onset in spi-nocerebellar ataxia by CAG tracts in various genes. Brain 137, 2444e2455.
Van Damme, P., Veldink, J.H., van Blitterswijk, M., Corveleyn, A., van Vught, P.W.,Thijs, V., Dubois, B., Matthijs, G., van den Berg, L.H., Robberecht, W., 2011.Expanded ATXN2 CAG repeat size in ALS identifies genetic overlap between ALSand SCA2. Neurology 76, 2066e2072.
Van Langenhove, T., van der Zee, J., Engelborghs, S., Vandenberghe, R., Santens, P.,Van den Broeck, M., Mattheijssens, M., Peeters, K., Nuytten, D., Cras, P., DeDeyn, P.P., De Jonghe, P., Cruts, M., Van Broeckhoven, C., 2012. Ataxin-2 polyQexpansions in FTLD-ALS spectrum disorders in Flanders-Belgian cohorts. Neu-robiol. Aging 33, 1004.
van Rheenen, W., Shatunov, A., Dekker, A.M., McLaughlin, R.L., Diekstra, F.P.,Pulit, S.L., van der Spek, R.A., Võsa, U., de Jong, S., Robinson, M.R., Yang, J.,Fogh, I., van Doormaal, P.T., Tazelaar, G.H., Koppers, M., Blokhuis, A.M.,Sproviero, W., Jones, A.R., Kenna, K.P., van Eijk, K.R., Harschnitz, O.,Schellevis, R.D., Brands, W.J., Medic, J., Menelaou, A., Vajda, A., Ticozzi, N., Lin, K.,Rogelj, B., Vrabec, K., Ravnik-Glava�c, M., Koritnik, B., Zidar, J., Leonardis, L.,Gro�selj, L.D., Millecamps, S., Salachas, F., Meininger, V., de Carvalho, M., Pinto, S.,Mora, J.S., Rojas-García, R., Polak, M., Chandran, S., Colville, S., Swingler, R.,Morrison, K.E., Shaw, P.J., Hardy, J., Orrell, R.W., Pittman, A., Sidle, K., Fratta, P.,Malaspina, A., Topp, S., Petri, S., Abdulla, S., Drepper, C., Sendtner, M., Meyer, T.,Ophoff, R.A., Staats, K.A., Wiedau-Pazos, M., Lomen-Hoerth, C., VanDeerlin, V.M., Trojanowski, J.Q., Elman, L., McCluskey, L., Basak, A.N., Tunca, C.,Hamzeiy, H., Parman, Y., Meitinger, T., Lichtner, P., Radivojkov-Blagojevic, M.,Andres, C.R., Maurel, C., Bensimon, G., Landwehrmeyer, B., Brice, A., Payan, C.A.,Saker-Delye, S., Dürr, A., Wood, N.W., Tittmann, L., Lieb, W., Franke, A.,Rietschel, M., Cichon, S., Nöthen, M.M., Amouyel, P., Tzourio, C., Dartigues, J.F.,Uitterlinden, A.G., Rivadeneira, F., Estrada, K., Hofman, A., Curtis, C., Blauw, H.M.,van der Kooi, A.J., de Visser, M., Goris, A., Weber, M., Shaw, C.E., Smith, B.N.,Pansarasa, O., Cereda, C., Del Bo, R., Comi, G.P., D’Alfonso, S., Bertolin, C.,Sorarù, G., Mazzini, L., Pensato, V., Gellera, C., Tiloca, C., Ratti, A., Calvo, A.,Moglia, C., Brunetti, M., Arcuti, S., Capozzo, R., Zecca, C., Lunetta, C., Penco, S.,Riva, N., Padovani, A., Filosto, M., Muller, B., Stuit, R.J., PARALS Registry; SLALOMGroup; SLAP Registry; FALS Sequencing Consortium; SLAGEN Consortium;NNIPPS Study Group, Blair, I., Zhang, K., McCann, E.P., Fifita, J.A., Nicholson, G.A.,Rowe, D.B., Pamphlett, R., Kiernan, M.C., Grosskreutz, J., Witte, O.W., Ringer, T.,Prell, T., Stubendorff, B., Kurth, I., Hübner, C.A., Leigh, P.N., Casale, F., Chio, A.,Beghi, E., Pupillo, E., Tortelli, R., Logroscino, G., Powell, J., Ludolph, A.C.,Weishaupt, J.H., Robberecht, W., Van Damme, P., Franke, L., Pers, T.H.,Brown, R.H., Glass, J.D., Landers, J.E., Hardiman, O., Andersen, P.M., Corcia, P.,Vourc’h, P., Silani, V., Wray, N.R., Visscher, P.M., de Bakker, P.I., van Es, M.A.,Pasterkamp, R.J., Lewis, C.M., Breen, G., Al-Chalabi, A., van den Berg, L.H.,Veldink, J.H., 2016. Genome-wide association analyses identify new risk vari-ants and the genetic architecture of amyotrophic lateral sclerosis. Nat. Genet.48, 1043e1048.
Wang, M.D., Gomes, J., Cashman, N.R., Little, J., Krewski, D., 2014. Intermediate CAGrepeat expansion in the ATXN2 gene is a unique genetic risk factor for ALS-asystematic review and meta-analysis of observational studies. PLoS One 9,e105534.
Yang, X.W., Yamamoto, A., 2014. CLEARance wars: PolyQ strikes back. Nat. Neurosci.17, 1140e1142.
Yu, Z., Zhu, Y., Chen-Plotkin, A.S., Clay-Falcone, D., McCluskey, L., Elman, L.,Kalb, R.G., Trojanowski, J.Q., Lee, V.M., Van Deerlin, V.M., Gitler, A.D.,Bonini, N.M., 2011. PolyQ repeat expansions in ATXN2 associated with ALS areCAA interrupted repeats. PLoS One 6, e17951.


![[3] - Vrije Universiteit Brussel | Redelijk Web viewInstitut du Cerveau et de la . Moëlle. épinière, Paris, France ; 6. Université Paris ... levels of sensorimotor experience such](https://static.fdocuments.in/doc/165x107/5a74e16c7f8b9ad22a8c2c36/3-vrije-universiteit-brussel-redelijk-doc-file-web-viewinstitut.jpg)


