
Neural Network Based Methodology for Cavitation Detection in Pressure Dropping Devices ... ·...
10
Indian Society for Non-Destructive Testing Hyderabad Chapter Proc. National Seminar on Non-Destructive Evaluation Dec. 7 - 9, 2006, Hyderabad NDE-2006 Neural Network Based Methodology for Cavitation Detection in Pressure Dropping Devices of PFBR P.K. Gupta 1 , P.A. Kumar 1 , A. Kaul 2 , G.K. Pandey 1 , G. Padmakumar 1 , V. Prakash 1 and C. Anandbabu 1 1 Fast Reactor Technology Group, Indira Gandhi Centre for Atomic Research, Kalpakkam-603 102, [email protected] 2 Netaji Subash Institute of Technology, New Delhi Abstract This paper discusses a reliable, low cost and non-intrusive method of detecting the occurrence of cavitation in the pressure drop devices used for flow zoning in PFBR core. This involves classification of a pressure drop device, under given operating conditions, as cavitating or noncavitating using an adequately trained neural network. In this work, two models are assimilated, namely a process dependent ANN model and a generalized ANN model. The RMS of the wideband [10-100 kHz] acoustic signal and skewness of the acoustic time signal acquired from an accelerometer installed downstream of the test section are fed as features to the process model and generalized model respectively, for training. The networks are trained using feed forward back propagation training algorithm till the test error reduces to a predetermined level. The networks are tested using data not under the training domain and classification errors are derived. This paper discusses the measurements and instrumentation employed, experimental methodology followed, training and testing of the network and discussion on the results obtained. Keywords: Cavitation detection, Artificial Neural Network (ANN), Root Mean Square (RMS), Feed forward back propagation, Network training, Testing, Classification error, Dependence function 1. Introduction The PFBR core is divided into 15 flow zones to regulate flow in proportion to the heat generated in the Fuel Subassembly (FSA) [1]. This flow zoning has been achieved by means of installing the pressure drop devices at the foot of the SA. These pressure drop devices should meet the pressure drop requirement without any cavitation. The cavitation free performance of the device must be ensured because it can lead to reactivity perturbations, positive sodium void coefficient, dimensional changes due to erosion etc. There is an ongoing experimental program in place for assessing the hydraulic performance of flow zoning devices in Fast Reactor Technology Group (FRTG). In this development program, many orifice configurations have been qualified for cavitation free performance, for use in the different flow zones of PFBR. To supplement the experimental program, an ANN based approach for cavitation detection is investigated in which an adequately trained and tested ANN is used to qualify a pressure drop device as cavitating or non-cavitating under given operating conditions so that cavitation characteristics of any device could be
Transcript of Neural Network Based Methodology for Cavitation Detection in Pressure Dropping Devices ... ·...
Indian Society for Non-Destructive Testing Hyderabad Chapter
Proc. National Seminar on Non-Destructive Evaluation Dec. 7 - 9, 2006, Hyderabad
NDE-2006
Neural Network Based Methodology for Cavitation Detection in Pressure
Dropping Devices of PFBR
P.K. Gupta1, P.A. Kumar
1, A. Kaul
2, G.K. Pandey
1, G. Padmakumar
1,
V. Prakash1 and C. Anandbabu
1
1Fast Reactor Technology Group, Indira Gandhi Centre for Atomic Research,
Kalpakkam-603 102, [email protected] 2Netaji Subash Institute of Technology, New Delhi
Abstract
This paper discusses a reliable, low cost and non-intrusive method of detecting the
occurrence of cavitation in the pressure drop devices used for flow zoning in PFBR
core. This involves classification of a pressure drop device, under given operating
conditions, as cavitating or noncavitating using an adequately trained neural network.
In this work, two models are assimilated, namely a process dependent ANN model
and a generalized ANN model. The RMS of the wideband [10-100 kHz] acoustic
signal and skewness of the acoustic time signal acquired from an accelerometer
installed downstream of the test section are fed as features to the process model and
generalized model respectively, for training. The networks are trained using feed forward back propagation training algorithm till the test error reduces to a
predetermined level. The networks are tested using data not under the training domain
and classification errors are derived. This paper discusses the measurements and
instrumentation employed, experimental methodology followed, training and testing
of the network and discussion on the results obtained.
Keywords: Cavitation detection, Artificial Neural Network (ANN), Root Mean Square (RMS), Feed forward back propagation, Network training, Testing,
Classification error, Dependence function
1. Introduction
The PFBR core is divided into 15 flow
zones to regulate flow in proportion to the
heat generated in the Fuel Subassembly
(FSA) [1]. This flow zoning has been
achieved by means of installing the
pressure drop devices at the foot of the SA.
These pressure drop devices should meet
the pressure drop requirement without any
cavitation. The cavitation free performance
of the device must be ensured because it
can lead to reactivity perturbations,
positive sodium void coefficient,
dimensional changes due to erosion etc.
There is an ongoing experimental program
in place for assessing the hydraulic
performance of flow zoning devices in
Fast Reactor Technology Group (FRTG).
In this development program, many orifice
configurations have been qualified for
cavitation free performance, for use in the
different flow zones of PFBR. To
supplement the experimental program, an
ANN based approach for cavitation
detection is investigated in which an
adequately trained and tested ANN is used
to qualify a pressure drop device as
cavitating or non-cavitating under given
operating conditions so that cavitation
characteristics of any device could be

P.K. Gupta
NDE-2006 246
predicted without the need for cavitation
testing.
This paper discusses the cavitation
phenomenon, similarity criterion for
cavitation testing, measurements and data
acquisition, ANN models, training and
testing of the network and discussion on
the results obtained.
2. Theoretical Background
Cavitation phenomenon includes
nucleation, growth and implosion of
vapour or gas filled cavities [2]. These
cavities are formed into a liquid when the
static pressure of the liquid for one reason
or another is reduced below the vapour
pressure of the liquid at a given
temperature. These bubbles expand until
they reach regions of higher pressure on
their path and then implode violently,
producing cascading effects on
neighboring bubbles. This collapse
manifests itself with noise and vibration.
Also, efficiency of a system is reduced due
to cavitation and it could lead to erosion of
the adjacent material surfaces. The noise &
vibration associated with occurrence of
cavitation could be picked up by a high
frequency accelerometer to assess the
cavitation characteristics of a pressure
drop device.
3. Similarity Criteria for Cavitation
Testing
Testing of flow zoning devices in
sodium is expensive, time consuming and
requires special instrumentation [3]. Water
is being used as a test fluid for cavitation
testing due to similar hydraulic
characteristic of sodium, simpler
instrumentation and ease of testing. For
cavitation studies, non dimensional
parameter qualifying intensity of
cavitation, Cavitation Index (CI) [4] is
simulated.
net
vu PPCI
∆
−= (1)
Here ‘Pu’ is the absolute upstream
pressure (Pa) at upstream side of the test
section, ‘Pv’ is the vapor pressure (Pa) of
the test fluid at a given temperature and
‘Pnet’ is the net pressure drop (Pa) across
the test section. Velocity similitude is
required to derive the test flow for a
particular flow zone.
4. Experimental Methodology
The cavitation testing is conducted in a
water test loop using Demineralized (DM)
water. Fig. 1 depicts the geometrical
details of a typical orifice plate. An
assembly of orifice plates is fixed in the
subassembly foot to simulate the upstream
conditions prevailing in the prototype.
Based on velocity similitude, required
water flow at about 40 deg. C is sent
through the test section. The flow is
maintained constant by controlling the
discharge and pump bypass valve in the
test loop. The CI is reduced gradually by
decreasing the upstream pressure. Then,
sufficient time is allowed for stabilizing
the flow and acoustic signals are recorded
for analysis. Fig. 2 shows a blown out
view of the instrumented test section with
the downstream accelerometer installed to
pick the acoustic noise.
5. Instrumentation
The instrument schematic employed for
the studies is shown in Fig. 3. The acoustic
noise is recorded by a high frequency
accelerometer (resonant frequency: 50
kHz) installed downstream of the test
section. The acoustic signal from the
accelerometer is fed to a charge amplifier
and filtered [5 kHz High pass] to avoid
low frequency background vibration. This
signal is then fed to an FFT analyzer and a
digital storage oscilloscope for obtaining
frequency spectra and real-time plot
respectively. Flow rate is measured by
volume collection method with an
estimated accuracy of ± 0.5 %. Pressure
drop across the test section is measured
using Differential Pressure Transmitter
(DPT). Temperature of water is measured

Cavitation Detection in Pressure Dropping Devices of PFBR
NDE-2006 247
by Resistance Temperature Detectors
(RTD).
6. ANN Methodology
Nowadays, ANN are being applied to a
lot of real world, industrial problems, from
functional prediction and system modeling
(where physical processes are not well
understood or are highly complex), to
pattern recognition engines and robust
classifiers, with the ability to generalize
while making decisions about imprecise
input data [5]. The beauty of ANN is that
the ability to learn and approximate
relationships between input and output is
decoupled from the size and complexity of
the problem [6]. An artificial neural
network (ANN) is a model consisting of
many processing neurons in layered
structures. ANNs learn to associate given
outputs with given inputs by adjusting the
weights of neuronal connections. ANNs
are classified by learning procedure such
as supervised learning and unsupervised
learning.
In this investigation, two approaches
were attempted to build ANN models. In
the first approach, a process based ANN
model is built with upstream pressure and
flow as the input variables and probability
of cavitation as the output. In the second
approach, a generalized ANN model is
assimilated with only statistical parameter,
namely skewness (third moment of mean)
of the acoustic time signal as the input and
probability of cavitation as the output. For
both the models, a multilayer perceptron
(MLP) based feed forward ANN has been
used with back propagation training. The
process dependent ANN model is depicted
in Fig. 4 where as generalized model
architecture is shown in Fig. 5.
MLP network has greater
representational power for dealing with
highly non-linear, strongly coupled and
multivariable system [7]. MLP is
composed of simple perceptron in a
hierarchical structure forming a feed
forward topology with one or more hidden
layers between input and output. The
neutrons are expanded by a threshold
factor and the sigmoid function, given by,
)1/(1)( xexf −+= (2)
is employed as the activation function,
the network is trained using back
propagation training algorithm.
The objective is to minimize the
instantaneous value of total error energy,
given by, and of average error energy,
given by,
( )2)5.0( ∑ −= n
j
n
j
n ydE (3)
and of average error energy, given by,
∑=
=N
n
n
av EN
E1
1 (4)
where n denotes the number of epochs,
En is the instantaneous value of total error
energy, Eav is the average error energy; N
is the total number of training pattern, n
jd
is the target output for neuron j and n
jy is
the network output of neuron j. In the back
propagation algorithm, the error between
target output and the network output is
calculated and this would be back
propagated using steepest descent or
gradient approach. The network weights
are adjusted by moving a small step in the
direction of negative gradient of error
surface during iteration. The iterations are
repeated until a specified convergence is
reached. The convergence criterion for the
network is determined by the average root-
mean-square (RMS) error between the
desired and predicted output values,
∑∑==
−=p
j
jiji
n
i
RMS ydpN
E1
2
1
)(/11
(5)
Where ERMS is the average root-mean
square, N is the number of training or
testing data and p is the number of
variables in the output.

P.K. Gupta
NDE-2006 248
Fig. 1: Geometrical details for Zone VII orifice plate instrumented
Fig. 2: Blown out view of the instrumented test section

Cavitation Detection in Pressure Dropping Devices of PFBR
NDE-2006 249
Fig. 3: Instrument Schematic for Cavitation detection and analysis
Fig. 4: Process dependent ANN model
Fig. 5: Generalized ANN model
P.K. Gupta
NDE-2006 250
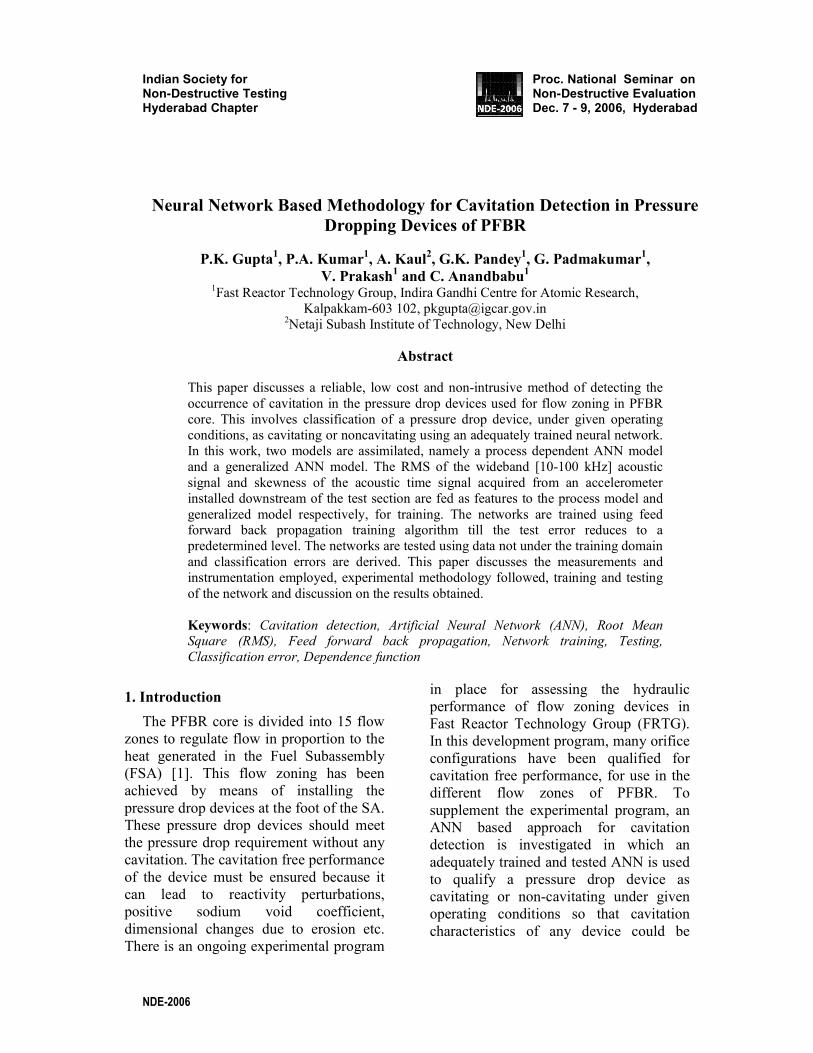
Fig. 6: Learning curve for the process dependent ANN model
Fig. 7: Learning curve for the generalized ANN model
Table 1: Matrix of confusion for the ANN model
Table 2: Table of errors for the process dependent ANN model
Cavitation Detection in Pressure Dropping Devices of PFBR
NDE-2006 251
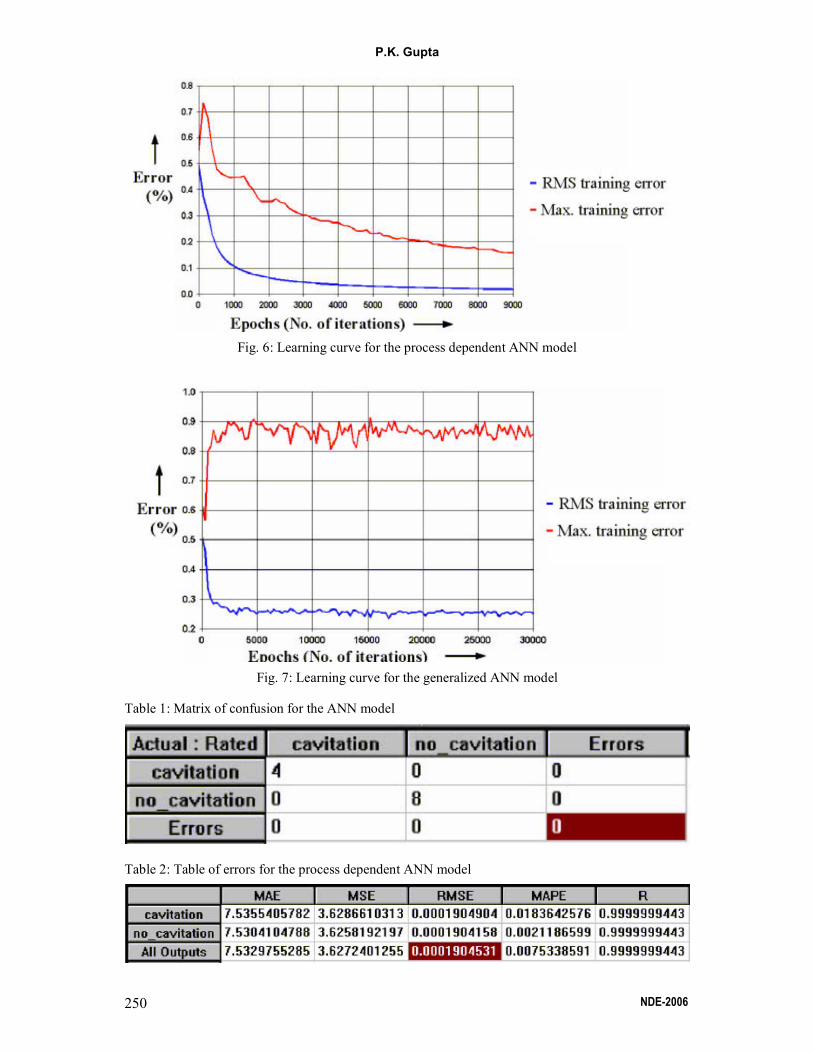
Fig. 8: Dependence function showing relationship between upstream pressure and probability of cavitation occurrence
Fig. 9: Dependence function showing relationship between probability of cavitation occurrence and flow
P.K. Gupta
NDE-2006 252
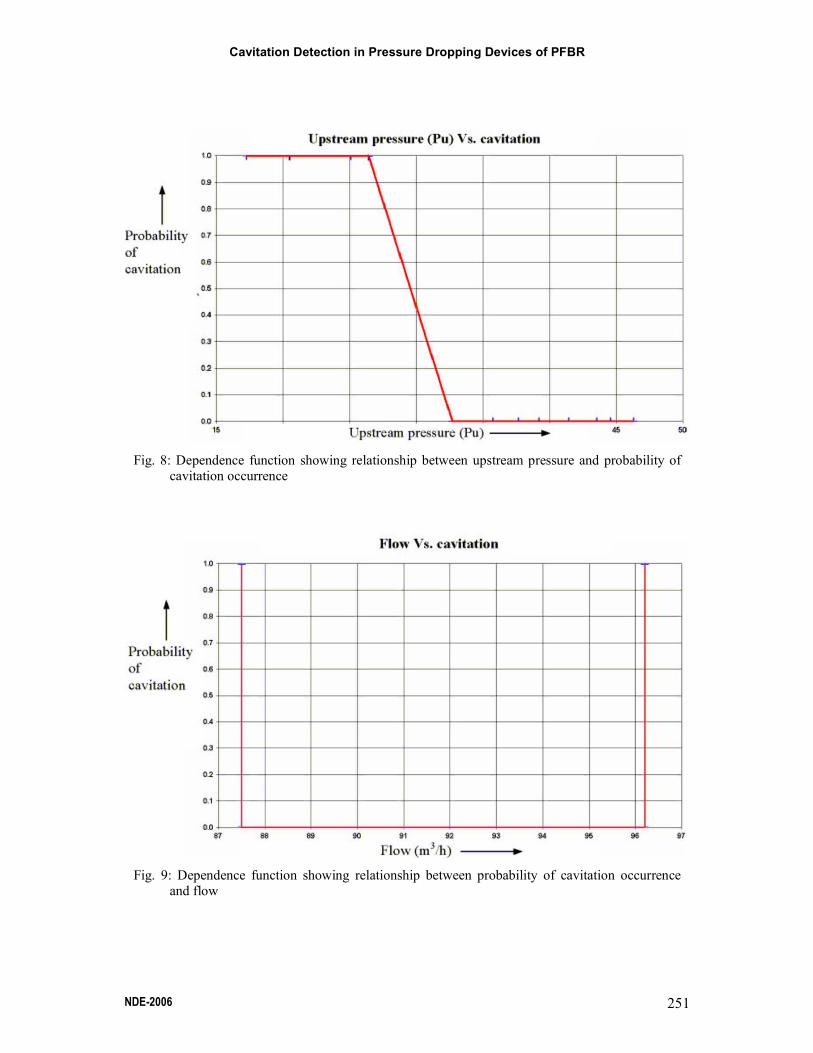
Fig. 10: Dependence function for the generalized ANN model
Table 3: Matrix of Confusion
Table 4: Errors for the generalized ANN model
6.1 ANN Training
The network is trained using feed
forward back propagation training algorithm
with supervised learning. Out of the total 35
datasets available, 23 randomly selected
datasets were used during the training phase
and remaining 12 were used to test the
trained network for consistency. The
training data for the process dependent
ANN consisted of values of Pu and Flow
along with the corresponding classification
into cavitating and non-cavitating randomly
selected from the total data set. The network
learning proceeded for 9000 epochs till the
test error reduces to 0.02 %. The learning
curve for the process dependent network is
depicted in Fig. 6.
For the generalized ANN, out of the total
56 data sets, 38 randomly selected datasets
were used during the training phase and
remaining 18 were used to test the trained
network. The network learning proceeded
Cavitation Detection in Pressure Dropping Devices of PFBR
NDE-2006 253
for 30000 epochs till the test error reduces
to 0.25 %. The learning curve for the
generalized network is shown in Fig. 7.
7. Results and Discussions
Table 1 tabulates the matrix of confusion
obtained from the process dependent
network. This compares the test outputs
with the expected outputs and thus
quantifies the errors.
As can be inferred from table 1, the
process dependent model is able to classify
all the datasets correctly. The quantified
error estimates are tabulated in table 2. The
error to be noted here is the RMSE error,
whose value is as low as 0.02%. We have
tried to incorporate the physical
understanding of the cavitation process into
the ANN model by estimating the
dependence of the network output to the
input parameters, i.e. the dependence of the
probability of cavitation occurrence on the
upstream pressure and flow. The
dependence functions for upstream pressure
and flow are plotted in Fig. 8 and Fig. 9
respectively. As expected, there is a strong
correlation between the probability of
cavitation occurrence and upstream pressure
and a very weak relationship with flow
variation.
However, it should be noted that flow
range tested in the experiments is very
narrow and no definite conclusion could be
drawn based on the limited data available. It
is postulated that since formation and
collapsing of bubbles would be higher in
case of higher flow, due to high turbulence,
occurrence of cavitation should be
correlated with flow.
However, from the viewpoint of the
classification accuracy, the results are not
very encouraging, as tabulated in table 3.
The network made 3 incorrect
classifications out of a total of 18, for
16.67% classification error. The
corresponding RMS error is 34%. This high
error could be attributed to limited dataset at
the training stage. This model could be fine
tuned with datasets obtained from cavitation
testing of the pressure drop devices from
other flow zones of PFBR so that prediction
accuracy could be improved.
8. Conclusions
A non-intrusive cavitation detection
approach based on the ANN model with
upstream pressure and flow as the input
parameters has been demonstrated. The
network was trained using feed forward
back propagation algorithm with supervised
learning with Root Mean Square (RMS) of
the wideband acoustic noise signal as the
extracted feature. The network was found to
be effective with classification accuracy of
100% and RMS error of 0.02%. The
probability of cavitation occurrence is found
to be a strong function of the upstream
pressure and has weak dependence on flow
variation. A generalized ANN model is also
assimilated with skewness as the
classification feature in which it is found
that the incidence of cavitation could be
characterized by the sign change of
skewness (from +ve to –ve) of the acoustic
noise.
9. Future work
The classification accuracy of the
generalized ANN could be improved by
incorporating cavitation testing data from
the pressure drop devices of other fuel zones
of PFBR. This network could be generalized
further to obtain an online intelligent
algorithm for anomaly detection in fast
breeder reactors. Specifically, leak,
cavitation and other mechanical vibration
signals could be differentiated in a running
nuclear plant based on a generalized fault
detection ANN model, which had been
trained based on the experimental leak,
cavitation and mechanical vibration signals.
10. References
1. Prototype Fast Breeder Reactor – Preliminary Safety Analysis Report,
Chapter 5.2 – Core Engineering, February
2004.
P.K. Gupta
NDE-2006 254
2. Timo Koivula, On cavitation in fluid power, Proceedings of 1st FPNI – PhD Symposium,
2000, Hamburg, Germany, pp. 371 – 382.
3. H.J. Bomeluberg, 1968, An evaluation of
the applicability of water model testing to
liquid metal engineering problems, Liquid
Metal Engineering Centre Report.
4. Tullis. J, Cavitation guide for Control Valves, NUREG/CR-6031 (1993)
5. Magali R.G. Meireles, Paulo E. M.
Almeida, A comprehensive review for
Industrial applicability of Artificail Neural
Networks, IEEE transactions on Industrial
Electronics, Vol. 50, No. 3, June 2003, pp
585-601.
6. S. Haykin, Neural Networks: A comprehensive foundation, 2nd edition, New
York: Prentice-Hall, 1995.
7. S.C. Juang, Y.S. Tarang and H.R. Lii, A
comparison between the back-propagation
and counter-propagation networks in the
modeling of the TIG welding process,
Journal of Materials Processing
Technology, Vol. 75, 1998, pp. 54 – 62.


![Experimental Research on Cavitation Erosion Detection Based on … · 2012-10-09 · estimate cavitation erosion by observing the removal of the paint [3]. They detect cavitation](https://static.fdocuments.in/doc/165x107/5e93bba127dcb37304714469/experimental-research-on-cavitation-erosion-detection-based-on-2012-10-09-estimate.jpg)


