Network Pa−erns of Legislative Collaboration in Twenty ... · Network Pa−erns of Legislative...
36
Network Paerns of Legislative Collaboration in Twenty Parliaments Franc ¸ois Briae [email protected] Supplementary online material is appendix contains detailed information on the data and networks briey documented in the short note “Network Paerns of Legislative Collaboration in Twenty Parliaments”. Section A starts by reviewing the existing literature on legislative cosponsorship as a strategic position-taking device for legis- lators within parliamentary chambers. Section B then documents the data collection process, Section C summarises its results, and Section D contains the full list of party abbreviations used in the data. Section E fully documents how the cosponsorship networks were constructed and weighted, and lists some derived measures. e replication material for this study is available at https://github.com/ briatte/parlnet. e code was wrien in R (R Core Team, 2015), and the cur- rent release of the repository is version 2.6. See the README le of the reposi- tory for detailed replication instructions including package dependencies. e raw data up to January 2016 are available at doi:10.5281/zenodo.44440. CONTENTS A Background information on legislative cosponsorship . . . . . . . . . 2 B Sample denition and data collection . . . . . . . . . . . . . . . 4 B.1 Bills ........................................ 4 B.2 Sponsors ..................................... 10 C Descriptive statistics by country, chamber and legislature . . . . . . . . 11 D Party abbreviations and Le/Right scores . . . . . . . . . . . . . . 17 E Cosponsorship network construction . . . . . . . . . . . . . . . 27 E.1 Edge weights ................................... 28 E.2 Network objects ................................. 30 E.3 Network descriptors ............................... 31 References . . . . . . . . . . . . . . . . . . . . . . . . . . . 35 1
Transcript of Network Pa−erns of Legislative Collaboration in Twenty ... · Network Pa−erns of Legislative...

Network Pa�erns of Legislative Collaboration in Twenty Parliaments
Francois Bria�[email protected]
Supplementary online material
�is appendix contains detailed information on the data and networks brie�ydocumented in the short note “Network Pa�erns of Legislative Collaborationin Twenty Parliaments”. Section A starts by reviewing the existing literatureon legislative cosponsorship as a strategic position-taking device for legis-lators within parliamentary chambers. Section B then documents the datacollection process, Section C summarises its results, and Section D containsthe full list of party abbreviations used in the data. Section E fully documentshow the cosponsorship networks were constructed and weighted, and listssome derived measures.�e replication material for this study is available at https://github.com/
briatte/parlnet. �e code was wri�en in R (R Core Team, 2015), and the cur-rent release of the repository is version 2.6. See the README �le of the reposi-tory for detailed replication instructions including package dependencies. �eraw data up to January 2016 are available at doi:10.5281/zenodo.44440.
CONTENTS
A Background information on legislative cosponsorship . . . . . . . . . 2
B Sample de�nition and data collection . . . . . . . . . . . . . . . 4
B.1 Bills . . . . . . . . . . . . . . . . . . . . . . . . . . . . . . . . . . . . . . . . 4
B.2 Sponsors . . . . . . . . . . . . . . . . . . . . . . . . . . . . . . . . . . . . . 10
C Descriptive statistics by country, chamber and legislature . . . . . . . . 11
D Party abbreviations and Le�/Right scores . . . . . . . . . . . . . . 17
E Cosponsorship network construction . . . . . . . . . . . . . . . 27
E.1 Edge weights . . . . . . . . . . . . . . . . . . . . . . . . . . . . . . . . . . . 28
E.2 Network objects . . . . . . . . . . . . . . . . . . . . . . . . . . . . . . . . . 30
E.3 Network descriptors . . . . . . . . . . . . . . . . . . . . . . . . . . . . . . . 31
References . . . . . . . . . . . . . . . . . . . . . . . . . . . 35
1

A. BACKGROUND INFORMATION ON LEGISLATIVE COSPONSORSHIP
Legislative scholarship o�ers a wealth of studies that stress the importance of collabo-ration between Members of Parliament (MPs) in the lawmaking process. Cosponsorshipfrequently features among these collaborative cues: while in o�ce, MPs are o�en grantedthe opportunity to support each other by apposing their joint signatures on a piece oflegislation, such as an amendment, a bill or a nonbinding resolution. �e possibility tonominally cosponsor legislation does not exist in every single representative democracy,but it is fairly common in both parliamentary and presidential se�ings, and has been forseveral decades in countries such as the United States (Campbell, 1982), Argentina andChile (Aleman and Calvo, 2013; Micozzi, 2014), and in several European countries.
�ere are several ways to explain, however, why MPs decide to cosponsor legislation to-gether. Parliaments are highly strategic environments where multiple goals such as lead-ership, policy-speci�c in�uence or reelection can be pursued all at once, thereby makingit implausible to trace down cosponsorship to a single explanatory factor. Accordingly,scholars of legislative behaviour have come up with multiple reasons for cosponsorship tooccur, largely out of observations of such behaviour in the U.S. Congress (Schiller, 1995;Kessler and Krehbiel, 1996; Wilson and Young, 1997; Koger, 2003).
Taken as a whole, this segment of the literature broadly conceptualises legislative cospon-sorship as a strategic position-taking device that allows a legislator to convey a signal toother legislators or to external constituents. As such, cosponsorship may seem similar toroll call votes, but as several authors have pointed out, many of the constraints that applyto parliamentary votes are less e�ective when it comes to initiating legislation: speci�-cally, cosponsorship is o�en less subject to party discipline, insofar as party leaders andparty whips exert less in�uence over it than they do over voting behaviour (Schiller, 1995;Desposato, Kearney and Crisp, 2011; Aleman and Calvo, 2013).
Consequently, while cosponsorship might share some of the properties of �oor votes withregards to its ability to shape the legislative agenda, it might also be viewed as akin tothe other “non-roll call position taking devices” available to legislators, such as speechesor wri�en communications, which MPs can resort to as “mechanisms to target voters, butalso interest groups, party leaders, expected presidential candidates, and even racial or eth-nic clusters” (Micozzi, 2014, p. 1188). �is de�nition stresses the importance of electoralincentives and political ambition in the reasoning that might underlie the act of cospon-sorship, along other possible goals such as increasing the likelihood of approval of a pieceof legislation (Wilson and Young, 1997; Tam Cho and Fowler, 2010) or pursuing a speci�cpolicy stance (Koger, 2003; Aleman and Calvo, 2013).
Given the multiplicity of meanings that can be a�ributed to cosponsorship, it might also beuseful to de�ne it negatively, by explaining what it does not embody. Speci�cally, severalscholars have raised the issue that cosponsorship might represent li�le more than “cheaptalk” between legislators, since the act of cosponsorship is trivially time-demanding in it-self and the cost of cosponsorship is low, with few penalties and possibly high rewards incase of legislative success (Kessler and Krehbiel, 1996; Wilson and Young, 1997; Fowler,2006a). In practice, however, cosponsorship appears to be much more selective than sys-tematic: existing studies show that MPs cosponsor only a very small fraction of all legisla-tion, which might be explained by the “substantial search cost involved in deciding whichbills to cosponsor” (Fowler, 2006a, p. 459), or by the private nature of the interactionsthat result in legislation to be cosponsored (Micozzi, 2014, fn. 1, p. 1204). In either case,
2

cosponsorship is much less likely to come out as a generalised, inexpensive signal withli�le meaning a�ached to it, than as a proxy for the existence of collaborative relationships– or, from a network perspective, ties – between MPs.
Even if cosponsorship characterises as a non-trivial act, uncertainty yet remains with re-gards to the decision of legislators not to cosponsor a given piece of legislation. �is issueseverely a�ects the opportunity to use cosponsorship as an alternative measurement toroll call votes: although some studies report broad agreement between ideal points mea-sured from both sources (Aleman et al., 2009), the decision not to cosponsor legislationis hardly equivalent to voting against it (Desposato, Kearney and Crisp, 2011). A safercourse of research might therefore consist in asking broad, descriptive questions aboutthe determinants of legislative cosponsorship, rather than focusing on its potential valueas a benchmark of individual ideological positions.
�is brief overview of existing research leaves us with a question that seems particularly�t for comparative inquiry: which factors, if any, might explain the act of cosponsorshipacross parliamentary environments? Since cosponsorship is inherently relational, manystudies have begun to answer that question by suggesting that legislators are not sim-ply concerned by what they cosponsor, but also with whom, thus making it a dual act ofposition-taking: through the joint sponsorship of selected legislative items, MPs not onlyexpress preferential a�achment to speci�c issues, but also preferential a�achment to otherlegislators (Gross, Kirkland and Shalizi, 2012).
�is last argument features prominently in recent studies of legislative cosponsorship,which have made use of social network analysis to account for it. In its simplest form,the hypothesis translates into the phenomenon known as homophily (McPherson, Smith-Lovin and Cook, 2001): legislators are more prone to cosponsor the work of other legis-lators when they share some characteristics, such as ethnicity (Bra�on and Rouse, 2011),gender (Clark and Caro, 2013), constituency (Aleman and Calvo, 2013) or commi�ee mem-bership (Kirkland and Gross, 2012). Under more complex assumptions, cosponsorshipmight also emerge from strategic decisions where dissimilar sponsors ally in order tomaximise their legislative success, thereby forming “weak ties” motivated by outcomeconsiderations (Kirkland, 2011).
A further argument of interest about the determinants of legislative cosponsorship hasbeen laid out by Kirkland (2014). Since cosponsorship is essentially a process of partnerselection, the structure of legislative assemblies might play an additional role in that op-eration. As Kirkland (2014, p. 169) explains, “legislators must balance their choices aboutcollaboration with the uncertainty surrounding those relational decisions”; as a conse-quence, “any institutional structures that alter the level of information, and by extensionuncertainty, in a chamber regarding bill outcomes or bill sponsors will a�ect cosponsor-ship choices” (Kirkland, 2014, p. 172). In that perspective, the size of the chamber and ofits parliamentary commi�ees might respectively hinder or enable learning among legis-lators, thereby a�ecting their overall propensity to cosponsor and/or their propensity tocosponsor across party lines.
�e literature on legislative cosponsorship therefore contains many empirical puzzles,ranging from the strategic motives that underlie cosponsorship to the individual and in-stitutional factors that might be used to predict its occurrence. Based on a methodologicalframework that turns several additional parliamentary chambers into candidates for net-work studies of legislative behaviour, the data presented in this appendix and in the notethat it supports o�er an opportunity to further explore that puzzle across space and time.
3

B. SAMPLE DEFINITION AND DATA COLLECTION
In order to broaden the empirical base for research on legislative cosponsorship to a largerset of parliaments than currently available through existing studies, we surveyed the o�-cial websites of 33 parliaments, including all current member states of the European Unionand all four members of the European Free Trade Association (Iceland, Liechtenstein, Nor-way and Switzerland), to which we added one non-European democracy (Israel). We thenused several Web scraping technologies to collect information on private bills and theirsponsors from these websites.1
Table B1 shows an overview of the data that we have managed to collect so far. �e datacover 27 parliamentary chambers in 20 countries, over a total of 558 cumulative years splitinto 150 legislatures, understood as periods between two nationwide legislative elections.2�e sample contains a mix of unicameral and bicameral parliamentary systems, includingthree federal regimes (Austria, Belgium and Switzerland). �e country-chamber codesshown in the table are reused at several points in the �gures and tables of this document.
B.1. Bills
�is study is focused on the cosponsorship of private bills, de�ned as law proposals ini-tiated by one or more MPs that become binding if they make it through the legislativeprocess of their country of introduction. �is de�nition is compatible with the theoreticalassumptions outlined in Section A on how MPs signal their positions to their constituentsor to third parties, and is comparable across countries: it corresponds, for instance, to thede�nition of propositions de loi in Belgium and France, or to torvenyjavaslat in Hungaryand lagafrumvorp in Iceland, and in the special case of Denmark, includes both ‘prelimi-nary’ bills (beslutningsforslag) and ‘full-�edged’ bills (lovforslag).
�is de�nition excludes bills initiated by the executive branch of government, as well asnon-binding statements by MPs, such as resolutions (or early day motions in the UnitedKingdom). We further limited our a�ention to bills sponsored by individual MPs, i.e. billsfor which nominal sponsorship information appear in o�cial parliamentary records. �isrestriction resulted in excluding additional countries from our sample, such as Germany orSpain, where the vast majority of legislation is sponsored by entire parliamentary groupsand do not carry individual endorsements (Brunner, 2013, p. 16).
�e data collected according to this de�nition amounts to slightly above 239,000 bills, 60%of which were sponsored by two or more MPs. �ese statistics are shown in more detail inFigures B1 and B2, which show their breakdown in each country, chamber and legislature.Because the data do not include governmental bills, these �gures do not measure overalllegislative production, which varies dramatically between countries and chambers; thereis, however, an observable trend towards increased levels of legislative productivity andlegislative cosponsorship in several cases.
1For an introduction to the technologies that we used, see the chapters on HTML, JSON, SQL and XML�les in Munzert et al. (2015), as well as the chapter on XPath syntax.
2Although the data for Iceland are exceptionally extensive and range back to 1907, we restricted its pres-ence in the sample to the six most recent legislatures, which covers all elections since the Althing was reformedto sit as a unicameral parliament, and makes the proportion of Icelandic legislatures comparable to that ofother countries in the sample. Similarly, the data for the lower chamber of Italy range back to 1948 but arelimited to the nine most recent legislatures for comparability.
4

Table B1: Overview of country-chamber sample.
Region Country Chamber Code Period Years Legislatures
East Bulgaria Unicameral BG 2005–2015 11 4Czech Republic Lower CZ-PO 1996–2015 20 6
Upper CZ-SE 1996–2015 20 6Estonia Unicameral EE 2007–2015 9 3Hungary Unicameral HU 1998–2015 18 5Lithuania Unicameral LT 1992–2015 24 6Romania Lower RO-CA 1996–2015 20 5
Upper RO-SE 1996–2015 20 5Slovakia Unicameral SK 1998–2015 18 5
West Austria Lower chamber only AT 1994–2015 22 7Belgium Lower BE-CH 1991–2015 25 7
Upper BE-SE 1995–2014 20 5Switzerland Lower CH-CN 1995–2015 21 5
Upper CH-CS 1995–2015 21 5France Lower FR-AN 1986–2015 25a 6
Upper FR-SE 1986–2015 30 7Ireland Lower IE-DA 1997–2015 19 4
Upper IE-SE 1997–2015 19 4Italy Lower IT-CA 1983–2015 33 9
Upper IT-SE 1996–2015 20 5Portugal Unicameral PT 1991–2015 25 7
North Denmark Unicameral DK 2001–2015 15 5Finland Unicameral FI 1999–2014 16 4Iceland Unicameral IS 1995–2015 21 6Norway Unicameral NO 1985–2015 31 8Sweden Unicameral SE 1988–2015 28 8
Asia Israel Unicameral IL 2009–2015 7 3
aMissing legislature 10 (1993–1997) of the French lower chamber.
5

East
BG
East
CZ_PO
East
CZ_SE
East
EE
East
HU
East
LT
East
RO_CA
East
RO_SE
East
SK
West
AT
West
BE_CH
West
BE_SE
West
CH_CN
West
CH_CS
West
FR_AN
West
FR_SE
West
IE_DA
West
IE_SE
West
IT_CA
West
IT_SE
West
PT
North
DK
North
FI
North
IS
North
NO
North
SE
Asia
IL
10
1000
05 09 13 14 96 98 02 06 10 13 96 98 02 06 10 13 07 11 15 98 02 06 10 14 92 96 00 04 08 12 96 00 04 08 12 96 00 04 08 12 98 02 06 10 12 94 95 99 02 06 08 13 91 95 99 03 07 10 14 95 99 03 07 10 95 99 03 07 11 95 99 03 07 11 86 88 97 02 07 12 86 88 93 97 02 07 12 97 02 07 11 97 02 07 11 83 87 92 94 96 01 06 08 13 96 01 06 08 13 91 95 99 02 05 09 11 01 05 07 11 15 99 03 07 11 95 99 03 07 09 13 85 89 93 97 01 05 09 13 88 91 94 98 02 06 10 14 09 13 15
Legislature start year
Ave
rage
num
ber
of b
ills
intr
oduc
ed p
er y
ear
All private bills Cosponsored bills
Figure B1: Average number of bills per year in each country, chamber and legislature. Solid lines are measured out of all bills, dashed lines out of cosponsoredbills only. �e vertical scale is logged.
6

East
BG
East
CZ_PO
East
CZ_SE
East
EE
East
HU
East
LT
East
RO_CA
East
RO_SE
East
SK
West
AT
West
BE_CH
West
BE_SE
West
CH_CN
West
CH_CS
West
FR_AN
West
FR_SE
West
IE_DA
West
IE_SE
West
IT_CA
West
IT_SE
West
PT
North
DK
North
FI
North
IS
North
NO
North
SE
Asia
IL
0%
25%
50%
75%
100%
05 09 13 14 96 98 02 06 10 13 96 98 02 06 10 13 07 11 15 98 02 06 10 14 92 96 00 04 08 12 96 00 04 08 12 96 00 04 08 12 98 02 06 10 12 94 95 99 02 06 08 13 91 95 99 03 07 10 14 95 99 03 07 10 95 99 03 07 11 95 99 03 07 11 86 88 97 02 07 12 86 88 93 97 02 07 12 97 02 07 11 97 02 07 11 83 87 92 94 96 01 06 08 13 96 01 06 08 13 91 95 99 02 05 09 11 01 05 07 11 15 99 03 07 11 95 99 03 07 09 13 85 89 93 97 01 05 09 13 88 91 94 98 02 06 10 14 09 13 15
Legislature start year
Fra
ctio
n of
all
bills
Sponsors per bill 1 2 3−5 6−10 > 10
Figure B2: Number of sponsors per bill in each country, chamber and legislature. In some chambers like those of Belgium and Portugal, there is a regulatorylimit on the maximum number of sponsors per bill (Ma�son 1995, p. 457, cited in Brunner 2013, p. 16).
7

Table B2 contains some further details about our data sources. In most countries, thedata were collected by sending a general query for all bills of a given legislature to theinternal search engine of the parliamentary website, and by downloading the bills foundby going through the complete pagination of the results. When parliaments maintainedopen data portals that made it possible to download all bills and/or sponsors, that strategywas preferred.3 Both strategies had very high success rates that le� less than 1% of all billsand sponsors unobserved a�er a few re-runs of the code to �x occasional network errors.4
Private bills are not the only kind of legislation that MPs might consider cosponsoring.Two other types of common legislative items, which Fowler (2006a,b) treats as bills in hisresearch on legislative cosponsorship in the U.S. Congress, are also relevant in that regard:
• In many parliamentary systems, MPs can collectively submit ‘motions’, ‘petitions’or ‘resolutions’ that, if adopted, can be either non-binding, or binding in a speci�cway that does not translate into law (such as forcing the parliament to table a plenarydebate on a given issue, or in rarer cases, forcing the government to resign).Examples of such items include early day motions in the United Kingdom, which wealready mentioned and which exist in many parliamentary systems inspired by theBritish one, as well as Forslag til vedtagelse in Denmark and motie in both chambersof the Dutch parliament.Despite motions being generally available from the same sources and over the sametime period as bills, we refrained from including them in our sample of legislationin order to avoid comparing cosponsorship across legislative items that do not carrythe same consequences if adopted, and that might therefore vary in ways that wouldthreaten the comparability of the legislation under scrutiny. For that same reason,our legislation sample does not include bills introduced by popular initiative, evenwhen they can be cosponsored by MPs, as is the case in the lower chamber of Italy.
• It is also highly common for MPs to be able to submit amendments to bills submit-ted by other legislators, such as budget-related bills submi�ed by the governmentor private bills submi�ed by other MPs.Although we initially considered collecting amendments, these were o�en availableon much shorter time periods than bills. Furthermore, many countries allow MPsto introduce amendments in untraceable legislative environments, such as stand-ing commi�ee meetings for which there is li�le to no parliamentary record. Last,amendments are, much more o�en than bills, subject to duplication: several MPsmight introduce the same amendment separately, rather than cosponsor the sameamendment. For all these reasons, we did not collect amendments for this study.
For every bill that we collected, we extracted sponsorship information on the �rst authorand cosponsor(s) of the bill, as well as other descriptors (such as its title, introduction date,keywords or legislative outcome) when they were available.
3In the unique case of Israel, we also used an open data portal maintained by an una�liated third party,Open Knesset, by �e Public Knowledge Workshop: https://oknesset.org/.
4Although the code for this project does not include a self-updating mechanism, it stores all raw datalocally in order to skip existing �les on re-runs. As a consequence, the data for all countries and chamberscan be updated at reasonably high speed as new bills become available.
8

Table B2: Overview of the di�erent kinds of legislation retrieved during data collection.�e kinds indicated in bold type are those used for network construction. �e dots in thesecond column mark the cases for which we were able to turn to a legislative open dataportal to collect either bills or sponsors data (or both).
Country code Open data Data coverage
AT private bills (selbstandige antrage)aBE-CH government bills, private bills (propositions de loi),
amendments, resolutions, reportsBE-SE government bills, private bills (propositions de loi),
amendments, resolutions, reportsBG government bills, private billsCH-CN •• private bills (initiatives parlementaires)CH-CS •• private bills (initiatives parlementaires)CZ-PO private bills (navrhy zakonu)CZ-SE private bills (navrhy zakonu)DK government bills, private bills (lovforslag), motions
(beslutningsforslag), resolutionsEE private bills (eelnoud)FI private bills (lakialoite)FR-AN government bills, private bills (propositions de loi)b,
amendments, resolutionsFR-SE •••• government bills, private bills (propositions de loi)b ,
amendments, resolutionsHU private bills (torvenyjavaslat), government billsIE-DA private billsIE-SE private billsIL • private billsIS government bills, private bills (lagafrumvorp)IT-CA ••• private bills (disegni di legge)IT-SE private bills (disegni di legge)LT private bills (istatymo projektas)NO • private bills (saker)PT private bills (projete de lei)RO government bills, private bills (propunerilor legislative)RO government bills, private bills (propunerilor legislative)SE •• private bills (motioner)SK private bills (legislatıvna iniciatıva)Open data �le formats: • HTML/XML, •• JSON, ••• RDF/SPARQL, •••• PostgreSQL database.
a�e sponsorship data are limited to the MPs who �led the bill, as it was not possible to collect the namesof additional sponsors from the original documents.
bBecause French bills can be sponsored both by individual MPs and by entire parliamentary factions, wecollected but later ignored group signatures when parsing the data.
9

B.2. Sponsors
Using the same parliamentary sources as we used for bills, we retrieved as much infor-mation as possible on the individual legislators who sponsored the bills. �e variablescollected across all countries include socio-demographics (age and sex) and parliamen-tary career information (time in o�ce, constituency, commi�ee membership(s) and partya�liation), for a total of over 18,000 MPs who appeared on at least one cosponsored bill.
Some important simpli�cations apply to our measures of party a�liation and time in o�ce:
• Party a�liation was not necessarily stable across a full legislature: for example,in 2005, several Austrian MPs followed Jorg Haider in defecting from the FreedomParty of Austria (FPO) to create the Alliance for the Future of Austria (BZO). In suchcases, which were particularly frequent in Austria, Iceland and Italy, we recordedonly the longest party a�liation of the sponsor over the entire legislature.Another limitation that applies to party a�liations stems from the di�erence be-tween partisan and parliamentary factions. �is di�erence is most visible in coun-tries like Italy, where MPs are frequently elected under the banner of a small politicalparty, but then sit in parliament as part of a coalition of these parties. To handle thisissue, we proceeded to several recodings based on the composition of parliamentaryfactions, all of which are documented in detail in Section D.
• Time in o�ce, or seniority, was measured as years spent in the same parliamentarychamber, even though some countries like Italy or Romania frequently elect mem-bers of their lower chamber to the upper chamber as senators. In order to keepseniority �gures comparable across all countries, these chamber transitions are un-accounted for in our measures of time in o�ce.A further limitation to the measurement of time in o�ce is that many countries donot provide the exact periods of o�ce-holding of their MPs, or do so only since agiven point in time, such as the �rst legislature since independence in the CzechRepublic and Slovakia. As a consequence, our seniority measures are sometimesonly approximately continuous and comparable to each other. �ey can, however,be safely used to create dummies that discriminate ‘freshmen’, i.e. newly electedMPs who did not sit in any previously observed legislature, from other MPs.
In order to further identify each MP, we also collected the address of his or her pro�le pageon the website of the corresponding parliamentary chamber, as well as the address of hisor her photograph when it was available. �e photographs of the bill sponsors were usedto verify their gender when that information had to be imputed from �rst names and/orfamily names, or from gendered information featured in their pro�le pages.
Further details on sponsor variables appear in Section E.2, which lists the complete set ofa�ributes assigned to the cosponsorship networks.
10

C. DESCRIPTIVE STATISTICS BY COUNTRY, CHAMBER AND LEGISLATURE
In the tables of this section, each row corresponds to a country-chamber-legislature, iden-ti�ed by their country-chamber code followed by the start year of the legislature. Eachtable reports the duration of the legislature,5 the total number of bills introduced, the per-centage of those bills that were sponsored by two or more MPs, the number of individualMPs who participated into bill cosponsorship, the average number of sponsors per bill,and the number of di�erent political parties found among the sponsors.
• Table C1: Austria
• Table C2: Belgium
• Table C3: Bulgaria
• Table C4: Czech Republic
• Table C5: Denmark
• Table C6: Estonia
• Table C7: Finland
• Table C8: France
• Table C9: Hungary
• Table C10: Iceland
• Table C11: Ireland
• Table C12: Israel
• Table C13: Italy
• Table C14: Lithuania
• Table C15: Norway
• Table C16: Portugal
• Table C17: Romania
• Table C18: Slovakia
• Table C19: Sweden
• Table C20: Switzerland
5�e duration of the legislature is shown in brackets when the measure is right-censored because thelegislature is still ongoing.
11

Table C1: Austria
ID Years Bills % cosponsored Sponsors Mean sponsors/bill Parties
AT-2013 (3) 257 21 60 1.4 6AT-2008 6 395 35 83 1.5 5AT-2006 3 241 17 51 1.2 5AT-2002 5 270 46 74 1.6 4AT-1999 4 259 41 63 1.5 4AT-1995 5 498 25 67 1.3 5AT-1994 2 163 19 44 1.3 5
Table C2: Belgium
ID Years Bills % cosponsored Sponsors Mean sponsors/bill Parties
BE-CH-2014 (2) 457 82 138 3.3 10BE-CH-2010 5 857 85 165 3.5 10BE-CH-2007 4 694 82 173 3.6 9BE-CH-2003 5 724 64 163 2.6 9BE-CH-1999 5 533 67 150 2.4 9BE-CH-1995 5 483 53 139 2.1 9BE-CH-1991 5 400 44 153 2.0 10BE-SE-2010 5 1179 61 82 2.4 9BE-SE-2007 4 951 52 85 2.2 10BE-SE-2003 5 1003 48 81 2.0 9BE-SE-1999 5 570 45 77 2.2 10BE-SE-1995 5 502 61 71 2.7 9
Table C3: Bulgaria
ID Years Bills % cosponsored Sponsors Mean sponsors/bill Parties
BG-2014 (2) 258 91 245 11.2 6BG-2013 2 190 89 245 7.4 4BG-2009 5 425 72 253 5.4 6BG-2005 5 692 41 209 1.8 7
12

Table C4: Czech Republic
ID Years Bills % cosponsored Sponsors Mean sponsors/bill Parties
CZ-PO-2013 (3) 118 100 204 16.6 7CZ-PO-2010 4 362 100 209 15.7 5CZ-PO-2006 5 424 100 215 13.2 5CZ-PO-2002 5 392 99 214 11.3 5CZ-PO-1998 5 494 100 204 9.0 5CZ-PO-1996 3 174 99 184 12.8 6CZ-SE-2013 (3) 37 78 85 9.3 11CZ-SE-2010 4 39 79 80 7.4 7CZ-SE-2006 5 50 50 66 3.8 10CZ-SE-2002 5 22 91 74 10.8 11CZ-SE-1998 5 18 100 73 10.2 7CZ-SE-1996 3 12 100 49 6.4 5
Table C5: Denmark
ID Years Bills % cosponsored Sponsors Mean sponsors/bill Parties
DK-2015 (1) 122 38 62 2.8 8DK-2011 5 1273 40 124 2.5 13DK-2007 5 1485 50 140 3.0 12DK-2005 3 677 49 120 2.8 11DK-2001 (4) 475 43 108 2.4 9
Table C6: Estonia
ID Years Bills % cosponsored Sponsors Mean sponsors/bill Parties
EE-2015 (1) 39 21 83 3.4 6EE-2011 5 89 10 78 2.3 4EE-2007 5 126 14 99 2.4 6
Table C7: Finland
ID Years Bills % cosponsored Sponsors Mean sponsors/bill Parties
FI-2011 (4) 335 82 202 35.3 10FI-2007 4 545 76 191 16.0 9FI-2003 4 663 80 194 19.4 9FI-1999 4 547 73 190 24.3 8
13
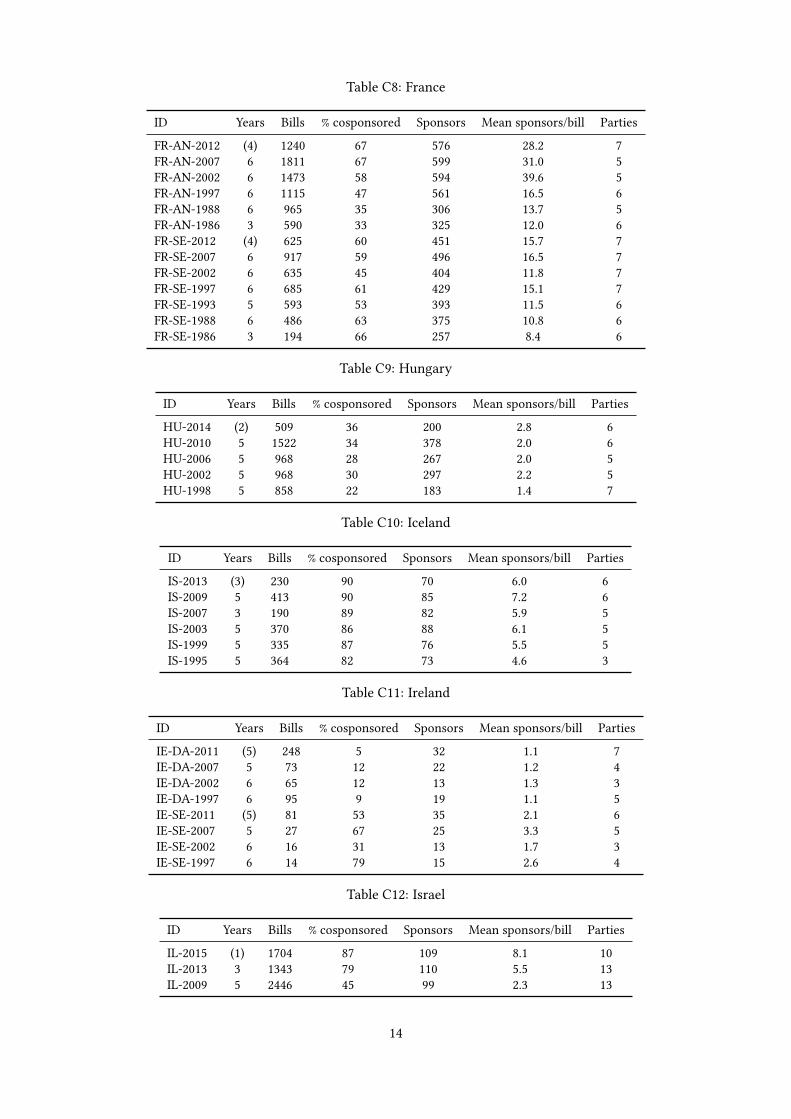
Table C8: France
ID Years Bills % cosponsored Sponsors Mean sponsors/bill Parties
FR-AN-2012 (4) 1240 67 576 28.2 7FR-AN-2007 6 1811 67 599 31.0 5FR-AN-2002 6 1473 58 594 39.6 5FR-AN-1997 6 1115 47 561 16.5 6FR-AN-1988 6 965 35 306 13.7 5FR-AN-1986 3 590 33 325 12.0 6FR-SE-2012 (4) 625 60 451 15.7 7FR-SE-2007 6 917 59 496 16.5 7FR-SE-2002 6 635 45 404 11.8 7FR-SE-1997 6 685 61 429 15.1 7FR-SE-1993 5 593 53 393 11.5 6FR-SE-1988 6 486 63 375 10.8 6FR-SE-1986 3 194 66 257 8.4 6
Table C9: Hungary
ID Years Bills % cosponsored Sponsors Mean sponsors/bill Parties
HU-2014 (2) 509 36 200 2.8 6HU-2010 5 1522 34 378 2.0 6HU-2006 5 968 28 267 2.0 5HU-2002 5 968 30 297 2.2 5HU-1998 5 858 22 183 1.4 7
Table C10: Iceland
ID Years Bills % cosponsored Sponsors Mean sponsors/bill Parties
IS-2013 (3) 230 90 70 6.0 6IS-2009 5 413 90 85 7.2 6IS-2007 3 190 89 82 5.9 5IS-2003 5 370 86 88 6.1 5IS-1999 5 335 87 76 5.5 5IS-1995 5 364 82 73 4.6 3
Table C11: Ireland
ID Years Bills % cosponsored Sponsors Mean sponsors/bill Parties
IE-DA-2011 (5) 248 5 32 1.1 7IE-DA-2007 5 73 12 22 1.2 4IE-DA-2002 6 65 12 13 1.3 3IE-DA-1997 6 95 9 19 1.1 5IE-SE-2011 (5) 81 53 35 2.1 6IE-SE-2007 5 27 67 25 3.3 5IE-SE-2002 6 16 31 13 1.7 3IE-SE-1997 6 14 79 15 2.6 4
Table C12: Israel
ID Years Bills % cosponsored Sponsors Mean sponsors/bill Parties
IL-2015 (1) 1704 87 109 8.1 10IL-2013 3 1343 79 110 5.5 13IL-2009 5 2446 45 99 2.3 13
14
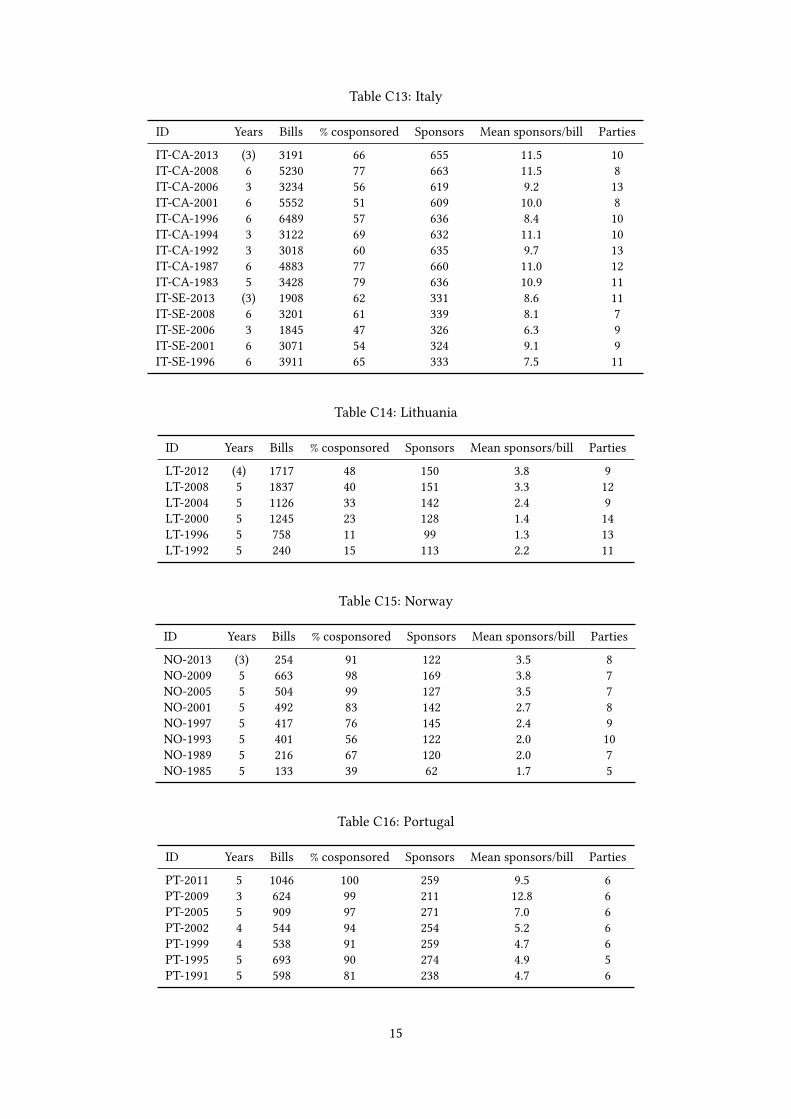
Table C13: Italy
ID Years Bills % cosponsored Sponsors Mean sponsors/bill Parties
IT-CA-2013 (3) 3191 66 655 11.5 10IT-CA-2008 6 5230 77 663 11.5 8IT-CA-2006 3 3234 56 619 9.2 13IT-CA-2001 6 5552 51 609 10.0 8IT-CA-1996 6 6489 57 636 8.4 10IT-CA-1994 3 3122 69 632 11.1 10IT-CA-1992 3 3018 60 635 9.7 13IT-CA-1987 6 4883 77 660 11.0 12IT-CA-1983 5 3428 79 636 10.9 11IT-SE-2013 (3) 1908 62 331 8.6 11IT-SE-2008 6 3201 61 339 8.1 7IT-SE-2006 3 1845 47 326 6.3 9IT-SE-2001 6 3071 54 324 9.1 9IT-SE-1996 6 3911 65 333 7.5 11
Table C14: Lithuania
ID Years Bills % cosponsored Sponsors Mean sponsors/bill Parties
LT-2012 (4) 1717 48 150 3.8 9LT-2008 5 1837 40 151 3.3 12LT-2004 5 1126 33 142 2.4 9LT-2000 5 1245 23 128 1.4 14LT-1996 5 758 11 99 1.3 13LT-1992 5 240 15 113 2.2 11
Table C15: Norway
ID Years Bills % cosponsored Sponsors Mean sponsors/bill Parties
NO-2013 (3) 254 91 122 3.5 8NO-2009 5 663 98 169 3.8 7NO-2005 5 504 99 127 3.5 7NO-2001 5 492 83 142 2.7 8NO-1997 5 417 76 145 2.4 9NO-1993 5 401 56 122 2.0 10NO-1989 5 216 67 120 2.0 7NO-1985 5 133 39 62 1.7 5
Table C16: Portugal
ID Years Bills % cosponsored Sponsors Mean sponsors/bill Parties
PT-2011 5 1046 100 259 9.5 6PT-2009 3 624 99 211 12.8 6PT-2005 5 909 97 271 7.0 6PT-2002 4 544 94 254 5.2 6PT-1999 4 538 91 259 4.7 6PT-1995 5 693 90 274 4.9 5PT-1991 5 598 81 238 4.7 6
15

Table C17: Romania
ID Years Bills % cosponsored Sponsors Mean sponsors/bill Parties
RO-CA-2012 (4) 2734 83 414 14.5 10RO-CA-2008 5 3934 73 339 8.2 7RO-CA-2004 5 4490 79 356 5.6 8RO-CA-2000 5 1988 78 349 4.8 8RO-CA-1996 5 798 72 335 4.5 11RO-SE-2012 (4) 2734 40 179 6.1 8RO-SE-2008 5 3934 40 137 4.1 6RO-SE-2004 5 4490 44 151 3.3 7RO-SE-2000 5 1988 25 128 1.7 7RO-SE-1996 5 798 22 109 1.7 10
Table C18: Slovakia
ID Years Bills % cosponsored Sponsors Mean sponsors/bill Parties
SK-2012 (4) 847 62 139 2.8 6SK-2010 3 131 76 103 2.9 6SK-2006 5 502 50 135 2.1 6SK-2002 5 320 60 141 3.2 8SK-1998 5 359 64 149 3.8 9
Table C19: Sweden
ID Years Bills % cosponsored Sponsors Mean sponsors/bill Parties
SE-2014 (2) 6323 46 368 2.3 8SE-2010 5 14633 51 387 2.6 9SE-2006 5 14187 52 390 2.7 8SE-2002 5 16490 60 395 3.2 8SE-1998 5 13607 63 380 3.7 8SE-1994 5 9869 67 398 3.7 8SE-1991 4 9753 64 375 3.2 9SE-1988 4 11737 76 379 4.2 7
Table C20: Switzerland
ID Years Bills % cosponsored Sponsors Mean sponsors/bill Parties
CH-CN-2011 5 269 83 226 19.8 11CH-CN-2007 5 344 86 220 22.0 13CH-CN-2003 5 251 82 224 23.4 14CH-CN-1999 5 190 82 211 25.2 15CH-CN-1995 5 184 64 219 16.3 16CH-CS-2011 5 25 48 44 5.8 8CH-CS-2007 5 28 71 50 7.7 8CH-CS-2003 5 35 77 47 10.1 4CH-CS-1999 5 27 85 48 14.5 4CH-CS-1995 5 21 71 51 11.8 6
16

D. PARTY ABBREVIATIONS AND LEFT/RIGHT SCORES
To further characterize the positions of bill sponsors relative to each other, we matchedtheir party a�liations with an indication of where the party sits on a standardized Le�/Rightscale, using the scores available in the latest edition of the ParlGov database (Doring, 2013;Doring and Manow, 2014), which are time-invariant scores ranging from 0 to 10 and com-puted as the weighted mean values of party positions taken from several expert surveysof political parties.6
�e tables in this section list the party abbreviations and Le�/Right scores used in thedata. A few special cases required taking the mean of several scores, and independent oruna�liated MPs have no Le�/Right scores, as do a small number of minor political partiesand special categories like ethnolinguistic minorities. All recodings are documented in thenotes at the end of each table.
• Table D1: Austria
• Table D2: Belgium
• Table D3: Bulgaria
• Table D4: Czech Republic
• Table D5: Denmark
• Table D6: Estonia
• Table D7: Finland
• Table D8: France
• Table D9: Hungary
• Table D10: Iceland
• Table D11: Ireland
• Table D12: Israel
• Table D13: Italy
• Table D14: Lithuania
• Table D15: Norway
• Table D16: Portugal
• Table D17: Romania
• Table D18: Slovakia
• Table D19: Sweden
• Table D20: Switzerland
6See http://www.parlgov.org/documentation/party-positions/ for further details.
17
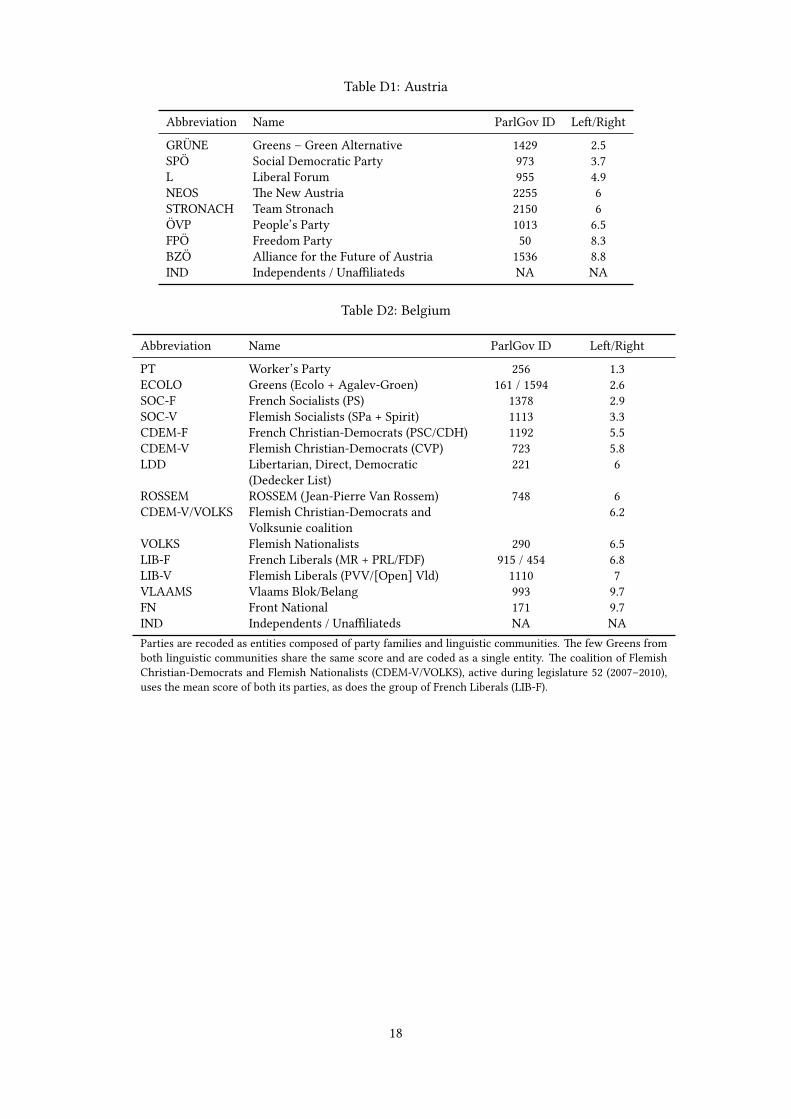
Table D1: Austria
Abbreviation Name ParlGov ID Le�/Right
GRUNE Greens – Green Alternative 1429 2.5SPO Social Democratic Party 973 3.7L Liberal Forum 955 4.9NEOS �e New Austria 2255 6STRONACH Team Stronach 2150 6OVP People’s Party 1013 6.5FPO Freedom Party 50 8.3BZO Alliance for the Future of Austria 1536 8.8IND Independents / Una�liateds NA NA
Table D2: Belgium
Abbreviation Name ParlGov ID Le�/Right
PT Worker’s Party 256 1.3ECOLO Greens (Ecolo + Agalev-Groen) 161 / 1594 2.6SOC-F French Socialists (PS) 1378 2.9SOC-V Flemish Socialists (SPa + Spirit) 1113 3.3CDEM-F French Christian-Democrats (PSC/CDH) 1192 5.5CDEM-V Flemish Christian-Democrats (CVP) 723 5.8LDD Libertarian, Direct, Democratic
(Dedecker List)221 6
ROSSEM ROSSEM (Jean-Pierre Van Rossem) 748 6CDEM-V/VOLKS Flemish Christian-Democrats and
Volksunie coalition6.2
VOLKS Flemish Nationalists 290 6.5LIB-F French Liberals (MR + PRL/FDF) 915 / 454 6.8LIB-V Flemish Liberals (PVV/[Open] Vld) 1110 7VLAAMS Vlaams Blok/Belang 993 9.7FN Front National 171 9.7IND Independents / Una�liateds NA NAParties are recoded as entities composed of party families and linguistic communities. �e few Greens fromboth linguistic communities share the same score and are coded as a single entity. �e coalition of FlemishChristian-Democrats and Flemish Nationalists (CDEM-V/VOLKS), active during legislature 52 (2007–2010),uses the mean score of both its parties, as does the group of French Liberals (LIB-F).
18

Table D3: Bulgaria
Abbreviation Name ParlGov ID Le�/Right
KB Coalition for Bulgaria 1160 2.9DPS Movement for Rights and Freedoms 1286 4.6A National Union A�ack 535 5.5NMS National Movement Simeon the Second 544 5.8BNS Bulgarian People’s Union 1375 5.8ODS United Democratic Forces 784 7GERB Citizens for European Development of
Bulgaria1541 7.4
BBZ Bulgaria Without Censorship 2362 7.4RB Reformist Bloc 2363 7.4SK Blue Coalition 1254 7.4DSB Democrats for a Strong Bulgaria 57 7.9PF Patriotic Front 2211 / 2212 8.7RZS Order, Lawfulness, Justice 636 8.7IND Independents / Una�liateds NA NA�e score of the Patriotic Front (PF) corresponds to the score of its two parties, the Bulgarian National Move-ment and the National Front for the Salvation of Bulgaria. �e Coalition for Bulgaria (KB) also ran as theBulgarian Socialist Party and as Le�ist Bulgaria.
Table D4: Czech Republic
Abbreviation Name ParlGov ID Le�/Right
KSCM Communist Party 1173 0.7CSSD Social Democratic Party 789 3SPO Party of Civic Rights 406 3.3SZ Greens 196 4.1KDU People’s Party 1245 5.8PIR Pirate Party 2261 5NEZ Independents 653 5.5ANO2011 Action of Dissatis�ed Citizens 2263 6VV Public A�airs 336 6SNKED SNK European Democrats 1532 6.14KOAL Four-Party Coalition 1245 / 1123 / 688 6.7ODA Civic Democratic Alliance 1123 7.1US Freedom Union–Democratic Union 688 7.2ODS Civic Democratic Party 829 7.4TOP09 Tradition Responsibility Prosperity 09 2 7.4USVIT Dawn of Direct Democracy 2262 7.4SPR Republicans of Miroslav Sladek 872 9.8NK Independents Movement NA NAIND Independents / Una�liateds NA NA�e score of the Pirate Party (PIR) is the average of the scores of its electoral partners, the People’s Party(KDU) and the Greens (SZ), and the score of the Four-Party Coalition (4KOAL) is the average of the scoresof three of its members, the People’s Party (KDU), the Civic Democratic Alliance (ODA), and the FreedomUnion-Democratic Union (US). For the upper chamber, minor parties with less than three sponsors are codedas independents, as are a few senators endorsed by several parties but a�liated to none.
19

Table D5: Denmark
Abbreviation Name ParlGov ID Le�/Right
E Unity List 306 0.9SFP Socialist People’s Party 1644 2.1SD Social Democrats 1629 3.8RV Radical Le� 211 4.9KD Christian Democrats 1331 5.7LA Liberal Alliance 376 6KFP Conservative People’s Party 590 7.2V Liberal Party 1605 7.3DFP People’s Party 978 9IND Independents / Una�liateds NA NA
GreenlandIA Community of the People 1891 1.3S Forward 74 3.3
Faroe IslandsJF Social Democratic Party 1894 3.3SF Union Party 1892 7.4�e single member of centre-le� party �e Alternative is coded as independent, as is the single member ofthe Faroese Republic Party.
Table D6: Estonia
Abbreviation Name ParlGov ID Le�/Right
K Estonian Centre Party 1137 4SDE Social Democratic Party 1448 4.2ERL People’s Union of Estonia 417 4.6EER Estonian Greens 219 5.6EV Free Party 2409 7.4EKRE People’s Party of Republicans and
Conservatives1395 7.4
RE Estonian Reform Party 113 7.9IRL Union of Pro Patria and Res Publica 1597 8.5
Table D7: Finland
Abbreviation Name ParlGov ID Le�/Right
VR Le� Group NA 2.2VAS Le� Alliance 1292 2.2VIHR Green League 1062 3.6SD Social Democratic Party 395 3.6KESK Centre Party 94 5.8R Swedish People’s Party 585 6.4PS [True] Finns Party 200 6.6KD Christian Democrats 1463 7.2KOK National Coalition Party 1118 7.2M11 Change 2011 NA NA�e two MPs who split from the Le� Alliance (VAS) to form their own parliamentary group in 2011 (VR) areassigned the same score as their initial formation.
20

Table D8: France
Abbreviation Name ParlGov ID Le�/Right
COM Communists (PCF + GDR) 686 1.4ECO Greens (Verts) 873 3.2SOC Socialists (PS + SRC) 1539 3.2RAD Radicals (RCV + PRG/RRDP/RDSE) 1492 4.1CEN Centrists (UDF/MODEM/UDI) 509 6.1DRO Conservatives (DL + RPR/UMP) 138 / 658 7.5FN Front National 270 9.7IND Independents / Una�liateds NA NAParties are recoded as entities that cover the political parties and parliamentary groups from both parliamen-tary chambers. �e ‘Mixed Le�’ group (RCV) of legislature 11 (1997-2002) is coded as Radicals (RAD).
Table D9: Hungary
Abbreviation Name ParlGov ID Le�/Right
LMP Politics Can Be Di�erent 403 2.6MSZP Socialist Party 1591 2.9SZDSZ Alliance of Free Democrats 1426 4FIDESZ Fidesz - Civic Union 921 6.5MDF Democratic Forum 546 6.5KDNP Christian Democratic People’s Party 434 7.4JOBBIK Jobbik Movement for a Be�er Hungary 600 8.7FKGP Independent Smallholders, Agrarian
Workers and Civic Party870 9
MIEP Justice and Life Party 95 9.6IND Independents / Una�liateds NA NA
Table D10: Iceland
Abbreviation Name ParlGov ID Le�/Right
VG Le�-Green Movement 210 1.2P Pirate Party 2205 2.6SF Social Democratic Alliance 1006 4.1F Progressive Party 1455 5BF Bright Future 2204 6HR �e Movement 587 6FL Liberal Party 506 6.2S Independence Party 1342 7.5IND Independents / Una�liateds NA NA�e entity for the Social Democratic Alliance (SF) includes its forming parties before 2000: the Social Demo-cratic Party, the People’s Alliance, the Women’s List and National Awakening. �e entity for �e Movement(HR) also codes for its predecessor, the Citizens’ Movement.
21

Table D11: Ireland
Abbreviation Name ParlGov ID Le�/Right
AAA Anti-Austerity Alliance NA 1.3SOC Socialist Party 1014 1.3SF Sinn Fein 2217 1.3DL Democratic Le� 1580 1.9GP Green Party 1573 2.4LAB Labour Party 318 3.6FF Fianna Fail 280 6.1FG Fine Gael 1393 6.4RENUA RENUA Ireland NA 6.4PD Progressive Democrats 651 8IND Independents / Una�liateds NA NA�e Anti-Austerity Alliance (AAA) is assigned the same score than the Socialist Party (SOC) because its can-didates were members of that party. RENUA Ireland (RENUA) is assigned the same score as Fine Gael (FG)because its members come from that party.
Table D12: Israel
Abbreviation Name ParlGov ID Le�/Right
BALAD Balad 805 0.7JL Joint List NA 1HADASH Hadash 732 1.3MERETZ Meretz 1419 1.8INDEP Independence NA 3.3LAB Labour Party 244 3.3ZU Zionist Union NA 4.7HATNUAH Hatnuah 2320 6KADIMA Kadima 1870 6KULANU Kulanu 2410 6YA Yesh Atid 2321 6LIKUD Likud 678 6.7UTJ United Torah Judaism 1303 6.9SHAS Shas 788 7JH �e Jewish Home 214 8.6YB Yisrael Beiteinu 1816 8.7NU National Union 1357 9.6UAL United Arab List NA NA�e Joint List (JL) is coded at mid-distance from two of its founding entities, Hadash (HADASH) and Balad(BALAD). �e Independence list (INDEP) is assigned the same score than the Labour Party (LAB), from whichit split. �e Zionist Union (ZU) is coded at mid-distance its founding entities, the Labour Party (LAB) andHatnuah (HATNUAH).
22

Table D13: Italy
Abbreviation Name ParlGov ID Le�/Right
DP Proletarian Democracy 1424 0.5PRC Communist Refoundation Party 1321 0.9PDCI Party of the Italian Communists 1661 1SEL Le� Ecology Freedom 465 1.3PCI Italian Communist Party 1088 1.6SIN Independent Le� (1088) 1.6VERD-PDCI Greens and Communists (coalition) 1661 / 910 1.7VERD Greens Federation 910 2.4DEMSIN Democrats of the Le� 809 2.6M5S Five Star Movement 2155 2.6PD Democratic Party 1048 2.6AP Alliance of Progressives 1048 3.3ULIVO �e Olive Tree 1048 3.3PSI Italian Socialist Party 1475 3.8RAD Radicals 1296 4RNP Rose in the Fist 1278 / 1296 4MARGH Daisy – Democracy is Freedom 1005 4ID �e Democrats 961 4.1PPI People’s Party 142 4.6PSDI Italian Democratic Socialist Party 242 4.6IDV Italy of Values 693 4.9PRI Italian Republican Party 93 5RINNOV Italian Renewal 630 5UDEUR Union of Democrats for Europe –
Populars399 5.3
DC Christian Democrats 1633 5.7CCD Christian Democratic Centre 99 5.9CCD-CDU White Flower (coalition) 627 5.9SC Civic Choice (with [Mario] Monti) 2156 6CD Democratic Centre 2153 6UDC Union of the Centre 226 6.1UDC-TP Union of the Centre (�ird Pole coalition) 226 6.1CDU United Christian Democrats 128 6.2MPA Movement for Autonomy 1040 6.2PPP Populars for [Romano] Prodi 840 6.2PT People and Territory (1040) 6.2RETE Movement for Democracy – �e Net 366 6.2GAL Large Autonomy and Freedom (coalition) NA 6.5PLI Italian Liberal Party 487 6.5NCD-UDC New Centre-Right and Union of the
Centre (coalition)2268 / 226 6.8
FI-PDL Go Italy – �e People of Freedom 596 7.1FLI-TP Future and Freedom for Italy (�ird Pole
coalition)1477 7.4
NCD New Centre-Right 2268 7.4FLD Federalists and Liberal-Democrats (1436) 7.8LN League of the North 1436 7.8AN National Alliance 373 8.1MSI-DN Italian Social Movement–National Right 831 9.2IND Independents / Una�liateds / Minor lists NA NAParliamentary coalitions are coded at mid-distance between their forming parties, and three groups are codedin reference to a related party whose ParlGov ID is indicated in brackets. Minor lists si�ing as independents(such as those representing Italians from abroad) are coded as independent.
23

Table D14: Lithuania
Abbreviation Name ParlGov ID Le�/Right
LSDP Social Democratic Party 1277 3.2LDDP Democratic Labour Party 519 3.3LVZS Peasant and Greens Union 191 3.3NDP New Democratic Party 1261 3.3DP Labour Party 581 3.9LLRA Election Action of Lithuania’s Poles 28 3.9NS New Union (Social-Liberals) 856 4.3LCS Centre Union of Lithuania 887 4.9TT Order and Justice 1421 5.3LKDP Lithuanian Christian Democrats 675 6.2KDS Christian Democratic Union 493 6.2LLIS Liberal Union of Lithuania 378 6.8NKS Moderate Conservative Union 709 7.4SK Sajudis coalition 1045 7.4TS-LKD Homeland Union (Conservatives) 1045 7.4LLAS Lithuanian Liberty Union 1562 7.8LS Liberals’ Movement 482 7.8LICS Liberal and Centre Union 983 7.8LTS Lithuanian National Union List 432 8.7TPP National Resurrection Party 1502 8.7JL Young Lithuania nationalists 383 9.8LPKTS Union of Lithuanian Political Prisoners
and Deportees1447 9.8
DK Way of Courage 2121 NAIND Independents / Una�liateds NA NA�e score of the Homeland Union (TS-LK) is also used for the Moderate Conservative Union (NKS), whichhas le� the Union, and for the Sajudis coalition (SK), which the Union largely absorbed. Two minor partieswith only one member (the Independence Party and the ‘LRPCH’ party) are coded as independents.
Table D15: Norway
Abbreviation Name ParlGov ID Le�/Right
RV Red Electoral Alliance 1638 0.4SV Socialist Le� Party 81 1.6MDG Green Party 2254 2.6A Labour Party 104 3.4SP Centre Party 702 4.7V Liberal Party 647 5.1KRF Christian Democratic Party 1538 5.9KP Coastal Party 780 7.4H Right 1435 7.9FRP Progress Party 351 8.8FFF Future for Finnmark NA NAIND Independents / Una�liateds NA NA
24

Table D16: Portugal
Abbreviation Name ParlGov ID Le�/Right
BE Bloc of the Le� 557 1.6PEV Greens 1535 1.7PCP Communist Party 514 2.2PS Socialist Party 725 4PSD Social Democratic Party 1273 6.3CDS-PP Democratic and Social Centre – People’s
Party251 8
PSN National Solidarity Party 82 NA
Table D17: Romania
Abbreviation Name ParlGov ID Le�/Right
PP-DD People’s Party - Dan Diaconescu 2130 1.3VERZII Greens 792 2.6PER Ecologist Party 792 2.6FER Ecologist Federation 792 2.6PSD Social Democratic Party 1120 3.2UNPR National Union for the Progress of
Romania2002 3.3
PC Conservative Party 5 4.8PD-L Democratic Liberal Party 958 5.4PNTCD Christian-Democratic National Peasants’
Party888 5.5
PUNR National Unity Party 648 5.6UDMR Democratic Union of Hungarians in
Romania948 6
PNL National Liberal Party 1015 6.1PRM Greater Romania Party 713 6.7MIN Ethnolinguistic minorities 425 NAIND Independents / Una�liateds NA NA
Table D18: Slovakia
Abbreviation Name ParlGov ID Le�/Right
KSS Communist Party 44 0.5SDL Party of the Democratic Le� 1415 3.2SOP Party of Civic Understanding 1016 3.3SMER-SD Direction – Social Democracy 220 3.4HZDS Movement for a Democratic Slovakia 1142 4.9SAS Freedom and Solidarity 1460 6SMK-MKP Hungarian Coalition 559 6.5SNS National Party 1072 7KDH Christian Democratic Movement 1432 7.1ANO Alliance of the New Citizen 1200 7.2SDKU-DS Democratic and Christian Union –
Democratic Party131 7.3
MOST-HID Most-Hid 1620 7.4OLANO Ordinary People and Independent 1759 7.4
25

Table D19: Sweden
Abbreviation Name ParlGov ID Le�/Right
V Le� Party 882 1.5MP Green Party 1154 3.4S Swedish Social Democratic Party 904 3.4C Centre Party 1461 5.8FP Liberal People’s Party 892 6.3KD Christian Democrats 282 7.2M Moderate Party 657 7.9SD Sweden Democrats 1546 8.7NYD New Democracy 951 9IND Independents / Una�liateds NA NA
Table D20: Switzerland
Abbreviation Name ParlGov ID Le�/Right
PDT Labour Party 1167 0.5FRAP Frauen Macht Politik! 569 1.3PES Green Party 141 1.7PSS Socialist Party 35 1.8PVL Green Liberal Party 308 2.6ADI Alliance of Independents 1264 3.3PDC Christian Democratic People’s Party 531 4.7PEV Evangelical People’s Party 602 4.9PCS Christian Social Party 1012 6.2PLR Free Democratic Party 26 6.3PLD Liberal Party 458 7.3UDC Swiss People’s Party 750 7.4PBD Conservative Democratic Party 1213 7.4FPS Freedom Party 1602 8.1UDF Federal Democratic Union 1318 8.1LEGA Ticino League 1500 8.7MCG Geneva Citizens Movement 2599 8.7DS Swiss Democrats 628 9.4IND Independents / Una�liateds NA NAParty abbreviations are based on the French party names. �ree small parties are grouped with larger forma-tions: the single MP for the Le� Alternative in Geneva is grouped with the Labour Party (PDT), Green MPsfrom Bern and Zoug are grouped with the Green Party (PES), and the branches of the Christian Social Party(PCS) in the Obwalden and Wallis cantons are grouped with their main party.
26

E. COSPONSORSHIP NETWORK CONSTRUCTION
In order to build comparable cosponsorship networks in each country, chamber and leg-islature, we proceed by matching the de�nition of cosponsorship ties used in networkanalyses of the U.S. Congress (Fowler, 2006a,b; Gross, Kirkland and Shalizi, 2012). We relyon a similar constructor, namely a two-mode edge list of the form
{b1, a8}, {b1, a31}, . . ....
. . . {bn−1, a36}, {bn, a120}
with bills denoted bn and MP sponsors denoted an. To focus on collaboration betweenlegislators, we then collapse the b×a two-mode network to a one-mode network contain-ing strictly MPs, by connecting the �rst author of each bill to all other sponsors on thatbill. �e resulting adjacency matrix A of directed ties between MPs (i, j) is an asymmetricmatrix with elements
Aij =
{1 if MP i cosponsored a bill authored by MP j,.0 otherwise.
and where all diagonal elements (MPs hypothetically cosponsoring legislation with them-selves) are discarded. As a result, the resulting cosponsorship networks do not containany self-loops.
�is network construction routine has two important limitations. First, because we focuson interactions between MPs, we do not account for many of the di�erences that mightexist between bills. �is is a consequence of our comparative research design: in a morerestricted observational context, it would have been useful to keep that information, assuggested by Gross, Kirkland and Shalizi (2012), in order to account for temporal or the-matic variance at the bill-level. Unfortunately, most countries in our sample do not provideextensive bill details: less than half of them, for instance, provide bill keywords.
A second limitation comes from our decision to focus solely on the ties between the �rstauthor of each bill and his or her cosponsor(s), thereby re�ecting only some of the inter-actions that occur when MPs decide to cosponsor legislation together. �is is because,like Fowler (2006a,b), we might reasonably assume that all cosponsors on a bill know whothey are ‘connecting to’ with regards to the �rst author, but not that they also know everycosponsor on that same bill.
Last, while almost all countries give some importance to the �rst author of a bill in theirparliamentary rules (for instance, by making them the default speaker for the bill), somealso apply a distinction between ‘�rst authors’ and ‘cosponsors’ in their o�cial records. Byignoring that distinction, we e�ectively treated a small number of ‘�rst authors’ (beyondthe �rst one) in Belgium and Italy as ‘cosponsors’. To make sure that this simpli�cationcould be made, we compared the networks built out of all �rst authors in these coun-tries with their ‘simpli�ed’ counterparts, and observed only minor di�erences in terms ofnetwork structure.
27
E.1. Edge weights
Since cosponsorship between two MPs i and j can occur more than once during a legisla-ture, the ties of their network must be valued to re�ect their di�erent strength. To do so,we follow Gross, Kirkland and Shalizi (2012) by weighting all cosponsorships in inverseproportion to the overall number of cosponsors on the bill, and by normalizing the sum ofthese weights to the maximum number of possible cosponsorships between MP cosponsori and MP author j during the legislature.
�e equation that we implement is given in Gross, Kirkland and Shalizi (2012, eqn. 1, p. 8).Le�ing cj(k) denote the number of cosponsors on MP j’s kth bill, the strength of the tiebetween MP j and every cosponsor i on the bill is �rst weighted to 1/cjk, in order todownplay the in�uence of bills that are cosponsored by large numbers of MPs. At thatstage, each �rst author is connected to each of his or her cosponsors by the sum of theseweights, de�ned as
Wij =
nj∑k=1
Yij(k)
cj(k)(E1)
where Yij(k) = 1 if MP i is a cosponsor of MP j’s kth bill (Gross, Kirkland and Shalizi,2012, p. 8). We refer to this weighting scheme as ‘Newman-Fowler weights’, because it isused both by Newman (2001a,b) in undirected networks of scienti�c coauthorship, and byFowler (2006a,b) in directed networks of legislative cosponsorship. Figure E1a shows thedistribution of these weights, which have no upper boundary.
�e next step consists in dividing these weights, which Fowler (2006a, p. 468) calls the“weighted quantity of bills cosponsored”, by the maximum value that they reach when MPi is a cosponsor on every kth bill by MP j. �e resulting weights, which Gross, Kirklandand Shalizi (2012, p. 8) call the “weighted propensity to cosponsor” and which we refer toas ‘Gross-Shalizi weights’ in reference to an earlier version of the manuscript by the twoauthors, are de�ned as
WPCij =
nj∑k=1
Yij(k)
cj(k)
nj∑k=1
1cj(k)
(E2)
Figure E1b shows the distribution of these weights, which are bounded between 0 and 1,and which are particularly useful to understand the kind of cosponsorship activity occur-ring in the networks. In e�ect, these weights o�en penalize the majority of cosponsorshipties found in the network by bringing them close to a null weight value, while leaving aminority of cosponsorship ties at a weight value of 1.
�e networks that we provide carry all three kinds of edge weights: ‘raw’ cosponsorshipcounts, ‘Newman-Fowler weights’, and ‘Gross-Shalizi weights’. Since the cosponsorshipnetworks are directed, all edge weights are also asymmetrical: the edge weight from MP ito MP j might and usually will di�er from the edge weight from MP j to MP i.
28

Each of these weighting schemes might also be used to compute and compare weightednetwork measures (Opsahl and Panzarasa, 2009; Opsahl, Agneessens and Skvoretz, 2010),or to model the likelihood of cosponsorship between sponsors against di�erent distribu-tions of reference (see in particular Krivitsky, 2012).
AT BE_CH BE_SE BG CH_CN CH_CS CZ_PO
CZ_SE DK EE FI FR_AN FR_SE HU
IE_DA IE_SE IL IS IT_CA IT_SE LT
NO PT RO_CA RO_SE SE SK
0.1 1.0 10.0 0.1 1.0 10.0 0.1 1.0 10.0 0.1 10.0 0.01 0.10 1.00 0.1 1.0 0.1 10.0
0.1 1.0 0.1 1.0 10.0 0.1 1.0 0.01 0.10 1.00 0.1 10.0 0.1 10.0 0.1 10.0
0.1 1.0 1 0.1 1.0 10.0 0.1 1.0 0.1 10.0 0.1 10.0 0.1 10.0
0.1 1.0 10.0 0.1 1.0 10.0 0.1 10.0 0.1 10.0 1 100 0.1 1.0 10.0
Edge weights (Newman−Fowler)
Den
sity
(a) Distribution of ‘Newman-Fowler’ edge weights (Equation E1).
AT BE_CH BE_SE BG CH_CN CH_CS CZ_PO
CZ_SE DK EE FI FR_AN FR_SE HU
IE_DA IE_SE IL IS IT_CA IT_SE LT
NO PT RO_CA RO_SE SE SK
0 1 0 1 0 1 0 1 0 1 0 1 0 1
1 0 1 1 0 1 0 1 0 1 0 1
1 1 0 1 0 1 0 1 0 1 0 1
0 1 0 1 0 1 0 1 0 1 0 1
Edge weights (Gross−Shalizi)
Den
sity
(b) Distribution of ‘Gross-Shalizi’ edge weights (Equation E2).
Figure E1: Distribution of ‘Newman-Fowler’ and ‘Gross-Shalizi’ edge weights in all net-works. Each line corresponds to the network of a legislature.
29

E.2. Network objects
�e parlnet.rda �le available from the repository for this study contains the completeseries of networks presented in the rest of this document:
• objects starting with net are legislative cosponsorship networks
• objects starting with conet are commi�ee co-membership networks
�e former networks are constructed were constructed as explained in the previous sub-section. �e la�er networks are based on the commi�ee membership(s) of all sponsorspresent in the legislative cosponsorship network to which they correspond. Commi�eeco-membership networks are undirected, as required for their use as an edge covariate inexponential graph models wri�en with the ergm package (Hunter et al., 2008). Commi�eeco-memberships are available only for a subset of the entire sample of countries, chambersand legislatures, and are entirely missing for the (very small) cosponsorship networks ofboth Irish chambers.
All network objects are forma�ed in the R network class (Bu�s, 2008). �e legislativecosponsorship networks carry the following a�ributes:
• Network-level attributes
– country: country name, in English– ipu: chamber identi�er in the IPU-PARLINE database (Inter-Parliamentary
Union, 2015)– seats: statutory chamber size, sourced from the database above– lang: Wikipedia language version used for chamber name and constituencies7
– chamber: chamber name, as a Wikipedia handle– type: chamber type (lower, upper or unicameral)– n cosponsored: number of cosponsored bills– n sponsors: number of sponsors per bill, as a table object8
• Vertex-level attributes
– Socio-demographics
∗ born: year of birth of the sponsor, when available9
∗ sex: gender of the sponsor (coded as ‘F’ for females and ‘M’ for males)10
7Network-level chamber names and vertex-level constituencies are coded as Wikipedia handles to thecorresponding entry on the Wikipedia language version indicated by the lang network-level a�ribute, whichis usually the o�cial language of the country, except for Bulgaria and Romania, in which case WikipediaEnglish constituency names are used. See also footnote 12, p. 31.
8�is table also contains the number of single-sponsored private bills that were collected but later ignoredduring network construction.
9�is variable was imputed from Wikipedia entries when possible but is occasionally missing in severalnetworks, and is entirely missing for Hungary.
10As explained in Section B.2, p. 10, this variable was sometimes imputed from �rst names, family names,a combination of both, and veri�ed through visual inspection of sponsor photographs.
30

– Descriptive information
∗ nyears: sponsor seniority, in years (see Section B.2, p. 10)∗ url and photo: URL to the online pro�le of the sponsor and, when avail-
able, to a photograph of him or her11
∗ constituency: sponsor constituency, generally as a Wikipedia basename12
– Party information
∗ party: party abbreviation (see Section B.2, p. 10, and Section D)∗ lr: Le�/Right party score (see Section B.2, p. 10, and Section D)
– Other measures
∗ n au: number of cosponsored bills on which the sponsor is a �rst author∗ n co: number of cosponsored bills on which the sponsor is a cosponsor∗ n bills: sum of n au and n co
• Edge-level attributes
– raw: ‘raw cosponsorship counts’, i.e. the number of cosponsorship ties betweentwo sponsors
– nfw: ‘Newman-Fowler weights’, i.e. the weighted quantity of bills cosponsored(see Section E.1)
– gsw: ‘Gross-Shalizi weights’, i.e. the weighted propensity to cosponsor (seeSection E.1)
– committee: number of parliamentary commi�ees listing both sponsors as theirmembers
�e commi�ee co-membership networks carry only the committee vertex a�ribute, as wellas a network-level a�ribute called committees, which contains a table object listing allparliamentary commi�ees found for the country/chamber, and their number of sponsormembers (which is sometimes equal to zero).
Last, all networks carry vertex names corresponding to the full names of the sponsors, withduplicate names usually ending either with -1 or -2. �ese names are not standardizedacross countries, but they are identical across all legislatures of a same country/chamber,in order to make the data potentially useful for longitudinal analysis.
E.3. Network descriptors
�e parlnet.csv �le available from the repository for this study contains a set of descrip-tive variables measured at the country-chamber-legislature level, as well as summary mea-sures related to the bills and sponsors featured in the networks.
11�e photo variable is coded as local �le paths to JPG, GIF or PNG images, which are used in the interactivevisualizations of the data available at http://f.briatte.org/parlviz. An empty �le path indicates that nophotograph of the sponsor was found on the website of his or her parliament.
12Lithuanian districts or district municipalities are not mapped to any Wikipedia entries. �ere are noconstituencies in the electoral system of Israel and in the Belgian and Irish Senates (although the la�er uses‘vocational panels’ instead, which are therefore coded as constituencies). Due to a redistricting reform, manyconstituencies are missing for Sweden prior to 2002. Not all constituencies are geographic, as several chamberselect or nominate members at the national level in order to represent special constituencies (such as citizensabroad or ethnolinguistic minorities).
31

�e following variables were coded manually:
• network: name of the corresponding network object
• country: country name, in English
• ipu: IPU-PARLINE chamber identi�er (Inter-Parliamentary Union, 2015)
• region: European region (East, North, West, or ‘Asia’ for Israel)
• type: parliamentary chamber type (Lower, Unicameral, Upper)
• size: statutory chamber size (Inter-Parliamentary Union, 2015)
• cty: country-chamber code (see Table B1, p. 5)
• start: legislature start year
• end: legislature end year
• duration: legislature duration, in years
• censored: whether the legislature is ongoing (0/1)
• government: type of government coalition (see note below)
• coalition: composition of government coalition (see note below)
Note – the government variable indicates ‘single’ or ‘stable’ if either a single party or a stablecoalition of parties governed throughout the entire legislature, and ‘mixed’ otherwise.When the government variable is equal to either ‘single’ or ‘mixed’, the coalition variablecontains the party abbreviation(s) corresponding to the governing coalition, separated bysemicolons. Both variables are based on information retrieved from the ParlGov database(Doring and Manow, 2014).
�e following variables were derived from the networks:
• nodes: number of sponsors
• edges: number of cosponsorship ties
• density: network density
• n bills au: number of sponsored bills
• n bills co: number of cosponsored bills
• n sigs au: number of bill signatures
• n sigs co: number of bill signatures on cosponsored bills
• s min: minimum number of sponsors per bill
• s max: maximum number of sponsors per bill
• s med: median number of sponsors per bill
32

• s mu: mean number of sponsors per bill
• mu au: mean number of bill authored per sponsor
• mu co: mean number of bill cosponsored per sponsor
• n au: number of sponsors who authored at least one bill
• n co: number of sponsors who cosponsored at least one bill
• n both: number of sponsors who authored and cosponsored at least one bill
• n fem: number of female sponsors
• n new: number of ‘freshmen’ sponsors �rst elected in the last year (i.e. who did notserve any mandate in past legislatures; see Section B.2, p. 10)
• n ind: number of independent sponsors with no party a�liation
• ysio n: sponsor seniority (number of distinct values)13
• ysio min: minimum sponsor seniority (past years in o�ce; see Section B.2, p. 10)
• ysio max: maximum sponsor seniority (past years in o�ce; see Section B.2, p. 10)
• ysio med: median sponsor seniority (past years in o�ce; see Section B.2, p. 10)
• ysio mu: mean sponsor seniority (past years in o�ce; see Section B.2, p. 10)
• ysio cor: Pearson correlation between sponsor age and sponsor seniority
• born p: sponsor age (percentage of nonmissing values)
• born min: minimum sponsor age (year of birth)
• born max: maximum sponsor age (year of birth)
• born med: median sponsor age (year of birth)
• born mu: mean sponsor age (year of birth)
• constituency p: sponsor constituency (percentage of nonmissing values)
• constituency n: sponsor constituency (number of distinct values)
• pg n: sponsor parties (number of distinct values)
• pg min: miminum size of parties
• pg max: maximum size of parties
• pg med: median size of parties
• pg mu: mean size of parties
• pg sd: standard deviation of party group sizes13�is variable is used to detect the absence of variance in the seniority measures at the level of a speci�c
network. �is issue currently a�ects the earliest legislatures/networks of the Belgian Senate, the Czech Senate,Lithuania and Portugal, which have been used as baselines to measure sponsor seniority in all of the otherlegislatures/networks of these chambers.
33

• n gov: number of sponsors in government (see previous note, p. 32)
• n opp: number of sponsors in opposition (see previous note, p. 32)
• pc n: parliamentary commi�ees (number of distinct values)
• pc min: minimum size of parliamentary commi�ees
• pc max: maximum size of parliamentary commi�ees
• pc med: median size of parliamentary commi�ees
• pc mu: mean size of parliamentary commi�ees
• pc sd: standard deviation of parliamentary commi�ee sizes
• cc min: minimum number of shared commi�ee memberships
• cc max: maximum number of shared commi�ee memberships
• cc med: median number of shared commi�ee memberships
• cc mu: mean number of shared commi�ee memberships
• cc p: percentage of cosponsorship ties between sponsors sharing at least one com-mi�ee membership
• lr n: Le�/Right party scores (number of distinct values)
• lr min: minimum Le�/Right party score
• lr max: maximum Le�/Right party score
• lr med: median Le�/Right party score
• lr mu: mean Le�/Right party score
• lr sd: standard deviation of Le�/Right party scores
• raw min: minimum edge weight, based on raw cosponsorship counts
• raw max: maximum edge weight, based on raw cosponsorship counts
• raw med: median edge weight, based on raw cosponsorship counts
• raw mu: mean edge weight, based on raw cosponsorship counts
• nfw min: minimum ‘Newman-Fowler’ edge weight
• nfw max: maximum ‘Newman-Fowler’ edge weight
• nfw med: median ‘Newman-Fowler’ edge weight
• nfw mu: mean ‘Newman-Fowler’ edge weight
• gsw min: minimum ‘Gross-Shalizi’ edge weight
• gsw max: maximum ‘Gross-Shalizi’ edge weight
• gsw med: median ‘Gross-Shalizi’ edge weight
• gsw mu: mean ‘Gross-Shalizi’ edge weight
34

REFERENCES
Aleman, Eduardo and Ernesto Calvo. 2013. “Explaining Policy Ties in Presidential Con-gresses: A Network Analysis of Bill Initiation Data.” Political Studies 61:356–377.
Aleman, Eduardo, Ernesto Calvo, Mark P. Jones and Noah Kaplan. 2009. “ComparingCosponsorship and Roll-Call Ideal Points.” Legislative Studies �arterly 34:87–116.
Bra�on, Kathleen A. and Stella M. Rouse. 2011. “Networks in the Legislative Arena: HowGroup Dynamics A�ect Cosponsorship.” Legislative Studies �arterly 36:423–460.
Brunner, Martin. 2013. Parliaments and Legislative Activity. Motivations for Bill Introduc-tion. New York, NY: Springer.
Bu�s, Carter T. 2008. “network: A Package for Managing Relational Data in R.” Journal ofStatistical So�ware 24:1–36.
Campbell, James E. 1982. “Cosponsoring Legislation in the US Congress.” Legislative Stud-ies �arterly.
Clark, Jennifer Hayes and Veronica Caro. 2013. “Multimember Districts and the Substan-tive Representation of Women: An Analysis of Legislative Cosponsorship Networks.”Politics & Gender 9:1–30.
Desposato, Sco� W., Ma�hew C. Kearney and Brian F. Crisp. 2011. “Using Cosponsorshipto Estimate Ideal Points.” Legislative Studies �arterly 36:531–565.
Doring, Holger. 2013. “�e Collective Action of Data Collection: A Data Infrastructure onParties, Elections and Cabinets.” European Union Politics 14:161–178.
Doring, Holger and Philip Manow. 2014. “Parliaments and Governments Database (Parl-Gov): Information on Parties, Elections and Cabinets in Modern Democracies.” Stableversion 14-12.URL: http://www.parlgov.org/
Fowler, James H. 2006a. “Connecting the Congress: A Study of Cosponsorship Networks.”Political Analysis 14:456–487.
Fowler, James H. 2006b. “Legislative Cosponsorship Networks in the U.S. House and Sen-ate.” Social Networks 28:454–465.
Gross, Justin H., Justin H. Kirkland and Cosma Shalizi. 2012. “Cosponsorship in the U.S.Senate: A Multilevel Two-Mode Approach to Detecting Subtle Social Predictors ofLegislative Support.” Unpublished manuscript.URL: http://justinhgross.web.unc.edu/files/2012/03/
Multilevel-2mode-cosponsorship main.pdf
Hunter, David R, Mark S Handcock, Carter T Bu�s, Steven M Goodreau and Martina Mor-ris. 2008. “ergm: A Package to Fit, Simulate and Diagnose Exponential-Family Modelsfor Networks.” Journal of Statistical So�ware 24.
Inter-Parliamentary Union. 2015. “PARLINE database of national parliaments.”.URL: http://www.ipu.org/parline-e/parlinesearch.asp
Kessler, Daniel and Keith Krehbiel. 1996. “Dynamics of Cosponsorship.” American PoliticalScience Review 90:555–566.
35

Kirkland, Justin H. 2011. “�e Relational Determinants of Legislative Outcomes: Strongand Weak Ties between Legislators.” Journal of Politics 73:887–898.
Kirkland, Justin H. 2014. “Chamber Size E�ects on the Collaborative Structure of Legisla-tures.” Legislative Studies �arterly 39:169–198.
Kirkland, Justin H. and Justin H. Gross. 2012. “Measurement and �eory in Legislative Net-works: �e Evolving Topology of Congressional Collaboration.” Social Networks 36:97–109.
Koger, Gregory. 2003. “Position-Taking and Cosponsorship in the U.S. House.” LegislativeStudies �arterly 28:225–246.
Krivitsky, Pavel N. 2012. “Exponential-Family Random Graph Models for Valued Net-works.” Electronic Journal of Statistics 6:1100–1128.
Ma�son, Ingvar. 1995. Private Members’ Initiatives and Amendments. In Parliaments andMajority Rule in Western Europe, ed. Herbert Doring. Frankfurt: Campus pp. 448–487.
McPherson, Miller, Lynn Smith-Lovin and James M Cook. 2001. “Birds of a Feather: Ho-mophily in Social Networks.” Annual Review of Sociology 27:415–444.
Micozzi, Juan Pablo. 2014. “Alliance for Progress? Multilevel Ambition and Pa�erns ofCosponsorship in the Argentine House.” Comparative Political Studies 47:1186–1208.
Munzert, Simon, Christian Rubba, Peter Meißner and Dominic Nyhuis. 2015. AutomatedData Collection with R: A Practical Guide to Web Scraping and Text Mining. New York:Wiley.
Newman, Mark E.J. 2001a. “Scienti�c Collaboration Networks. I. Network Constructionand Fundamental Results.” Physical Review E 64:016131.
Newman, Mark E.J. 2001b. “Scienti�c Collaboration Networks. II. Shortest Paths, WeightedNetworks, and Centrality.” Physical Review E 64:016132.
Opsahl, Tore, Filip Agneessens and John Skvoretz. 2010. “Node Centrality in WeightedNetworks: Generalizing Degree and Shortest Paths.” Social Networks 32:245–251.
Opsahl, Tore and Pietro Panzarasa. 2009. “Clustering in Weighted Networks.” Social Net-works 31:155–163.
R Core Team. 2015. R: A Language and Environment for Statistical Computing. Vienna,Austria: R Foundation for Statistical Computing.URL: http://www.r-project.org/
Schiller, Wendy J. 1995. “Senators as Political Entrepreneurs: Using Bill Sponsorship toShape Legislative Agendas.” American Journal of Political Science 39:186–203.
Tam Cho, Wendy K. and James H. Fowler. 2010. “Legislative Success in a Small World:Social Network Analysis and the Dynamics of Congressional Legislation.” Journal ofPolitics 72:124–135.
Wilson, Rick K. and Cheryl D. Young. 1997. “Cosponsorship in the U.S. Congress.” Legisla-tive Studies �arterly 22:25–43.
36