
Network Measures of Ecosystem...
8
A Dorin and K B Korb: Network measures of ecosystem complexity, Proceedings of the Twelfth International Conference on the Synthesis and Simulation of Living Systems (Artificial Life XII), 19 August 2010 to 23 August 2010, The MIT Press, Cambridge MA USA, pp. 323-328 Network Measures of Ecosystem Complexity Alan Dorin and Kevin B. Korb Faculty of Information Technology, Monash University, Clayton, Australia [alan.dorin, kevin.korb] @ infotech.monash.edu.au Abstract We argue that the networks that can be constructed to represent ecosystems may inform us about the open-endedness of the evolutionary systems that underlie their dynamics. By adopting this approach we circumvent problems that arise from looking for open-endedness at the level of the organism, the more usual approach. We then examine various measures of ecosystem (niche web) complexity and propose a new information- theoretic approach, Chaitin-Shannon Web Complexity. We compare its behaviour to that of the more common measures in ecology, in the light of common intuitions about complexity over a set of test networks and real ecosystem trophic webs. We also examine how the various measures accommodate intuitions about the complexity of these networks. Introduction The search for open-ended evolutionary simulations is compelling and has driven a sub-community of Artificial Life researchers to join philosophers and theoretical biologists in pondering the manner in which biological evolution is open- ended. This has resulted in various simulation environments that attempt to replicate the behaviour of real ecosystems (e.g. see the review in (Dorin, Korb et al. 2008)) and open problems such as the call to, “create a formal framework for synthesizing dynamical hierarchies at all scales” (Bedau, McCaskill et al. 2000). To achieve the goal of open-ended evolutionary software, we must first unambiguously identify open-ended complexity increase when we see it – we require a measure. Typically, as we show below, the search has focused on the increasing complexity of organisms, their structure and behaviour. For reasons we outline, we believe this to be wrong-headed and the source of much confusion. Instead, we propose to measure the complexity of the ecosystems of which organisms are a part, and to show that these do increase in complexity over evolutionary time periods. We achieve this by looking at ecosystem networks. Ecosystem networks Biological evolution operates within ecosystems on changing populations that define for themselves new ways of accumulating and consuming energy and matter to be employed for reproduction. Through feedback loops, organisms construct their own niches, passively and actively organising their environment, modifying the selection pressures acting on themselves, their progeny, and their cohabiters (Odling-Smee, Laland et al. 2003). The moulding of self-selection pressures by a population shifts the constraints within which future generations are introduced. Ecosystems can be described by a variety of networks linking these biotic and abiotic physical, chemical and behavioural relationships. We, like many ecologists, focus our attention on such networks as a way of understanding the global properties of the systems they represent (Watts and Strogatz 1998; Barrat and Weigt 2000; Dunne, Williams et al. 2002; Proulx, Promislow et al. 2005; Blüthgen, Fründ et al. 2008). We examine several techniques employed in the ecological and other literature for measuring the properties of ecosystem food webs and networks, describing also the Chaitin-Shannon web complexity based on information theory (Boulton and Wallace 1969). We then assess how these measures stack up against one another and against our intuitions about the complexity of ecosystem networks in a set of examples. Open-Ended Complexity Increase A common opinion about evolution has been that it swims against the tide of entropy and in particular that evolution over time constructs more and more complex organisms (e.g., see (Bronowski 1970)). This idea of creative complexity increase equates at its most extreme, to the view that evolution is progressing from bacteria to invertebrates and thence to vertebrates and mammals and, finally, to the pinnacle of life forms, us. 1 Such a view of Progress, however, ignores some quite basic features of evolution. For example, that the bacteria being “progressed from” still exist today and, indeed, have exactly as long an evolutionary history as we do, since we all have common ancestry. So, progress can hardly be characterized by endurance. Instead, progress has been recast as complexity, and complexity itself has been cast in terms favorable to ourselves; for example, as owning complex neural organizations — an account that fails to address the vast majority of earth’s life (Maynard-Smith and Szathmáry 1995). An infatuation with ourselves is also behind the “C- value paradox” — our chromosomes appear no more complex than those of other mammals and less complex than those of some plants. The two long-standing antagonists Dawkins and 1 For a skeptical review of this consensus opinion, identifying culprits, see (McShea, D. W. (1991)).
Transcript of Network Measures of Ecosystem...

A Dorin and K B Korb: Network measures of ecosystem complexity, Proceedings of the Twelfth International Conference on the Synthesis and Simulation of Living Systems (Artificial Life XII), 19 August 2010 to 23 August 2010, The MIT Press, Cambridge MA USA, pp. 323-328
Network Measures of Ecosystem Complexity
Alan Dorin and Kevin B. Korb
Faculty of Information Technology, Monash University, Clayton, Australia
[alan.dorin, kevin.korb] @ infotech.monash.edu.au
Abstract We argue that the networks that can be constructed to represent ecosystems may inform us about the open-endedness of the evolutionary systems that underlie their dynamics. By adopting this approach we circumvent problems that arise from looking for open-endedness at the level of the organism, the more usual approach. We then examine various measures of ecosystem (niche web) complexity and propose a new information-theoretic approach, Chaitin-Shannon Web Complexity. We compare its behaviour to that of the more common measures in ecology, in the light of common intuitions about complexity over a set of test networks and real ecosystem trophic webs. We also examine how the various measures accommodate intuitions about the complexity of these networks.
Introduction The search for open-ended evolutionary simulations is compelling and has driven a sub-community of Artificial Life researchers to join philosophers and theoretical biologists in pondering the manner in which biological evolution is open-ended. This has resulted in various simulation environments that attempt to replicate the behaviour of real ecosystems (e.g. see the review in (Dorin, Korb et al. 2008)) and open problems such as the call to, “create a formal framework for synthesizing dynamical hierarchies at all scales” (Bedau, McCaskill et al. 2000).
To achieve the goal of open-ended evolutionary software, we must first unambiguously identify open-ended complexity increase when we see it – we require a measure. Typically, as we show below, the search has focused on the increasing complexity of organisms, their structure and behaviour. For reasons we outline, we believe this to be wrong-headed and the source of much confusion. Instead, we propose to measure the complexity of the ecosystems of which organisms are a part, and to show that these do increase in complexity over evolutionary time periods. We achieve this by looking at ecosystem networks.
Ecosystem networks Biological evolution operates within ecosystems on changing populations that define for themselves new ways of accumulating and consuming energy and matter to be employed for reproduction. Through feedback loops, organisms construct their own niches, passively and actively organising their environment, modifying the selection
pressures acting on themselves, their progeny, and their cohabiters (Odling-Smee, Laland et al. 2003). The moulding of self-selection pressures by a population shifts the constraints within which future generations are introduced. Ecosystems can be described by a variety of networks linking these biotic and abiotic physical, chemical and behavioural relationships. We, like many ecologists, focus our attention on such networks as a way of understanding the global properties of the systems they represent (Watts and Strogatz 1998; Barrat and Weigt 2000; Dunne, Williams et al. 2002; Proulx, Promislow et al. 2005; Blüthgen, Fründ et al. 2008).
We examine several techniques employed in the ecological and other literature for measuring the properties of ecosystem food webs and networks, describing also the Chaitin-Shannon web complexity based on information theory (Boulton and Wallace 1969). We then assess how these measures stack up against one another and against our intuitions about the complexity of ecosystem networks in a set of examples.
Open-Ended Complexity Increase A common opinion about evolution has been that it swims against the tide of entropy and in particular that evolution over time constructs more and more complex organisms (e.g., see (Bronowski 1970)). This idea of creative complexity increase equates at its most extreme, to the view that evolution is progressing from bacteria to invertebrates and thence to vertebrates and mammals and, finally, to the pinnacle of life forms, us.1 Such a view of Progress, however, ignores some quite basic features of evolution. For example, that the bacteria being “progressed from” still exist today and, indeed, have exactly as long an evolutionary history as we do, since we all have common ancestry. So, progress can hardly be characterized by endurance. Instead, progress has been recast as complexity, and complexity itself has been cast in terms favorable to ourselves; for example, as owning complex neural organizations — an account that fails to address the vast majority of earth’s life (Maynard-Smith and Szathmáry 1995). An infatuation with ourselves is also behind the “C-value paradox” — our chromosomes appear no more complex than those of other mammals and less complex than those of some plants. The two long-standing antagonists Dawkins and 1 For a skeptical review of this consensus opinion, identifying culprits, see (McShea, D. W. (1991)).

Gould have together, and quite rightly, castigated this view as human chauvinism in an exchange in Evolution (Dawkins 1997; Gould 1997). Gould preferred to see in every attempt to characterize complexity and attribute its increase to evolutionary processes this hidden agenda of congratulating ourselves on our own unique wonderfulness. Dawkins, on the other hand, considers the evolutionary increase in complexity to be not just compatible with evolution, but intrinsic to it. Evolution climbs “Mount Improbable” (Dawkins 1996). Dawkins’ line of defence for ongoing complexity increase is to suggest that, whereas adaptive processes responding to the abiotic environment may just track meandering changes in the climate, coevolutionary processes acting between species work to develop coadaptations in trajectories that can be regarded as progressive in an engineering sense. Arms races lead to better weaponry and better defences, including better speed, flight, hearing and vision, for example.
In the Artificial Life literature, Bedau takes up the debate, offering his evolutionary activity statistics to assess whether or not an evolutionary system is evolving in an open-ended fashion (Bedau, Snyder et al. 1998) and an Arrow of Complexity Hypothesis that evolutionary systems show a systematic tendency to increase the complexity of organisms over time (Bedau 2009). Some Artificial Life researchers, notably (Ray 1990), have attempted to replicate this apparent evolutionary complexity increase in software, thus far, without any consensus of success, although some claim a limited success whilst improving Bedau et al’s measures of open-endedness (Channon 2006). The fundamental problem we have with the activity statistics, however, is that whatever they measure is not what we want to measure: they make no attempt to assess the complexity of organisms or ecosystems, but only the volume of new, adaptive "components" within an evolutionary system. By contrast, Adami has considered the level of the individual organism to be his target and has provided a measure of its complexity that accounts for the amount of information an organism stores about its (assumed to be static) niche (Adami 2002). Nevertheless, Adami notes the importance of extending the measure for application to complete ecosystems of dynamic, interacting niches, an approach we also prefer.
An attempt to dismiss complexity increases in individual species' organisation and behaviour over evolutionary time periods invokes a metaphoric “passive diffusion” (McShea 1994) through species design space, rather than a directed drive towards greater complexity. While diffusion may well contribute to increases in species complexity, it is unlikely to explain it entirely (Korb and Dorin 2010). In any case, we prefer to sidestep the issue and focus on complexity at a higher level: in the organization of niches in the ecosystem. Niche web complexity is not subject to the diffusion effects cited by McShea and others (ibid.); furthermore, it, and its correlate, species biodiversity, have with little controversy shown sustained increases over geological time. If we wish to understand the behaviour of niche web complexity, whatever its trajectory, we require a principled way of measuring it.
Complexity Measures for Ecosystems A measure of complexity for (virtual or real) ecosystems must correspond to our (educated) intuitions about what constitutes the complexity of a network (such as a food web). A few useful intuitions influenced by our readings of the literature (e.g. (Strogatz 2001)) are listed next. We then present some measures of network properties that have been employed in this literature and our own suggestion.
Intuitions about network complexity Intuition 1 (simple): A network with a regular, repeating structure is simple (e.g. a lattice or a fully-connected network). Intuition 2 (simple): Networks with few links are simple (e.g. a single long chain or a fully disconnected network). Intuition 3 (simple): A random network is simple (with a high probability; but since random processes can produce any structure, such a net will sometimes accidentally be complex!). Intuition 4 (simple): Small world networks − those with low "degrees of separation" − are simple. Intuition 5 (complex): A complex network has organisations (clusters, loops) of multiple sizes. Intuition 6 (complex): A bigger network is more complex than a small one. These intuitions, while widely commented upon in the ecological literature, are not universal; nor are they unambiguous. For one thing, they only make sense with ceteris paribus clauses − other things remaining equal. And there are potential interactions between some of them. For example, Intuition 6 may be undermined by increasing the size of the network while simultaneously deleting arcs and bringing in Intuition 2. We use them here not as premises, but as initial considerations. They may also work as heuristic guides to assessing networks and their complexity measures.
Intuition 5 is likely to capture some aspects of the major transitions in evolution, which can lead to tightly organized groups of niches.
Whilst the small-world networks2 of Intuition 4 have been shown to exhibit complex dynamical behaviour (e.g., see (Lago-Fernández, Huerta et al. 2000; Sporns, Tononi et al. 2000)) we are suggesting here that the networks themselves are structurally simple, whatever dynamical properties they may have – complex structure and behaviour do not necessarily go hand-in-hand (e.g., see (Strogatz 2001)). Others may, of course, have different intuitions about this!
Intuitions 1 and 2 have an interesting joint consequence which we will make use of later: networks of low density are simple, but so too are networks of high density (fully connected or worse). We infer that there may well be some kind of “Goldilocks effect”, i.e., that there is a maximum of 2 By small world we simply mean networks with a relatively low “degree of separation” — i.e. the diameter of the network is small relative to the number of nodes it contains (Proulx, Promislow et al. 2005). Some of the literature adds requirements to do with loopiness, clustering, etc.

network complexity achieved at some middle level of density, which tapers off when there are either too many or too few arcs. The same effect applies to Intuition 4 as well: very small worlds mean very high interconnection, while very large worlds imply very low interconnection.
Measures of network properties Networks have been widely studied in biology and several measures have been used to inform us about their properties in general (Watts and Strogatz 1998; Dunne, Williams et al. 2002; Proulx, Promislow et al. 2005; Neutel, Heesterbeek et al. 2007; Blüthgen, Fründ et al. 2008). Here we list some of relevance,3 gauging the extent to which each informs us about network complexity. We conclude this list by introducing our own proposal.
Number of nodes: n Ceteris paribus, smaller networks are simpler networks (cf. Intuition 2).
Number of edges: e Having fewer edges is another way in which networks can be smaller and therefore simpler (Intuition 2).
Weight: n + e The simple combination of the above two measures, reflecting the actual weight of a physical model of the network.
Density: D = e / n2 Given that there are n2 potential directed arcs in a network (where a node may have an arc directed back to itself), this is the frequency of arcs (relevant to Intuitions 1, 2, 4 and 5).
Density-Mass: D × n = e / n This combines Intuitions 2 and 6. Given that denser networks are more complex (other things being held equal and up to a point of diminishing returns) and larger networks are more complex, it’s reasonable to suppose that a measure of complexity might be proportional to both simultaneously, so we multiply the two measures.
Characteristic path length (CPL):
CPL =
€
sijpi=1
n
∑j=1
n
∑
where sij is the shortest path between nodes i and j (0 in case the shortest path is infinite) and p is the number of finite shortest paths between two nodes in the network (i.e., p < n2 just in case some shortest paths are infinite). Thus, CPL is the average shortest path length (“degree of separation”) between nodes. Low values would normally indicate a highly connected network, i.e., high edge density, or perhaps strategically placed edges allowing for shortcuts, corresponding to Intuitions 1 and 4. We also measure the variance of the shortest path lengths in the network in the 3 The literature contains many measures and variations. We focus on a few popular unweighted measures but omit several others that will be of interest for future studies. Measures such as the maximum omnivourous loop weight (Neutel, Heesterbeek, et al. 2007) are useful in some ecological applications but obviously not applicable to networks with unweighted edges.
hope it will indicate the presence of loops of different sizes (Intuition 5).
Clustering Coefficient (CC):
CC =
€
1n
SiNii
∑
where Ni is the number of i’s neighbours and Si is the number of shared neighbours, i.e., neighbours which are also neighbours of neighbours. This measures, on average, how “cliquey” the neighbours are across a network.
In a niche web a high clustering coefficient shows the presence of tightly coupled clusters of niche-dependencies. So, this is a partial indicator of the clusters and loops of Intuition 5. We also calculate the variance of the number of shared neighbours to reveal these structures at different sizes.
Shannon web complexity (SWC) This is a new use of a prior information-theoretic complexity measure, measuring niche web complexity by the number of bits needed to efficiently encode a network with n nodes, where the web may be any directed graph between the nodes. The code should be Shannon efficient for specifying the network structure to a receiver. In our first, naïve, version of SWC we make the simplifying assumption that the density of arcs in the network is uniform; i.e., the number of arcs in any two subgraphs of the same size is approximately the same. This assumption admittedly will be untrue for many networks, when the measure will no longer be Shannon efficient; below we indicate how to elaborate SWC to deal with such networks.
First, we need to identify (label, number) all the nodes. We can do this simply by specifying how many there are, i.e., coding the number n, assuming the labels will be 1, 2, …, n.
log2 n
Now we need to specify all arcs. We can do this in two steps. First we encode an estimate p of the probability that an arc exists between any two nodes; call this code length M(p). Given knowledge of p, specifying an existing arc takes −log2 p bits and specifying the absence of an arc takes −log2 (1 − p) bits. The number of possible arcs (going in either direction between nodes) is n2 (since nodes may be parents of themselves), so
p = e / n2
where e is the number of arcs in the graph (i.e., this is the density measure from above).
Hence, we can identify the arc structure in the following number of bits:
e (−log2 p) + [n2 − e] (−log2 (1 − p))
The first summand is the bit cost of specifying e arcs; the second is the bit cost of specifying all other potential arcs are missing. So, our final measure is:
M(p) + log2 n + e (– log2 p) + [n2 – e] (– log2 (1 – p))
This has the reasonable Goldlilocks property above: a low density web is counted as simple; complexity increases as the number of arcs increase; but as the web becomes very dense – as, for example, an ecosystem turns into an indiscriminate
mush – it starts losing complexity. Maximal complexity is reached when p ≈ 0.5. This measure is shown by (Boulton and Wallace 1969) to be effectively the same as the following adaptive code, which is simpler to compute (meaning, e.g., we don’t actually have to measure M(p)):
€
log2(n2 +1)!e!(n2 − e)!
This measure doesn’t respond directly to Intuition 5 that loopiness implies complexity, however as the arc density goes from low towards 0.5, loopiness is inevitable. Loopiness is improbable at low arc densities, while in some way meaningless at very high arc densities. While we think this naïve SWC is interesting, as it stands it is clearly defective. In particular, it violates Intuition 3 in an egregious way: all networks of the same size and with the same density receive the same measure, regardless of the order or disorder of those interconnections. This is related to the fact, remarked upon above, that SWC treats the network as a homogenous whole.
Chaitin-Shannon web complexity (CSWC) An approach which assesses subgraphs of different diameters, based upon Chaitin (1979), is a promising approach for extending SWC to heterogenous networks. Chaitin proposed a novel information-theoretic way of measuring the complexity of a system X of a size n by comparing the number of bits required to describe that system (H(X), where H stands for an entropy measure) with the number of bits required to describe X when partitioned into subsets of maximum diameter d<n (Hd(X)). When the descriptions are diameter-limited they are forced to forgo invoking large-scale structure to simplify the description. By looking at all possible diameter limits (and all possible partitions for each diameter) and finding the maximum discrepancy between description lengths with and without partitioning we obtain a natural measure of the complexity of the system. As Chaitin wrote: "If X has structure, then Hd(X) will rapidly increase; as d decreases and one can no longer take advantage of patterns of; size > d in describing X… Hd(X) will increase as d decreases past; the diameter of significant patterns in X, and if X is organized; hierarchically this will happen at each level in the hierarchy." The final measure finds the maximum (searching over diameter sizes d) for:
Hd(X) - H(X)
This approach is related to Wallace's (2005) minimum message length inference.
So far we have only taken a very short step towards a proper implementation of Chaitin's idea, which implemented naïvely would be intractable. In an approach reminiscent of (Tononi, Sporns et al. 1999) we have aimed at only a single diameter d, namely n-1, looking simply at binary partitions of that size and a singleton set. Tononi et al. use a standard entropy measure over joint random variables, which does not apply to network structures as such; we use SWC to measure
the structural entropy of both the original network and each partition, with:
€
Hd (X ) = min(H (α)+ H (Xi )i∑ )
where the Xi are subgraphs of size n-1 and H(α) is the number of bits required to describe the way in which the omitted singleton is connected to the rest of the network. This implementation is limited, of course, by not looking at smaller diameters, but also by not looking at more than the simplest partitions of the given diameter. We shall extend the measure to overcome both of these limitations in future work, even though a full search of the partition space is exponentially complex. Despite this limitation, in our results below we call this the Chaitin-Shannon web complexity (CSWC).
Another alternative of considerable potential is that of Standish (2009). This uses a standard algorithmic complexity approach to assessing the complexity of networks.
Testing Our Measures
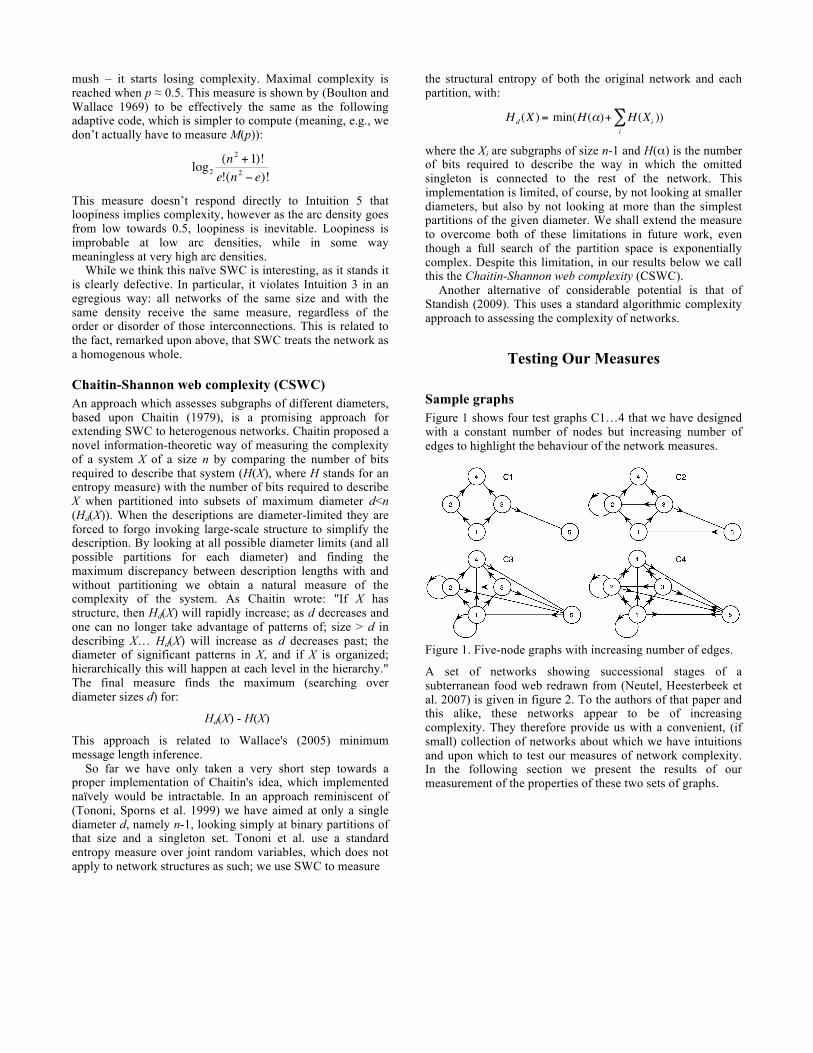
Sample graphs Figure 1 shows four test graphs C1…4 that we have designed with a constant number of nodes but increasing number of edges to highlight the behaviour of the network measures.
Figure 1. Five-node graphs with increasing number of edges.
A set of networks showing successional stages of a subterranean food web redrawn from (Neutel, Heesterbeek et al. 2007) is given in figure 2. To the authors of that paper and this alike, these networks appear to be of increasing complexity. They therefore provide us with a convenient, (if small) collection of networks about which we have intuitions and upon which to test our measures of network complexity. In the following section we present the results of our measurement of the properties of these two sets of graphs.

Figure 2. Graphs of subterranean food webs after (Neutel, Heesterbeek et al. 2002).
Results Figure 3 allows us to read the trends of the measures given above for graphs C1-4. Apart from the variance measures, naïve SWC and the CPL, all rise with the number of edges in the network. This certainly corresponds with a simplistic interpretation of Intuition 2. But this suggests the ever-increasing measures are actually poor indicators of complexity as the sustained increase contradicts Intuitions 1 and 4 that as the network becomes more fully connected, it is becoming more homogeneous, less likely to have long loops and distinct clusters, and therefore less complex. In contrast, we see here that naïve SWC and CPL both take the requisite dive after C3 (which has density ≈ 0.5) as the network connectedness climbs “too far”. The variance measures also dip at either end as expected given the addition of loops that occurs from C1 to C2 and C3 and the massive reduction in path lengths that then occurs by adding many doubly directed edges in C4. The CSWC does not drop as we would like at C4. Quite possibly this is because it is unable to detect the kinds of structures it is intended to measure whilst exploring only diameter n-1 in C4. In this graph no single node acts as a “key”. CSWC is similar in this regard to betweenness centrality – a measure that gauges the significance of each vertex by counting the number of shortest paths between node pairs that pass through it (Freeman 1977).
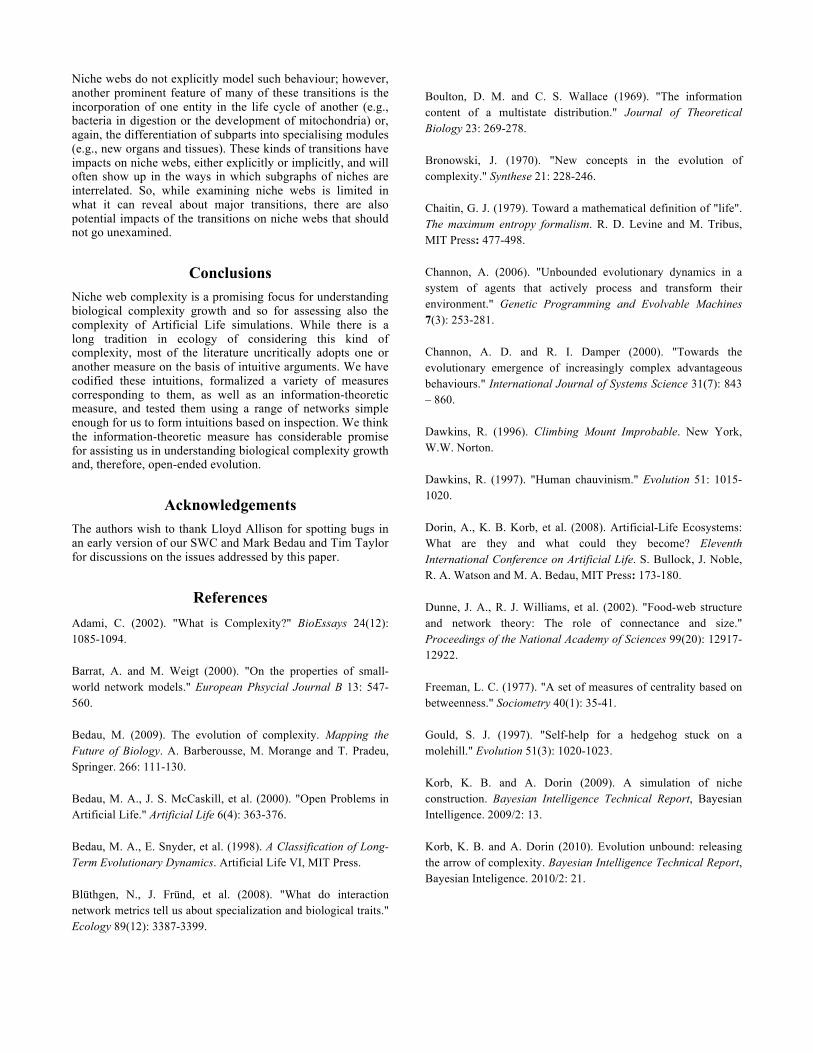
Figure 4 shows the CPL, clustering coefficient and their associated variance measures applied to the webs of figure 2. The CPL drops in the middle stages, before rising once again. As the ratio of the number of arcs to number of nodes increases (i.e., the edge density increases), the chance of having differentiated sub-networks actually decreases – the network will become one large structure with many internally connecting arcs. Depending on how these edges are added, the characteristic path length may drop, as is the case here where the networks (e.g. Hul 2) have additional nodes (increasing the denominator of the calculation) with no new, sizeable clusters or loops. We detected this behaviour in figure 3 between networks C3 and C4 that have identical node counts. If more nodes are later added (e.g. Hul 2-3 and 4) in such a way as to add lengthy loops, then the CPL too rises. The variance measure of the shortest path lengths used in computing the CPL mimics this measure’s behaviour.
The clustering coefficient and the variance of the neighbourliness of the networks’ nodes both rise as we would expect, indicating the increase in loops and clusters from network Sch to Hul 1. In moving to Hul 2 we see a drop in complexity by these measures – no new loops or clusters have been added, only nodes 11 and 12 in a single branch. Is this sufficient to consider the addition to be a complexity increase? By these measures, and by our intution, there is none. Onwards to Hul 4 the measures continue to rise as we would expect since new loops are added whilst the network density remains low.
Figure 5 shows the trends of the naïve SWC and CSWC measures applied to the webs of Figure 2. The naïve SWC demonstrates a continued increase in complexity across the webs as we, and the ecologists, would have expected. The CSWC trends in the direction we would expect, however our intuition that the move from Sch to Hul 1 is a far greater increase in complexity than that from Hul 1 to Hul 2 (as discussed above) is not indicated by this measure. Similarly, the increase from Hul 2-3 to Hul 4 is counter-intuitively small by this measure.
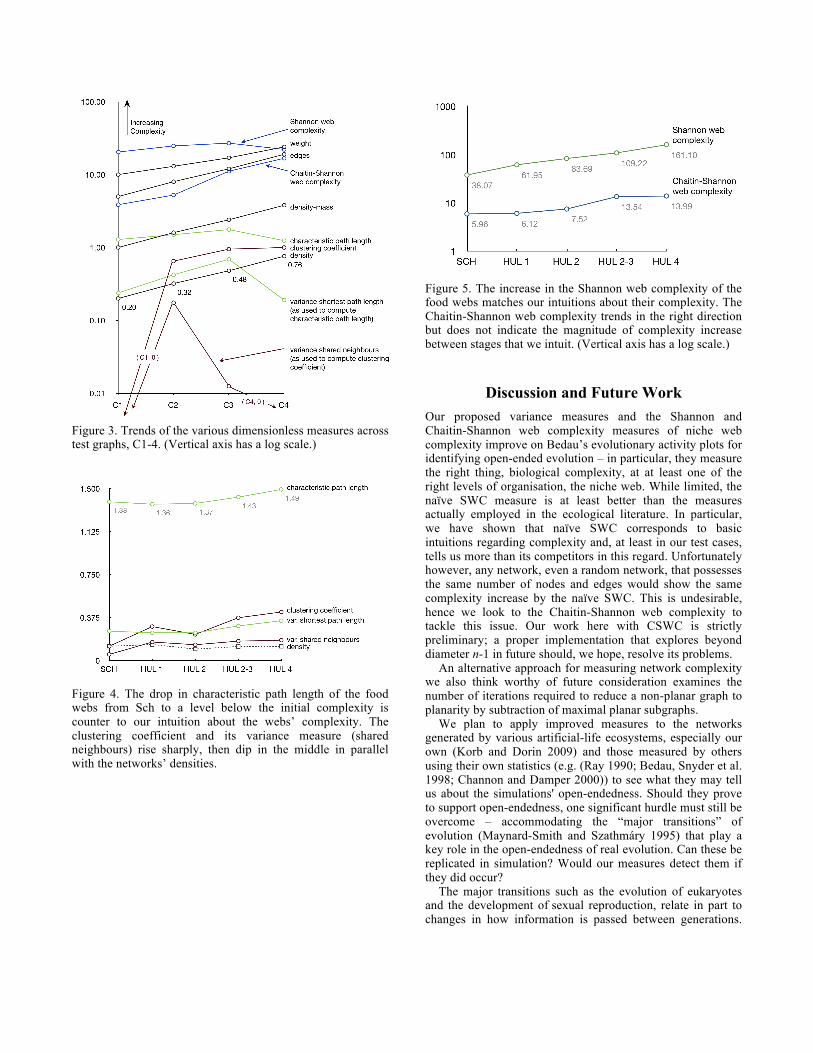
Figure 3. Trends of the various dimensionless measures across test graphs, C1-4. (Vertical axis has a log scale.)
Figure 4. The drop in characteristic path length of the food webs from Sch to a level below the initial complexity is counter to our intuition about the webs’ complexity. The clustering coefficient and its variance measure (shared neighbours) rise sharply, then dip in the middle in parallel with the networks’ densities.
Figure 5. The increase in the Shannon web complexity of the food webs matches our intuitions about their complexity. The Chaitin-Shannon web complexity trends in the right direction but does not indicate the magnitude of complexity increase between stages that we intuit. (Vertical axis has a log scale.)
Discussion and Future Work Our proposed variance measures and the Shannon and Chaitin-Shannon web complexity measures of niche web complexity improve on Bedau’s evolutionary activity plots for identifying open-ended evolution – in particular, they measure the right thing, biological complexity, at at least one of the right levels of organisation, the niche web. While limited, the naïve SWC measure is at least better than the measures actually employed in the ecological literature. In particular, we have shown that naïve SWC corresponds to basic intuitions regarding complexity and, at least in our test cases, tells us more than its competitors in this regard. Unfortunately however, any network, even a random network, that possesses the same number of nodes and edges would show the same complexity increase by the naïve SWC. This is undesirable, hence we look to the Chaitin-Shannon web complexity to tackle this issue. Our work here with CSWC is strictly preliminary; a proper implementation that explores beyond diameter n-1 in future should, we hope, resolve its problems.
An alternative approach for measuring network complexity we also think worthy of future consideration examines the number of iterations required to reduce a non-planar graph to planarity by subtraction of maximal planar subgraphs.
We plan to apply improved measures to the networks generated by various artificial-life ecosystems, especially our own (Korb and Dorin 2009) and those measured by others using their own statistics (e.g. (Ray 1990; Bedau, Snyder et al. 1998; Channon and Damper 2000)) to see what they may tell us about the simulations' open-endedness. Should they prove to support open-endedness, one significant hurdle must still be overcome – accommodating the “major transitions” of evolution (Maynard-Smith and Szathmáry 1995) that play a key role in the open-endedness of real evolution. Can these be replicated in simulation? Would our measures detect them if they did occur?
The major transitions such as the evolution of eukaryotes and the development of sexual reproduction, relate in part to changes in how information is passed between generations.
Niche webs do not explicitly model such behaviour; however, another prominent feature of many of these transitions is the incorporation of one entity in the life cycle of another (e.g., bacteria in digestion or the development of mitochondria) or, again, the differentiation of subparts into specialising modules (e.g., new organs and tissues). These kinds of transitions have impacts on niche webs, either explicitly or implicitly, and will often show up in the ways in which subgraphs of niches are interrelated. So, while examining niche webs is limited in what it can reveal about major transitions, there are also potential impacts of the transitions on niche webs that should not go unexamined.
Conclusions Niche web complexity is a promising focus for understanding biological complexity growth and so for assessing also the complexity of Artificial Life simulations. While there is a long tradition in ecology of considering this kind of complexity, most of the literature uncritically adopts one or another measure on the basis of intuitive arguments. We have codified these intuitions, formalized a variety of measures corresponding to them, as well as an information-theoretic measure, and tested them using a range of networks simple enough for us to form intuitions based on inspection. We think the information-theoretic measure has considerable promise for assisting us in understanding biological complexity growth and, therefore, open-ended evolution.
Acknowledgements The authors wish to thank Lloyd Allison for spotting bugs in an early version of our SWC and Mark Bedau and Tim Taylor for discussions on the issues addressed by this paper.
References Adami, C. (2002). "What is Complexity?" BioEssays 24(12): 1085-1094. Barrat, A. and M. Weigt (2000). "On the properties of small-world network models." European Phsycial Journal B 13: 547-560. Bedau, M. (2009). The evolution of complexity. Mapping the Future of Biology. A. Barberousse, M. Morange and T. Pradeu, Springer. 266: 111-130. Bedau, M. A., J. S. McCaskill, et al. (2000). "Open Problems in Artificial Life." Artificial Life 6(4): 363-376. Bedau, M. A., E. Snyder, et al. (1998). A Classification of Long-Term Evolutionary Dynamics. Artificial Life VI, MIT Press. Blüthgen, N., J. Fründ, et al. (2008). "What do interaction network metrics tell us about specialization and biological traits." Ecology 89(12): 3387-3399.
Boulton, D. M. and C. S. Wallace (1969). "The information content of a multistate distribution." Journal of Theoretical Biology 23: 269-278. Bronowski, J. (1970). "New concepts in the evolution of complexity." Synthese 21: 228-246. Chaitin, G. J. (1979). Toward a mathematical definition of "life". The maximum entropy formalism. R. D. Levine and M. Tribus, MIT Press: 477-498. Channon, A. (2006). "Unbounded evolutionary dynamics in a system of agents that actively process and transform their environment." Genetic Programming and Evolvable Machines 7(3): 253-281. Channon, A. D. and R. I. Damper (2000). "Towards the evolutionary emergence of increasingly complex advantageous behaviours." International Journal of Systems Science 31(7): 843 – 860. Dawkins, R. (1996). Climbing Mount Improbable. New York, W.W. Norton. Dawkins, R. (1997). "Human chauvinism." Evolution 51: 1015-1020. Dorin, A., K. B. Korb, et al. (2008). Artificial-Life Ecosystems: What are they and what could they become? Eleventh International Conference on Artificial Life. S. Bullock, J. Noble, R. A. Watson and M. A. Bedau, MIT Press: 173-180. Dunne, J. A., R. J. Williams, et al. (2002). "Food-web structure and network theory: The role of connectance and size." Proceedings of the National Academy of Sciences 99(20): 12917-12922. Freeman, L. C. (1977). "A set of measures of centrality based on betweenness." Sociometry 40(1): 35-41. Gould, S. J. (1997). "Self-help for a hedgehog stuck on a molehill." Evolution 51(3): 1020-1023. Korb, K. B. and A. Dorin (2009). A simulation of niche construction. Bayesian Intelligence Technical Report, Bayesian Intelligence. 2009/2: 13. Korb, K. B. and A. Dorin (2010). Evolution unbound: releasing the arrow of complexity. Bayesian Intelligence Technical Report, Bayesian Inteligence. 2010/2: 21.

Lago-Fernández, L. F., R. Huerta, et al. (2000). "Fast Response and Temporal Coding on Coherent Oscillations in Small-World Networks." Physical Review Letters 84(12): 2758–2761. Maynard-Smith, J. and E. Szathmáry (1995). The Major Transitions in Evolution. New York, W.H. Freeman. McShea, D. W. (1991). "Complexity and evolution: what everybody knows." Biology and Philosophy 6(3): 303-324. McShea, D. W. (1994). "Mechanisms of large-scale evolutionary trends." Evolution 48(6): 1747-1763. Neutel, A.-M., J. A. P. Heesterbeek, et al. (2007). "Reconciling complexity with stability in naturally assembling food webs." Nature 449: 599-602. Neutel, A.-M., J. A. P. Heesterbeek, et al. (2002). "Stability in Real Food Webs: Weak Links in Long Loops." Science 296(5570): 1120-1123. Odling-Smee, F. J., K. N. Laland, et al. (2003). Niche Construction, the neglected process in evolution. Princeton, Princeton University Press. Proulx, S. R., D. E. L. Promislow, et al. (2005). "Network thinking in ecology and evolution." Trends in Ecology and Evolution 20(6): 345-353. Ray, T. S. (1990). An approach to the synthesis of life. Artificial Life II, Santa Fe, New Mexico, Addison Wesley: 371-408. Sporns, O., G. Tononi, et al. (2000). "Theoretical Neuroanatomy: Relating Anatomical and Functional Connectivity in Graphs and Cortical Connection Matrices." Cerebral Cortex 10(2): 127-141. Standish, R. K. (2009) Complexity of networks (reprise). arXiv: 0911.3482v2 Strogatz, S. H. (2001). "Exploring Complex Networks." Nature 410(6825): 268-276. Tononi, G., O. Sporns, et al. (1999). "Measures of degeneracy and redundancy in biological networks." Proceedings of the National Academy of Sciences of the USA 96(6): 3257-3262. Wallace, C. S. (2005). Statistical and inductive inference by minimum message length, Springer-Verlag. Watts, D. J. and S. H. Strogatz (1998). "Collective dynamics of small-world networks." Nature 393: 440-442.


![JGRChJ 10 (2014) 68-89]JGRChJ 10 (2014) 68-89] ... S. Kloppenborg notes that it is difficult to prove Matthew added it.9 6. Kurt Aland and Barbara Aland, The Text of the New Testament:](https://static.fdocuments.in/doc/165x107/5aca3a857f8b9a51678dc243/jgrchj-10-2014-68-89-jgrchj-10-2014-68-89-s-kloppenborg-notes-that-it.jpg)