Network Management and Bandwidth Resource Allocation in...
8
Proceedings of the 2016 International Conference on Industrial Engineering and Operations Management Kuala Lumpur, Malaysia, March 8-10, 2016 Network Management and Bandwidth Resource Allocation in Educational Institutions Pakinam El Touby, Hala A. Farouk, Mohamed Mahmoud and Aziz E. Elsayed Industrial and Management Engineering Department College of Engineering and Technology Arab Academy for Science, Technology and Maritime Transport Abu-Kir Campus, P.O. Box 1029, Alexandria, Egypt [email protected] , [email protected] , [email protected] , [email protected] Abstract— Bandwidth distribution and network resource allocation are the main challenges of the IT department of any university, since it directly affects the quality of education. The users of a university campus network are mainly faculty, administrative staff, and students. It is important to fairly distribute and allocate the user’s share of bandwidth. Therefore the index of fairness is considered as the main university campus network performance criterion. In this paper a generic model of the fairness index is presented to analyze the reasons for its application and the benefit of its implementation. An educational institute located in Alexandria, Egypt, with a total number of thirty-two buildings, that contains four Colleges with around 350 faculty members, 1200 technical and administrative staff and 5000 students, is taken as a case study. Data from the campus data center is collected and the index of fairness is measured and elaborated. The results indicate an unfair network resource allocation and therefore suggestions for improving the bandwidth distribution, which directly impacts the user’s satisfaction, are proposed. Keywords— Index of Fairness, Decision Support Systems, Educational Facility performance I. INTRODUCTION One of the major services a university offers to its users is the internet. The internet network facility of the Arab Academy for Science, Technology and Maritime Transport (AASTMT) is a university campus network which provides internet service for more than six campuses in different cities all over Egypt. The main university Computer Network Data Center (CNDC) that manages the internet in the different campuses is established in Abu-Kir campus, located in Alexandria. The Abu-Kir campus network is the main concern of this paper, since it has over 25 buildings hosted by five colleges. The campus network serves over 5000 students, about 350 faculty members, 1200 technical and administrative staff and many visitors or temporary employees. This network offers besides the internet other various services such as remote software access, student’s performance assessment and registration. The remote software access allows research students and faculty members to access the AASTMT virtual private network (VPN) and run various software as thin clients. Student’s performance assessment is accessed by both students and faculty. Students can view their exam results and faculty can enter results and view statistics on their students’ performance from inside and outside the campus. Registration allows students to register desired courses from also either inside or outside campus. Part of the AASTMT strategic plan is to upload all course materials including lectures’ videos and to allow students to access them from outside and inside the campus. These services facilitate the task performed by decision takers at the AASTMT and therefore it can be considered as a decision support system (DSS). As this network continues to grow in size and the DSS continues to grow in complexity, it was important to examine the network performance and attempt to improve it. Monitoring network performance is a fundamental task for network operators as it directly impacts the quality of service and hence user satisfaction [1]. Improving the service will also strongly affect the quality of education in a positive way. Therefore AASTMT has subscribed with the three reliable national internet service providers (ISP) in Egypt. Internet in this paper is defined in terms of bandwidth. AASTMT receives a total bandwidth of 280 Mbps, which was foreseen by the CNDC administrators to satisfy all customers’ demands inside the campus. However many complaints have been received from both faculty members and students concerning the speed of the internet and the stability of the connection. In a network, where resources are shared among different users, fair allocation is important [2]. Since there are satisfied and unsatisfied customers on the same network, the bandwidth appears to be unfairly distributed. This unfair bandwidth distribution affects the quality of service. In this paper we study the effectiveness of the fairness index proposed in [2] to measure the fairness of the bandwidth distribution. This paper first illustrates an overview of the network infrastructure within the Abu-Kir campus. Then the gathered data, the measured fairness index and analysis of the results are presented. (c) IEOM Society International
Transcript of Network Management and Bandwidth Resource Allocation in...

Proceedings of the 2016 International Conference on Industrial Engineering and Operations Management
Kuala Lumpur, Malaysia, March 8-10, 2016
Network Management and Bandwidth Resource Allocation in
Educational Institutions
Pakinam El Touby, Hala A. Farouk, Mohamed Mahmoud and Aziz E. Elsayed Industrial and Management Engineering Department
College of Engineering and Technology
Arab Academy for Science, Technology and Maritime Transport
Abu-Kir Campus,
P.O. Box 1029, Alexandria, Egypt
[email protected] , [email protected] , [email protected] , [email protected]
Abstract— Bandwidth distribution and network resource allocation are the main challenges of the IT department of any
university, since it directly affects the quality of education. The users of a university campus network are mainly faculty,
administrative staff, and students. It is important to fairly distribute and allocate the user’s share of bandwidth. Therefore the index
of fairness is considered as the main university campus network performance criterion. In this paper a generic model of the fairness
index is presented to analyze the reasons for its application and the benefit of its implementation. An educational institute located in
Alexandria, Egypt, with a total number of thirty-two buildings, that contains four Colleges with around 350 faculty members, 1200
technical and administrative staff and 5000 students, is taken as a case study. Data from the campus data center is collected and the
index of fairness is measured and elaborated. The results indicate an unfair network resource allocation and therefore suggestions
for improving the bandwidth distribution, which directly impacts the user’s satisfaction, are proposed.
Keywords— Index of Fairness, Decision Support Systems, Educational Facility performance
I. INTRODUCTION
One of the major services a university offers to its users is the internet. The internet network facility of the Arab Academy for Science, Technology and Maritime Transport (AASTMT) is a university campus network which provides internet service for more than six campuses in different cities all over Egypt. The main university Computer Network Data Center (CNDC) that manages the internet in the different campuses is established in Abu-Kir campus, located in Alexandria. The Abu-Kir campus network is the main concern of this paper, since it has over 25 buildings hosted by five colleges. The campus network serves over 5000 students, about 350 faculty members, 1200 technical and administrative staff and many visitors or temporary employees.
This network offers besides the internet other various services such as remote software access, student’s performance assessment and registration. The remote software access allows research students and faculty members to access the AASTMT virtual private network (VPN) and run various software as thin clients. Student’s performance assessment is accessed by both students and faculty. Students can view their exam results and faculty can enter results and view statistics on their students’ performance from inside and outside the campus. Registration allows students to register desired courses from also either inside or outside campus. Part of the AASTMT strategic plan is to upload all course materials including lectures’ videos and to allow students to access them from outside and inside the campus. These services facilitate the task performed by decision takers at the AASTMT and therefore it can be considered as a decision support system (DSS). As this network continues to grow in size and the DSS continues to grow in complexity, it was important to examine the network performance and attempt to improve it.
Monitoring network performance is a fundamental task for network operators as it directly impacts the quality of service and hence user satisfaction [1]. Improving the service will also strongly affect the quality of education in a positive way. Therefore AASTMT has subscribed with the three reliable national internet service providers (ISP) in Egypt. Internet in this paper is defined in terms of bandwidth. AASTMT receives a total bandwidth of 280 Mbps, which was foreseen by the CNDC administrators to satisfy all customers’ demands inside the campus. However many complaints have been received from both faculty members and students concerning the speed of the internet and the stability of the connection.
In a network, where resources are shared among different users, fair allocation is important [2]. Since there are satisfied and unsatisfied customers on the same network, the bandwidth appears to be unfairly distributed. This unfair bandwidth distribution affects the quality of service. In this paper we study the effectiveness of the fairness index proposed in [2] to measure the fairness of the bandwidth distribution. This paper first illustrates an overview of the network infrastructure within the Abu-Kir campus. Then the gathered data, the measured fairness index and analysis of the results are presented.
(c) IEOM Society International
Proceedings of the 2016 International Conference on Industrial Engineering and Operations Management
Kuala Lumpur, Malaysia, March 8-10, 2016
II. BANDWIDTH FAIRNESS INDICES
Decision support systems (DSS) are knowledge based information systems that help decision makers to easily take their decisions. They do not substitute individuals who take decisions, however they only facilitate taking the right decision through some data analysis [3]. One of the most significant issues a university should take a decision about is the internet [4, 5].
Internet is nowadays one of the most important and powerful educational tools with numerous potentials. It is currently being used by everyone involved in the educational process in higher educational institutions. Direct participants to the education process are students and faculty members, indirect participants are other administrative members and technicians. Both direct and indirect participants are considered as internet users inside a college campus. Every one of them deserves to have a reliable fast internet connection to be able to perform their tasks efficiently and hence improve the quality of education. Improving the internet service performance is one of the main and significant decisions college IT managers take into consideration [5].
Since demand for bandwidth is explosively growing, a fair bandwidth allocation is needed [6]. Bandwidth is defined as “the amount of data transmitted over a communications link during a fixed time interval” in [7]. Network bandwidth is usually expressed in bits per second (bps); currently modern networks typically have speeds measured in millions of bits per second (megabits per second, or Mbps) or billions of bits per second (gigabits per second, or Gbps). Bandwidth is one of the factors that affect network performance. Other network performance measures may be packet loss, latency and jitter. Improving any of these measures will positively affect the user satisfaction as mentioned in [8]. However, this paper focuses only on bandwidth as the key performance indicator.
Bandwidth is moreover defined as “the transmission capacity of a computer network or other telecommunication system” according to the Oxford dictionary [9]. Although bandwidth and throughput seem to be similar, but they are not to be interchanged. Bandwidth in this sense is the maximum amount of data transferred over a link, while throughput is the average data transferred. In other words, bandwidth is considered as the theoretical units of work per time and throughput is the actual units of work per time.
This paper discusses bandwidth distribution as a resource allocation problem. Bandwidth resource allocation is allocating the available bandwidth resource to different users in a utilized manner to improve the internet performance and to increase the user satisfaction [10]. Managing networks is a point of interest in many networks researches. Network management involves the allocation of fixed resources in this case bandwidth, to many different services and applications [11]. Several researchers have already discussed the importance of bandwidth allocation and network management [6, 11–14].
Some recent studies [6, 11, 12, 15, 16] have only focused on the optimization of the bandwidth allocation in campus networks. Part of them [6, 15] have used traffic shaping models for the optimization operation. These models required differentiating between two types of network traffic, peer-to-peer and non-peer-to-peer. Peer to peer, as explained in [6, 15], are file sharing applications that are mostly used in entertainment, such as Gnutella and WinMx. They are bandwidth-hungry applications and consume most of the bandwidth in a network. All other traffic types than the entertainment file sharing peer-to-peer are considered as non-peer-to-peer traffic. Traffic shaping problem was modeled as Markov decision process and algorithms were developed to determine the optimal bandwidth allocation.
On the other hand the fair distribution of bandwidth has also been extensively studied. This research is tending to focus on fair allocation and distribution of bandwidth rather than developing traffic shaping models. A fair and efficient bandwidth distribution has been a central issue in computer networks [17]. In Oxford dictionary [9], fairness is defined as “ equitableness, fair dealing, honesty..”. There are some other fairness definitions in literature such as “the system is no better-off than its worse-off individual”[18]. Generally in wireless or internet networks fairness means that equal individuals should be treated equally. A system is fair when everyone sharing this system gets what they really deserve. Fairness is usually ascribed to resource sharing or allocation problems. In order to measure whether a system is fair or not, or how much it is fair, an important performance criterion was needed. This is the so called fairness index or index of fairness, that was first developed in the eighties and proposed in [2]. In this paper, a popular fairness index has been introduced, tested and compared with other fairness indices mentioned in former literature. Indices that were previously proposed in literature were basically variance, coefficient of variation and minimum to maximum ratio. However, these indices did not satisfy all of the required properties the author wanted to have in his proposed index. Four properties were desired in [2]:
Independent of population size: the index should be scalable with number of users.
Independent of scale and metric: the index should not change with measure or metrics used. This property impliesthat variance can be also used as a fairness index.
Boundedness: the index should be finite and bounded between (0) and (1). A (0) indicates a complete unfair systemand (1) indicates a completely fair system.
Continuity: the index function should be continuous on allocations. This means that, any slight change in theallocation should be reflected in the index.
(c) IEOM Society International

Proceedings of the 2016 International Conference on Industrial Engineering and Operations Management
Kuala Lumpur, Malaysia, March 8-10, 2016
As can be seen variance, coefficient of variation and min-max ratio do not fit all the required fairness index properties. Variance for instance in not bounded, min – max ratio is not continuous.
In coherence with the model properties the index is defined in [2] as:
f(x) = [∑ xi
ni=1 ]
2
n ∑ xi2n
i=1
Where n is the number of competing users sharing a resource, 𝑥𝑖 is the allocation received by each 𝑖𝑡ℎ user.
F(x) is bounded between 0 and 1. The illustrated index is one of the earliest proposed and widely studied fairness measures. This index is a quantitative measure and provides measurement of fairness with a real number representation.
Besides, fairness can be qualitatively measured. The most two representative measures are max-min fairness and proportional fairness. Max-min fairness is achieved in a system,” if it cannot increase any individual’s resource without decreasing another individual’s resource allocation which is already less than the previous ones” [19].
The second measure, the proportional fairness, “allocates bandwidth in proportion to their data rates” as mentioned in [20]. Equality in wired networks may not be achieved using max-min fairness. On the other hand, proportional fairness needs availability of the whole allocation information, which makes it difficult to be used in distributed wireless networks. Achieving fair resource allocation in shared systems are well-studied topics in wireless networks. A fair allocation affects the internet performance and leads to satisfied users. Recently there has been also growing interest in studying the effect of fairness on internet performance [21].
III. THE CAMPUS NETWORK INFRASTRUCTURE
The AASTMT branches allover Egypt are all connected together using a Wide Area Network (WAN). High speed internet is available in all AASTMT branches. A total of 280 Mbps of bandwidth is received and distributed all over the branches. Inside each branch there are usually two types of connections available, wired networks known as Local Area Network (LAN) and wireless connections known as (Wi-Fi), to provide internet services for the various purposes mentioned earlier.
As stated before, the CNDC of the Abu-Kir campus is the main computer center that manages and controls the AASTMT network in all branches. Fig. 1 shows an overview of the network infrastructure in Abu-Kir campus.
INTERNET
BRANCHES
Router
Core Switch
Access Switch
Distribution Switch
Access Point
Mobile Devices
Computer
Building 1
Router
Firewall
Servers FarmDataCenter
Access Switch
Access Point
Mobile Devices
Building 28Building
10/100/1000 Mbps10/100/1000 Mbps
1/10 Gbps
1 Gbps if copper wire10 Gbps if fiberoptics
1/10 Gbps
280 Mbps
Fig. 1. AASTMT network campus infrastructure
(c) IEOM Society International
Proceedings of the 2016 International Conference on Industrial Engineering and Operations Management
Kuala Lumpur, Malaysia, March 8-10, 2016
The CNDC in Fig. 1 is connected to its servers’ farm, which are the AASMT servers that provide the aforementioned services such as the VPN. The Firewall displayed in the figure is responsible for the security. It controls the type of incoming and outgoing data traffic according to preset rules made by the CNDC administrators. The incoming internet from the ISP, represented in a cloud, must first pass through the CNDC firewall system. This firewall is also connected to the other branches as well as to the campus core switch to serve internet to either other branches or to the Abu-Kir campus. Like many other campus networks, this network is similarly constructed using three tiers of switches. The first-tier switch is the core switch. It joins the distribution switches together and provides fast transport within the campus buildings. The next tier is the distribution switch. Distribution switches are to be found in every building to deliver internet connectivity through access switches. The links between the distribution switches and the core switch provide two different speeds either 1 Gbps or 10 Gbps, according to the type of wires used. Distribution switches connect many access switches together. The last tier is the access switch. Each building contains many access switches that are all connected to one distribution switch. Again the link between the access switch and the distribution switch is either 1 or 10 Gbps according to the type of wires used. 1 Gbps is available in case of the use of copper wire, while 10 Gbps is provided when fiber-optics are used. Access switches provide user access to the network through either wired connections using Ethernet cables or wireless connections through access points. Ethernet cables can provide speeds such as 10, 100 and 1000 Mbps depending on the on the network interface card installed in the computers. The hierarchy of the distribution and access switches presented in building 1 is repeated in each building of the campus.
IV. INDEX OF FAIRNESS ELABORATION
A. Data Collection and Observations
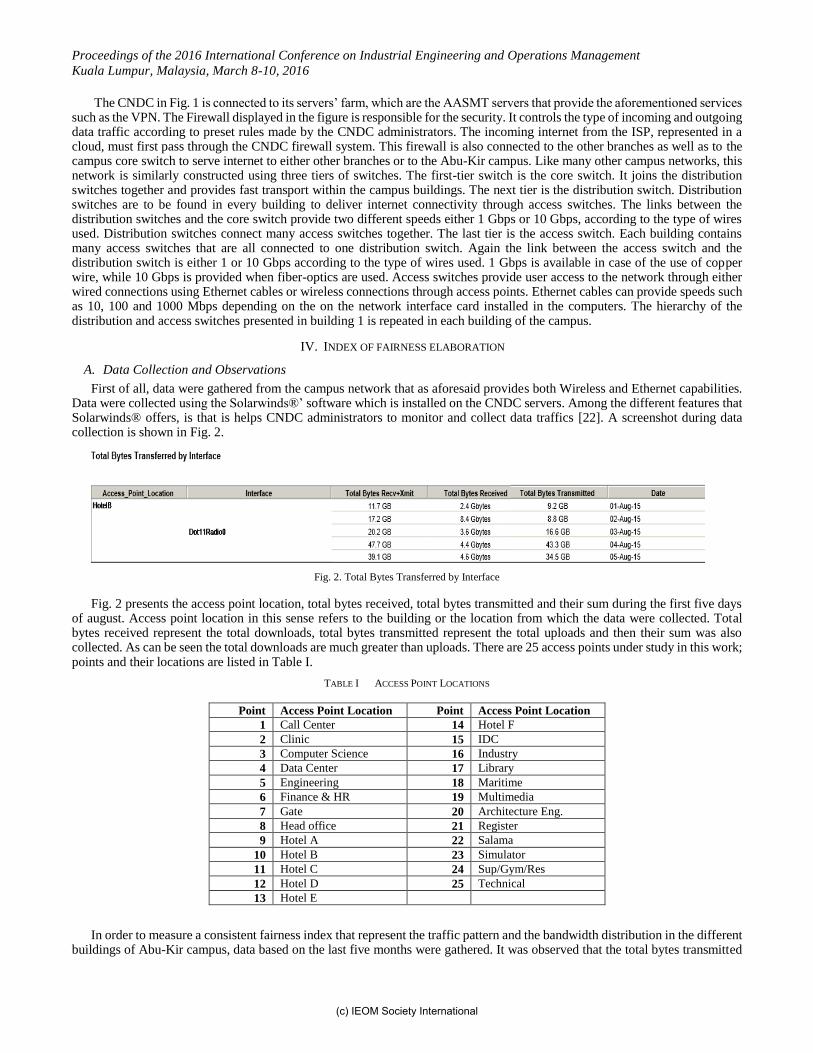
First of all, data were gathered from the campus network that as aforesaid provides both Wireless and Ethernet capabilities. Data were collected using the Solarwinds®’ software which is installed on the CNDC servers. Among the different features that Solarwinds® offers, is that is helps CNDC administrators to monitor and collect data traffics [22]. A screenshot during data collection is shown in Fig. 2.
Fig. 2. Total Bytes Transferred by Interface
Fig. 2 presents the access point location, total bytes received, total bytes transmitted and their sum during the first five days of august. Access point location in this sense refers to the building or the location from which the data were collected. Total bytes received represent the total downloads, total bytes transmitted represent the total uploads and then their sum was also collected. As can be seen the total downloads are much greater than uploads. There are 25 access points under study in this work; points and their locations are listed in Table I.
TABLE I ACCESS POINT LOCATIONS
Point Access Point Location Point Access Point Location
1 Call Center 14 Hotel F
2 Clinic 15 IDC
3 Computer Science 16 Industry
4 Data Center 17 Library
5 Engineering 18 Maritime
6 Finance & HR 19 Multimedia
7 Gate 20 Architecture Eng.
8 Head office 21 Register
9 Hotel A 22 Salama
10 Hotel B 23 Simulator
11 Hotel C 24 Sup/Gym/Res
12 Hotel D 25 Technical
13 Hotel E
In order to measure a consistent fairness index that represent the traffic pattern and the bandwidth distribution in the different buildings of Abu-Kir campus, data based on the last five months were gathered. It was observed that the total bytes transmitted
(c) IEOM Society International
Proceedings of the 2016 International Conference on Industrial Engineering and Operations Management
Kuala Lumpur, Malaysia, March 8-10, 2016
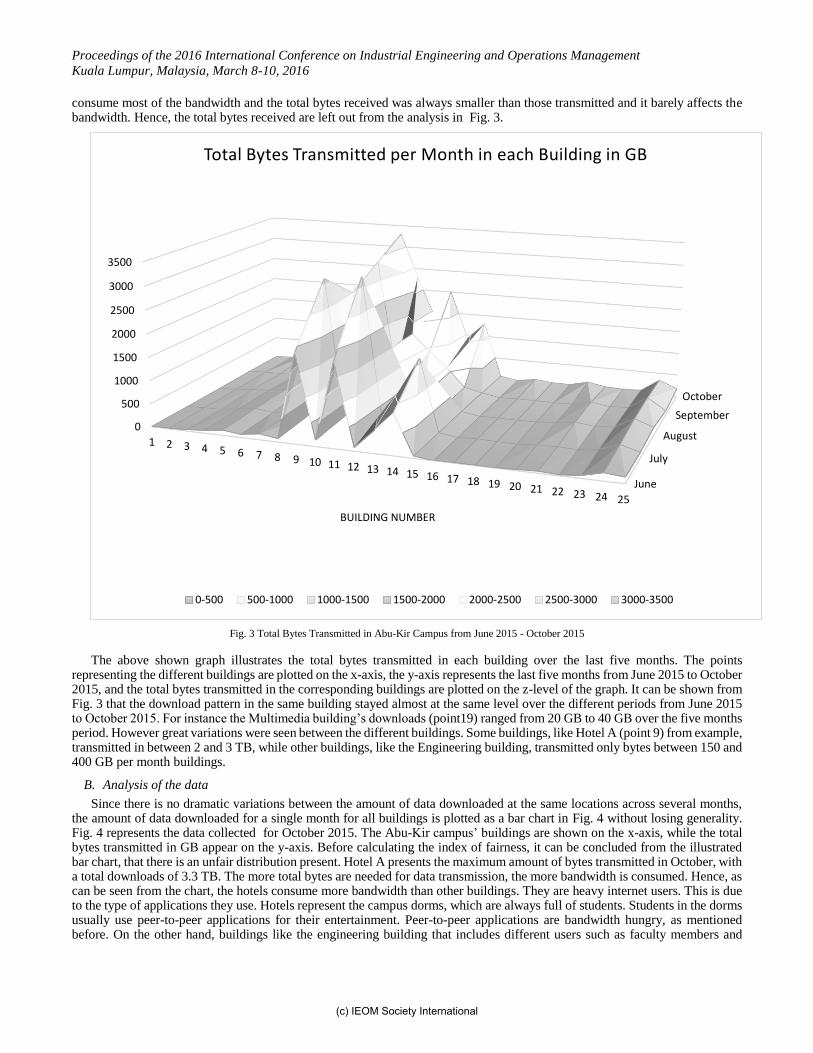
consume most of the bandwidth and the total bytes received was always smaller than those transmitted and it barely affects the bandwidth. Hence, the total bytes received are left out from the analysis in Fig. 3.
Fig. 3 Total Bytes Transmitted in Abu-Kir Campus from June 2015 - October 2015
The above shown graph illustrates the total bytes transmitted in each building over the last five months. The points representing the different buildings are plotted on the x-axis, the y-axis represents the last five months from June 2015 to October 2015, and the total bytes transmitted in the corresponding buildings are plotted on the z-level of the graph. It can be shown from Fig. 3 that the download pattern in the same building stayed almost at the same level over the different periods from June 2015 to October 2015. For instance the Multimedia building’s downloads (point19) ranged from 20 GB to 40 GB over the five months period. However great variations were seen between the different buildings. Some buildings, like Hotel A (point 9) from example, transmitted in between 2 and 3 TB, while other buildings, like the Engineering building, transmitted only bytes between 150 and 400 GB per month buildings.
B. Analysis of the data
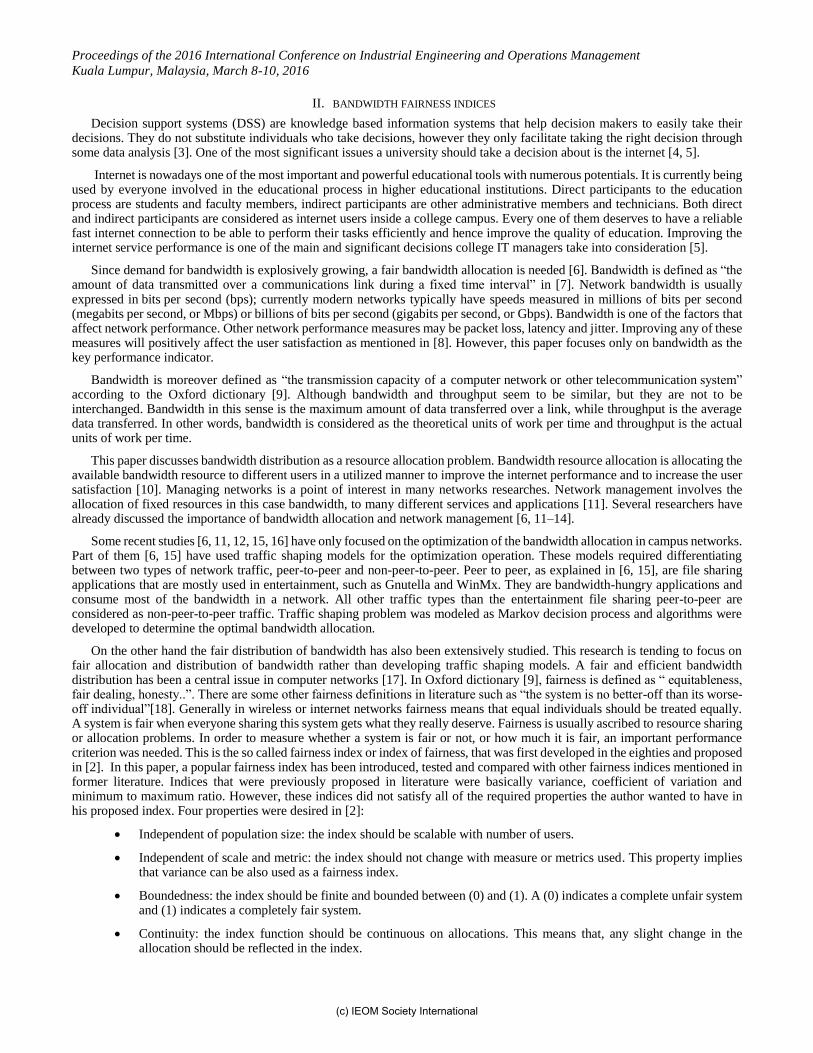
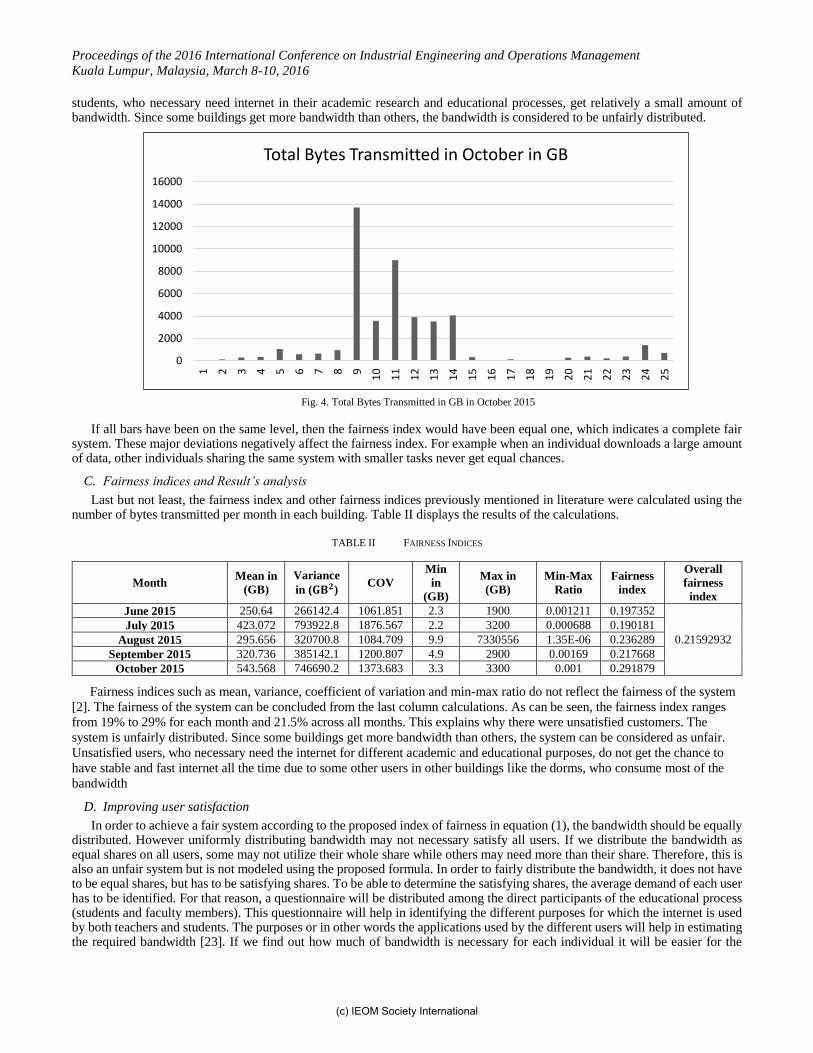
Since there is no dramatic variations between the amount of data downloaded at the same locations across several months, the amount of data downloaded for a single month for all buildings is plotted as a bar chart in Fig. 4 without losing generality. Fig. 4 represents the data collected for October 2015. The Abu-Kir campus’ buildings are shown on the x-axis, while the total bytes transmitted in GB appear on the y-axis. Before calculating the index of fairness, it can be concluded from the illustrated bar chart, that there is an unfair distribution present. Hotel A presents the maximum amount of bytes transmitted in October, with a total downloads of 3.3 TB. The more total bytes are needed for data transmission, the more bandwidth is consumed. Hence, as can be seen from the chart, the hotels consume more bandwidth than other buildings. They are heavy internet users. This is due to the type of applications they use. Hotels represent the campus dorms, which are always full of students. Students in the dorms usually use peer-to-peer applications for their entertainment. Peer-to-peer applications are bandwidth hungry, as mentioned before. On the other hand, buildings like the engineering building that includes different users such as faculty members and
June
July
August
September
October
0
500
1000
1500
2000
2500
3000
3500
1 2 3 4 5 6 7 8 9 10 11 12 13 14 15 16 17 18 19 20 21 22 23 24 25
BUILDING NUMBER
Total Bytes Transmitted per Month in each Building in GB
0-500 500-1000 1000-1500 1500-2000 2000-2500 2500-3000 3000-3500
(c) IEOM Society International
Proceedings of the 2016 International Conference on Industrial Engineering and Operations Management
Kuala Lumpur, Malaysia, March 8-10, 2016
students, who necessary need internet in their academic research and educational processes, get relatively a small amount of bandwidth. Since some buildings get more bandwidth than others, the bandwidth is considered to be unfairly distributed.
If all bars have been on the same level, then the fairness index would have been equal one, which indicates a complete fair system. These major deviations negatively affect the fairness index. For example when an individual downloads a large amount of data, other individuals sharing the same system with smaller tasks never get equal chances.
C. Fairness indices and Result’s analysis
Last but not least, the fairness index and other fairness indices previously mentioned in literature were calculated using the number of bytes transmitted per month in each building. Table II displays the results of the calculations.
TABLE II FAIRNESS INDICES
Fairness indices such as mean, variance, coefficient of variation and min-max ratio do not reflect the fairness of the system
[2]. The fairness of the system can be concluded from the last column calculations. As can be seen, the fairness index ranges
from 19% to 29% for each month and 21.5% across all months. This explains why there were unsatisfied customers. The
system is unfairly distributed. Since some buildings get more bandwidth than others, the system can be considered as unfair.
Unsatisfied users, who necessary need the internet for different academic and educational purposes, do not get the chance to
have stable and fast internet all the time due to some other users in other buildings like the dorms, who consume most of the
bandwidth
D. Improving user satisfaction
In order to achieve a fair system according to the proposed index of fairness in equation (1), the bandwidth should be equally distributed. However uniformly distributing bandwidth may not necessary satisfy all users. If we distribute the bandwidth as equal shares on all users, some may not utilize their whole share while others may need more than their share. Therefore, this is also an unfair system but is not modeled using the proposed formula. In order to fairly distribute the bandwidth, it does not have to be equal shares, but has to be satisfying shares. To be able to determine the satisfying shares, the average demand of each user has to be identified. For that reason, a questionnaire will be distributed among the direct participants of the educational process (students and faculty members). This questionnaire will help in identifying the different purposes for which the internet is used by both teachers and students. The purposes or in other words the applications used by the different users will help in estimating the required bandwidth [23]. If we find out how much of bandwidth is necessary for each individual it will be easier for the
0
2000
4000
6000
8000
10000
12000
14000
16000
1 2 3 4 5 6 7 8 9
10
11
12
13
14
15
16
17
18
19
20
21
22
23
24
25
Total Bytes Transmitted in October in GB
Month Mean in
(GB)
Variance
in (𝐆𝐁𝟐) COV
Min
in
(GB)
Max in
(GB)
Min-Max
Ratio
Fairness
index
Overall
fairness
index
June 2015 250.64 266142.4 1061.851 2.3 1900 0.001211 0.197352
0.21592932
July 2015 423.072 793922.8 1876.567 2.2 3200 0.000688 0.190181
August 2015 295.656 320700.8 1084.709 9.9 7330556 1.35E-06 0.236289
September 2015 320.736 385142.1 1200.807 4.9 2900 0.00169 0.217668
October 2015 543.568 746690.2 1373.683 3.3 3300 0.001 0.291879
Fig. 4. Total Bytes Transmitted in GB in October 2015
(c) IEOM Society International

Proceedings of the 2016 International Conference on Industrial Engineering and Operations Management
Kuala Lumpur, Malaysia, March 8-10, 2016
AASTMT decision makers to reallocate the distribution and to best utilize the received bandwidth. Furthermore this questionnaire will measure the user’s level of satisfaction towards the college internet. This survey will moreover highlight the problems faced by the respondents while using the internet. The results of the survey will indicate the overall system performance. Using a 5% margin of error and a 95% confidence level, the required number of faculty respondents taking this questionnaire will be 180 persons. If we consider the same confidence level and margin of error, however for the students’ sample size calculation, the chosen sample size will be 350 students. The required sample size was calculated using [24]. The results of the questionnaire and the improved fairness index is discussed and elaborated in future work.
In addition, bandwidth unfair distribution and allocation may not be the only reason behind user’s dissatisfaction. Therefore the hardware allocation problem should be considered. Reallocating hardware devices such as routers may introduce a solution to the problem. Improving Wi-Fi signal may increase the user’s satisfaction towards the internet and hence decrease the amount of received complaints. Improving Wi-Fi signal involves identifying the best location for placing Wi-Fi routers. Wi-Fi internet is on contrary to the Ethernet, being shared by many users. Finding the optimum location for the routers or the access points, will offer better coverage for the users. Users will be therefore able to finish their internet related educational tasks faster and more efficiently. The user’s satisfaction level and hence the quality of education is positively affected.
V. CONCLUSION AND FUTURE WORK
Although the AASTMT campus receives a huge quota of bandwidth from its internet service providers, there were still unsatisfied users. Unfair bandwidth allocation and distribution was predicted to be one of the reasons of user’s dissatisfaction. Therefore it was necessary to examine the fairness of the system, through collecting data and measuring a proposed fairness index, which clearly indicate that the system was indeed unfair.
Applying the fairness index formula on the gathered data resulted in an only 21% fair bandwidth distribution. When an individual consumes most of the bandwidth in the system, other individuals sharing the same system do not get equal chances to have the same amount of bandwidth. This leads to user dissatisfaction and to a decreased level of the quality of service and education. When direct participants of the educational process such as faculty members and students, who necessary need a reliable and fast internet for academic purposes, do not get the required service, the learning outcomes of the educational process will be negatively affected.
AASTMT decision makers should reconsider the bandwidth distribution or the network allocation problem. Setting up some limitation policies on the various buildings to provide all users with the same chance of getting real needs bandwidth share may be one of the solutions.
Furthermore the results of the questionnaire will help in identifying the demand required by each user. Therefore, a new formula can be developed in the future, to reflect the fairness of the system according to the real needs of bandwidth share and not equal or uniform bandwidth share.
Meanwhile, the hardware reallocation may also present a solution to the problem. If we consider reallocating the routers that provide wireless in a manner that everyone gets a better internet or Wi-Fi coverage, the user satisfaction will increase and the learning outcomes of the educational process will be improved
REFERENCES
[1] R. Cusani, T. Inzerilli, and L. Valentini, “Network monitoring and performance evaluation in a 3.5G network,” Comput. Networks, vol. 51, no. 15, pp. 4412–4420, Oct. 2007.
[2] R. Jain, D.-M. Chiu, and W. R. Hawe, “A quantitative measure of fairness and discrimination for resource allocation in shared computer system,” DEC technical report TR301, vol. cs.NI/9809, no. DEC-TR-301. pp. 1–38, 1984.
[3] M. Personal, R. Archive, V. P. Bresfelean, and N. Ghisoiu, “Higher education decision making and decision support systems,” no. 26698, 2010.
[4] M. Ploj, “The Role of Internet in Education,” pp. 243–249, 2012.
[5] C. Technology, “Bandwidth management in universities in Zimbabwe : Towards a responsible user base through effective policy implementation Lockias Chitanana Midlands State University , Zimbabwe,” vol. 8, no. 2, pp. 62–76, 2012.
[6] D. C. Novak, “Managing bandwidth allocations between competing recreational and non-recreational traffic on campus networks,” Decis. Support Syst., vol. 45, no. 2, pp. 338–353, May 2008.
[7] R. Prosad, C. Davrolis, M. Murray, and K. C. Claffy, “Bandwidth estimation: metrics, measurement techniques, and tools,” IEEE Netw., vol. 17, no. 6, pp. 27–35, 2003.
[8] K.-J. Kim, I.-J. Jeong, J.-C. Park, Y.-J. Park, C.-G. Kim, and T.-H. Kim, “The impact of network service performance on customer satisfaction and loyalty: High-speed internet service case in Korea,” Expert Syst. Appl., vol. 32, no. 3, pp. 822–831, Apr. 2007.
[9] “Oxford Dictionary.” [Online]. Available: http://www.oxforddictionaries.com/.
[10] Aptivate, “Bandwidth management position paper.,” no. June, 2007.
[11] S. Kalyanasundaram, E. K. P. Chong, and N. B. Shroff, “Optimal resource allocation in multi-class networks with user-specified utility functions,” Comput. Networks, vol. 38, no. 5, pp. 613–630, Apr. 2002.
(c) IEOM Society International
Proceedings of the 2016 International Conference on Industrial Engineering and Operations Management
Kuala Lumpur, Malaysia, March 8-10, 2016
[12] G. Tychogiorgos and K. K. Leung, “Optimization-based resource allocation in communication networks,” Comput. Networks, vol. 66, pp. 32–45, 2014.
[13] R. Bar-Yehuda, G. Polevoy, and D. Rawitz, “Bandwidth allocation in cellular networks with multiple interferences,” Proc. 6th Int. Work. Found. Mob. Comput. - DIALM-POMC ’10, vol. 194, p. 33, 2010.
[14] C. H. Wang and H. P. Luh, “Analysis of bandwidth allocation on end-to-end QoS networks under budget control,” Comput. Math. with Appl., vol. 62, no. 1, pp. 419–439, 2011.
[15] S. K. Nair and D. C. Novak, “A traffic shaping model for optimizing network operations,” Eur. J. Oper. Res., vol. 180, no. 3, pp. 1358–1380, Aug. 2007.
[16] S. Mingsong and W. Yuefan, “Optimization in dynamic allocation of network bandwidth campus based on Xen,” pp. 1–4.
[17] R. M. Salles and J. a. Barria, “Fair and efficient dynamic bandwidth allocation for multi-application networks,” Computer Networks, vol. 49, no. 6. Elsevier B.V., pp. 856–877, Jul-2005.
[18] J. Rawls, “a Theory of Justice,” Idea, pp. 136–142, 1996.
[19] R. V. Prasad, E. Onur, and I. G. M. M. Niemegeers, “Fairness in Wireless Networks:Issues, Measures and Challenges,” IEEE Commun. Surv. Tutorials, vol. 16, no. 1, pp. 5–24, 2014.
[20] L. Li, M. Pal, and Y. R. Yang, “Proportional fairness in multi-rate wireless LANs,” Proc. - IEEE INFOCOM, pp. 1678–1686, 2008.
[21] T. Bonald and L. Massoulié, “Impact of fairness on Internet performance,” ACM SIGMETRICS Perform. Eval. Rev., vol. 29, no. 1, pp. 82–91, 2001.
[22] “Solarwinds website.” [Online]. Available: http://www.solarwinds.com.
[23] R. Kenny and T. Broughton, “Domestic bandwidth requirements in Australia A forecast for the period 2013-2023,” no. May, 2014.
[24] F. Tusell, “Finite Population Sampling,” no. May, 2012.
BIOGRAPHY
Pakinam El Touby is a fulltime graduate teaching assistant at the department of Industrial and Management Engineering (IME) at Arab
Academy for Science, Technology and Maritime Transport. She is currently enrolled in M.Sc. program in Industrial and Management
Engineering in the same Academy. Her thesis research area is in network and bandwidth resource allocation. She graduated with an honor
degree in 2013 and she is also a member of IIE.
Hala A. Farouk received her PhD in Engineering from Cairo University, Egypt in 2011. She has been teaching and conducting research at
the Computer Engineering Department in the Arab Academy for Science, Technology and Maritime Transport (AAST) from 2001 to 2012.
Currently, she is an assistant professor at the Industrial and Management Engineering Department in the AAST.
Her research interests center on hardware design and its adoption in industry, security of hardware systems and the adoption of
evolutionary optimization in industry. She is a member of the IIE, ACM, IACR and the IEEE.
Mohamed Mahmoud is an associate Professor at the Arab Academy for Science, Technology and Maritime Transport. He is currently the
manager of the Computer Networks and Data Center (CNDC).
Aziz E. ElSayed is a Professor of IE at College of Engineering, Arab Academy for Science, Technology, Egypt. Dr. Aziz is currently the
advisor to the Academy president for scientific affairs. From (12-2011 to 8-2014), He served as the VP for education and quality assurance.
He also was the dean of Engineering, from (02-2008) to (12-2011). He was also the dean of Engineering, (BAU), Lebanon (2003-2004) ,
and the chair of the department of IE (2001-2003).
Dr. Aziz has over 39 years of experience in the field of IE since He got his Ph.D. from Alexandria University, (1983). He joined the School
of IE, Purdue University, as a visiting professor (1984-1986). He also worked as an industrial expert, MOP, Saudi Arabia (1987-1994). His
research interest lies in the improvement of Industrial systems performance, Industrial Facility Planning, PPC, lean manufacturing, and
process design.
Dr. Elsayed supervised a vast number of research theses in the field of Industrial and Management Engineering. He is also a senior member
of IIE, SME, and CASA of SME since (1984). He holds the genuine research award in engineering from Alexandria University (1987) and
the Best Teacher Award based on Student Polls, (2008).
(c) IEOM Society International