Network-based fMRI-neurofeedback training applied to ... · time, SAN activation and DMN...
193
GUSTAVO SANTO PEDRO PAMPLONA Network-based fMRI-neurofeedback training applied to sustained attention Treinamento por fMRI-neurofeedback baseado em redes aplicado à atenção sustentada Tese apresentada à Faculdade de Filosofia, Ciências e Letras de Ribeirão Preto da Universidade de São Paulo para obtenção do título de Doutor. Área de concentração Física Aplicada à Medicina e Biologia Orientador: Prof. Dr. Carlos Ernesto Garrido Salmon Ribeirão Preto – SP 2018
Transcript of Network-based fMRI-neurofeedback training applied to ... · time, SAN activation and DMN...
GUSTAVO SANTO PEDRO PAMPLONA
Network-based fMRI-neurofeedback training applied to sustained attention
Treinamento por fMRI-neurofeedback baseado em redes aplicado à atenção sustentada
Tese apresentada à Faculdade de Filosofia, Ciências e Letras de Ribeirão Preto da Universidade de São Paulo para obtenção do título de Doutor.
Área de concentração
Física Aplicada à Medicina e Biologia
Orientador:
Prof. Dr. Carlos Ernesto Garrido Salmon
Ribeirão Preto – SP
2018

ii
Autorizo a reprodução e divulgação total ou parcial deste trabalho, por qualquer meio convencional ou eletrônico, para fins de estudo e pesquisa, desde que citada a fonte.
Este documento corresponde à versão corrigida da Dissertação de Mestrado. A versão original encontra-se na Seção de Pós-Graduação da FFCLRP-USP.
FICHA CATALOGRÁFICA
Pamplona, Gustavo Santo Pedro. Network-based fMRI-neurofeedback training applied to
sustained attention / Treinamento por fMRI-neurofeedback baseado em redes aplicado à atenção sustentada / Gustavo Santo Pedro Pamplona; orientador Carlos Ernesto Garrido Salmon. – Ribeirão Preto, 2018.
193p.
Tese (Doutorado – Programa de Pós-Graduação em Física Aplicada a Medicina e Biologia) – Faculdade de Filosofia, Ciências e Letras de Ribeirão Preto da Universidade de Ribeirão Preto, 2018.
1. Neurofeedback. 2. Real-time fMRI. 3. Attention. 4. Behavioral changes. 5. Sustained attention network. 6. Default Mode Network.

iii

iv
Acknowledgements
The following thesis is a result of intense and insistent work, albeit also with rife
scientific pleasure and curiosity. Still, its realization was only possible through the
coverage of many supporters.
Thank you Prof. Carlos Garrido by trusting me since the beginning of my master’s
studies, especially when the doctoral study was not more than an ambitious glimpse. I
am glad by the precious hours you spent aside of me, tirelessly explaining each one of
the study’s substantial elements. Not to mention the fact you always followed me
during the MRI acquisitions in Brazil. It was a supervision based on the beauty of the
scientific rigor and positivist skepticism, something I intend to keep for the lifetime.
Since when I cogitate running part of the PhD studies in Switzerland, Prof. Frank
Scharnowski was entirely and wholeheartedly open arms cordially to receive me. The
combination between sympathy and brilliance I saw in this professor was an example
that ego is truly inverse to knowledge. You gave me all personal and professional
support I needed, besides of the engagement and the credit for the research
realization.
The volunteers’ participations were orchestrally arranged by Jennifer Heldner, at that
time my master student, indissociable fellowship during data acquisition. Because of
your work, the study could be timely made. I thank you by the unconditional
involvement in the project and the contagious joy during the winter experiments.
To the study collaborators, my deepest gratitude. It was because of excellent experts
on board that the study could reach the desired scientific level. I thank the meticulous
Dr. Robert Langner and the creative Prof. Lars Michels by the support in the psychologic
and neuroscientific concepts of attention. Also, thanks to Dr. Ludovica Griffanti by the
impeccable support in ICA and by being humble when listening to a mere spectator of
her OHBM lecture.
I thank the IDOR team, in Rio de Janeiro, by the initial help to understand the
neurofeedback technique and by granting the conditions for pilot experiments, kindly
provided by Prof. Jorge Moll. I also thank the 24/7 help given by Dr. Rodrigo Basilio in
the initial moments of computational operations. Also, thank you, Dr. Griselda Garrido,
by the seminal help in basic principles and by the connection to IDOR.
The research universe can be funny and creative when one works in InBrain Lab, at USP
Ribeirão Preto. How I miss those pleasant coffee time with inspiring talks. I thank in

v
special to Bruno Hebling by the friendship and positive criticism, to the cheerful André
Paschoal and his horrible cookies, to the support of the friend Jeam “Mineiro” Barbosa,
and to many others. A big hug to each one of this loved lab. Also, thank you Dr. Carlo
Rondinoni, Maíra, João Paulo, Ícaro, Cassiano, Dr. Felipe, Dr. Danilo, Prof. Renata
Leoni, and Pedro.
I was also optimally welcomed and installed in the Neurofeedback Lab in Zürich, or
better, Scharnowski Lab. Many thanks to Amelie Haugg by the ubiquitous help, to the
always available Dr. Philipp Stämpfli, and to everyone from (and related to) this lab.
Also, thank you Ronald, Bingjie, Nada, Margrith, and Cindy.
Very important, my huge thank you to each one of the volunteers in Brazil and
Switzerland. It was a pleasure to get to know you and to have you included in my
experiment. In special, to the Brazilian volunteers by being so solicitous in the
participation, even though sometimes tough conditions were offered. In many cases,
our friendship was tested through their longitudinal participation.
Many thanks to the MR technicians from Clinics Hospital of Faculty of Medicine, USP
Ribeirão Preto. The experiment would not be possible without you.
To the Brazilian research agencies CNPq and CAPES and the Swiss Federal Commission
for Scholarships by the financial help and the granted opportunity.
To the statistical aid from Dr. Arron Metcalfe and Dr. Simon Schwab.
To the patient members of my PhD defense committee, by being with me during a long
but constructive event, Prof. Draulio Araujo, Prof Jarrod Lewis-Peacock, Prof. Lars
Michels, Prof. Carlos Garrido and Prof. João Sato.
And last but not least, I would like to both thank and dedicate this thesis to my great
family and my amazing friends; as well as to my sweet girlfriend Charlotte, by injecting
me the happiness I needed for the last sprint of my PhD studies.

vi
“If, while reading this article, you have noticed yourself having to re-read parts of it because you have been thinking of something else, blame it not only on the turgid academic prose, but also on the small inefficiencies of your right hemisphere vigilant attention system.” –
Ian H. Robertson, The absent mind: Attention and error. The Psychologist, v. 16, n. 9, p. 476–479, 2003.

vii
Resumo
PAMPLONA, G. S. P. Treinamento através de fMRI-neurofeedback baseado em redes
aplicado à atenção sustentada. 2018. 193p. Tese (Doutorado – Programa de Pós-
Graduação em Física Aplicada à Medicina e Biologia) – Faculdade de Filosofia, Ciências
e Letras de Ribeirão Preto da Universidade de Ribeirão Preto.
A atenção é uma função mental crucial na vida cotidiana, mas infelizmente distrai-se
facilmente. Os fundamentos cerebrais que sustentam a atenção, a chamada rede de
atenção, foram satisfatoriamente identificados, assim como os fundamentos cerebrais
que sustentam a divagação, a chamada rede de modo padrão. Entretanto, embora tais
processos sejam conhecidos, este conhecimento ainda não foi transformado em
protocolos avançados de treinamento de atenção baseado na atividade cerebral.
Portanto, é proposto o uso de uma nova técnica baseada em imageamento por
ressonância funcional (fMRI) em tempo real para proporcionar aos indivíduos
informação sobre os níveis de atividade cerebral atuais nas redes de atenção e de
modo padrão.
Segundo nosso conhecimento atual, esse é o primeiro estudo a mostrar que, com o
auxílio do neurofeedback baseado em fMRI, indivíduos podem aprender como
melhorar o controle da ativação da rede de atenção e da desativação da rede de modo
padrão ao mesmo tempo. Este processo de treinamento poderia ser explicado
principalmente em termos da desativação da rede de modo padrão. Efeitos
comportamentais foram observados, ao separar um grupo com os melhores
aprendizes, em uma medida de atenção geral e, especificamente, na habilidade de
alternação de tarefas, controlado por um grupo teste-reteste realizando a mesma
bateria de testes comportamentais. Alterações em conectividade funcional induzidas
por neurofeedback foram também reveladas em múltiplas regiões cerebrais positiva e
negativamente relacionadas à atenção. Embora os efeitos comportamentais não
puderam ser constatados depois de dois meses após o treinamento, os participantes
ainda mantiveram a habilidade de controlar a autorregulação das redes em questão.
viii
Esse método provê uma ferramenta não-invasiva e não-farmacológica para
proporcionar melhorias gerais na habilidade de atenção para sujeitos saudáveis, o que
pode ser potencialmente benéfico para muitos pacientes de desordens neurológicas e
psiquiátricas.
Nesta tese, são mostradas evidências convincentes de que a definição de redes
cerebrais e outros parâmetros experimentais de neurofeedback baseado em fMRI são
decisivos para a indução do aprendizado de autorregulação, em um estudo similar,
também considerando o sinal diferencial de redes competitivas relacionadas à
atenção.
Finalmente, é apresentado Personode, uma ferramenta útil, de fácil utilização e de
livre acesso direcionado a pesquisadores em neuroimagem, para classificação de
mapas produzidos por uma análise de componentes independentes em redes de
repouso canônicas e definições de regiões de interesse em níveis individuais e de
grupo. É também mostrado que a ferramenta conduz a melhores resultados para
análises de ativação induzida à tarefa e conectividade funcional.
Palavras-chave: 1. Neurofeedback. 2. fMRI em tempo real. 3. Atenção. 4. Alterações
comportamentais. 5. Rede de atenção sustentada. 6. Rede de modo padrão.
ix
Abstract
PAMPLONA, G. S. P. Network-based fMRI-neurofeedback training applied to
sustained attention. 2018. 193p. Thesis (Ph.D. – Programa de Pós-Graduação em Física
Aplicada à Medicina e Biologia) – Faculdade de Filosofia, Ciências e Letras de Ribeirão
Preto da Universidade de Ribeirão Preto.
Attention is a key mental function in everyday life, but unfortunately we easily get
distracted. The brain correlates underlying sustained attention, the so-called sustained
attention network (SAN), have been well identified, as have the brain correlates
underlying mind-wandering, the so-called default mode network (DMN). Nevertheless,
even though we know about the underlying brain processes, this knowledge has not
yet been translated in advanced brain-based attention training protocols. Here we
proposed to use a novel brain imaging technique based on real-time functional
magnetic resonance imaging (fMRI) to provide individuals with information about
ongoing levels of activity in the attention and the default mode networks.
To the best of our knowledge, this is the first study to show that, with the help of that
fMRI-neurofeedback, individuals can learn how to improve controlling of, at the same
time, SAN activation and DMN deactivation. This learning process was explained
mainly in terms of DMN deactivation. Behavioral effects were observed when
separating a group with the best learners in an overall measure of attention and
specifically in the task-switching ability, controlled by a test-retest group performing
the same behavioral tests battery. Neurofeedback-induced functional connectivity
changes were also observed in multiple brain regions positively and negatively related
to attention. Although the behavioral effects were no longer present two months after
training, participants still held the learned ability of controlling self-regulation of the
concerned networks. This approach potentially provides a non-invasive and non-
pharmacological tool to deliver general enhancements in the attention ability for
healthy subjects and it can be potentially beneficial to many neurological and
psychiatric patients.

x
We also show in this thesis compelling evidence that brain regions definition and other
experimental parameters are crucial for inducing learning of self-regulation via fMRI-
neurofeedback, in a similar study also considering differential signal of attention-
related competitive networks.
We finally present Personode, a useful, easy to use, and open access toolbox to
neuroimaging researchers, for independent component analysis maps classification
into canonical resting-state networks and regions-of--interest definition in individual
and group levels. We also show that the toolbox leads to better results for task-
induced activation and functional connectivity analyses.
Keywords: 1. Neurofeedback. 2. Real-time fMRI. 3. Attention. 4. Behavioral changes. 5.
Sustained attention network. 6. Default Mode Network.

xi
List of Figures
Figure 1. A typical fMRI-neurofeedback loop (adapted from http://neurofeedback-
research.org/). The loop is comprised by (1) signal acquisition, (2) online
processing, (3) feedback presentation, and (4) participant’s response to the
feedback. ...............................................................................................................................................40
Figure 2. Experimental timeline – Experiment I. In order to perform the
neurofeedback training, a longitudinal training has to be conducted (for NF group).
Sessions of neurofeedback were made in two different days for each participant.
One day before, one day after, and after two months of neurofeedback training
(follow-up), the participants were also submitted to questionnaires screening,
resting-state functional images acquisition, anatomical image acquisition (except
in follow-up day), and attention tests application. ...............................................................60
Figure 3. Selected SAN (red) and DMN (blue) ROIs and their center-of-mass xyz
MNI coordinates for Experiment I in sagittal, coronal, and axial views. SAN1 =
mACC, SAN2 = rIFJ, SAN3 = rTPJ, SAN4 = rIPS, DMN1 = PCC, DMN2 = mPFC, DMN3
= lAG, DMN4 = rAG. ...........................................................................................................................64
Figure 4. Neurofeedback training design for Experiment I. Intermittent feedback
was shown for 30-s baseline (represented by a black square), 40-s regulation
(represented by a black up-arrow), and 4-s feedback blocks (represented by
thermometers in which the height was proportional to the performance in the last
cycle). The cycle was repeated 5 times. At the end of the run, information about
monetary reward was given proportional to the performance in the run during 5 s.
...................................................................................................................................................................68
Figure 5. Screenshots showing representative conditions and instructions for the
attention tests battery of Experiment I, presented in the following order: CPT –
Continuous Performance Task, Switcher – Task-Switching Performance, PVT –

xii
Psychomotor Vigilance Test, Mental Rotation, and ANT – Attentional Network Test.
...................................................................................................................................................................76
Figure 6. T-values for regulation vs baseline conditions regarding the differential
signal SAN minus DMN across runs (left) and days (right) for neurofeedback
training runs. Error bars represent the standard error of the mean. Asterisk
indicates significant difference. ...................................................................................................84
Figure 7. T-values for regulation vs baseline conditions regarding the average of
SAN across runs (left) and days (right) for neurofeedback training runs. Error bars
represent the standard error of the mean. ..............................................................................84
Figure 8. T-values for regulation vs baseline conditions regarding the average of
DMN across runs (left) and days (right) for neurofeedback training runs. Error
bars represent the standard error of the mean. Asterisk indicates significant
difference. .............................................................................................................................................85
Figure 9. T-values for regulation vs baseline conditions regarding individual SAN
ROIs across runs (above) and days (below) for neurofeedback training runs. Error
bars represent the standard error of the mean. ....................................................................86
Figure 10. T-values for regulation vs baseline conditions regarding individual DMN
ROIs across runs (above) and days (below) for neurofeedback training runs. Error
bars represent the standard error of the mean. Asterisks indicate significant
difference. .............................................................................................................................................86
Figure 11. Performance estimates for offline and online analyses are proportional,
indicating trustworthy online computation of the brain-activity-based feedback.
The figure provides a visual comparison of learning curves for offline (left) and
online (right) analyses regarding the differential signal across runs for
neurofeedback training runs. ........................................................................................................87
Figure 12. T-values for regulation vs baseline conditions regarding the differential
signal SAN minus DMN (above), average SAN (below, left), and average DMN
(below, right) for transfer runs and follow-up runs. Error bars represent the
standard error of the mean. Asterisk indicates significant difference. .........................88

xiii
Figure 13. T-values for regulation vs baseline conditions regarding individual SAN
(above) and DMN ROIs (below) across runs for transfer runs and follow-up runs.
Results are shown for transfer runs before training, after training, and follow-up.
Error bars represent the standard error of the mean. Asterisks indicate significant
difference. .............................................................................................................................................89
Figure 14. Cohen’s effect sizes for each of the combined measures for NF (blue)
and TR (orange) groups, as well as for NF sub-groups: learners (gray) and sub-
learners (yellow). CPT – Continuous Performance Task, Switcher – Task-Switching
Performance, PVT – Psychomotor Vigilance Test, Rotation – Mental Rotation, and
ANT – Attentional Network Test. ................................................................................................90
Figure 15. Scatterplot and linear fit showing the association between difference of
Self-Focused Attention scores (follow-up minus pre-training) and slope of the
neurofeedback learning curve. .....................................................................................................92
Figure 16. Pearson correlations between slopes of neurofeedback learning curve
over runs and the following self-report scores: control, difficulty, and
concentration. Error bars represent standard errors of the mean. ...............................93
Figure 17. Self-reported concentration scores for all participants over
neurofeedback runs and linear fit. ..............................................................................................93
Figure 18. Associations between differences of attention tests combined measures
(application after minus before neurofeedback training) and slopes of
neurofeedback learning curve. r and p represent Pearson correlation and p-values,
respectively. CPT – Continuous Performance Task, Switcher – Task-Switching
Performance, PVT – Psychomotor Vigilance Test, Rotation – Mental Rotation, and
ANT – Attentional Network Test. ................................................................................................94
Figure 19. Axial slices showing activations (red) and deactivations (blue) for NF
group during last training run for uncorrected p = 0.001 and cluster size > 10
voxels. .....................................................................................................................................................95
xiv
Figure 20. 3D renders showing activations (red) and deactivations (green) for NF
group during last training run for uncorrected p = 0.001 and cluster size > 10
voxels. .....................................................................................................................................................96
Figure 21. Axial slices showing activations (red) and deactivations (blue) for NF
group during first training run for uncorrected p = 0.001 and cluster size > 10
voxels. .....................................................................................................................................................96
Figure 22. 3D renders showing activations (red) and deactivations (green) for NF
group during first training run for uncorrected p = 0.001 and cluster size > 10
voxels. .....................................................................................................................................................97
Figure 23. Axial slices showing a paired t-test contrast map for NF group between
last minus first training runs for uncorrected p = 0.005 and cluster size > 10 voxels.
Contrasts last > first are represented in red and contrasts first > last are
represented in blue. ..........................................................................................................................98
Figure 24. 3D renders showing a paired t-test contrast map for NF group between
last minus first training runs for uncorrected p = 0.005 and cluster size > 10 voxels.
Contrasts last > first are represented in red and contrasts first > last are
represented in green. .......................................................................................................................98
Figure 25. Axial slices showing activations (red) and deactivations (blue) for NF
group during last transfer run for uncorrected p = 0.001 and cluster size > 10
voxels. .....................................................................................................................................................99
Figure 26. 3D renders showing activations (red) and deactivations (green) for NF
group during last transfer run for uncorrected p = 0.001 and cluster size > 10
voxels. .................................................................................................................................................. 100
Figure 27. Axial slices showing activations (red) and deactivations (blue) for NF
group during first transfer run for uncorrected p = 0.001 and cluster size > 10
voxels. .................................................................................................................................................. 100

xv
Figure 28. 3D renders showing activations (red) and deactivations (green) for NF
group during first transfer run for uncorrected p = 0.001 and cluster size > 10
voxels. .................................................................................................................................................. 101
Figure 29. Axial slices showing a paired t-test contrast map for NF group between
last and first training runs for uncorrected p = 0.005 and cluster size > 10 voxels.
Contrasts last > first are represented in red and contrasts first > last are
represented in blue. ....................................................................................................................... 102
Figure 30. 3D renders showing a paired t-test contrast map for NF group between
last and first training runs for uncorrected p = 0.005 and cluster size > 10 voxels.
Contrasts last > first are represented in red and contrasts first > last are
represented in green. .................................................................................................................... 102
Figure 31. Average Pearson correlation between SAN and DMN as a whole for pre-
training (blue), post-training (red), and follow-up (yellow) resting-state
acquisitions. Anti-correlations between the networks as a whole did not change
with training. .................................................................................................................................... 103
Figure 32. Glass brain view showing seed-to-voxel functional connectivity changes
regarding the provided ROIs as seeds. The contrast reported here is for resting-
state images acquired in the fourth day of experiment (after training) minus the
ones acquired in the first day of experiment (before training). Red clusters
represent higher connectivity and blue clusters represent lower connectivity. P-
unc represents uncorrected p-values and k min represents the minimum number
of voxels functionally connected to a given seed. .............................................................. 104
Figure 33. Z-scores of combined measures for applications before (blue) and after
(orange) neurofeedback training, and follow-up (gray). These values are shown for
the whole NF group (above) as well as for the best learners group (below – seven
subjects). Asterisks show significant increases for either post-training or follow-up
applications according to one-tailed paired t-tests corrected by FDR considering all
measures. Error bars represent standard errors of mean. ............................................ 106
Figure 34. Experimental design – Experiment II. A three-day neurofeedback
training (blue) was performed, together with evaluations of attention abilities

xvi
before and after training (red). The intervals between experiment days were one
week, but the interval between last training day and last attention assessment was
one day. Anatomical and functional images were acquired from the participants in
the first day of experiment (green). ........................................................................................ 129
Figure 35. Axial slices showing selected SAN (blue) and DMN (red) ROIs for
Experiment II (above). Table shows centers-of-mass MNI xyz coordinates for SAN
ROIs together with their AAL labels (below); DMN ROIs were individualized to
each participant. .............................................................................................................................. 131
Figure 36. Neurofeedback training design for Experiment II. Up- and down-
regulation blocks were interleaved, consisted by static elements (up and down
arrows, respectively, a central fixation point, maximum level) as well as a bar
updated every repetition time. The first block was for baseline measurements and
consisted only by static elements. Up-regulation blocks screens were colored while
down-regulation and baseline blocks screens were black and gray. Up-regulation
and baseline blocks lasted 60 s and down-regulation blocks lasted 30 s. ................ 133
Figure 37. Performance betas regarding the differential signal SAN minus DMN
(above), average SAN (below, left), and average DMN (below, right) for last
training runs and last transfer runs. Asterisks indicates performance betas
different of zero. .............................................................................................................................. 138
Figure 38. Performance betas for differential NF across runs (left) and transfer
runs (right) for online analysis (Experiment II). The asterisk shows a significant
difference across days................................................................................................................... 138
Figure 39. Performance betas over training runs regarding the differential signal
SAN minus DMN for a separation between learners (red line) and non-learners
(green line). ....................................................................................................................................... 139
Figure 40. Graph showing the relationship between slope of learning curve and
index of networks overlapping of masks provided and mask that should be ideally
provided (above). The correlation slope of learning curve and index of overlapping
is significant for SAN (blue), but not for DMN (red). Regarding individual ROIs in

xvii
these networks, the table shows in which each regions the average overlapping
was higher for learners (purple). ............................................................................................. 140
Figure 41. Average of Pearson correlations across subjects between self-report
scores (control, difficulty, and concentration) and estimated betas of performance
for Experiment II. ............................................................................................................................ 142
Figure 42. Functional connectivity differences between learners and non-learners
for resting-state acquisitions after neurofeedback training (left). Red/blue lines
represent more positive/negative connections for learners vs non-learners,
respectively; line thickness is proportional to the strength of the difference. Also,
the average anticorrelation between SAN and DMN as a whole for learners and
non-learners after training is also reported (right). ......................................................... 143
Figure 43. (A) Personode toolbox interface. Diverse aspects of the toolbox usage
can be altered through a GUI, as the input files, whether group file will be specified
or not, which templates will be classified, option for automatic coregistration of
ICA components to MNI space, additional information about ROI definition, and
masks files to be with nodes labeled as an individual nodes or as whole network.
(B) Classification step. Ordered by the most probable associations in terms of
spatial correlation to the templates, the three most probable ICA components are
shown to be chosen by the user at a time as the correct RSN, together with a value
of probability related to it. Currently, up to 21 different RSN can be classified by
the toolbox. (C) Personalized ROI definition. Nifti mask files are created with the
spherical ROIs, together with a text file containing information about the z-peak
value where the ROI is centered, “real-world” and MNI coordinates, and RSN
names. ................................................................................................................................................. 152
Figure 44. Flowchart of Personode processing, including the selection of input files,
classification of components, definition of ROIs, and generating the output.......... 153
Figure 45. Personode improves activation results. Compared to single study and
meta-analytic based ROI definitions, Personode’s group ICA and individual ICA
based ROI definitions reveals significantly higher activations. Asterisks denote

xviii
significant differences (FDR-corrected). L – Left, R – Right, Post Cing – Posterior
Cingulate, Med PreFront – Medial Prefrontal, Mid Temp – Middle Temporal. ....... 163
Figure 46. For an activation study, Personode provided better results through
spherical ROIs compared to irregular ROIs in most of cases. Asterisks denote
significant differences (FDR-corrected) spherical minus irregular Personode’s
definition. L – Left, R – Right, Post Cing – Posterior Cingulate, Med PreFront –
Medial Prefrontal, Mid Temp – Middle Temporal. ............................................................. 164
Figure 47. Standard deviations (in millimeters) of nodes’ centers-of-mass locations
according to Personode-defined spherical ROIs. PCC – Posterior Cingulate Cortex,
mPFC – Medial Prefrontal Cortex, Angular L – Left Angular Gyrus, Angular R –
Right Angular Gyrus, Temporal Mid L – Left Middle Temporal Gyrus, Temporal Mid
R – Right Middle Temporal Gyrus, Cer Tonsil R – Right Cerebellar Tonsil. ............. 165
Figure 48. Personode improves functional connectivity results, in terms of positive
correlations and anticorrelations, in most of cases. Compared to CONN cluster
definition, Personode’s individual ICA based ROI definitions reveals significantly
more connectivity changes in the expected direction. DMN – Default Mode
Network, Post. – Posterior, LFPN – Left Frontoparietal Network, RFPN – Right
Frontoparietal Network, d/p – Dorsal/Posterior, Exec Ctrl – Executive Control. . 166
Figure 49. Personode improves functional connectivity results for individual
definition in most of cases. Compared to group definition, Personode’s individual
ICA based ROI definitions reveals significantly more connectivity changes in the
expected direction. DMN – Default Mode Network, Post. – Posterior, LFPN – Left
Frontoparietal Network, RFPN – Right Frontoparietal Network, d/p –
Dorsal/Posterior, Exec Ctrl – Executive Control. ............................................................... 167
Figure 50. Association matrices from ROIs defined from CONN (left) and
Personode (right). Personode clearly improves functional connectivity results, in
terms of positive correlations and anticorrelations, for default mode, dorsal
attention, left and right frontoparietal networks. DMN – Default Mode Network, Att
– Dorsal Attention Network, LFPN – Left Frontoparietal Network, RFPN – Right
Frontoparietal Network, Sal – Salience Network, Exec – Executive Control. .......... 168

xix
Figure S1. Original scores differences extracted from CPT for NF and TR groups.
Asterisk indicates a significant difference for uncorrected p-values. ........................ 188
Figure S2. Original scores differences extracted from Switcher Test for NF and TR
groups. ................................................................................................................................................ 189
Figure S3. Original scores differences extracted from PVT for NF and TR groups.
Asterisk indicates a significant difference for uncorrected p-values. ........................ 190
Figure S4. Original scores differences extracted from Mental Rotation Test for NF
and TR groups. Single asterisks indicate a significant difference for uncorrected p-
values while the double asterisk indicates a significant difference for FDR-
corrected p-values for measures computed for all tests. ................................................ 191
Figure S5. Original scores differences extracted from ANT for NF and TR groups.
................................................................................................................................................................ 192
Figure S6. Attention tests results for Experiment II. Blue bars represent values for
attention scores before neurofeedback training and orange bars represent values
for attention scores after neurofeedback training. Asterisks indicate significant
differences for two-tailed paired t-tests for uncorrected p-values < 0.05. .............. 193
xx
List of Tables
Table 1. Associations of brain regions and attention tests selected for the study. “X”
shows when an association would be expected and “O” when no association would
be expected. The combination “X/O” denotes controversial association. ...................80
Table 2. P-values of paired t-tests for combined measures differences from
attention tests for NF and TR groups and for sub-groups of NF group (7 best
learners and 7 sub-learners). Single-asterisks indicate significant differences for
FDR-corrected p-values considering all tests regarding NF and TR group and
double-asterisks indicate significant differences for FDR-corrected p-values
considering all tests regarding both sub-groups. CPT – Continuous Performance
Task, Switcher – Task-Switching Performance, PVT – Psychomotor Vigilance Test,
Rotation – Mental Rotation, and ANT – Attentional Network Test. ...............................90
Table 3. Pearson correlation values and uncorrected p-values for associations
between differences of DSSQ (Dundee Stress State Questionnaire) scores of
interest (follow-up minus Day1 and Day4 minus Day1) and slope of neurofeedback
learning curve. Day1 means pre-training and Day4 means post-training
applications. .........................................................................................................................................92
Table 4. P-values for comparisons between combined measures differences for
follow-up and before training attention tests applications and between follow-up
and after training attention tests applications for NF group and learners. Asterisk
indicates a significant difference for FDR-corrected p-values considering all tests
regarding NF group. ....................................................................................................................... 107
Table 5. RSN templates available in Personode to be identified. Also shown the
UKBiobank templates indices, the z-score cut-off for clusters creation (see Methods
– Personode procedure) and clusters’ center-of-mass coordinates and
correspondent AAL labels. Inf – Inferior, Sup – Superior, L – Left, R – Right, Mid –

xxi
Middle, Oper – Operculum, Post – Posterior, Ant – Anterior, Tri – Pars Triangularis,
Supp – Supplementary. ................................................................................................................. 157
Table 6. Coordinates of DMN nodes from single-study (FOX et al., 2005) and meta-
analysis (SCHILBACH et al., 2012) definitions to be compared with Personode
definition in a task-related ROI-activation study. .............................................................. 161
Table 7. Intra-network changes for each classified network comparing
individualized to a group ROI definition. .............................................................................. 168
Table 8. Other inter-networks positive interactions defined by individual ROIs
using Personode. Asterisks denote mean correlations significantly higher than
zero, as it was expected. L – Left, R – Right, DMN – Default Mode Network. ........... 169

xxii
List of Abbreviations
AAL – Automated Anatomic Labeling
ACC – Anterior Cingulate Cortex
ADHD – Attention Deficit Hyperactivity Disorder
ANT – Attentional Network Test
AR – Autoregressive Model
BCI – Brain-Computer Interface
BOLD – Blood Oxygenation Level Dependent
BPQ – Body Perception Questionnaire
BRUMS – Brunel Mood Scale
CFQ – Cognitive Failure Questionnaire
CHF – Swiss Francs
CPT – Continuous Performance Task
CSF – Cerebrospinal Fluid
DMN – Default Mode Network
DRIN – Direct Reconstructor Interface
DSSQ – Dundee Stress State Questionnaire
EEG – Electroencephalography
EPI – Echo Planar Imaging
FDR – False Discovery Rate
fMRI – functional Magnetic Resonance Imaging
xxiii
FOV – Field of View
FWHM - Full-Width at Half-Maximum
GLM – General Linear Model
ICA – Independent Component Analysis
IFJ – Inferior Frontal Junction
IPS – Intraparietal Sulcus
mACC – medial Anterior Cingulate Cortex
MAIA – Multidimensional Assessment of Interoceptive Awareness
mLPFC – midlateral Prefrontal Cortex
MNI – Montreal Neurological Institute
mPFC – medial Prefrontal Cortex
MPRAGE – Magnetization Prepared Gradient Echo
MRI – Magnetic Resonance Imaging
MVPA – Multi-Voxel Pattern Analysis
NF – Neurofeedback (group)
NIfTI – Neuroimaging Informatics Technology Initiative
NIRS – Near Infrared Spectroscopy
NKI – Nathan Kline Institute
PCC – Posterior Cingulate Cortex
PEBL – Psychology Experiment Building Language
PVT – Psychomotor Vigilance Task
ROI – Region of Interest
RSN – Resting-State Networks

xxiv
SAN – Sustained Attention Network
SMA – Supplementary Motor Area
SMR – Sensorimotor Rhythm
SVM – Support Vector Machine
TPJ – Temporoparietal Junction
TR – Test-Retest (group)
TR/TE – Repetition Time/ Echo Time
xxv
Summary
1. Introduction ....................................................................................................................................29
1.1 Attention ..............................................................................................................................29
1.2 Sustained attention and neural basis .......................................................................31
1.2.1 Functional magnetic resonance imaging and functional connectivity32
1.2.2 “Task-positive” network .......................................................................................34
1.2.3 “Task-negative” network ......................................................................................35
1.2.4 Competitive behavior between attention-related and default mode
networks.......................................................................................................................................37
1.3 fMRI-Neurofeedback .......................................................................................................39
1.3.1 fMRI-Neurofeedback - an overview .................................................................39
1.3.2 fMRI-Neurofeedback - signal acquisition .......................................................41
1.3.3 fMRI-Neurofeedback - signal processing .......................................................43
1.3.4 fMRI-Neurofeedback - feedback presentation .............................................44
1.3.5 fMRI-Neurofeedback - participants ..................................................................46
1.3.6 fMRI-Neurofeedback - learning .........................................................................48
1.4 Attention enhancement .................................................................................................50
2 Hypotheses and objectives ....................................................................................................55
2.1 Hypothesis ..........................................................................................................................55
2.2 Objectives ............................................................................................................................56
3 Experiment I: fMRI-neurofeedback applied to attention ..........................................58
3.1 Methodology ......................................................................................................................58
xxvi
3.1.1 Participants ................................................................................................................58
3.1.2 MRI acquisition ........................................................................................................59
3.1.3 Experimental design...............................................................................................61
3.1.4 Real-time fMRI system ..........................................................................................62
3.1.5 ROI definitions ..........................................................................................................64
3.1.6 Neurofeedback training and transfer runs ....................................................67
3.1.7 Feedback calculation ..............................................................................................70
3.1.8 Self-report and subjective ratings .....................................................................74
3.1.9 Behavioral tests ........................................................................................................75
3.1.10 Offline analysis .........................................................................................................82
3.2 Results ..................................................................................................................................83
3.2.1 ROI activation analysis ..........................................................................................83
3.2.2 Behavioral effects ....................................................................................................89
3.2.3 Strategies and questionnaires ............................................................................91
3.2.4 Linking behavior and brain changes ................................................................94
3.2.5 Whole brain activity ...............................................................................................95
3.2.6 Functional connectivity changes .................................................................... 103
3.2.7 Follow-up ................................................................................................................. 104
3.3 Discussion ........................................................................................................................ 107
3.3.1 Neurofeedback Training .................................................................................... 107
3.3.2 Behavioral effects ................................................................................................. 113
3.3.3 Connectivity results ............................................................................................. 117
3.3.4 Follow-up ................................................................................................................. 119
3.3.5 Real-time fMRI-based neurofeedback .......................................................... 121
3.3.6 Experimental design and limitations ............................................................ 123
4 Experiment II: fMRI-neurofeedback and ROIs positioning influence ................ 127
4.1 Methodology ................................................................................................................... 128

xxvii
4.1.1 Participants ............................................................................................................. 128
4.1.2 MRI acquisition ..................................................................................................... 128
4.1.3 Experimental design............................................................................................ 129
4.1.4 Real-time fMRI system ....................................................................................... 130
4.1.5 ROI definitions ....................................................................................................... 131
4.1.6 Neurofeedback training and transfer runs ................................................. 133
4.1.7 Feedback calculation ........................................................................................... 135
4.1.8 Self-report and subjective ratings .................................................................. 136
4.1.9 Behavioral tests ..................................................................................................... 136
4.1.10 Offline analysis ...................................................................................................... 137
4.2 Results ............................................................................................................................... 137
4.2.1 ROI activation analysis ....................................................................................... 137
4.2.2 Behavioral effects ................................................................................................. 141
4.2.3 Strategies and questionnaires ......................................................................... 141
4.2.4 Functional connectivity analysis .................................................................... 143
4.3 Discussion ........................................................................................................................ 144
4.3.1 Neurofeedback training ..................................................................................... 144
4.3.2 Behavioral effects ................................................................................................. 146
4.3.3 Connectivity results ............................................................................................. 147
4.3.4 Experimental design............................................................................................ 147
5 Personode: a new toolbox for ICA component classification and individualized
ROI definition ................................................................................................................................... 149
5.1 Introduction .................................................................................................................... 149
5.2 Methods ............................................................................................................................ 151
5.2.1 Personode procedure ......................................................................................... 151
5.2.2 Personode applications ...................................................................................... 159
5.3 Results ............................................................................................................................... 163

xxviii
5.3.1 DMN activation study ......................................................................................... 163
5.3.2 Resting State Correlation Analysis ................................................................ 165
5.4 Discussion ........................................................................................................................ 169
6 General conclusions .............................................................................................................. 176

29
1. INTRODUCTION
1.1 ATTENTION
Attention is the cognitive process that the brain uses to select which aspect of
information is important enough to be focused to while ignoring other perceivable
stimuli. However, as the other side of the same coin, distractibility comes together,
constantly driving the attention away, a fluid and dynamic process that falls into one
on another side depending on the situation or demand.
General theories of attention assume two systems converging on a common neural
architecture (CORBETTA; SHULMAN, 2002). One of them is unconscious and covert,
the so-called bottom-up attention (also called stimulus-driven or exogenous); while we
are awake, it is always on and it is a fast system, which makes us to attend to some
stimuli orienting our focus, like motion, sudden loud noise or sensations of touch,
whether we want or not. The other one is a conscious and overt system, the so-called
top-down attention (also called goal-driven, endogenous or attentional control); it
supports a complex process that orients our focus to a task that needs to be made and
it remains, fortunately, until the job is done. The latter system is essential for
performing tasks that require concentration, but it is also prone to distractions.
Besides of getting distracted by the bottom-up system, the top-down attentional
system can be also affected by mind-wandering, which is defined as “thinking about

30
something other than what one is currently intending to think about, or thoughts
without a clearly identified proximate intention which initiated the thoughts” (SOOD;
JONES, 2013). Mind-wandering thoughts are in past and future domains, a process that
is usually unfocused and random (SOOD; JONES, 2013). Although at times useful,
mind-wandering can lead to performance detriment and they are more frequent the
more habituated subjects are to a task (MASON et al., 2007), generating lapses of
attention. Any individual is subject to these failures in controlling attention many times
a day. Most of time, attentional lapses lead to innocuous consequences, like forgetting
what it was about to say, what to do next, or responding more slowly to a stimulus.
However, they may also cause learning difficulties and financial losses, and even tragic
consequences in terms of human lives, such as work-related or traffic accidents
(ROBERTSON, 2003). Moreover, an excessive wandering mind is less happy and
predisposed to psychopathologies (KILLINGSWORTH; GILBERT, 2010).
Constantly presented with a big load of information, attention only selects one input at
a moment, which is usually the most salient one, and threat, pleasure, challenge, and
novelty are the entities with greater salience (ROBERTSON, 2003; SOOD; JONES, 2013).
Threat focus is evolutionary preserved because of its obvious survival value, but
threats in the daily routine nowadays, when living in a safe environment, are
represented by worries, emotional hurts, regrets, and fears (SOOD; JONES, 2013).
Although the term attention is employed as a unitary term in a spectrum of daily-life
situations, the simplicity is just terminological. Attention is an ability which is related to
multiple cognitive processes, encompassing several important cognitive functions, but
having as essence the selective focus (SOOD; JONES, 2013). As different features of
attention, we can number the selective attention – defined as the ability to respond to
specific stimuli –, the sustained attention – as known as vigilance, it is the ability to
keep the concentration for long periods of time for detecting the appearance of a
target –, and the switching attention – which is the ability to shift the focus among
tasks, orienting it to a giving task, while ignoring others (ROBERTSON, 2003).
Switching attention ability, for instance, involves multitasking and it has specific
implications over modern daily-life, because nowadays, with the appearance of social
media, marketing flooding, and the necessity of executing multiple tasks, the number

31
of possible distractors has greatly increased. Consequently, the limited attentional
human system has been more and more tested, and failures are much more
susceptible. For instance, when drivers simultaneously are engaged in other tasks, like
talking by the phone or texting, they are prone to make more mistakes. Also, especially
speaking about vigilance, decrements in performance are seen over time and due to
habituation, leading to the emergence of task-unrelated thoughts. Interestingly, the
less challenging the task, the more probable to happen (LANGNER; EICKHOFF, 2013),
which, at a first sight, seems paradoxical. For example, radar screen monitoring would
be more challenging than prolonged computer gaming.
Lacking the ability to sustain attention for a period can cause decreased behavioral
performance and is a common symptom of neurological as well as psychiatric
disorders. Maybe the most well-known disorder associated with this impairment is the
attention deficit hyperactivity disorder (ADHD), which have specific problems with
sustained attention, but show normal performance on selective attention tests
(ROBERTSON, 2003). Other conditions also show decrements in this ability, such as
anxiety disorders, schizophrenia, Alzheimer and Parkinson diseases, as well as patients
with brain damage or in a coma.
1.2 SUSTAINED ATTENTION AND NEURAL BASIS
In order to understand how attention is translated in the brain and the underpinnings
of this broad function in terms of supporting regions, networks and interactions, it is
common to take advantage of neuroimaging methods, such as functional magnetic
resonance imaging (fMRI) and approaches based on it. In this chapter, neuroimaging
findings will be discussed along the lines of functional relevance to attention.
32
1.2.1 Functional magnetic resonance imaging and functional connectivity
Magnetic Resonance Imaging (MRI) is a powerful technique that allows to produce
medical images with different sets of contrasts among soft tissues in the body,
depending on the setup parameters. The Magnetic Resonance Imaging (MRI) scanner
makes it possible by providing a strong magnetic field, which aligns the nuclear spins of
the sample. Moreover, magnetic field gradients are applied during a MRI experiment
for signal spatial decoding. MRI presents major advantages, such as high spatial
resolution, non-invasiveness, and exploration of different contrasts generation
between tissues depending on the acquisition parameters.
MRI is useful for, besides of excellent visualization of anatomical structures, also
providing information about physiological processes. A notable application is the so-
called functional MRI, which is based on the Blood Oxygenation Level Dependent
(BOLD) effect and indirectly describes the brain activity through the neurovascular
coupling.
MRI is based on the nuclear magnetic resonance phenomenon for nuclei with spins
different of zero. Hydrogen nucleus is the most abundant in the human body, hence it
is the usual candidate for this measurement. Hydrogen nuclei or proton spins are like
tiny rotating magnets around the direction of the main applied magnetic field and
their precession frequency is proportional to the magnitude of the magnetic field.
Their slight excess of parallel spins produces a not null longitudinal magnetization in
the sample while the main magnetic field is applied.
When a radiofrequency electromagnetic pulse with the same frequency is applied to
excite the nuclei, a transversal component of the magnetization also emerges.
Temporal variation of this component can be then detected by a reception coil,
inducing the MRI signal. After the pulse, the spin system returns to the equilibrium by
two main relaxation mechanisms: the longitudinal relaxation, characterized by the T1
value, and the transverse relaxation, characterized by the time constant T2. The
measured signal is actually dependent on T2*, a combination of the intrinsic T2 and
the effect of the local magnetic field inhomogeneities.
33
Physiologically speaking, the neuronal metabolism is dependent of the oxygen supply
in the blood, because the energy production from glucose is mainly due to the aerobic
metabolism. Neuronal activity provokes an increase in the oxygen consumption and an
even higher increase in the local blood flow. Since the increase in the blood flow
exceeds the oxygen consumption rate, neuronal activity produces an increase in the
oxyhemoglobin/deoxyhemoglobin ratio in activated zones.
Deoxyhemoglobin has unpaired electrons, causing the molecule to become strongly
paramagnetic, while oxyhemoglobin does not have unpaired electrons and it is
diamagnetic. Using fast MRI sequences, like echo-planar-imaging (EPI), and specific
imaging parameters, such as repetition time and echo time, activations indirectly
related to brain activity can be measured as an increase in the relative signal, because
the local relaxation T2* in the brain increases when the
oxyhemoglobin/deoxyhemoglobin ratio increases.
The BOLD contrast finally obtained is very poor because of the low signal variation.
Thus, acquisitions need to be repeated in time and at least a pair of tasks must be
employed, in order to statistically compare the signal variations measured in each
voxel. Differences in activation will thus relate to the difference between two tasks.
Further information about fMRI Physics and the physiological principles, can be found
in several books (BUXTON, 2002; HUETTEL; SONG; MCCARTHY, 2009; TOFTS, 2005).
Not only the brain activity can be studied through the BOLD signal, but also the degree
of functional connectivity among regions, which is defined as the synchronous
fluctuation of BOLD signal from different brain regions (BISWAL et al., 1995; VAN DEN
HEUVEL; POL, 2010). The degree of connectivity can be evaluated considering the
average of signal within a circumscribed region or in the level of the voxel. Consistent
spatial patterns are found across individuals during rest and bring information about
the functioning and communication among multiple brain regions (BECKMANN et al.,
2005; DAMOISEAUX et al., 2006; SHEN; WRITER, 2015), constituting canonical resting-
state networks (RSN). This approach illustrates the brain as an interconnected and
interactive network, rather than made of regions that work separately. It offers the

34
outstanding advantage of being usually evaluated during rest, which simplifies
experimental planning.
Functional connectivity has been densely studied in healthy subjects, to reveal
associations with individual differences (FINN et al., 2015; PAMPLONA et al., 2015;
SONG et al., 2008), normal aging (ANDREWS-HANNA et al., 2007; VIEIRA, 2018), as well
as in the understanding of diseases, such as Alzheimer’s disorder, schizophrenia, using
functional correlations as biomarkers of the brain system integrity (VAN DEN HEUVEL;
POL, 2010).
1.2.2 “Task-positive” network
Introduced first by Fox and colleagues, the task-positive network, a specific set of
regions encompassing frontal and parietal regions, is related to focused and selective
attention (FOX et al., 2005). However, this network could be dissociated in at least two
networks, which can be co-active, but not necessarily always: the frontoparietal
control network, which comprises dorsolateral, prefrontal, insula and supplementary
motor area (SMA), involved in cognitive control operations; and the dorsal attention
network, which comprises the frontal eye field and the intraparietal sulcus and it is
involved in active directed attention (FOX et al., 2005; KELLY et al., 2008; SPRENG,
2012). This network responds positively to a given attentional task; in other words, the
BOLD signal gets higher than a previously established baseline.
Because the plural concept of attention is better expressed with respect to multiple
anatomical regions and their interactions among each other, both BOLD-signal activity
and functional connectivity are useful to understand the neural basis of this function.
Each one of these brain regions is responsible by a particular attentional aspect and
they work jointly to this function composition (LANGNER; EICKHOFF, 2013). A network-
based approach is therefore particularly more relevant for this mental function than
considering isolated regions.

35
The attention top-down system includes parts of the intraparietal cortex and the
superior frontal cortex, while the attention bottom-up system is comprised by the
temporoparietal cortex and the inferior frontal cortex (CORBETTA; SHULMAN, 2002).
When it comes to the sustained attention, some authors agreed to say that it is
actually a combination of both top-down and bottom-up processes and provided data
supporting a network (the sustained attention network – SAN) located in the right
frontal and parietal cortices working in conjunction to primitive mid-brain arousal
systems, more specifically consisted by dorsomedial areas, medial and ventrolateral
prefrontal cortex, anterior and parietal insula, as well as cerebellar vermis, thalamus,
putamen, and midbrain (LANGNER; EICKHOFF, 2013; ROBERTSON, 2003). They
conjectured that, rather than depicting a unitary function, this network could
contextualize a mixture of task-related processes constantly redirecting attention to a
goal and recurrent processes underlying task-set maintenance (LANGNER; EICKHOFF,
2013). Specific roles assigned to single regions of attention network will be described
in sections 3.1.5 and 4.1.5.
1.2.3 “Task-negative” network
In contrast, the default mode network (DMN) was first identified as presenting task-
induced deactivations (RAICHLE et al., 2001) and coincides with the definition of the
task-negative network by FOX et al. (2005). This terminology in fact fortified the DMN
as an always deactivated network by goal-directed cognition tasks (SPRENG, 2012),
independent on the nature. Nevertheless, far from being passive or deactivated all the
time, the DMN is involved in internally focused cognitive processes – or not related to
external task demands. DMN has been implicated to internal self-referential processes
(GUSNARD et al., 2001), such as mental rumination, episodic (GREICIUS et al., 2003),
and prospective memory, as well as to introspection (SCHILBACH et al., 2012) and
mind-wandering (MASON et al., 2007). Many of these processes can bring cognitive
benefits in daily life, such as creativity, self-placement in time comparing to past and
future, and prospective planning, but it was also associated to worsened memory
36
(DASELAAR; PRINCE; CABEZA, 2004), task habituation (MASON et al., 2007), and
degraded vigilance (HINDS et al., 2013). Interestingly, the more demanding the task,
the more pronounced this dichotomy is observed (FOX et al., 2005; KELLY et al., 2008),
evidencing a neural basis for the obviously noticeable competition between the
focused attention and the manifestation of stimulus-independent thoughts. Due to the
introspective nature of this mental processes, DMN tends to be more active during
resting than during task performance (RAICHLE et al., 2001).
DMN recruitment is associated to stimulus-independent thoughts (MASON et al.,
2007), in which the mind easily and frequently wanders from one thought to the next,
a fluid process. Indeed, this day-dreaming happens also when people get habituated to
a task: the incidence of wandering thoughts increases as they get proficiency in the
task. Many theories were conceived to explain the functional significance of this
phenomenon, such as maintaining a stand-by arousal level to facilitate the execution
of an upcoming task; a sense to locate the self in time, making past and future to be
coherent according to the present experience (GREICIUS et al., 2003); an evolved
ability of splitting attention and manage multiple tasks (MASON et al., 2007).
Therefore, while one network is related to a state of higher focus to present events,
the other one has the antagonist behavior of driving to thoughts unrelated to an
external task, constituting a competitive behavior in terms of attention. Fox and
colleagues’ study showed anti-correlations between attention-related and default-
mode regions, a result detectable even with no task. The authors then stated that the
brain works in two processing modes: a "default mode" and a "task mode" (FOX et al.,
2005).
Weissman and colleagues showed that fast performance on a visual letter-based task
was associated to prior reduction in the DMN signal and increase in the task positive
network signal (WEISSMAN et al., 2006), which overlaps with SAN. Momentary
attention lapses are associated to reduced activation in attention-related regions,
together with reduced deactivation in DMN (WEISSMAN et al., 2006). Attentional
lapses start with reduced pre-stimulus activity in anterior cingulate and right
prefrontal regions as well as less deactivation in the DMN, which suggests less
suspension of task-irrelevant mental processes, such as day-dreaming or monitoring
37
the external environment. Also, brief attentional lapses were associated with reduced
stimulus-evoked activity in the visual cortex, probably because of low-quality
perceptual representations of stimuli.
These studies show that a higher sustained attention state happens when there is a
combination of DMN suppression, maybe reflecting an interruption of distraction and
intrusive thoughts, together with the attention-network activation.
1.2.4 Competitive behavior between attention-related and default mode networks
Attention-related and default mode networks are intrinsically anticorrelated and
constantly competing, even when subjects are at rest (FOX et al., 2005; JOSIPOVIC et
al., 2012). When an attention-demanding task is present, they drift away, reflecting
the competition between sustained attention and the interference of task-irrelevant
thoughts, which can be experienced many times a day. Basically, the brain is never at
rest but continuously maintain network activity (SOOD; JONES, 2013). The competition
happens probably mediated by the frontoparietal control network, which may be
explained in terms of exogenous versus endogenous loci of information processing
(SPRENG, 2012).
As an evidence of anticorrelated behavior, Hinds and colleagues identified that faster
reaction times were predicted by activations in the SMA, a region positively related to
attention, and slower reaction times were predicted by activations in the DMN (HINDS
et al., 2013). In the same study, the roles of these brain regions were further
investigated by automatically triggering trials of a vigilance task based on brain states
BOLD signal using real-time fMRI. Reaction times were significantly faster for stimuli
triggered by increased activation in SMA than for the ones triggered by the increased
activation in DMN regions, suggesting that higher concentration is a result of the
interaction between the involved regions rather than modulation in a single brain
region.

38
Lawrence and colleagues identified neural networks supporting sustained attention
through task-induced fMRI-activations and related them to performance in a vigilance
task. Higher performance participants were successful either in activate attention-
related regions, or deactivate DMN regions or both, while lower-performance
participants failed in either activating or deactivating these networks (LAWRENCE et
al., 2003), suggesting that different cognitive strategies can be used to achieve a good
performance. During the CPT execution (further explained in section 3.1.9), Ogg and
colleagues detected an activated network comprised by frontal and parietal regions, as
well as deactivation in regions belonging to DMN (OGG et al., 2008).
The anticorrelation between the default mode and “task positive networks” is linked
to consistent behavioral performance in attentional-demanding tasks, because these
networks are related to opposed processes. The stronger the anticorrelation between
these networks during resting for an individual, the higher would be his performance,
as a predictor of reaction times on a flanker task (KELLY et al., 2008).
Thompson and colleagues also examined the relationship between a psychomotor
vigilance task (PVT – explained in section 3.1.9) and the interaction between default
mode and attention-related networks (THOMPSON et al., 2013). A faster performance
was associated to greater differential signal of attention-related network minus DMN,
as well as higher anticorrelation (even when the time scale of the window for the
computation was short – a bit more of 10 seconds). In addition, they found that the
signal from only one network was not predictive of PVT performance, suggesting that
the difference between networks would explain better the improvement in
performance.
These anticorrelated networks of the brain and their functional role can be also
studied through meditation practices, when related to focused attention aspects. DMN
was found to be relatively deactivated in experienced meditators compared to
controls, related to self-reported less mind-wandering, supporting the hypothesis that
DMN competes with task-specific neural processing, creating attentional lapses and
deficits in performance (BREWER et al., 2011). Besides of the finding that
concentration-based meditation results in activations within attention-related regions
(BREFCZYNSKI-LEWIS et al., 2007), it was reported a higher anticorrelation between

39
attention-related and default mode networks during meditation compared to rest for
experienced Tibetan Buddhist meditators (JOSIPOVIC et al., 2012).
Therefore, there is enough evidence to conjecture that training the simultaneous
control of SAN activation and DMN deactivation could bring some benefits to an
individual’s attention ability. In the next section, we will describe a technique to
implement such idea.
1.3 FMRI-NEUROFEEDBACK
1.3.1 fMRI-Neurofeedback - an overview
Typical fMRI experiments are usually processed and analyzed after the acquisition is
complete. Due to computational advances in fMRI data acquisition, reconstruction,
transferring, and processing, this kind of information can be analyzed now in real-time
(WEISKOPF, 2012). Added to this, interactive experimental paradigms could be
created, expanding fMRI as a tool to study neuroscience. When experimenters manage
to access the resulting signal in real-time and present it back in an accurate way to the
subject in the scanner, it can work as a mirror showing his own brain activity - a
technique called neurofeedback.
Neurofeedback is thus an approach of the type brain-computer interface (BCI) which
consists in measuring the brain signal of a given region and convert it to sensorial
stimuli, which is then presented to the participant in real-time in order to train
voluntary regulation (Figure 1), which could be thus used to induce behavioral changes
(ROTA et al., 2009; RUIZ et al., 2014; SITARAM et al., 2008, 2016).

40
Figure 1. A typical fMRI-neurofeedback loop (adapted from http://neurofeedback-research.org/). The loop is comprised by (1) signal acquisition, (2) online processing, (3) feedback presentation, and (4) participant’s response to the feedback.
Using fMRI-neurofeedback can be also used for neuroscientific studies to investigate
the relationship between brain activity and behavior. Conventional activation studies
treat brain activity as the dependent variable which changes according to a behavioral
task, the independent variable. Neurofeedback, in contrast, can be seen as a method
that investigates the effects of changing the brain activity (independent variable) on
behavioral measures (dependent variable) (SULZER et al., 2013; WEISKOPF, 2012).
Copious neurofeedback studies were conducted based on the specificity between
brain regions and the sought behavioral effect (RUIZ et al., 2014; SULZER et al., 2013).
Among them, we can cite the voluntary regulation of the right inferior frontal gyrus
modulating specific aspects of language processing (ROTA et al., 2009); the increase of
top-down connectivity from the dorsomedial prefrontal cortex onto the amygdala
modulating emotion (KOUSH et al., 2015); the regulation training of anterior insula, a
region involved in emotion (CARIA et al., 2007); the down-regulation of the posterior
cingulate cortex, inversely involved in focused attention (GARRISON et al., 2013); the
voluntary control of early visual cortex activity leading to enhanced visual sensibility
(SCHARNOWSKI et al., 2012); the training of SMA and the parahippocampal cortex

41
activity to improve reaction times and memory, respectively (SCHARNOWSKI et al.,
2015); and the regulation of the orbitofrontal cortex activity leading to control over
anxiety (SCHEINOST et al., 2013a).
Since it was shown to cause several measurable effects on humans, neurofeedback
could be potentially also used as a novel therapeutic tool to treat neurologic and
psychiatric disorders (BIRBAUMER, 2006; DECHARMS et al., 2005; LINDEN et al., 2012;
RUIZ et al., 2014; SITARAM et al., 2008). As an example, neurofeedback was suggested
as a therapeutic method for the improvement of mood of patients with depression
(LINDEN et al., 2012).
A typical fMRI-neurofeedback experimental design usually follows a loop (SITARAM et
al., 2016), comprising (1) signal acquisition by a proper protocol in a MRI scanner, (2)
online processing to remove artifacts and to compute the resulting signal in real-time,
(3) the feedback presentation, and (4) the own participant and its experience and
adaptation to the feedback (Fig. 1).
Beyond the fast signal acquisition, processing, and computation, other specific
strategies for neurofeedback research must also be considered in each step of the
loop. In the next sections, we will expand each one of them.
1.3.2 fMRI-Neurofeedback - signal acquisition
Regarding the signal acquisition, it was explained in section 1.2.1 that, once the
participants are positioned in the MRI scanner, fMRI allows to non-invasively measure
the signal related to brain activity with a very high spatial resolution. Although the
whole signal processing step nowadays only takes a fraction of second, fMRI also
involves the inherent time of repetition and the hemodynamic delay of the peak BOLD
response, so real-time is a relative term. Real-time is here defined as delayed by only a
couple of seconds, thus sometimes also called near-real-time.
42
Alternatively, neurofeedback can be also based on electroencephalography (EEG)
signals. Learned control of brain electric activity using EEG has been studied since the
1960’s through instantaneous feedback not based on the signal from circumscribed
regions, but in terms of spectral power, event-related potentials or slow cortical
potentials (GRUZELIER, 2014). EEG offers a much higher temporal resolution (in the
order of milliseconds) compared to fMRI (in the order of seconds), thus EEG-based
neurofeedback does not show the inherent delay seen in the fMRI-based one, the
feedback is shown almost instantly. On the other hand, fMRI has superior spatial
resolution compared to EEG and it can evaluate deep cortical and subcortical brain
regions, granting fMRI-based neurofeedback higher specificity and precision with
regards to brain region definition, paving the way for novel possibilities. Besides of
that, other types of techniques can be also used, such as Near Infrared Spectroscopy
(NIRS), or a combination of them.
3T MRI scanners seem to be appropriate for the signal acquisition in neurofeedback
studies. A higher magnetization of the sample is observed for higher field strengths,
enabling a better spatial resolution, which could be useful for regulation of small
structures in the brain. However, many structures of interest in the brain are in the
order of millimeters, measurable by 3T MRI scanners, and, as side-effects, there would
be more distortions in the image and concerns with safety because of radiofrequency
deposition for ultra-high field MRI scanners (WEISKOPF et al., 2004).
Physiological data, such as heart rate or breathing rhythm, can be also acquired during
neurofeedback acquisitions. Participants can try to regulate BOLD signal through some
sort of physiological modulation. Changes in respiratory rhythm and volume also
change the carbon dioxide level, a potent vasodilator, in the blood and cause BOLD
fluctuations (BIRN et al., 2009; SITARAM et al., 2008). Therefore, it is a common
practice to acquire physiological data to verify whether there is influence of them
activation patterns in a post hoc analysis.

43
1.3.3 fMRI-Neurofeedback - signal processing
Once the acquired signal is extracted from the regions of interest (ROIs), it must be
transferred as fast as possible to another computer and processed to reduce the
amount of noise. Representing brain activity through a feedback signal instead of
artifact is a primary concern in the field and can contaminate BOLD measurements and
inhibit learning of self-regulation (SULZER et al., 2013). These computations are usually
made through software that enable this kind of online processing, such as the open-
source tools OpenNFT (KOUSH et al., 2017), FRIEND (SATO et al., 2013), and FRIEND
Engine (BASILIO et al., 2015), as well as the commercial tool Turbo BrainVoyager (Brain
Innovation, Maastricht, The Netherlands).
The ROIs definition is an important step in neurofeedback studies. ROIs can be defined
via functional localizers based on a region-related task (HARMELECH; FRIEDMAN;
MALACH, 2015; LINDEN et al., 2012; ROTA et al., 2009; SCHARNOWSKI et al., 2012,
2015; SCHEINOST et al., 2013b; SITARAM et al., 2008; SULZER et al., 2013), on
coordinates from the literature (GARRISON et al., 2013), from meta-analysis study
(MEGUMI et al., 2015), manual demarcation based on the anatomical image (CARIA et
al., 2007), averaging the whole cluster signal (MARXEN et al., 2016) or considering only
the most active voxels (KOUSH et al., 2015). Each method shows advantages over
others. Some of them will be treated along this thesis.
There are even more complex fMRI-based neurofeedback techniques than the ones
based on the immediate measurement of the brain activation. One of them is the one
based on Multi-Voxel Pattern Analysis (MVPA), based on support vector machine
(SVM) classifiers, which detects patterns of voxel activity in circumscribed regions and
it is more sensitive to the detection of distributed brain patterns and maximizes the
ability of predicting unobserved data (SATO et al., 2013; SITARAM et al., 2016). The
SVM algorithm outlines a hyperplane to discriminate between two classes and, once
the model is determined from the training images, independent outcomes are
classified into a specific label (SITARAM et al., 2008; YAMADA et al., 2017). In an
intriguing study, for instance, Shibata and colleagues were able to incept the

44
perceptual orientation abilities into a group of subjects just by training the primary
visual cortex activity patterns previously observed for particular orientations through
neurofeedback based on MVPA (SHIBATA et al., 2011). Promising results have been
also found using closed-loop approaches (DEBETTENCOURT et al., 2015), when the
task stimuli perturb brain states.
It was also shown that participants can also learn to change brain networks using
effective-connectivity-based neurofeedback in a dynamic causal modelling (KOUSH et
al., 2015), applied to emotion regulation: during training, participants learned to
voluntarily increase top-down effective connectivity from the dorsomedial prefrontal
cortex, which is involved in cognitive control, onto the bilateral amygdala. Moreover,
techniques based on the modulation of functional connectivity can be also used for
neurofeedback studies (RUIZ et al., 2014; SATO et al., 2013), by computing the
common variance over relatively short albeit sufficient sliding windows of current and
past time points in the level of two or more brain regions (MEGUMI et al., 2015; RUIZ
et al., 2014; ZILVERSTAND et al., 2014), indicating that neurofeedback training can lead
to strengthening or suppression of connections (WEISKOPF, 2012).
Advanced techniques to remove cardiac and respiration influence from fMRI data have
been tested in real time using a high-performance processing computer (MISAKI et al.,
2015), which could be used for neurofeedback experiments; however, to the best of
our knowledge, it has not been used to the moment.
1.3.4 fMRI-Neurofeedback - feedback presentation
After the processing step, signal must be compared to the baseline and the signal
change is computed. Then the signal is converted to an easy, didactic feedback which
participants can understand intuitively.
Presented feedback can be of many types, such as auditory (HARMELECH; FRIEDMAN;
MALACH, 2015), verbal, or tactile (RUIZ et al., 2014), but the most frequently used is
the visual feedback (CARIA et al., 2007; GARRISON et al., 2013; KOUSH et al., 2015;

45
LINDEN et al., 2012; ROTA et al., 2009; SCHARNOWSKI et al., 2012, 2015; SHIBATA et
al., 2011; ZHANG et al., 2013), with a variety of visualization methods, such as
thermometers, intermittent numbers (MEGUMI et al., 2015), scrolling curves
(SCHARNOWSKI et al., 2015; SCHEINOST et al., 2013b), functional maps, or even virtual
reality (SITARAM et al., 2008; SULZER et al., 2013). Feedback can also be shown as
stimuli or elements of a task that perturb brain activity (DEBETTENCOURT et al., 2015).
Continuous feedback, used in many neurofeedback studies, consists of constantly
feedback updated after every acquired volume. This kind of feedback seems to offer
some advantages, such as many opportunities to correct mental strategies or thoughts
according to what is received as feedback and supposed higher engagement or
interest in the experiment. Moreover, subjects also usually report preferring
continuous feedback because they have a better sense of how good they are
controlling during the training (MARXEN et al., 2016). When continuous feedback is
used, participants are usually also informed that the feedback signal changing is
delayed in 2-6 seconds, likely to impair the regulation capability (SULZER et al., 2013),
but it is expected that participants get used to it over training.
However, there is enough evidence showing that intermittent feedback – in other
words, feedback that is shown at the end of task block during few seconds – might be
more efficient than continuous feedback (JOHNSON et al., 2012; KOUSH et al., 2015;
MARXEN et al., 2016). Due to a delayed hemodynamic response, it must be harder for
subjects to connect what is experienced as feedback with thoughts that happened
some seconds ago for appraisal and interpretation of feedback may be erroneous.
Moreover, fMRI noise produces inherently floating signal, harder to domain, while
intermittent feedback averages the signal over the block producing a more reliable
signal and it does not consider the hemodynamic delay. More importantly, during
continuous feedback subjects have to deal simultaneously with task and appraisal,
which can potentially spoil performance. This is also called dual-task interference and
this confusion can be avoided by using intermittent feedback, in which task and
appraisal are separated in time.
In the early stages of development of the field, fMRI-neurofeedback studies used real-
time fMRI to train individuals to regulate single brain regions related to functions as

46
movement, cognition, perception, and emotion, depending logically on the desired
behavioral effect. However, complex cognitive processes are not considered to be
limited to the activation of a single brain ROI, but brain functions are sometimes
represented by coordinated activity of spatially distributed regions, what is exactly the
definition of a brain network (RUIZ et al., 2014). fMRI offers the advantage of
measuring simultaneously the activation of entire networks of the brain. The
possibility of modulating specific spatiotemporal patterns on a network level with
neurofeedback may be, in certain cases, more effective than single region regulation
and preferable compared to anatomically unspecific pharmacological interventions
(SITARAM et al., 2016). A way of regulating multiple brain regions could be using the
differential neurofeedback, which consists in exhibiting the mean BOLD signal
difference from two regions, associated to different functions (ROBINEAU et al., 2014;
SCHARNOWSKI et al., 2015). It also offers the advantage of cancelling unspecific effects
of global activation, for example, due to physiological influence and general effects of
arousal (CARIA et al., 2007; HINDS et al., 2011; SCHARNOWSKI et al., 2015; SITARAM et
al., 2008), because some artifact sources are present throughout the brain.
1.3.5 fMRI-Neurofeedback - participants
Finally closing the loop, participants then try to control feedbacks by using mental
strategies. If the strategy is wrong, feedbacks would be bad, and they have to correct
it. When the feedback is right, learning is reinforced.
Instructing participants to use certain kind of mental imagery is a common practice,
employed with the aim to facilitate control and improve the efficiency of the learning
process. However, it was suggested that explicit and conscious strategies may not be
necessary and may even hinder efficient learning (SEPULVEDA et al., 2016), supported
by successful self-regulation without instructing mental imagery (LINDEN et al., 2012;
MARXEN et al., 2016; SEPULVEDA et al., 2016; SHIBATA et al., 2011; YAMADA et al.,
2017). Sepulveda and colleagues found that, in a study considering the SMA,
47
contingent feedback without explicit instructions to use specific mental imagery
enables more effective learning (SEPULVEDA et al., 2016), which seems
counterintuitive to other experiments that used instructions (CARIA et al., 2007;
HARMELECH; FRIEDMAN; MALACH, 2015; ROTA et al., 2009; SCHARNOWSKI et al.,
2012, 2015), so more comparison studies involving other brain regions related to
different functions would be necessary to determine the influence of feedback, reward
and instructions in learning brain self-regulation (SITARAM et al., 2016). Therefore,
instructions could be given as a first suggestion to the participants, but they can still
learn how to improve the performance over training.
A monetary reward can also be a feedback for the next training run, and some
neurofeedback studies also offer a monetary reward proportional to their
performance as an incentive (KOUSH et al., 2015; MEGUMI et al., 2015; RUIZ et al.,
2014; SEPULVEDA et al., 2016; SHIBATA et al., 2011; YAMADA et al., 2017). Sepulveda
found that monetary reward induces higher amplitude of self-regulation than when no
reward is provided (SEPULVEDA et al., 2016).
Another element to be considered in neurofeedback studies is that is a longitudinal
study and the “dose” of training days or runs is a parameter to be thought during the
experiment design. However, more studies are necessary to outline optimal
longitudinal parameters for specific types of training.
As any interventional study, control experiments, such as control groups or within-
subjects control conditions are necessary to rule out subjects’ motivation, to ensure
physiological specificity, to account for effects of mere mental strategies, and to
control for placebo effects (SULZER et al., 2013), practice behavioral effects, and other
non-specific effects (arousal, perceptual input, physiological inputs). If results of
performance success are obtained after neurofeedback training but there is no
comparison to a control group, it can be argued that the results are a product of non-
specific influences of training. Placebo effects can be considered common in fMRI-
neurofeedback: subjects are immersed in a cutting-edge technological environment,
omitting critical reasoning and increasing the engagement, thus well-controlled
experiments are essential to clarify whether the intervention is promoting adaptive
brain learning and behavioral effects (THIBAULT; LIFSHITZ; RAZ, 2017).
48
Control groups can be designed in many ways, the selection of control condition(s)
should be addressed depending on the research goals. Usually, participants in control
group receive identical instructions and are not aware of the existence of a control
group or, if they are, they do not know naturally which group they belong to. Some
studies offered yoked-feedback to participants (DEBETTENCOURT et al., 2015; KOUSH
et al., 2015; MEGUMI et al., 2015; ROTA et al., 2009; SCHEINOST et al., 2013b), in
which feedback from a subject in the experimental group is shown to the one in the
control group. Participants can also receive artificially produced feedback (SULZER et
al., 2013), feedback from different brain regions not related to the intended behavioral
effects (CARIA et al., 2007; HARMELECH; FRIEDMAN; MALACH, 2015; SCHARNOWSKI
et al., 2012), inverted feedback, or imagery either inside (ZHANG et al., 2013) or
outside the scanner (CARIA et al., 2007; LINDEN et al., 2012).
During design of experimental conditions, experimenters must take care of some
aspects. For example, a subject can consciously realize sham feedback and find out
that he does not make part of the experimental group, discouraging performance
(SULZER et al., 2013).
1.3.6 fMRI-Neurofeedback - learning
Learning the volitional regulation control may lead to behavioral changes, typically
tested by specific tasks and compared before versus after training (SULZER et al.,
2013). In the sense of a causal inference between brain and behavior, neurofeedback
could be treated as an endogenous neural stimulation, having the potential for
modulating brain networks and serving as a therapeutic method (SITARAM et al.,
2016). For instance, it was demonstrated that training participants to increase visual
cortex activity improves vision (SCHARNOWSKI et al., 2012), and that training motor
regions causes faster motor responses (SCHARNOWSKI et al., 2015). Neurofeedback
training is also a promising non-pharmacological and non-invasive therapeutic tool,
and therapeutic effects in depression, Parkinson’s, tinnitus, addictions etc. have been

49
shown (SULZER et al., 2013). The only side effects for neurofeedback would be mental
fatigue and physical discomfort, which are common in experiments that take a while in
the scanner. Naturally, neurofeedback should not be indicated to people with
restrictions to be in a MRI scanner and the environment can be impeditive for
claustrophobic subjects (SULZER et al., 2013).
Neurofeedback studies commonly account with behavioral assessments after training
(SULZER et al., 2013) to investigate and verify learned behavioral effects after
neurofeedback training. It is an open question in the field though the extent to which
detected transferred brain abilities during the training remain in real life situations.
Transfer runs after training, when subjects are tested to demonstrate whether they
are able to maintain the learned skill of controlling brain activation or other measure
even when neurofeedback is withdrawn (ROBINEAU et al., 2017; SULZER et al., 2013),
are also a central measure and a common procedure in neurofeedback studies.
Transfer runs are usually designed to be identical to the training runs, except by the
feedback is not present, and they are commonly placed before and after a set of
training runs, to verify learned neural modulation induced by training.
Especially for clinical applications, it is also crucial that follow-up neurofeedback
studies are conducted to verify whether the learned self-regulation ability remained
after long periods; however, unfortunately, the literature is scarce in this type of
results. A recent study demonstrated that learned self-regulation of differential visual
cortex activity was maintained over a long period of 14 months (ROBINEAU et al.,
2017). The persistent results are likely not to be restrict to the studied regions and
suggest that subjects are able to use this ability whenever they need.
Different models of neurofeedback learning have been proposed and, although there
are overlaps among theories, future hypothesis-based experiments should clarify the
validity of them. Here we number some of them (SITARAM et al., 2016): Operant
Learning – in which subjects learn to control brain activity when correct brain
responses are reinforced by contingent feedback; Dual-Process Theory – a model that
explains why some subjects fail in neurofeedback learning, it consists of subjects keep
searching a strategy until discovering one that works, by trial and error; Awareness

50
Theory – since feedback provides information about a physiological response, it makes
subjects to be aware of it and it finally leads to the voluntary control over the
response; Skill Learning – in an initial phase, neurofeedback elicits rapid change in
performance and afterwards a phase of more gradual improvement, as the skill is
consolidated.
As well as the already mentioned necessity of control groups in neurofeedback, the
field offers some other specific challenges, such as failures of some individuals to
achieve self-regulation, inter-individual differences in learning capacity, uncertain
long-term effects, and unclear transfer benefits (SITARAM et al., 2016). Hypothesis-
based studies could help to elucidate these topics and bolster neurofeedback
applicability.
In addition to behavioral effects assigned to the neurofeedback training,
neuroplasticity due to training can be also analyzed and would be indicating the
persistence of functional organization (MEGUMI et al., 2015; SCHEINOST et al., 2013b;
SITARAM et al., 2016). This could be measured via functional connectivity. This
neuroplasticity could be the underpinnings of the revealed behavioral effects,
enriching the discussion in terms of neural basis of the findings.
Therefore, neurofeedback can be considered an emerging powerful tool to be used to
understand neuroscientific theories and to induce behavioral effects, when all the
factors orbiting the field are carefully considered and designed. As we described in
section 1.2, there is enough evidence to motivate us to use neurofeedback to be
applied to attention, as it will be explored next.
1.4 ATTENTION ENHANCEMENT
Before proceeding with the motivations of using fMRI-neurofeedback to train
attention, we can cite some other types of training oriented to enhance attention
ability, designed to bring better skills to face daily-life situations.
51
Attention was shown to be enhanced through repetition of a specific task (POSNER;
ROTHBART; TANG, 2015). Vigilant attention can also be enhanced in the short term
through exogenous means and, in the long term, using catchphrases that produce
arousal and lead to a state of higher alertness (ROBERTSON, 2003). Aerobic exercise
was revealed to lead to attention improvement, but it seems to be that actually a
general mental state improves, not exclusive to the attention ability (POSNER;
ROTHBART; TANG, 2015). Green and Bavelier (2003) showed that training on action
video games enhanced the useful field of view as well as the performance in an
attentional blink test and only ten days of training were sufficient (GREEN; BAVELIER,
2003), indicating that faster perceptual processes and better management of
performing simultaneously different tasks are likely to reveal after training. However,
in a more controlled study, changes in cognitive aspects could not be found,
evidencing caveats in this type of training and more research is needed to determine
the real-world effects in attention obtained by video-game-based training (BANIQUED
et al., 2013).
Due to the close link between attention and meditation mentioned in section 1.2,
there is support showing that meditation could also be used as a training to change or
boost attention states. There are many different styles of meditation, but the so-called
“one-point concentration”, in which one sustains attention in a small object or breath
without succumbing to distractions, is quite studied in the field by involving practices
designed to achieve strengthening of attentional focus and reduced preoccupation
with thoughts and emotions (BREFCZYNSKI-LEWIS et al., 2007; SOOD; JONES, 2013)
(TANG et al., 2007). Training of attention based on meditative practices was also
studied, specifically the Mindfulness-Based Stress Reduction, and practitioners after
training showed a range of connectivity changes, mainly in terms of sensory, attention,
and self-referential representations in the brain, suggesting a more consistent focus,
better sensorial processing, and higher awareness of sensorial input (KILPATRICK et al.,
2011). However, lack of control groups can diminish the reliability in these positive
findings (BRABOSZCZ et al., 2013).
It is noteworthy that the attention network comprises a lot of functions, and
consequently many aspects of attention could be aimed for enhancement. Current

52
forms of attention training are limited by the fact that they focus on improvements in
very specific aspects, not generalizing to other domains of attention. Pharmacological
interventions designed for attention enhancement may cause severe side effects, and
the treatment is not designed to specific regions but to the brain as a whole.
Sustained attention training based on biofeedback techniques were also studied, since
they minimize drugs side effects and act directly in the brain area of interest. Such
techniques have been pursuit through EEG-neurofeedback (GRUZELIER, 2014) since
the 2000’s, through the training of regulation of Sensorimotor Rhythm (SMR), beta1
frequency, and other parameters, and it has been related to lead to an extensive range
of cognitive and affective gains, such as sustained attention, orienting and executive
attention, memory, spatial rotation, reaction time, complex psychomotor skills,
intelligence, mood, and well-being (GRUZELIER, 2014), likely related to a better
“mental-state”. As an example, Egner and Gruzelier found that the upregulation of
SMR and beta1 frequency through EEG-neurofeedback protocols was related to a
positive impact in the impulsivity of healthy subjects, evaluated by a continuous
performance task (CPT) (to be explained later in section 3.1.9). These results of
improvement of response inhibition were interpreted as caused by the inhibition of
the sensorimotor cortex, consistent with the SMR result. However, this study did not
include a between-subjects control group comparison (EGNER; GRUZELIER, 2002).
In fact, the existing literature about double-blind, placebo-controlled experiments
using EEG do not support any benefit of neurofeedback in lowering ADHD symptoms,
possibly just because EEG-neurofeedback is not an effective treatment in ADHD
(VOLLEBREGT et al., 2014). Small sample sizes and other study limitations are elements
that can influence this negative finding and the topic is currently under debate.
However, brain activity regulation training could be concerned in more relevant brain
structures, not only in electrocortical frequency bands. This could reveal common
characteristics in the human brain, paving the way for novel discoveries and reinforce
neuroscientific theories. Therefore, the high-resolution fMRI technique appears as a
good candidate to measure signal specific to some brain regions and the
neurofeedback based on it could fill this gap of study.

53
Sustained attention training in healthy subjects was in fact succeeded through a
closed-loop fMRI-neurofeedback in an elegant study (DEBETTENCOURT et al., 2015).
In this study, subjects had their attention-related brain states tracked moment-to-
moment during training runs through the MVPA approach customizing the feedback
for each subject and considering the whole brain. When there was activity indication
that the subjects were in a more focused attention state, stronger stimuli were
presented, rewarding them with an easier task; in contrast, when subjects were
detected to be in a less focused attention state, degraded stimuli were presented, a
more difficult task for lapsing. Interestingly, better performance was observed in an
attentional task after compared to before training, actually the same used during the
closed-loop training, and the enhancement was higher when feedback was carrying
information from the frontoparietal attention network. We thought that by
considering a priori the interaction between competitive large-scale brain networks,
sufficiently reported to be related to sustained attention as the loci for this ability, we
could also obtain improvement in attention-assessing instruments. This way, unlike
DEBETTENCOURT et al. (2015), we would expect to observe broad attention
improvements in tasks due to a training based on the differential activation between
networks, i.e. a training not based on the same evaluative tasks.
Sitaram and colleagues cited that normalizing nodes of large-scale brain networks
underlying attention aspects (including SAN and DMN) would serve as potential targets
for neurofeedback in order to optimize the interactions across these networks
(SITARAM et al., 2016). Therefore, due to the aforementioned theory about
competitive networks, we propose that the training of SAN activation and DMN
deactivation could potentially lead to behavioral effects, as attention improvement,
which could be a novel treatment strategy for certain neuropsychiatric diseases. Based
again on meditation studies that show that the direction of competitive networks
could be modulated through meditative practices (JOSIPOVIC et al., 2012), it was
thought that these interactions could be also voluntarily controlled oriented by the
neurofeedback approach.
We thus propose to use a novel network-based neurofeedback approach to
simultaneously increase SAN and decrease DMN network activity, which could

54
potentially improve attention and reduce distraction by task-irrelevant thoughts. If
confirmed the hypothesis of attention improvement after learning of self-regulation
through neurofeedback, this approach would provide a non-invasive and non-
pharmacological tool to deliver general improvements in the attention ability for
cognitive enhancement and, as an important application, to the benefit of patients
suffering from attentional deficits and even the expansion of cognitive abilities in
healthy subjects. This idea of study, as it is, was never implemented before, to the best
of our knowledge.
From the optics of Neuroscience, our results may have a big impact in the
understanding of current theories regarding the functional role of competitive
networks in the brain, since it treats them as independent variables and assess the
behavioral consequences of their modulation. Particularly, there is growing interest to
study the DMN functionality, but the knowledge about it comes from indirect
measures, since it is tricky to find methods that teach subjects to manipulate this
network.
Therefore, we hypothesize that the activity difference training between networks
positively and negatively related to sustained attention could bring to the healthy
individuals learning of how to simultaneously handle them, possibly providing a higher
capability of accessing a higher attentive state after training. As fMRI-neurofeedback
offers high spatial resolution, this study could shed light to neural mechanisms
concepts of sustained attention, either in specific regions or in networks as a whole.

55
2 HYPOTHESES AND OBJECTIVES
To fulfill the aforementioned proposals, two main experiments were accomplished in
different sites, at the University of Zürich, Switzerland, and at the University of São
Paulo, Brazil, referred to as Experiments I and II, respectively. Moreover, a
neuroimaging tool was developed for classifying independent component analysis
(ICA) maps to RSNs and defining ROIs individually, described in the last chapter,
motivated by the necessity of optimally and easily localizing ROIs for neurofeedback
studies.
2.1 HYPOTHESIS
Once our study is idealized, we formulate the main initial hypothesis that the learning
of self-regulation through neurofeedback based on the differential BOLD signal of SAN
activation and DMN deactivation lead to improved attention, a brain function related
to multiple regions and competitive networks rather than specific, unitary regions.
Thus, we can also split the main hypothesis in more specific ones:
● Once the fMRI-neurofeedback apparatus is set and it shows good
correspondence between mental imagery and presented feedback, subjects
are able to volitively regulate SAN activation and DMN deactivation;

56
● This capability of self-regulation, even if not existent from the beginning of the
experiment, can be improved over training;
● Even when neurofeedback system is removed, subjects can still modulate brain
activity as trained before;
● Behavioral effects in terms of attention, measured by specific tests and
questionnaires, are observed only for individuals that practiced neurofeedback
training and learned the regulation of the concerned brain networks;
● Neuroplasticity after training is also observed by functional connectivity
differences in images acquired during resting-state, revealing the neural basis
underpinnings for the learned ability;
● The learned ability, as well as the behavioral effects, long-lasting remains after
the end of training.
2.2 OBJECTIVES
• Implement the system (apparatus and software) for fMRI-neurofeedback
experiments in the local research center;
• Through differential neurofeedback based on fMRI, train healthy subjects to
simultaneously self-regulate the activation of SAN and the deactivation of
DMN;
• Check for positive effects in sustaining attention, through a diverse battery of
psychometric tests, after successful learning of the voluntary disassociation
between SAN and DMN;
• Verify functional connectivity changes, related to the regions of interest
considered in the study, induced by neurofeedback training;
• Verify whether the improved ability of voluntary self-regulation remains two
months after the training application, as well as possible behavioral effects and
functional connectivity changes;

57
• Develop an open-source toolbox for individualization of regions of interest
definition, based on independent component analysis;
• Verify whether the individualization of regions of interest improves analyses of
task-related activation and functional connectivity.

58
3 EXPERIMENT I: FMRI-NEUROFEEDBACK APPLIED TO ATTENTION
The following chapter describes a study whose data were acquired in
Magnetresonanztomographie-Zentrum, at the Psychiatrische Universitätsklinik,
Universität Zürich, Zürich, Switzerland. The findings described here were considered
the major ones for the applicant’s Doctoral studies.
Here, we will describe the real-time fMRI-neurofeedback system implemented to
provide learning of self-regulation the differential signal of SAN and DMN for healthy
participants. Our results show successful learning, mainly via DMN; evidences of
positive attentional effects for the best learners, controlled by a test-retest group;
neuroplasticity supporting attention training; and long-term persistent differential self-
regulation ability.
3.1 METHODOLOGY
3.1.1 Participants
Thirty volunteers (10 woman, 26.9±3.8 years old, range 20.6-35.6 years) have
participated in this study, being recruited by online advertisement. To be included as

59
participants, subjects had to be between 18 and 40 years old and they needed to have
sufficient knowledge for reading and speaking English. Half of participants were
included in the neurofeedback (NF) group, comprised of subjects submitted to
neurofeedback training and behavioral tests application (five days of experiment), and
half of them were included in the test-retest (TR) group, comprised of subjects that
were submitted only to behavioral tests application (two days of experiment). Both
groups were paired in age and genre (p=0.15, paired t-test). Exclusion criteria at
recruitment for NF group included left-handedness, vision impairments outside of -3 to
+3 diopters (when correction by contact lenses was not possible), MRI
contraindications, history of mental and/or cardiovascular disorders; and rejection of
abstaining from the use of alcohol or other drugs during the days of experiment. Last
two exclusion criteria were also applied to TR group. This study was approved by the
local ethics committee of the Canton of Zürich in Switzerland. All the participants read
and signed the consent form before applying to the study.
3.1.2 MRI acquisition
All images were acquired through a Philips Achieva 3T MRI scanner and a 32-channel
head coil in the Magnetresonanztomographie-Zentrum at the Psychiatrische
Universitätsklinik, in Zurich, Switzerland. Functional images were acquired using a T2*-
weighted gradient-echo-EPI sequence with repetition time/echo time (TR/TE) =
2000/30 ms, flip angle = 80°, field of view (FOV) = 240 mm × 240 mm, and 37 slices
acquired in an ascending order were used in every run to cover all the cerebrum but
not the cerebellum (voxel size = 3 x 3 x 4 mm³, gap = 0.5 mm). SofTone mode was
activated by means to avoid excessive noise impairing individual performances.
Functional acquisitions were performed during resting state, neurofeedback training
and transfer periods (Figure 2). Anatomical T1-weighted brain images were also
acquired using a 3D MPRAGE (magnetization prepared gradient echo) sequence, TR/TE
= 7.2/3.4 ms, 170 slices, voxel size = 1 x 1 x 1 mm³, flip angle = 8°, FOV = 240mm x
240mm, duration = 3.5 min.

60
Figure 2. Experimental timeline – Experiment I. In order to perform the neurofeedback training, a longitudinal training has to be conducted (for NF group). Sessions of neurofeedback were made in two different days for each participant. One day before, one day after, and after two months of neurofeedback training (follow-up), the participants were also submitted to questionnaires screening, resting-state functional images acquisition, anatomical image acquisition (except in follow-up day), and attention tests application.
Resting-state acquisitions were comprised by 200 scans (6min40s) and, right before,
participants were asked to relax, not move, breath regularly, look at a central black
circle screen for visual fixation, and not to think about anything in particular.
Neurofeedback training acquisitions were comprised by 190 scans (6min20s) and
transfer acquisitions, by 180 scans (6 min). Five initial dummy scans for every
functional acquisition were included to establish steady-state magnetizations.
Heart rate was measured during functional runs by using a pulse oximeter attached to
the participants’ right index finger and breathing rhythm was measured during
functional runs by fastening a pneumatic belt to the participants’ abdomen. Due to
time constraints, physiological signal analysis is not included in this thesis, but it will be
done for the upcoming article. Participants could see all stimuli through MR-
compatible goggles. Cartoons were also shown during anatomical acquisitions and idle

61
periods. Eye-tracker measurements were desired but not possible because the device
showed some problems in terms of comfort and sight focus.
3.1.3 Experimental design
The experimental timeline for the Experiment I is represented in Figure 2 and it was
respected for every individual in NF group. Each participant was contacted by
mail/phone and the slots in the scanner were reserved. Also, before the first day of
experiment, the participants were asked to fill out two of the interospection
questionnaires (explained in section 3.1.8) at home and compensated by 20 Swiss
Francs (CHF). Intervals among first to third days of experiment should be as short as
possible but one week maximum, between third to fourth days was mandatory to be
one day, and fourth to fifth day around two months. Participation was compensated
by 25 CHF/hour.
In the first day and fourth days of experiment, the NF group was first asked to fill out
the attention questionnaires (explained in section 3.1.8). Then, the participant was
positioned in the MRI scanner, ensuring a comfortable position, and anatomical and
resting-state fMRI were acquired. After leaving the scanner, the instructions for
attention tests were provided to the participants in a paper and, once certifying that
they understood them, they were asked to perform the attention tests battery. The
battery for the Experiment I consisted of five attention tests, always in the same order.
There were 5-min breaks between the second and the third tests and between the
fourth and the fifth tests.
In the second and the third days of experiment, neurofeedback training sessions were
conducted. First the participants received instructions in paper about how to proceed
during the training and for initial suggestions of strategies to upregulate the
neurofeedback. Then the participants were positioned in the MRI scanner and one
single functional volume was acquired to serve as a subject-space reference and the
ROI masks, previously defined in the Montreal Neurological Institute (MNI) space,

62
were adjusted and taken to the subject space. Thus, five neurofeedback runs and one
transfer run were made, in which the transfer run was the first in the second day of
experiment and the last in the third day of experiment. For these days, the subjects
stayed in the scanner for around 45 minutes.
The fifth day of experiment was a follow-up to check whether the changes caused by
neurofeedback, if existent, were still present. It was very similar to the first and the
fourth days of experiment, but there was no anatomical acquisition and two transfer
runs (instead of neurofeedback ones) were also acquired right after the resting-state
experiment. Also, a paper with instructions was provided for requesting them to use
the same strategies that they considered to work the best two months ago. Due to
technical issues, only one transfer run was acquired from four participants.
Regarding the TR group, the same experiment was performed in two days, separated
by a two-week interval. In both days, they were first asked to fill out the Dundee Stress
State Questionnaire (DSSQ) and the Cognitive Failure Questionnaire (CFQ), explained
in section 3.1.8. Then, the instructions for the attention tests were provided and they
were asked to perform the same attention tests battery submitted to the NF group, in
the same order. Each day of experiment lasted around 1h45min and a lump sum of 90
CHF was paid for the participation of the TR group.
3.1.4 Real-time fMRI system
For the image processing in real-time, we used an open-access tool, the OpenNFT
(http://opennft.org/) (KOUSH et al., 2017). For the feedback presentation, we used
Psychtoolbox for MATLAB (http://psychtoolbox.org/).
OpenNFT is an integrated MATLAB/Python framework designed for neurofeedback
training which combines processing speed and a friendly and functional interface
(KOUSH et al., 2017). Henceforth, real-time processing and feedback calculation and
presentation were performed by using this toolbox, but since it is an open-source

63
code, additional functionalities were incorporated to the main code to attend to the
specific needs of this study. OpenNFT’s Python interface was not used in this study.
To perform real-time image processing without significant delay, a high-performance
computer (Intel Core I7, 16GB RAM, Windows 7) was used, which performed each
functional volume processing in around 0.55 s.
As described in the section 3.1.3, anatomical images were previously acquired in the
first experiment day, regardless of neurofeedback training was not performed in this
day. However, before the second experiment day, i.e. the neurofeedback training,
these anatomical images were processed in SPM 12 software (Wellcome Department
of Cognitive Neurology, London, UK) using the segmentation step to create the inverse
transformation field, which transforms MNI data into individual subject space. This
whole method can be done before the neurofeedback session and it optimizes the
time where the participant rests in scanner.
Then, right before the neurofeedback training (second and third days), a single
functional image (also referred here as the functional template) was acquired and
exported to the real-time processing computer. Provided with the inverse
transformation field, the normalization step warps the MNI-based ROIs masks
(explained in section 3.1.5) images to the subjects’ anatomical image. Then, in
coregistration step, ROIs masks are resliced to voxel-to-voxel match the single
functional image overlapped to the anatomical image, finally being ready to be used to
extract the signal from the ROIs.
During training and transfer runs, functional images in Analyze™ format were acquired
and transferred to the real-time processing computer as soon as they were
reconstructed in the MRI scanner computer via the Direct Reconstructor Interface
(DRIN) application, provided by Philips, and connected via a local area network.
OpenNFT then reads functional images as they reach the previously specified folder.

64
3.1.5 ROI definitions
The choice of brain regions to posteriorly extract BOLD signals is a crucial step for any
neurofeedback training study based on fMRI (as it will be seen in Chapter 4) because
there must be a precise association between brain regions and expected behavioral
effects.
The selected regions for the SAN definition in our study were intended to comprise
multiple cognitive functions to outline this ability in the brain. As explained before,
attention is not a unitary function and it is formed by the combination of different
brain regions. Thus, several regions were considered in this study, positively and
negatively related to this function, in terms of BOLD signal brain activity. Figure 3
shows all eight selected SAN and DMN ROIs. As it will be explained below, SAN ROIs
had fixed positions while DMN ROIs were individualized. DMN ROIs are shown in
Figure 3 using representative xyz MNI coordinates.
Figure 3. Selected SAN (red) and DMN (blue) ROIs and their center-of-mass xyz MNI coordinates for Experiment I in sagittal, coronal, and axial views. SAN1 = mACC, SAN2 = rIFJ, SAN3 = rTPJ, SAN4 = rIPS, DMN1 = PCC, DMN2 = mPFC, DMN3 = lAG, DMN4 = rAG.
SAN1 (labeled as cluster 1 in LANGNER & EICKHOFF (2013)) covers the medial anterior
cingulate cortex (mACC), among other areas, which is responsible by detecting and/or
solving processing conflicts (WEISSMAN et al., 2006), processing errors and adjusting

65
efforts, sustaining intention and preparation, monitoring performance, and signalizing
the necessity for attentional redirecting after making a mistake. It was also reported
that this region is a core of the human task-set system and displays start-cue and
sustained activities (DOSENBACH et al., 2006). This selected region also comprises the
SMA, which has been associated to cognitive control of motor output, from motor
preparation, facilitation, and inhibition (LANGNER; EICKHOFF, 2013). It exhibits activity
due to pre-planned movement (CUNNINGTON et al., 2002), and it is related to motor
output controlling (TANJI, 1994), and enhanced vigilance, expressed by faster reaction
time (HINDS et al., 2013). SAN1 also embraces the superior frontal gyrus, involved in
refraining pre-planned responses and might play an important rule for maintaining
efficient responding, allowing preparation without execution (LANGNER; EICKHOFF,
2013).
SAN2 (labeled as cluster 2 in LANGNER & EICKHOFF (2013)) corresponds to inferior
frontal junction (IFJ), which is associated with the intermediation between target
stimuli and sustaining the specific efficiency of sensorimotor responding. It is thought
to be related especially to switching-rule processes and discrimination (i.e. go vs no-
go) tasks (LANGNER; EICKHOFF, 2013).
SAN3 (labeled as cluster 8 in LANGNER & EICKHOFF (2013)) can be associated to the
right temporoparietal junction (rTPJ), which is related to stimulus-driven bottom-up
reorienting of attention (CORBETTA; SHULMAN, 2002; LANGNER; EICKHOFF, 2013;
WEISSMAN et al., 2006), indicating that the bottom-up system is also positively related
to sustained attention. This region exhibits reliable start-cue activity, but not sustained
or error-related activity (DOSENBACH et al., 2006). It is also related to updating of task
sets for response selection (WOLFF; MÜCKSCHEL; BESTE, 2017), thought to be useful
for switching-task abilities.
SAN4 (labeled as region 14 in LANGNER & EICKHOFF (2013)) is related to the
intraparietal sulcus (rIPS), associated with endogenous, goal-oriented, or top-down
attentional orienting (CORBETTA; SHULMAN, 2002), in contrast to the SAN3. It was
also associated to initial engagement across a variety of tasks (DOSENBACH et al.,
2006). It is suggested that this region is recruited only transiently during the initial
engagement, but not involved with sustained activity (DOSENBACH et al., 2006). The
66
IPS is also associated to be guiding the focus in space and it is thought to be involved
spatial orienting and mental rotation (LANGNER; EICKHOFF, 2013).
SAN regions were defined based on a meta-analysis study about sustained attention,
we used a meta-analysis study, which brings together neuroimaging data about
sustained attention studies finding overlapping points among them (LANGNER;
EICKHOFF, 2013) and extracted and converted to a binary mask from the map kindly
provided by Prof. Robert Langner. Since SAN1 and SAN2 were big clusters compared to
the other SAN regions, they were also eroded, i.e. outer layer voxels were removed
from the mask. Therefore, SAN ROIs were formed by clusters, respecting the anatomy
of each brain region.
Inter-individual differences can be seen in fMRI studies (FINN et al., 2015) and, by
using strategies that do not consider this variability, defined ROIs might not be
optimally represented for all subjects (SHEN et al., 2013), a topic that will be
extensively discussed in the chapter 5. Therefore, for neurofeedback studies,
whenever feasible, individualizing ROIs might bring a higher precision for this type of
intervention. Even though fMRI meta-analysis is quite robust, subject adequacy is not
optimal, due to individual differences. Since DMN can be outlined via the ICA
approach, by finding the component which represents a given RSN and obtaining
subject-specific resulting maps, this method could be potentially used as a basis for
individual ROIs definition. A previous resting-state acquisition is needed for that, which
is relatively easier to implement compared to a localizer task.
Therefore, for this experiment, before the neurofeedback training start (second day)
and provided with anatomical and resting-state fMRI data (acquired in the first day),
the following procedure was conducted to individualize DMN ROIs for every NF group
participant. First, resting-state functional images were preprocessed in SPM 12
following a standard procedure (see section 3.1.10 for detailed information about
preprocessing). Then, Gift toolbox for MATLAB (http://mialab.mrn.org/software/gift/)
was used to obtain a pre-defined number of 30 ICA maps. Back to SPM 12 again, all ICA
maps were coregistered to the MNI space by specifying an MNI template as a
reference. Among all group components resulted from this approach, the component
representing the dorsal DMN was identified by a visual inspection and Personode’s

67
guidance (details in chapter 5). The individual level selected component was then
overlapped to a DMN template and z-ICA peak values coordinates inside of four
representative clusters, DMN1-DMN4, were found (see Personode’s Methodology in
the last chapter). 6-mm-radius spherical ROIs were finally created around each
coordinate, constituting the individualized DMN mask used for neurofeedback
training. DMN1, DMN2, DMN3, and DMN4 represent posterior cingulate cortex (PCC),
medial prefrontal cortex (mPFC), left and right angular gyrus, respectively.
Bilateral angular gyrus activations or deactivations are not uncommon in the literature
(ANDREWS-HANNA et al., 2007; SEGHIER, 2013), including meta-analysis studies
(SCHILBACH et al., 2012). Thus, at least in terms of classifying DMN and not specific
functions, it seemed quite unreasonable not to get bilateralized regions for Experiment
I.
Unfortunately, personalizing the intended SAN ROIs by Personode’s methodology is
not possible, because these regions are not comprised in a single RSN obtained by ICA
approach (see section 1.2.2).
SAN ROIs were chosen to be trained through neurofeedback based on the specificity
between tasks and brain regions and the general outline of attention ability and DMN
clusters were chosen by being representative and recurrent in several studies
(DAMOISEAUX et al., 2006; FOX et al., 2005; MILLER et al., 2016; SCHILBACH et al.,
2012). All regions were chosen after a common agreement among all collaborators of
the study.
3.1.6 Neurofeedback training and transfer runs
Neurofeedback training and transfer runs were composed by 30-s baseline blocks
interleaved with 40-s regulation blocks, repeating the cycle five times. Neurofeedback
training runs also contained 4-s intermittent feedback blocks always after regulation
blocks and a 5-s reward screen after the last feedback screen. As it will be further
discussed in section 3.3.6, the number and duration of blocks were designed to be

68
short enough to minimize fatigue effects, since the total time in the scanner is limited
by the participants’ comfort, and to have a reasonable number of training runs,
enabling more data points for the analysis; but long enough to train sustaining of brain
activity. Figure 4 shows the neurofeedback training design for Experiment I.
Neurofeedback training runs lasted 6min15s and transfer runs lasted 5min50s, a bit
shorter because feedback and reward blocks were not shown.
Figure 4. Neurofeedback training design for Experiment I. Intermittent feedback was shown for 30-s baseline (represented by a black square), 40-s regulation (represented by a black up-arrow), and 4-s feedback blocks (represented by thermometers in which the height was proportional to the performance in the last cycle). The cycle was repeated 5 times. At the end of the run, information about monetary reward was given proportional to the performance in the run during 5 s.
Participants received written instructions describing that, during training sessions, they
should attempt to regulate activity of the targeted brain networks in the best way
possible, using strategies of their choice, and that they would receive feedback of their
success. Participants were also asked to minimize head motion and irregular breathing.
Provided feedback in this experiment was the so-called intermittent, i.e. only appeared
sporadically to the participant. This was preferable here because it avoids the dual-task
interference (as mentioned in section 1.3.4), which would be theoretically present in a
continuous feedback experiment. Feedback was then comprised by thermometers
with the temperature reading proportional to the differential signal change SAN minus
DMN related to the previous baseline-regulation cycle. The highest thermometer level
was represented by the red color and the lowest thermometer level by the blue color;
intermediary levels were represented by gradual color changes between blue to red.

69
A black square on a white background screen represented baseline blocks and,
regarding this period, participants received the following instruction by written:
“During resting conditions you are supposed to relax and let your mind start
wandering. Please do not prepare attention-strategies during the rest periods. Resting
properly is as important as up-regulating attention.”
A black up-arrow on a white background screen represented self-regulation blocks, in
which participants were asked to regulate brain activity so that they could improve
received feedback. The visual feedback was designed to keep at minimum the
difference between regulation and baseline screens and to be simplistic for avoiding
unrelated strategies, specific to the screen content. To facilitate learning, we
recommended exploring some attention-related mental strategies, but following
established neurofeedback procedures it was emphasized that the participants should
find an individual strategy that works best for them. Regarding this period, the
following instruction by written was given: “It is possible to regulate activity in those
brain regions and thereby the feedback signal by mental imagery. In order to
successfully self-regulate the feedback signal you are asked to find a strategy that
works best for you. We recommend that you prepare a few mental strategies before
each run and try them in different self-regulation blocks. As potential regulation
strategies, the following up-regulation strategies might be a good starting point:
● pay attention to details on the screen (alignment, shape, color, …) and change
the focus of attention every 5-10 s;
● pay attention to the screen and monitor if your mind is wandering. Every time
that is the case, pay attention to the screen again;
● remain in a state of heightened alertness.”
The suggested strategies were based on standard instructions provided in fMRI
sessions applied to meditation studies (JOSIPOVIC et al., 2012) and on empiric
knowledge about reported strategies during piloting. It was emphasized that the
subjects could try other strategies beyond those suggested. Leaving subjects room to
explore alternative strategies may favor the utilization of subconscious conditioning
effects (MARXEN et al., 2016).

70
In this study, we are interested not only in assessing participants’ capability of
voluntarily controlling feedback, but also in evaluating if the ability of regulation was
acquired even when the feedback is removed. Therefore, right before the first training
run (second day) and right after the last training run (third day), no feedback was
shown, and baseline and regulation screens were the same. These runs are so-called
transfer runs and are an established procedure to accomplish evaluation of learned
self-regulation in situations where neurofeedback is no longer available. For the first
transfer run, the participants were asked to choose and apply, the best way possible,
one of the recommended strategies described above. For the second transfer run,
participants were asked to apply the strategy that worked better among all training
runs. By doing this, we can study if this ability was augmented in relation to the initial
trial.
In the fifth day of experiment, the follow-up session, subjects should show if their
networks self-regulation ability remains even after two months of the training period.
The procedure was the same for transfer runs: no feedback or reward was shown.
Participants performed two transfer runs this day, but due to technical reasons, four
participants could not perform the second run. Participants were instructed to use the
strategy that worked best two months ago.
3.1.7 Feedback calculation
Real-time signal processing demands fast computation and alternative techniques to
create a feedback that reliably represents neural subject experience, with no
significant computational delays, and that contains reduced noise not related to
cognitive states, even though the entire run is not available.
Before ROIs-specific computation steps, every upcoming fMRI volume was submitted
to standardized preprocessing steps, namely, spatial realignment to the first image’s
space with estimation of six parameters of movement (translation and rotation),
reslicing, and spatial smoothing with an isotropic Gaussian kernel with 5 mm FWHM.

71
Then, the average signal from each ROI (four for SAN and four for DMN) was averaged
and extracted separately.
Periodic fluctuations in fMRI, caused by physiological noise such as heart rate and
breathing rhythm, typically exhibit significant temporal autocorrelation, hard to be
modeled as a nuisance signal due to the low temporal resolution. It can be modeled by
an autoregressive model of order p, AR(p), (LINDQUIST, 2008), in which the
autocorrelation is thought to be due to unmodeled sources. AR(1) correction was used
in our real-time computation system to improve single subject statistics, in which the
error term in time 𝑡 somehow depends on error term in 𝑡 − 1.
Next, incremental general linear model (GLM) was computed to reduce undesired
noise. By the end of the baseline block, data points were collected to be used for
removal of influence of a linear regressor and normalized-to-z parameters of
movement from subsequent volumes (HINDS et al., 2011).
Besides of the most common fMRI artifacts, such as inhomogeneities of the static
magnetic field, head movement, heartbeat, and respiration (WEISKOPF et al., 2004),
some non-linear artifacts are observed as spikes, which are unrelated to BOLD signal,
such as eye movement, swallowing, irregular respiratory activity, and electrostatic
discharges (KOUSH et al., 2012). Detecting spikes in online analysis is challenging
because the whole time-course is incomplete to check whether the current point is a
spike. Also, a low-pass filter should be integrated to suppress high frequency. Spike
detection and high-frequency noise removal can be achieved by using a modified
Kalman filter (KOUSH et al., 2012), which is a recent and effective technique for real-
time fMRI noise correction. The technique relies on a Bayesian model: first produces
an estimate of the current state using real measures and uncertainties and then
predicts the next point based on a weighted average based on those uncertainties
(KOUSH et al., 2012).
After Kalman filtering and incremental removal of movement influence, the following
procedure was applied for the computation of intermittent feedback value 𝐹 (this
order keeps optimal settings of signal processing and artifacts removal). Initially, for
the first baseline period, the median of the resulting time-course during the period,
72
excluding the five first volumes, was computed and represented by 𝑚𝑏𝑎𝑠𝑁 , in which the
index 𝑁 refers to a given ROI. Subsequent blocks considered all previous baseline
blocks (always without first five volumes of the block) and 𝑚𝑏𝑎𝑠𝑁 was updated after
every baseline block. Accurate values for baseline are crucial because it characterizes
ROIs states in the absence of regulation for the signal change computation.
Mean resultant signals for time-series during regulation blocks computed for 𝑁 ROIs in
a volume 𝑖 are here named 𝑠𝑖𝑁.
There is variability of limits of BOLD signal change across subjects. These limits for
individual performance are unknown before training and are prone to change
according to learning, then an adaptive system which normalizes signal changes for
subjects and runs is preferable because concerns the variability. In our study, signal
limits were rescaled for every ROI separately (since each ROI has its own time-series
pattern) as following: (i) if the actual volume number is lower than 20 (because 5%
would be less than one volume, see below), inferior and superior limits, 𝑙𝑖𝑚𝑖𝑛𝑓𝑁 and
𝑙𝑖𝑚𝑠𝑢𝑝𝑁 , respectively, are the minimum and maximum values during this period (Koush
2012) (which is a quite adaptive rule, but it happens only mainly during baseline, when
signal changes are not computed yet); (ii) otherwise, inferior and superior limits are
the median of the 5% minimum and the median of the 5% maximum, respectively, of
signal values previous to the actual volume in the current run (SCHARNOWSKI et al.,
2012); (iii) the computation concerned a sliding window for the last three cycles
(baseline and regulation blocks, 105 volumes total), a compromise between too few or
too much adaptation. Fixed normalization does not consider signal change variability
while too dynamic normalization might elicit changes not related to neural processes.
Finally, (iv) the average normalized baseline signal �̂�𝑏𝑎𝑠𝑁 and the average normalized
regulation �̂�𝑖𝑁 were computed, respectively by (KOUSH et al., 2012)
�̂�𝑏𝑎𝑠𝑁 =
𝑚𝑏𝑎𝑠𝑁 − 𝑙𝑖𝑚𝑖𝑛𝑓
𝑁
𝑙𝑖𝑚𝑠𝑢𝑝𝑁 − 𝑙𝑖𝑚𝑖𝑛𝑓
𝑁
and
�̂�𝑖𝑁 =
𝑠𝑖𝑁 − 𝑙𝑖𝑚𝑖𝑛𝑓
𝑁
𝑙𝑖𝑚𝑠𝑢𝑝𝑁 − 𝑙𝑖𝑚𝑖𝑛𝑓
𝑁 .

73
Thus, the normalized signal change 𝑛𝑠𝑐𝑖𝑁 is
𝑛𝑠𝑐𝑖𝑁 = �̂�𝑖
𝑁 − �̂�𝑏𝑎𝑠𝑁
and the intermittent feedback signal 𝐹 is finally given by
𝐹 = 𝑛𝑠𝑐𝑆𝐴𝑁 − 𝑛𝑠𝑐𝐷𝑀𝑁 ,
where 𝑛𝑠𝑐𝑆𝐴𝑁 is the average normalized signal change concerning SAN ROIs and
𝑛𝑠𝑐𝐷𝑀𝑁 the average normalized signal change concerning DMN ROIs.
For training runs, during intermittent feedback blocks, a thermometer was shown to
the participant proportional to 𝐹 computed in the last cycle. The index of the
thermometer image computed by normalizing by the limits 𝑙𝑖𝑚𝑠𝑢𝑝𝑡ℎ𝑒𝑟𝑚 = −𝑙𝑖𝑚𝑖𝑛𝑓
𝑡ℎ𝑒𝑟𝑚 =
𝑙𝑖𝑚𝑚𝑎𝑥𝑡ℎ𝑒𝑟𝑚 (initially defined by 0.35) and discretizing values 𝐹 to 21 corresponding
thermometers available, from fully negative to fully positive thermometers, passing
through the zero level.
To encourage their accomplishment in training runs, the participants were granted by
a money reward proportional to their performance, shown on the screen right after
the run. To compute the reward value, first the Pearson correlation 𝑟𝑟𝑒𝑤𝑎𝑟𝑑 was
computed between the whole resulting time-series (excluding the first baseline block,
where no signal change was computed) and a curve obtained by a boxcar function
produced with the stimuli onsets convoluted with a standard hemodynamic response
function in SPM 12. A maximum constant 𝑐𝑚𝑎𝑥 is initially defined by 0.35, to compare
to the 𝑟𝑟𝑒𝑤𝑎𝑟𝑑. Then, other constants were computed: 𝑐1 = 𝑐𝑚𝑎𝑥/6, 𝑐2 = 2 ∗ 𝑐𝑚𝑎𝑥/6,
…, 𝑐6 = 6 ∗ 𝑐𝑚𝑎𝑥/6 = 𝑐𝑚𝑎𝑥 . If 𝑟𝑟𝑒𝑤𝑎𝑟𝑑 was lower than 𝑐1 (including negative
correlations), 0 CHF were paid; if 𝑟𝑟𝑒𝑤𝑎𝑟𝑑 was between 𝑐1 and 𝑐2, 0.50 CHF were paid;
𝑟𝑟𝑒𝑤𝑎𝑟𝑑 between 𝑐2 and 𝑐3, 1.00 CHF; and so on until 3 CHF (𝑟𝑟𝑒𝑤𝑎𝑟𝑑 > 𝑐𝑚𝑎𝑥), the
maximum reward value. To make this reward system adaptive to subjects’
performance during training runs, if the participant could reach the performance
𝑟𝑟𝑒𝑤𝑎𝑟𝑑 > 𝑐𝑚𝑎𝑥, 𝑐𝑚𝑎𝑥 and 𝑙𝑖𝑚𝑚𝑎𝑥𝑡ℎ𝑒𝑟𝑚 in the next run was increased by 0.05. If the
average of 𝑟𝑟𝑒𝑤𝑎𝑟𝑑 for two runs in a row (to make the system less adaptive to
worsened than improved performance) was lower than 𝑐𝑚𝑎𝑥/2, 𝑐𝑚𝑎𝑥 and 𝑙𝑖𝑚𝑚𝑎𝑥𝑡ℎ𝑒𝑟𝑚 in
the next run was decreased by 0.05.

74
3.1.8 Self-report and subjective ratings
Right after each neurofeedback training run, we asked every participant the following
questions:
1. From 1 to 10, in which 1 is very bad and 10 is very good, how do you evaluate
your control over the thermometer?
2. From 1 to 10, in which 1 is very hard and 10 is very easy, how difficult was it to
control the thermometer?
3. From 1 to 10, in which 1 is very weak and 10 is very strong, how was your
concentration level in the last period?
4. What was the strategy used to control the thermometer?
5. Have you thought about the strategy you will use in the next run? Will it be the
same or will you change?
The first three questions regarding participants’ self-perception of their own regulation
control, difficulty, and concentration levels were made to associate them later with
neurofeedback performance. The results can tell about their feedback experience and
motivation. The fourth question was made to investigate regulation strategies patterns
across trials, mainly for the best performers, while the last question prepares
participants for the next training run. Regarding transfer runs, only third and fourth
questions were asked. Two subjects were removed from this analysis due to technical
issues resulting in incomplete data collection.
To assess differences of attention characteristics before vs after neurofeedback
training, we applied to NF group two questionnaires, the CFQ and the DSSQ, in first,
fourth, and fifth days of experiment. The first one measures stable attentional
characteristics of the participant (or “traits”). The second one captures several
domains (like energetic/tense arousal state, motivation, task-related and -unrelated
thoughts) and reveals information attentiveness in real life situations from a subjective
perception. By using both, we acquired information about how neurofeedback training
effects were felt by the participants and could provide potentially correlations to
regulation performances. DSSQ was also applied before both attention tests

75
applications for TR group. From all the possible outcomes obtained from DSSQ
application, some of them were hypothesized to potentially show associations with
training learning, namely: motivation, self-focused attention, concentration, control
and confidence, task-related interference, and task-irrelevant interference. Due to
failures on the application, DSSQ was not applied to eight participants.
Because neurofeedback is essentially an interospective activity and the DMN – a
network related to interospection, among others – is tonic for this study, we could
evaluate if interospection scores can serve as predictors for neurofeedback
performance. To this end, two questionnaires of interospection were applied only
once before the neurofeedback training (filled out by participants at home): the
Multidimensional Assessment of Interoceptive Awareness (MAIA) and the Body
Perception Questionnaire (BPQ). Due to time constraints, analyses involving these two
questionnaires are not included in this thesis, but they will be done for the upcoming
article. These are standard questionnaires applied in neurofeedback research at the
local research center. In a long-term, accumulated data from different domains could
shed light about how neurofeedback training works.
3.1.9 Behavioral tests
Before and after neurofeedback training days and in follow-up day – first, fourth, and
fifth days of experiment (Figure 2) –, attention performances from every participant
were examined via a battery of five attention tests outside the scanner, aiming to
verify changes across various attentional demands induced by training sessions.
Tests were applied always in a mock scanner room (for logistical and availability
reasons), which had always approximately the same degree of luminosity and
temperature. Subjects were asked to use the provided ear protectors to avoid being
disturbed by noise. Position of screen on table was fixed, no chin fixation was used to
avoid participants’ tiredness and muscle tension. Tests were performed in an exclusive
computer and were part of the Psychology Experiment Building Language (PEBL)

76
software (MUELLER; PIPER, 2014), always following the same order, as described
below. Figure 5 summarizes the used attention tests.
Figure 5. Screenshots showing representative conditions and instructions for the attention tests battery of Experiment I, presented in the following order: CPT – Continuous Performance Task, Switcher – Task-Switching Performance, PVT – Psychomotor Vigilance Test, Mental Rotation, and ANT – Attentional Network Test.
Continuous Performance Task (CPT). (CONNERS et al., 2003; PIPER et al., 2016) A
series of random white letters appears, one at a time, on a black screen. One must
press “space” button as fast as every letter is seen, except for the letter “X”: no
response should be given for this stimulus (Figure 5). The interval between letters
(inter-stimulus time - ISI) varies among random blocks of 1, 2, and 4 s, and the
77
measured ability is not only the stimuli detection, but also their discrimination. 360
stimuli were presented. Total time for this test was about 14.5 minutes. Accuracy and
reaction times can be extracted from this test for inter-stimulus time of 1, 2, and 4 s,
and overall (for all trials), as well as for early and late trials, here defined as the first 60
trials and the last 60 trials, respectively. The measurements made for this test were
the commission error rate (when one responds to the “X” stimulus) and the reaction
times to respond to the letters except by “X” (omission error rate was not considered
in this study since it was zero almost in all cases). CPT is an example of a go/no-go task,
which targets and non-targets are randomly presented, with targets (stimuli "go")
requiring a given response and non-targets (stimuli "no-go") requiring response
retention.
Task-Switching Performance (Switcher). (ANDERSON et al., 2012) Different figures are
shown on a screen, containing pairs of geometric shapes, pairs of colors filling these
figures, and pairs of letters inside. One of these figures is marked with a white circle
around it. Different instructions, once at a time, appear at the top of the screen, which
can be either SHAPE, COLOR, or LETTER. The participant must then attend to the
current instruction, find and indicate with a mouse clicking on which one is the
correspondent pair for the circumscribed figure. For instance, if a figure of an orange
triangle with a letter “F” is marked and the instruction is COLOR, the participant must
find the other orange figure on the screen, independent on either its shape or the
letter inside of it (Figure 5). The test starts with two switching instructions (here
referred as 2 tasks condition), then three ordered switching instructions (3 tasks
condition) and ends with three switching instructions in a random order (3 tasks
random condition). Total time for this test is about 5 minutes and 121 trials were
presented (6 for practice, 38 for 2 tasks condition, 39 for 3 tasks condition, and 38 for
3 tasks random condition). The involved ability in this test is the cognitive flexibility of
activating and suppressing attention to different instructions. The measurement for
this test is the mean reaction time for different instructions switching modes (2 tasks,
3 tasks, and 3 tasks random), as well as switching cost, here defined as the average
reaction time for 3 tasks random condition minus the average reaction time for 3 tasks
condition, and mixing cost, here defined as the average reaction time for 3 tasks

78
condition minus the average reaction time for 2 tasks condition. The motivation of its
application was to determine how difficult it is to the individual to switch mental
processing from one to another environment.
Psychomotor Vigilance Test (PVT). (HELTON et al., 2007; LOH et al., 2004) Once a red
circle appears on a black screen, participants must respond to it by pressing “space”
key as fast as possible (Figure 5). Intervals inter-stimuli were random, preventing that
the task execution becomes predictable. This test lasted about 17 minutes and 121
trials were presented (first trial excluded from analysis). The measurements acquired
for this test were reaction times to respond to the stimuli and lapses of attention
(defined here as responses longer than 500 ms) for all trials, the average of reaction
times for the 10% slowest trials and the 10% fastest trials. Also, the slope was
computed by dividing the trials in portions of 20 trials (6 portions), averaging the
reaction time for each portion, computing the linear regression of these 6 points, and
extracting the slope of this fitting; the higher the slope, the higher the detriment of
vigilance over time. The assessed ability for PVT is the stimuli detection and the
reaction times can be extracted from this test. PVT stimuli are all the same, i.e. they
are all target and the task does not require stimuli identification. There is only one
possible response and the uncertain aspect is the exact moment for the stimuli
occurrence. It was applied to evaluate the readiness to respond to unexpected stimuli
onsets, an ability called "psychomotor vigilance".
Mental Rotation Task: (BERTEAU-PAVY; RABER; PIPER, 2011; PIPER et al., 2015) In this
task, the participants need to decide whether a pair of figures they see are the same or
not. These figures are shown rotated with respect to the other on the plane of the
screen. Participants should press “S” (for same) for stimuli identically matched after
either clockwise or counterclockwise mental rotation. They should press “D” (for
different) when, even after mental rotation, figures could not still be matched, i.e. they
are mirrored images (Figure 5). Total time for this task was around 4.5 min and 128
trials were presented. Accuracy and reaction times can be extracted from this test for
overall trials, as well as different angles of one figure with respect to the other (0°, 45°,
90°, 135°, and 180°), for same and different figures, and for different shapes (L-shapes
and Bolt, both shown in Figure 5). The assessed ability for this test is obviously the
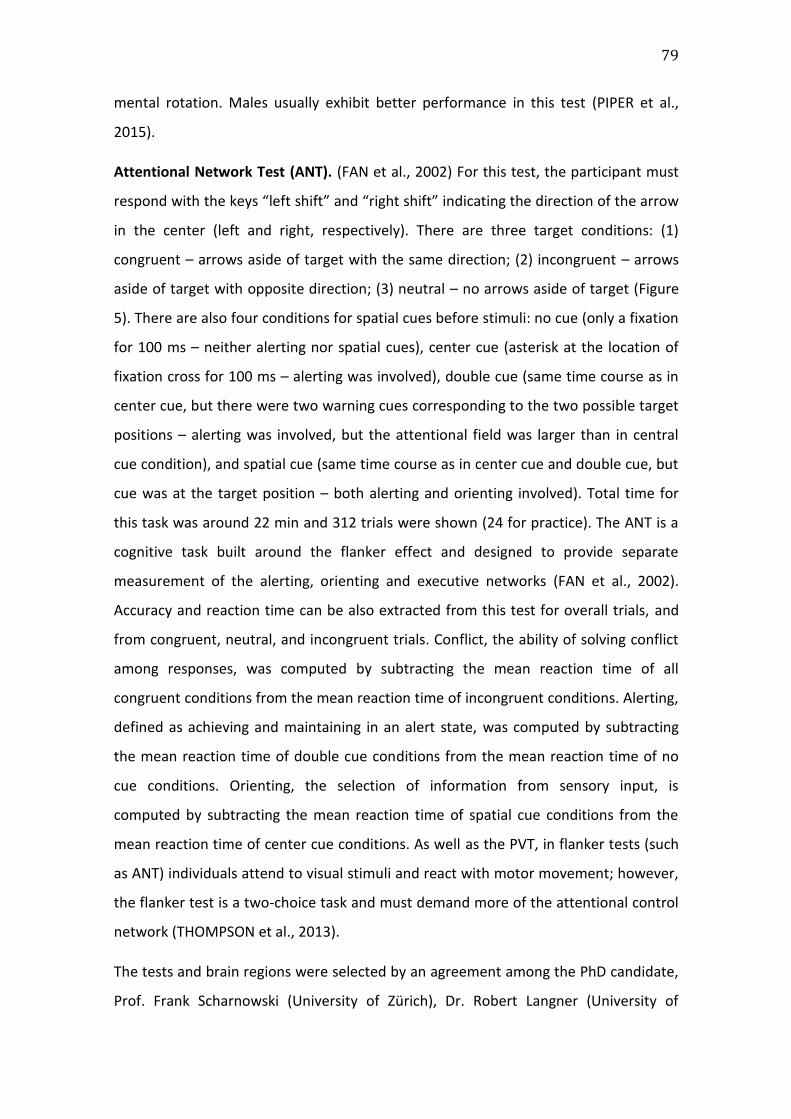
79
mental rotation. Males usually exhibit better performance in this test (PIPER et al.,
2015).
Attentional Network Test (ANT). (FAN et al., 2002) For this test, the participant must
respond with the keys “left shift” and “right shift” indicating the direction of the arrow
in the center (left and right, respectively). There are three target conditions: (1)
congruent – arrows aside of target with the same direction; (2) incongruent – arrows
aside of target with opposite direction; (3) neutral – no arrows aside of target (Figure
5). There are also four conditions for spatial cues before stimuli: no cue (only a fixation
for 100 ms – neither alerting nor spatial cues), center cue (asterisk at the location of
fixation cross for 100 ms – alerting was involved), double cue (same time course as in
center cue, but there were two warning cues corresponding to the two possible target
positions – alerting was involved, but the attentional field was larger than in central
cue condition), and spatial cue (same time course as in center cue and double cue, but
cue was at the target position – both alerting and orienting involved). Total time for
this task was around 22 min and 312 trials were shown (24 for practice). The ANT is a
cognitive task built around the flanker effect and designed to provide separate
measurement of the alerting, orienting and executive networks (FAN et al., 2002).
Accuracy and reaction time can be also extracted from this test for overall trials, and
from congruent, neutral, and incongruent trials. Conflict, the ability of solving conflict
among responses, was computed by subtracting the mean reaction time of all
congruent conditions from the mean reaction time of incongruent conditions. Alerting,
defined as achieving and maintaining in an alert state, was computed by subtracting
the mean reaction time of double cue conditions from the mean reaction time of no
cue conditions. Orienting, the selection of information from sensory input, is
computed by subtracting the mean reaction time of spatial cue conditions from the
mean reaction time of center cue conditions. As well as the PVT, in flanker tests (such
as ANT) individuals attend to visual stimuli and react with motor movement; however,
the flanker test is a two-choice task and must demand more of the attentional control
network (THOMPSON et al., 2013).
The tests and brain regions were selected by an agreement among the PhD candidate,
Prof. Frank Scharnowski (University of Zürich), Dr. Robert Langner (University of
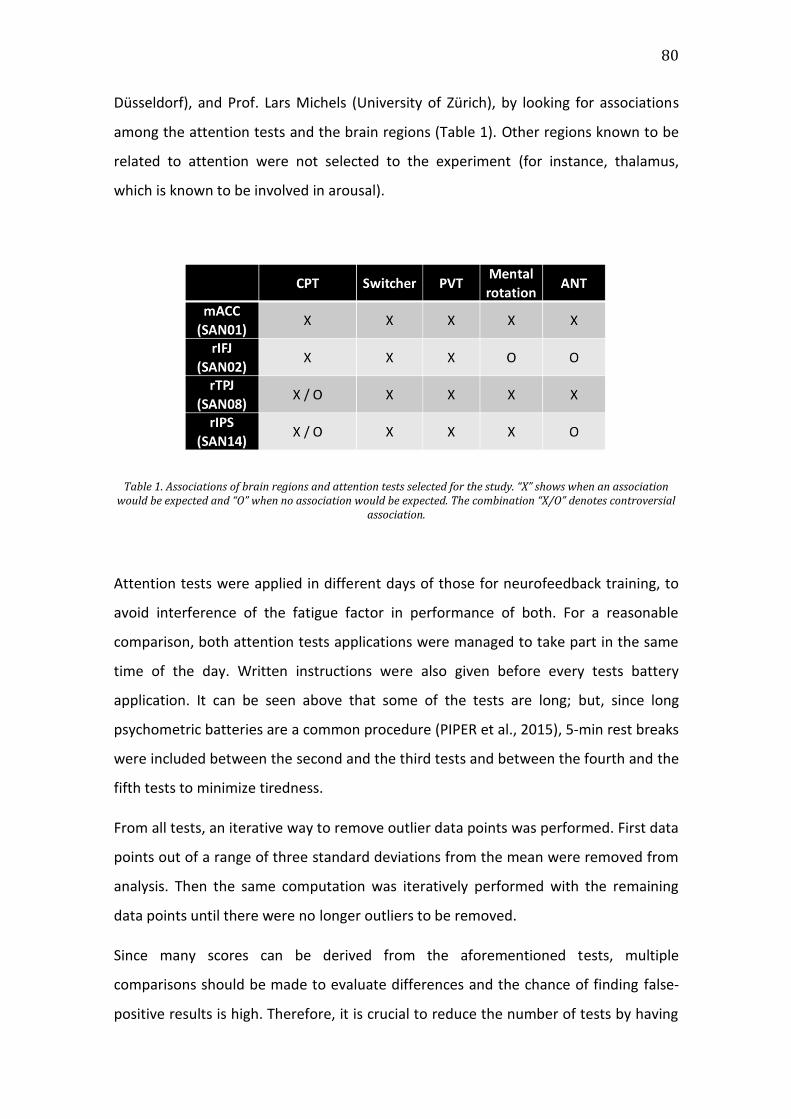
80
Düsseldorf), and Prof. Lars Michels (University of Zürich), by looking for associations
among the attention tests and the brain regions (Table 1). Other regions known to be
related to attention were not selected to the experiment (for instance, thalamus,
which is known to be involved in arousal).
Table 1. Associations of brain regions and attention tests selected for the study. “X” shows when an association would be expected and “O” when no association would be expected. The combination “X/O” denotes controversial
association.
Attention tests were applied in different days of those for neurofeedback training, to
avoid interference of the fatigue factor in performance of both. For a reasonable
comparison, both attention tests applications were managed to take part in the same
time of the day. Written instructions were also given before every tests battery
application. It can be seen above that some of the tests are long; but, since long
psychometric batteries are a common procedure (PIPER et al., 2015), 5-min rest breaks
were included between the second and the third tests and between the fourth and the
fifth tests to minimize tiredness.
From all tests, an iterative way to remove outlier data points was performed. First data
points out of a range of three standard deviations from the mean were removed from
analysis. Then the same computation was iteratively performed with the remaining
data points until there were no longer outliers to be removed.
Since many scores can be derived from the aforementioned tests, multiple
comparisons should be made to evaluate differences and the chance of finding false-
positive results is high. Therefore, it is crucial to reduce the number of tests by having

81
specific questions. Summarizing multiple scores from a given test in a combined
measure is a way to study if effects could be found for the attention aspect evaluated
that test. One possible strategy for this end is essentially combining them by using z-
scores (PAAS; VAN MERRIËNBOER, 1993); that is, they are standardized with a mean of
zero and a standard deviation of one. Such combined measures may bring a better
insight into the cognitive consequences of training.
The first step of this process was creating a vector by putting together measures made
across groups. Be 𝐺 = 𝐴, 𝐵, … , 𝑁 different groups (for instance, in our study, before
and after neurofeedback training or first and second applications for TR group), then
the vector of combined measures 𝑉 would be given by
𝑉𝑥 = [𝑥1𝐴, 𝑥2
𝐴, … , 𝑥𝑛𝐴, 𝑥1
𝐵, 𝑥2𝐵 , … , 𝑥𝑛
𝐵 , … , 𝑥1𝑁 , 𝑥2
𝑁 , … , 𝑥𝑛𝑁],
in which 𝑥 is a single measure provided by a given test for the subjects 𝑖 = 1,2, … , 𝑛,
where 𝑛 is the number of subjects considered (considering that both groups have the
same number 𝑛 of subjects). The same is made across as many measures as desired,
let’s say, 𝑥, 𝑦, 𝑧, … . However, some measures are related to performance in different
directions, for instance, the higher the accuracy, the better the performance in a given
test, while the longer the reaction time, the worse the performance. Therefore,
reaction times, and other similar measures, must be reflected (converted to negative
values). Then every vector 𝑉 of measures 𝑥, 𝑦, 𝑧, … is converted to the respective z-
score by computing
𝑍𝑥 = [(𝑥𝑖𝐺 − 𝑉�̅�)/𝜎𝑉𝑥
].
This conversion must be done for the N number of groups, for the n number of
subjects, and for the measures 𝑥, 𝑦, 𝑧, … . Then groups must be put together again, and
statics tests are applied.
This was the strategy used to combine measures in this study and it was made for CPT
(combining the reaction times and accuracy for inter-stimuli times of 1s, 2s, and 4s),
Switcher (combining the reaction times and accuracy for 2 tasks, 3 tasks, and 3 tasks
random), PVT (combining reaction times and lapses), Mental Rotation (combining the
reaction times and accuracy for overall stimuli), and ANT (combining the reaction

82
times and accuracy for overall stimuli). Also, an overall attention score was computed
by putting together all these combined measures, which could bring higher sensibility
to find differences in the overall attention ability.
3.1.10 Offline analysis
ROI activation analysis was performed offline in SPM 12 software and MATLAB. First,
fMRI from all subjects (from NF group) and all runs (training, transfer, and follow-up)
were preprocessed through slice-timing correction (SLADKY et al., 2011), spatial
realignment (reslicing all run volumes and creating a mean image), coregistration of
the anatomical image to the mean functional image resulted from realignment,
segmentation of the coregistered anatomical image to produce tissue class images
(gray matter, white matter, and cerebrospinal fluid (CSF) compartments images) and
to compute the forward deformation field, normalization of preprocessed anatomical
and functional files to MNI space using the forward deformation field computed in the
previous step, and spatial smoothing of functional data with an isotropic Gaussian
kernel with 5 mm FWHM.
Then, the influence of movement in preprocessed fMRI data was regressed out via
GLM including the six movement parameters (translation and rotation) as multiple
regressors. The blocks onset and durations were also specified, and the expected BOLD
response was derived from a boxcar model convolved with a canonical hemodynamic
function (default SPM parameters). Next, for every voxel, beta values were extracted
by regressing the fMRI activity, as the independent variable, to the expected BOLD
response, the dependent one. These parameters were contrasted via multiple 2-
sample t-tests for every voxel to derive a statistic for the difference in activation
between regulation blocks > baseline blocks. These contrast images results were
visualized using xjView toolbox (http://www.alivelearn.net/xjview).
Next, contrast images were coregistered to the MNI space template and overlapped
with the MNI ROIs masks used during neurofeedback training (SAN ROIs were the

83
same for all subjects, while DMN ROIs were subject-specific). Finally, the averaged
contrast values were extracted from each ROI for analysis. By averaging the ones from
each network, we could evaluate network changes, and by subtracting DMN from SAN
values we could evaluate differential changes. Two ROIs (SAN1 and DMN2) from one
single subject were excluded from the transfer runs analysis because the first transfer
for this subject presented incomplete coverage during acquisition.
Resting-state images followed the same preprocessing steps reported for ROI
activation analysis. We used CONN toolbox (WHITFIELD-GABRIELI; NIETO-CASTANON,
2012) for functional connectivity analysis and additional preprocessing steps were
necessary: 0.008-0.09 Hz passband filter, linear detrending, despiking, as well as the
removal of the main component signals from white matter and CSF compartments. An
exploration of the functional connectivity changes due to neurofeedback training was
done considering an ROI-to-ROI approach, using the four SAN ROIs used and the four
DMN ROIs used in the experiment, and a seed-to-voxel analysis, using the same ROIs
as seeds. The contrast between resting-state fMRI collected after minus before
neurofeedback training (fourth and first days of experiment, respectively) was
computed in this analysis.
3.2 RESULTS
3.2.1 ROI activation analysis
Figure 6 shows t-values for the contrast between regulation vs baseline blocks over
runs (also called learning curve) and days regarding the average differential signal SAN
minus DMN for all NF group participants. Learning curve slope is positive (linear
regression: β=0.13, p=0.04) and the average t-value for the second training day was
also higher than for the first day (one-tailed paired t-test: p=0.0024).
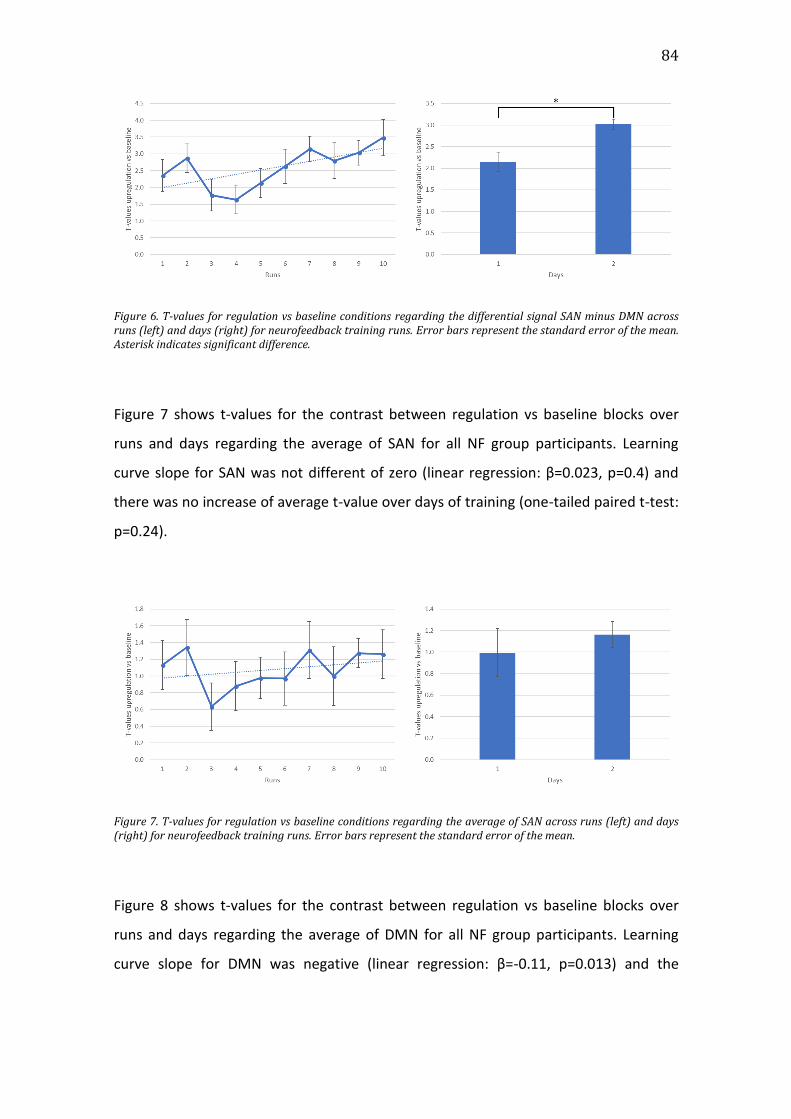
84
Figure 6. T-values for regulation vs baseline conditions regarding the differential signal SAN minus DMN across runs (left) and days (right) for neurofeedback training runs. Error bars represent the standard error of the mean. Asterisk indicates significant difference.
Figure 7 shows t-values for the contrast between regulation vs baseline blocks over
runs and days regarding the average of SAN for all NF group participants. Learning
curve slope for SAN was not different of zero (linear regression: β=0.023, p=0.4) and
there was no increase of average t-value over days of training (one-tailed paired t-test:
p=0.24).
Figure 7. T-values for regulation vs baseline conditions regarding the average of SAN across runs (left) and days (right) for neurofeedback training runs. Error bars represent the standard error of the mean.
Figure 8 shows t-values for the contrast between regulation vs baseline blocks over
runs and days regarding the average of DMN for all NF group participants. Learning
curve slope for DMN was negative (linear regression: β=-0.11, p=0.013) and the

85
average t-value for the second training day was also more negative than for the first
day (one-tailed paired t-test: p=0.019).
Figure 8. T-values for regulation vs baseline conditions regarding the average of DMN across runs (left) and days (right) for neurofeedback training runs. Error bars represent the standard error of the mean. Asterisk indicates significant difference.
Figure 9 shows t-values for the contrast between regulation vs baseline blocks over
runs and days regarding individual SAN ROIs for all NF group participants. Learning
curve slope was not found to be significant for any of the ROIs (linear regression:
SAN1: β=0.04, p=0.17; SAN2: β=-0.07, p=0.06; SAN3: β=0.06, p=0.10; SAN4: β=0.06,
p=0.21). Significant higher activations for individual SAN ROIs over days were also not
found (one-tailed paired t-tests: SAN1: p=0.20; SAN2: p=0.8; SAN3: p=0.18; SAN4:
p=0.11).

86
Figure 9. T-values for regulation vs baseline conditions regarding individual SAN ROIs across runs (above) and days (below) for neurofeedback training runs. Error bars represent the standard error of the mean.
Figure 10 shows t-values for the contrast between regulation vs baseline blocks over
runs and days regarding individual DMN ROIs for all NF group participants. Learning
curve slope was significantly negative for DMN2 and DMN3 (linear regression: DMN1:
β=-0.12, p=0.06; DMN2: β=-0.13, p=0.012; DMN3: β=-0.11, p=0.012; DMN4: β=-0.07,
p=0.08). Significant higher deactivations were found for individual DMN ROIs for the
second compared to the first training day for DMN1 and DMN3 (one-tailed paired t-
tests: DMN1: p=0.005; DMN2: p=0.07; DMN3: p=0.04; DMN4: p=0.06).
Figure 10. T-values for regulation vs baseline conditions regarding individual DMN ROIs across runs (above) and days (below) for neurofeedback training runs. Error bars represent the standard error of the mean. Asterisks indicate significant difference.
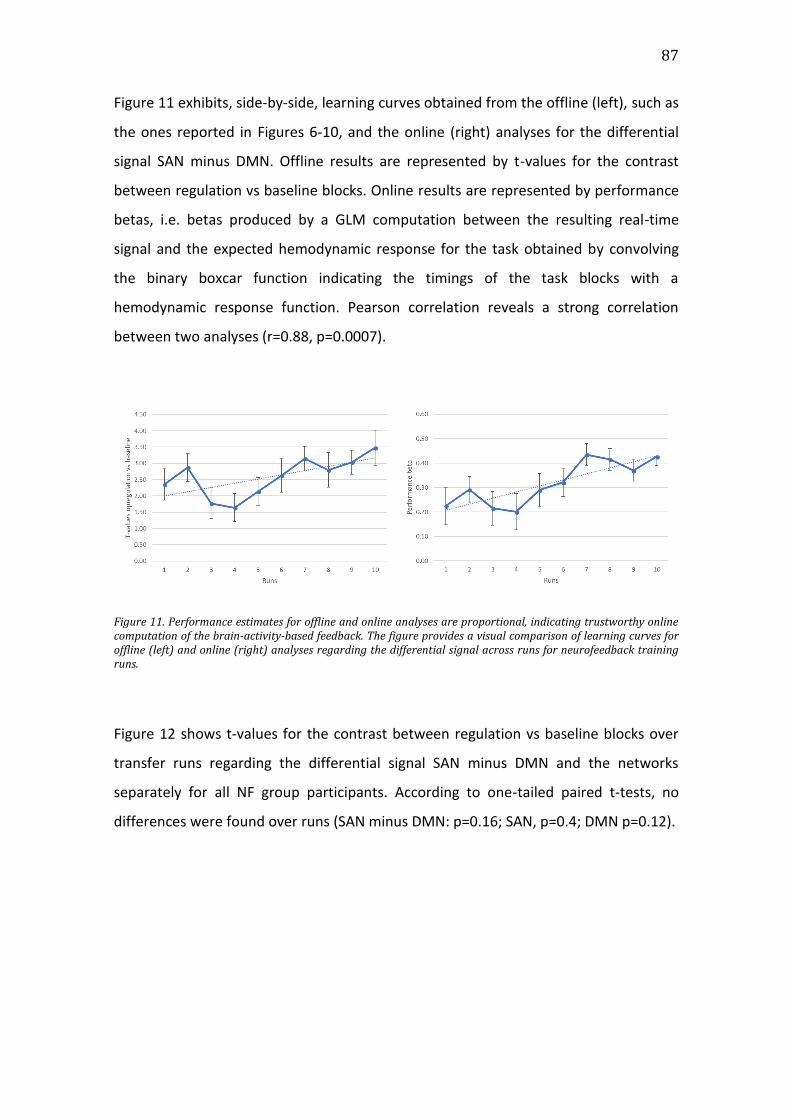
87
Figure 11 exhibits, side-by-side, learning curves obtained from the offline (left), such as
the ones reported in Figures 6-10, and the online (right) analyses for the differential
signal SAN minus DMN. Offline results are represented by t-values for the contrast
between regulation vs baseline blocks. Online results are represented by performance
betas, i.e. betas produced by a GLM computation between the resulting real-time
signal and the expected hemodynamic response for the task obtained by convolving
the binary boxcar function indicating the timings of the task blocks with a
hemodynamic response function. Pearson correlation reveals a strong correlation
between two analyses (r=0.88, p=0.0007).
Figure 11. Performance estimates for offline and online analyses are proportional, indicating trustworthy online computation of the brain-activity-based feedback. The figure provides a visual comparison of learning curves for offline (left) and online (right) analyses regarding the differential signal across runs for neurofeedback training runs.
Figure 12 shows t-values for the contrast between regulation vs baseline blocks over
transfer runs regarding the differential signal SAN minus DMN and the networks
separately for all NF group participants. According to one-tailed paired t-tests, no
differences were found over runs (SAN minus DMN: p=0.16; SAN, p=0.4; DMN p=0.12).

88
Figure 12. T-values for regulation vs baseline conditions regarding the differential signal SAN minus DMN (above), average SAN (below, left), and average DMN (below, right) for transfer runs and follow-up runs. Error bars represent the standard error of the mean. Asterisk indicates significant difference.
Figure 13 shows t-values for the contrast between regulation vs baseline blocks over
transfer runs regarding individual SAN and DMN ROIs. Also, no transfer effects were
found for individual ROIs, although DMN1 presented a borderline change (one-tailed
paired t-tests: SAN1 (mACC): p=0.4; SAN2 (rIFJ): p=0.9; SAN3 (rTPJ): p=0.14; SAN4
(rIPS): p=0.3; DMN1 (PCC): p=0.06; DMN2 (mPFC): p=0.09; DMN3 (lAG): p=0.17; DMN4
(rAG): p=0.27).

89
Figure 13. T-values for regulation vs baseline conditions regarding individual SAN (above) and DMN ROIs (below) across runs for transfer runs and follow-up runs. Results are shown for transfer runs before training, after training, and follow-up. Error bars represent the standard error of the mean. Asterisks indicate significant difference.
3.2.2 Behavioral effects
Figures S1 to S5 (Appendix) show original scores differences extracted from attention
tests for NF and TR groups. NF group differences are with respect to tests applied post-
vs pre-training (days 4 and 1, respectively), while TR group differences are with respect
to the second vs the first applications. Comparisons between differences of NF and RT
group were tested using 2-sample t-tests and significant differences for uncorrected p-
values are shown by (*) and for false discovery rate (FDR) corrected p-values
(considering all measures) by (**).
Table 2 shows p-values for paired t-tests for differences of combined measures from
attention tests for NF and TR groups. Differences for NF group are with respect to the
values acquired post- vs pre-training (days 4 and 1, respectively), while differences for
TR group are with respect to the values acquired in the second vs the first applications.
Significant differences for FDR-corrected p-values (considering all tests regarding NF
and TR group) by single asterisks. To further describe the results, Figure 14 shows
Cohen’s effect sizes for each of the combined measures for NF and TR group.
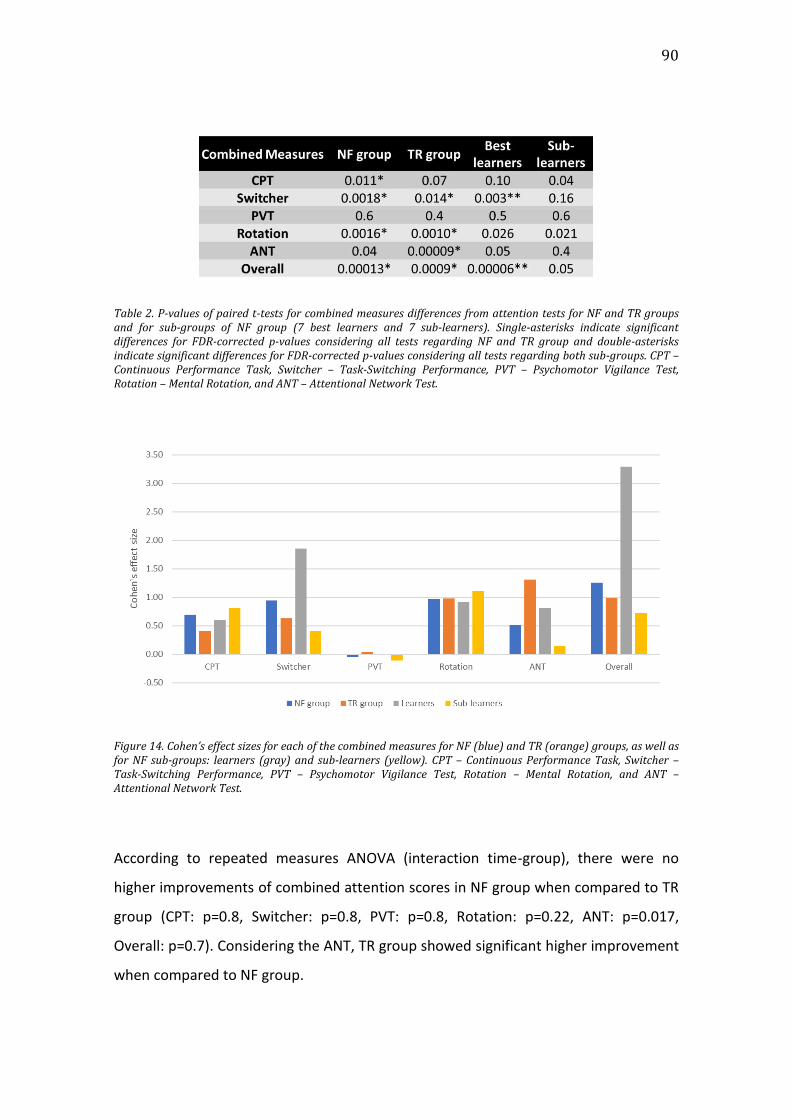
90
Table 2. P-values of paired t-tests for combined measures differences from attention tests for NF and TR groups and for sub-groups of NF group (7 best learners and 7 sub-learners). Single-asterisks indicate significant differences for FDR-corrected p-values considering all tests regarding NF and TR group and double-asterisks indicate significant differences for FDR-corrected p-values considering all tests regarding both sub-groups. CPT – Continuous Performance Task, Switcher – Task-Switching Performance, PVT – Psychomotor Vigilance Test, Rotation – Mental Rotation, and ANT – Attentional Network Test.
Figure 14. Cohen’s effect sizes for each of the combined measures for NF (blue) and TR (orange) groups, as well as for NF sub-groups: learners (gray) and sub-learners (yellow). CPT – Continuous Performance Task, Switcher – Task-Switching Performance, PVT – Psychomotor Vigilance Test, Rotation – Mental Rotation, and ANT – Attentional Network Test.
According to repeated measures ANOVA (interaction time-group), there were no
higher improvements of combined attention scores in NF group when compared to TR
group (CPT: p=0.8, Switcher: p=0.8, PVT: p=0.8, Rotation: p=0.22, ANT: p=0.017,
Overall: p=0.7). Considering the ANT, TR group showed significant higher improvement
when compared to NF group.

91
Table 2 also shows p-values of paired t-tests for combined measures differences from
attention tests for the NF group separated in two subgroups: the seven best learners
and the seven least learners (here referred as sub-learners). The participant in the
middle of this classification was taken out of this analysis because of the uneven
number of subjects in NF group. These values were FDR corrected for all performed
tests regarding these two sub-groups and the significant changes are shown by double
asterisks. To further describe the results differences for these two sub-groups, Figure
14 also shows Cohen’s effect sizes for each of the combined measures.
3.2.3 Strategies and questionnaires
CFQ overall score acquired in the first day of experiment (pre-training) were not
associated to slope of learning curve (linear regression, β=0.24, p=0.4).
Table 3 shows the associations between the hypothesized DSSQ scores and slope of
learning curves. Two associations are shown: follow-up minus day 1 (pre-training
application) and day 4 (post-training application) minus day 1. Due to failures in this
test application, this last association was computed with the available data of only 6
subjects. P-values in the table are uncorrected. Compared to applications pre-training,
regulation learning was positively correlated to Self-Focused Attention improvement
measured in follow-up application and positively correlated to Control and Confidence
measured in post-training application. Although with no statistical validation, but with
moderate value of correlation, follow-up minus pre-training applications were
correlated to learning. Figure 15 also shows a scatterplot of the difference of DSSQ
Self-Focused Attention for follow-up minus pre-training applications versus the slope
of learning curve (linear regression: β=0.52, p=0.05).

92
Table 3. Pearson correlation values and uncorrected p-values for associations between differences of DSSQ (Dundee Stress State Questionnaire) scores of interest (follow-up minus Day1 and Day4 minus Day1) and slope of neurofeedback learning curve. Day1 means pre-training and Day4 means post-training applications.
Figure 15. Scatterplot and linear fit showing the association between difference of Self-Focused Attention scores (follow-up minus pre-training) and slope of the neurofeedback learning curve.
Averages of Pearson correlations between self-reported scores (levels of control – the
higher the score, the higher the perceived control over the feedback –, difficulty – the
higher, the easier was it to control –, and concentration – the higher, the more
concentrated participants were – during training runs) and performance over runs
across subjects were positive (one-sample t-tests; control: mean=0.31, p=0.025;
difficulty: mean=0.37, p=0.005; concentration: mean=0.25, p=0.15, p=0.02) (Figure 16).
As additional information, Figure 17 shows the average of self-report concentration
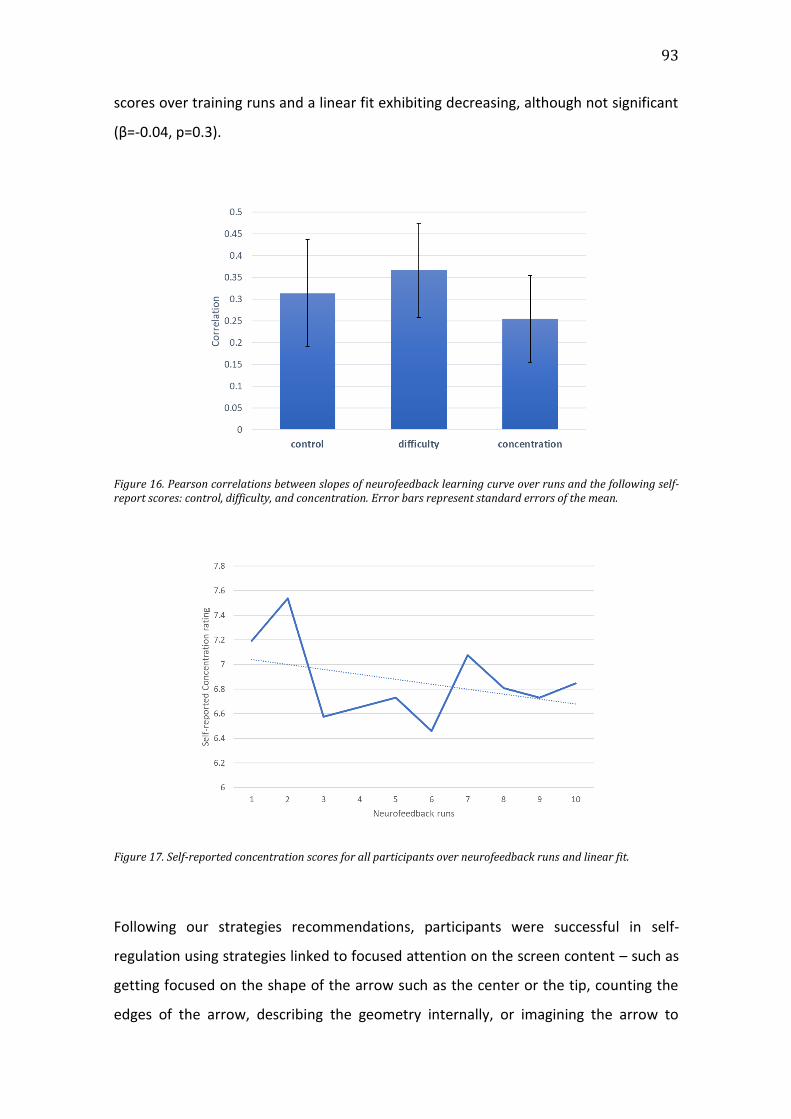
93
scores over training runs and a linear fit exhibiting decreasing, although not significant
(β=-0.04, p=0.3).
Figure 16. Pearson correlations between slopes of neurofeedback learning curve over runs and the following self-report scores: control, difficulty, and concentration. Error bars represent standard errors of the mean.
Figure 17. Self-reported concentration scores for all participants over neurofeedback runs and linear fit.
Following our strategies recommendations, participants were successful in self-
regulation using strategies linked to focused attention on the screen content – such as
getting focused on the shape of the arrow such as the center or the tip, counting the
edges of the arrow, describing the geometry internally, or imagining the arrow to

94
change colors –, imagery of threatening situations – pretending to be in danger or
holding an emotional speech in front of many people –, and mental math solving.
Strategies prone to habituation did not lead to good performance – such as counting
backwards or reciting silently the alphabet. For baseline blocks, the most successful
trials were associated to future planning – such as thinking of what to eat for dinner
and future determinations –, relaxing situations – such as laying by the beach, affective
experiences with family or friends, feeling calm and relaxed, trying to think of nothing
–, and introspective thoughts – making up a story about themselves, imagery of
swimming, singing internally listening to the sound of one's own breath.
3.2.4 Linking behavior and brain changes
Figure 18 shows associations between learning curves slopes and scores differences
for all combined measures. No significant correlations were found.
Figure 18. Associations between differences of attention tests combined measures (application after minus before neurofeedback training) and slopes of neurofeedback learning curve. r and p represent Pearson correlation and p-values, respectively. CPT – Continuous Performance Task, Switcher – Task-Switching Performance, PVT – Psychomotor Vigilance Test, Rotation – Mental Rotation, and ANT – Attentional Network Test.

95
3.2.5 Whole brain activity
Figure 19 and 20 show activations and deactivations for NF group during last training
run for uncorrected p = 0.001 and cluster size > 10 voxels. Among the activation
clusters, we can cite SMA, bilateral inferior occipital gyrus, bilateral thalamus, left
superior parietal gyrus, right superior temporal gyrus. Among the deactivation clusters,
precuneus, bilateral angular gyrus, right insula, and middle superior frontal gyrus.
Figure 19. Axial slices showing activations (red) and deactivations (blue) for NF group during last training run for uncorrected p = 0.001 and cluster size > 10 voxels.

96
Figure 20. 3D renders showing activations (red) and deactivations (green) for NF group during last training run for uncorrected p = 0.001 and cluster size > 10 voxels.
Figure 21. Axial slices showing activations (red) and deactivations (blue) for NF group during first training run for uncorrected p = 0.001 and cluster size > 10 voxels.
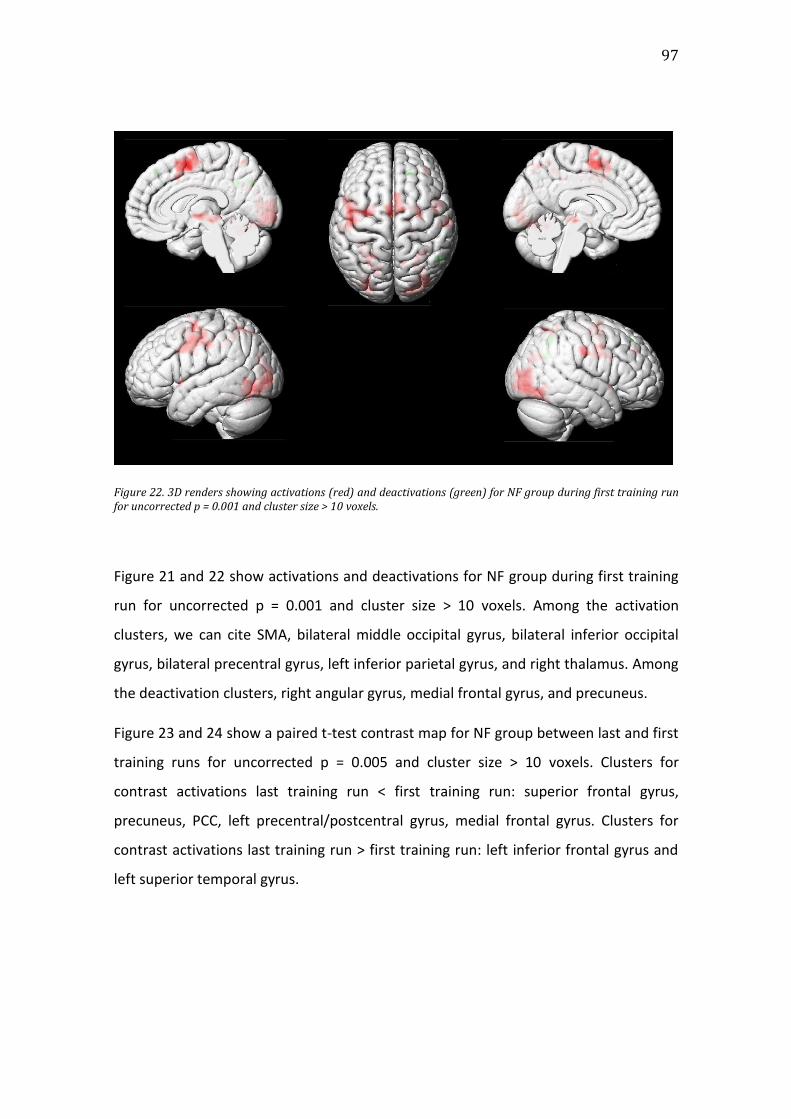
97
Figure 22. 3D renders showing activations (red) and deactivations (green) for NF group during first training run for uncorrected p = 0.001 and cluster size > 10 voxels.
Figure 21 and 22 show activations and deactivations for NF group during first training
run for uncorrected p = 0.001 and cluster size > 10 voxels. Among the activation
clusters, we can cite SMA, bilateral middle occipital gyrus, bilateral inferior occipital
gyrus, bilateral precentral gyrus, left inferior parietal gyrus, and right thalamus. Among
the deactivation clusters, right angular gyrus, medial frontal gyrus, and precuneus.
Figure 23 and 24 show a paired t-test contrast map for NF group between last and first
training runs for uncorrected p = 0.005 and cluster size > 10 voxels. Clusters for
contrast activations last training run < first training run: superior frontal gyrus,
precuneus, PCC, left precentral/postcentral gyrus, medial frontal gyrus. Clusters for
contrast activations last training run > first training run: left inferior frontal gyrus and
left superior temporal gyrus.
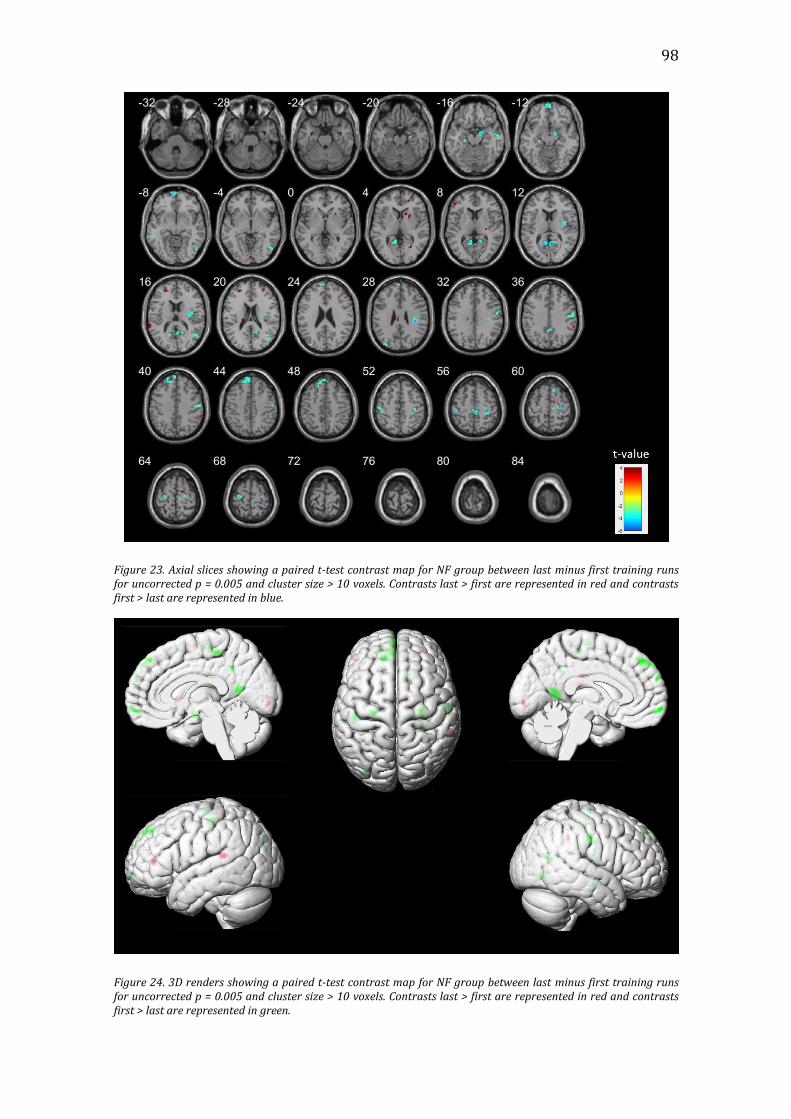
98
Figure 23. Axial slices showing a paired t-test contrast map for NF group between last minus first training runs for uncorrected p = 0.005 and cluster size > 10 voxels. Contrasts last > first are represented in red and contrasts first > last are represented in blue.
Figure 24. 3D renders showing a paired t-test contrast map for NF group between last minus first training runs for uncorrected p = 0.005 and cluster size > 10 voxels. Contrasts last > first are represented in red and contrasts first > last are represented in green.
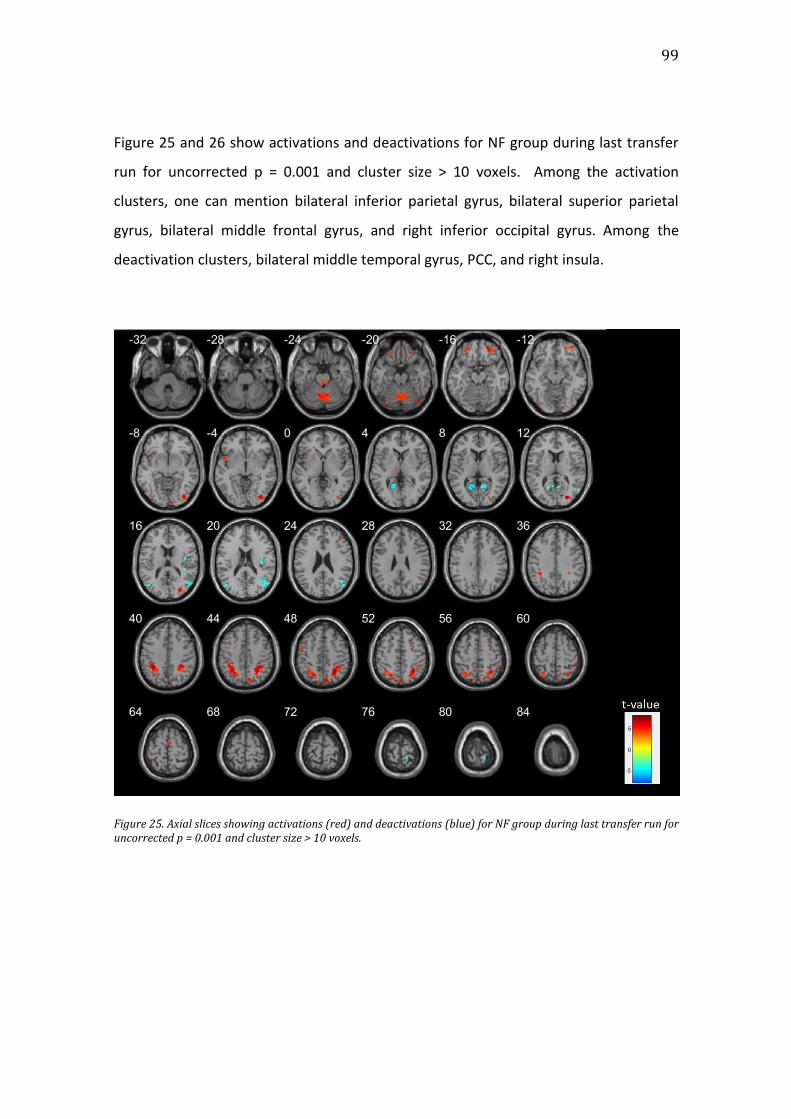
99
Figure 25 and 26 show activations and deactivations for NF group during last transfer
run for uncorrected p = 0.001 and cluster size > 10 voxels. Among the activation
clusters, one can mention bilateral inferior parietal gyrus, bilateral superior parietal
gyrus, bilateral middle frontal gyrus, and right inferior occipital gyrus. Among the
deactivation clusters, bilateral middle temporal gyrus, PCC, and right insula.
Figure 25. Axial slices showing activations (red) and deactivations (blue) for NF group during last transfer run for uncorrected p = 0.001 and cluster size > 10 voxels.

100
Figure 26. 3D renders showing activations (red) and deactivations (green) for NF group during last transfer run for uncorrected p = 0.001 and cluster size > 10 voxels.
Figure 27. Axial slices showing activations (red) and deactivations (blue) for NF group during first transfer run for uncorrected p = 0.001 and cluster size > 10 voxels.

101
Figure 28. 3D renders showing activations (red) and deactivations (green) for NF group during first transfer run for uncorrected p = 0.001 and cluster size > 10 voxels.
Figure 27 and 28 show activations and deactivations for NF group during first transfer
run for uncorrected p = 0.001 and cluster size > 10 voxels. Among the activation
clusters, we can cite bilateral middle occipital gyrus, bilateral inferior occipital gyrus,
bilateral precentral gyrus, and right thalamus. Among the deactivation clusters, medial
frontal gyrus, and right angular gyrus.
Figure 29 and 30 show a paired t-test contrast map for NF group between last and first
training runs for uncorrected p = 0.005 and cluster size > 10 voxels. Clusters for
contrast activations last training run < first training run: left precentral gyrus,
precuneus, right fusiform gyrus, and right insula. Clusters for contrast activations last
training run > first training run: right superior medial frontal gyrus and right inferior
parietal gyrus.

102
Figure 29. Axial slices showing a paired t-test contrast map for NF group between last and first training runs for uncorrected p = 0.005 and cluster size > 10 voxels. Contrasts last > first are represented in red and contrasts first > last are represented in blue.
Figure 30. 3D renders showing a paired t-test contrast map for NF group between last and first training runs for uncorrected p = 0.005 and cluster size > 10 voxels. Contrasts last > first are represented in red and contrasts first > last are represented in green.
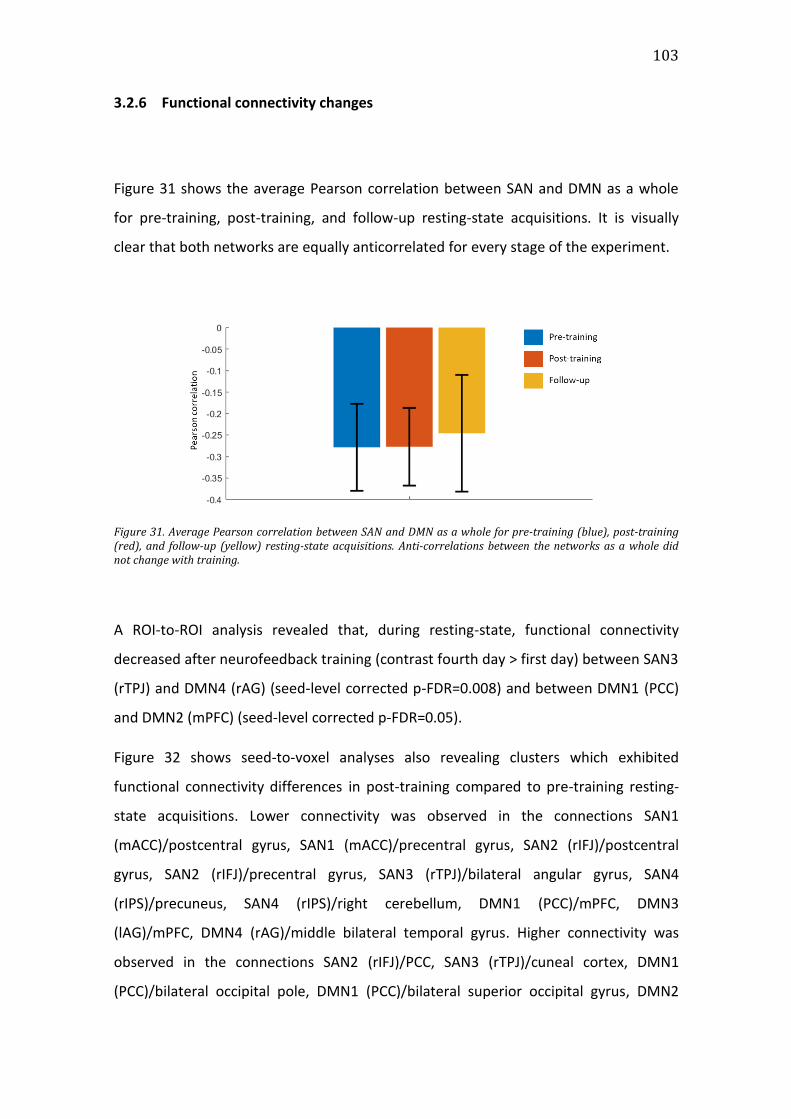
103
3.2.6 Functional connectivity changes
Figure 31 shows the average Pearson correlation between SAN and DMN as a whole
for pre-training, post-training, and follow-up resting-state acquisitions. It is visually
clear that both networks are equally anticorrelated for every stage of the experiment.
Figure 31. Average Pearson correlation between SAN and DMN as a whole for pre-training (blue), post-training (red), and follow-up (yellow) resting-state acquisitions. Anti-correlations between the networks as a whole did not change with training.
A ROI-to-ROI analysis revealed that, during resting-state, functional connectivity
decreased after neurofeedback training (contrast fourth day > first day) between SAN3
(rTPJ) and DMN4 (rAG) (seed-level corrected p-FDR=0.008) and between DMN1 (PCC)
and DMN2 (mPFC) (seed-level corrected p-FDR=0.05).
Figure 32 shows seed-to-voxel analyses also revealing clusters which exhibited
functional connectivity differences in post-training compared to pre-training resting-
state acquisitions. Lower connectivity was observed in the connections SAN1
(mACC)/postcentral gyrus, SAN1 (mACC)/precentral gyrus, SAN2 (rIFJ)/postcentral
gyrus, SAN2 (rIFJ)/precentral gyrus, SAN3 (rTPJ)/bilateral angular gyrus, SAN4
(rIPS)/precuneus, SAN4 (rIPS)/right cerebellum, DMN1 (PCC)/mPFC, DMN3
(lAG)/mPFC, DMN4 (rAG)/middle bilateral temporal gyrus. Higher connectivity was
observed in the connections SAN2 (rIFJ)/PCC, SAN3 (rTPJ)/cuneal cortex, DMN1
(PCC)/bilateral occipital pole, DMN1 (PCC)/bilateral superior occipital gyrus, DMN2

104
(mPFC)/bilateral occipital pole, DMN2 (mPFC)/bilateral superior occipital gyrus, DMN2
(mPFC)/caudate, DMN3 (lAG)/bilateral occipital pole, DMN3 (lAG)/bilateral superior
occipital gyrus, DMN4 (rAG)/bilateral occipital pole, DMN4 (rAG)/bilateral superior
occipital gyrus.
Figure 32. Glass brain view showing seed-to-voxel functional connectivity changes regarding the provided ROIs as seeds. The contrast reported here is for resting-state images acquired in the fourth day of experiment (after training) minus the ones acquired in the first day of experiment (before training). Red clusters represent higher connectivity and blue clusters represent lower connectivity. P-unc represents uncorrected p-values and k min represents the minimum number of voxels functionally connected to a given seed.
3.2.7 Follow-up
Figure 12 shows comparisons of average t-values (associated to performance)
regarding the differential signal SAN minus DMN for the follow-up experiment, when
no feedback was shown. According to one-tailed paired t-tests, follow-up runs showed
higher differential activation than pre-training transfer runs (p=0.04, indicated by the
asterisk), but not higher than the post-training transfer runs (p=0.4). Considering
networks separately, follow-up runs did not exhibit higher activations for SAN (p=0.26

105
and p=0.25, resp.) or higher deactivations for DMN, although the difference was
borderline when compared to pre-training transfer run (p=0.06 and p=0.6, resp.).
Considering ROIs separately, also shown in Figure 13, DMN1 and DMN2 were the only
ones showing significant differences when comparing follow-up runs average t-values
to either pre- or post-training transfer runs (one-tailed paired t-tests: follow-up runs
compared to pre-training transfer runs – SAN1 (mACC): p=0.17; SAN2 (rIFJ): p=0.8;
SAN3 (rTPJ): p=0.11; SAN4 (rIPS): p=0.3; DMN1 (PCC): p=0.022; DMN2 (mPFC): p=0.04;
DMN3 (lAG): p=0.21; DMN4 (rAG): p=0.26. Follow-up runs compared to post-training
transfer runs – SAN1 (mACC): p=0.14; SAN2 (rIFJ): p=0.25; SAN3 (rTPJ): p=0.19; SAN4
(rIPS): p=0.5; DMN1 (PCC): p=0.6; DMN2 (mPFC): p=0.6; DMN3 (lAG): p=0.8; DMN4
(rAG): p=0.7).
Figure 33 shows z-scores of combined measures for attention tests applications pre-
training, post-training, and follow-up. These z-scores are shown for the whole NF
group as well as for the learners one.

106
Figure 33. Z-scores of combined measures for applications before (blue) and after (orange) neurofeedback training, and follow-up (gray). These values are shown for the whole NF group (above) as well as for the best learners group (below – seven subjects). Asterisks show significant increases for either post-training or follow-up applications according to one-tailed paired t-tests corrected by FDR considering all measures. Error bars represent standard errors of mean.
Table 4 shows p-values for comparisons between combined measures differences for
follow-up and pre-training attention tests applications and between follow-up and
post-training attention tests applications for NF group and learners. The asterisk shows
significant increases of follow-up test applications according to one-tailed paired t-
tests corrected by FDR considering all measures for both groups separately (12
comparisons each).

107
Table 4. P-values for comparisons between combined measures differences for follow-up and before training attention tests applications and between follow-up and after training attention tests applications for NF group and learners. Asterisk indicates a significant difference for FDR-corrected p-values considering all tests regarding NF group.
Regarding functional connectivity for follow-up session, Figure 31 shows that
anticorrelation between SAN and DMN as a whole was naturally present in this session
too but not different of before or after training sessions. For a ROI-to-ROI analysis,
significant differences detected for the contrast post-training versus pre-training were
not seen for follow-up versus pre-training (contrast for SAN3-DMN4: unc. p=0.3;
contrast for DMN1-DMN2: unc. p=1). Patterns of differences observed in the seed-to-
voxel analysis between post- vs pre-training contrast were not detected for the
contrast follow-up vs pre-training.
3.3 DISCUSSION
3.3.1 Neurofeedback Training
As a remarkable finding, slope of differential activation over runs was positive and
differential activation for the second training day was augmented compared to the
first one (Fig. 6), which demonstrates successful learning for the proposed fMRI-
neurofeedback training. To the best of our knowledge, this is the first study to show

108
that subjects can learn how to improve controlling of, at the same time, SAN activation
and DMN deactivation through fMRI-neurofeedback. It is worth noting that, despite
the fact that subjects already domain the volitional control of the differential
activation in the very first training run (which can be also seen for the first transfer run,
in Fig. 12), neurofeedback was shown to be a valuable method to improve this ability
with training. Since the used neurofeedback technique was of the differential type,
sustained attention and default mode networks could possibly be manipulated in
different ways to achieve the regulation (ROBINEAU et al., 2014; SITARAM et al.,
2008). Therefore, to further understand neural processes supporting this
enhancement, we can inspect what have occurred to the control of each network
separately.
Positive activation regarding SAN was observed throughout training over runs and days
(Fig. 7); however, no learning effects could be verified. On the other hand, learning
effects were found for DMN, evidenced by an increasingly deactivation in DMN over
runs and days (Fig. 8), even though also deactivation in DMN was seen for the first
runs for training and transfer sessions (Fig. 12). The deactivation of DMN seems to be
related to suppression of default processes during self-regulation period (DOSENBACH
et al., 2006; WEISSMAN et al., 2006). Therefore, observed learning effects can be
explained in terms of DMN, even though performance itself can be explained by both
effects: activations in SAN and deactivations in DMN (LAWRENCE et al., 2003). Splitting
networks into individual ROIs and observing specific activations could shed light on the
phenomenon.
As well as detected for the SAN as a whole, SAN regions individually did not exhibit
learning effects (Fig. 9). There was even a trend of lower activation in SAN2 (rIFJ) over
training, which is related to switching-rule processes and discrimination, probably
because of higher preference of regulating other brain regions or less effortful
engagement when switching conditions over time. Almost all DMN ROIs, by the other
side, demonstrated to be more deactivated over sessions and runs or, at least, exhibit
a trend to change in the expected direction (Fig. 10). Therefore, learning effects
present in DMN were not node-specific, but rather throughout the network. DMN
nodes are known to deactivate practically together for a given task, i.e. deactivations
109
in DMN are a ubiquitous phenomenon, observed across diverse cognitive tasks
(DOSENBACH et al., 2006; GUSNARD et al., 2001; KELLY et al., 2008). Even though
activation in SAN was seen in all ROIs, learning effects were only attributed to DMN,
thus it is worth understanding better the underpinnings for this preference.
It was previously reported that DMN regions are relatively easier to self-regulate
through neurofeedback than other regions like, for example, visual regions
(HARMELECH; FRIEDMAN; MALACH, 2015). This differentiation comes from the fact
that DMN processes intrinsically derived information, consequently more submissive
to the neurofeedback approach. Another study, showed learned the PCC deactivation,
a DMN-integrant region, using a motor imagery strategy (ZHANG et al., 2013).
Although Garrison and colleagues have reported the inability of non-meditators to
volitionally deactivate the PCC during neurofeedback (GARRISON et al., 2013), our
study shows sufficient contrary evidence to show that naïve subjects are also able to
deactivate DMN and improve deactivation over training.
No significant differences were found for transfer runs for either differential activation
or splitting into SAN and DMN (Fig. 12), even though graphs suggest alteration trends
in the expected direction. Similarly, when looking into a regional level, also no
significant differences were seen (Fig. 13), although most of variations were in the
expected direction (only SAN2 did not follow the pattern). In addition, significance was
almost reached for DMN1, which corresponds to the PCC and it is known to be a hub
within DMN and plays a central role in a set of introverted functions (SCHILBACH et al.,
2012).
Lack of significance for transfer runs results would be possibly explained by the second
transfer run being performed after a whole neurofeedback training session, while the
first transfer run was performed in the beginning of the session. In order to fit our
measurements in only two training days, a transfer run right after training was the
found solution. Mental fatigue and physical discomfort are common not only in
neurofeedback, but in MRI experiments in general, which require minimal head
movement and sometimes also high concentration degree (SULZER et al., 2013).
Therefore, even though fatigue effects could be hiding transfer effects, which would

110
be a limitation in our study, there is still evidence to state that regulation ability was
conserved even when neurofeedback was absent in our experiment.
The fatigue effect can be also noticed during training runs, specifically between second
and fourth runs, in the first training day, and between second and third runs, in the
second training day (respectively, runs 2 to 4 and 7 to 8 in the left graph of Fig. 6).
During these intervals, there were observed apparent performance decreases.
Regulation improvement in late training runs seems to be “last sprint” effects, that is,
subjects seems to improve regulation when approaching to the end of the experiment.
It was previously reported that, in neurofeedback experiments, about 20% of subjects
are unable to control brain activity through neurofeedback or BCI methods, the so-
called “BCI illiteracy” (DICKHAUS et al., 2009; ROBINEAU et al., 2014). In our
experiment, however, all individuals succeeded in performing self-regulation in late
training stages, which evidences a relatively simpler task to be put into practice and a
feasible application to patients.
Self-report scores right after neurofeedback runs were interesting to show how
feedback was experienced by participants’, indicated by control and difficulty scores,
and how focused they were during training (Fig. 16). Positive average correlation of
control scores and neurofeedback performance means that participants’ perception of
their control over the feedback was authentic to their actual performance. This
positive correlation comes from the fact that feedback computation techniques (for
instance, signal correction and noise reduction) and design elements (for instance,
intermittent feedback) were useful to provide to the participants a trustworthy and
coherent feedback. Positive average correlation of difficulty scores (the higher the less
difficult participants report to control feedback) and performance means that higher
performances were linked to easier control. This could be explained by the process of
searching the strategy that works better: better performances indicate that the
participants found satisfactory strategies while lower performances indicate periods
when they are employing unrelated strategies, resulting in unsuccessful trials.
However, we are aware that this result could have been biased by feedback and
reward levels: the better their performance in the task, the easier they would report it
was. Positive average correlation between concentration scores and performance

111
means that the more focused the participants were, the better their performance.
However, there was a trend of lowering concentration levels over training (Fig. 17),
possibly explained by habituation to the task: in the beginning it is harder to perform,
but concentration in the task gets less necessary with proficiency, a common
mechanism in various tasks’ learning processes.
When successful performance was reached, it was expected to draw a fine parallel
between adopted strategies and regions considered for training. More than activity in
a single region or network, regulation here was related to the dissociation of
competitive networks, which is linked to focused attention (FOX et al., 2005; HINDS et
al., 2013; JOSIPOVIC et al., 2012), the basis of most strategies chosen for regulation
blocks. Other successful strategies are assigned to be related to SAN, like imagery of
threatening situations (SOOD; JONES, 2013) or mental math (DAVIS et al., 2009). For
baseline blocks, subjects adopted mainly strategies related to DMN activation, such as
future planning (MASON et al., 2007) and introspective thoughts arising (SCHILBACH et
al., 2012), besides of relaxing strategies, probably related to abandoning upregulation
strategies. It is noteworthy that strategies prone to habituation for regulation blocks
did not work well, probably because it starts to activate DMN at some point (MASON
et al., 2007).
From whole brain activity maps (Figs. 19 to 30), it was evident that neurofeedback
training handled with some of the regions in which the signal was offered as feedback.
Activations were observed in SMA and right superior medial frontal gyrus (both
covered by SAN1), right superior temporal gyrus (represented by SAN3), bilateral
inferior parietal gyrus (SAN4). Deactivations were detected in posterior frontal
gyrus/precuneus (DMN1), middle superior frontal gyrus (DMN2), and bilateral angular
gyrus (DMN3 and DMN4).
Looking at the neural basis of attentional lapses as proposed by Weissman and
colleagues (WEISSMAN et al., 2006) is helpful to understand why the neurofeedback
induced activations could potentially lead to higher attention abilities. Activations and
deactivations induced by our neurofeedback training, are intrinsically connected to the
neural system underpinning various aspects of attention. Activations in anterior
cingulate cortex – covered by SAN1 –, a region which undoubtedly contributes to

112
detect and resolve response conflicts, it is linked to the ability of differentiating
distraction from irrelevant stimuli, and it is interestingly a region that overlaps over
several neurofeedback studies, indicating that it plays a role in neurofeedback
regulation mechanism, in terms of cognitive processes (SITARAM et al., 2016). TPJ –
covered by SAN3 –, related to stimulus-triggered reorienting of attention, plays a role
in recovering from attention lapses. Lapses of attention are conversely associated with
reduced task-induced deactivation of the DMN (WEISSMAN et al., 2006).
However, other regions also exhibited de-/activations (Figs. 19 to 30). Activations were
observed in bilateral inferior occipital gyrus, possibly related to a better perceptual
representation of behavioral relevant stimuli (WEISSMAN et al., 2006); bilateral
thalamus, which mediates brainstem and cortical arousal systems during sustained
attention (LANGNER; EICKHOFF, 2013) and, as well as the anterior cingulate cortex
(ACC), it is a region present in a range of neurofeedback regulation studies concerning
different ROIs, indicating a ubiquitous role for this type of processing (SITARAM et al.,
2016); bilateral superior parietal gyrus, although not selected as a region-target for
neurofeedback, it was clearly jointly activated as the well-known dorsal attention
network, together with SAN regions (KELLY et al., 2008; MILLER et al., 2016), involved
in top-down attention control (CORBETTA; SHULMAN, 2002); bilateral middle frontal
gyrus, responsible by maintaining and strategically manipulating the contents of
working memory (WEISSMAN et al., 2006); left inferior frontal gyrus, which also takes
part in the process of stimulus driven reorienting of attention (WEISSMAN et al., 2006),
and left superior temporal gyrus, which is known to be related to language and its
activation may reflect strategies with verbal content. Deactivations were also
measured in right insula, possibly representing less attention to internal body
sensations (CARIA et al., 2007); left precentral/postcentral gyrus, since these regions
exhibited lower activation after training, probably because motor imagery strategies
might have been abandoned and a focalization to attention-related were assumed;
and right fusiform gyrus, possibly because individuals engaged less in visual cues but
more in imagery strategies (DOSENBACH et al., 2006).
In this study, a proof-of-concept of the successful differential regulation of both SAN
and DMN using fMRI-neurofeedback was shown, as well as the learning of how to

113
improve it. Participants could perform the regulation from early stages of the
experiment, what makes sense because healthy people have attention already as a
fundamental ability and the neural underpinnings were expressed in initial measures.
But highlighting that the regulation can be improved with training suggests the natural
extension of this approach to alleviate the symptoms of patients who have ADHD
(LANGNER; EICKHOFF, 2013). It was shown that a population of ADHD patients exhibit
reduced (or less negative) connectivity between the anterior cingulate cortex, a SAN
region, and the DMN (CASTELLANOS et al., 2008), which may explain the inattention
dysfunction. This population would start from a lower point of success, but could
potentially improve this ability, what could bring beneficial effects. The behavioral
effects of this kind of training will be discussed hereafter.
3.3.2 Behavioral effects
A battery of tests was applied before and after neurofeedback training aiming to
assess different aspects of attention, namely: discrimination and response to stimuli
(CPT); rule switching process (Switcher); detection of stimuli (PVT); spatial rotation
(Mental Rotation); and conflict solving, spatial orienting, and alertness (ANT). Several
neurofeedback studies revealed behavioral effects related to brain regions whose
signal was fed back to participants for regulation.
Many comparisons between pre- and post-training tests applications were reported
(Figs. S1 to S5). However, since many comparisons were made, results are too specific,
complicated to explain, and multiple tests increase the likelihood of finding false
positives just by chance. Despite of the fact that some small p-values were reported,
it’s unclear if these findings were truly representative for the whole picture of a
behavioral effect. Thus, there was the need of summarizing results by combining
measures making them easier to be interpreted and more sensitive to possible
changes. Combined measures are also a good strategy to restrict the number of
comparisons (PAAS; VAN MERRIËNBOER, 1993).

114
Considering then combined measures (Table 2), both NF and TR groups showed
improvements in attention scores post-training for combined measures in Switcher
and Mental Rotation tests as well as for the Overall measure. The combined measure
for CPT was seen to be improved for NF group and the combined measure for ANT
improved only for TR group (although p-values were borderline). PVT was the only test
that has not shown improved performance for the second application. Practice effects
seem thus to be present in the study. In other words, as evidenced by the TR group, a
better performance is measured when applying tests for the second time, independent
on the training. Even though PEBL tests have been used for many applications
(MUELLER; PIPER, 2014), there are very limited information about the psychometric
properties (PIPER et al., 2015), such as test-retest evaluations for the tests we used in
our experiment, which were not available to date. Including TR group to control for
behavioral effects in our evaluation was indispensable because it constitutes the only
possible control for pure behavioral effects.
However, we did not observe higher improvements in combined attention scores for
NF group compared to TR group, on top of the practice effects. Instead, a higher
improvement in ANT for RT group when compared to NF group was observed, possibly
due to a higher fatigue effect for NF group, that participated also in neurofeedback
sessions (even though in a different day), not present in the TR group timeline.
Higher effects sizes of combined measures for CPT, Switcher, and Overall suggest
though neurofeedback-specific effects on top of the practice ones (Fig. 14). However,
comparisons between the scores’ differences between second minus first applications
show that they were not higher for NF group, that is, using this comparison, no
improvement restrict to NF group could have been shown. Nevertheless, we could
hypothesize yet that subjects who had a higher learning during neurofeedback training
could present broader behavioral effects compared to the ones which the learning was
lower.
However, it can be argued that neurofeedback training effects would be likely seen
only in subjects who learned the ability during training or improved this ability. In fact,
this division has been studied (ROBINEAU et al., 2014; SCHARNOWSKI et al., 2012) and
relies on criteria related to performance parameters over runs, like both slope of
115
learning curve and last run performance scores (contrast values regulation vs baseline)
to be positive. However, in our experiment, due to the high rate of good performers,
all the participants demonstrated positive last run performance scores. Concerning
slope of learning, only two out of fifteen participants showed negative value.
Therefore, it is plausible to classify subjects in our study into the best learners and the
least learners separately, in which they would be grouped by ranking their learning
slope values. Seven of the participants were then classified as best learners and seven
as sub-learners (the participant with the median learning slope value was excluded of
this analysis because we had an uneven number of participants). Separating a group of
subjects that arises from the original pool of subjects, which minimally learned to
control feedback, would naturally serve as a control group to be compared with
learners, investigating behavioral effects exclusive and related to the learning feature
(SCHARNOWSKI et al., 2012).
After separating participants into these two groups, attention scores differences were
not found for sub-learners group, while significant differences and descriptive higher
effect sizes were detected for best learners in Switcher test combined measure and
overall measure (Table 2 and Fig. 14). Based on these comparisons and effect sizes,
this may mean that neurofeedback training results in enhanced behavioral effects in
terms of a general measure of attention and, more specifically, for the task-switching
ability, even though a cautious interpretation is recommended for these results.
Correlations between behavior changes and neurofeedback learning were also
analyzed by means of linking training to attention effects. Combined measures for
Switcher and ANT tests, as well as the overall measure, showed results that suggest
moderate associations, although with no statistical validation (p ≤ 0.13) (Fig. 18).
Despite the lack of significance, one can point out that the sample size is modest and
inter-individual analysis may not lead to striking results. Also, some of the tasks may
not be well suited for such an approach because they induce to few inter-individual
differences, hindering the observation of high correlations.
Based on the assumption, after the learning-driven division analysis, that our approach
using neurofeedback training is truly leading to behavioral changes mainly in terms of
the Switcher test, it would be an interesting finding. This would also find

116
neuroscientific support according to what was seen during neurofeedback training,
when participants preferred regulating the differential feedback by increasingly
deactivating the DMN. This network activity has been linked to intrusive thoughts (FOX
et al., 2005) and, if training is helping subjects to learn how to suppress it when
needed, lapses of attention could be avoided and the capability of alternating tasks
would increase. Another possible explanation is that the offered neurofeedback
training was intrinsically involved to mental state switching between regulation and
baseline periods, therefore attention switching was required throughout the training
and this specifically ability was being trained. This latter theory would rely less in ROIs
specifically related to the switching task, but more to the network’s competition
behavioral. Yet, once again, results must be carefully interpreted, due to the moderate
sample size.
Behavioral effects due to neurofeedback training can be revealed by psychometric
tests, but also by using standardized psychological questionnaires. Self-report scores
can bring further information about whether the intervention had an effect over
mental states, which are usually directly related to subject’s experience in real-life
situations.
CFQ scores could not be linked as predictors for the learning success rate in
neurofeedback. This questionnaire express attentional traits, in the form of a
temporally stable description for each participant. Thus, since attentional traits do not
influence performance learning, but the learning rate was high in this experiment, we
argue that it was actually a desired result, because it means that the approach could
be efficient to people in a broad range of attentional traits, an evidence that the
training could be applied to a clinic population and learning would be also expected.
Because CFQ provides stable scores, effects due to training would not be expected to
be revealed in this questionnaire and the analysis comparing post- and pre-training
scores was not reported here.
DSSQ scores capture several attentional domains and the measures are prone to
fluctuate over time more easily than CPQ scores, so attention improvement in real-life
situations due to neurofeedback training could be evaluated by this questionnaire.
Association between neurofeedback learning and improvement in Self-Focused
117
Attention and Control and Confidence scores was observed (Table 3, Fig. 15). The
former might be an indirect consequence of the acquired better control of DMN:
although the participants intrinsically learned to down-regulate DMN and higher
deactivation in DMN is solidly related to a higher externally-oriented attention than
the one to the self (GUSNARD et al., 2001), it is possible that a higher control of DMN
could also bring benefits in terms of self-oriented attention. These results would mean
specifically long-term benefits, because the association was found for the difference of
scores observed in follow-up (and not in post-training) compared to the pre-training
moment. The latter result, indicating higher confidence and control levels after
training, was found for a very small number of participants. However, a moderate
correlation value was also found for follow-up and results seem to converge to show
that the association was likely not a false positive result for the post-training stage and
it moderately remains until follow-up. It could be argued though that these results
were not controlled, and they could be a placebo effect not essentially related to the
ability learned, thus this point remains as an open question in our study.
As an addendum, it is important to still say that the participants were not asked to
consciously use the strategy they learned in the scanner during the tests application (it
is worth saying that this could interfere in behavioral tests results). Possible findings
would be due to a direct manipulation of the concerned brain regions and the effects
of it could be seen outside the scanner. It is not clear though, regarding neurofeedback
studies, how much the acquired ability changes subjects’ daily routine, but one
speculates that the approach offers the desired competence learning of activating
brain regions whenever needed and it could be reflected in better daily-routine
performances.
3.3.3 Connectivity results
Neurofeedback training can induce neuroplasticity effects detected by functional
connectivity (MEGUMI et al., 2015; SCHEINOST et al., 2013b; SEPULVEDA et al., 2016).

118
Anticorrelation between SAN and DMN as a whole was present during all stages of
experiment; however, in the network level, it did not change due to training. A more
region-specific analysis could be made with the ROIs selected for training, which could
potentially lead to significant results.
ROI-to-ROI functional connectivity analysis revealed higher anticorrelation between
SAN3 (associated to right temporo-parietal junction) and DMN4 (associated to right
angular gyrus) post-training compared to pre-training. It was thought that training
would enhance anticorrelation between SAN and DMN and the finding is concordant
to what it was expected, despite of no other SAN-DMN connection differences were
found. It is worth noting the SAN3 showed the lowest p-values for slope of learning
curve (Fig. 9) and for transfer differences post- versus pre-training (Fig. 13) among
SAN, so it would be a region more probable to exhibit neuroplasticity changes.
Also, significant differences were found for the connectivity between DMN1
(associated to PCC) and DMN2 (associated to medial prefrontal cortex), which was
shown more negative in the post-training resting-state acquisition. It was thought that
training would cause a higher connectivity among DMN ROIs, but the finding contrasts
with it. Significantly, DMN1 showed more deactivation over days and DMN2 exhibited
more deactivation over runs (Fig. 10). Moreover, the lowest p-values for transfer
differences post- versus pre-training were seen for DMN1 and DMN2. This connection
is considered to be involved in recalling self-relevant memories (TOMPSON; FAYE
CHUA; KITAYAMA, 2016), so a lower connectivity between mPFC and PCC after training
likely means less intrusive thoughts which can cause distraction.
Seed-to-voxel analysis also shows some revealing results, among which we can
highlight (i) SAN3 more negatively correlated with bilateral angular gyrus, which is the
case previously reported for the connectivity difference SAN3-DMN4 but it additionally
shows that the contralateral region of angular region, part of DMN, was also more
anticorrelated - this anticorrelation must represent a disengagement of bottom-up
attention after training (CORBETTA; SHULMAN, 2002) to internal body sensations
(CARIA et al., 2007), leading to less endogenous distractions; (ii) DMN3 less connected
to mPFC post-training, as well as the already reported weakened connectivity between
DMN1 and mPFC, likely meaning less distractive thoughts caused by self-referential

119
information recalling (TOMPSON; FAYE CHUA; KITAYAMA, 2016); (iii) DMN4 more
connected to bilateral middle temporal regions, probably because higher-order
regions, which when active lead to attentional detriment (WEISSMAN et al., 2006), are
probably being triggered by DMN deactivation; (iv) and all DMN nodes more
connected to occipital areas, probably because of a better-quality perceptual
representation triggered by the suppression of task-irrelevant thoughts.
Our neurofeedback approach led to functional architecture changes that were
measured in a different day than the training, revealing non-transient effects but
somewhat persistent. It is also noteworthy that our approach consisted of
neurofeedback sessions that lasted a short period (less than one hour for two days)
but still seemed to lead to neuroplasticity effects over the brain, detected by easily-
implemented resting-state acquisitions, which were made at the same time of the day
and then several features that could be pointed as confounders were minimized for
this measurement. However, additional control groups could bring a higher validation
of the findings.
Revealed neuroplasticity changes caused by the neurofeedback training are evidences
that the intervention might lead to modifications in real-life situations (as outlined in
the section 3.3.2) and could be expressed in attention-demanding circumstances.
3.3.4 Follow-up
As a joint study, a two-month follow-up was also accomplished aside of the main one.
The goal was to determine, after two months of the main experiment was conducted,
(i) whether the participants could still exhibit brain regions regulation in transfer runs
acquired through neurofeedback training; (ii) examine whether behavioral changes
remain; and (iii) whether neuroplasticity changes remain.
Considering the differential signal regulation, there was a significant increase of
performance in follow-up transfer runs compared to pre-training ones (Fig. 12). This
result is especially interesting because no significant difference was observed between

120
post- vs pre-training transfer runs. This may suggest a long-term consolidation of the
regulation ability and confirm that, even considering a relatively long time after
training, subjects still master the regulation ability with no feedback, using it whenever
they want. It could be claimed that, once this ability is acquired, it continues to be
improved over time. Neurofeedback could be then just the initial trigger for a
continuous neural learning afterwards.
When looking at the networks separately, this result could was probably mainly again
explained by DMN changes (Fig. 13), although compelling borderline increases in SAN
were also present (see SAN1 and SAN3). DMN1 and DMN2 were significantly more
deactivated in follow-up than pre-training transfer runs, a result not seen when
looking at post-training transfer runs, a result mainly due to the reduction of the
standard deviation (Fig. 12), representing a more solid performance and regulation
learning consolidation. The lack of significant differences for post-training transfer runs
(made after five neurofeedback training runs) reinforce the hypothesis that fatigue
effects might be masking these results but with less interference over follow-up
transfer runs (made after only a resting-state run).
Regarding behavioral effects measured by attention tests, differences found for post-
training vs pre-training were not retained (Fig. 33 and Table 4) (except by Mental
Rotation, which was already discussed to be a practice effect), but post-training levels
do not go down to pre-training levels. Nevertheless, Switcher test during follow-up
measurements still seems to show effects, which would be restrict to subjects that
best learned the regulation only (Table 4). Although compelling, results must be
carefully considered, since the originally moderate sample size got even smaller when
divided into best and sub-learners and the p-values are not so small. Further study is
needed to clarify this point. If behavioral effects are existent, as it seems to be, even
though not strongly, then the used approach can be useful in subject’s mundane
activities in a long term. If regulation capability is maintained (as described above), but
behavioral effects are not reproducible, it opens the discussion about how useful this
regulation learning and preservation would be for subjects submitted to this type of
training.
121
Comparing follow-up to post-training applications did not produce any significant
results (Table 4), so the permanence of behavioral effects in follow-up session could
not be validated in our study.
None of the findings concerning functional connectivity analysis obtained from after
training resting-state could be reproduced in the follow-up session; in other words,
neuroplasticity observed right after training, which is possibly due to neurofeedback
training, did not remain after two months, in opposite to what is reported in the
literature (MEGUMI et al., 2015). However, this agrees with the lack of behavioral
effects in follow-up sessions. Two explanations emerge from these results: either (i)
connections may be weakening over time because of lack of use or (ii), since it was
demonstrated that participants could learn and keep the regulation ability until the
time of the follow-up session, this could come from the learning process mechanism:
learning a skill initially produces changes in the brain but then they gradually come
back to the initial state (BREFCZYNSKI-LEWIS et al., 2007), reflecting initial higher
effortful concentration then becoming less effortful with practice.
3.3.5 Real-time fMRI-based neurofeedback
To make neurofeedback training possible, all upcoming images must be acquired,
reconstructed, transferred, and processed in a short time, a flow that is only possible
to be almost instantly performed thanks to the computational advances in the field.
Although online analysis does not count all processing methods usually performed in
offline analysis (the gold standard in neuroimaging), some elegant strategies can be
applied to filter data and reduce noise, leading to a cleaner result. When it comes to
fMRI signal, noise and influence of non-neural factors must be still considered, but
with the complication that the application of common strategies is not possible for
incomplete acquisitions. Alternatives as the ones used here can work around the
problem, such as volume-to-volume preprocessing, incremental GLM for movement
influence removal, and suppression of BOLD-unspecific signals, like spikes and high

122
frequency, using Kalman filter. Each method needs to be carefully set before the
experiment in order to optimize parameters for the intended corrections. It was finally
shown that online and offline outcomes are highly correlated (Fig. 11), in terms of
activation performance, and therefore online analysis (for the strategies and
parameter we used) was trustworthy for our goals.
The definition of regions to be trained during neurofeedback sessions was a crucial
step for our experiment. Once extensively discussed with attention experts,
collaborators on board, some correspondences were outlined putting together
attention aspects, tests to be applied, and brain regions, to ultimately delineate a
representant network positively correlated to attention – the SAN. The same number
of nodes were used pick representant nodes for the network negatively correlated to
attention – the DMN.
Once regions were chosen, masks should be created to reliably represent individuals’
brain as more accurate as possible. Concerning SAN, a more individualized method
would be to ask participants to perform attention tasks in the scanner before
neurofeedback experiment and then define clusters for every one of them, according
to their task-related de-/activations. This type of definition, the so-called localizer
tasks, is used in many neurofeedback studies (ROBINEAU et al., 2014; ROTA et al.,
2009; SEPULVEDA et al., 2016; ZHANG et al., 2013). However, they are of elaborate
design, more expensive, time-consuming, and can still contain definition uncertainties
due to first-level analysis statistics. We can also point that attention ability involves
multiple aspects of the brain, making it hard to design a task which embraces plural
regions at the same time. Meta-analysis neuroimaging studies, in turn, gather multiple
works to find common brain regions findings, a consistent approach. Therefore, for the
SAN definition we selected four of the regions reported in an attention-oriented meta-
analysis study (LANGNER; EICKHOFF, 2013).
By the other side, since DMN can be represented by a produced map from the ICA
approach in an individual level, we took advantage of this fact to give the basis to
create individualized DMN masks for the study’s participants, proven to be more
accurate and representative (SOHN et al., 2015, and Chapter 5) – a method extensively
123
reported in the last chapter of this thesis. This method would not work for the
intended attention network, since it could not be represented by a single ICA map.
3.3.6 Experimental design and limitations
We now make critical considerations about some points of our experimental design to
reckon on the used procedures.
Two sessions of training were used in our experiment. Taking an attentive look at
Figures 6-10 (especially the last one), it seems that the ceiling effect was not reached
yet and there would have room for increasing performance (ROBINEAU et al., 2014). A
short number of training sessions is common in the literature (GARRISON et al., 2013;
HARMELECH; FRIEDMAN; MALACH, 2015; MARXEN et al., 2016; SCHEINOST et al.,
2013b; SEPULVEDA et al., 2016; ZHANG et al., 2013), but it appears to be specific to
the brain regions and other features of the study. We conjecture that a training ending
in even higher performances could bring more sensitive consequences to the
experiment.
Attention tests application, designed to check for behavioral effects as results of
neurofeedback training, were not applied in the same day of training sessions, right
after those, as it was made in other experiments (KOUSH et al., 2015; ROTA et al.,
2009; SCHARNOWSKI et al., 2015). This decision was essential to alleviate the strong
fatigue effects induced by both neurofeedback training (which lasted around one hour)
and attention tests battery application (which lasted around 1h30min). It was also
thought that, through this timeline, overnight restoring sleep played a positive role
consolidating learning and contributing to the retention of ability before attending to
the behavioral tests application once again (ROBINEAU et al., 2017). Together with the
functional connectivity findings, the short-term persistence of neurofeedback-induced
behavioral effects could be further explored to be elongated, which are of meaningful
clinic relevance (SCHEINOST et al., 2013b).

124
The duration of regulation blocks was designed to be a mid-term between being short
enough to not become tiresome for the participants’ execution and to contribute also
for a short overall run duration run, which would lead to more data points for analysis,
and being long enough to train not only brain activity engagement, but also its
sustaining, which was thought to have positive consequences for behavioral effects.
Robineau and colleagues have reported that, for a regulation block of 30 seconds,
activity increases were seen only during the first half of the block, returning to baseline
after that. A plateau in brain activity was not observed, but rather a peak and then
decaying. This could reveal that attentional processes used during training would
induce to initial increases in BOLD signal but it is prone to decrease over time, due to
the nature of the task, fatigue or temporal properties of hemodynamic coupling
(ROBINEAU et al., 2014). Anyway, it is not clear whether the regulation training would
have a specific influence either only in attention engagement or also in its sustaining.
Since significant effects were not seen for tasks were retaining attention for longer
periods (such as the ones required for CPT or PVT), one could claim that training to
intentionally regulate attention-related regions for 30-second blocks was not ideal for
a longer time vigilance enhancement, but this direct relationship is hard to be
established and at the moment this question remains unclear. In terms of
neurofeedback designing though, relatively short blocks could also bring a better
perception of the regulation-baseline contrast, leading to a more consistent learning.
Intermittent feedback especially seems to have played an important role in our
experiment, compared to continuous feedback design, eliminating the dual-task
interference, lowering the interference of inherent signal delay, and offering less
fluctuation in exhibited feedback signal (JOHNSON et al., 2012). Mainly for attentional
processes, it is better presenting feedback for appraisal and a period for regulation in
different periods, since evaluating the own performance might be a distractor for the
attention-related regulation and, at the same time, being focused in the employed
strategies would imply in worse feedback appraisal.
A question that may naturally arise is about why neurofeedback based on the
difference between SAN and DMN was implemented, instead of the one based on the
also reported anticorrelation between these two networks, using functional-

125
connectivity-based neurofeedback (RUIZ et al., 2014). Theoretically, it could be
possible to train the sustained attention through the self-regulation of anticorrelation
provided by neurofeedback. If continuous feedback would be presented, sliding-
windows should likely be used and the delay between mental strategies and presented
feedback would be in the order of tens of seconds against seconds for the actually
used differential signal, but this drawback is not a problem for intermittent feedback.
However, neurofeedback based on the networks difference instead of the correlation
is still preferable in our study: measuring correlation is noisier than measuring direct
networks difference, mainly when short temporal windows are used; networks
difference may be a more direct and instant proxy for attention manifestation than the
anticorrelation; and, although the networks are intrinsically anticorrelated, the SAN
and the “task-positive network” (FOX et al., 2005) are not conceptually the same.
In this study, strategies suggestions were provided to the participants, with the
justification of potentially improving the efficiency of learning process and diminishing
the strategies exploration time. Even though it was shown, for a single-region
regulation task based on the motor imagery, that a priori suggested strategies would
not be a necessary feature for neurofeedback experiments (LINDEN et al., 2012;
SEPULVEDA et al., 2016), providing suggestions would shuttle participants straight to
the point which a given function is being considered. We argue that, when no
strategies are suggested and learning is observed, it could reflect that subjects are
finding, by trial and error, what is the function to be trained, rather than improving an
ability. Therefore, the consequences of not giving a priori suggestions would be that
learning results are driven also by a feature of strategies exploration and, once the
correct strategy is found, less time for effectively improving the regulation would be
available. Providing suggestions, by the other hand, take subjects to a not null
performance level in the initial instants of training, but gives neurofeedback the
chance to be used for directly improving a specific ability. However, it also opens a
new question, that cognitive instructions alone could allow subjects to regulate well
and maybe even improve a given ability over time. Answering this question would
signify a control group for which no feedback is provided, not existent in this study.
126
¹ Information provided by Frank Scharnowski, Kymberly Young, and Bettina Sorger in Real-Time Functional Imaging and Neurofeedback Conference, 2017.
Eye-tracker acquisitions would be desired in our experiment, since IPS (SAN4) is
involved in saccadic eye movements (ANDERSEN, 1989) and the participants could,
theoretically, activate this region by constantly moving their eyes during regulation
blocks. This system was available, but, during piloting, it was reported to be
uncomfortable and the sight was out of focus and unsharp, so it was preferred to use
the regular goggles. This can be pointed as a limitation in our study; however, (i)
strategies of moving eyes were not reported and (ii) borderline significance for
differences in this region were observed, while other regions showed more convincing
significance. As a limitation in our study, only one control group (TR group) was
considered, when combining at least two control conditions are recommended to
cover for most relevant confounding factors (verbal information)¹. TR group was of the
type no-training control group, aimed to verify for behavioral effects. The decision of
including a no-training control group came based on the suspicious of practice effects
in Experiment II (to be explained next), since attention tests performance
improvement was detected for the only existent neurofeedback group despite of the
reduced learning rate. Division into best learners and sub-learners arose to a natural
control group, but the reduced sample size must be pondered (SCHARNOWSKI et al.,
2012).

127
4 EXPERIMENT II: FMRI-NEUROFEEDBACK AND ROIS POSITIONING
INFLUENCE
The following chapter describes a study whose data were acquired in Hospital das
Clínicas de Ribeirão Preto and Faculdade de Filosofia, Ciências e Letras de Ribeirão
Preto, both at the University of São Paulo, in Ribeirão Preto, Brazil. The findings
described here paved the way for a revisited study, the so-called Experiment I, as
previously reported in this thesis. Therefore, timewise, it must be made clear here that
Experiment II was realized before Experiment I, but the studies were here reported in
a different arrangement because of relevance reasons.
This work was presented as a poster in the Annual Meeting of the Swiss Society for
Neuroscience, Zürich, Switzerland, 2018; 3rd Real-Time Functional Imaging and
Neurofeedback, Nara, Japan, 2017; 23rd Annual Meeting of the Organization for
Human Brain Mapping (awarded with the Merit Abstract Travel Stipend), Vancouver,
Canada, 2017; ISMRM 25TH Annual Meeting and Exhibition, Honolulu, USA, 2017; 4th
Brainn Congress, Campinas, Brazil, 2017.

128
4.1 METHODOLOGY
4.1.1 Participants
Twelve volunteers (6 woman, 24.8±3.5 years old, range 21.3-30.9 years old) have
participated in this study, being recruited by oral and online advertisement. Exclusion
criteria at recruitment were the same for Experiment I, but also included use of
medicines to treat psychological disorders, insomnia or irregular sleeping diagnosis
and handedness was controlled by the Edinburgh Laterality Questionnaire (score lower
than +50). The study was approved by the ethics committee of Faculdade de Filosofia,
Ciências e Letras de Ribeirão Preto, University of São Paulo, Brazil, technical approval
number 1.096.076, date 06/03/2015. All participants signed a consent term before
applying to the study.
4.1.2 MRI acquisition
All images were acquired in a Philips Achieva 3T MRI scanner and using a 32-channel
head coil at the Clinical Hospital of Ribeirão Preto, at the University of São Paulo.
Functional and anatomical imaging protocols were the same used for Experiment I;
however, due to a different experimental planning, the number of functional volumes
acquired also was altered. Resting-state acquisitions were comprised by 150 scans
(5min) and neurofeedback training and transfer acquisitions, by 240 scans (8min). Due
to technical issues, heart rate and breathing rhythm could not be acquired. Stimuli was
shown on a monitor in front of the scanner, outside the MRI scanner room, and
directed to participants through a mirror attached to a head coil.

129
4.1.3 Experimental design
The experimental timeline for the Experiment II is represented in the Figure 34. The
participant was contacted by mail/phone and the slots for the scanner were reserved.
There was no time interval controlling between first and second days of experiment.
Intervals among second to fifth days of experiment should be as short as possible but
one week maximum and the interval between fifth and sixth days was mandatory to
be in the following morning. There was no monetary compensation for Experiment II.
Also, no follow-up session was conducted for Experiment II and there was only one
experimental group.
Figure 34. Experimental design – Experiment II. A three-day neurofeedback training (blue) was performed, together with evaluations of attention abilities before and after training (red). The intervals between experiment days were one week, but the interval between last training day and last attention assessment was one day. Anatomical and functional images were acquired from the participants in the first day of experiment (green).
In the first day, anatomical and resting-state fMRI were acquired, always after 11 pm.
Also, the Consent Term was read and signed in this day.
In the second day and sixth days of experiment, all of them in the morning (in a time
that was convenient for each one of the participants), the Brunel Mood Scale (BRUMS)
questionnaire was first applied. Then, instructions for attention tests were provided
via slides presentation and, once certifying that the participants understood them,
they were asked to perform the attention tests battery. The battery for the Experiment
II consisted of four attention tests, always in the same order. There were 5-min breaks
between the second and the third tests.

130
In the third, fourth, and fifth days of experiment, the neurofeedback training sessions
were conducted, always after 11pm, the available time at the local Hospital. First the
instructions and strategies to neurofeedback upregulation and downregulation were
provided to the participants via slides presentation. In the third day, we showed the
feedback signal from a big ROI located in motor cortex (based on previous pilot studies
using finger tapping task) in the beginning of the experiment and it was asked them to
constantly tap their left hand fingers against the thumb during 10-s task blocks and to
stop any hand movements during 10-s rest blocks. This initial experiment lasted
1min40s. This brought to every participant a practical understanding of the inherent
hemodynamic response delay (ROBINEAU et al., 2014; SCHARNOWSKI et al., 2012).
After that, still in the third day, one transfer run was performed, followed by three
training runs. In the fourth day, four training feedback runs were performed. In the
fifth day, two training feedback training runs were performed, followed by a transfer
run and a resting-state acquisition. Before and after each training session (pre- and
post-training, respectively), the BRUMS questionnaire was also applied. For these days,
the subjects stayed in the scanner for around 40 minutes.
4.1.4 Real-time fMRI system
The real-time fMRI processing system in Experiment II was the same used in
Experiment I.
However, a crucial difference in the ROIs positioning procedure applies to Experiment
II, which was the main reason why it was conducted sub-optimally. Once properly
positioned in the MRI scanner, the ROIs masks in the MNI space were only
coregistered to the subjects’ space, having as a reference a single functional
acquisition. Instead of following the positioning procedures described for the
Experiment I, an MNI single-subject template image was directly taken to the
functional template space, using SPM 12 registration, and carrying together the ROIs
masks. Therefore, ROIs masks was not optimally matched to the functional templates

131
collected before each training session, because coregistration itself only aligns to a
template but does not apply for non-linear deformations/displacements. Since
normalization should have been used, because it warps source images and considers
non-linear transformations. The consequences of this feature in our study will be
discussed in detail in Results and Discussion sections.
4.1.5 ROI definitions
Figure 35 shows all six selected SAN and DMN ROIs used for Experiment II. As well as in
the Experiment I, SAN ROIs were also defined from a meta-analysis study (LANGNER;
EICKHOFF, 2013) and DMN ROIs were also individualized using the same procedures,
but the some of the chosen regions were different.
Figure 35. Axial slices showing selected SAN (blue) and DMN (red) ROIs for Experiment II (above). Table shows centers-of-mass MNI xyz coordinates for SAN ROIs together with their AAL labels (below); DMN ROIs were individualized to each participant.

132
In order to have a balance between spatial variability covering and precision, 6-mm-
radius spherical ROIs were used to represent both SAN and DMN, centered in the
centers-of-mass of the clusters reported in the meta-analysis study. SAN1 was
coincident for both Experiments, but SAN2 and SAN3 were different regions. SAN
region selection criteria were mainly dependent on cluster size for Experiment II.
DMN4, the right angular gyrus ROI representant in Experiment I, was not included in
Experiment II. All ROIs were also exported to a binary mask to be later trained through
fMRI neurofeedback. Figure 35 also shows centers-of-mass MNI xyz coordinates for
SAN ROIs together with their Automated Anatomical Labeling (AAL) labels; on the
other hand, DMN ROIs were individualized for every subject thus did not a fixed
center-of-mass for the group. SAN1 center-of-mass was placed mainly quite close of
the inter-hemispheric fissure (MNI coordinates 2, 14, 49) and it was displaced two
millimeters to be more probable to represent a cortical region.
SAN 2 (labeled as cluster 3 in LANGNER & EICKHOFF (2013)) includes the anterior
insula, that signalizes the necessity of investing in attentive effort to ease the signal
particularly under challenging circumstances, such as increased timing during task. As
well as the mACC (SAN1), anterior insula was reported to be a core for human task-set
system, exhibiting start-cue and sustained activity (DOSENBACH et al., 2006). Anterior
insula is also thought to be involved in switching central executive and default mode
networks, which would trigger the suppression of the periodic intrusions, driving to a
higher sustained attention state (LANGNER; EICKHOFF, 2013).
SAN 3 (labeled as cluster 4 in LANGNER & EICKHOFF (2013)) includes midlateral
prefrontal cortex (mLPFC), which relates to continuous monitoring of relevant external
events, and it is especially important for longer sustained attention maintenance and
unpredictable stimuli onsets. This monitoring is required independently on the nature
of the attentional task and may be even more demanding in the absence of overt
response (LANGNER; EICKHOFF, 2013).
Individualization of DMN regions for Experiment II was made in the same way that
Experiment I, except by the individual ROIs placement. First, through a group ICA
analysis using resting-state fMRI from the local laboratory’s database, 41 healthy
subjects (right-handed, between 18 and 40 years old, 24 women) were used to find the
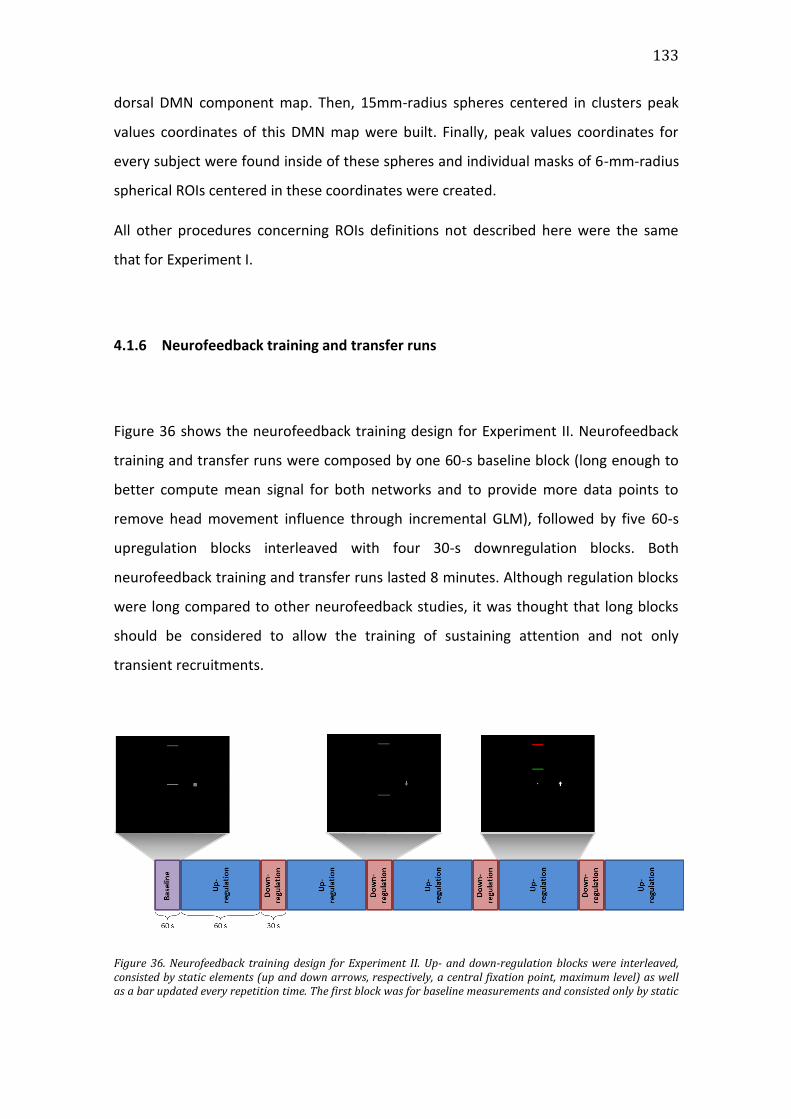
133
dorsal DMN component map. Then, 15mm-radius spheres centered in clusters peak
values coordinates of this DMN map were built. Finally, peak values coordinates for
every subject were found inside of these spheres and individual masks of 6-mm-radius
spherical ROIs centered in these coordinates were created.
All other procedures concerning ROIs definitions not described here were the same
that for Experiment I.
4.1.6 Neurofeedback training and transfer runs
Figure 36 shows the neurofeedback training design for Experiment II. Neurofeedback
training and transfer runs were composed by one 60-s baseline block (long enough to
better compute mean signal for both networks and to provide more data points to
remove head movement influence through incremental GLM), followed by five 60-s
upregulation blocks interleaved with four 30-s downregulation blocks. Both
neurofeedback training and transfer runs lasted 8 minutes. Although regulation blocks
were long compared to other neurofeedback studies, it was thought that long blocks
should be considered to allow the training of sustaining attention and not only
transient recruitments.
Figure 36. Neurofeedback training design for Experiment II. Up- and down-regulation blocks were interleaved, consisted by static elements (up and down arrows, respectively, a central fixation point, maximum level) as well as a bar updated every repetition time. The first block was for baseline measurements and consisted only by static

134
elements. Up-regulation blocks screens were colored while down-regulation and baseline blocks screens were black and gray. Up-regulation and baseline blocks lasted 60 s and down-regulation blocks lasted 30 s.
Participants received oral and visual instructions (via PowerPoint presentation) of how
to proceed during the neurofeedback training session.
Provided feedback in this experiment was continuous, i.e. updated every time of
repetition. Even though it provides a higher real-time experience, dual-task
interference is present and subjects need to be aware that what they see is delayed
because of the time of repetition and the hemodynamic response delay.
For the baseline block (only the first block), a static black screen with two horizontal
bars and a square in gray-scale was shown (Fig. 36). The similarity to up- and down-
regulation blocks stimuli was intended, which would avoid big differences between
baseline and regulation blocks. During the period, participants received the following
instruction: “During this first period, you do not need to do anything. Just get relaxed.”
During upregulation blocks, feedback was composed by a green horizontal bar on a
black background moving proportionally to the differential signal change SAN minus
DMN updated to every volume. Also, a red horizontal bar indicating the highest level
to be reached, as well as a white up-arrow aside to better indicate up-regulation, and a
white point of fixation on the middle were shown. Similar strategies to the ones given
in Experiment I were used here.
During down-regulation blocks, the same updating feedback was shown, but all in
gray-scale and with the arrow pointing down (Fig. 36). The following strategies were
provided for this period:
● Remember personal past memories.
● Stimulate thinking in future situations.
● Just keep relaxed, rambling freely and abandoning strategies to take the bar
up.
Transfer runs were also acquired in Experiment II. Right before the first training run
(third day) and right after the last training run (fifth day), runs were acquired with no
feedback but with the words “REPOUSO” (rest, in Portuguese), to indicate the baseline

135
block, “PARA CIMA” (up), indicating up-regulation period, and “PARA BAIXO” (down),
indicating down-regulation period. Transfer runs instructions were the same as those
of Experiment I.
4.1.7 Feedback calculation
Same real-time processing steps for Experiment I were done, except by the following:
● Instead of extracting the signal separately from individual ROIs, the average
signal from each network (SAN and DMN) was computed.
● AR(1) correction was not performed.
● The linear trend was not removed from data using incremental GLM.
● Normalized signal and superior and inferior limits were computed for each
network, not to every ROI. The computation followed the same criteria for
Experiment I, except by being more adaptive, since the computation was
concerning a sliding window of one cycle (45 volumes).
● As previously explained, there was only one baseline block in the run, other
blocks were up- and down-regulation. Therefore, baseline ROIs values could
not get updated over blocks for Experiment I, making it more susceptible to
drifting effects. Because of this, baseline block duration was also longer for
better characterization.
● Because feedback in Experiment II was of the continuous type, it was updated
for every volume, that is
𝐹𝑖 = 𝑛𝑠𝑐𝑆𝐴𝑁 − 𝑛𝑠𝑐𝐷𝑀𝑁 ,
in which 𝑖 is the current volume and 𝑛𝑠𝑐 is the normalized signal change for
each ROI sets.
● Since no money reward relative to performance in the run was offered, its
computation was not made.

136
4.1.8 Self-report and subjective ratings
Same self-report questions described for Experiment I were made also for Experiment
II.
However, right before and right after each session neurofeedback training (third to
fifth days), another questionnaire, the BRUMS humor scale, was applied to assess
levels of tension, depression, anger, fatigue, confusion, and vigor. This is an
abbreviated scale developed to allow a fast measurement of humor states (ROHLFS et
al., 2008).
4.1.9 Behavioral tests
Before and after neurofeedback training days, in the second and the sixth days of
experiment (Fig. 34), attention performances from every participant were examined
via a battery of four attention tests outside the scanner, instead of five tests, three of
them also used for Experiment I. Attention tests were the following: CPT, Switcher,
PVT, and Stroop, all of them using the PEBL software (MUELLER; PIPER, 2014). PVT was
different for this experiment by showing a navy-blue stimulus instead of red.
Tests were applied in a reserved room, which was always with the lights off and
temperature was kept constant with an air conditioner. Other parameters were the
same for Experiment I. Instructions were given via PowerPoint presentation.
Here is a description about Stroop test. This test shows several words, once at a time,
with different font colors in a gray screen. The participant always has to indicate the
font color. There are three possible cases in this test: (1) congruent, in which the font
color is the same as the exhibited word; (2) incongruent, in which the font color is
different of the exhibited word, a different color; and (3) neutral, in which the
exhibited words are not colors. Four font colors were shown: yellow, green, red, and
blue and participants must indicate those with keys 1, 2, 3, and 4, respectively.
137
Possible measurements to be extracted were accuracy and reaction times for
congruent, incongruent, and neutral conditions. This test involves inhibitory control,
but also activation of the right task schema and response, represented by aMCC and
anterior insula, amongst other regions (CIESLIK et al., 2015).
4.1.10 Offline analysis
Same procedures reported in Experiment I were used for Experiment II concerning
functional connectivity analysis, except by the fact different ROIs were used for ROI-to-
ROI analysis and seed-to-voxel analysis was not performed.
4.2 RESULTS
4.2.1 ROI activation analysis
Since ROIs positioning for neurofeedback training was suboptimal for Experiment II,
the focus of this study is mainly on regulation performance for the provided ROIs and
not for ROIs were supposed to have used. We show, therefore, in Figures 37 and 38,
Pearson correlation values between time-courses we obtained from provided, albeit
suboptimal, ROIs and time-courses from the expected model, built with a boxcar
function of the onsets and durations of blocks used in the experiment convolved with
a hemodynamic response function using SPM standard parameters.

138
Figure 37. Performance betas regarding the differential signal SAN minus DMN (above), average SAN (below, left), and average DMN (below, right) for last training runs and last transfer runs. Asterisks indicates performance betas different of zero.
Figure 38. Performance betas for differential NF across runs (left) and transfer runs (right) for online analysis (Experiment II). The asterisk shows a significant difference across days.
Figure 37 shows that, considering all subjects, performance betas for the contrast
upregulation vs downregulation in last training run were higher than zero, according to
a two-tailed one-sample t-test (mean=0.21, p=0.016), but no significant differences
were found for isolated SAN or DMN regulation (SAN: mean=0.18, p=0.11; DMN:
mean=0.07, p=0.26). Also, performance betas for the same contrast show that
regulation capability for the last transfer run were higher than zero, according to a
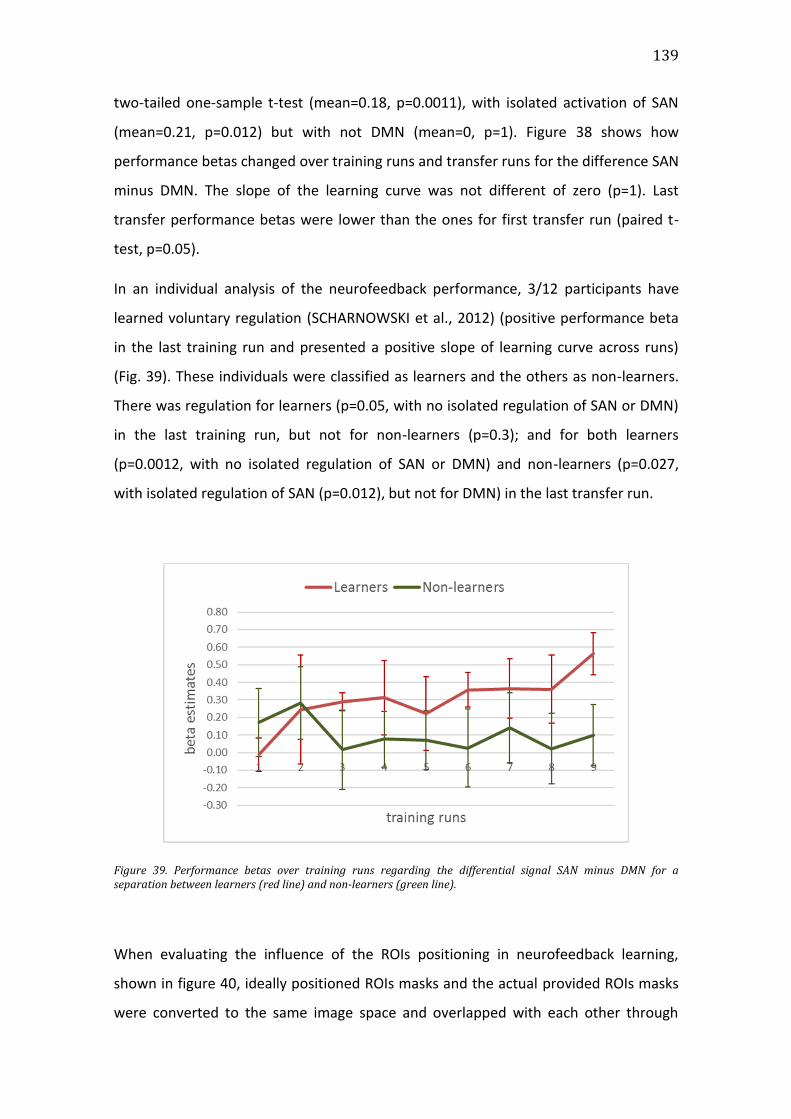
139
two-tailed one-sample t-test (mean=0.18, p=0.0011), with isolated activation of SAN
(mean=0.21, p=0.012) but with not DMN (mean=0, p=1). Figure 38 shows how
performance betas changed over training runs and transfer runs for the difference SAN
minus DMN. The slope of the learning curve was not different of zero (p=1). Last
transfer performance betas were lower than the ones for first transfer run (paired t-
test, p=0.05).
In an individual analysis of the neurofeedback performance, 3/12 participants have
learned voluntary regulation (SCHARNOWSKI et al., 2012) (positive performance beta
in the last training run and presented a positive slope of learning curve across runs)
(Fig. 39). These individuals were classified as learners and the others as non-learners.
There was regulation for learners (p=0.05, with no isolated regulation of SAN or DMN)
in the last training run, but not for non-learners (p=0.3); and for both learners
(p=0.0012, with no isolated regulation of SAN or DMN) and non-learners (p=0.027,
with isolated regulation of SAN (p=0.012), but not for DMN) in the last transfer run.
Figure 39. Performance betas over training runs regarding the differential signal SAN minus DMN for a separation between learners (red line) and non-learners (green line).
When evaluating the influence of the ROIs positioning in neurofeedback learning,
shown in figure 40, ideally positioned ROIs masks and the actual provided ROIs masks
were converted to the same image space and overlapped with each other through

140
customized MATLAB codes and SPM 12. The percentage of overlapping is regarding
the number of common voxels in two ROIs compared to the original ROI size.
Figure 40. Graph showing the relationship between slope of learning curve and index of networks overlapping of masks provided and mask that should be ideally provided (above). The correlation slope of learning curve and index of overlapping is significant for SAN (blue), but not for DMN (red). Regarding individual ROIs in these networks, the table shows in which each regions the average overlapping was higher for learners (purple).
Figure 40 shows that there was a significant correlation between SAN ROIs slope over
training runs and the overlapping of these ROIs to the ones that were supposed to be
provided if the coregistration was not suboptimal (right, blue, Kendall-tau = 0.67, p <
0.001). No significant correlation for the same analysis was found for DMN (right, red,
p = 0.7). According to a two-sample t-test, the average overlapping is compared for
learners and non-learners, which were statistically significant higher for learners for
SAN2, SAN3, and DMN2.

141
4.2.2 Behavioral effects
Figure S6 shows attention tests results for the experiment II. Since the number of
learners was quite small for the Experiment II (n=3), differences between attention
scores were analyzed only for all subjects together, no separation between learners
and non-learners was considered. As an overview, there was a trend of reaction times
to be faster and accuracy to be higher for the second application compared to the first
one. Significant differences are indicated by asterisks for two-tailed paired t-tests for
uncorrected p-values < 0.05.
4.2.3 Strategies and questionnaires
Through Pearson correlations between individuals’ performance over days and
matching self-reports and according to one-sample t-tests, it was found that there
were relationships between performance and the reported scores: self-evaluation of
control of the neurofeedback (unc. p = 0.00029), difficulty in the task (unc. p = 0.008),
and self-evaluation of degree of concentration applied (unc. p = 0.008), reported in
figure 41.

142
Figure 41. Average of Pearson correlations across subjects between self-report scores (control, difficulty, and concentration) and estimated betas of performance for Experiment II.
Participants have adopted a range of strategies to control the feedback signal.
Considering learners in last training run, most successful strategies were, for
upregulation, following feedback bar with the eyes, thinking that the eyes were a kind
of a lever, imagery of driving a car, alertness state in relation to feedback movements,
focusing/concentration, imagery of bar going up.; and for downregulation, imagery of
daily life situations such as to be with family members, mind-wandering, recalling past
thoughts, visual fixation outside the screen, refraining from specific thoughts.
Concerning BRUMS questionnaires, considering all participants, tension and confusion
levels increased (one-sample t-tests, unc. p = 0.04 and unc. p = 0.021, respectively)
after neurofeedback training compared to before. Considering learners and non-
learners separately, there was an increase only for confusion for non-learners (unc. p =
0.020).
After first day of neurofeedback training, considering all participants, fatigue levels
increased (one-sample t-tests, unc. p = 0.001) and vigor levels decreased (unc. p =
0.04); considering learners and non-learners separately, there was vigor level
decreasing only for non-learners (unc. p = 0.003). After second day of neurofeedback
training, considering all participants, fatigue levels increased (unc. p = 0.00019) and
vigor levels decreased (unc. p = 0.0004); considering learners and non-learners
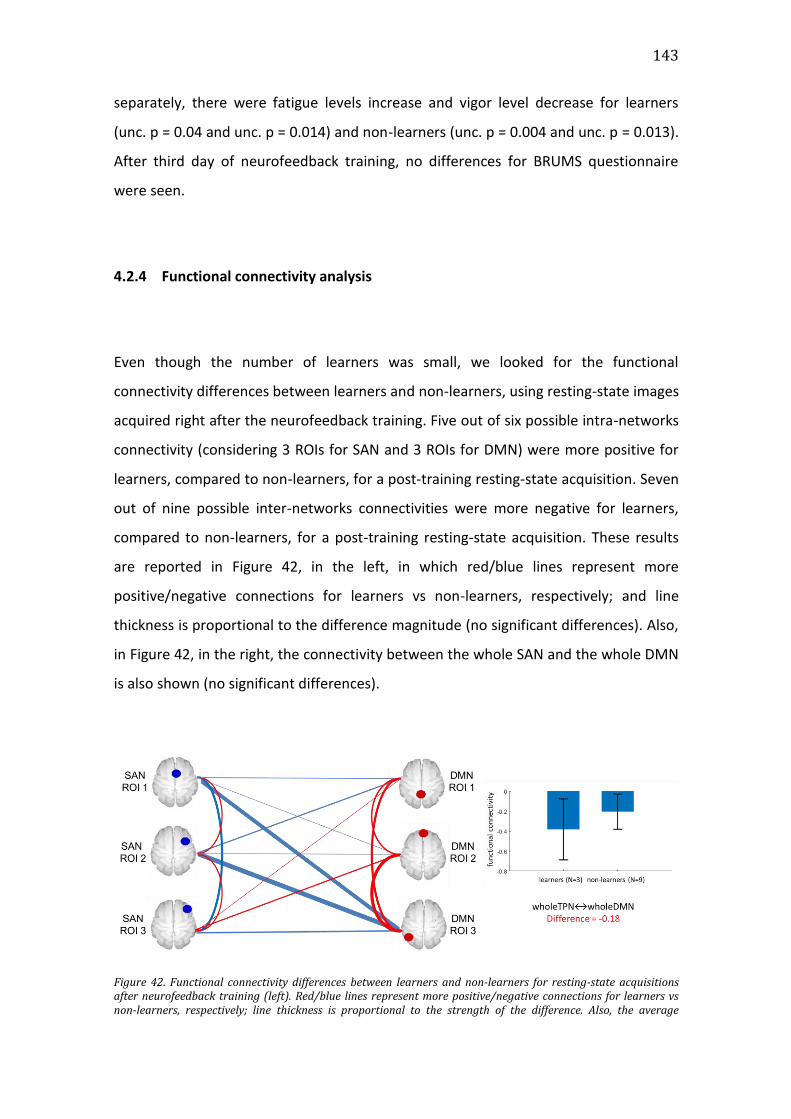
143
separately, there were fatigue levels increase and vigor level decrease for learners
(unc. p = 0.04 and unc. p = 0.014) and non-learners (unc. p = 0.004 and unc. p = 0.013).
After third day of neurofeedback training, no differences for BRUMS questionnaire
were seen.
4.2.4 Functional connectivity analysis
Even though the number of learners was small, we looked for the functional
connectivity differences between learners and non-learners, using resting-state images
acquired right after the neurofeedback training. Five out of six possible intra-networks
connectivity (considering 3 ROIs for SAN and 3 ROIs for DMN) were more positive for
learners, compared to non-learners, for a post-training resting-state acquisition. Seven
out of nine possible inter-networks connectivities were more negative for learners,
compared to non-learners, for a post-training resting-state acquisition. These results
are reported in Figure 42, in the left, in which red/blue lines represent more
positive/negative connections for learners vs non-learners, respectively; and line
thickness is proportional to the difference magnitude (no significant differences). Also,
in Figure 42, in the right, the connectivity between the whole SAN and the whole DMN
is also shown (no significant differences).
Figure 42. Functional connectivity differences between learners and non-learners for resting-state acquisitions after neurofeedback training (left). Red/blue lines represent more positive/negative connections for learners vs non-learners, respectively; line thickness is proportional to the strength of the difference. Also, the average

144
anticorrelation between SAN and DMN as a whole for learners and non-learners after training is also reported (right).
4.3 DISCUSSION
We would like to stress, once again, that Experiment II, the one to be discussed here,
was conducted before Experiment I. That is why so many instances of Experiment II
were reviewed and optimized before planning Experiment I. The order reported here is
in terms of importance and relevance of the results.
4.3.1 Neurofeedback training
Considering all subjects, there was regulation capability observed in the last training
run (Fig. 37). Splitting apart SAN and DMN, no significant activations in either SAN or
DMN separately were observed. It is worth noting that this differential successful self-
regulation was obtained even using a sub-optimal system (as reported in section 4.2).
From this paragraph onwards, the measures considered for analysis are the ones
obtained online, since the coregistration was suboptimal and we want to evaluate the
signals as they were presented as feedback, not the ones based on intended ROIs, in
order to study the neurofeedback process. Performance betas are given in terms of
correlations between online neurofeedback time-course signals and the expected
time-course, based on a hemodynamic model.
Regarding the last transfer run, there was also significant regulation capability of the
differential signal, with significant isolated regulation of SAN but with no significant
regulation of DMN. The reason why there was more SAN activation and more DMN
deactivation only for transfer runs and not for training runs seems to be related to
dual-task interference caused by continuous feedback displaying. Subjects during
145
neurofeedback training were constantly being distracted by the moving bar, while
trying to get focused on the task, making SAN and DMN to behave differently from
what it was expected.
Considering all the participants together, no learning effects due to neurofeedback
training were detected and performance in first transfer run was better than in last
transfer run for Experiment II (Fig. 28). Many reasons could explain these negative
results but, besides of the already mentioned sub-optimal coregistration and the dual-
task interference issues, we also highlight another caveat present in our methodology,
mainly noticed for the worse performance in last transfer run compared to first: the
huge fatigue effect experienced by the participants. Likewise Experiment I, in which it
was reported that transfer effects could have been smoothed by comparing a last
transfer run after many training runs to a first transfer run performed in the beginning
in the acquisition, the same experiment design was used for Experiment II and the
fatigue effects must have been even stronger. As reported in section 4.1.3, this
experiment was conducted always late in the evening, and the participants’ general
attention function must have weakened at this time, leading to worse performance
values.
Self-report scores (Fig. 41) show that, although the experimental conditions were not
the best and they should be improved to be applied to Experiment I, subjects’
experience during this real-time system were still somehow faithful to what it was
being shown as feedback. In the average, subjects reported to domain the control over
the feedback. Also, as reported for Experiment I, the better the performance, the
easier it was for the participants to control the bar, reflecting the process of finding
the right strategy to be used. In addition, self-report concentration was correlated to
performance, which makes the connection between the function to be studied and the
brain regions provided for neurofeedback training.
Self-reported strategies are also indicators of the association brain function/feedback
control, giving to the system a degree of reliability. For up-regulation, some of the
strategies used were related to SAN activation or to a broad attention function, such
as an alertness state, focusing, concentration, and imagery of driving a car. Some
strategies for down-regulation were related to DMN activation, like mind-wandering,

146
recalling of past memories, imagery of daily life situations, and imagery of being with
family members.
Since feedback was not completely but somehow faithful to participants’ experience,
some of them could actually take advantage of the system to use it as a brain activity
measurer and even to learn brain regulation, although few of them compared to the
overall number (here, only 25% of participants were classified as learners). Therefore,
investigating this division into learners and non-learners could bring precious
information, as described next.
Participants who were less affected by the erroneous displacement of the ROIs during
training learned better, as shown in the association for the overlapping of provided
ROIs with the intended ROIs and slope of learning curve for SAN (Fig. 40). In summary,
learners had better positioned individual ROIs. It is clear thus that accurate ROI
placement is crucial for successful neurofeedback training and this is the main
message of Experiment II.
Despite the suboptimal neurofeedback training design and ROI definition of
Experiment II, some participants were still able to learn the regulation of the
differential activity, particularly those that were less affected by the displacement.
These preliminary findings corroborated to design and plan a similar experiment using
improved training conditions (i.e. correct ROI placement, intermittent feedback,
monetary incentives etc.), which was already described here as Experiment I.
Moreover, the importance of correct ROIs positioning and representation will be still
further emphasized here in the last chapter of the thesis, besides of proposing a tool
to help defining them.
4.3.2 Behavioral effects
Given that scores differences were found for multiple attention tests comparing post-
to pre-training applications (Fig. S6) and the rate of learners for Experiment II was
quite low, there were enough evidences to consider that practice effects were present

147
during these attention tests applications. It was then reasonable to use a test-retest
group in Experiment I to consider the changes on top of the practice effects.
Regarding the questionnaire BRUMS applied, levels of fatigue increase and levels of
vigor decrease after neurofeedback training, indicating that the training was mentally
demanding for the participants; but it was more observed for non-learners, probably
because motivational effects caused by successful regulation might have compensated
tiredness during the experiment. Also, levels of confusion increased, mainly for non-
learners, a direct consequence of unsuccessful training.
4.3.3 Connectivity results
Despite the ROI displacement, we found trends of increased within-network
correlations and decreased between-network correlations during resting-state data
acquisition for learners, as compared to non-learners, for post-training resting-state. A
trend for increased anticorrelation between SAN and DMN for learners was also
observed when considering the SAN and DMN as a whole.
A higher proportion of increased within-network connectivity and increased between-
network anticorrelation is concordant with the assumption of higher dissociation of
the competition SAN/DMN post-training and this subtle finding gave the basis for the
search of connectivity differences during post-training resting-state, as pointed in
Experiment I.
4.3.4 Experimental design
Besides of the suboptimal ROIs definition, there were other features that might have
impaired results and that were redesigned for Experiment I. With regard to fatigue
effects, which is a factor that would likely take down engagement levels, the

148
participants for this experiment were submitted to long regulation blocks (1 min), to
sessions conducted late night (always at 11 pm or later), and to a lack of incentive (no
monetary reward). Moreover, the monitor showing feedback was far away from the
participants’ sight and they had to somewhat squint to watch the screen, possibly
tiring the eyes and decreasing engagement. Instructions were provided in an oral
format and, even trying to avoid, there were differences of eloquence when
instructing. As it was described in the section 4.1.7, the scaling system was too
adaptive, making regulation experience less realistic. Continuous feedback, instead of
intermittent, was first justified in terms of interest and engagement to the task, but it
contained the so-called dual-task interference and might have also disturbed
performance by provoking constant distractions.
Connectivity results counted on only a few learners and the control of the time interval
between post- and pre-training resting-state acquisitions was less strict than for
Experiment I, increasing the likelihood of producing spurious results. Also, resting-state
data was performed after a whole session of neurofeedback runs (unlike Experiment I),
as well as the last transfer run (likewise Experiment I), and fatigue effects must have
also blurred results for these analyses.
149
5 PERSONODE: A NEW TOOLBOX FOR ICA COMPONENT
CLASSIFICATION AND INDIVIDUALIZED ROI DEFINITION
This chapter is related to the implementation of an open-source toolbox, useful for ICA
component classification into RSNs and ROI individualization, shown to provide better
results for task-induced activation parameters extraction and functional connectivity
analysis.
This work was presented as a poster in the 24th Annual Meeting of the Organization
for Human Brain Mapping, Singapore, Singapore, 2018, and recently submitted to
Human Brain Mapping Journal (Manuscript ID: HBM-18-0719).
5.1 INTRODUCTION
Most of the studies in fMRI involve brain mapping, spatially translating behaviors or
functions and disentangling interactions among distinct brain regions. Therefore,
measured signals’ spatial origin must be specific and reliable among subjects, which
could be tricky when a priori brain regions definitions are used, like the ones based on
anatomical atlases, single-studies coordinates, or non-specific clusters. Moreover, it
has been shown that inter-individual differences are present in fMRI studies (AYDIN et

150
al., 2009; FINN et al., 2015; TERRIBILLI et al., 2011); Methodologies using the same
brain regions for all subjects are sub-optimal, since they do not consider variability
among subjects, therefore, extracted signals from these regions could contain
undesired voxels influence and exclude information from functionally relevant voxels
(GOLESTANI; GOODYEAR, 2011). Consequently, functionally speaking, the node
defined might not be accurately representative of a given brain region (SHEN et al.,
2013).
The notable cortical anatomy and functional localization variability makes regions
identification challenging in different brains. Even a small variation in a brain region
position could potentially modify functional patterns (LIU, 2011), in terms of task-
related activation or connectivity studies. The former is often analyzed thresholding
whole-brain statistical maps, but in some cases analyses in a specific brain region are
performed for data exploration, to limit the number of statistical tests, or to check a
given information in a functionally defined region (POLDRACK, 2007). As for the
connectivity studies, ROIs are primarily selected to provide the structural contours for
signals extraction in analyses considering either individual brains or across populations
(LIU, 2011).
Despite the difficulty in reliably and individually defining ROIs, resting-state fMRI data
are, in contrast to task fMRI, easier to acquire and contain precious subject-specific
information. Even in the absence of a task, networks’ spatial patterns are reproducible
and associated with different functions (DAMOISEAUX et al., 2006). Since they can be
detected even in a resting mode, these networks are often called RSN and, even
though comprised by anatomically separated regions, these networks are connected in
order to jointly and continuously support a given function (SMITH et al., 2009).
RSNs can be consistently extracted using ICA (BECKMANN et al., 2005; DAMOISEAUX et
al., 2006) which simultaneously decompose fMRI data into multiple, coherent
networks. The approach also offers the advantage of being model-free, i.e., it does not
require whether a priori hypotheses, predefined ROIs, or copious user initialization.
Examples of RSNs reflecting brain functions that can be found through this technique,
are motor, visual and auditory processing, attention, memory, and default mode
networks (DAMOISEAUX et al., 2006). As a necessary step for the interpretation of
151
functional connectivity analyses, ICA maps need to be classified in canonical RSNs to
be related to a function. This can be a difficult and time-consuming process because
multiple components can be associated to multiple RSNs. However, once ICA maps are
linked to RSNs and because they exhibit reliable individual-level information, they can
thus be used to define the subject-specific information to define ROIs, which have
been shown to improve resting-state analyses (SOHN et al., 2015).
Here, we present Personode (publicly available in www.nitrc.org/projects/personode),
a user-friendly, open-source MATLAB toolbox that semi-automatically guides through
ICA component classification into RSNs, alleviating the selection, and allows the robust
definition of either group- or subject-specific ROIs derived from RSN, which could
make network analysis more accurate and individually specific. Endorsing its
applicability, in this study we verified that the tool produces higher activations than
ROIs based on single-studies coordinates or meta-analysis studies for expected regions
in a task-related activation analysis and more accurate correlation values (either
positive or negative) than clusters belonging to an atlas for expected interactions
among networks in a resting state functional connectivity analysis.
5.2 METHODS
5.2.1 Personode procedure
5.2.1.1 Input files
Personode relies on ICA to define ROIs either at the group-level or at the subject-level.
After ICA analysis (for instance, using the GIFT toolbox for MATLAB) creating group or
individual files, MNI-normalized ICA z-score maps can be loaded in Personode’s using a
GUI (Fig. 43A). Before running Personode’s analysis, input ICA maps can be viewed and

152
checked in the toolbox interface. A flowchart illustrating Personode’s process is shown
in Figure 44.
Figure 43. (A) Personode toolbox interface. Diverse aspects of the toolbox usage can be altered through a GUI, as the input files, whether group file will be specified or not, which templates will be classified, option for automatic coregistration of ICA components to MNI space, additional information about ROI definition, and masks files to be with nodes labeled as an individual nodes or as whole network. (B) Classification step. Ordered by the most probable associations in terms of spatial correlation to the templates, the three most probable ICA components are shown to be chosen by the user at a time as the correct RSN, together with a value of probability related to it. Currently, up to 21 different RSN can be classified by the toolbox. (C) Personalized ROI definition. Nifti mask files

153
are created with the spherical ROIs, together with a text file containing information about the z-peak value where the ROI is centered, “real-world” and MNI coordinates, and RSN names.
Figure 44. Flowchart of Personode processing, including the selection of input files, classification of components, definition of ROIs, and generating the output.
5.2.1.2 Component classification
Firstly, components derived by ICA approach need to be classified as RSNs. To help in
this process, Personode guides users in a semi-manual networks classification using a
probabilistic approach after setting up the inputs. The degree of probability for each
component to be classified is computed via spatial-correlation-based comparison to a
RSN template (Fig. 43B) created from resting-state data of 5000 subjects of the UK
Biobank dataset (MILLER et al., 2016). A set of 25 components in the MNI space were
derived with an ICA approach. Based on previous reports (BECKMANN et al., 2005;

154
DAMOISEAUX et al., 2006; SEELEY et al., 2007; SMITH et al., 2009; VEER et al., 2010),
21 of these components were visually identified as anatomically and functionally
relevant RSNs and assigned a label according to the literature. The other four
components were considered to be related to head motion and physiological noise.
Correlation values among all RSN maps of the template and all input components are
converted to a similarity index, obtained by dividing the correlation value between an
input component and a RSN component of the template by the sum of all possible
positive correlation values between the concerned RSN template map and all the yet
not classified components. All correlation values are converted to this similarity index
by following the same process and these numbers are multiplied by 100 to represent
probability. Components are then ordered according to their similarity indices and the
difference between first and second highest indices for each RSN template maps is
computed. If initially specified by the user that more than one RSN will be considered
for classification, the first manual selection screen shown will be the one that shows
the RSN template map that generated the highest difference and up to the three most
probable components of the input data (according to the number of components yet
to be classified), together with their corresponding probability values. The user can
then select the most representative map for the specific RSN map in the template.
After an association is selected by the user, this component is taken out of the set and
the probabilities are computed again, iteratively, until all previously specified RSN are
classified. Associations template-component can also be skipped by the user to be
defined afterwards. Group-level components input is required for classification, since
they reflect RSN more robustly and less noisy than individual maps.
5.2.1.3 ROIs definition
After components classification, Personode then proceeds to the ROIs definition step,
which uses clusters from each selected RSN template to spatially limit individual ROIs
definition. These clusters were created by taking the UKBiobank RSN templates and
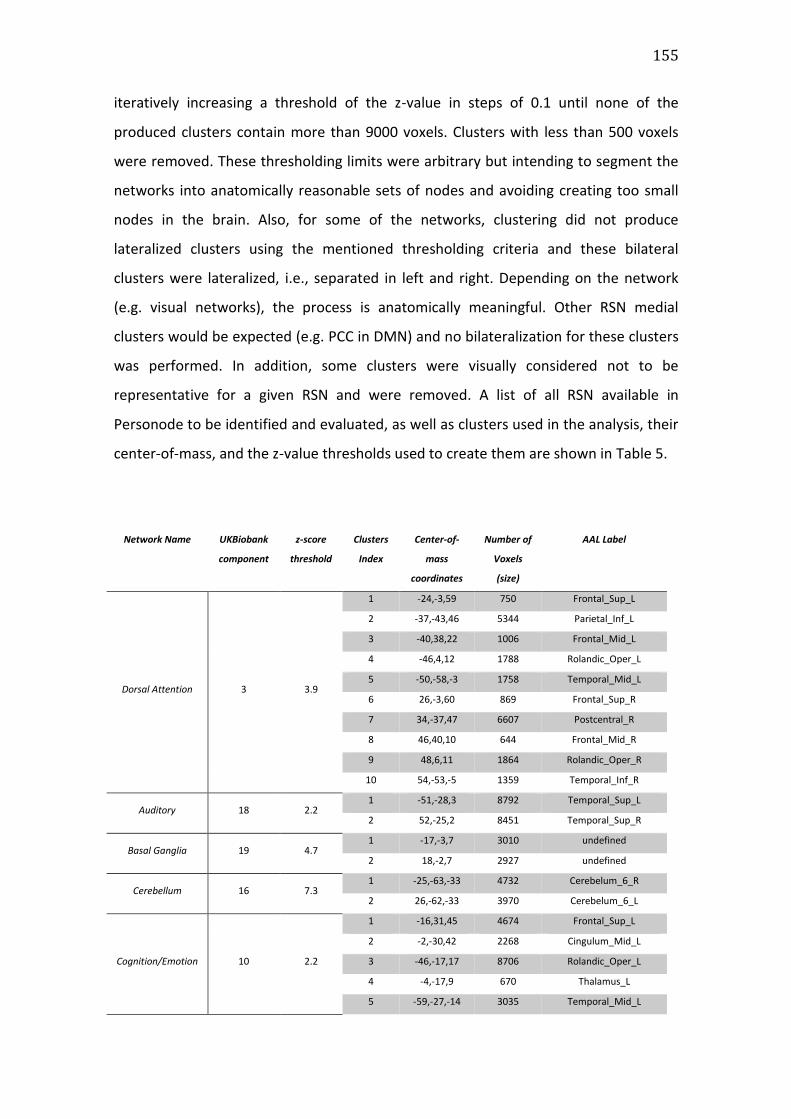
155
iteratively increasing a threshold of the z-value in steps of 0.1 until none of the
produced clusters contain more than 9000 voxels. Clusters with less than 500 voxels
were removed. These thresholding limits were arbitrary but intending to segment the
networks into anatomically reasonable sets of nodes and avoiding creating too small
nodes in the brain. Also, for some of the networks, clustering did not produce
lateralized clusters using the mentioned thresholding criteria and these bilateral
clusters were lateralized, i.e., separated in left and right. Depending on the network
(e.g. visual networks), the process is anatomically meaningful. Other RSN medial
clusters would be expected (e.g. PCC in DMN) and no bilateralization for these clusters
was performed. In addition, some clusters were visually considered not to be
representative for a given RSN and were removed. A list of all RSN available in
Personode to be identified and evaluated, as well as clusters used in the analysis, their
center-of-mass, and the z-value thresholds used to create them are shown in Table 5.
Network Name UKBiobank
component
z-score
threshold
Clusters
Index
Center-of-
mass
coordinates
Number of
Voxels
(size)
AAL Label
Dorsal Attention 3 3.9
1 -24,-3,59 750 Frontal_Sup_L
2 -37,-43,46 5344 Parietal_Inf_L
3 -40,38,22 1006 Frontal_Mid_L
4 -46,4,12 1788 Rolandic_Oper_L
5 -50,-58,-3 1758 Temporal_Mid_L
6 26,-3,60 869 Frontal_Sup_R
7 34,-37,47 6607 Postcentral_R
8 46,40,10 644 Frontal_Mid_R
9 48,6,11 1864 Rolandic_Oper_R
10 54,-53,-5 1359 Temporal_Inf_R
Auditory 18 2.2 1 -51,-28,3 8792 Temporal_Sup_L
2 52,-25,2 8451 Temporal_Sup_R
Basal Ganglia 19 4.7 1 -17,-3,7 3010 undefined
2 18,-2,7 2927 undefined
Cerebellum 16 7.3 1 -25,-63,-33 4732 Cerebelum_6_R
2 26,-62,-33 3970 Cerebelum_6_L
Cognition/Emotion 10 2.2
1 -16,31,45 4674 Frontal_Sup_L
2 -2,-30,42 2268 Cingulum_Mid_L
3 -46,-17,17 8706 Rolandic_Oper_L
4 -4,-17,9 670 Thalamus_L
5 -59,-27,-14 3035 Temporal_Mid_L

156
6 42,23,44 583 Frontal_Mid_R
7 51,-19,19 5414 Rolandic_Oper_R
8 62,-21,-15 1448 Temporal_Mid_R
Default Mode,
Dorsal/Posterior 1 3.1
1 0,-54,30 2668 Cingulum_Post_L
2 -1,48,23 8809 Frontal_Sup_Medial_L
3 -29,-76,-34 2394 Cerebelum_Crus1_L
4 -46,-65,33 1189 Angular_L
5 -57,-6,-21 1907 Temporal_Mid_L
6 1,-54,-45 518 Cerebelum_9_R
7 30,-75,-34 2733 Cerebelum_Crus1_R
8 51,-60,31 821 Angular_R
9 57,-2,-23 1594 Temporal_Mid_R
Default Mode,
Medial 8 3.7
1 -23,-46,-45 776 Cerebelum_9_L
2 -25,17,51 1752 Frontal_Mid_L
3 -2,-50,21 9000 Cingulum_Post_L
4 -41,-72,27 2178 Occipital_Mid_L
5 24,-46,-44 865 Cerebelum_8_R
6 27,21,49 1407 Frontal_Sup_R
7 48,-62,26 2669 Angular_R
Executive Control 17 3.2
1 0, 35, 24 2436 Cingulum_Ant_L
2 -1,-49,51 1486 Precuneus_L
3 -28,37,29 6045 Frontal_Mid_L
4 28,39,31 5181 Frontal_Mid_R
5 41,-61,-37 1910 Cerebelum_Crus1_R
6 -42,-60,-37 1297 Cerebelum_Crus1_L
Frontoparietal, Left 7 3.7
1 -2,29,45 959 Frontal_Sup_Medial_L
2 -36,-59,45 2284 Parietal_Inf_L
3 -37,29,20 8898 Frontal_Inf_Tri_L
4 -56,-51,-8 1524 Temporal_Mid_L
5 27,-73,-36 2630 Cerebelum_Crus1_R
6 43,30,14 2509 Frontal_Inf_Tri_R
Frontoparietal,
Right 6 3
1 -29,-69,-37 3502 Cerebelum_Crus1_L
2 -37,-53,44 1823 Parietal_Inf_L
3 35,33,23 8510 Frontal_Mid_R
4 37,-56,46 5884 Angular_R
5 61,-35,-11 2715 Temporal_Mid_R
6 6,38,25 1425 Cingulum_Ant_R
Ventral stream, Left 22 4.4
1 -22,-77,-34 1339 Cerebelum_Crus1_L
2 -46,30,3 1142 Frontal_Inf_Tri_L
3 30,33,23 8789 Frontal_Mid_R
4 56,-36,8 3889 Temporal_Sup_R
Ventral stream,
Right 14 3.4
1 -35,-50,42 707 Parietal_Inf_L
2 -49,-5,6 8851 Rolandic_Oper_L
3 -6,32,43 5661 Frontal_Sup_Medial_L
4 34,-52,46 1543 Parietal_Inf_R
5 50,3,-13 2733 Temporal_Pole_Sup_R
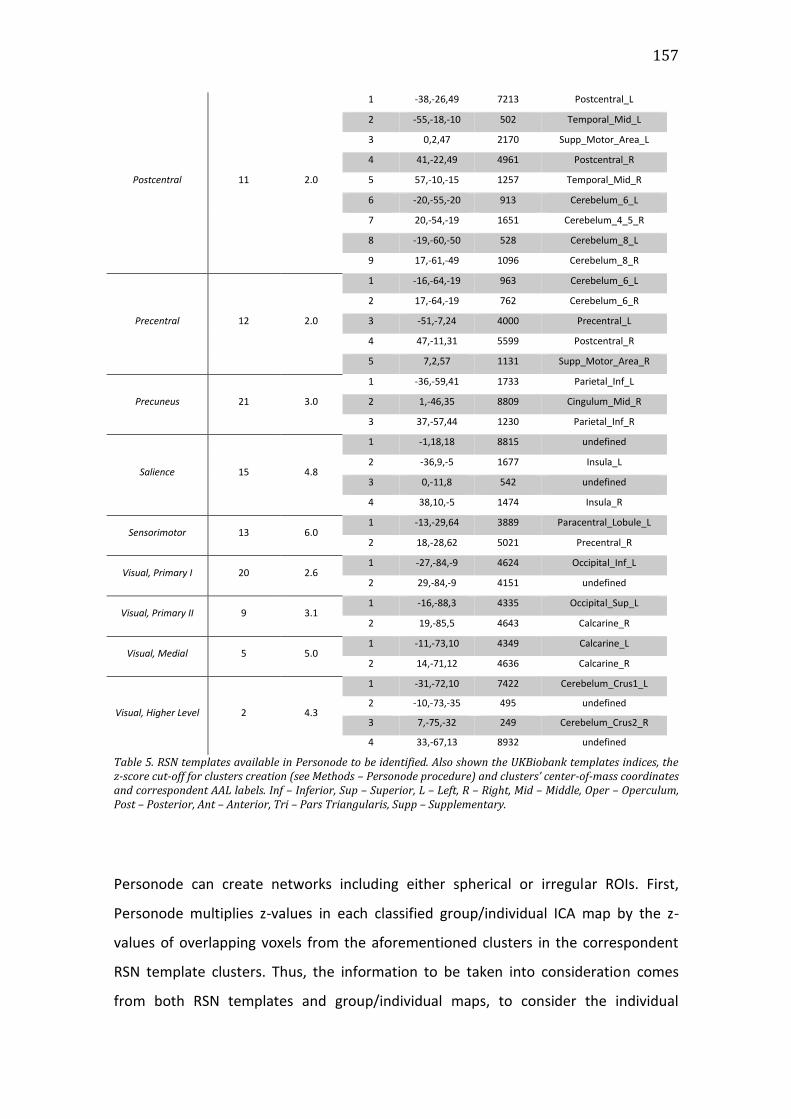
157
Postcentral 11 2.0
1 -38,-26,49 7213 Postcentral_L
2 -55,-18,-10 502 Temporal_Mid_L
3 0,2,47 2170 Supp_Motor_Area_L
4 41,-22,49 4961 Postcentral_R
5 57,-10,-15 1257 Temporal_Mid_R
6 -20,-55,-20 913 Cerebelum_6_L
7 20,-54,-19 1651 Cerebelum_4_5_R
8 -19,-60,-50 528 Cerebelum_8_L
9 17,-61,-49 1096 Cerebelum_8_R
Precentral 12 2.0
1 -16,-64,-19 963 Cerebelum_6_L
2 17,-64,-19 762 Cerebelum_6_R
3 -51,-7,24 4000 Precentral_L
4 47,-11,31 5599 Postcentral_R
5 7,2,57 1131 Supp_Motor_Area_R
Precuneus 21 3.0
1 -36,-59,41 1733 Parietal_Inf_L
2 1,-46,35 8809 Cingulum_Mid_R
3 37,-57,44 1230 Parietal_Inf_R
Salience 15 4.8
1 -1,18,18 8815 undefined
2 -36,9,-5 1677 Insula_L
3 0,-11,8 542 undefined
4 38,10,-5 1474 Insula_R
Sensorimotor 13 6.0 1 -13,-29,64 3889 Paracentral_Lobule_L
2 18,-28,62 5021 Precentral_R
Visual, Primary I 20 2.6 1 -27,-84,-9 4624 Occipital_Inf_L
2 29,-84,-9 4151 undefined
Visual, Primary II 9 3.1 1 -16,-88,3 4335 Occipital_Sup_L
2 19,-85,5 4643 Calcarine_R
Visual, Medial 5 5.0 1 -11,-73,10 4349 Calcarine_L
2 14,-71,12 4636 Calcarine_R
Visual, Higher Level 2 4.3
1 -31,-72,10 7422 Cerebelum_Crus1_L
2 -10,-73,-35 495 undefined
3 7,-75,-32 249 Cerebelum_Crus2_R
4 33,-67,13 8932 undefined
Table 5. RSN templates available in Personode to be identified. Also shown the UKBiobank templates indices, the z-score cut-off for clusters creation (see Methods – Personode procedure) and clusters’ center-of-mass coordinates and correspondent AAL labels. Inf – Inferior, Sup – Superior, L – Left, R – Right, Mid – Middle, Oper – Operculum, Post – Posterior, Ant – Anterior, Tri – Pars Triangularis, Supp – Supplementary.
Personode can create networks including either spherical or irregular ROIs. First,
Personode multiplies z-values in each classified group/individual ICA map by the z-
values of overlapping voxels from the aforementioned clusters in the correspondent
RSN template clusters. Thus, the information to be taken into consideration comes
from both RSN templates and group/individual maps, to consider the individual
158
variability of each subject (or the group) and the probabilistic maps from a big dataset
of functional data. To define the optimal center coordinates for spherical ROIs, the
voxel with the highest value resulting from the multiplication is considered the center
of a spherical ROI (defined here as “peak value”) (Fig. 43C). By doing it, the toolbox is
defining a coordinate where a certain functional node is most probably located for the
group/individual, around which a sphere of a given radius is defined and used in
further analyses. To define the irregular clusters, the n voxels with the highest values
originated from the multiplication by RSN template cluster and group/individual z-
values maps are binarized to create a mask correspondent to a network’s node. The
number n is here defined as being 10% of the number of voxels of a correspondent
RSN template cluster (restricting the nodes to comprise only the most anatomically
and functionally relevant voxels), with a lower limit defined by 120 voxels minimum (to
avoid a too small number of voxels). For both methods, when the multiplication
between z-scores of group component images and thresholded RSN clusters produced
values lower than 0.1, no ROI is created for this cluster, avoiding spurious definition.
These processes can be made in both levels, group and individual.
5.2.1.4 Output files
Once the coordinates are computed, Personode produces Neuroimaging Informatics
Technology Initiative (NIfTI) files including either spherical (user-specified radius) or
irregular nodes-representative ROIs masks, either as a whole network (mask
constituted of zeros and ones) or as labeled image (labeled with consecutive integers
as 1, 2, etc.). A .txt file is also created containing the information about each defined
network, namely ROIs labels, RSN names, components numbers (the fourth dimension
of the input ICA files), multiplication peak values of clusters RSN templates by the
group/individual maps, and these 3D peak values coordinates in “real-world” (voxel
number) and in MNI space. NIfTI files and .txt files are saved in group- and subject-
specific folders.

159
5.2.2 Personode applications
The most two main applications of the proposed tool could be in task-related
activation and functional connectivity analyses. To evaluate how this redefinition
would produce more reliable results in different analyses, we performed two
application studies: task-induced BOLD activation and resting-state functional
connectivity. Anatomical, functional resting-state (120 volumes dataset) and task-
induced functional images from 118 subjects (64 female, 30±7 years-old, range 21-44
years-old, right-handed) were selected and downloaded from the Nathan Kline
Institute (NKI)/Rockland Sample repository (http://fcon_1000.projects.nitrc.org/indi/
enhanced/neurodata.html). Data acquisition specifications can be found in a previous
study (MCDONALD et al., 2017).
5.2.2.1 DMN activation study
To evaluate how ROIs individualization could improve BOLD activation studies, we
compared the results obtained in a task-related activation study by using single-study-
and meta-analysis-based ROI and Personode’s definitions, for group and individual-
levels. Spherical and irregular ROI definitions were analyzed here. The selected task
was the moral dilemma (HARRISON et al., 2008), in which the participant are asked to
make morally ambiguous decisions based on blocks of scenarios and vignettes
interleaved with control ones, when they respond to questions with no dilemma
involved. The DMN, likely to be the most studied RSNs in fMRI literature, is known to
be involved in episodic silent thinking, self-oriented mental activity, autobiographical
memory recall, prospective thinking, and mind-wandering (GREICIUS et al., 2003;
GUSNARD et al., 2001; MASON et al., 2007), and it was shown that moral dilemma
blocks evoke regionally specific activity increases in DMN compared to control
(HARRISON et al., 2008), as opposed to the deactivations readily seen in fMRI
experiments involving attention-demanding cognitive tasks (GREICIUS et al., 2003;

160
GUSNARD et al., 2001; SMITH et al., 2009; WEISSMAN et al., 2006). Initial and final 10-
volume baseline blocks were discarded from analysis. Details about the task can be
found in (MCDONALD et al., 2017) and are also available in the website:
https://github.com/OpenCogLabRepository/moral-dilemma.
Both resting-state and task-related fMRI images were preprocessed in SPM 12
software (Wellcome Department of Cognitive Neurology, London, UK) in the following
order: interleaved slice-timing correction, realignment to the mean image,
coregistration of anatomical image to the mean functional image, segmentation of
anatomical image in gray and white matter and CSF compartments and subsequent
creation of forward deformation field for normalization to MNI standard space, and
smoothing using an isotropic 5 mm FWHM Gaussian kernel. Preprocessed task-related
fMRI data were further motion corrected via including movement parameters as
multiple regressors and their influence was regressed out. Specifying the stimulus
onset and scans duration, expected BOLD response was derived from a boxcar model
convolved with a canonical hemodynamic function (default SPM parameters). For
every voxel, beta values were extracted by regressing fMRI activity, as the
independent variable, to the expected BOLD response, the dependent one. These
parameters were contrasted via multiple 2-sample t-tests for every voxel to derive a
statistic for the difference in activation moral dilemma periods > control periods.
Using preprocessed resting-data fMRI from all subjects, ICA approach was carried out
as implemented in Gift toolbox (http://icatb.sourceforge.net/) and the dataset was
decomposed into 30 components. The component correspondent to dorsal/posterior
DMN was then classified and selected using Personode toolbox. Seven 4-mm-radius
spherical and seven irregular ROIs (representing PCC, mPFC, bilateral angular gyrus,
inferior temporal gyrus and right cerebellar tonsil) for group and individual maps were
defined with Personode, as described in Methods – Personode procedure section. For
comparison, corresponding spherical ROIs with same size were also defined using
Marsbar toolbox (http://marsbar.sourceforge.net) centered in Fox coordinates (see
Table 6) (FOX et al., 2005), a single-study definition from a highly explored article and
also available as the basis of a DMN mask in CONN toolbox (WHITFIELD-GABRIELI;
NIETO-CASTANON, 2012). Since it is a recommended practice to define ROIs for a

161
certain domain using meta-analysis studies, thought to be less sensitive to noise than
single-study activations (POLDRACK, 2007), an additional comparison using
corresponding spherical ROIs with same size centered in coordinates from a meta-
analysis study (SCHILBACH et al., 2012) were also made, although only 4 ROIs could be
matched with the ones produced by Personode. Using the obtained moral dilemma
contrast images, we extracted the average of contrast estimates from each ROI and we
compared the values obtained from different strategies (single-study, meta-analysis,
and Personode definitions) and different ROI shapes (spherical and irregular) using
paired one-sample t-tests with a level of significance of 0.05, corrected by FDR.
Table 6. Coordinates of DMN nodes from single-study (FOX et al., 2005) and meta-analysis (SCHILBACH et al., 2012) definitions to be compared with Personode definition in a task-related ROI-activation study.
5.2.2.2 Resting-state Functional Connectivity Analysis
Using the same resting-state fMRI analysis described above, we also conducted
analyses to check how Personode’s ROI definition impacts functional connectivity
results. Group and individual Personode’s ROIs were compared to a set of 31 ROIs
from some commonly used RSNs available in CONN toolbox. Some of these CONN ROIs
were also bilateralized before analysis (cerebellum, sensorimotor, and visual) to make
them comparable to Personode’s definition. Only the common networks/regions to
both in CONN and Personode toolboxes were considered here.
162
For this analysis, the same preprocessing steps and ICA decomposition procedure used
in the previous application were applied. For the 17 components classified as RSNs
with the guidance of Personode, irregular ROIs were defined for each node in group
and individual levels, as described above. The analysis with spherical ROIs was also
made but not shown in the present study because resulted in clearly inferior results
compared to CONN clusters. Preprocessed anatomical, gray matter, white matter, and
CSF compartments were loaded to CONN toolbox for functional connectivity analysis.
Twelve networks and a total of thirty regions defined in Personode were selected for
comparison to CONN networks, paired by visual correspondence. All networks, defined
by either CONN clusters or Personode, were masked with the gray matter. Five
principal components from white matter and five from CSF compartment masks, as
well as the six movement parameters and their first-order derivatives were regressed
out from the original time-series. Also, a band-pass filter (0.008-0.09 Hz), a despiking
before regression, and a linear detrending were performed as denoising steps. ROI-to-
ROI Pearson correlations were calculated for all subjects, for CONN clusters and
group/individual Personode ROIs.
A first comparison was made for intra-networks connectivity, to assess which ROI
definition would lead to a higher positive connectivity within networks. In addition,
some networks were selected for inter-networks connectivity analysis, since their
interactions (positive or negative correlations) are known from the literature (based on
(FOX et al., 2005; SEELEY et al., 2007; VEER et al., 2010). To compare CONN’s and
Personode’s individual/group ROI definitions, functional connectivity differences were
evaluated using paired one-sample t-tests for a level of significance of 0.05, corrected
by a seed-level FDR.

163
5.3 RESULTS
5.3.1 DMN activation study
Figure 45 summarizes comparisons between Personode and both single-study and
meta-analytic definitions for a contrast task vs control blocks using spherical ROIs.
Significant differences are indicated by asterisks, according to paired one-sample t-
tests for a level of significance of 0.05, corrected by FDR in the level of each pair of
comparisons. Individualized ROIs produced higher activations in 6/7 nodes and group
ROIs produced higher activations in 4/7 nodes, when compared to the single-study
literature definition (FOX et al., 2005) (Table 6). When compared to group ROIs,
individualized ROIs produced higher activations in 3/7 nodes and lower activation in
1/7 nodes. Individualized and group ROIs produced higher activations in all four nodes
considered, when compared to a meta-analysis definition (SCHILBACH et al., 2012)
(Table 6).
Figure 45. Personode improves activation results. Compared to single study and meta-analytic based ROI definitions, Personode’s group ICA and individual ICA based ROI definitions reveals significantly higher activations. Asterisks denote significant differences (FDR-corrected). L – Left, R – Right, Post Cing – Posterior Cingulate, Med PreFront – Medial Prefrontal, Mid Temp – Middle Temporal.
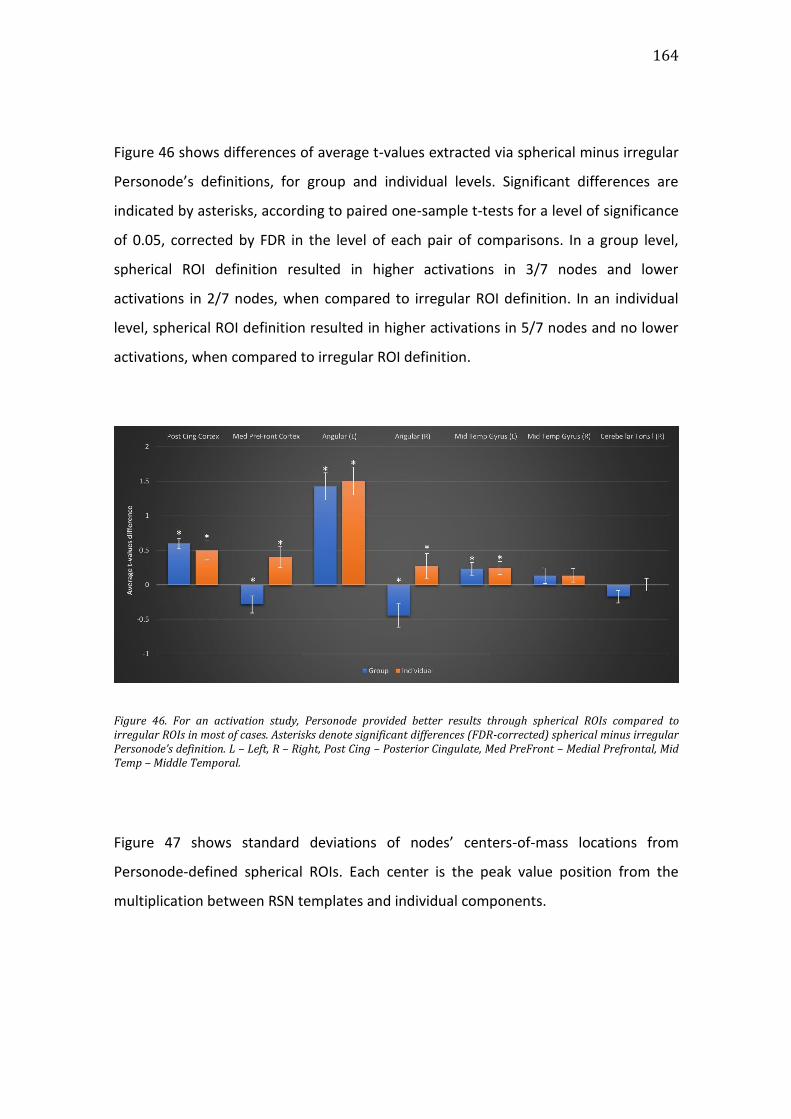
164
Figure 46 shows differences of average t-values extracted via spherical minus irregular
Personode’s definitions, for group and individual levels. Significant differences are
indicated by asterisks, according to paired one-sample t-tests for a level of significance
of 0.05, corrected by FDR in the level of each pair of comparisons. In a group level,
spherical ROI definition resulted in higher activations in 3/7 nodes and lower
activations in 2/7 nodes, when compared to irregular ROI definition. In an individual
level, spherical ROI definition resulted in higher activations in 5/7 nodes and no lower
activations, when compared to irregular ROI definition.
Figure 46. For an activation study, Personode provided better results through spherical ROIs compared to irregular ROIs in most of cases. Asterisks denote significant differences (FDR-corrected) spherical minus irregular Personode’s definition. L – Left, R – Right, Post Cing – Posterior Cingulate, Med PreFront – Medial Prefrontal, Mid Temp – Middle Temporal.
Figure 47 shows standard deviations of nodes’ centers-of-mass locations from
Personode-defined spherical ROIs. Each center is the peak value position from the
multiplication between RSN templates and individual components.

165
Figure 47. Standard deviations (in millimeters) of nodes’ centers-of-mass locations according to Personode-defined spherical ROIs. PCC – Posterior Cingulate Cortex, mPFC – Medial Prefrontal Cortex, Angular L – Left Angular Gyrus, Angular R – Right Angular Gyrus, Temporal Mid L – Left Middle Temporal Gyrus, Temporal Mid R – Right Middle Temporal Gyrus, Cer Tonsil R – Right Cerebellar Tonsil.
5.3.2 Resting State Correlation Analysis
Figure 48 shows functional connectivity changes comparing individual-level
Personode’s irregular ROI definition to CONN clusters. For intra-network connections,
where more positive correlations would be expected, Personode significantly
produced 13/26 (50.0%) more positive correlations and 10/26 (38.5%) more negative
correlations. For inter-network connections, where positive interactions were also
expected, Personode significantly produced 12/16 (75.0%) more positive correlations
and 1/16 (6.2%) more negative correlations. For inter-network connections, where
negative interactions were expected, Personode significantly produced 7/58 (12.1%)
more positive correlations and 34/58 (58.6%) more negative correlations.

166
Figure 48. Personode improves functional connectivity results, in terms of positive correlations and anticorrelations, in most of cases. Compared to CONN cluster definition, Personode’s individual ICA based ROI definitions reveals significantly more connectivity changes in the expected direction. DMN – Default Mode Network, Post. – Posterior, LFPN – Left Frontoparietal Network, RFPN – Right Frontoparietal Network, d/p – Dorsal/Posterior, Exec Ctrl – Executive Control.
Figure 49 shows functional connectivity changes comparing individual-level to group-
level Personode’s irregular ROI definition. For intra-network connections, Personode
significantly produced 21/26 (80.8%) more positive correlations and 6/26 (7.7%) more
negative correlations. For inter-network connections between networks with positive
interaction, Personode significantly produced 6/16 (37.5%) more positive correlations
and 5/16 (31.2%) more negative correlations. For inter-network connections between
networks with negative interaction, Personode significantly produced 14/58 (24.1%)
more positive correlations and 26/58 (44.8%) more negative correlations.

167
Figure 49. Personode improves functional connectivity results for individual definition in most of cases. Compared to group definition, Personode’s individual ICA based ROI definitions reveals significantly more connectivity changes in the expected direction. DMN – Default Mode Network, Post. – Posterior, LFPN – Left Frontoparietal Network, RFPN – Right Frontoparietal Network, d/p – Dorsal/Posterior, Exec Ctrl – Executive Control.
By computing the Pearson correlation of the time-series from the average signal from
nodes in common defined by both Personode and CONN clusters, association matrices
were created and presented in Figure 50 for a set of representative networks: DMN
(posterior/dorsal, for Personode’s label), attention dorsal, left and right frontoparietal,
salience, and executive control.

168
Figure 50. Association matrices from ROIs defined from CONN (left) and Personode (right). Personode clearly improves functional connectivity results, in terms of positive correlations and anticorrelations, for default mode, dorsal attention, left and right frontoparietal networks. DMN – Default Mode Network, Att – Dorsal Attention Network, LFPN – Left Frontoparietal Network, RFPN – Right Frontoparietal Network, Sal – Salience Network, Exec – Executive Control.
Since Personode can produce, for a given network, more ROIs than the number of
clusters that CONN provides, we also performed an analysis considering the complete
set of clusters produced by Personode, comparing intra-network changes for
individualized ROI definition to a group definition. As expected, results in Table 7 show
that, in general, more positive correlations were found for individualized than group
ROI definition.
Table 7. Intra-network changes for each classified network comparing individualized to a group ROI definition.

169
We also hypothesized, using Personode’s individual ROI definition, positive
interactions among the following networks: (1) “motion” networks (Postcentral,
Precentral, and Sensorimotor), (2) ventral stream networks (left and right ones), and
(3) default mode (dorsal/posterior and medial) networks and Precuneus. This
evaluation also could not be compared to CONN clusters because some of Personode’s
cluster have no equivalent in CONN clusters. We assessed if mean correlations among
networks would be higher than zero, indicating positive interactions. All hypotheses,
except by dorsal/posterior DMN – Precuneus, were confirmed, as shown in Table 8.
Table 8. Other inter-networks positive interactions defined by individual ROIs using Personode. Asterisks denote mean correlations significantly higher than zero, as it was expected. L – Left, R – Right, DMN – Default Mode Network.
5.4 DISCUSSION
Personode is an open-access, user-friendly, MATLAB-based toolbox for ROI definition
relying on group or individual ICA resting-state maps. It also helps in classifying
components into RSNs. Both, task-related activation and functional connectivity
studies can benefit from the use of this tool. Our analysis shows that (1) individualized
spherical Personode-based ROIs could produce stronger results than ROIs based on
single-studies coordinates or meta-analysis studies for task-related activation analyses
and (2) individualized irregular Personode-based ROIs can produce better results than

170
an RSN atlas for ROI-to-ROI functional connectivity studies. To the best of our
knowledge, such tool is not currently available for neuroimaging researchers.
This toolbox can also alleviate and optimize the difficult process of visual classification
of ICA maps into canonical RSNs. After performing an ICA, multiple components are
created, which can represent multiple RSN and makes the process time-consuming,
difficult, and prone to false associations. Personode calculates spatial Pearson
correlation indices between the components and a RSN template (based on images
from 5000 subjects) (MILLER et al., 2016), probabilistic reordering and visual
navigation to ease classification decision-making. Although Personode uses an
automatic procedure to suggest the most probable components associated to a given
RSN, its classification also depends on the user’s decision. On one hand a completely
automatic procedure would hardly be exempt of misclassifications and, on the other
hand, even though subjective selections based on visual inspections are a common
procedure (DAMOISEAUX et al., 2006; SHIRER et al., 2012; VEER et al., 2010), an
exclusively manual selection, by visually associating multiple RSNs to multiple
components, can be painful. Therefore, Personode comes to ease this decision-making
process by presenting probabilistic procedure but leaving to user the ultimate choice.
The toolbox can create subject- and group-specific networks to represent individual
variability or populational characteristics, considering a reasonable number of RSN
templates and clusters from the most studied intrinsic networks. Generally used ROI
definitions (LIU, 2011) can rely on anatomical atlases, like the AAL atlas (TZOURIO-
MAZOYER et al., 2002), with subsequent warping to the subject space; however, the
approach is vulnerable to the individual variability, to the inclusion of functionally non-
relevant voxels (as the ones located in the white matter), and to the omission of voxels
containing signal of interest. Using coordinates from other studies also ignores
individual variability and carry on population-level characteristics that can differ from
the specific study (SOHN et al., 2015). A way to consider individual differences in ROI
definition is either through manual labeling by experts, although of laborious
implementation and practically impossible for multiple ROIs connectivity studies, or
through task-based fMRI paradigms, which, whilst recommended in some cases, is
more expensive, demands additional experimental planning, depends on subjects’

171
performance and commitment, and it is impaired for excessive head movement.
Personode’s ROI definition combines individual variability characterization and the
facility of resting-state data acquisitions and the easily-designed model-free ICA
approach. Such technique would not demand previous planning and could be
especially useful for clinical populations, elderly, and children.
For the task-related activation study, better results were obtained using individual
Personode ROI definition, comparing to single-study or meta-analysis definitions (Fig.
45). It was also shown that spherical ROIs show sharper activations compared to
irregular ROIs (Fig. 46), more in an individual level then in a group one, thus averaging
voxels signals around the most probable coordinate for activation parameters
extraction would be preferable other than computing them from a number of voxels in
the irregular ROIs. It is worth noting that better results were obtained using ICA maps,
which are independent of task-induced activation maps and supports the validity of
Personode’s individualized ROI definition. Moreover, it was shown that, even if
Personode-defined ROIs centers-of-mass varied less than 1 cm (except for mPFC) (Fig.
47), results can change substantially (LIU, 2011), what concerns the anatomical
localization specificity and associated ROIs functionality for each subject. Still for the
task-related activation study, it was also seen that group or individual definitions were
equivalent, for certain ROIs, possibly due to spatial smoothing. Results are reported to
DMN dorsal/posterior nodes in a task known to activate this network, but they can be
extended to other activation studies and associated brain networks/nodes.
In order to have a successful functional connectivity analysis, ROIs positioning must be
reliable, reproducible, and accurate (LIU, 2011). By knowing beforehand RSNs
interactions among each other (in other words, if networks should be positively or
negatively correlated), it would be possible evaluate if Personode’s definition improves
functional connectivity characterization, compared to a network atlas, under the
assumption that a better definition would lead to stronger connections in the
expected direction (VAN DIJK et al., 2010). We showed that Personode leads to
stronger expected results in terms of functional connectivity for subject-specific ROI
definition. Figures 48 and 50 show how correlations defined in individual ROI
definitions are higher compared to CONN clusters for some of the networks, selected

172
due to known interactions (FOX et al., 2005; SEELEY et al., 2007; VEER et al., 2010).
Among intra and inter-network nodes, where positive interactions would be expected,
a higher number of more positive correlations was obtained using individualized ROIs,
while among inter-network nodes, where negative interactions would be expected, a
higher number of more negative correlations was obtained using individualized ROIs. It
is worth pointing out that the toolbox produced especially interesting results for
anticorrelations, which suggests that they may be as worthy to be studied as positive
correlations and must have a role in neuronal processes oriented to competitive
behaviors or antagonistic goals (FOX et al., 2005). It is clear by Figure 50 that positive
and negative associations are better formed using Personode’s individual definition in
intra-network positive correlations for DMN posterior/dorsal, dorsal attention, and left
and right frontoparietal networks, in inter-network positive correlations between left
and right frontoparietal networks, and in inter-network negative correlations between
DMN posterior/dorsal and dorsal attention. However, these interactions are better
seen using CONN clusters, in intra-network positive correlations for salience network,
in inter-network positive correlations between salience and executive control
networks, and in inter-network negative correlations between salience/executive
control and DMN posterior/dorsal. This could be because CONN clusters are only
specified as being part of the salience network, but they are large and might be
comprising also components from executive control network, while Personode treats
nodes from both networks. In this instance, we thus highlight the augmented
sensitivity of Personode to differentiate a reasonable number of networks compared
to the concerned method.
Higher correlation among intra-network nodes, a result obtained using ROI definition
compared to CONN clusters (Fig. 48, left) and to group ROI definition (Fig. 49, left, and
Table 7), provides a more accurate connectivity pattern, since they exhibit positive
correlations among each other (BULLMORE; SPORNS, 2009). Furthermore, Personode
can generate definitions constituted by a considerable number of RSNs and nodes,
enriching analyses with detailed connectivity information and making possible new
lines of investigation (as shown in Table 8). By having available hypothesis of networks

173
interactions and how they would change due to interventions or individual differences,
functional connectivity could be better studied by using the methods described here.
Since Personode uses group/individual ICA maps to define ROIs (but not only),
functional connection values using this definition are not independent of the ICA
approach. Regardless of that, this information is valuable for better positioning ROIs
and, by consequence, improving the results. This dependence, however, partially
explain the better results for irregular compared to spherical ROIs and the better
results for individual compared to group ROIs, since the nodes anatomy is more
respected in irregular definitions. In addition, ROIs positioning also depends on
templates coming from an independent dataset considering a very high number of
subjects, contributing to a solid functional-anatomical restriction and, mainly with
respect to individual definition, avoiding exclusive definition in noisy individual ICA
maps. Even though fMRI single-sessions ICA decomposing are noisier and less reliable
than group ICA, SMITH et al., (2009) argue that “it should be still possible to derive
benefit from aligning those networks that are reliably detectable in single-session data
with an appropriate template”, a procedure that the present study proposes:
combining a robust RSN template with individual information derived by single-subject
ICA.
As perspectives, Personode can benefit other studies involving task-induced
activations and functional connectivity and improve their interpretations, since
incorrect nodes definitions could lead to spurious results. Moreover, we suggest that
the tool could be used also, for example, in neurofeedback studies, in which the ROI
individualization is desired and researchers often resort to fMRI functional localizers
(HARMELECH; FRIEDMAN; MALACH, 2015; ROBINEAU et al., 2017; SCHARNOWSKI et
al., 2015; SCHEINOST et al., 2013b). If the ROI is part of an RSN available in Personode,
this tool could be used to a better definition, what would be a clear advantage, given
that the only requirement would be an easily designed resting-state scan. We could
also speculate that other studies related to fMRI data could also benefit from the
method, as seed-to-voxel functional connectivity, individual characteristics prediction
based on connectivity fingerprints (CAMERON et al., 2009; FINN et al., 2015), graph
analysis of fMRI complex networks (RUBINOV; SPORNS, 2010), ROIs usage to track

174
fibers in anatomical connectivity studies (NUCIFORA et al., 2007), and quantitative
measurements based on the Arterial Spin Labeling technique of RSNs (DAI et al., 2016).
The present study is not pioneer in exploring individualized ROIs method based on
resting-state acquisition; however, it is the first to offer an open-access tool to allow
such analyses, with promising results obtained on known activations and functional
connections. GOLESTANI and GOODYEAR (2011) introduced a method based on inter-
voxel cross-correlation of resting-state data, which led to a higher connectivity within
network. However, only the motor cortical network was investigated. Personode’s
definition differs of Sohn (SOHN et al., 2015) by also considering both probabilistic
functional information RSN templates (the UK Biobank components) combined with
subjects (or group of subjects) z-values ICA maps to provide a reliable definition
regarding previous anatomical probability and individual variability. In Sohn’s method,
a subject/group peak-value would be sought inside of a binary cluster, what can
produce high spatial variability and subsequently anatomical distortions. Therefore,
the present study also analyzes the effect of defining irregular ROIs, based on the
combined estimates from both RSN templates and group/individual maps.
The presented method also shows some limitations that must be considered. (1) It is
known that ICA approach can split canonical RSN in more than just one component. In
certain circumstances, for example, DMN can be subdivided in anterior and posterior
components. In this scenario, Personode’s classification and mainly ROI definition
would be problematic. It is recommended then that ICA analysis be performed
predefining a fair number of components: 20 to 30 would be a reasonable interval. In
future versions, additional RSN templates could be included, considering also some
subdivided RSN templates. (2) Since RSN template clusters are spatially non-exclusive,
some degree of overlapping could be present among spherical and irregular ROIs from
different networks. This overlap could also happen within the same network for
bilateral clusters, only for spherical ROIs (when most probable ROIs coordinates center
are too close of each other). Since RSN clusters are thresholded and coordinates
definition depends on their z-values, the overlap incidence is minimized, but the user
should be aware about this issue, mainly when analyzing ROI-to-ROI connectivity. (3)
Regarding the analysis showed in this study, although Personode has the advantage of

175
providing a reasonable number for networks/nodes for definition, the comparison
with other methods presented here was limited by the number of paired
networks/nodes available in the other methods. (4) UK Biobank ICA templates used in
this study included subjects between 40 and 69 years old (MILLER et al., 2016). Even
though individual variance is included in the definition process, Personode uses
templates’ information as well to define ROIs and, if a younger or older population of
subjects is considered, one must have either the assumption that RSNs are relatively
steady over age or that the individual information is enough for an accurate
individualization.

176
6 GENERAL CONCLUSIONS
Neurofeedback based on fMRI is a novel technique which allows training of regions of
the brain. Unlike drug interventions, it has the advantage to act directly in precisely
defined brain regions, counting on the high fMRI spatial resolution and with no
observed side effects so far. We showed that it is possible to rapidly transfer the ability
of differential self-regulation between SAN and DMN, two large-scale anticorrelated
networks of the brain. This training induces significant learning of these networks
dissociation, mainly explained through higher voluntary control of DMN deactivations.
Even though the participants exhibited self-regulation competence in early stages of
the experiment, neurofeedback training boosted this control, which was verified after
training and even when feedback of brain activity was withdrawn. Our data suggest
that the successful training could bring behavioral changes for overall attention, more
specifically in the case of switching-task ability. Functional neuroplasticity changes in
some of the trained brain areas and others were measured and associated to
neurofeedback training. Long-lasting improved capability of self-regulation was yet
verified, but not accomplished of the permanence of behavioral effects and functional
connectivity changes.
Under sub-optimal conditions, low success rate in a first neurofeedback-induced
learning experiment was mainly explained by erroneous ROIs displacement, even
though successful neurofeedback regulation and learning for a modest number of

177
participants were observed. These preliminary results paved the way for a more
careful, better designed experiment, which yielded novel findings.
Still along these lines, individualized ROIs were shown to provide better results for
task-induced activation parameters extraction and functional connectivity analysis.
Thus, we share an open-source toolbox, useful for ICA component classification into
RSNs and individual/group ROI definition. Neuroimaging researchers can take
advantage of it for accurate ROIs definition, leading to more trustworthy results in a
range of studies.

178
Bibliography
ANDERSEN, R. A. Visual and Eye Movement Functions of the Posterior Parietal Cortex. Annual Review of Neuroscience, v. 12, n. 1, p. 377–403, 1 mar. 1989.
ANDERSON, K. et al. The effects of time of day and practice on cognitive abilities: The PEBL Tower of London, Trail-making, and Switcher tasks. 2012.
ANDREWS-HANNA, J. R. et al. Disruption of Large-Scale Brain Systems in Advanced Aging. Neuron, v. 56, n. 5, p. 924–935, 2007.
AYDIN, K. et al. Smaller Gray Matter Volumes in Frontal and Parietal Cortices of Solvent Abusers Correlate with Cognitive Deficits. American Journal of Neuroradiology, v. 30, n. 10, p. 1922–1928, 2009.
BANIQUED, P. L. et al. Cognitive training with casual video games: points to consider. Frontiers in Psychology, v. 4, p. 1010, 7 jan. 2013.
BASILIO, R. et al. FRIEND Engine Framework: a real time neurofeedback client-server system for neuroimaging studies. Frontiers in Behavioral Neuroscience, v. 9, p. 3, 2015.
BECKMANN, C. F. et al. Investigations into resting-state connectivity using independent component analysis. Philosophical transactions of the Royal Society of London. Series B, Biological sciences, v. 360, n. 1457, p. 1001–13, 2005.
BERTEAU-PAVY, D.; RABER, J.; PIPER, B. Contributions of age, but not sex, to mental rotation performance in a community sample. PEBL Technical Report Series. [s.l: s.n.]. Disponível em: <http://sites.google.com/site/pebltechnicalreports/home/2011/pebl-technical-report-2011-02>.
BIRBAUMER, N. Breaking the silence: Brain-computer interfaces (BCI) for communication and motor control. Psychophysiology, v. 43, n. 6, p. 517–532, 2006.
BIRN, R. M. et al. fMRI in the presence of task-correlated breathing variations. NeuroImage, v. 47, n. 3, p. 1092–1104, 2009.
BISWAL, B. et al. Functional Connectivity in the Motor Cortex of Resting Human Brain Using Echo-Planar Mri. Magnetic Resonance in Medicine, v. 34, p. 537–541,

179
1995.
BRABOSZCZ, C. et al. Plasticity of visual attention in Isha yoga meditation practitioners before and after a 3-month retreat. Frontiers in Psychology, v. 4, p. 914, 2013.
BREFCZYNSKI-LEWIS, J. A. et al. Neural correlates of attentional expertise in long-term meditation practitioners. Proceedings of the National Academy of Sciences, v. 104, n. 27, p. 11483–11488, 2007.
BREWER, J. A. et al. Meditation experience is associated with differences in default mode network activity and connectivity. Proceedings of the National Academy of Sciences, v. 108, n. 50, p. 20254–20259, 2011.
BULLMORE, E. T.; SPORNS, O. Complex brain networks: graph theoretical analysis of structural and functional systems. Nature reviews. Neuroscience, v. 10, n. 3, p. 186–198, 2009.
BUXTON, R. B. Introduction to Functional Magnetic Resonance Imaging: Principles and Techniques. [s.l.] Cambridge University Press, 2002.
CAMERON, C. R. et al. Disease state prediction from resting state functional connectivity. Magnetic Resonance in Medicine, v. 62, n. 6, p. 1619–1628, 24 nov. 2009.
CARIA, A. et al. Regulation of anterior insular cortex activity using real-time fMRI. NeuroImage, v. 35, n. 3, p. 1238–1246, 2007.
CASTELLANOS, F. X. et al. Cingulate - Precuneus Interactions: A New Locus of Dysfunction in Adult Attention-Deficit/Hyperactivity Disorder. Biological psychiatry, v. 63, n. 3, p. 332–337, 1 fev. 2008.
CIESLIK, E. C. et al. Three key regions for supervisory attentional control: Evidence from neuroimaging meta-analyses. Neuroscience & Biobehavioral Reviews, v. 48, p. 22–34, 2015.
CONNERS, C. K. et al. Continuous Performance Test Performance in a Normative Epidemiological Sample. Journal of Abnormal Child Psychology, v. 31, n. 5, p. 555–562, out. 2003.
CORBETTA, M.; SHULMAN, G. L. Control of goal-directed and stimulus-driven attention in the brain. Nature Reviews Neuroscience, v. 3, p. 201, 1 mar. 2002.
CUNNINGTON, R. et al. The Preparation and Execution of Self-Initiated and Externally-Triggered Movement: A Study of Event-Related fMRI. NeuroImage, v. 15, n. 2, p. 373–385, 2002.

180
DAI, W. et al. Quantifying fluctuations of resting state networks using arterial spin labeling perfusion MRI. Journal of Cerebral Blood Flow & Metabolism, v. 36, n. 3, p. 463–473, 2016.
DAMOISEAUX, J. S. et al. Consistent resting-state networks across healthy subjects. Proceedings of the National Academy of Sciences, v. 103, n. 37, p. 13848–13853, 2006.
DASELAAR, S. M.; PRINCE, S. E.; CABEZA, R. When less means more: deactivations during encoding that predict subsequent memory. NeuroImage, v. 23, n. 3, p. 921–927, 2004.
DAVIS, N. et al. The neural correlates of calculation ability in children: an fMRI study. Magnetic Resonance Imaging, v. 27, n. 9, p. 1187–1197, 2009.
DEBETTENCOURT, M. T. et al. Closed-loop training of attention with real-time brain imaging. Nature Neuroscience, v. 18, n. 3, p. 470–478, 2015.
DECHARMS, R. C. et al. Control over brain activation and pain learned by using real-time functional MRI. Proceedings of the National Academy of Sciences of the United States of America, v. 102, n. 51, p. 18626–31, 2005.
DICKHAUS, T. et al. Predicting BCI performance to study BCI illiteracy. BMC Neuroscience, v. 10, n. 1, p. P84, 2009.
DOSENBACH, N. U. F. et al. A Core System for the Implementation of Task Sets. Neuron, v. 50, n. 5, p. 799–812, 2006.
EGNER, T.; GRUZELIER, J. Learn self-regulation of EEG frequency components affects attention and event-related brain potentials in humans. Neuroreport, v. 12, p. 4155–4159, 2002.
FAN, J. et al. Testing the Efficiency and Independence of Attentional Networks. Journal of cognitive neuroscience, v. 14, p. 340–347, 2002.
FINN, E. S. et al. Functional connectome fingerprinting: identifying individuals using patterns of brain connectivity. Nature Neuroscience, n. October, p. 1–11, 2015.
FOX, M. D. et al. The human brain is intrinsically organized into dynamic, anticorrelated functional networks. Proceedings of the National Academy of Sciences, v. 102, n. 27, p. 9673–9678, 2005.
GARRISON, K. A. et al. Real-time fMRI links subjective experience with brain activity during focused attention. NeuroImage, v. 81, p. 110–118, 2013.

181
GOLESTANI, A.-M.; GOODYEAR, B. G. Regions of interest for resting-state fMRI analysis determined by inter-voxel cross-correlation. NeuroImage, v. 56, n. 1, p. 246–251, 1 maio 2011.
GREEN, C. S.; BAVELIER, D. Action video game modifies visual selective attention. Nature, v. 423, p. 534, 2003.
GREICIUS, M. D. et al. Functional connectivity in the resting brain: A network analysis of the default mode hypothesis. Proceedings of the National Academy of Sciences, v. 100, n. 1, p. 253–258, 2003.
GRUZELIER, J. H. EEG-neurofeedback for optimising performance. I: A review of cognitive and affective outcome in healthy participants. Neuroscience & Biobehavioral Reviews, v. 44, p. 124–141, 2014.
GUSNARD, D. A. et al. Medial prefrontal cortex and self-referential mental activity: Relation to a default mode of brain function. Proceedings of the National Academy of Sciences, v. 98, n. 7, p. 4259–4264, 2001.
HARMELECH, T.; FRIEDMAN, D.; MALACH, R. Differential Magnetic Resonance Neurofeedback Modulations across Extrinsic (Visual) and Intrinsic (Default-Mode) Nodes of the Human Cortex. Journal of Neuroscience, v. 35, n. 6, p. 2588–2595, 2015.
HARRISON, B. J. et al. Consistency and functional specialization in the default mode brain network. Proceedings of the National Academy of Sciences, v. 105, n. 28, p. 9781–9786, 2008.
HELTON, W. S. et al. The abbreviated vigilance task and cerebral hemodynamics. Journal of clinical and experimental neuropsychology, v. 29, n. 5, p. 545–552, 2007.
HINDS, O. et al. Computing moment-to-moment BOLD activation for real-time neurofeedback. NeuroImage, v. 54, n. 1, p. 361–368, 2011.
HINDS, O. et al. Roles of default-mode network and supplementary motor area in human vigilance performance: evidence from real-time fMRI. Journal of Neurophysiology, v. 109, n. 5, p. 1250–1258, 2013.
HUETTEL, S. A.; SONG, A. W.; MCCARTHY, G. Functional Magnetic Resonance Imaging. [s.l.] Oxford University Press, Incorporated, 2009.
JOHNSON, K. A. et al. Intermittent “Real-time” fMRI Feedback Is Superior to Continuous Presentation for a Motor Imagery Task: A Pilot Study. Journal of Neuroimaging, v. 22, n. 1, p. 58–66, 2012.
182
JOSIPOVIC, Z. et al. Influence of meditation on anti-correlated networks in the brain. Frontiers in Human Neuroscience, v. 5, p. 183, 2012.
KELLY, A. M. C. et al. Competition between functional brain networks mediates behavioral variability. NeuroImage, v. 39, n. 1, p. 527–537, 2008.
KILLINGSWORTH, M. A.; GILBERT, D. T. A Wandering Mind Is an Unhappy Mind. Science, v. 330, n. 6006, p. 932, 2010.
KILPATRICK, L. A. et al. Impact of mindfulness-based stress reduction training on intrinsic brain connectivity. NeuroImage, v. 56, n. 1, p. 290–298, 2011.
KOUSH, Y. et al. Signal quality and Bayesian signal processing in neurofeedback based on real-time fMRI. NeuroImage, v. 59, n. 1, p. 478–489, 2012.
KOUSH, Y. et al. Learning Control Over Emotion Networks Through Connectivity-Based Neurofeedback. Cerebral Cortex, v. 27, n. 2, p. 1193–1202, 2015.
KOUSH, Y. et al. OpenNFT: An open-source Python/Matlab framework for real-time fMRI neurofeedback training based on activity, connectivity and multivariate pattern analysis. NeuroImage, 2017.
LANGNER, R.; EICKHOFF, S. B. Sustaining attention to simple tasks: A meta-analytic review of the neural mechanisms of vigilant attention. Psychological Bulletin, v. 139, n. 4, p. 870–900, 2013.
LAWRENCE, N. S. et al. Multiple neuronal networks mediate sustained attention. Journal of cognitive neuroscience, v. 15, n. 7, p. 1028–1038, 2003.
LINDEN, D. E. J. et al. Real-Time Self-Regulation of Emotion Networks in Patients with Depression. PLOS ONE, v. 7, n. 6, p. 1–10, 2012.
LINDQUIST, M. A. The Statistical Analysis of fMRI Data. Statistical Science, v. 23, n. 4, p. 439–464, 2008.
LIU, T. A few thoughts on brain ROIs. Brain imaging and behavior, v. 5, n. 3, p. 189–202, 2011.
LOH, S. et al. The validity of psychomotor vigilance tasks of less than 10-minute duration. Behavior research methods, instruments, & computers, v. 36, p. 339–346, 2004.
MARXEN, M. et al. Amygdala Regulation Following fMRI-Neurofeedback without Instructed Strategies. Frontiers in Human Neuroscience, v. 10, p. 183, 2016.

183
MASON, M. F. et al. Wandering Minds: The Default Network and Stimulus-Independent Thought. Science, v. 315, n. 5810, p. 393–395, 2007.
MCDONALD, A. R. et al. The real-time fMRI neurofeedback based stratification of Default Network Regulation Neuroimaging data repository. NeuroImage, v. 146, n. October 2016, p. 157–170, 2017.
MEGUMI, F. et al. Functional MRI neurofeedback training on connectivity between two regions induces long-lasting changes in intrinsic functional network. Frontiers in Human Neuroscience, v. 9, n. 3, 2015.
MILLER, K. L. et al. Multimodal population brain imaging in the UK Biobank prospective epidemiological study. Nature Neuroscience, v. 19, n. 11, p. 1523–1536, 2016.
MISAKI, M. et al. Real-time fMRI processing with physiological noise correction – Comparison with off-line analysis. Journal of Neuroscience Methods, v. 256, p. 117–121, 2015.
MUELLER, S. T.; PIPER, B. J. The Psychology Experiment Building Language (PEBL) and PEBL Test Battery. Journal of Neuroscience Methods, v. 222, p. 250–259, 2014.
NUCIFORA, P. G. P. et al. Diffusion-Tensor MR Imaging and Tractography: Exploring Brain Microstructure and Connectivity. Radiology, v. 245, n. 2, p. 367–384, 2007.
OGG, R. J. et al. Neural correlates of a clinical continuous performance test. Magnetic Resonance Imaging, v. 26, n. 4, p. 504–512, 2008.
PAAS, F. G. W. C.; VAN MERRIËNBOER, J. J. G. The Efficiency of Instructional Conditions: An Approach to Combine Mental Effort and Performance Measures. Human Factors, v. 35, n. 4, p. 737–743, 1993.
PAMPLONA, G. S. P. et al. Analyzing the association between functional connectivity of the brain and intellectual performance. Frontiers in Human Neuroscience, v. 9, n. 2, p. 1–11, 2015.
PIPER, B. et al. Evaluation of the validity of the Psychology Experiment Building Language tests of vigilance, auditory memory, and decision making. PeerJ, v. 4, p. e1772, 2016.
PIPER, B. J. et al. Reliability and validity of neurobehavioral function on the Psychology Experimental Building Language test battery in young adults. PeerJ, v. 3, p. e1460, 2015.

184
POLDRACK, R. A. Region of interest analysis for fMRI. Social cognitive and affective neuroscience, v. 2, n. 1, p. 67–70, 2007.
POSNER, M. I.; ROTHBART, M. K.; TANG, Y.-Y. Enhancing attention through training. Current Opinion in Behavioral Sciences, v. 4, p. 1–5, 2015.
RAICHLE, M. E. et al. A default mode of brain function. Proceedings of the National Academy of Sciences, v. 98, n. 2, p. 676–682, 2001.
ROBERTSON, I. H. The absent mind: Attention and error. The Psychologist, v. 16, n. 9, p. 476–479, 2003.
ROBINEAU, F. et al. Self-regulation of inter-hemispheric visual cortex balance through real-time fMRI neurofeedback training. NeuroImage, v. 100, p. 1–14, 2014.
ROBINEAU, F. et al. Maintenance of Voluntary Self-regulation Learned through Real-Time fMRI Neurofeedback. Frontiers in Human Neuroscience, v. 11, p. 131, 2017.
ROHLFS, I. C. P. DE M. et al. A Escala de Humor de Brunel (Brums): instrumento para detecção precoce da síndrome do excesso de treinamento. Revista Brasileira de Medicina do Esporte, v. 14, p. 176–181, 2008.
ROTA, G. et al. Self-Regulation of Regional Cortical Activity Using Real-Time fMRI: The Right Inferior Frontal Gyrus and Linguistic Processing. Human brain mapping, v. 30, p. 1605–1614, 2009.
RUBINOV, M.; SPORNS, O. Complex network measures of brain connectivity: Uses and interpretations. NeuroImage, v. 52, n. 3, p. 1059–1069, 2010.
RUIZ, S. et al. Real-time fMRI brain computer interfaces: Self-regulation of single brain regions to networks. Biological Psychology, v. 95, p. 4–20, 2014.
SATO, J. R. et al. Real-Time fMRI Pattern Decoding and Neurofeedback Using FRIEND: An FSL-Integrated BCI Toolbox. PLOS ONE, v. 8, n. 12, 2013.
SCHARNOWSKI, F. et al. Improving Visual Perception through Neurofeedback. Journal of Neuroscience, v. 32, n. 49, p. 17830–17841, 2012.
SCHARNOWSKI, F. et al. Manipulating motor performance and memory through real-time fMRI neurofeedback. Biological Psychology, v. 108, p. 85–97, 2015.
SCHEINOST, D. et al. Orbitofrontal cortex neurofeedback produces lasting changes in contamination anxiety and resting-state connectivity. Translational Psychiatry, v. 3, p. e250, 2013a.
185
SCHEINOST, D. et al. Orbitofrontal cortex neurofeedback produces lasting changes in contamination anxiety and resting-state connectivity. Translational Psychiatry, v. 3, p. e250, abr. 2013b.
SCHILBACH, L. et al. Introspective Minds: Using ALE Meta-Analyses to Study Commonalities in the Neural Correlates of Emotional Processing, Social & Unconstrained Cognition. PLOS ONE, v. 7, n. 2, p. 1–10, 2012.
SEELEY, W. W. et al. Dissociable Intrinsic Connectivity Networks for Salience Processing and Executive Control. Journal of Neuroscience, v. 27, n. 9, p. 2349–2356, 2007.
SEGHIER, M. L. The Angular Gyrus. The Neuroscientist, v. 19, n. 1, p. 43–61, 2013.
SEPULVEDA, P. et al. How feedback, motor imagery, and reward influence brain self-regulation using real-time fMRI: Brain Self-Regulation Using Real-Time fMRI. Human Brain Mapping, v. 37, 2016.
SHEN, H. H.; WRITER, S. Core Concept: Resting-state connectivity. Proceedings of the National Academy of Sciences, v. 112, n. 46, p. 14115–14116, 2015.
SHEN, X. et al. Groupwise whole-brain parcellation from resting-state fMRI data for network node identification. NeuroImage, v. 82, p. 403–415, 2013.
SHIBATA, K. et al. Perceptual Learning Incepted by Decoded fMRI Neurofeedback Without Stimulus Presentation. Science, v. 334, n. 6061, p. 1413–1415, 2011.
SHIRER, W. R. et al. Decoding Subject-Driven Cognitive States with Whole-Brain Connectivity Patterns. Cerebral Cortex, v. 22, n. 1, p. 158–165, 2012.
SITARAM, R. et al. fMRI Brain-Computer Interfaces. IEEE Signal Processing Magazine, v. 25, n. 1, p. 95–106, 2008.
SITARAM, R. et al. Closed-loop brain training: the science of neurofeedback. Nature Reviews Neuroscience, v. 18, p. 86, 2016.
SLADKY, R. et al. Slice-timing effects and their correction in functional MRI. NeuroImage, v. 58, n. 2, p. 588–594, 2011.
SMITH, S. M. et al. Correspondence of the brain’s functional architecture during activation and rest. Proceedings of the National Academy of Sciences, v. 106, n. 31, p. 13040–13045, 2009.
SOHN, W. et al. Influence of ROI selection on resting state functional connectivity: an individualized approach for resting state fMRI analysis. Frontiers in Neuroscience, v. 9, p. 280, 2015.
186
SONG, M. et al. Brain spontaneous functional connectivity and intelligence. NeuroImage, v. 41, n. 3, p. 1168–1176, 2008.
SOOD, A.; JONES, D. T. On Mind Wandering, Attention, Brain Networks, and Meditation. EXPLORE: The Journal of Science and Healing, v. 9, n. 3, p. 136–141, 2013.
SPRENG, R. N. The Fallacy of a “Task-Negative” Network. Frontiers in Psychology, v. 3, p. 145, 2012.
SULZER, J. et al. Real-time fMRI neurofeedback: Progress and challenges. NeuroImage, v. 76, p. 386–399, 2013.
TANG, Y.-Y. et al. Short-term meditation training improves attention and self-regulation. Proceedings of the National Academy of Sciences, v. 104, n. 43, p. 17152–17156, 2007.
TANJI, J. The supplementary motor area in the cerebral cortex. Neuroscience Research, v. 19, n. 3, p. 251–268, 1994.
TERRIBILLI, D. et al. Age-related gray matter volume changes in the brain during non-elderly adulthood. Neurobiology of Aging, v. 32, n. 2, p. 354–368, 2011.
THIBAULT, R. T.; LIFSHITZ, M.; RAZ, A. Neurofeedback or neuroplacebo? Brain, v. 140, n. 4, p. 862–864, 2017.
THOMPSON, G. et al. Short-Time Windows of Correlation Between Large-Scale Functional Brain Networks Predict Vigilance Intraindividually and Interindividually. Human brain mapping, v. 34, 2013.
TOFTS, P. Quantitative MRI of the Brain: Measuring Changes Caused by Disease. [s.l.] Wiley, 2005.
TOMPSON, S.; FAYE CHUA, H.; KITAYAMA, S. Connectivity between mPFC and PCC predicts post-choice attitude change: The self-referential processing hypothesis of choice justification. Human brain mapping, v. 37, 2016.
TZOURIO-MAZOYER, N. et al. Automated anatomical labeling of activations in SPM using a macroscopic anatomical parcellation of the MNI MRI single-subject brain. NeuroImage, v. 15, n. 1, p. 273–289, 2002.
VAN DEN HEUVEL, M. P.; POL, H. E. H. Exploring the brain network: A review on resting-state fMRI functional connectivity. European Neuropsychopharmacology, v. 20, n. 8, p. 519–534, 2010.
VAN DIJK, K. R. A. et al. Intrinsic Functional Connectivity As a Tool For Human

187
Connectomics: Theory, Properties, and OptimizationJournal of NeurophysiologyBethesda, MD, 2010.
VEER, I. M. et al. Whole Brain Resting-State Analysis Reveals Decreased Functional Connectivity in Major DepressionFrontiers in Systems Neuroscience, 2010.
VIEIRA, B. H. Brain functional connectivity in regions that exhibit age-related cortical thinning. [s.l.] University of São Paulo, 2018.
VOLLEBREGT, M. A. et al. Does EEG-neurofeedback improve neurocognitive functioning in children with attention-deficit/hyperactivity disorder? A systematic review and a double-blind placebo-controlled study. Journal of Child Psychology and Psychiatry, v. 5, p. 460–472, 2014.
WEISKOPF, N. et al. Principles of a brain-computer interface (BCI) based on real-time functional magnetic resonance imaging (fMRI). IEEE Transactions on Biomedical Engineering, v. 51, n. 6, p. 966–970, 2004.
WEISKOPF, N. Real-time fMRI and its application to neurofeedback. NeuroImage, v. 62, n. 2, p. 682–692, 2012.
WEISSMAN, D. H. et al. The neural bases of momentary lapses in attention. Nature Neuroscience, v. 9, p. 971, 2006.
WHITFIELD-GABRIELI, S.; NIETO-CASTANON, A. Conn : A Functional Connectivity Toolbox for Correlated and Anticorrelated Brain Networks. Brain Connectivity, v. 2, n. 3, p. 125–141, 2012.
WOLFF, N.; MÜCKSCHEL, M.; BESTE, C. Neural mechanisms and functional neuroanatomical networks during memory and cue-based task switching as revealed by residue iteration decomposition (RIDE) based source localization. Brain Structure and Function, v. 222, n. 8, p. 3819–3831, 2017.
YAMADA, T. et al. Resting-State Functional Connectivity-Based Biomarkers and Functional MRI-Based Neurofeedback for Psychiatric Disorders: A Challenge for Developing Theranostic Biomarkers. International Journal of Neuropsychopharmacology, n. 10, 2017.
ZHANG, G. et al. Functional Alteration of the DMN by Learned Regulation of the PCC Using Real-Time fMRI. IEEE Transactions on Neural Systems and Rehabilitation Engineering, v. 21, n. 4, p. 595–606, 2013.
ZILVERSTAND, A. et al. Windowed Correlation: A Suitable Tool for Providing Dynamic fMRI-Based Functional Connectivity Neurofeedback on Task Difficulty. PLOS ONE, v. 9, n. 1, p. 1–13, 2014.

188
Appendix – Supplementary material
Figure S1. Original scores differences extracted from CPT for NF and TR groups. Asterisk indicates a significant difference for uncorrected p-values.

189
Figure S2. Original scores differences extracted from Switcher Test for NF and TR groups.

190
Figure S3. Original scores differences extracted from PVT for NF and TR groups. Asterisk indicates a significant difference for uncorrected p-values.

191
Figure S4. Original scores differences extracted from Mental Rotation Test for NF and TR groups. Single asterisks indicate a significant difference for uncorrected p-values while the double asterisk indicates a significant difference for FDR-corrected p-values for measures computed for all tests.

192
Figure S5. Original scores differences extracted from ANT for NF and TR groups.

193
Figure S6. Attention tests results for Experiment II. Blue bars represent values for attention scores before neurofeedback training and orange bars represent values for attention scores after neurofeedback training. Asterisks indicate significant differences for two-tailed paired t-tests for uncorrected p-values < 0.05.


![Enhancing Declarative Process Models with DMN …Enhancing Declarative Process Models with DMN Decision Logic 153 the Decision Model and Notation (DMN) [13]. By separating decisions](https://static.fdocuments.in/doc/165x107/5ec7e18045b8f32c372a8cf0/enhancing-declarative-process-models-with-dmn-enhancing-declarative-process-models.jpg)