Network and Database for Omics Data...
17
Network and Database for Omics Data Analysis Agus Salim, Ph.D Big Data Analytics: Application to Modern Genetics Universitas Jember, 23 Dec 2015 Agus Salim, Ph.D Network and Database for Omics Data Analysis
Transcript of Network and Database for Omics Data...

Network and Database for Omics Data
Analysis
Agus Salim, Ph.D
Big Data Analytics: Application to Modern GeneticsUniversitas Jember, 23 Dec 2015
Agus Salim, Ph.D Network and Database for Omics Data Analysis

Genes Network
When analyzing Omics data, we tend to test each geneseparately for association with outcome (disease)Treating each gene as ’singleton’ is convenient, but is itappropriate?After all, experiments have shown that genes work innetwork with a collection of genes performing one majortask
Agus Salim, Ph.D Network and Database for Omics Data Analysis
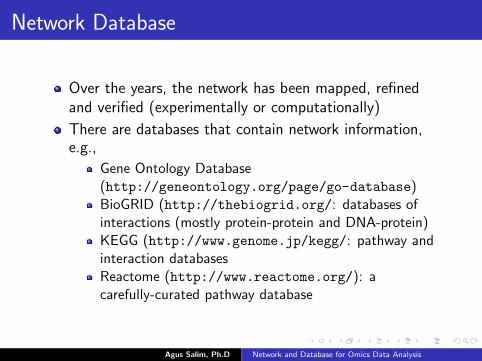
Network Database
Over the years, the network has been mapped, refinedand verified (experimentally or computationally)
There are databases that contain network information,e.g.,
Gene Ontology Database(http://geneontology.org/page/go-database)BioGRID (http://thebiogrid.org/: databases ofinteractions (mostly protein-protein and DNA-protein)KEGG (http://www.genome.jp/kegg/: pathway andinteraction databasesReactome (http://www.reactome.org/): acarefully-curated pathway database
Agus Salim, Ph.D Network and Database for Omics Data Analysis

Incorporating Network into Data Analysis
One of the following approaches:
1 Test each gene separately, followed by testing forover/under-representation of genes from certain pathwaysamong the statistically-significant genes (Example: GOTest, GSEA)
2 Incorporate the network from the start; the DE status ofa gene depends on the status of its ’neighbor’ (MarkovRandom Field-Based Algorithm)
Agus Salim, Ph.D Network and Database for Omics Data Analysis
Gene Ontology (GO) Test
Is the collection of significant genes over (under) representgenes from certain pathways?
Uses the list of statistically-significant genes (e.g., fromt-test) as input
Perform the test pathway-by-pathway
Uses Fisher’s exact test for 2× 2 table as the underlyingstats tool.
Agus Salim, Ph.D Network and Database for Omics Data Analysis

Gene Ontology (GO) Test
Uses the list of statistically-significant genes (e.g., fromt-test) as input
Perform the test pathway-by-pathway
Uses Fisher’s exact test for 2× 2 table as the underlyingstats tool.
Agus Salim, Ph.D Network and Database for Omics Data Analysis

Gene Ontology (GO) Test
Status In pathway Not in Pathway TotalS a b qNS c d p − qTotal m1 m2 p
We can perform Fisher-exact test on this table.
Agus Salim, Ph.D Network and Database for Omics Data Analysis

Gene Ontology (GO) Test
If we use the following analogy with fair experiment involvingmarbles, Statistically significant (S) genes = drawn marbles,genes in the pathway = ’red’ marbles, genes not in thepathway = ’blue’ marbles.
If we draw q marbles from a bag containing m1 ’red’ andm2 = p −m1 ’blue’ marbles, then the chance of drawingexactly a ’red’ ones is
C (m1, a)× C (p −m1, b)
C (p, q)
The number of genes from the pathway (A) followsHypergeometric distribution, with
E (A) = m1q
p
Agus Salim, Ph.D Network and Database for Omics Data Analysis
Gene Ontology (GO) Test
The p-value can be calculated as follows (using p-valuedefinition)
For over-representation test: P(≥ a)
For under-representation test: P(≤ a)
Agus Salim, Ph.D Network and Database for Omics Data Analysis
Gene-set Enrichment Analysis
The GO test categorizes gene into ’S’ and ’NS’categories, but within each category there is nodifferentiation based on the weight of evidence
Some ’S’ genes may be ’just’ significant, likewise some’NS’ genes may just fail to meet the significance criterion.
Gene-set Enrichment Analysis (GSEA) weights genesdifferently based on the strength of evidence
Agus Salim, Ph.D Network and Database for Omics Data Analysis
Gene-set Enrichment Analysis
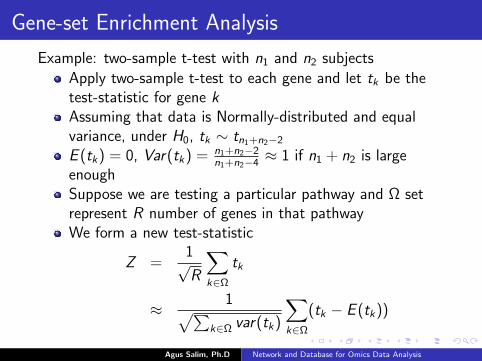
Example: two-sample t-test with n1 and n2 subjects
Apply two-sample t-test to each gene and let tk be thetest-statistic for gene kAssuming that data is Normally-distributed and equalvariance, under H0, tk ∼ tn1+n2−2
E (tk) = 0, Var(tk) = n1+n2−2n1+n2−4
≈ 1 if n1 + n2 is largeenoughSuppose we are testing a particular pathway and Ω setrepresent R number of genes in that pathwayWe form a new test-statistic
Z =1√R
∑k∈Ω
tk
≈ 1√∑k∈Ω var(tk)
∑k∈Ω
(tk − E (tk))
Agus Salim, Ph.D Network and Database for Omics Data Analysis

GSEA
Z =1√R
∑k∈Ω
tk
Genes with stronger evidence (larger magnitude of tk) willcontribute more to the test-statistic
By using Lindeberg’s Central Limit Theorem, we can
show that Zd−→ N(0, 1)
Which means, we can obtain p-value by comparing Z tostandard normal distribution
Agus Salim, Ph.D Network and Database for Omics Data Analysis

Markov Random Field (MRF) Approach
Incorporating network information from the beginningThe basic idea: the state of each gene(normal/supressed/enhanced) depends the status of itsneighborNeighbors are genes that are directly linked by edge(s)The probability of a normal gene is higher in theneighborhood of normal genes, and lower in theneighborhood full of suppressed/enhanced genes
Agus Salim, Ph.D Network and Database for Omics Data Analysis

Markov Random Field (MRF) Approach
The state of each gene ONLY depends on the state of itsdirect neighbors
There is probability distribution for gene under each state
For each gene k , there are three states xk = −1, 0, 1
p(xk = d | neighbors) ∝ expγd + βduk(d)− β0uk(0)
where (γd , βd , β0) are MRF-model parameters to be estimatedfrom data, uk(d) is the proportion of gene k ’s neighbors withstate = d .
Agus Salim, Ph.D Network and Database for Omics Data Analysis

Markov Random Field (MRF) Approach
The state of each gene ONLY depends on the state of itsdirect neighbors
There is probability distribution for gene under each state
For each gene k , there are three states xk = −1, 0, 1
p(xk = d | neighbors) ∝ expγd + βduk(d)− β0uk(0)
where (γd , βd , β0) are MRF-model parameters to beestimated from data, uk(d) is the proportion of gene k ’sneighbors with state = d .
We have on-going work where we usePoisson-Gamma-Beta (PGB) distribution to model geneexpression data under each state
Agus Salim, Ph.D Network and Database for Omics Data Analysis

Markov Random Field (MRF) Approach
Computationally challenging, so we use a hybridapproach: Methods of Moments (MoM) andMaximum-Likelihood to estimate parameters.
Preliminary results: very encouraging (beat GO andGSEA!). We are hoping to submit for publication soon.
Agus Salim, Ph.D Network and Database for Omics Data Analysis

Some Useful References
Falcon S, Gentleman R. (2007). Using GOstats to test genelists for GO term association. Bioinformatics 23: 257-8.
Subramanian A et al. (2005). Gene set enrichment analysis:a knowledge-based approach for interpreting genome-wideexpression profiles. Proc Natl Acad Sci USA 102: 15545-50.
Sajeewani IDM, Prendergast L, Salim A. PathDESeq: apowerful pathway-based differential expression analysis forsequencing data. To be submitted.
Agus Salim, Ph.D Network and Database for Omics Data Analysis