NETWORK ANALYSIS OF CLIMATE CHANGE ... - Harvard University
78
NETWORK ANALYSIS OF CLIMATE CHANGE & DISASTER RESILIENCE ACTORS WORKING IN BAGERHAT DISTRICT, BANGLADESH March 2020
Transcript of NETWORK ANALYSIS OF CLIMATE CHANGE ... - Harvard University
NETWORK ANALYSIS
OF CLIMATE CHANGE &
DISASTER RESILIENCE
ACTORS WORKING IN
BAGERHAT DISTRICT,
BANGLADESH
March 2020
Program on Resilient Communities. Network
Analysis of Climate Change & Disaster
Resilience Actors Working in Bagerhat District,
Bangladesh. Harvard Humanitarian Initiative.
2020.
This study was conducted as part of the
Harvard Humanitarian Initiative’s Program on
Resilient Communities. The program partnered
with Root Change to analyze network data.
The Harvard Humanitarian Initiative (HHI) is
a university-wide initiative with a mission to
advance the science and practice of
humanitarian response worldwide through
research and education. HHI serves as the
humanitarian arm of Harvard University and
brings an interdisciplinary approach to
building the evidence base of humanitarian
studies and professionalizing the field of
humanitarian aid. Through its research
programs and educational offerings, HHI is an
influential forum for humanitarian innovation,
effectiveness, and leadership.
HHI’s Program on Resilient Communities
uses evidence-based approaches to interpret
how communities mitigate the impact of
disasters. The program’s starting point is the
central role local communities play in both
disaster preparedness and response.
Communities are the front line and locus for
interactions with local civil society
organizations, the private sector, national
disaster management agencies, and the
international humanitarian community.
Root Change aims to bring people together
to question assumptions, think deeply, test
ideas, and lead the way to a world built on
social justice principles. Root Change designs
products, technologies, and interactive
experiences that help people, organizations,
and communities build better futures for
themselves.
ABOUT THE AUTHORS
This report was written by HHI and Root
Change.
At HHI, Phuong Pham, Sarah Ferguson,
Vincenzo Bollettino, and Patrick Vinck
designed and implemented the study, data
analysis, and writing of the report.
At Root Change, Rachel Dickinson, Alexis
Smart, and Evan Bloom conducted the analysis
and wrote the report.
ACKNOWLEDGMENTS
The authors are grateful to Concern
Worldwide and Jagrata Juba Shangha for their
support arranging the logistics for this study,
particularly ATM Zakir Hossain, Helen Ware,
Mahmudul Hasan, Palash Kanti Haldar, Sayeed
Mahmud Riadh, and Zia Ahmed. We also
thank Naoshin Jahan for her dedication to the
study and for her instrumental role in data
collection. Finally, we thank the organizations
and participants who took part in the survey
for welcoming the data collection team and
sharing their time and insights.
NETWORK ANALYSIS
OF CLIMATE CHANGE &
DISASTER RESILIENCE
ACTORS WORKING IN
BAGERHAT DISTRICT,
BANGLADESH
MARCH 2020
TABLE OF CONTENTS
Acronyms .................................................................................................................................................................................................................................................................................... 6
Study Overview ......................................................................................................................................................................................................................................................................... 7
Summary of Key Findings and Recommendations ....................................................................................................................................................................................................... 8
Objective ................................................................................................................................................................................................................................................................................... 10
Methodology ........................................................................................................................................................................................................................................................................... 13
Findings ...................................................................................................................................................................................................................................................................................... 19
Conclusion ................................................................................................................................................................................................................................................................................ 38
Annexes ..................................................................................................................................................................................................................................................................................... 39
Annex A: Protocol................................................................................................................................................................................................................................................................... 40
Annex B: Zoom in of Full Network Image ...................................................................................................................................................................................................................... 47
Annex C: Overview of Relationships ................................................................................................................................................................................................................................ 48
Annex D: Overview of Actors ............................................................................................................................................................................................................................................. 53
Annex E: Key Actors ............................................................................................................................................................................................................................................................... 59
Annex F: Sub-Networks ........................................................................................................................................................................................................................................................ 64
Annex G: Network Structures ............................................................................................................................................................................................................................................. 75
References................................................................................................................................................................................................................................................................................. 77
TABLE OF FIGURES
Figure 1: Example of Degrees of Separation ................................................................................................................................................................................................................. 14
Figure 2: Types of Actors ..................................................................................................................................................................................................................................................... 16
Figure 3. Full Network, Climate Change Adaptation and Disaster Resilience in Bagerhat District, Bangladesh ................................................................................... 21
Figure 4. Number of Collaboration Areas versus Number of Relationships Identified in Each. ................................................................................................................. 22
Figure 5. Percentage of Relationships by Collaboration Type ................................................................................................................................................................................ 23
Figure 6. Percentage of Relationships by Length of Collaboration ...................................................................................................................................................................... 24
Figure 7. Percentage of Organization Types Found in Network ............................................................................................................................................................................ 25
Figure 8. Number of Actors with Each Organization Focus .................................................................................................................................................................................... 26
Figure 9. Coordination Sub-Network .............................................................................................................................................................................................................................. 36
Figure 10. Local Actor Sub-Network, with International Actors Removed ......................................................................................................................................................... 37

6 | PROGRAM ON RESILIENT COMMUNITIES
ACRONYMS
CBO – Community-based Organization
DEPP – Disasters and Emergency Preparedness Program
DFID – Department for International Development
DRR – Disaster Risk Reduction
E-I Index – External to Internal Index
HHI – Harvard Humanitarian Initiative
INGO – International Non-governmental Organization
IOM – International Organization for Migration
JJS – Jagrata Juba Shangha
NGO – Non-governmental Organization
NPA – Net Promoter Analysis
SNA – Social Network Analysis
UN – United Nations

NETWORK ANALYSIS OF RESILIENCE ACTORS IN BAGERHAT DISTRICT, BANGLADESH | 7
STUDY OVERVIEW
Coordination among actors during an
emergency is crucial for effective, efficient
action (1,2). The existence of pre-disaster
relationships between actors can strengthen
the speed with which coordination occurs in
a disaster setting, making relationship-
building before a disaster an important
element of preparedness (1,2). As such,
understanding the relationships between
stakeholders working to advance disaster
resilience and response is a crucial first step
to support institutional strengthening and
capacity building (3).
The Harvard Humanitarian Initiative (HHI),
Concern Worldwide, and Jagrata Juba
Shangha (JJS) are jointly implementing
programs to enhance climate change
adaptation and disaster resilience among
coastal communities in Bagerhat District,
Bangladesh. This district is located in
Bangladesh’s low-elevation coastal zones,
which are especially vulnerable to natural
disasters and have already begun to see the
effects of climate change (4). Bagerhat has
high levels of food and water insecurity and
poverty, and is highly vulnerable to natural
disasters and climate change impacts (5).
The district has been heavily impacted by
recent cyclones, and is experiencing sea
level rise and saltwater intrusion (5).
This network analysis was undertaken to
support strengthening coordination and
collaboration among actors working on
climate change adaptation and disaster
resilience in Bagerhat. As a first step toward
understanding coordination and
collaboration among these actors, HHI
conducted a network analysis. This network
analysis research had two goals:
1) To understand the relationships
among actors supporting climate
change adaptation and disaster
resilience work among coastal
communities in Bagerhat district,
Bangladesh; and
2) To develop a representation of the
disaster risk and resilience system in
Bagerhat through a depiction of the
structure and characteristics of the
relationships among the actors that
make up the system.
This report details the findings of this
network analysis study. The study design is
modeled after a summative phase external
evaluation that HHI conducted in 2016-2017
on the START Network’s Disasters and
Emergency Preparedness Program (DEPP)
(6). The network analysis techniques applied
in this evaluation have been adapted from
the DEPP study to analyze the disaster
resilience network in coastal Bangladesh.
HHI partnered with Root Change to conduct
the analysis represented in this report. The
report presents the network analysis and
methods used, as well as findings and
recommendations for translating how these
results can inform programs to strengthen
disaster and climate change resilience in
Bagerhat district, Bangladesh.

8 | PROGRAM ON RESILIENT COMMUNITIES
SUMMARY OF KEY FINDINGS AND RECOMMENDATIONS
The following is a summary of findings from
the network analysis, as well as additional
questions that these findings raise and
recommendations for strengthening the
climate adaptation and disaster resilience
network in Bagerhat district, Bangladesh.
LOCALIZATION
• Overall, local actors (both district and
national) were found to play a
prominent role in the network. District
and national actors held influential
positions in the key actor analysis.
Furthermore, international actors had
high cross-collaboration with local
actors and were well connected to local
actors.
• While international actors only made up
22% of the network, when they were
removed, we saw a loss of 51% of
relationships, and the creation of 13
local actor isolates.
• Collaboration could be increased
between local actors to support greater
resilience when international actors
withdraw their support. Multi-
stakeholder platforms, such as social
labs or collective impact strategies, that
bring together diverse local actors to
work towards a common agenda on
issues related to climate change and
disaster resilience may foster this
collaboration. These platforms help to
emphasize mutual accountability and
co-creation between local actors and
groups and can help to support local
system self-reliance.
NETWORK OF PEERS AND COLLEAGUES
• The actors working on climate
adaptation and disaster resilience in
Bagerhat district represent a network of
peers and colleagues, made up primarily
of district and national level
organizations. The majority of local
actors have more than a decade of
experience working with each other,
they interact frequently, and have fairly
high levels of trust.
• Formal partnerships and mutual
interests define the majority of
relationships. This is evident both in how
participating organizations have
described their relationships and in the
network structure.
LIMITED MUTUALITY
• Reciprocal, or bi-directional, ties remain
quite low, representing only 7.5% of
relationships in the full network, and
only 2.4% of relationships between local
actors. With actors’ long history of
engagement and formal partnerships,
we would expect to see a higher rate of
reciprocity as a sign of mutual
collaboration.
• Further research is needed to determine
why collaboration is predominately
unidirectional and if there are
opportunities for local actors to co-
collaborate and jointly develop or test
solutions.
LIMITED ENGAGEMENT WITH
ACADEMIA, CBOS, MEDIA, AND THE
PRIVATE SECTOR
• There is low presence and engagement
with academic institutions, community-
based organizations (CBOs), the media,
and the private sector, representing
untapped potential resources and
knowledge to improve climate change

NETWORK ANALYSIS OF RESILIENCE ACTORS IN BAGERHAT DISTRICT, BANGLADESH | 9
and disaster resilience in Bagerhat
district.
• In particular, engagement with and
between CBOs is an area that could be
strengthened. Half of the isolates in the
network (50%) were CBOs, and this
group had no relationships with one
another.
LIMITED COLLABORATION AMONG
GOVERNMENT
• Government was the main actor type
identified in this system, accounting for
the highest percentage of actors at 30%.
Government was in 730 total
relationships in the network (55.6% of all
relationships) and also had the highest
cross-collaboration with other types of
actors. However, government actors
were found to have very little
collaboration with each other—out of
24 government actors, only 10
relationships were found between them.
Therefore, government actors are very
present in the network, but are not
collaborating much with one another.
• Given the focus area of this network on
climate change adaptation and disaster
resilience, we might expect there to be
greater collaboration and exchange of
information and learning between
government departments. This may be
an area that warrants further
investigation to understand the
relationships between government
agencies and how collaboration could
be strengthened.
DOMINANCE OF FEW KEY ACTORS
• Across the multiple collaboration areas,
four key actors were consistently found
to be the top collaboration hubs in the
network, having the most relationships:
Mid-Sized INGO A, Mid-Sized Local
NGO B, Large International
Organization C, and Mid-Sized Local
NGO D.
• Their position of influence makes them
good candidates to act as brokers and
to help connect others in the system.
Further research is needed to determine
if they are playing brokering roles. Their
central position in the network also
makes them potential bottlenecks for
the flow of information and ideas within
the network.
• These actors could be engaged to
discuss their role in the system and the
findings of this work and to determine if
there are actions these actors are taking
or could take to elevate other local
actors who are providing expertise,
resources, and support in the district.
These key actors can also help to
connect others the system, such as
academic institutions, CBOs, media, and
the private sector, to increase
collaboration with these actors
throughout the network.
10 | PROGRAM ON RESILIENT COMMUNITIES
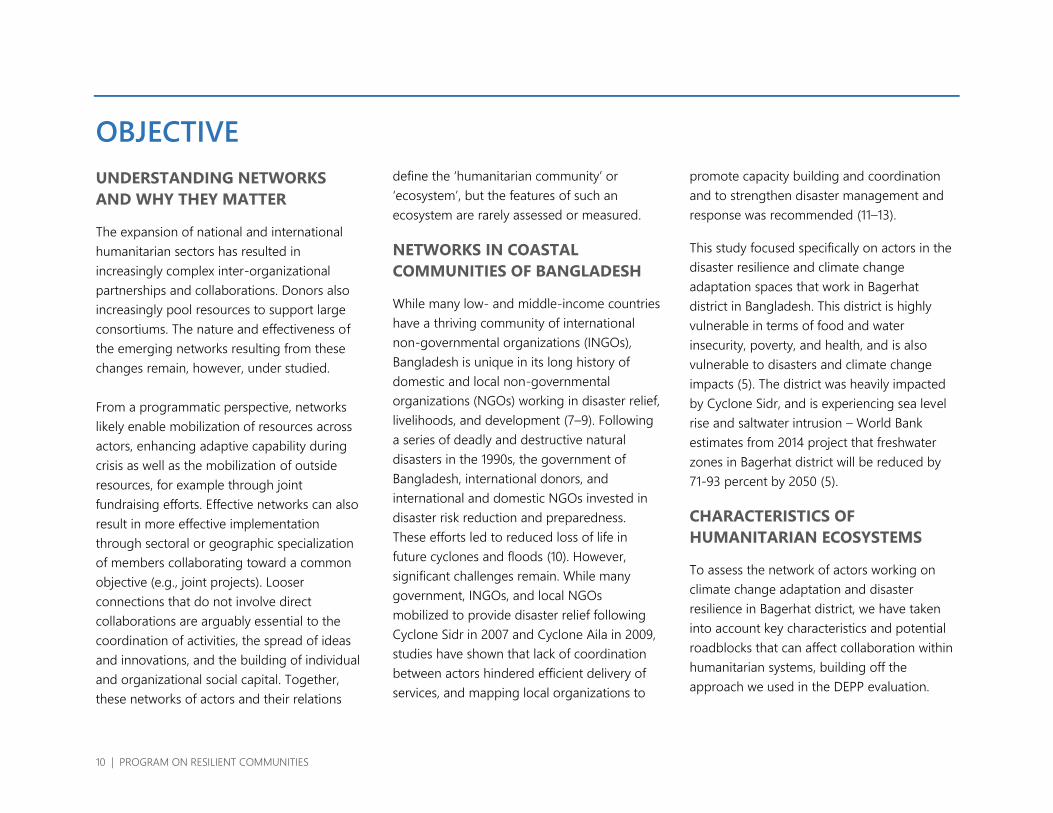
OBJECTIVE
UNDERSTANDING NETWORKS
AND WHY THEY MATTER
The expansion of national and international
humanitarian sectors has resulted in
increasingly complex inter-organizational
partnerships and collaborations. Donors also
increasingly pool resources to support large
consortiums. The nature and effectiveness of
the emerging networks resulting from these
changes remain, however, under studied.
From a programmatic perspective, networks
likely enable mobilization of resources across
actors, enhancing adaptive capability during
crisis as well as the mobilization of outside
resources, for example through joint
fundraising efforts. Effective networks can also
result in more effective implementation
through sectoral or geographic specialization
of members collaborating toward a common
objective (e.g., joint projects). Looser
connections that do not involve direct
collaborations are arguably essential to the
coordination of activities, the spread of ideas
and innovations, and the building of individual
and organizational social capital. Together,
these networks of actors and their relations
define the ‘humanitarian community’ or
‘ecosystem’, but the features of such an
ecosystem are rarely assessed or measured.
NETWORKS IN COASTAL
COMMUNITIES OF BANGLADESH
While many low- and middle-income countries
have a thriving community of international
non-governmental organizations (INGOs),
Bangladesh is unique in its long history of
domestic and local non-governmental
organizations (NGOs) working in disaster relief,
livelihoods, and development (7–9). Following
a series of deadly and destructive natural
disasters in the 1990s, the government of
Bangladesh, international donors, and
international and domestic NGOs invested in
disaster risk reduction and preparedness.
These efforts led to reduced loss of life in
future cyclones and floods (10). However,
significant challenges remain. While many
government, INGOs, and local NGOs
mobilized to provide disaster relief following
Cyclone Sidr in 2007 and Cyclone Aila in 2009,
studies have shown that lack of coordination
between actors hindered efficient delivery of
services, and mapping local organizations to
promote capacity building and coordination
and to strengthen disaster management and
response was recommended (11–13).
This study focused specifically on actors in the
disaster resilience and climate change
adaptation spaces that work in Bagerhat
district in Bangladesh. This district is highly
vulnerable in terms of food and water
insecurity, poverty, and health, and is also
vulnerable to disasters and climate change
impacts (5). The district was heavily impacted
by Cyclone Sidr, and is experiencing sea level
rise and saltwater intrusion – World Bank
estimates from 2014 project that freshwater
zones in Bagerhat district will be reduced by
71-93 percent by 2050 (5).
CHARACTERISTICS OF
HUMANITARIAN ECOSYSTEMS
To assess the network of actors working on
climate change adaptation and disaster
resilience in Bagerhat district, we have taken
into account key characteristics and potential
roadblocks that can affect collaboration within
humanitarian systems, building off the
approach we used in the DEPP evaluation.
NETWORK ANALYSIS OF RESILIENCE ACTORS IN BAGERHAT DISTRICT, BANGLADESH | 11
Below we describe the factors that influenced
our system analysis and our recommendations.
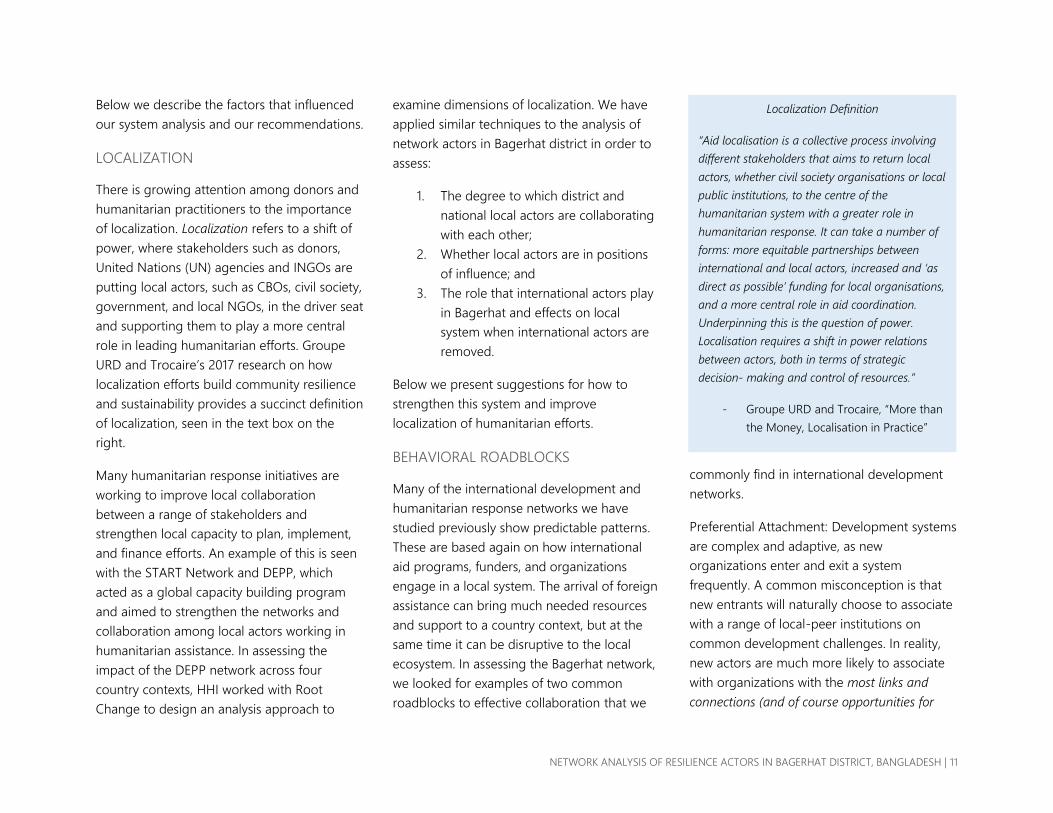
LOCALIZATION
There is growing attention among donors and
humanitarian practitioners to the importance
of localization. Localization refers to a shift of
power, where stakeholders such as donors,
United Nations (UN) agencies and INGOs are
putting local actors, such as CBOs, civil society,
government, and local NGOs, in the driver seat
and supporting them to play a more central
role in leading humanitarian efforts. Groupe
URD and Trocaire’s 2017 research on how
localization efforts build community resilience
and sustainability provides a succinct definition
of localization, seen in the text box on the
right.
Many humanitarian response initiatives are
working to improve local collaboration
between a range of stakeholders and
strengthen local capacity to plan, implement,
and finance efforts. An example of this is seen
with the START Network and DEPP, which
acted as a global capacity building program
and aimed to strengthen the networks and
collaboration among local actors working in
humanitarian assistance. In assessing the
impact of the DEPP network across four
country contexts, HHI worked with Root
Change to design an analysis approach to
examine dimensions of localization. We have
applied similar techniques to the analysis of
network actors in Bagerhat district in order to
assess:
1. The degree to which district and
national local actors are collaborating
with each other;
2. Whether local actors are in positions
of influence; and
3. The role that international actors play
in Bagerhat and effects on local
system when international actors are
removed.
Below we present suggestions for how to
strengthen this system and improve
localization of humanitarian efforts.
BEHAVIORAL ROADBLOCKS
Many of the international development and
humanitarian response networks we have
studied previously show predictable patterns.
These are based again on how international
aid programs, funders, and organizations
engage in a local system. The arrival of foreign
assistance can bring much needed resources
and support to a country context, but at the
same time it can be disruptive to the local
ecosystem. In assessing the Bagerhat network,
we looked for examples of two common
roadblocks to effective collaboration that we
commonly find in international development
networks.
Preferential Attachment: Development systems
are complex and adaptive, as new
organizations enter and exit a system
frequently. A common misconception is that
new entrants will naturally choose to associate
with a range of local-peer institutions on
common development challenges. In reality,
new actors are much more likely to associate
with organizations with the most links and
connections (and of course opportunities for
Localization Definition
“Aid localisation is a collective process involving
different stakeholders that aims to return local
actors, whether civil society organisations or local
public institutions, to the centre of the
humanitarian system with a greater role in
humanitarian response. It can take a number of
forms: more equitable partnerships between
international and local actors, increased and ‘as
direct as possible’ funding for local organisations,
and a more central role in aid coordination.
Underpinning this is the question of power.
Localisation requires a shift in power relations
between actors, both in terms of strategic
decision- making and control of resources.”
- Groupe URD and Trocaire, “More than
the Money, Localisation in Practice”

12 | PROGRAM ON RESILIENT COMMUNITIES
funding). Preferential attachment to centralized
actors reinforces the hegemony of a few key
actors, with negative consequences for
sustainability. Not surprisingly, when
international agencies set up operations, they
quickly become the target of preferential
attachment by local actors, where local actors
go primarily to these international agencies.
Preferential attachment can lead to positive
effects, such as local partners implementing
aid programs, but often donor attention on a
few local partners can make them “usual
suspects.” This reinforcement of “inner circle”
status can create preferential attachment
towards these few local actors as well. As a
result, networks can become dependent on a
few dominant actors, who have few incentives
to facilitate connections and embrace new
brokering roles that might potentially diminish
their own influence. We have looked for
presence of preferential attachment and
dominant actors in the full Bagerhat network
and across collaboration areas in our analysis.
Insularity: Another common feature of systems
is homophily – the tendency of individuals and
organizations to affiliate with others like
themselves. Organizations tend to restrict their
relationships to friends, colleagues, or peers
who often work in the same sector, have a
similar organization type, or have the same
beliefs, attitudes, and practices. This creates a
“small world” effect where clusters of
collaboration are composed of organizations
with common characteristics.
This insularity can complicate efforts to spread
new knowledge and ideas. Government actors,
NGOs, and donors are also susceptible to the
small-world syndrome. We have observed how
central actors with influence increasingly limit
ties to an “inner circle,” further isolating
themselves from new connections and
alternative viewpoints. In our analysis we have
looked for signs of insularity especially among
organization types such as CBOs, government,
INGOs, and local NGOs. We also look for other
drivers of homophily, including the age of an
organization and history of collaboration.
NETWORK ANALYSIS OF RESILIENCE ACTORS IN BAGERHAT DISTRICT, BANGLADESH | 13
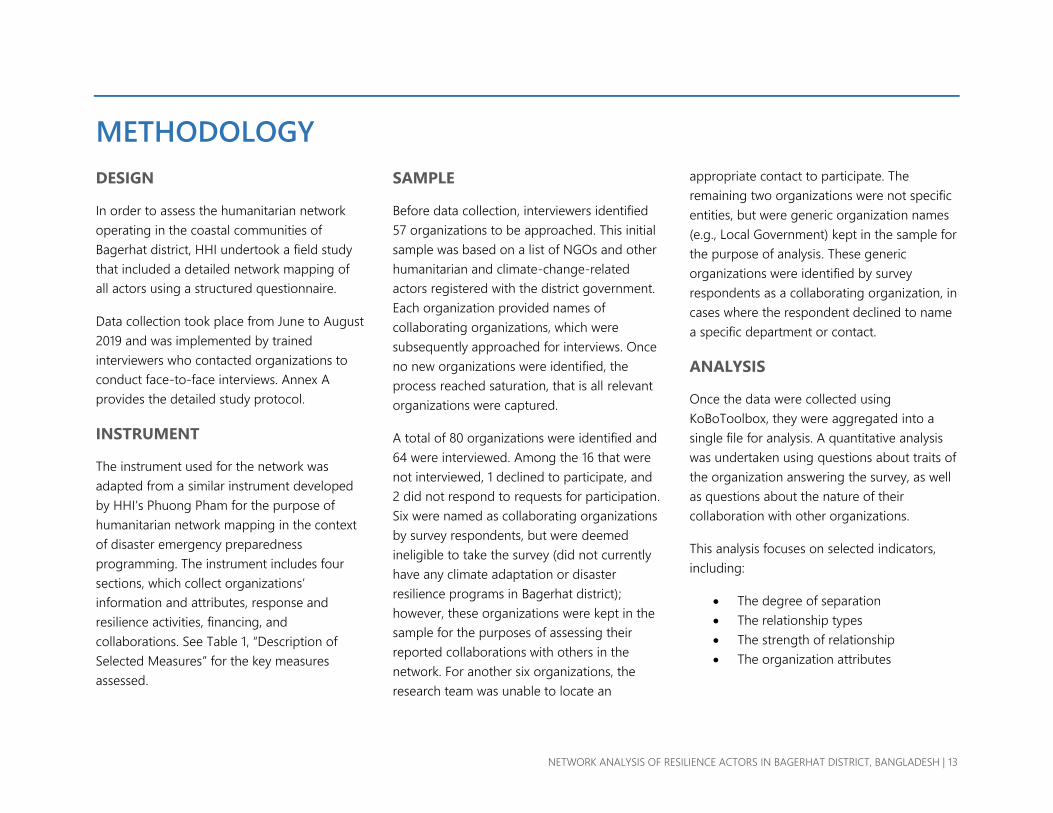
METHODOLOGY
DESIGN
In order to assess the humanitarian network
operating in the coastal communities of
Bagerhat district, HHI undertook a field study
that included a detailed network mapping of
all actors using a structured questionnaire.
Data collection took place from June to August
2019 and was implemented by trained
interviewers who contacted organizations to
conduct face-to-face interviews. Annex A
provides the detailed study protocol.
INSTRUMENT
The instrument used for the network was
adapted from a similar instrument developed
by HHI’s Phuong Pham for the purpose of
humanitarian network mapping in the context
of disaster emergency preparedness
programming. The instrument includes four
sections, which collect organizations’
information and attributes, response and
resilience activities, financing, and
collaborations. See Table 1, “Description of
Selected Measures” for the key measures
assessed.
SAMPLE
Before data collection, interviewers identified
57 organizations to be approached. This initial
sample was based on a list of NGOs and other
humanitarian and climate-change-related
actors registered with the district government.
Each organization provided names of
collaborating organizations, which were
subsequently approached for interviews. Once
no new organizations were identified, the
process reached saturation, that is all relevant
organizations were captured.
A total of 80 organizations were identified and
64 were interviewed. Among the 16 that were
not interviewed, 1 declined to participate, and
2 did not respond to requests for participation.
Six were named as collaborating organizations
by survey respondents, but were deemed
ineligible to take the survey (did not currently
have any climate adaptation or disaster
resilience programs in Bagerhat district);
however, these organizations were kept in the
sample for the purposes of assessing their
reported collaborations with others in the
network. For another six organizations, the
research team was unable to locate an
appropriate contact to participate. The
remaining two organizations were not specific
entities, but were generic organization names
(e.g., Local Government) kept in the sample for
the purpose of analysis. These generic
organizations were identified by survey
respondents as a collaborating organization, in
cases where the respondent declined to name
a specific department or contact.
ANALYSIS
Once the data were collected using
KoBoToolbox, they were aggregated into a
single file for analysis. A quantitative analysis
was undertaken using questions about traits of
the organization answering the survey, as well
as questions about the nature of their
collaboration with other organizations.
This analysis focuses on selected indicators,
including:
• The degree of separation
• The relationship types
• The strength of relationship
• The organization attributes
14 | PROGRAM ON RESILIENT COMMUNITIES
Most analysis was carried out using Python
coding language, including packages such as
NetworkX and DataFrames, to run social
network analysis algorithms and summary
statistics respectively. We used ORA, a tool
developed by CASOS at Carnegie Mellon for
network analysis, to create the network
images. In addition, the statistical software
package R was used for statistical significance
tests. Excel pivot tables provided additional
breakdowns of the data using multiple
variables and was used to create the pie charts
found throughout this report. The outputs of
all of the tools can be found in the annexes of
this report, organized in the same fashion as
the findings section.
DEGREES OF SEPARATION
Actors were eligible to participate in the survey
if they worked in Bagerhat district and
conducted any climate change adaptation or
disaster resilience work. The initial list of
respondents was based on a list of
humanitarian and climate-change-related
actors registered with the district government.
JJS facilitated introductions between these
actors and HHI’s enumerators.
The actors that were on the initial list were
asked with whom on the list they had
connections. They also were asked to name
additional actors who were not on this list but
work in climate change adaptation or disaster
resilience work in the district. Additional actors
named are considered to be 1st degree actors.
They are one degree of separation away from
the survey informant. The 1st degree actors
identified were then invited to also take the
network survey. The actors they identified are
2nd degree actors, as they are two degrees of
separation from the initial survey informant.
Through this process of nomination and
follow-up, HHI believes to have reached
almost every actor working in climate change
adaptation or disaster resilience in Bagerhat
district.
RELATIONSHIP TYPES
As part of the network survey, participants
identified the organization(s) with which they
had collaborated over the last six months.
They picked from a list of 38 collaboration
areas, representing a menu of topics in which
humanitarian actors are likely to engage.
Collaboration areas are the functional or
thematic areas in which organizations work
together. Participants could also name their
own areas of collaboration. Participants
identified 12 additional collaboration areas,
bringing the total to 50. This report
concentrates analysis on the full network and
the top four most frequently referenced
collaboration areas: Coordination, Advocacy,
Community Capacity Building, and Climate
Change Adaptation. For a complete list of
collaboration areas, see Annex C.
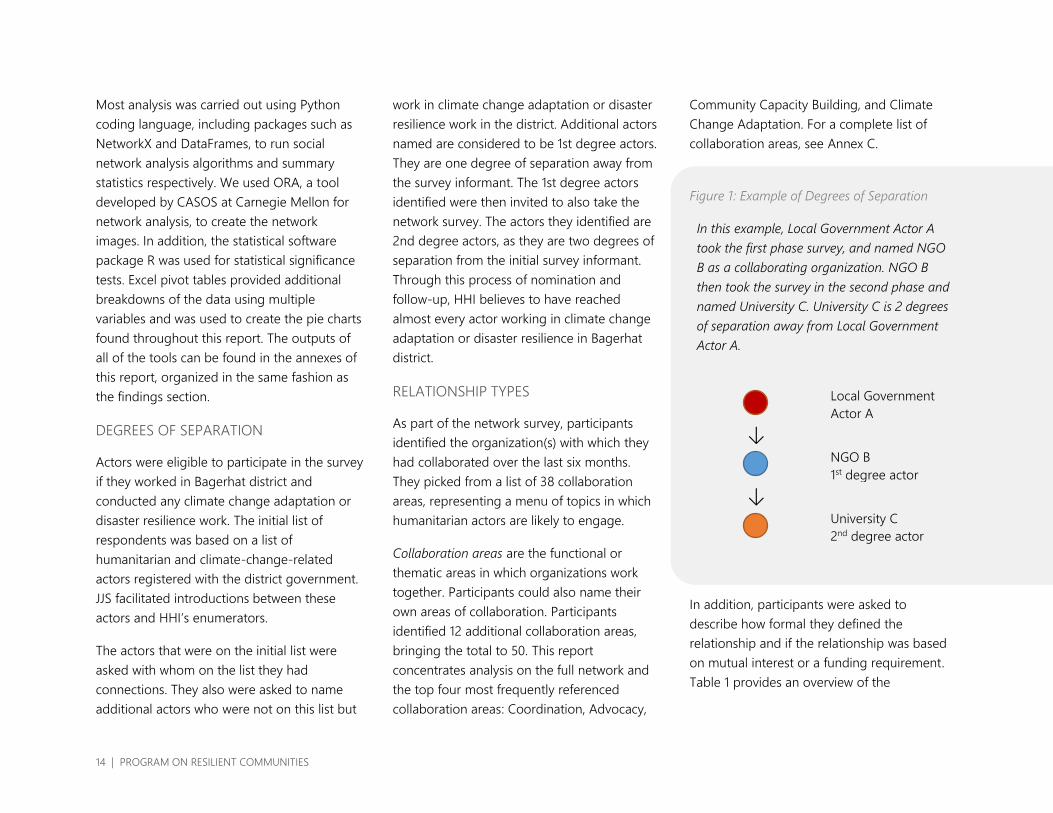
Figure 1: Example of Degrees of Separation
In this example, Local Government Actor A
took the first phase survey, and named NGO
B as a collaborating organization. NGO B
then took the survey in the second phase and
named University C. University C is 2 degrees
of separation away from Local Government
Actor A.
Local Government
Actor A
↓
NGO B
1st degree actor
↓
University C
2nd degree actor
In addition, participants were asked to
describe how formal they defined the
relationship and if the relationship was based
on mutual interest or a funding requirement.
Table 1 provides an overview of the
NETWORK ANALYSIS OF RESILIENCE ACTORS IN BAGERHAT DISTRICT, BANGLADESH | 15
information that was collected on relationship
type.
STRENGTH OF RELATIONSHIP
Survey participants were also asked to
describe attributes related to the strength of
the relationship. The first of these attributes
describes how frequently they collaborate with
the actors they identified. Frequency of
communication or interaction is a common
proxy for quality of relationship. The following
frequency scale was used:
• Rarely (1-2 times in the last 6 months)
• Occasionally (3-4 times in the last 6
months)
• Often (more than 6 times in the last 6
months
When an actor indicates frequent
collaboration, we hypothesize that there is
high trust and perceived value in continued
engagement.
In addition to frequency, respondents were
asked about how long they had collaborated
with an actor based on year increments, and
the likelihood they would recommend the
organization to another actor, which is a
common proxy for trust in a relationship. See
Table 1 for definitions of the attributes
collected on relationship strength.
ORGANIZATION ATTRIBUTES
For the actors surveyed, we captured a range
of attributes. See Table 1 for details on the
actor attributes collected.
RESULTS
Results of the analysis are reported using three
types of statistics:
1. Attributes summaries
Summary counts and percentages of
organization and relationship attributes
allow us to get a better sense of who is in
the network and what types of
relationships are present. For example, we
can answer questions such as: How many
INGOs are in the network vs CBOs? How
many relationships were reported for each
collaboration area? How frequently are
actors collaborating? In the findings
section, we have separated these by
organizational attributes, or information
about the survey respondent, and
relationship attributes, or information
collected about the nature of a given
relationship between two actors.
2. Network Statistics
Using social network analysis, we can learn
about a full system and its sub-systems.
For the full network and each sub-
network, we prepared a visualization and
calculated social network analysis statistics.
Network statistics include identifying key
actors that form the basis of this network
analysis – collaboration hubs, brokers, and
influencers. Each of these actor types play
different but equally valued roles within
the network. The aggregate impact these
three actor types have strongly affects the
viability of the system. Figure 2 defines
these three actor types.
Collaboration systems are dynamic and
often involve diverse sets of actors who
learn, adapt, self-organize and co-evolve
over time. Culture, values, beliefs, and
one’s peers all work to influence
relationships and interactions. Seemingly
small independent decisions – grant
money distributions, choice of program
partners, the selection of an international
versus a local NGO as an implementing
partner – can each have macro-level
impacts on the system. Therefore, roles
are continuously changing, as they are
based on the collaborations between and
among all actors in the network.
16 | PROGRAM ON RESILIENT COMMUNITIES
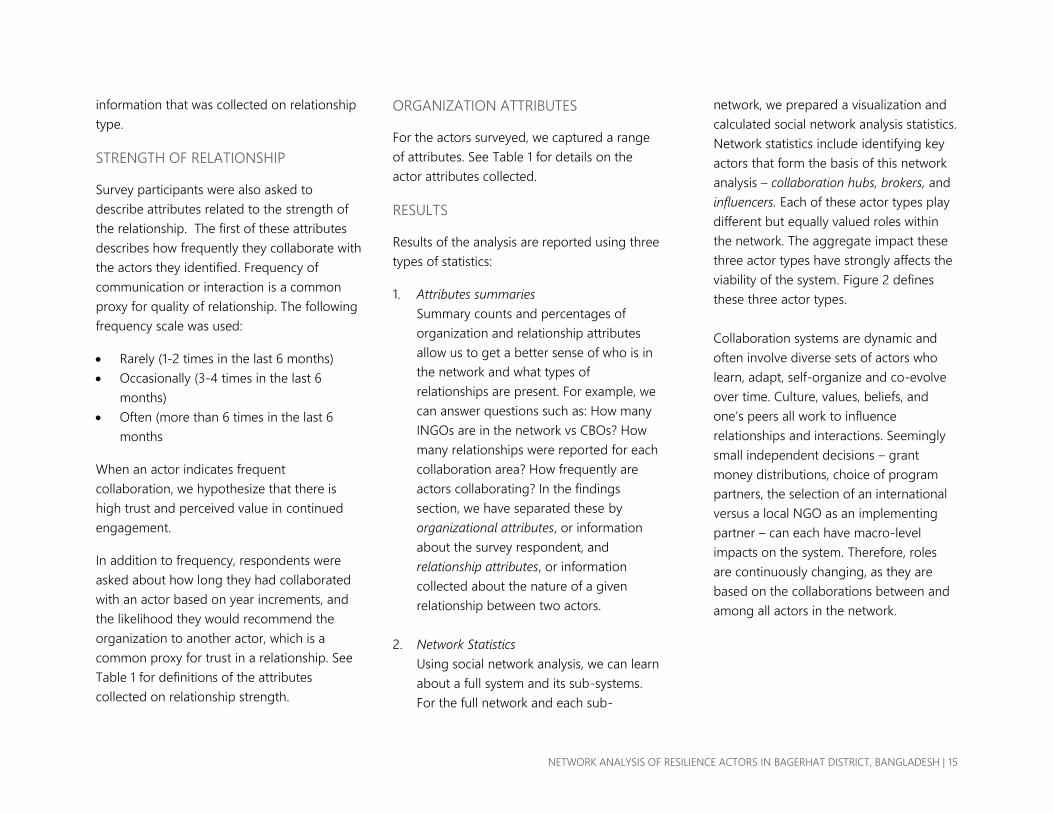
Figure 2: Types of Actors
Collaboration Hubs are sources and
distributors of subject matter expertise.
As intense gatherers and spreaders of
information, Collaboration Hubs are
often the first to pick up on new
trends. The SNA metric total degree
centrality is used to calculate these
scores.
Brokers introduce people and
institutions across an array of social,
cultural, professional and economic
circles. They often have exclusive ties
to unique actors and smaller sub-
groups, as well as direct ties to central
core agencies, such as funders and
international agencies. The SNA
metric betweenness centrality is used
to calculate these scores.
Influencers are connected to other
well-connected actors, and therefore
spread information quickly through
the system. Influencers are often “in
the know” and can help to get the
message out when rapid
communication is needed. The SNA
metric eigenvector centrality is used to
calculate these scores.
3. Collaboration Patterns
Attributes allow us to dive deeper into
specific groups of actors, or specific types
of collaboration. The analysis is separated
by whether it is based on relationship
attributes, organizational attributes, or
both. Most collaboration pattern analysis
in this report relies on a Social Network
Analysis (SNA) metric called E-I Index,
which stands for external-internal index.
By first defining a group of interest,
whether it be NGOs, CBOs, local actors,
district actors, etc., this metric uses
relationship counts to see whether actors
within that group are collaborating with
actors in their same group or actors in
other groups. This is of particular interest
when looking for insularity in a network.
For more information on this measure see
Annex C. We ran a correlation on scaled
attributes such as likelihood to
recommend another actor, or how long
actors have been collaborating. We also
ran chi-square tests for significance for
categorical attributes.
LIMITATIONS
While the study authors worked to avoid bias
in organization selection by using a list of
humanitarian and climate-change-related
actors registered with the district government,
it is possible that not all eligible respondents
working in Bagerhat district were identified. In
addition, this study was conducted with
logistical support from JJS and Concern
Worldwide, two NGOs (one local, one
international) working in Bagerhat district. JJS
and Concern Worldwide supported the study
team in outreach to prospective respondents,
which could have contributed to organizations’
bias in naming these two organizations as
collaborators.

NETWORK ANALYSIS OF RESILIENCE ACTORS IN BAGERHAT DISTRICT, BANGLADESH | 17
Table 1. Description of Selected Measures
Relationship
Type
Collaboration
Area
Organizations listed the other organizations with which they collaborate and selected the collaboration areas that described
their connection to each actor they nominated. Collaboration areas were chosen from a list or were written in; examples
include advocacy, community planning, funding, climate change adaptation, etc. For a full list of collaboration areas
identified, see Annex C.
Collaboration
Type
Organizations selected if their relationship with the actor is (1) a formal contractual relationship, (2) mainly information
sharing, (3) an informal partnership, or (4) created during a project (e.g., an NGO helped organize a CBO as part of a project,
and the NGO continues to collaborate with the CBO).
Collaboration
Reason
Organizations selected if their reason for collaborating with the actor is based on (1) mutual interest or (2) a funding
requirement.
Relationship
Strength
Frequency of
Interaction
Organizations selected the frequency with which they engaged with the actor in the past 6 months, with choices (1) often, (2)
occasionally, or (3) rarely.
Length of
Collaboration
Organizations selected incremental choices, such as less than 1 year, 1-5 years, 5-10 years, 10-15 years, and more than 15
years.
Likelihood to
Recommend
Organization
Organizations stated how likely their organization would be to recommend the actor for climate change or disaster resilience
work, based on a 1-10 Likert scale, with 1 being “not likely at all to recommend” and 10 being “very likely to recommend.”
Organization
Organization
Type
Respondents selected from 9 options: National NGO (has projects throughout the country), Local NGO (has projects in a
specific locality or region within country), Community-Based Organization/People’s Organization, International NGO,
International Organization (UN, IOM, World Bank, etc.), Government (national, district, sub-district, union, municipality, ward),
Academic Institution (University or College), Private Sector, or Media.
Organization Size
Respondents selected from choices of the number of employees at their organization. We then combined these choices into
the following categories: small (less than 100 employees), medium (100-1000 employees), or large (more than 1000
employees).
Organization
Focus
Respondents selected from the following categories: preparedness, risk reduction/resilience, response, adaptation, and/or
development. This variable was “choose all that apply.”
Local or
International Whether an actor is local (based in Bangladesh) or international (based in another country).
District, National,
or International
Further breakdown of the above by splitting choices into district (works only within Bagerhat District), national (works within
Bangladesh), or international.
18 | PROGRAM ON RESILIENT COMMUNITIES
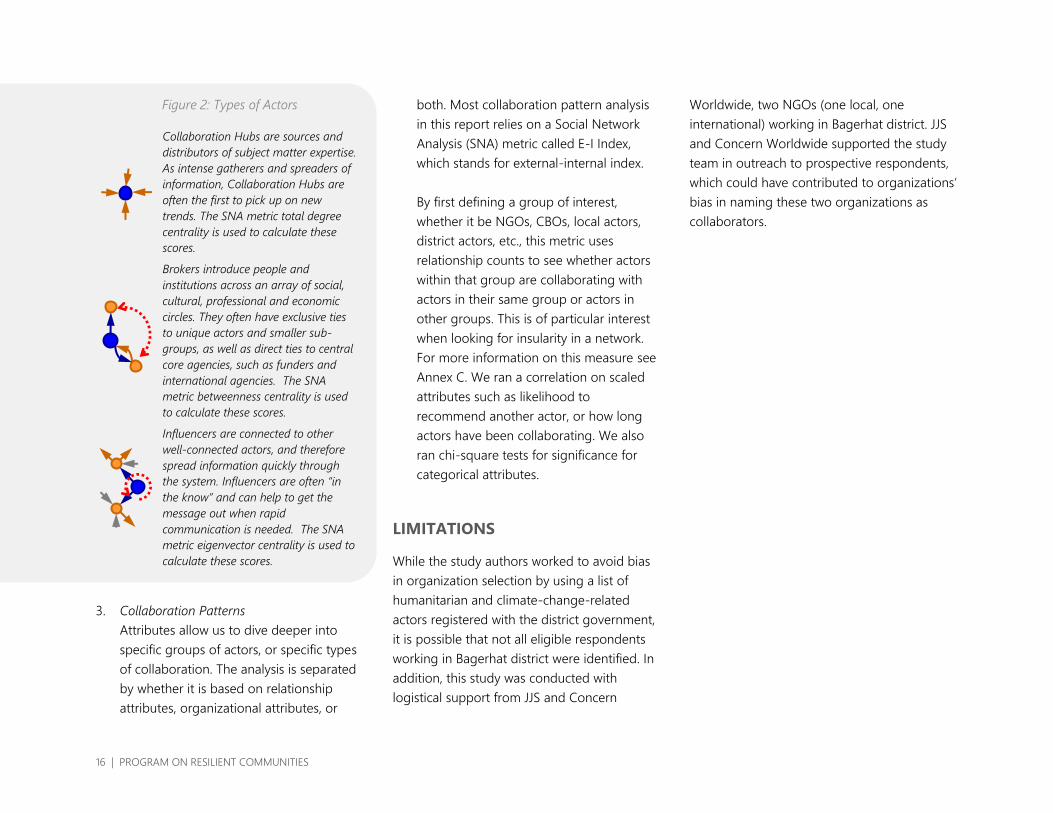
Network
Number of Organizations While there were 80 total organizations surveyed, not all of them will have relationships. This measure indicates the
number of organizations who have at least one relationship in the network.
Number of Relationships
The survey allowed and encouraged respondents to indicate all collaboration areas in which they worked with
another actor. This caused redundancy in the number of relationships between actors. Total number of relationships
is the number of relationships in the network, counting different collaboration areas separately. Number of unique
relationships only includes the number of relationships from one organization to another, and does not count
redundancy due to collaboration areas. The latter does preserve directionality of relationships, so a relationship from
actor A to actor B is counted separately from a relationship from actor B to actor A.
Average Number of
Collaboration Areas per
Relationship
This calculation takes the number of total relationships and divides by the number of unique relationships. In other
words, in how many collaboration areas the average two actors work together.
Average Number of
Relationships
This looks at how many total relationships each actor has and divides by the number of actors in the map. This is a
measure of how many connections each actor has.
Average Number of
Actors Each Actor is
Connected to
This looks at how many other actors each actor is connected to. First, we create a network that does not have
redundancy of collaboration areas or relationship directions. Then it looks at how many relationships each actor has
and divides by the number of actors in the map. This is another measure of how many others each actor knows.
Density
This Social Network Analysis (SNA) metric uses the number of actors in the network to determine the total number of
possible relationships. It then takes the number of actual relationships and divides by the total number of possible
relationships. This calculation does take into account relationship direction, but not redundancy of collaboration
areas.
Reciprocity
This metric divides the number of relationships that are reciprocal, or bidirectional between two actors, by the
number of actual relationships in the network to determine the percent of relationships that are reciprocal. This
calculation does take into account relationship direction, but not redundancy of collaboration areas.
Average Reach
This calculation uses the NetworkX algorithm local_reaching_centrality, which calculates the percentage of actors in
the network that can be reached by a single actor, using limitless degrees of separation. The algorithm provides a
score for each individual actor, so we then calculate an average based on the individual scores and total number of
actors in the network.

NETWORK ANALYSIS OF RESILIENCE ACTORS IN BAGERHAT DISTRICT, BANGLADESH | 19
FINDINGS
NETWORK OVERVIEW
The study identified a total of 80 actors
working to support climate change adaptation
and disaster resilience in Bagerhat District,
Bangladesh. Of these organizations, eight did
not have connections to any other
organizations. The other 72 organizations
reported 1312 total relationships with one
another.
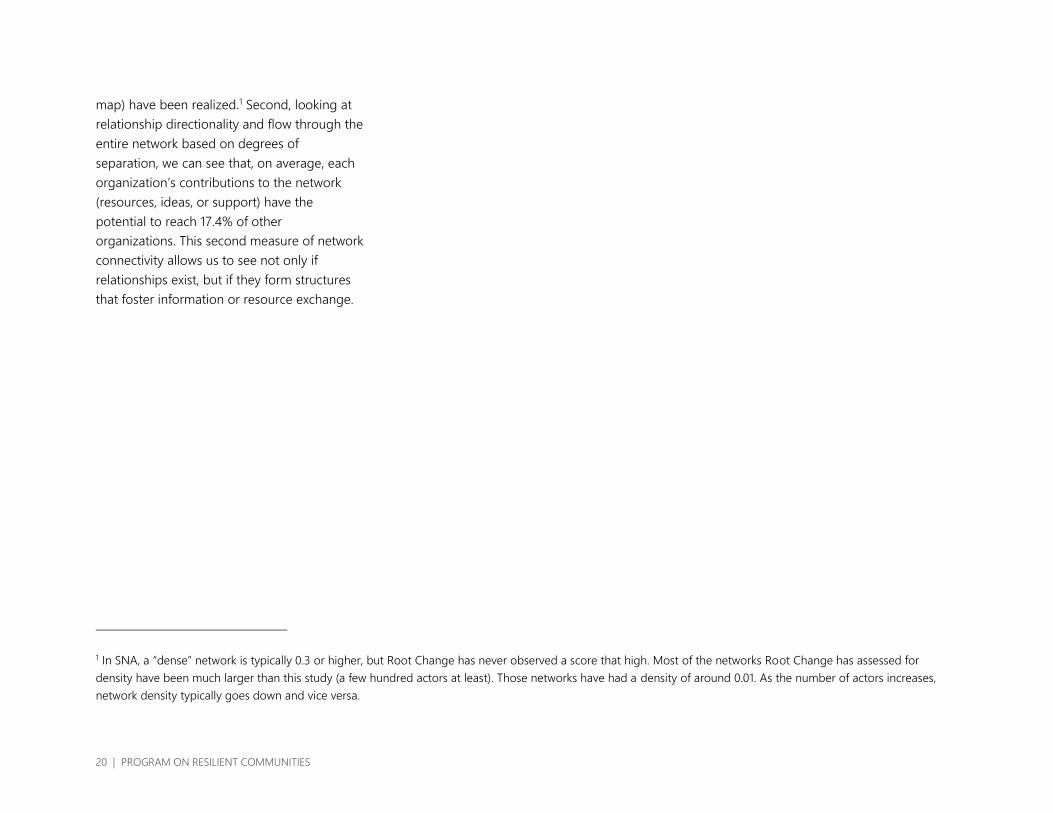
Figure 3 shows a visualization of the full
network. In this network, you can see a core
group of actors working actively together and
exchanging information, ideas, and support on
climate change adaptation and disaster
resilience. The network image in Annex B
zooms in on this core group of actors. There
are also some actors working on the periphery
or working in isolation. Actors in green
represent district-level actors, actors in blue
are national-level actors, and actors in red are
international organizations. Squares represent
large-sized organizations (more than 1000
employees), triangles are medium
organizations (100-1000 employees), and
circles are small organizations (less than 100
employees). We have sized actors by total-
degree centrality, which highlights which
actors in the system are collaboration hubs, or
are the most well-connected actors in the
network. We explore these actors more in the
Key Actor section of this report.
The full network, shown in Figure 3, is
comprised of 50 collaboration areas. In
collecting relationship data for a range of
collaboration areas, we were able to account
for both the presence of a relationship
between one organization to another, as well
as the number of different areas or topics
these two actors are collaborating around to
exchange information, ideas, and support. We
found there were 171 unique relationships,
meaning a relationship from one organization
to another, disregarding redundancy caused
by collaboration areas. This means that on
average, each organization went to another
organization for eight different collaboration
areas. For more on the top collaboration areas,
see the Sub-Network Analysis section.
On average, each organization has about 33
relationships (including redundancy in
collaboration areas) and knows about 4 other
organizations. These numbers can be skewed
by those who have many connections, but the
average helps us better understand how well-
connected someone in this system is likely to
be. The average can also serve as a benchmark
for the system, meaning that those who do
not have at least 33 relationships and know 4
other organizations might aim to do more
networking. For example, 28 actors know at
least 4 others in the network (35% of actors),
and 23 actors have at least 33 relationships
(28.8% of actors). For reference, the median
number of relationships per organization is 16,
and the median number of other
organizations a given organization knows is 2.
We use two measures to assess how well-
connected the network is: density and reach.
First, the density of the full network is 0.027. In
other words, 2.7% of all possible ties between
organizations (if each organization on the map
had a tie to every other organization on the
20 | PROGRAM ON RESILIENT COMMUNITIES
map) have been realized.1 Second, looking at
relationship directionality and flow through the
entire network based on degrees of
separation, we can see that, on average, each
organization’s contributions to the network
(resources, ideas, or support) have the
potential to reach 17.4% of other
organizations. This second measure of network
connectivity allows us to see not only if
relationships exist, but if they form structures
that foster information or resource exchange.
1 In SNA, a “dense” network is typically 0.3 or higher, but Root Change has never observed a score that high. Most of the networks Root Change has assessed for
density have been much larger than this study (a few hundred actors at least). Those networks have had a density of around 0.01. As the number of actors increases,
network density typically goes down and vice versa.
NETWORK ANALYSIS OF RESILIENCE ACTORS IN BAGERHAT DISTRICT, BANGLADESH | 21
Figure 3. Full Network, Climate Change Adaptation and Disaster Resilience in Bagerhat District, Bangladesh

22 | PROGRAM ON RESILIENT COMMUNITIES
OVERVIEW OF RELATIONSHIPS
SUMMARY OF FINDINGS FOR
COLLABORATION AREAS
In Bagerhat district, 50 total collaboration
areas were identified by organizations. Among
those, the greatest collaboration was found
within three areas: Coordination, Advocacy,
and Community Capacity Building, with 113,
89, and 88 relationships respectively. The next
top three collaboration areas, which ranged
between 79 and 60 relationships, included
Climate Change Adaptation, Project
Implementation, and Technical Assistance.
These six collaboration areas account for 40%
of all relationships. Figure 4 shows the number
of collaboration areas cited by organizations
and the range of total relationships reported in
each. Twenty-seven collaboration areas had
less than 19 relationships, accounting for over
half of collaboration areas. Among those were
Climate Mitigation and Disaster Preparedness,
two collaboration areas relevant to disaster
resilience, which were found to only have 1
relationship each. These were write-in
collaboration areas, where the person
answering the survey chose to create a new
category for them. Before a next round of
surveys, it would be good to explore why this
respondent felt like those categories were not
captured in the other choices, and why other
respondents did not also report relationships
in these areas. Early Warning System Expertise
33
6
11
27
100+-80
79-60
59-40
39-20
19-0
Number of Collaboration Areas
Number of Relationships
Figure 4. Number of Collaboration Areas versus Number of Relationships Identified in Each
NETWORK ANALYSIS OF RESILIENCE ACTORS IN BAGERHAT DISTRICT, BANGLADESH | 23
was also found to be on the low end of
collaboration, with only 28 relationships.
SUMMARY OF FINDINGS FOR
COLLABORATION TYPE AND REASON
In addition to collaboration areas, the network
survey asked about collaboration type (formal,
informal, or information sharing) and
collaboration reason (financially required or
mutual interests) to learn more about why
organizations are collaborating. In terms of
collaboration type, collaborations that are
informal or informational often do not have
explicit financial benefits, which indicate that
an actor values the work of the other
organization. Formal contracts could also be
by choice, but have an additional motivating
factor of financial benefits. In terms of
collaboration reason, a collaboration based on
mutual interests can also indicate that an actor
values the work of the other organization,
while a collaboration entered into due to
funding requirements can indicate that the
collaboration is not by choice. For this
network, collaboration is fairly evenly split
across all three collaboration types, and is
most often by choice rather than a
requirement imposed by a funder.
When looking at the reason for collaboration,
organizations cited that the majority of their
relationships were based on mutual interests,
accounting for 69.6%, with only 30%
relationships based on funding requirements.
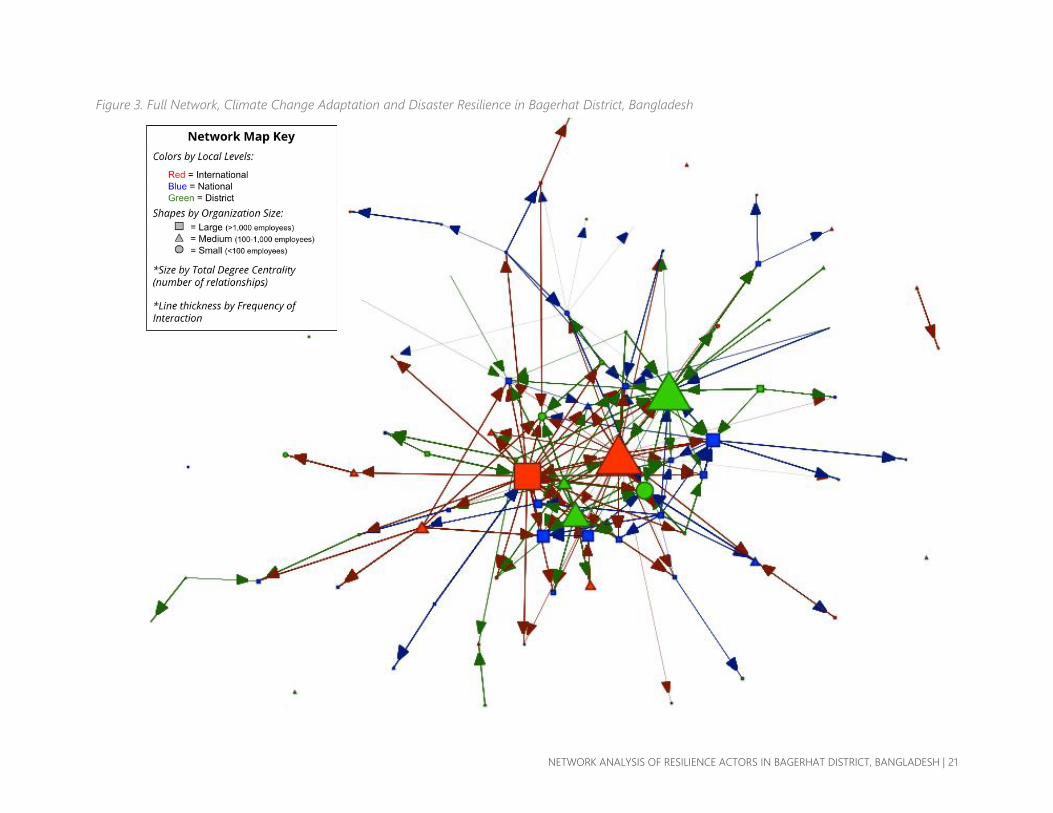
When looking at the type of collaboration,
formal contracts were the most commonly
cited relationship type, representing 42.35%,
followed by information sharing at 35.4%, and
informal partnerships at 21.7% (see Figure 5).
This suggests that informal partnerships are
not as common among actors, who typically
engage in formal partnerships or information
sharing.
When looking at the distribution of
collaboration reasons across collaboration
types, it appears that about half of informal
partnerships occur as funding requirements
(52.3%) and about half occur as a product of
mutual interests (47.7%). 99% of information
sharing relationships were due to mutual
interests, rather than funding requirements,
and this combination accounts for 35% of all
relationships reported in this study.
Collaborations which occur due to funding
requirements correspond most closely with
formal contracts or informal partnerships, and
not information sharing. A chi-square test
revealed that these patterns are statistically
significant (p<0.001). This indicates that
funding requirements lead to some sort of
partnership, whether formal or informal.
Table 2. Distribution of Collaboration Reason
across Collaboration Types
Mutual
Interests
Funding
Requirement
Formal
Contract 69.6% 30.4%
Informal
Partnership 47.7% 52.3%
Information
Sharing 99% 1%
42%
22%
35%
1%Formal
Contract
Informal
Partnership
Information
Sharing
Created During
Project/None
Figure 5. Percentage of Relationships by
Collaboration Type
24 | PROGRAM ON RESILIENT COMMUNITIES
SUMMARY OF FINDINGS FOR
RELATIONSHIP STRENGTH
The majority of actors in the disaster resilience
system in Bagerhat have more than a decade
of experience working with each other, they
interact frequently, and have high levels of
trust. This is evident both in how they have
described their relationships and in the
network structure.
The majority of organizations cited their
interaction with others as often, or more than
5 times in the last 6 months. This accounted
for 75.6% of relationships, which is quite high
and suggests that actors have many touch
points to meet and engage. This may also be
driven by high presence of formal partnerships
and mutual interests.
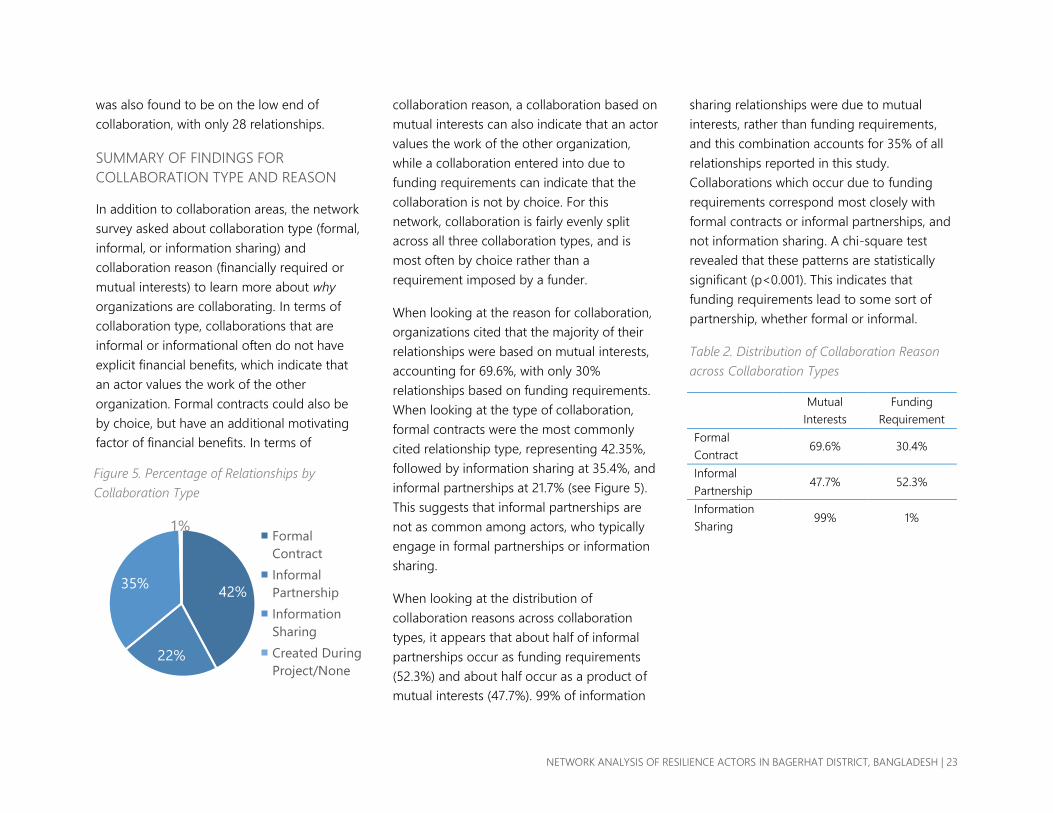
Over half of reported relationships, or 59.6%,
are between organizations who have known
each other for at least 10 years, with 34.3% of
relationships being between those who have
known each other for over 15 years. The
remaining 40.3% of relationships represent
actors who have known each other less than
10 years, with 23.9% being those who have
known each other for less than 3 years, or new
relationships within the district (see Figure 6).
This suggests that the majority of actors have
a history of working together, which may be
explained by the small size of the geography
of this system. High presence of long-term
relationships may also be an indicator of
preferential attachment of organizations who
have history with one another to stay within
their own small group.
Trust was also found to be moderate to high
among organizations. In the survey,
participants were asked how likely they are to
recommend their contacts to others on a scale
of 1-10, with 10 being extremely likely. This
question is commonly used as proxy for trust
or strength of relationship. We applied Net
Promoter Analysis (NPA) to assess these
relationships scores. NPA divides up scores in
the following way: organizations that give
scores between 9 and 10 are called
“promoters;” they are very pleased with the
relationships and would highly recommend
those actors. Within the network, 50.6% of
relationships received a score between 9 and
10. Organizations that give a score between 8
and 7 are considered to be “passives;” they
believe the relationship is okay, but may have
a few reservations. Within the network, 29.6%
of relationships received a score between 8
and 7. Organizations that give a score of 6 or
less are considered to be “detractors;” they
have more serious reservations about the
relationship, which indicates low levels of trust.
Within the network, 19.7% of relationships
received a score of 6 or less. Further analysis
would be needed to understand the reasons
why detractors gave low scores.
Net Promoter Analysis (NPA)
NPA is typically calculated on 0-10 scales for the
question, “How likely would you be to
recommend this organization?” Detractors are
calculated as a score of 6 or less. We have
adapted this approach for this question, which
was asked of participants in the survey on a 1-10
scale, meaning that we have considered
promoters to be scores of 9 and 10, passives to
be scores of 7 or 8, and detractors to be scores of
6 or less. For more information on NPA, please
visit https://www.netpromotersystem.com.
2%
22%
8%
9%25%
34%
Less than 1
year
1-3 years
3-5 years
5-10 years
10-15 years
More than 15
years
Figure 6. Percentage of Relationships by Length of
Collaboration

NETWORK ANALYSIS OF RESILIENCE ACTORS IN BAGERHAT DISTRICT, BANGLADESH | 25
When we ran a correlation between variables
representing how long actors have been
collaborating, how often they have been
collaborating, and how likely they are to
recommend the other actor, we found that
there was a significant (p<0.001) positive
correlation (0.347) between frequency of
interaction and likelihood to recommend the
other actor, and a significant (p<0.001) weak
positive correlation (0.126) between frequency
of interaction and how long the organization
has known the other actor. The was no
correlation between how long actors have
known someone and likelihood to recommend
them (p=0.182).
While interaction, history, and trust appear to
be high between the majority of actors in-
network, only 7% of relationships were found
to be reciprocal, or bidirectional between two
organizations. This suggests a small amount of
joint-initiatives or joint-collaboration between
actors. With a high number of formal
relationships within the network, we might
expect to see higher reciprocity. It may be that
within these formal partnerships there is more
of a one-way flow of information exchange as
opposed to two-way exchange, or that actors
display more “seeking” behavior, seeking
information or support rather than co-creating
and co-collaborating.
See Annex C for full tables of relationship
attributes in the network as well as results from
the correlation test.
OVERVIEW OF ACTORS
There are 62 local actors and 18 international
actors in the network. Of the 62 local actors,
30 work at the district level and 32 work at the
national level. In reviewing the types of actors
working in Bagerhat District, the largest group
was Government, with 24 actors (30%),
followed by National NGOs at 15% of actors,
and International NGOs at 14%. Figure 7
provides a breakdown of the actor types. Local
NGOs are particularly interesting, as they have
589 total relationships, or 44.9% of all
relationships in the network (the second
highest of any actor type), but only account for
9 actors in the network, or 11.3% of all actors. It
is important to note that one of the local
NGOs helped to launch the survey process
and identify all actors working in climate
change adaptation and disaster resilience in
Bagerhat. This actor brings many relationships
to the system and therefore skews the
numbers or local NGOs.
24
30%
12
15%
11
14%
4
5%
9
11%
8
10%
7
9%
4… 1…
Government (national, district, sub-
district, union, municipality, ward)
National NGO (has projects throughout
the country)
International NGO
International Organization (UN, IOM,
World Bank, etc.)
Local NGO (has projects in a specific
locality or region within country)
Community-based Organization /
People’s Organization
Private Sector
Academic Institution (University or
College)
Media
Figure 7. Percentage of Organization Types Found in Network
26 | PROGRAM ON RESILIENT COMMUNITIES
Academia, CBOs, media, and the private sector
were the smallest number of actor types found
engaging on climate change adaptation and
disaster resilience in the system. Only one
actor interviewed identified as a media
organization. However, media outlets were not
explicitly approached for participation in the
survey, because, while they are important for
advocacy and information sharing around
climate change and disasters, they are largely
not involved in program implementation for
resilience and adaptation.
When comparing the geographic focus of
actors, we found that 30 were district actors
(37.5%), 32 national actors (40%), and 18
international actors (22.5%). This shows that
within the district a majority of actors working
on climate change and disaster relief are local,
making up 77.5% of all actors, with
international actors accounting for 22.5% of
organizations working on these issues.
There were twice as many large organizations
found in the network, 41 or 51.3%, compared
to 20 medium and 19 small organizations. As
discussed in the Network Overview section
above, the top collaborators in the network
tended to be medium or large organizations.
This makes sense, as more people in an
organization means more potential for
collaboration and networking. Medium actors
were the most surprising, though, as they were
a small group of 20 actors (25% of the
sample), but had 849 total collaborations,
which is comparable to that of large
organizations, which had 934 total
collaborations.
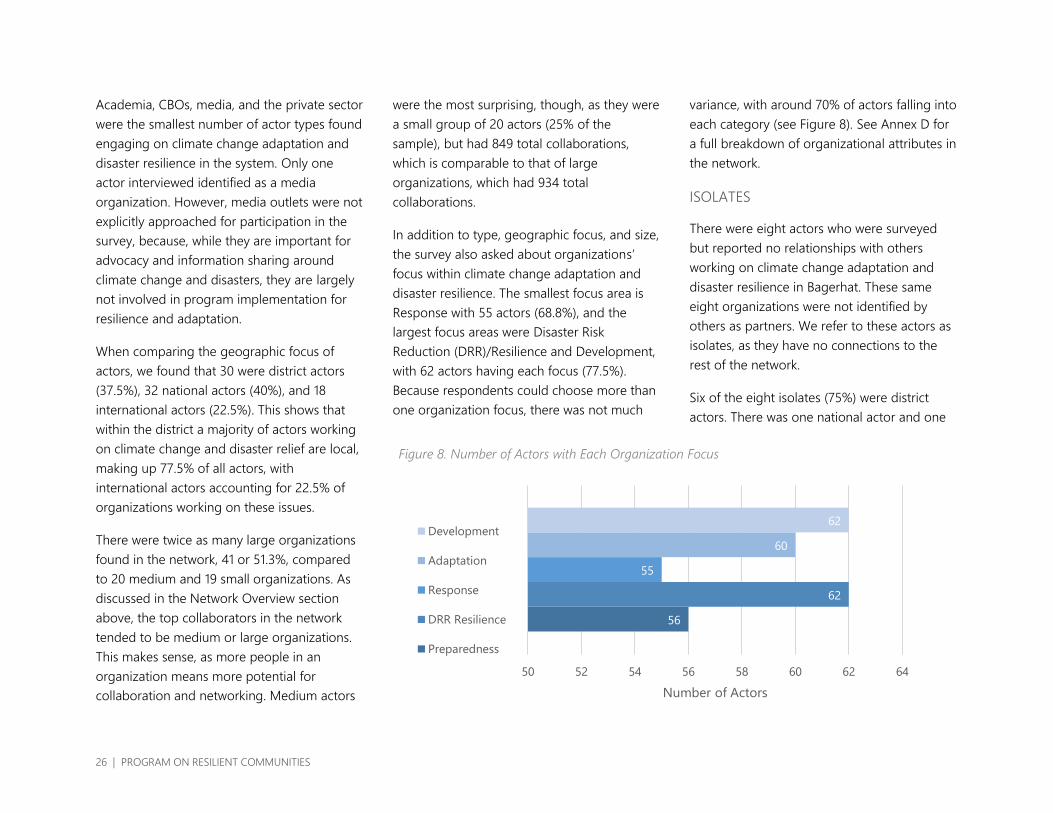
In addition to type, geographic focus, and size,
the survey also asked about organizations’
focus within climate change adaptation and
disaster resilience. The smallest focus area is
Response with 55 actors (68.8%), and the
largest focus areas were Disaster Risk
Reduction (DRR)/Resilience and Development,
with 62 actors having each focus (77.5%).
Because respondents could choose more than
one organization focus, there was not much
variance, with around 70% of actors falling into
each category (see Figure 8). See Annex D for
a full breakdown of organizational attributes in
the network.
ISOLATES
There were eight actors who were surveyed
but reported no relationships with others
working on climate change adaptation and
disaster resilience in Bagerhat. These same
eight organizations were not identified by
others as partners. We refer to these actors as
isolates, as they have no connections to the
rest of the network.
Six of the eight isolates (75%) were district
actors. There was one national actor and one
56
62
55
60
62
50 52 54 56 58 60 62 64
Number of Actors
Development
Adaptation
Response
DRR Resilience
Preparedness
Figure 8. Number of Actors with Each Organization Focus
NETWORK ANALYSIS OF RESILIENCE ACTORS IN BAGERHAT DISTRICT, BANGLADESH | 27
international actor. Half of the isolates were
CBOs (50%), two were government (25%), one
was in the private sector (12.5%), and one in
the media (12.5%). This last isolate was the
only actor in the network who was part of the
media, whereas there were additional actors in
the network for the other organization types.
Media as an isolate follows patterns found
elsewhere in this analysis around lack of media
engagement in this system. For example, there
were only 3 total relationships in the
Journalism/Media collaboration area, none
with the one media actor in the network.
CBOs as isolates also follows patterns found
elsewhere in this analysis around limited CBO
engagement. CBOs only accounted for 10% of
actors. They have no relationships with one
another (CBO to CBO engagement), and only
have a total of 30 relationships across all eight
CBOs, which is less than the network average
number of relationships per actor (33
relationships).
There were three large organizations (37.5%),
three medium organizations (37.5%), and two
small organizations (25%) in the isolate group,
which goes against earlier assumptions based
on the top collaborators of the network that it
2 Here, local actors include both district organizations and national organizations.
is easier for large organizations to be well-
connected.
One of the isolates only worked in response,
and another only worked in development. The
other isolates worked across at least three
areas of focus, with one isolate working in all
five areas of focus. Perhaps having only one
area of focus is limiting, but with most isolates
working in at least three areas of focus, this
does not seem to be a factor.
Further research is needed to determine why
these actors are isolates in the climate change
adaptation and disaster resilience network.
Geographic focus and organization type seem
to be factors, but organization size and focus
do not seem to be common trends among
these actors.
See Annex D for a list of the eight isolates in
the network.
COLLABORATION PATTERNS BETWEEN
ACTOR GROUPS
Using organization attributes, we can look at
collaboration more closely, answering
questions around who is collaborating. For
example, to what degree does collaboration
exist between local and international actors,
and between district and national actors? Is
there cross-collaboration happening between
different organization types, or actors with the
same focus? Cross-collaboration is important
to a network to prevent insularity, or
homophily, where actors only collaborate with
those like themselves. Using attributes around
whether actors are local or not also allows us
to explore localization, or whether cross-
collaboration is occurring among international
actors and local actors. Below is a summary of
findings across a range of questions.
Are local2 and international actors
collaborating?
In assessing the levels of collaboration
between local and international actors, we can
begin to see whether localization is emerging
in the network. Important to note is that
localization does not mean that international
actors are only going to local actors, as they
also need to coordinate with one another.
Instead, we are looking for a healthy balance
of relationships, which we do find in Bagerhat
district.
28 | PROGRAM ON RESILIENT COMMUNITIES
Of the 1312 relationships in the network, 1245
(95.0%) involve at least one local actor.
Roughly half of all relationships (46.4%) are
between one local and one international actor,
and roughly half of all relationships (48.5%)
are between two local actors. The remaining
relationships account for 67 total relationships
that the 17 international actors have with one
another. This last figure shows that
international actors are collaborating with one
another, but mostly collaborating with local
actors.
There are three times as many local actors with
relationships in the full network than
international actors (55 versus only 17), so it is
especially important that they are also
involved in most of the collaboration
happening in the network, which they are.
Further analysis reveals that international and
national actors have somewhat more
relationships (a total of 327 relationships) than
international and district actors (a total of 282
relationships). Additional analysis could reveal
whether international actors are hearing a
range of voices, meaning they are
collaborating with many different local actors,
or if international actors are going to the same
few local actors at each of these levels.
Are district and national actors collaborating?
Localization also applies at a more micro level,
inside a country for example. By analyzing
collaboration patterns between national and
district actors, we can begin to see if
localization is happening at the Bagerhat
district level. Overall, there is a healthy balance
of collaboration between district and national
actors, but national actors are collaborating
much more than international actors.
There are about the same number of district
actors as national actors in this network (30
and 32 respectively). Of the 48.5% of
relationships in the full network that are
between two local actors, about half of these
(53.8%) are between district and local national
actors, about a quarter (23.7%) are between
district actors only, and about a quarter
(22.5%) are between national actors only. This
represents a healthy balance, especially given
the even split in the number of district and
local national actors in the network.
Is there cross-collaboration between different
actor types?
For a resilient network, we expect to see actors
exchanging information, ideas, and support
across different actor types. In the climate
change adaptation and disaster resilience
network in Bagerhat, we see a large amount of
cross-collaboration between all actor types
(except media, which has no relationships),
meaning that actors are collaborating more
with those who are a different type of
organization than with those who are the
same type.
Government is involved in the highest amount
of cross-collaborations, with a ratio of 0.973
external to internal relationships. Of the 730
total relationships in the network including
government actors, 720 of these were to
organizations other than government. While
this helps to prevent insularity, the small
number of relationships between government
actors is worth noting. Government was the
largest group in the network, accounting for
30% of all actors, but those 24 government
actors only have 10 total relationships with one
another. This is an indication that government
actors are not collaborating with other
government actors on climate change
adaptation and disaster resilience, and that
some government actors are not exchanging
information with other government
departments.
The cross-collaboration ratio is also high for
international organizations (UN, IOM, World
bank, etc.) at 0.967, with 300 of 305
relationships being to other actor types. While
this means there are only five relationships
NETWORK ANALYSIS OF RESILIENCE ACTORS IN BAGERHAT DISTRICT, BANGLADESH | 29
between international organizations, there are
only four international organizations in the
network, so there should not be many
relationships between them. In fact, depending
on the structure of those relationships, four
relationships could connect all international
organizations to one another in a straight line
of information flow. Further analysis should be
done to see if any of these actors are working
in isolation.
Across all nine organization types, actors of
the same type are not collaborating much.
Local NGOs had the highest number of inter-
group relationships, or relationships between
local NGOs, with a total of 28 relationships.
This is especially notable because there were
only 9 local NGOs in the network. CBOs and
private sector actors are not collaborating with
one another at all.
Is there cross-collaboration between different
organization sizes?
For a resilient network, we also expect to see
actors exchanging information, ideas, and
support across different organization sizes.
There is a large amount of cross-collaboration
between different organization sizes, with all
sizes collaborating more with those who are a
different size than the same size. There is also
a healthy balance among all three
organization sizes of inter-group coordination.
Large organizations have the highest amount
of insularity of the three sizes with an external-
internal ratio of 0.415, but they are still
collaborating much more with small and
medium organizations than with large
organizations like themselves. Large
organizations also represented the largest
group of actors according to organization size
at 41 actors, or 51.3%, so this is to be expected.
Are organizations collaborating with those
who have the same focus?
HHI was also interested in exploring whether
organizations’ focus along the humanitarian to
development continuum affected
collaboration patterns.
Organizations could select that they have
more than one focus. About 70% of
organizations responded that they worked in
any given focus area, so the number of
relationships that include each focus area is
very high given the wide spread of possible
actors that can bring each focus to any given
collaboration. Because of this, the results of
this analysis are skewed and show very high
collaboration across organization focus areas.
One interesting finding is that every single
relationship that was reported includes an
actor focusing on DRR/Resilience, Adaptation,
and/or Development. These relationships
could have one actor that does all three, or
any combination across both actors who are
collaborating. 46 actors (57.5%) have all three
of these focus areas, so this is likely also
skewing these results, as relationships for
those 46 actors are contributing to these
findings without even looking at the second
actor in the relationship. These results indicate
that organizations in this system often work
broadly across the humanitarian continuum,
rather than specializing in one focus area.
See Annex D for tables indicating each actor
group, number of relationships within their
own group, number of relationships with those
outside of their group, total relationships for
that group, and a summary ratio based on the
SNA metric E-I index. This annex also includes
a table comparing presence of organization
focus on DRR/Resilience, Adaptation, and
Development.
ADDITIONAL COLLABORATION
PATTERNS BETWEEN ACTOR GROUPS
Combining organization and relationship
attributes, we can examine collaboration to
answer questions around how those specific
actors are collaborating. For example, do
different types of organizations collaborate in
different ways? This analysis expands on the
previous section and dives deeper into
collaboration between key groups of actors,

30 | PROGRAM ON RESILIENT COMMUNITIES
including local and international and the
various organization types. The specific
questions explored below were established
during pre-analysis planning between HHI and
Root Change.
How long have district, national, and
international actors been collaborating?
We know that there are signs of localization in
the network because international and local
actors are cross-collaborating, and that
international actors have more relationships
with national actors than with district actors.
We can now look at how long these groups
have been collaborating to get a better sense
of how long localization has been happening
and at which levels.
About a third of relationships between
national and international actors (32.4%) have
spanned only 1-3 years, but 45% of
relationships between these actor groups have
existed for at least 10 years. 23% of
relationships between international and district
actors span 1-3 years, and 62% have been
around for over 10 years. This indicates that in
recent years, international actors have more
connections with national actors than district
actors. Further analysis is needed to determine
if this is because national actors are becoming
more active in the district, because
international actors are prioritizing national
level relationships, or for other reasons.
In almost half of relationships between district
and national actors (44.4%), the actors have
been collaborating for more than 15 years,
indicating that localization on the micro level
has been occurring for a long time.
When looking within groups, international
actors have the youngest relationships with
one another, with nearly all relationships
(except one) falling into the 1-3 year category.
District actors have the oldest relationships
with one another, with 90.7% of their
relationships with one another being at least
10 years old. In all cases, district actors have
been working with one another for at least 3
years. National in-group relationships span the
choices, with the majority of relationships
(93.7%) being either more than 15 years or less
than 5 years. Further analysis, including
change over time of actors, might reveal
whether international actors are coming and
going into this system, a phenomenon that is
quite possible given international development
and humanitarian aid project cycles.
Do different types of organizations collaborate
in different ways?
Power dynamics can come from formal
contracts between granters and grantees—
INGO formal contracts with local NGOs or
CBOs, for example. To assess power dynamics,
we therefore looked at collaboration types
between different sets of organization types.
Academic institutions, CBOs, and private
sector actors only go to others working to
support climate change adaptation and
disaster resilience for formal contracts. This is
surprising for CBOs, who typically have similar
missions to INGOs or NGOs working in this
sector, but is unsurprising for academic
institutions and the private sector, who may
only come into the sector to work on research
or donate aid money or in-kind support.
Further research is needed to determine the
nature of these contracts.
International organizations do not go to
others for informal partnerships (only about
2% of their collaborations), but engage with
others for both information sharing (55.6% of
their relationships) and formal contracts (42%
of their relationships). National NGOs also go
to others most often for information sharing
(47.8% of their relationships). This indicates
that both international organizations and
national NGOs are actively seeking information
from others on this topic.
INGOs are the only actor type to have more
informal partnerships than any other type of
collaboration (37.3% of their relationships).
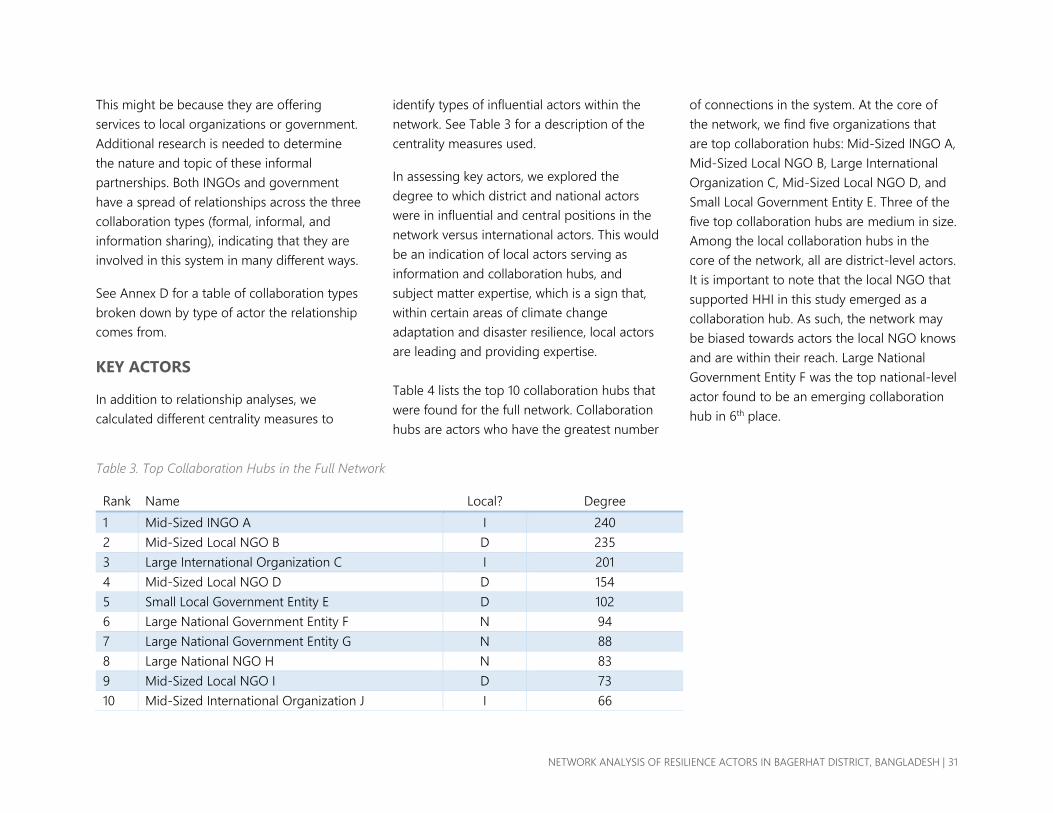
NETWORK ANALYSIS OF RESILIENCE ACTORS IN BAGERHAT DISTRICT, BANGLADESH | 31
This might be because they are offering
services to local organizations or government.
Additional research is needed to determine
the nature and topic of these informal
partnerships. Both INGOs and government
have a spread of relationships across the three
collaboration types (formal, informal, and
information sharing), indicating that they are
involved in this system in many different ways.
See Annex D for a table of collaboration types
broken down by type of actor the relationship
comes from.
KEY ACTORS
In addition to relationship analyses, we
calculated different centrality measures to
identify types of influential actors within the
network. See Table 3 for a description of the
centrality measures used.
In assessing key actors, we explored the
degree to which district and national actors
were in influential and central positions in the
network versus international actors. This would
be an indication of local actors serving as
information and collaboration hubs, and
subject matter expertise, which is a sign that,
within certain areas of climate change
adaptation and disaster resilience, local actors
are leading and providing expertise.
Table 4 lists the top 10 collaboration hubs that
were found for the full network. Collaboration
hubs are actors who have the greatest number
of connections in the system. At the core of
the network, we find five organizations that
are top collaboration hubs: Mid-Sized INGO A,
Mid-Sized Local NGO B, Large International
Organization C, Mid-Sized Local NGO D, and
Small Local Government Entity E. Three of the
five top collaboration hubs are medium in size.
Among the local collaboration hubs in the
core of the network, all are district-level actors.
It is important to note that the local NGO that
supported HHI in this study emerged as a
collaboration hub. As such, the network may
be biased towards actors the local NGO knows
and are within their reach. Large National
Government Entity F was the top national-level
actor found to be an emerging collaboration
hub in 6th place.
Table 3. Top Collaboration Hubs in the Full Network
Rank Name Local? Degree
1 Mid-Sized INGO A I 240
2 Mid-Sized Local NGO B D 235
3 Large International Organization C I 201
4 Mid-Sized Local NGO D D 154
5 Small Local Government Entity E D 102
6 Large National Government Entity F N 94
7 Large National Government Entity G N 88
8 Large National NGO H N 83
9 Mid-Sized Local NGO I D 73
10 Mid-Sized International Organization J I 66
32 | PROGRAM ON RESILIENT COMMUNITIES
Mid-Sized INGO A has both: a) the highest
total relationships (240), and b) connections to
the highest number of other actors in the
network (31). It is also a key broker (ranked 2nd
in the network with a betweenness centrality
score of 0.076). This means Mid-Sized INGO A
lies on the shortest path between other actors
in the network, and is well-positioned to
facilitate connections and information
exchange between others. A question for Mid-
Sized INGO A would be to what degree the
organization sees itself as a “broker” in the
system and is using its position to help
connect district and national actors to
coordinate and work together on common
issues. While Mid-Sized INGO A is well-
positioned to be a broker, more conversation
of these results is needed to determine if they
are playing this role. If this is not happening,
these findings could suggest that this
organization could be a bottle-neck to
information and idea flow.
The same is true for Mid-Sized Local NGO B
and Large International Organization C. Mid-
Sized Local NGO B has the second highest
number of total relationships (235) and has
connections to the third highest number of
actors (22). This local organization has the
highest broker score (0.094), and is also highly
visible in the network image as the large green
triangle in Figure 3. Large International
Organization C is a top actor as far as number
of relationships (201), number of actors it
knows (29), and broker score (0.041). This
international organization can be seen in the
network image as the large red square.
Small Local Government Entity E and Large
National Academic Institution W are the top
influencers in the network, with scores of 0.355
and 0.299 respectively. Influencers are those
who are connected to those in the network
who are very central and have a lot of
connections, and therefore have the ability to
pass information or ideas to or from powerful
actors. Some of these actors’ prominence may
be explained by their long-standing history in
the district. Mid-Sized INGO A, Mid-Sized
Local NGO B, and Mid-Sized Local NGO D
have relationships within district that are over
15 years old. Large International Organization
C appears to be a newer entrant, with
relationships only 3 years old. Mid-Sized INGO
A and Mid-Sized Local NGO B also share a
formal partnership based on mutual interest,
which may explain why they share many
connections between each other.
We see that local organizations have
prominent positions in the network, with Mid-
Sized INGO A and Large International
Organization C being two central international
organizations, and Mid-Sized Local NGO B
being a central district actor. This current
network state shows some potential signs of
preferential attachment towards these actors
and domination in the number of relationships
they hold. This raises several questions: What
history do these actors have working in the
district? To what degree do these actors use
their influence and high connectedness to help
connect other more isolated or peripheral
actors? How are these actors helping to
promote information, idea, and resource flows,
versus primarily funding or implementing
programs? If these actors are playing a
brokering and convening role, are helping to
connect other local actors with local experts,
and are supporting joint initiatives, over time
we would expect to see a wider distribution of
collaboration hubs among local NGOs,
government, CBOs, academia, and others in
the district.
See Annex E for tables of the top 25 actors
under each key actor measure, as well as
further definitions for those measures.
SUB-NETWORK ANALYSIS
Using organization and relationship attributes,
we pulled apart the layers of the full network
to look at dynamics within specific sub-
networks. The sub-network analysis included
an analysis of the top four collaboration areas,
NETWORK ANALYSIS OF RESILIENCE ACTORS IN BAGERHAT DISTRICT, BANGLADESH | 33
where collaboration was the highest among
actors. We also conducted a sub-network
analysis of collaboration between just local
actors, in order again to inform how localized
the network is and how the system is impacted
when international actors are removed.
COLLABORATION AREA ANALYSIS
The top four collaboration areas found in the
network were Coordination, Advocacy,
Community Capacity Building, and Climate
Change and Adaptation. These represent the
areas where district, national, and international
actors are collaborating the most to exchange
information, ideas, and support.
In each of the four sub-networks, the same
five key actors identified in the full network
analysis were found to have the highest
number of relationships across all four
collaboration areas (Mid-Sized INGO A, Mid-
Sized Local NGO B, Large International
Organization C, Mid-Sized Local NGO D, and
Small Local Government Entity E). These actors
also appear to have many common contacts
and connections with each other, with
Coordination being the most interconnected
collaboration area. This may be explained, as
mentioned above, by these organizations’
long-standing history in the system.
For each of these top collaboration area sub-
networks we find a more decentralized
network structure. In decentralized networks,
the flow of information can be controlled or
managed by a few key central actors. In the
case of these areas, the central actors are the
same top five collaboration hubs mentioned
earlier. The risk over time is that this may lead
to bottlenecks and peripheral actors becoming
dependent upon those central actors. A more
resilient system would ideally move towards a
more distributed structure, where there is
greater cohesion and links between multiple
actors in the network, allowing for a more
equal flow of information to all actors in the
network. Annex G provides an overview of
these network structures.
Each the four collaboration areas also have a
small number of isolates or islands that appear
in each network. An example of this is seen
with the Coordination sub-network in Figure 9.
See Annex F for visualizations of the top four
collaboration areas and a summary of network
health, including the top 10 actors in this
network broken down by whether they are
district, national or international.
COORDINATION NETWORK
This network has 62 actors that reported 113
relationships with one another. On average,
each organization in the network has about
3.6 relationships. There are no reciprocal
relationships, or bidirectional relationships
between two organizations, in this sub-
network, so that means each organization
knows about 3.6 actors. The network density is
0.03, meaning that around 3% of all possible
ties between organizations exist. This is denser
than the full network. On average, each
organization’s resources, ideas, or support has
the potential to reach 17.8% of other
organizations.
ADVOCACY NETWORK
The second largest collaboration area was the
Advocacy network. The top three actors by
total number of relationships for the advocacy
network were: Mid-Sized Local NGO B, Mid-
Sized INGO A, and Mid-Sized Local NGO D.
See Annex F for a list of the top 10 actors in
this network broken down by whether they are
local local, local national, or international.
Important to note when looking at the
network image is that, in all network images,
the actors are sized by number of relationships
in the full network. We can easily see that
density is lower in this network because there
are fewer lines between the actors.
This network has 62 actors that reported 89
relationships with one another. On average,
each organization in the network has about
2.9 relationships and knows about 2.8 actors.

34 | PROGRAM ON RESILIENT COMMUNITIES
The network density is 0.024, meaning that
around 2.4% of all possible ties between
organizations exist. This network has the same
density as the full network. Around 4.5% of
relationships are reciprocal, or bidirectional
between two organizations. On average, each
organization’s resources, ideas, or support has
the potential to reach 8.4% of other
organizations, which is much lower than the
other networks we have explored so far.
COMMUNITY CAPACITY BUILDING NETWORK
The third largest collaboration area was the
Community Capacity Building network. The
top three actors by total number of
relationships for the advocacy network were:
Large International Organization C, Mid-Sized
Local NGO B, and Mid-Sized INGO A. See
Annex F for a list of the top 10 actors in this
network broken down by whether they are
local local, local national, or international. We
can easily see the large number of
relationships that Large International
Organization C has compared to other
organizations in the network by looking at the
red lines coming from this actor.
This network has 54 actors that reported 88
relationships with one another. On average,
each organization in the network has about
3.3 relationships. There are no reciprocal
relationships, or bidirectional relationships
between two organizations, in this sub-
network, so that means each organization
knows about 3.3 actors. The network density is
0.031, meaning that around 3.1% of all possible
ties between organizations exist. This network
is denser than the advocacy network, even
though there are no reciprocal ties. On
average, each organization’s resources, ideas,
or support has the potential to reach 11.7% of
other organizations, which is also higher than
the advocacy network above.
CLIMATE CHANGE ADAPTATION NETWORK
The final collaboration area we explored was
Climate Change Adaptation, due to the focus
of this study. This network came in as the
fourth largest network when looking at
number of relationships. While we no longer
have redundancy of relationships (as we are
pulling out only one collaboration area), we
again are looking at the network of all actors
who have relationships in this collaboration
area.
This network has 52 actors that reported 76
relationships with one another. On average,
each organization in the network has about
2.9 relationships. There is only one reciprocal
relationship, or a relationship that is
bidirectional between two organizations, in
this sub-network. That relationship is between
Mid-Sized INGO A and Mid-Sized Local NGO
B. The network density is 0.029, meaning that
around 2.9% of all possible ties between
organizations exist. This network is slightly
denser than the full network. On average, each
organization’s resources, ideas, or support has
the potential to reach 10.4% of other
organizations, which is lower than the full
network.
The top three actors by total number of
relationships for the climate change
adaptation network were: Mid-Sized INGO A,
Mid-Sized Local NGO B, and Mid-Sized Local
NGO D. See Annex F for a list of the top 10
actors in this network broken down by
whether they are local local, local national, or
international.
LOCAL ACTOR SUB-NETWORK ANALYSIS
To further understand local collaboration
within the district and the level of localization,
we removed international actors from the full
network. This allowed us to visualize a network
of only local actors and their connections with
each other. When we did this, the local
network went from 80 total actors down to 62
actors and from 1312 total relationships to 636
relationships. This means that by removing a
total of 18 international actors the network lost
51% of relationships. This is quite high,
considering the fact that international actors
only account for 22% of the network actors.

NETWORK ANALYSIS OF RESILIENCE ACTORS IN BAGERHAT DISTRICT, BANGLADESH | 35
The loss of these international actors also
made 13 local actors isolates; you can see
these actors in Figure 10. This demonstrates a
potential weakness in the resilience of this
system and local actors’ ability to maintain
coordination and collaboration if international
actors withdraw their support.
The same top three local collaboration hubs,
Mid-Sized Local NGO B, Mid-Sized Local NGO
D, and Small Local Government Entity E
maintained their position as collaboration
hubs in the local network. See Annex F for a
list of the top 25 actors in this network broken
down by whether they work only at the
district-level or work nationally.
The top collaboration areas in the local actor
sub-network are: Coordination, Advocacy,
Climate Change and Adaptation, and
Community Capacity Building. These same
four were the top collaboration areas in the
full network, but Community Capacity Building
was third, and Climate Change and Adaptation
was fourth. Notable changes appear in the
Project Implementation and Technical
Assistance collaboration areas, which each lost
70% of relationships by removing international
actors. Project Implementation fell from 73
relationships down to 20 relationships, and
Technical Assistance moved from 72
relationships down to 22 relationships. This
indicates that, especially for these two areas,
international actors are involved in most
collaborations. For a full breakdown of the
collaboration areas in the local sub-network,
see Annex F.
In the local sub-network, there are 82 unique
relationships, or relationships from one
organization to another disregarding
redundancy caused by collaboration areas.
The average number of collaboration areas for
which each organization goes to another
organization is the same for the full network
and the local sub-network, at about eight
different collaboration areas. Each
organization in the network on average has
about 26 relationships and knows about 3
other organizations, which is one less
organization than in the full network. The
network density is 0.035, meaning that around
3.5% of all possible ties between organizations
exist, which is a higher density than the full
network. On average, each organization’s
resources, ideas, or support has the potential
to reach 12.2% of other organizations, which is
down from a reach of 17.8% in the full
network.
The number of reciprocal ties went down from
7% to 2.4%, which is significant drop. This
indicates that the majority of reciprocal ties are
between international and local actors. The
low level of reciprocal ties between local actors
could be another indication of a lack of joint-
initiatives or co-creation between local actors.
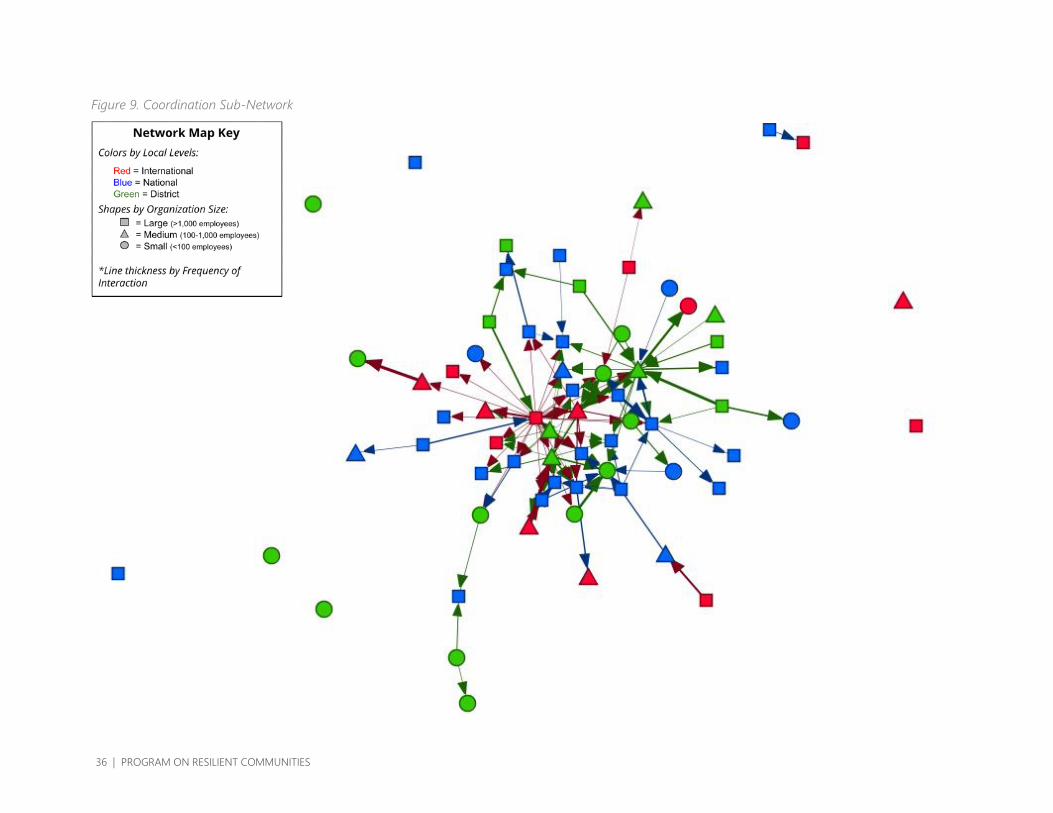
36 | PROGRAM ON RESILIENT COMMUNITIES
Figure 9. Coordination Sub-Network
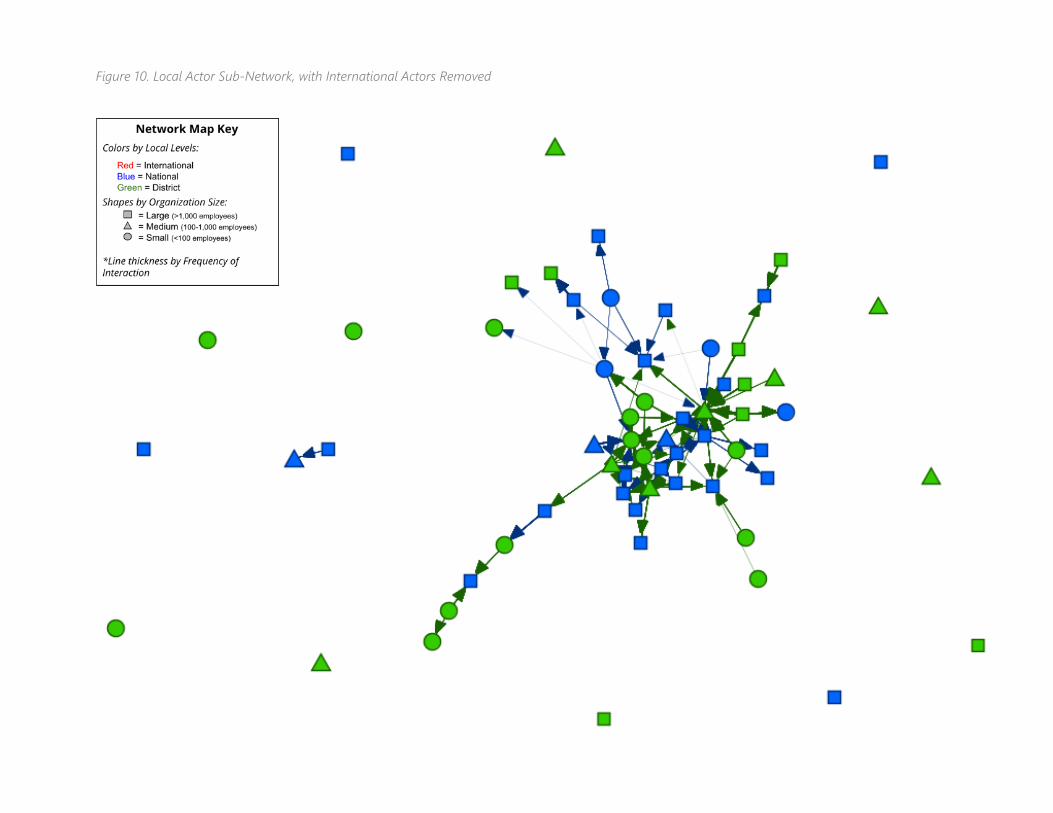
Figure 10. Local Actor Sub-Network, with International Actors Removed
38 | PROGRAM ON RESILIENT COMMUNITIES
CONCLUSION
In summary, this network analysis reveals a
fairly localized, fairly resilient network of
climate change adaptation and disaster
resilience organizations in Bagerhat district,
Bagerhat. This paper presents key findings
around localization, collaboaration patterns,
engagement within and across sectors, and
actor dominance within the network.
Key areas for exploration in efforts to advance
resilience of the network include:
• Increasing collaboration between local
actors, to support greater resilience when
international actors withdraw their
support. Multi-stakeholder platforms, such
as social labs or collective impact
strategies, that bring together diverse local
actors to work towards a common agenda
on issues related to climate change and
disaster resilience may foster this
collaboration. These platforms help to
emphasize mutual accountability and co-
creation between local actors and groups
and can help to support local system self-
reliance.
• Increasing engagement with academic
institutions, CBOs, the media, and the
private sector to draw on untapped
potential resources and knowledge and
further advance climate change and
disaster resilience in Bagerhat district.
• Promoting greater exchange of
information and learning between
government departments working on
climate change adaptation and resilience.
• Engaging organizations acting as the top
collaboration hubs in the network discuss
their role in the system and to determine if
there are actions these actors are taking or
could take to elevate other local actors
who are providing expertise, resources,
and support in the district. These key
actors can also help to connect others the
system, such as academic institutions,
CBOs, media, and the private sector, to
increase collaboration with these actors
throughout the network.

NETWORK ANALYSIS OF RESILIENCE ACTORS IN BAGERHAT DISTRICT, BANGLADESH | 39
ANNEXES
40 | PROGRAM ON RESILIENT COMMUNITIES
ANNEX A: PROTOCOL
INTRODUCTION
CONTEXT
Bangladesh is ranked seventh on the 1998–
2017 Climate Risk Index of countries most
affected by climate change; the country
experienced 190 extreme weather events
causing over 2.4 million USD in losses and
635.5 deaths annually during this period (1).
Located on the Bay of Bengal and in the
floodplains of several major rivers, Bangladesh
is particularly vulnerable to tropical cyclones
and seasonal flooding (2). These events, as
well as drought, storm surges, soil salinization,
and other climate change-related events, are
predicted to increase in frequency and severity
due to climate change (2). With a population
of 164.67 million and a land mass of only 147.6
square kilometers, the country has one of the
highest population densities in the world (3,4).
This high population density, combined with
high probability of natural disasters and low
levels of development, make Bangladesh
particularly vulnerable to climate change (5).
The country’s low-elevation coastal zones are
especially vulnerable to natural disasters, and
have already begun to see the effects of
climate change (6). These areas account for
over 40 percent of the country’s landmass and
49 percent of the country’s total population
(6). In recent years, these areas have been
significantly impacted by cyclones, sea level
rise, saltwater intrusion, coastal erosion,
flooding, and more (5,7,8). Agriculture is a key
economic activity; however, food yields in this
region are threatened by increasing
temperatures, unpredictability of monsoon
rains, soil salinization, and limited availability of
freshwater for consumption and irrigation (9).
These effects have threatened livelihoods and
food security and led to significant migration
from coastal areas to inland cities (7,10–12).
Thus, coastal communities in Bangladesh are
of significant humanitarian concern due to
their vulnerability to a range of natural
disasters as well as more gradual, but very
impactful, increasing threats from climate
change (2).
POPULATION
While many low- and middle-income countries
have a thriving community of international
non-governmental organizations (INGOs),
Bangladesh is unique in its long history of
domestic and local non-governmental
organizations (NGOs) working in disaster relief,
livelihoods, and development (13–15).
Following a series of deadly and destructive
natural disasters in the 1990s, the government
of Bangladesh, international donors, and
international and domestic NGOs invested in
disaster risk reduction and preparedness.
These efforts led to reduced loss of life in
future cyclones and floods (16). However,
significant challenges remain. While many
government, INGOs, and local NGOs
mobilized to provide disaster relief following
Cyclone Sidr in 2007 and Cyclone Aila in 2009,
studies have shown that lack of coordination
between actors hindered efficient delivery of
services (17,18).
This research will focus specifically on actors in
the disaster resilience and climate change
adaptation spaces that work in Bagerhat
district in Bangladesh. This district is highly
vulnerable in terms of food and water
insecurity, poverty, and health, and is also
vulnerable to disasters and climate change
impacts (19). The district was heavily impacted
by Cyclone Sidr, and is experiencing sea level
rise and saltwater intrusion – World Bank
estimates from 2014 project that freshwater
NETWORK ANALYSIS OF RESILIENCE ACTORS IN BAGERHAT DISTRICT, BANGLADESH | 41
zones in Bagerhat district will be reduced by
71-93 percent by 2050 (31).
THE VALUE OF A NETWORK ANALYSIS
APPROACH
Mapping stakeholders working to advance
climate change adaptation and disaster
resilience is a crucial first step to support
institutional strengthening and capacity
building (22). A number of studies of recent
emergencies in Bangladesh, including Cyclone
Sidr in 2007, Cyclone Aila in 2009, and the
ongoing Rohingya refugee crisis, recommend
mapping local organizations to promote
capacity building and coordination and to
strengthen disaster management and
response (17,18,23). Due to the number of
actors involved in disaster management and
response, coordination among actors during
an emergency is crucial for an effective,
efficient response (24,25). Studies have shown
that the existence of pre-disaster relationships
between actors can strengthen the speed with
which coordination occurs in a disaster setting,
making relationship-building before a disaster
an important element of preparedness (24,25).
Network analysis techniques seek to illustrate
and analyze formal and informal connections
between actors to build an understanding of a
network structure (24–26). Through this
analysis, processes of network governance,
influential actors, social capital, and
information flows become apparent (24–26).
This information is key to understanding how
these networks are able to leverage social
capital, exchange ideas, and work effectively
and efficiently before, during, and after a
disaster (27). It can also be used to support
interventions to increase coordination and
collaboration between stakeholders to support
disaster preparedness and climate change
adaptation activities (27).
STUDY PURPOSE AND RELEVANCE OF
FINDINGS
The study has two primary aims:
1) To understand the relationships
among actors supporting climate change
adaptation and disaster resilience work among
coastal communities in Bagerhat district,
Bangladesh, and
2) To develop a representation of the
disaster risk and resilience system in Bagerhat
through a depiction of the structure and
characteristics of the relationships among the
actors that make up the system.
The results of the proposed study will be used
to inform a research agenda and programs for
Harvard Humanitarian Initiative (HHI) and
other in-country partners to strengthen
disaster resilience and climate change
adaptation in these communities. This study
will adapt the Disasters and Emergency
Preparedness Programme (DEPP) evaluation’s
network analysis approach to the context of
coastal Bangladesh. The DEPP evaluation,
funded by the UK Department for International
Development (DFID), conducted an analysis of
actors in four DEPP countries to understand
network structures in these countries (27).
The findings of this study could be used in a
number of ways. For example, developing an
understanding of the actors and dynamics
within the implementation environment could
be used to design strategies to connect local
actors in the district to national and
international platforms during disasters. This
information could also inform the creation of
more effective means of collaboration, utilizing
and strengthening existing relationships and
platforms to more effectively share
information, coordinate work, and mobilize
resources before, during, and after
emergencies.
This research approach is being utilized in
both the Philippines and Bangladesh by HHI’s
Program on Resilient Communities. If found to
be effective in informing programs to
strengthen coastal community resilience and
actor coordination, this protocol could be
42 | PROGRAM ON RESILIENT COMMUNITIES
rolled out to rapidly assess the actor landscape
in other coastal areas in South East Asia or
elsewhere in the world to inform program
design.
METHODS
DESIGN
The study will utilize a quantitative survey and
network analysis of actors working in the
disaster resilience and climate change
adaptation spaces among coastal communities
in Bagerhat district, Bangladesh. As described
above, the study will adapt the quantitative
survey used by Pham, et al (unpublished) to
study connections between humanitarian
actors in the Philippines, Kenya, Ethiopia, and
Myanmar as part of the DEPP project (27). The
survey will include questions about respondent
organizations’ size, funding for resilience and
response activities, and types of resilience and
response activities conducted. It will also ask
respondents to identify the organizations with
which they collaborated in the past six months,
and will ask questions regarding the nature
and frequency of these collaborations as well
as trust in partner organizations.
SAMPLING
As conducted in Pham, et al (unpublished),
surveys will be conducted with established
actors in-country (27). The survey is designed
to provide results that are representative of
the organizations working in Bagerhat District,
Bangladesh. The sample population will
comprise all organizations (international and
local NGOs, government actors, private sector,
academic and research institutions, and
community-based organizations) doing work
related to climate change adaptation and
disaster resilience in coastal communities in
Bagerhat district. The initial sample will be
based on a list of NGOs and other
humanitarian and climate-change-related
actors registered with the district government.
This initial set of actors will be asked to
participate in the survey, and any additional
actors identified as collaborating organizations
through initial round surveys will also be asked
to participate using a snowball sampling
approach (27).
NGOs will be eligible to participate if they
work in Bagerhat district and conduct any
climate change adaptation or disaster
resilience work. In-country partners estimate
that there are approximately 50 organizations
that are eligible to participate in this research.
The recruitment process will be as follows:
1. Introduction by a partner organization
(JJS) staff member to colleagues at eligible
organizations identified in the Bagerhat District
Government’s list of registered organizations.
When contact is made, the research team will
provide information about the survey and
request permission of the agency director for
appropriate contact and permission to do the
survey interviews.
2. If no contact information for an
organization is known, the research team will
reach out to the communications person at
eligible organizations and request permission
of the agency director for appropriate contact
and permission to do the survey interviews.
3. Referrals to additional organizations
identified by respondents during the will be
used to identify contacts in additional eligible
organizations, and outreach will proceed as in
step 1.
DATA COLLECTION
The questionnaires will be programmed in
KoBo Toolbox, an electronic data collection
software, in both English and Bengali, so that
participants will be able to take the survey in
the language with which they are most
comfortable. The research team will also be
able to use the online platform to monitor
incoming data for quality and to revise the
survey as needed if issues arise. A similar,
ongoing survey in the Philippines found that
participants were not motivated to complete
NETWORK ANALYSIS OF RESILIENCE ACTORS IN BAGERHAT DISTRICT, BANGLADESH | 43
the survey when asked by email or phone; as
such, the surveys will be administered in
person. Two local enumerators with
experience conducting quantitative research
and who are fluent in Bengali and English will
be recruited to administer the survey.
Data will be collected between late June-early
August 2019. A member of the HHI research
team will train all enumerators and will
supervise the piloting of the survey. She will
accompany the enumerators for the first few
weeks of research, or as long as is needed for
the enumerators to feel comfortable using the
tool. When the HHI research team, local
partner organizations, and enumerators feel
that that the enumerators are able to
complete remaining data collection without
on-the-ground support, the HHI team will
supervise data collection remotely.
ANALYSIS AND REPORTING
Analysis of the data will include descriptive
statistics and key indicators from the survey, as
well as graphical representations of the
network. Descriptive statistics will include
number of organizations surveyed, average
and range of organization sizes, average and
range of percent of organization’s funding
devoted to disaster response and climate
change adaptation, etc. Key indicators
analyzed will include average number and
range of total and unique links per
organization, collaboration areas per link, most
common areas of collaboration, types of
collaboration (formal or informal; mandated or
self-initiated), frequency of collaboration,
likelihood of recommendation, etc. (27). As
much as possible, results will be stratified by
type of NGO (INGO, local NGO; small,
medium, large NGO; formal, informal
partnership; etc.) to identify whether or not
there are different patterns of networking and
collaboration between types of organizations
or in different types of collaborations.
In addition, network analysis maps will be
presented to illustrate network density and key
nodes in the network, with different symbols
used for type of NGO and number of links. As
was used in the DEPP evaluation, the statistical
software package R will be used for network
statistical significance tests, and the network
data will be analyzed using ORA, a tool
developed by CASOS at Carnegie Mellon for
network analysis (27).
The study’s preliminary results will be drafted
and participating organizations will be invited
to a results validation workshop to review the
data, provide feedback on the key trends
identified, and collaborate to identify next
steps and additional research questions to
inform future studies. After this workshop, the
report will be revised as needed and submitted
to a peer-reviewed journal.
ETHICS
To ensure protection of survey respondents
and local acceptability of the research, the
study protocol and questionnaire has been
approved by the Harvard T.H. Chan School of
Public Health’s Institutional Review Board (IRB)
as Non-Human Subjects Research. Because
the research only collects data regarding
organizations, and not individuals, the
approval of HHI’s full Community Advisory
Board (CAB) in Bangladesh will not be sought.
However, the protocol has been shared with
members of the CAB for their feedback and
insights. In order to protect the identify of
individual survey respondents, surveys will be
de-identified. Respondents will be fully
informed of the study purpose and intended
use of the data. All respondents will be
informed that their participation is voluntary
and that they are free to leave at any time
and/or skip any question they are
uncomfortable answering. All respondents will
be asked to provide informed consent before
participating in the survey.
Local researchers fluent in Bengali and English
will be recruited to administer the survey, and
will be trained in the use of Kobo Toolbox, the
questionnaire, and research ethics by the study
44 | PROGRAM ON RESILIENT COMMUNITIES
team before data collection begins. The
instruments will be piloted with local partner
organizations to ensure that questions are
clear and acceptable within the local context,
and the team will have regular debriefing and
review sessions to ensure quality and to refine
the survey as needed if issues arise.
LIMITATIONS
It is important to recognize that the network
structure and relationships captured in a
network analysis are dynamic (25). Similarly,
the activities actors conduct will change rapidly
due to funding cycles, changes in community
needs, etc. The network described in this
paper will change over time as actors enter
and exit the space, and as new relationships
form and previous relationships fade. While
this network analysis is helpful in informing
current programs, these results should only be
used to understand the landscape of actors at
the time the study was conducted. It will be
important to conduct follow-up studies to
observe changes in the network to inform
future programs.
In addition, it is possible that the study will not
be able to identify all actors working in the
study areas. Some local organizations may not
be registered with the district government, and
may not be identified by survey respondents.
REFERENCES
1. Eckstein D, Hutfils M-L, Winges M,
Germanwatch. Global Climate Risk Index 2019:
Who Suffers Most From Extreme Weather
Events? Weather-related Loss Events in 2017
and 1998 to 2017. Germanwatch; 2018.
2. UNDP-UN Environment National Adaptation
Plan Global Support Programme (NAP-GSP).
National Adaptation Plan process in focus:
Lessons from Bangladesh [Internet]. NAP-GSP;
2017 Nov [cited 2019 Mar 10]. Available from:
https://reliefweb.int/sites/reliefweb.int/files/res
ources/bangladesh_NAP_country_briefing.pdf
3. The World Bank. Country Profile:
Bangladesh [Internet]. The World Bank
DataBank. 2017 [cited 2019 Mar 15]. Available
from:
https://databank.worldbank.org/data/views/re
ports/reportwidget.aspx?Report_Name=Count
ryProfile&Id=b450fd57&tbar=y&dd=y&inf=n&
zm=n&country=BGD
4. The World Bank. Population density (people
per sq. km of land area) [Internet]. The World
Bank DataBank. 2017 [cited 2019 Mar 15].
Available from:
https://data.worldbank.org/indicator/en.pop.d
nst?year_high_desc=true
5. Leal Filho W, Modesto F, Nagy GJ, Saroar M,
YannickToamukum N, Ha’apio M. Fostering
coastal resilience to climate change
vulnerability in Bangladesh, Brazil, Cameroon
and Uruguay: a cross-country comparison.
Mitig Adapt Strateg Glob Change. 2018 Apr
1;23(4):579–602.
6. Neumann B, Vafeidis AT, Zimmermann J,
Nicholls RJ. Future Coastal Population Growth
and Exposure to Sea-Level Rise and Coastal
Flooding - A Global Assessment. PLoS One
[Internet]. 2015 Mar 11 [cited 2019 Mar
15];10(3). Available from:
https://www.ncbi.nlm.nih.gov/pmc/articles/PM
C4367969/
7. Rabbani G, Munira S, Saif S. Coastal
Community Adaptation to Climate Change-
Induced Salinity Intrusion in Bangladesh.
Salinity and Life [Internet]. 2018 Nov 5 [cited
2019 Feb 1]; Available from:
https://www.intechopen.com/online-
first/coastal-community-adaptation-to-
climate-change-induced-salinity-intrusion-in-
bangladesh
8. Karim M, Mimura N. Impacts of climate
change and sea-level rise on cyclonic storm
surge floods in Bangladesh. Global
Environmental Change. 2008 Aug;18(3):490–
500.

NETWORK ANALYSIS OF RESILIENCE ACTORS IN BAGERHAT DISTRICT, BANGLADESH | 45
9. N. Lázár A, Clarke D, Adams H, Razzaque
Akanda A, Szabo S, J. Nicholls R, et al.
Agricultural livelihoods in coastal Bangladesh
under climate and environmental change – a
model framework. Environmental Science:
Processes & Impacts. 2015;17(6):1018–31.
10. Edris Alam. Adaptation Actions, Migration
and Disaster Vulnerability of Bangladeshi
Coastal Communities [Internet]. Middle East
Institute; [cited 2019 Feb 1]. Available from:
https://www.mei.edu/publications/adaptation-
actions-migration-and-disaster-vulnerability-
bangladeshi-coastal
11. Bangladesh: A Country Underwater, a
Culture on the Move [Internet]. NRDC. [cited
2019 Feb 1]. Available from:
https://www.nrdc.org/onearth/bangladesh-
country-underwater-culture-move
12. Martin M, Kang Y hyun, Billah M, Siddiqui T,
Black R, Kniveton D. Climate-influenced
migration in Bangladesh: The need for a policy
realignment. Development Policy Review.
2017;35(S2):O357–79.
13. Zohir S. NGO Sector in Bangladesh: An
Overview. Economic and Political Weekly.
2004;39(36):4109–13.
14. Lewis D. Non-governmental organizations
and civil society in Bangladesh. In: Riaz A,
Rahman MS, editors. Routledge Handbook of
Contemporary Bangladesh [Internet]. London
and New York: Routledge; 2016. p. 11. Available
from:
https://www.researchgate.net/publication/299
570256_Non-
governmental_organizations_and_civil_society_
in_Bangladesh
15. Asian Development Bank. Overview of
NGOs and Civil Society: Bangladesh [Internet].
Asian Development Bank; 2008 Aug [cited
2019 Mar 12]. (Civil Society Briefs). Available
from:
https://www.adb.org/sites/default/files/publica
tion/28964/csb-ban.pdf
16. Cohen MJ, Ferguson K, Gingerich TR,
Scribner S. Righting the wrong: Strengthening
local humanitarian leadership to save lives and
strengthen communities [Internet]. Oxfam
America, Inc.; 2016 [cited 2019 Mar 12].
Available from:
https://oxfamilibrary.openrepository.com/bitstr
eam/handle/10546/595015/rr-righting-the-
wrong-260116-
en.pdf;jsessionid=0A30818EA9CBF9CE73EDC6
380ADFFC4E?sequence=1
17. Islam R, Walkerden G. How do links
between households and NGOs promote
disaster resilience and recovery?: A case study
of linking social networks on the Bangladeshi
coast. Nat Hazards. 2015 Sep 1;78(3):1707–27.
18. Sadik S, Nakagawa H, Rahman R, Shaw R,
Kawaike K, Fujita K, et al. Systematic Study of
Cyclone Aila Recovery Efforts in Koyra,
Bangladesh Highlighting the Possible
Contribution to Vulnerability Reduction.
Journal of Japan Society for Natural Disaster
Science. 2017;36:109–21.
19. Dasgupta S, Kamal FA, Khan ZH,
Choudhury S, Nishat A. River Salinity and
Climate Change: Evidence from Coastal
Bangladesh. The World Bank Development
Research Group Environment and Energy
Team; 2014 Mar. Report No.: 6817.
20. Government of Bangladesh. Cyclone Sidr in
Bangladesh. Government of Bangladesh; 2008
Apr p. 182.
21. ActionAid, Concern WorldWide,
DanChurchAid, MuslimAid, Islamic Relief,
Oxfam-GB, et al. In-depth Recovery Needs
Assessment of Cyclone Aila Affected Areas
[Internet]. 2009 Oct [cited 2019 Mar 16].
Available from:
https://reliefweb.int/sites/reliefweb.int/files/res
ources/F6603B7EF22A16B4C125768D004B1190
-Full_Report.pdf
46 | PROGRAM ON RESILIENT COMMUNITIES
22. Alcayna T, Bollettino V, Dy P, Vinck P.
Resilience and Disaster Trends in the
Philippines: Opportunities for National and
Local Capacity Building. PLoS Curr [Internet].
2016 Sep 14 [cited 2019 Mar 15];8. Available
from:
https://www.ncbi.nlm.nih.gov/pmc/articles/PM
C5061578/
23. Cook ADB, Ne FY. Complex Humanitarian
Emergencies and Disaster Management in
Bangladesh: The 2017 Rohingya Exodus
[Internet]. Singapore: Centre for Non
Traditional Security Studies (NTS Centre) S.
Rajaratnam School o International Studies;
2018 Jul [cited 2019 Mar 12]. (NTS Report).
Report No.: 11. Available from: https://think-
asia.org/bitstream/handle/11540/8498/NTS-
Report11-Bangladesh-HADR.pdf?sequence=1
24. Hossain L, Kuti M. Disaster response
preparedness coordination through social
networks. Disasters. 2010;34(3):755–86.
25. Weber C, Sailer K, Katzy B. Disaster relief
management - A dynamic network
perspective. In: International Technology
Management Conference. 2012. p. 167–76.
26. Levinger B, Bloom E. How National
Societies Achieve Sustainable Organizational
Development: A Multi-Country Study
[Internet]. American Red Cross, International
Federation of Red Cross and Red Crescent
Societies, Root Change; 2011 Aug [cited 2019
Aug 8] p. 48. Available from:
http://adore.ifrc.org/Download.aspx?FileId=83
606&.pdf
27. Pham P, Sharma V, Smart A, Hemno R,
Francois JJ, Gibbons N, et al. Network Analysis:
The impact of consortia collaboration on
disaster preparedness capacity building
[Internet]. Unpublished. Available from:
Personal Communication

NETWORK ANALYSIS OF RESILIENCE ACTORS IN BAGERHAT DISTRICT, BANGLADESH | 47
ANNEX B: ZOOM IN OF FULL NETWORK IMAGE

48 | PROGRAM ON RESILIENT COMMUNITIES
ANNEX C: OVERVIEW OF RELATIONSHIPS
COLLABORATION AREA COUNTS
Collaboration Area No. of Relationships
Coordination 113
Advocacy 89
Community Capacity Building 88
Climate Change and Adaptation 76
Project Implementation 73
Technical Assistance 72
Funding 59
Facilitation 54
Community Connections 48
Community Planning 48
Research 47
Community-Based Risk Analysis 44
Volunteers and Volunteer staff 39
Water, Sanitation, and Hygiene 37
Agriculture Expertise 34
Project Design 30
Early Warning Systems Expertise 28
Local Expertise 27
Management 26
Leadership 24
Logistics 23
Food Security and Livelihoods Expertise 21
Vulnerable Groups Expertise 21

NETWORK ANALYSIS OF RESILIENCE ACTORS IN BAGERHAT DISTRICT, BANGLADESH | 49
Proposal Writing 19
Monitoring, Evaluation, and Learning Expertise 17
Policy 15
Health/Public Health Expertise 15
Data Resources (including data sets, collection, and analysis) 15
Education 12
In-Kind Resources (e.g., meeting space) 11
Shelter Expertise 11
Conflict Mitigation Expertise 11
Child Protection Expertise 11
Finance Expertise (e.g., disaster insurance, loans, emergency funds, cash for work,
mobile money, other financial tools)
10
Gender-based Violence Expertise 9
Nutrition Expertise 9
Emergency Telecommunications 7
Journalism/Media 3
Technology/web Resources (e.g. server space, web site development, social media) 3
Natural Resource Management 2
Input Support 2
Climate Mitigation 1
Work with Fisheries Community 1
Infrastructure 1
Mangrove Planting 1
Disaster Preparedness Planning 1
Polder Management 1
Migration 1
Wildlife Human Conflict 1
Tidal River Management 1
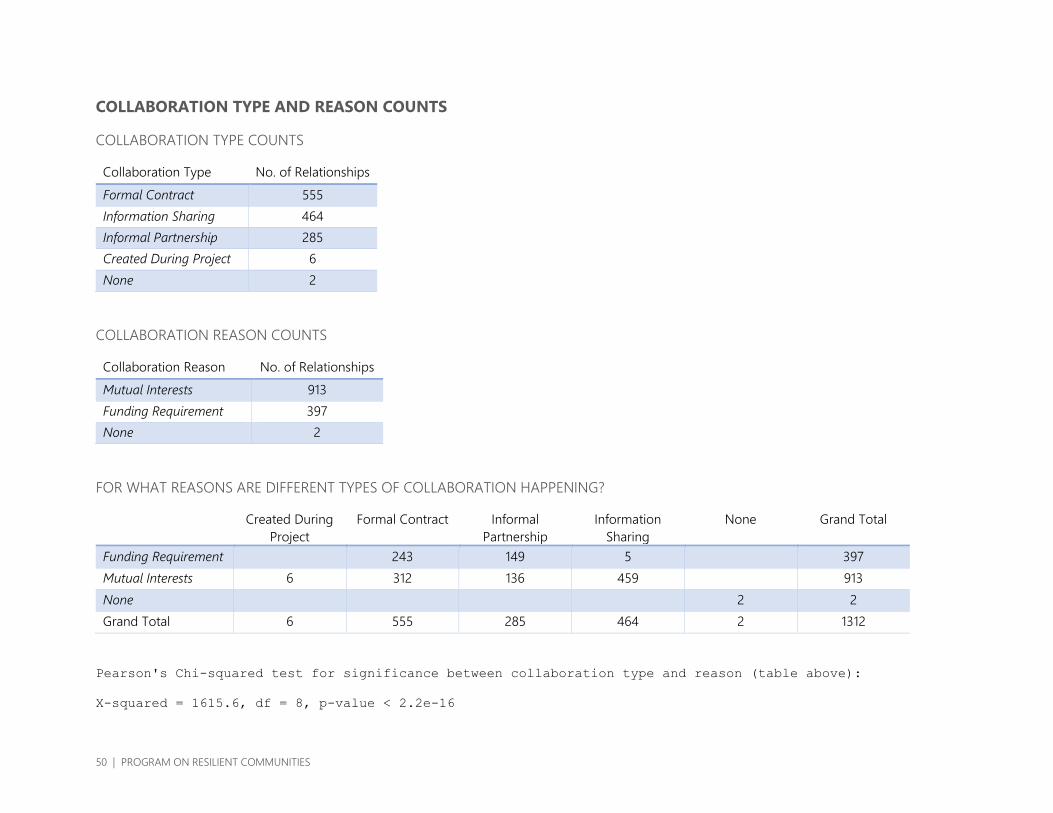
50 | PROGRAM ON RESILIENT COMMUNITIES
COLLABORATION TYPE AND REASON COUNTS
COLLABORATION TYPE COUNTS
Collaboration Type No. of Relationships
Formal Contract 555
Information Sharing 464
Informal Partnership 285
Created During Project 6
None 2
COLLABORATION REASON COUNTS
Collaboration Reason No. of Relationships
Mutual Interests 913
Funding Requirement 397
None 2
FOR WHAT REASONS ARE DIFFERENT TYPES OF COLLABORATION HAPPENING?
Created During
Project
Formal Contract Informal
Partnership
Information
Sharing
None Grand Total
Funding Requirement
243 149 5
397
Mutual Interests 6 312 136 459
913
None
2 2
Grand Total 6 555 285 464 2 1312
Pearson's Chi-squared test for significance between collaboration type and reason (table above):
X-squared = 1615.6, df = 8, p-value < 2.2e-16
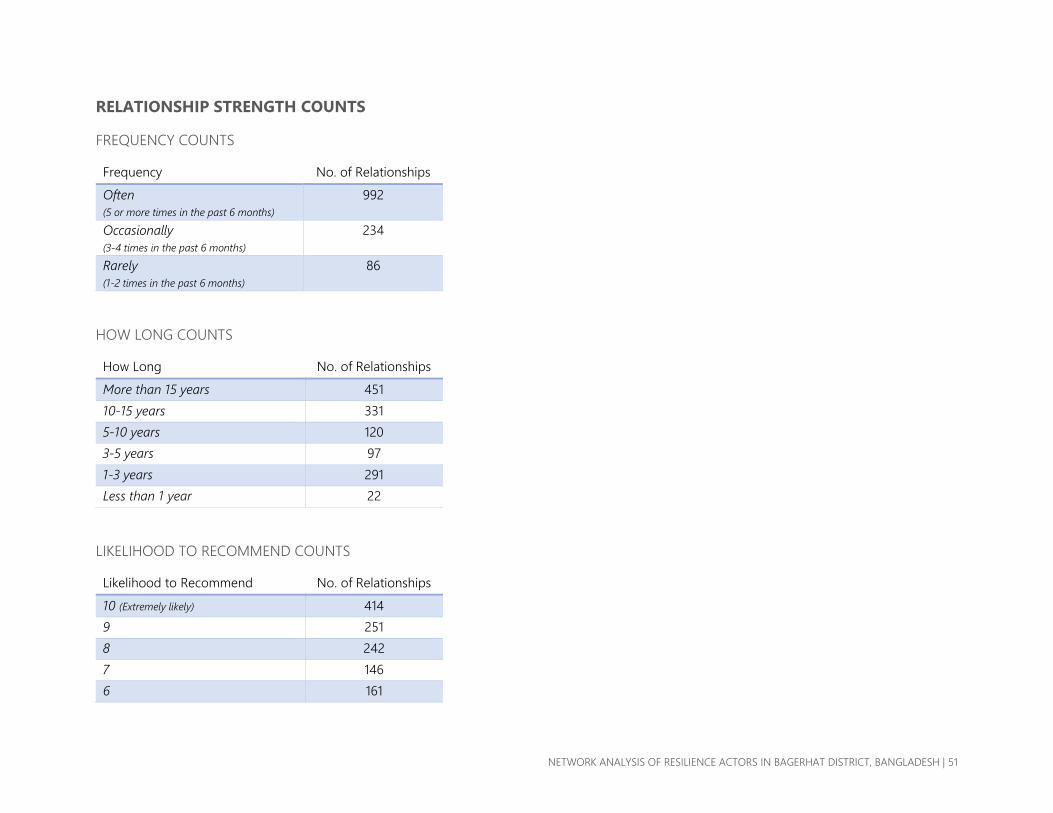
NETWORK ANALYSIS OF RESILIENCE ACTORS IN BAGERHAT DISTRICT, BANGLADESH | 51
RELATIONSHIP STRENGTH COUNTS
FREQUENCY COUNTS
Frequency No. of Relationships
Often
(5 or more times in the past 6 months)
992
Occasionally
(3-4 times in the past 6 months)
234
Rarely
(1-2 times in the past 6 months)
86
HOW LONG COUNTS
How Long No. of Relationships
More than 15 years 451
10-15 years 331
5-10 years 120
3-5 years 97
1-3 years 291
Less than 1 year 22
LIKELIHOOD TO RECOMMEND COUNTS
Likelihood to Recommend No. of Relationships
10 (Extremely likely) 414
9 251
8 242
7 146
6 161
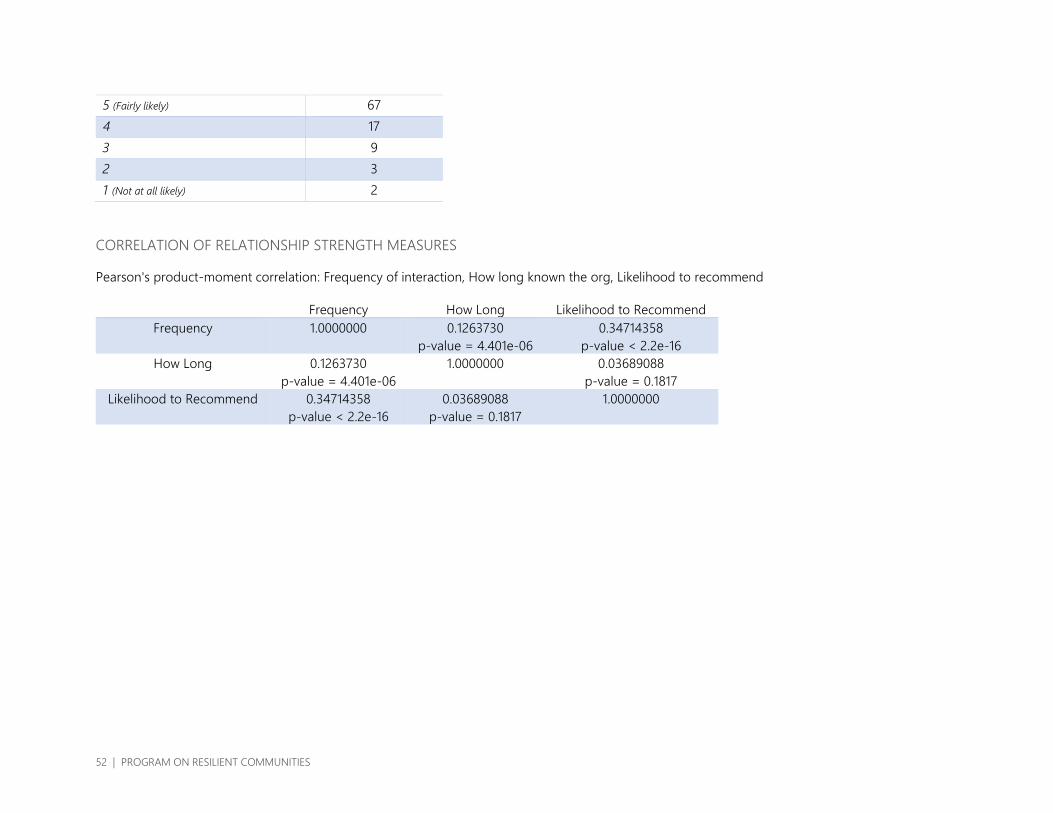
52 | PROGRAM ON RESILIENT COMMUNITIES
5 (Fairly likely) 67
4 17
3 9
2 3
1 (Not at all likely) 2
CORRELATION OF RELATIONSHIP STRENGTH MEASURES
Pearson's product-moment correlation: Frequency of interaction, How long known the org, Likelihood to recommend
Frequency How Long Likelihood to Recommend
Frequency 1.0000000 0.1263730
p-value = 4.401e-06
0.34714358
p-value < 2.2e-16
How Long 0.1263730
p-value = 4.401e-06
1.0000000 0.03689088
p-value = 0.1817
Likelihood to Recommend 0.34714358
p-value < 2.2e-16
0.03689088
p-value = 0.1817
1.0000000

NETWORK ANALYSIS OF RESILIENCE ACTORS IN BAGERHAT DISTRICT, BANGLADESH | 53
ANNEX D: OVERVIEW OF ACTORS
LOCAL VERSUS INTERNATIONAL COUNTS
Local Actor Actors Percent
Yes 62 77.5%
No 18 22.5%
DISTRICT, NATIONAL AND INTERNATIONAL COUNTS
Local Actor Actors Percent
District 30 37.5%
National 32 40.0%
International 18 22.5%
ORGANIZATION TYPE COUNTS
Organization Type Actors Percent
Government (national, district, sub-district, union, municipality, ward) 24 30.0%
National NGO (has projects throughout the country) 12 15.0%
International NGO 11 13.8%
Local NGO (has projects in a specific locality or region within country) 9 11.3%
Community-based Organization / People’s Organization 8 10.0%
Private Sector 7 8.8%
Academic Institution (University or College) 4 5.0%
International Organization (UN, IOM, World Bank, etc.) 4 5.0%
Media 1 1.3%
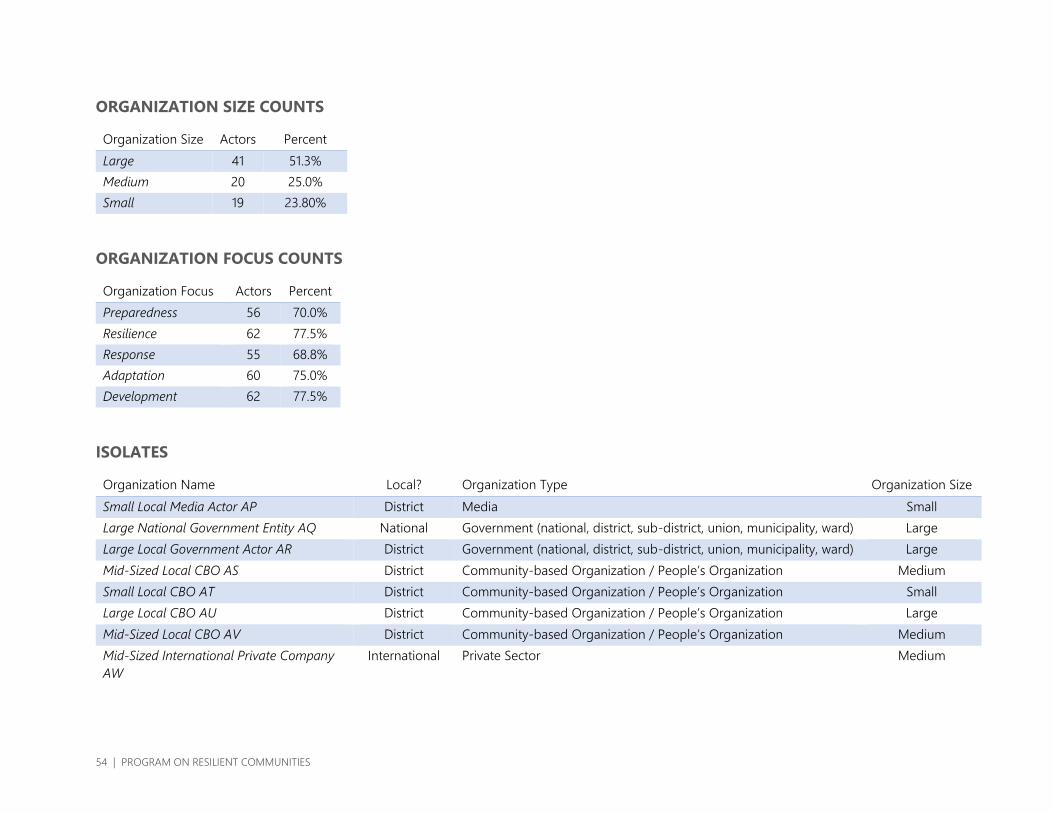
54 | PROGRAM ON RESILIENT COMMUNITIES
ORGANIZATION SIZE COUNTS
Organization Size Actors Percent
Large 41 51.3%
Medium 20 25.0%
Small 19 23.80%
ORGANIZATION FOCUS COUNTS
Organization Focus Actors Percent
Preparedness 56 70.0%
Resilience 62 77.5%
Response 55 68.8%
Adaptation 60 75.0%
Development 62 77.5%
ISOLATES
Organization Name Local? Organization Type Organization Size
Small Local Media Actor AP District Media Small
Large National Government Entity AQ National Government (national, district, sub-district, union, municipality, ward) Large
Large Local Government Actor AR District Government (national, district, sub-district, union, municipality, ward) Large
Mid-Sized Local CBO AS District Community-based Organization / People’s Organization Medium
Small Local CBO AT District Community-based Organization / People’s Organization Small
Large Local CBO AU District Community-based Organization / People’s Organization Large
Mid-Sized Local CBO AV District Community-based Organization / People’s Organization Medium
Mid-Sized International Private Company
AW
International Private Sector Medium
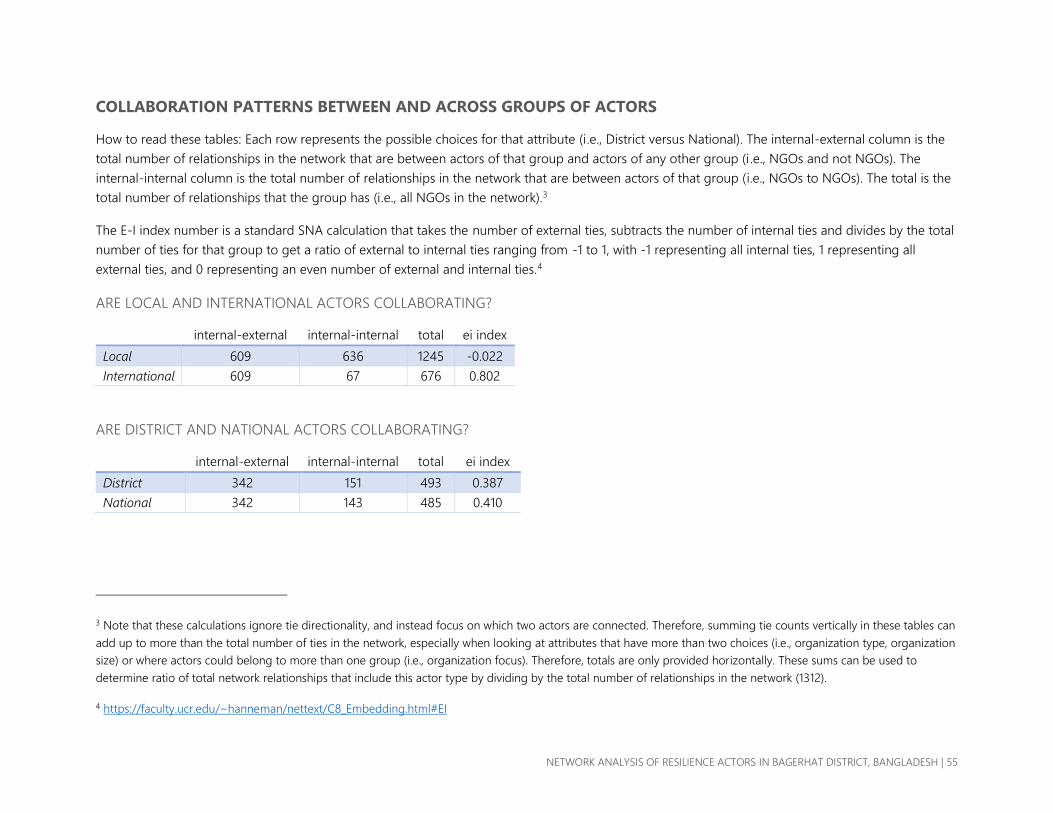
NETWORK ANALYSIS OF RESILIENCE ACTORS IN BAGERHAT DISTRICT, BANGLADESH | 55
COLLABORATION PATTERNS BETWEEN AND ACROSS GROUPS OF ACTORS
How to read these tables: Each row represents the possible choices for that attribute (i.e., District versus National). The internal-external column is the
total number of relationships in the network that are between actors of that group and actors of any other group (i .e., NGOs and not NGOs). The
internal-internal column is the total number of relationships in the network that are between actors of that group (i.e., NGOs to NGOs). The total is the
total number of relationships that the group has (i.e., all NGOs in the network).3
The E-I index number is a standard SNA calculation that takes the number of external ties, subtracts the number of internal ties and divides by the total
number of ties for that group to get a ratio of external to internal ties ranging from -1 to 1, with -1 representing all internal ties, 1 representing all
external ties, and 0 representing an even number of external and internal ties.4
ARE LOCAL AND INTERNATIONAL ACTORS COLLABORATING?
internal-external internal-internal total ei index
Local 609 636 1245 -0.022
International 609 67 676 0.802
ARE DISTRICT AND NATIONAL ACTORS COLLABORATING?
internal-external internal-internal total ei index
District 342 151 493 0.387
National 342 143 485 0.410
3 Note that these calculations ignore tie directionality, and instead focus on which two actors are connected. Therefore, summing tie counts vertically in these tables can
add up to more than the total number of ties in the network, especially when looking at attributes that have more than two choices (i.e., organization type, organization
size) or where actors could belong to more than one group (i.e., organization focus). Therefore, totals are only provided horizontally. These sums can be used to
determine ratio of total network relationships that include this actor type by dividing by the total number of relationships in the network (1312).
4 https://faculty.ucr.edu/~hanneman/nettext/C8_Embedding.html#EI

56 | PROGRAM ON RESILIENT COMMUNITIES
IS THERE CROSS-COLLABORATION BETWEEN DIFFERENT ACTOR TYPES?
internal-external internal-internal total ei index
Local NGO (has projects in a specific locality or region within country) 561 28 589 0.905
Government (national, district, sub-district, union, municipality, ward) 720 10 730 0.973
National NGO (has projects throughout the country) 357 7 364 0.962
International NGO 387 16 403 0.921
Community-based Organization / People’s Organization 30 0 30 1.000
Private Sector 63 0 63 1.000
Academic Institution (University or College) 64 5 69 0.855
International Organization (UN, IOM, World Bank, etc.) 300 5 305 0.967
Media 0 0 0 0.000
IS THERE CROSS-COLLABORATION BETWEEN DIFFERENT ORGANIZATION SIZES?
internal-external internal-internal total ei index
Small 307 57 364 0.687
Large 661 273 934 0.415
Medium 702 147 849 0.654
ARE ORGANIZATIONS COLLABORATING WITH THOSE WHO HAVE THE SAME FOCUS?
internal-external internal-internal total ei index
Preparedness 350 947 1297 -0.460
DRR Resilience 254 1058 1312 -0.613
Response 336 960 1296 -0.481
Adaptation 359 953 1312 -0.453
Development 231 1081 1312 -0.648
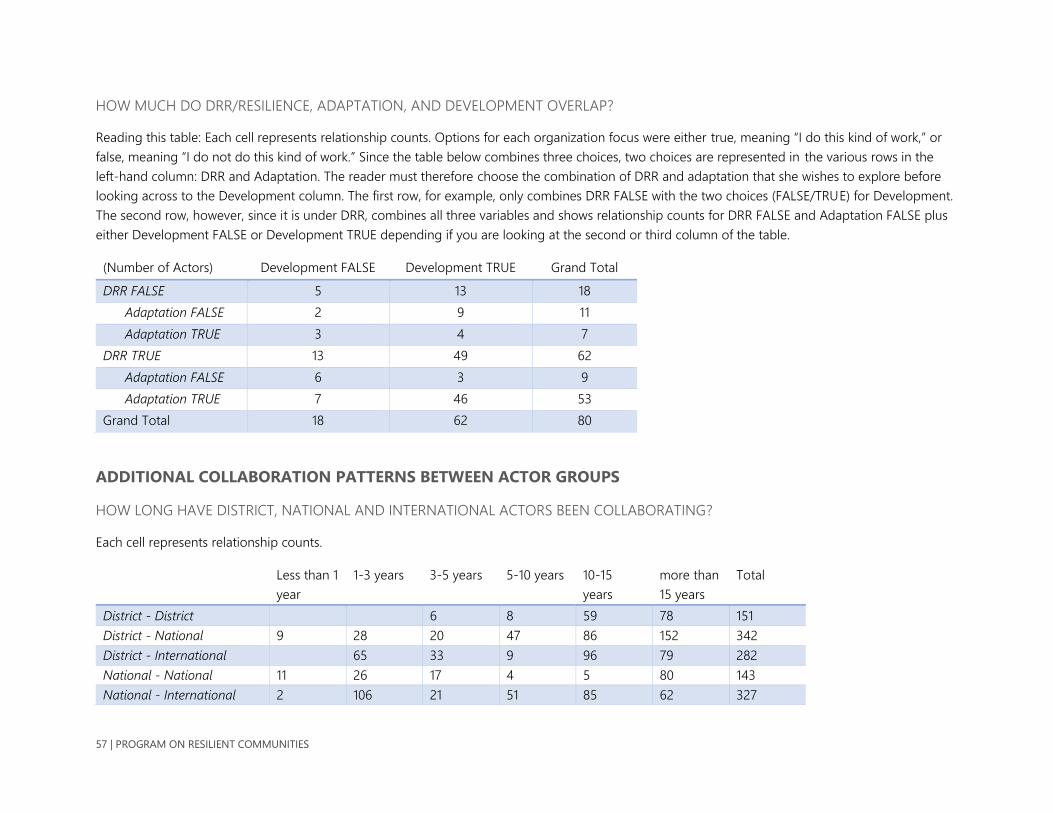
57 | PROGRAM ON RESILIENT COMMUNITIES
HOW MUCH DO DRR/RESILIENCE, ADAPTATION, AND DEVELOPMENT OVERLAP?
Reading this table: Each cell represents relationship counts. Options for each organization focus were either true, meaning “I do this kind of work,” or
false, meaning “I do not do this kind of work.” Since the table below combines three choices, two choices are represented in the various rows in the
left-hand column: DRR and Adaptation. The reader must therefore choose the combination of DRR and adaptation that she wishes to explore before
looking across to the Development column. The first row, for example, only combines DRR FALSE with the two choices (FALSE/TRUE) for Development.
The second row, however, since it is under DRR, combines all three variables and shows relationship counts for DRR FALSE and Adaptation FALSE plus
either Development FALSE or Development TRUE depending if you are looking at the second or third column of the table.
(Number of Actors) Development FALSE Development TRUE Grand Total
DRR FALSE 5 13 18
Adaptation FALSE 2 9 11
Adaptation TRUE 3 4 7
DRR TRUE 13 49 62
Adaptation FALSE 6 3 9
Adaptation TRUE 7 46 53
Grand Total 18 62 80
ADDITIONAL COLLABORATION PATTERNS BETWEEN ACTOR GROUPS
HOW LONG HAVE DISTRICT, NATIONAL AND INTERNATIONAL ACTORS BEEN COLLABORATING?
Each cell represents relationship counts.
Less than 1
year
1-3 years 3-5 years 5-10 years 10-15
years
more than
15 years
Total
District - District 6 8 59 78 151
District - National 9 28 20 47 86 152 342
District - International 65 33 9 96 79 282
National - National 11 26 17 4 5 80 143
National - International 2 106 21 51 85 62 327
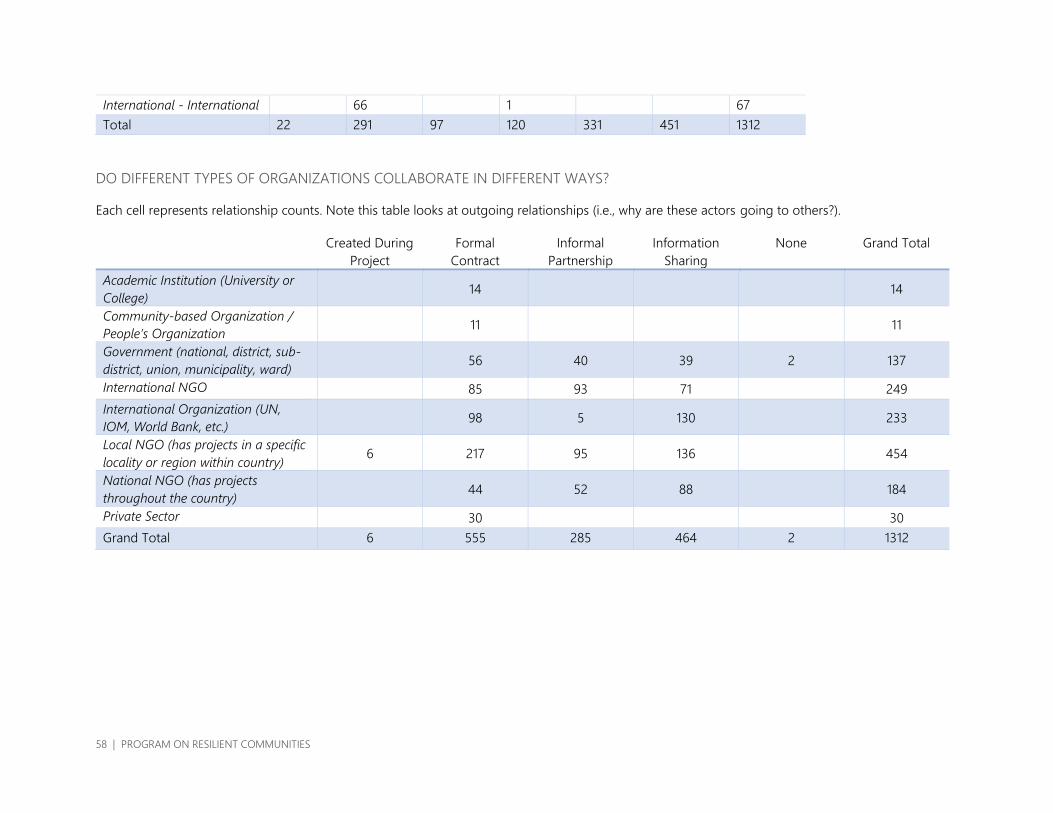
58 | PROGRAM ON RESILIENT COMMUNITIES
International - International 66 1 67
Total 22 291 97 120 331 451 1312
DO DIFFERENT TYPES OF ORGANIZATIONS COLLABORATE IN DIFFERENT WAYS?
Each cell represents relationship counts. Note this table looks at outgoing relationships (i.e., why are these actors going to others?).
Created During
Project
Formal
Contract
Informal
Partnership
Information
Sharing
None Grand Total
Academic Institution (University or
College) 14 14
Community-based Organization /
People’s Organization 11 11
Government (national, district, sub-
district, union, municipality, ward) 56 40 39 2 137
International NGO 85 93 71 249
International Organization (UN,
IOM, World Bank, etc.) 98 5 130 233
Local NGO (has projects in a specific
locality or region within country) 6 217 95 136 454
National NGO (has projects
throughout the country) 44 52 88 184
Private Sector 30 30
Grand Total 6 555 285 464 2 1312
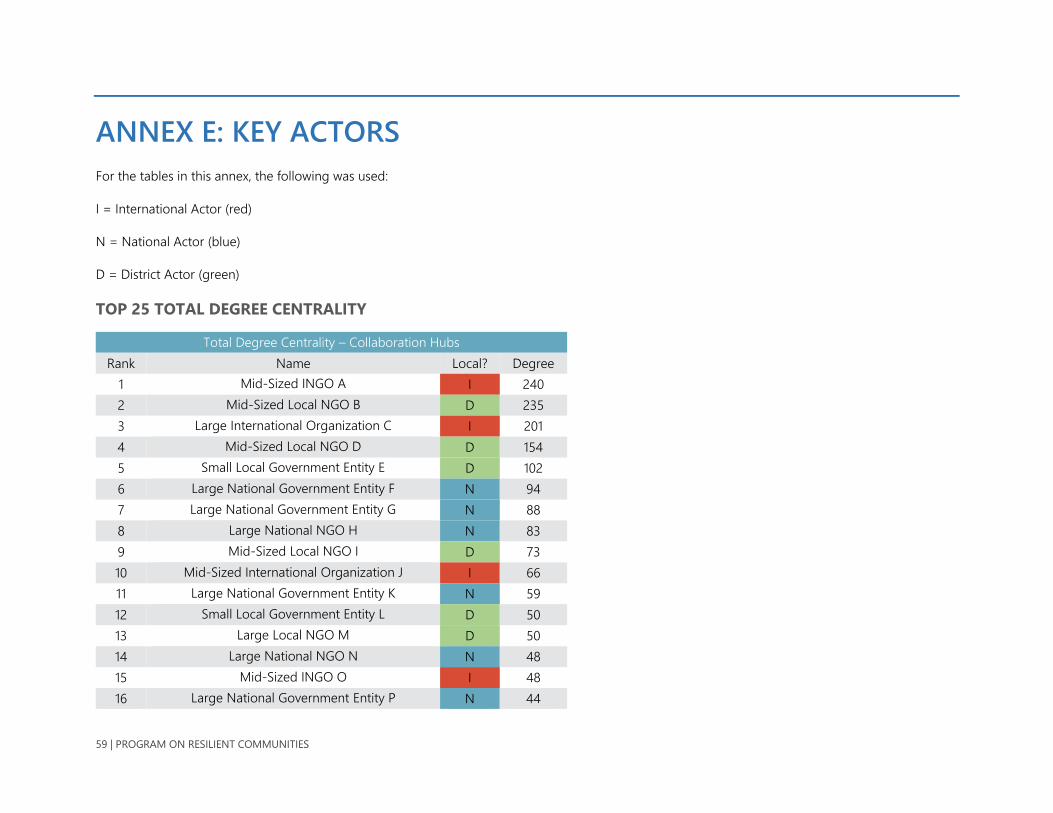
59 | PROGRAM ON RESILIENT COMMUNITIES
ANNEX E: KEY ACTORS
For the tables in this annex, the following was used:
I = International Actor (red)
N = National Actor (blue)
D = District Actor (green)
TOP 25 TOTAL DEGREE CENTRALITY
Total Degree Centrality – Collaboration Hubs
Rank Name Local? Degree
1 Mid-Sized INGO A I 240
2 Mid-Sized Local NGO B D 235
3 Large International Organization C I 201
4 Mid-Sized Local NGO D D 154
5 Small Local Government Entity E D 102
6 Large National Government Entity F N 94
7 Large National Government Entity G N 88
8 Large National NGO H N 83
9 Mid-Sized Local NGO I D 73
10 Mid-Sized International Organization J I 66
11 Large National Government Entity K N 59
12 Small Local Government Entity L D 50
13 Large Local NGO M D 50
14 Large National NGO N N 48
15 Mid-Sized INGO O I 48
16 Large National Government Entity P N 44
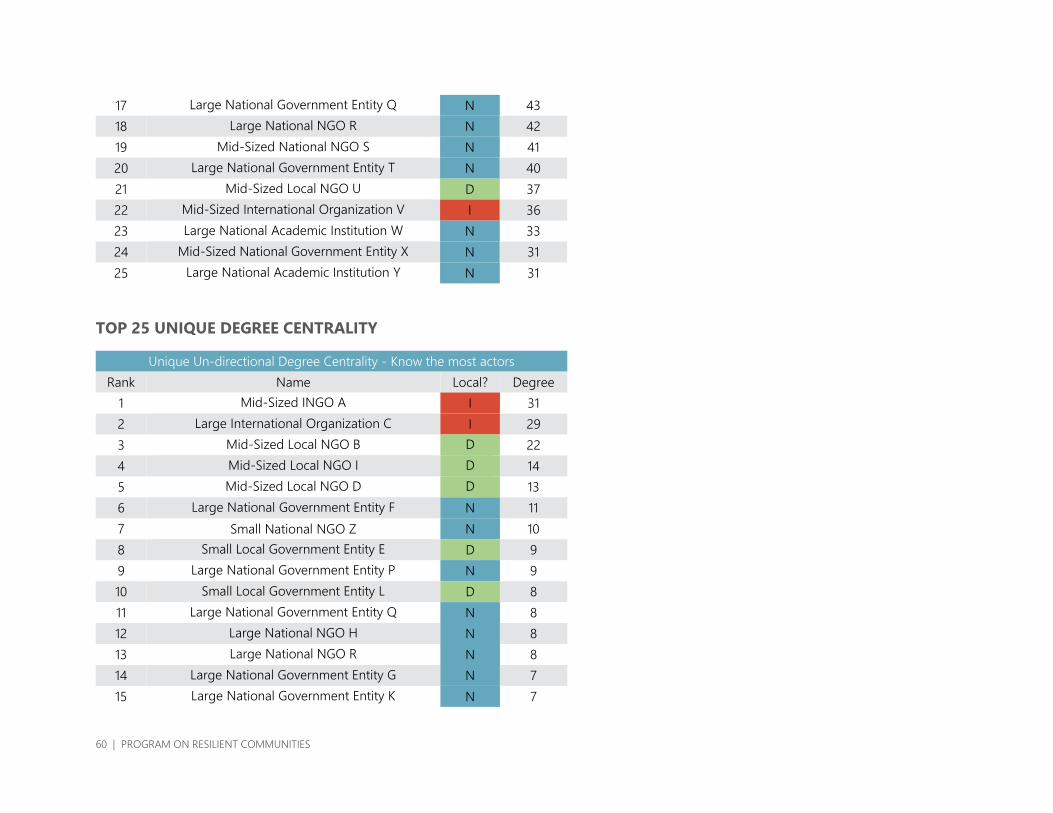
60 | PROGRAM ON RESILIENT COMMUNITIES
17 Large National Government Entity Q N 43
18 Large National NGO R N 42
19 Mid-Sized National NGO S N 41
20 Large National Government Entity T N 40
21 Mid-Sized Local NGO U D 37
22 Mid-Sized International Organization V I 36
23 Large National Academic Institution W N 33
24 Mid-Sized National Government Entity X N 31
25 Large National Academic Institution Y N 31
TOP 25 UNIQUE DEGREE CENTRALITY
Unique Un-directional Degree Centrality - Know the most actors
Rank Name Local? Degree
1 Mid-Sized INGO A I 31
2 Large International Organization C I 29
3 Mid-Sized Local NGO B D 22
4 Mid-Sized Local NGO I D 14
5 Mid-Sized Local NGO D D 13
6 Large National Government Entity F N 11
7 Small National NGO Z N 10
8 Small Local Government Entity E D 9
9 Large National Government Entity P N 9
10 Small Local Government Entity L D 8
11 Large National Government Entity Q N 8
12 Large National NGO H N 8
13 Large National NGO R N 8
14 Large National Government Entity G N 7
15 Large National Government Entity K N 7
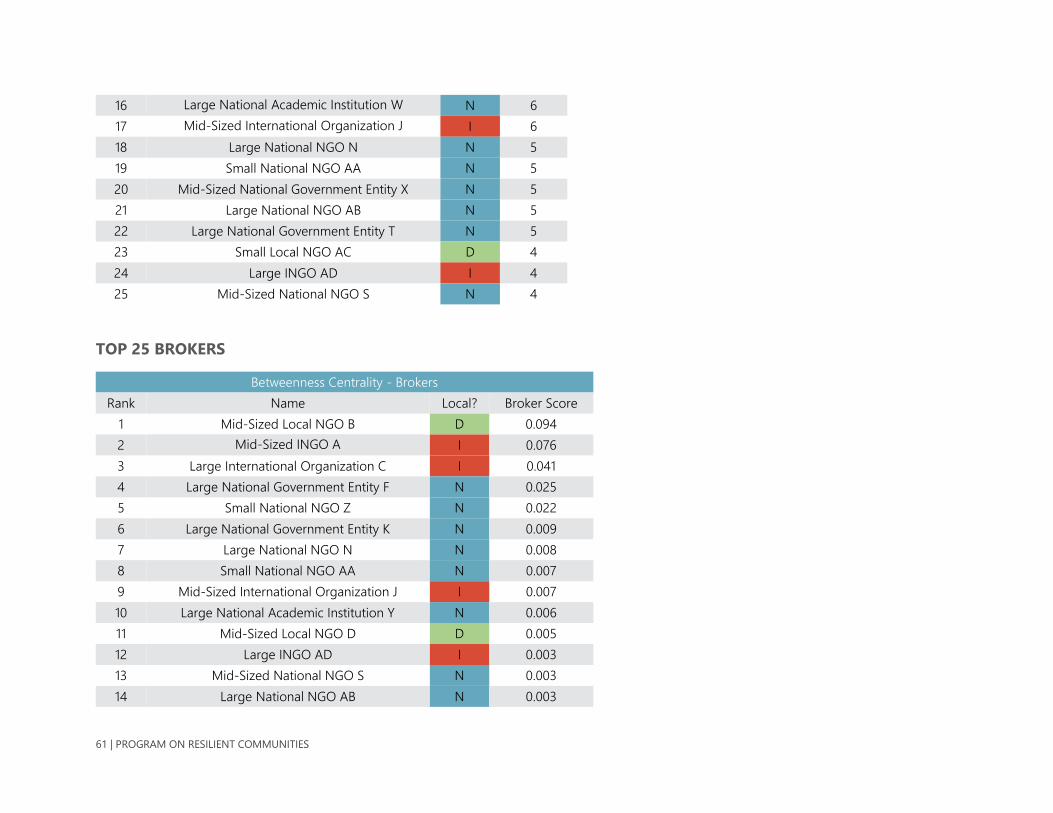
61 | PROGRAM ON RESILIENT COMMUNITIES
16 Large National Academic Institution W N 6
17 Mid-Sized International Organization J I 6
18 Large National NGO N N 5
19 Small National NGO AA N 5
20 Mid-Sized National Government Entity X N 5
21 Large National NGO AB N 5
22 Large National Government Entity T N 5
23 Small Local NGO AC D 4
24 Large INGO AD I 4
25 Mid-Sized National NGO S N 4
TOP 25 BROKERS
Betweenness Centrality - Brokers
Rank Name Local? Broker Score
1 Mid-Sized Local NGO B D 0.094
2 Mid-Sized INGO A I 0.076
3 Large International Organization C I 0.041
4 Large National Government Entity F N 0.025
5 Small National NGO Z N 0.022
6 Large National Government Entity K N 0.009
7 Large National NGO N N 0.008
8 Small National NGO AA N 0.007
9 Mid-Sized International Organization J I 0.007
10 Large National Academic Institution Y N 0.006
11 Mid-Sized Local NGO D D 0.005
12 Large INGO AD I 0.003
13 Mid-Sized National NGO S N 0.003
14 Large National NGO AB N 0.003
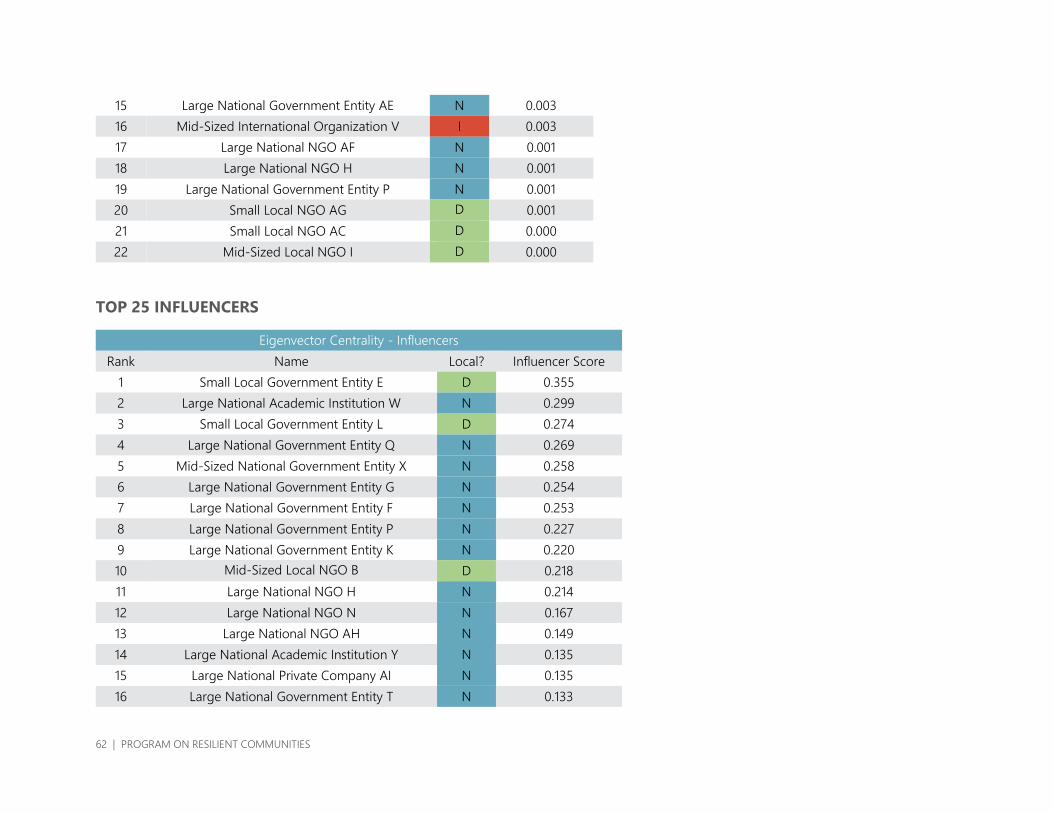
62 | PROGRAM ON RESILIENT COMMUNITIES
15 Large National Government Entity AE N 0.003
16 Mid-Sized International Organization V I 0.003
17 Large National NGO AF N 0.001
18 Large National NGO H N 0.001
19 Large National Government Entity P N 0.001
20 Small Local NGO AG D 0.001
21 Small Local NGO AC D 0.000
22 Mid-Sized Local NGO I D 0.000
TOP 25 INFLUENCERS
Eigenvector Centrality - Influencers
Rank Name Local? Influencer Score
1 Small Local Government Entity E D 0.355
2 Large National Academic Institution W N 0.299
3 Small Local Government Entity L D 0.274
4 Large National Government Entity Q N 0.269
5 Mid-Sized National Government Entity X N 0.258
6 Large National Government Entity G N 0.254
7 Large National Government Entity F N 0.253
8 Large National Government Entity P N 0.227
9 Large National Government Entity K N 0.220
10 Mid-Sized Local NGO B D 0.218
11 Large National NGO H N 0.214
12 Large National NGO N N 0.167
13 Large National NGO AH N 0.149
14 Large National Academic Institution Y N 0.135
15 Large National Private Company AI N 0.135
16 Large National Government Entity T N 0.133

63 | PROGRAM ON RESILIENT COMMUNITIES
17 Mid-Sized INGO A I 0.119
18 Large INGO AJ I 0.114
19 Large National Government Entity AK N 0.104
20 Large National Academic Institution AL N 0.102
21 Large National NGO AB N 0.097
22 Mid-Sized International Organization J I 0.088
23 Small INGO AM I 0.087
24 Mid-Sized Local NGO D D 0.084
25 Large National NGO AF N 0.080

64 | PROGRAM ON RESILIENT COMMUNITIES
ANNEX F: SUB-NETWORKS
For the tables in this annex, the following was used:
I = International Actor (red)
N = National Actor (blue)
D = District Actor (green)
COORDINATION NETWORK
This network has 62 actors that reported 113 relationships with one another. On average, each organization in the network has about 3.6 relationships.
There are no reciprocal relationships, or bidirectional relationships between two organizations, in this sub-network, so that means each organization
knows about 3.6 actors. The network density is 0.03, meaning that around 3% of all possible ties between organizations exist. This is denser than the
full network. On average, each organization’s resources, ideas, or support has the potential to reach 17.8% of other organizations.
Collaboration Hubs, Coordination Network
Total Degree Centrality – Collaboration Hubs
Rank Name Local? Degree
1 Large International Organization C I 31
2 Mid-Sized Local NGO B D 18
3 Mid-Sized Local NGO D D 13
4 Mid-Sized Local NGO I D 12
5 Large National Government Entity F N 11
6 Mid-Sized INGO A I 10
7 Small Local Government Entity E D 8
8 Large National Government Entity K N 6
9 Small Local Government Entity L D 5
10 Large National Government Entity Q N 5

65 | PROGRAM ON RESILIENT COMMUNITIES
COORDINATION NETWORK MAP

66 | PROGRAM ON RESILIENT COMMUNITIES
ADVOCACY NETWORK
The second largest collaboration area was the Advocacy network. See the table below for a list of the top 10 actors in this network broken down by
whether they are local local, local national, or international. Important to note when looking at the network image is that, in all network images, the
actors are sized by number of relationships in the full network. We can easily see that density is lower in this network because there are fewer lines
between the actors.
This network has 62 actors that reported 89 relationships with one another. On average, each organization in the network has about 2.9 relationships
and knows about 2.8 actors. The network density is 0.024, meaning that around 2.4% of all possible ties between organizations exist. This network has
the same density as the full network. Around 4.5% of relationships are reciprocal, or bidirectional between two organizations. On average, each
organization’s resources, ideas, or support has the potential to reach 8.4% of other organizations, which is much lower than the other networks we
have explored so far.
Collaboration Hubs, Advocacy Network
Total Degree Centrality – Collaboration Hubs
Rank Name Local? Degree
1 Mid-Sized Local NGO B D 16
2 Mid-Sized INGO A I 16
3 Mid-Sized Local NGO D D 11
4 Large National Government Entity F N 10
5 Mid-Sized Local NGO I D 9
6 Small Local Government Entity E D 7
7 Small Local Government Entity L D 5
8 Large National Government Entity P N 5
9 Large National NGO H N 5
10 Large National Government Entity G N 5

67 | PROGRAM ON RESILIENT COMMUNITIES
ADVOCACY NETWORK MAP
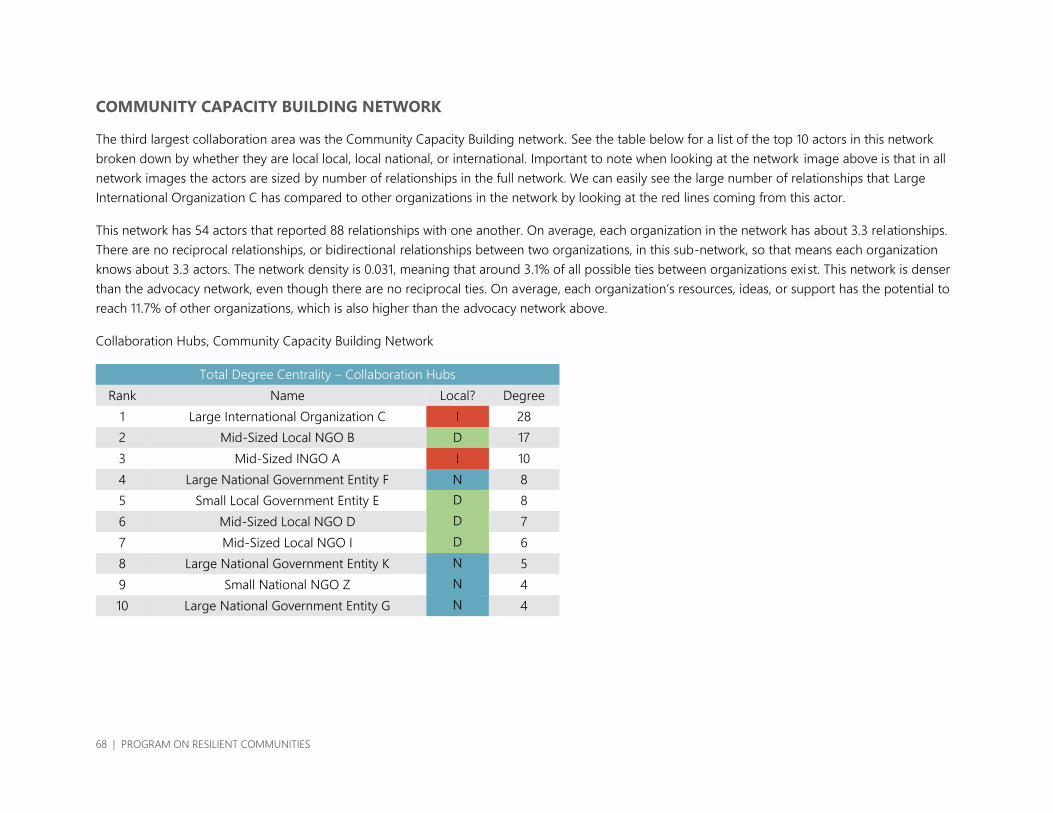
68 | PROGRAM ON RESILIENT COMMUNITIES
COMMUNITY CAPACITY BUILDING NETWORK
The third largest collaboration area was the Community Capacity Building network. See the table below for a list of the top 10 actors in this network
broken down by whether they are local local, local national, or international. Important to note when looking at the network image above is that in all
network images the actors are sized by number of relationships in the full network. We can easily see the large number of relationships that Large
International Organization C has compared to other organizations in the network by looking at the red lines coming from this actor.
This network has 54 actors that reported 88 relationships with one another. On average, each organization in the network has about 3.3 relationships.
There are no reciprocal relationships, or bidirectional relationships between two organizations, in this sub-network, so that means each organization
knows about 3.3 actors. The network density is 0.031, meaning that around 3.1% of all possible ties between organizations exist. This network is denser
than the advocacy network, even though there are no reciprocal ties. On average, each organization’s resources, ideas, or support has the potential to
reach 11.7% of other organizations, which is also higher than the advocacy network above.
Collaboration Hubs, Community Capacity Building Network
Total Degree Centrality – Collaboration Hubs
Rank Name Local? Degree
1 Large International Organization C I 28
2 Mid-Sized Local NGO B D 17
3 Mid-Sized INGO A I 10
4 Large National Government Entity F N 8
5 Small Local Government Entity E D 8
6 Mid-Sized Local NGO D D 7
7 Mid-Sized Local NGO I D 6
8 Large National Government Entity K N 5
9 Small National NGO Z N 4
10 Large National Government Entity G N 4
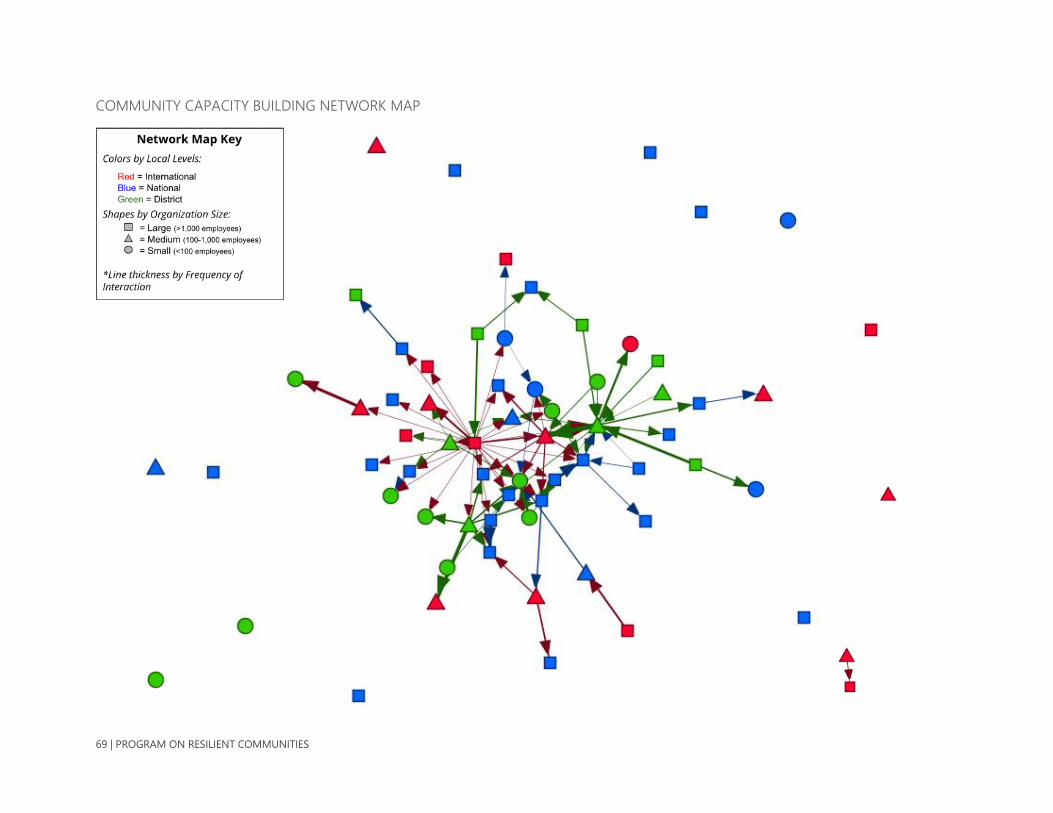
69 | PROGRAM ON RESILIENT COMMUNITIES
COMMUNITY CAPACITY BUILDING NETWORK MAP

70 | PROGRAM ON RESILIENT COMMUNITIES
CLIMATE CHANGE ADAPTATION NETWORK
The final collaboration area we explored was Climate Change Adaptation, due to the focus of this study. This network came in as the fourth largest
network when looking at number of relationships. While we no longer have redundancy of relationships (as we are pulling out only one collaboration
area), we again are looking at the network of all actors who have relationships in this collaboration area.
This network has 52 actors that reported 76 relationships with one another. On average, each organization in the network has about 2.9 relationships.
There is only one reciprocal relationship, or a relationship that is bidirectional between two organizations, in this sub-network. That relationship is
between and INGO and local NGO. The network density is 0.029, meaning that around 2.9% of all possible ties between organizations exist. This
network is slightly denser than the full network. On average, each organization’s resources, ideas, or support has the potent ial to reach 10.4% of other
organizations, which is lower than the full network.
See the table below for a list of the top 10 actors in this network broken down by whether they are local local, local national, or international. Important
to note when looking at the network image above is that, in all network images, the actors are sized by number of relationships in the full network.
Collaboration Hubs, Climate Change Adaptation Network
Total Degree Centrality – Collaboration Hubs
Rank Name Local? Degree
1 Mid-Sized INGO A I 18
2 Mid-Sized Local NGO B D 13
3 Mid-Sized Local NGO D D 7
4 Small Local Government Entity E D 6
5 Large National NGO R N 6
6 Mid-Sized International Organization J I 6
7 Mid-Sized Local NGO I D 6
8 Large National Government Entity G N 5
9 Large National Government Entity K N 5
10 Large National Government Entity F N 4

71 | PROGRAM ON RESILIENT COMMUNITIES
CLIMATE CHANGE ADAPTATION NETWORK MAP
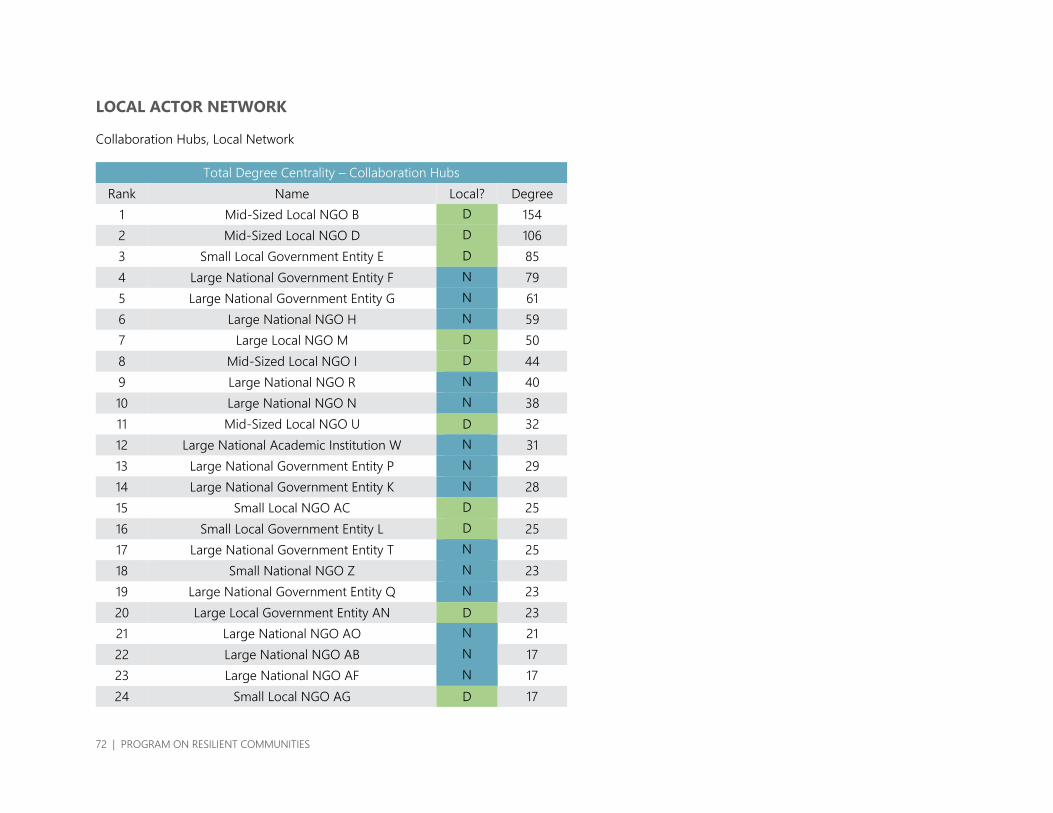
72 | PROGRAM ON RESILIENT COMMUNITIES
LOCAL ACTOR NETWORK
Collaboration Hubs, Local Network
Total Degree Centrality – Collaboration Hubs
Rank Name Local? Degree
1 Mid-Sized Local NGO B D 154
2 Mid-Sized Local NGO D D 106
3 Small Local Government Entity E D 85
4 Large National Government Entity F N 79
5 Large National Government Entity G N 61
6 Large National NGO H N 59
7 Large Local NGO M D 50
8 Mid-Sized Local NGO I D 44
9 Large National NGO R N 40
10 Large National NGO N N 38
11 Mid-Sized Local NGO U D 32
12 Large National Academic Institution W N 31
13 Large National Government Entity P N 29
14 Large National Government Entity K N 28
15 Small Local NGO AC D 25
16 Small Local Government Entity L D 25
17 Large National Government Entity T N 25
18 Small National NGO Z N 23
19 Large National Government Entity Q N 23
20 Large Local Government Entity AN D 23
21 Large National NGO AO N 21
22 Large National NGO AB N 17
23 Large National NGO AF N 17
24 Small Local NGO AG D 17

73 | PROGRAM ON RESILIENT COMMUNITIES
25 Mid-Sized National NGO S N 16
Collaboration Area Counts, Local Network
Collaboration Area No. of Relationships
Coordination 60
Advocacy 52
Climate Change and Adaptation 41
Community Capacity Building 39
Community Connections 32
Facilitation 32
Community Planning 25
Volunteers and Volunteer staff 24
Research 24
Agriculture Expertise 23
Technical Assistance 22
Project Implementation 20
Community-Based Risk Analysis 20
Funding 15
Early Warning Systems Expertise 14
Vulnerable Groups Expertise 14
Water, Sanitation, and Hygiene 14
Local Expertise 14
Leadership 14
Logistics 13
Management 12
Monitoring, Evaluation, and Learning Expertise 12
Project Design 11
Health/Public Health Expertise 10
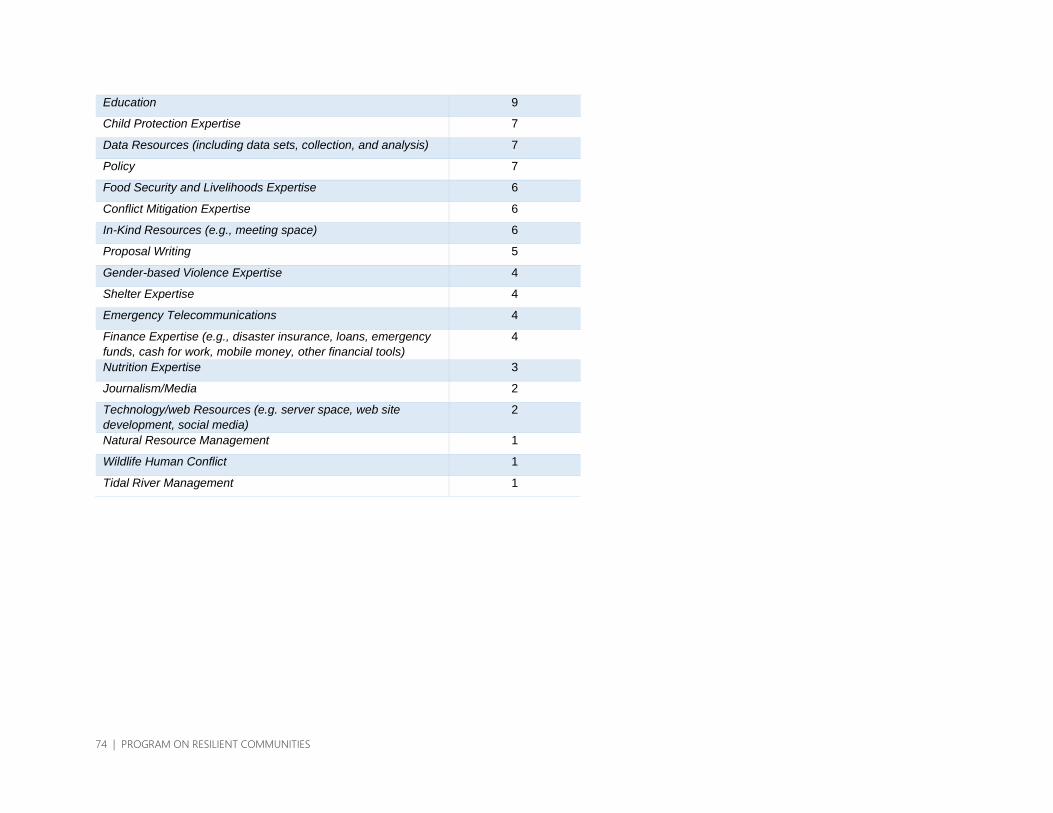
74 | PROGRAM ON RESILIENT COMMUNITIES
Education 9
Child Protection Expertise 7
Data Resources (including data sets, collection, and analysis) 7
Policy 7
Food Security and Livelihoods Expertise 6
Conflict Mitigation Expertise 6
In-Kind Resources (e.g., meeting space) 6
Proposal Writing 5
Gender-based Violence Expertise 4
Shelter Expertise 4
Emergency Telecommunications 4
Finance Expertise (e.g., disaster insurance, loans, emergency
funds, cash for work, mobile money, other financial tools)
4
Nutrition Expertise 3
Journalism/Media 2
Technology/web Resources (e.g. server space, web site
development, social media)
2
Natural Resource Management 1
Wildlife Human Conflict 1
Tidal River Management 1
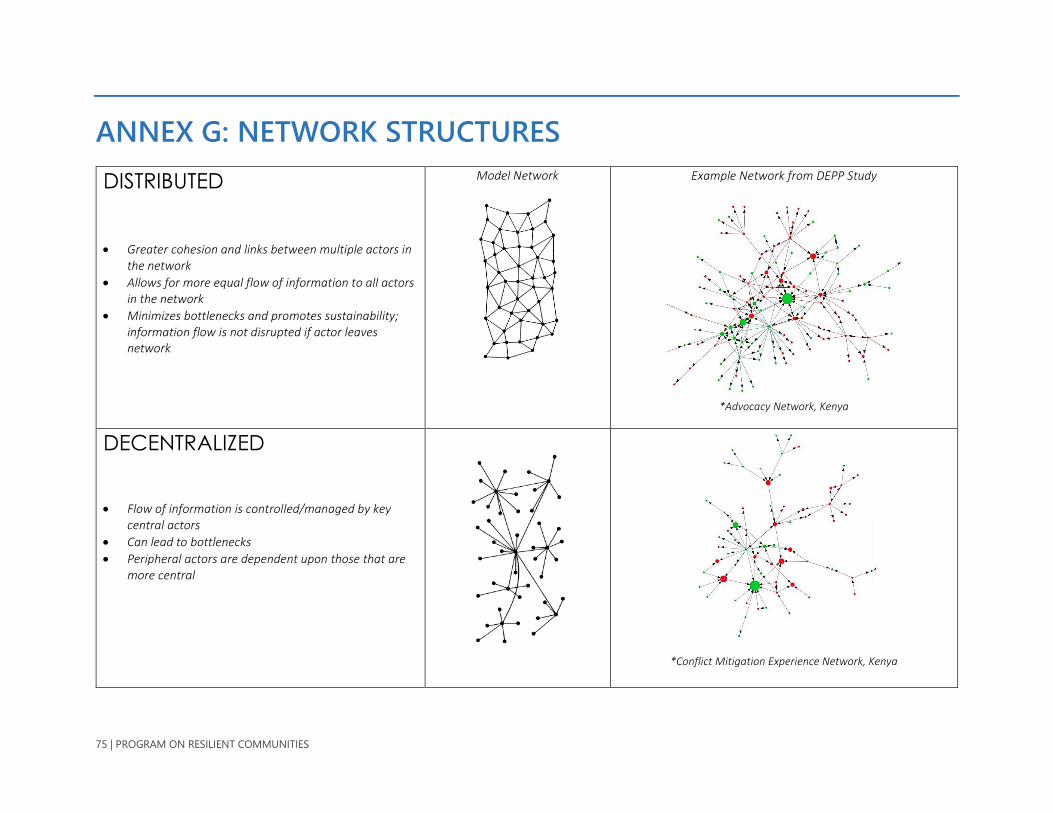
75 | PROGRAM ON RESILIENT COMMUNITIES
ANNEX G: NETWORK STRUCTURES
DISTRIBUTED
• Greater cohesion and links between multiple actors in the network
• Allows for more equal flow of information to all actors in the network
• Minimizes bottlenecks and promotes sustainability; information flow is not disrupted if actor leaves network
Model Network
Example Network from DEPP Study
*Advocacy Network, Kenya
DECENTRALIZED
• Flow of information is controlled/managed by key central actors
• Can lead to bottlenecks
• Peripheral actors are dependent upon those that are more central
*Conflict Mitigation Experience Network, Kenya
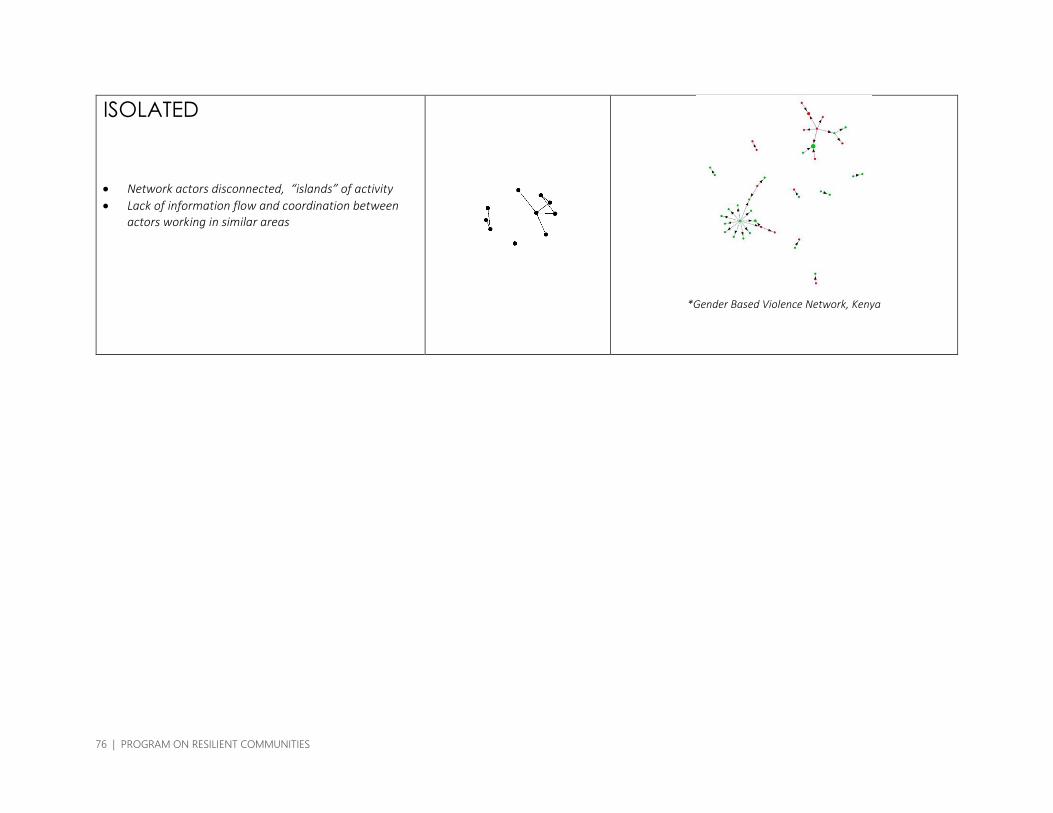
76 | PROGRAM ON RESILIENT COMMUNITIES
ISOLATED
• Network actors disconnected, “islands” of activity
• Lack of information flow and coordination between actors working in similar areas
*Gender Based Violence Network, Kenya
77 | PROGRAM ON RESILIENT COMMUNITIES
REFERENCES
1. Hossain L, Kuti M. Disaster response
preparedness coordination through
social networks. Disasters.
2010;34(3):755–86.
2. Weber C, Sailer K, Katzy B. Disaster
relief management - A dynamic
network perspective. In: International
Technology Management Conference
[Internet]. 2012 [cited 2019 Mar 15]. p.
167–76. Available from:
https://ieeexplore.ieee.org/abstract/do
cument/6306403/
3. Alcayna T, Bollettino V, Dy P, Vinck P.
Resilience and Disaster Trends in the
Philippines: Opportunities for National
and Local Capacity Building. PLoS Curr
[Internet]. 2016 Sep 14 [cited 2019 Mar
15];8. Available from:
https://www.ncbi.nlm.nih.gov/pmc/arti
cles/PMC5061578/
4. Neumann B, Vafeidis AT, Zimmermann
J, Nicholls RJ. Future Coastal
Population Growth and Exposure to
Sea-Level Rise and Coastal Flooding -
A Global Assessment. PLoS One
[Internet]. 2015 Mar 11 [cited 2019 Mar
15];10(3). Available from:
https://www.ncbi.nlm.nih.gov/pmc/arti
cles/PMC4367969/
5. Dasgupta S, Kamal FA, Khan ZH,
Choudhury S, Nishat A. River Salinity
and Climate Change: Evidence from
Coastal Bangladesh. The World Bank
Development Research Group
Environment and Energy Team; 2014
Mar. Report No.: 6817.
6. Pham P, Sharma V, Hémono R, Jean-
Francois J, Scott J. The Disasters and
Emergencies Preparedness
Programme Evaluation: Summative
Phase Report [Internet]. Harvard
Humanitarian Initiative; 2018 May p.
230. Available from:
https://hhi.harvard.edu/resources/dep
p-external-evaluation
7. Zohir S. NGO Sector in Bangladesh: An
Overview. Economic and Political
Weekly. 2004;39(36):4109–13.
8. Lewis D. Non-governmental
organizations and civil society in
Bangladesh. In: Riaz A, Rahman MS,
editors. Routledge Handbook of
Contemporary Bangladesh [Internet].
London and New York: Routledge;
2016. p. 11. Available from:
https://www.researchgate.net/publicati
on/299570256_Non-
governmental_organizations_and_civil_
society_in_Bangladesh
9. Asian Development Bank. Overview of
NGOs and Civil Society: Bangladesh
[Internet]. Asian Development Bank;
2008 Aug [cited 2019 Mar 12]. (Civil
Society Briefs). Available from:
https://www.adb.org/sites/default/files
/publication/28964/csb-ban.pdf
10. Cohen MJ, Ferguson K, Gingerich TR,
Scribner S. Righting the wrong:
Strengthening local humanitarian
leadership to save lives and strengthen
communities [Internet]. Oxfam
America, Inc.; 2016 [cited 2019 Mar 12].

78 | PROGRAM ON RESILIENT COMMUNITIES
Available from:
https://oxfamilibrary.openrepository.c
om/bitstream/handle/10546/595015/rr
-righting-the-wrong-260116-
en.pdf;jsessionid=0A30818EA9CBF9CE
73EDC6380ADFFC4E?sequence=1
11. Cook ADB, Ne FY. Complex
Humanitarian Emergencies and
Disaster Management in Bangladesh:
The 2017 Rohingya Exodus [Internet].
Singapore: Centre for Non Traditional
Security Studies (NTS Centre) S.
Rajaratnam School of International
Studies; 2018 Jul [cited 2019 Mar 12].
(NTS Report). Report No.: 11. Available
from: https://think-
asia.org/bitstream/handle/11540/8498/
NTS-Report11-Bangladesh-
HADR.pdf?sequence=1
12. Islam R, Walkerden G. How do links
between households and NGOs
promote disaster resilience and
recovery?: A case study of linking
social networks on the Bangladeshi
coast. Nat Hazards. 2015 Sep
1;78(3):1707–27.
13. Sadik S, Nakagawa H, Rahman R, Shaw
R, Kawaike K, Fujita K, et al. Systematic
Study of Cyclone Aila Recovery Efforts
in Koyra, Bangladesh Highlighting the
Possible Contribution to Vulnerability
Reduction. Journal of Japan Society for
Natural Disaster Science. 2017;36:109–
21.