Culture of pakistan By Mr Allah Dad Khan Agriculture Expert KPK Pakistan
NetSol Technologies Ltd. NetSol IT Village (Software Technology Park), Lahore Ring Road, Ghazi Road Interchange, Lahore Gantt. 54792, Pakistan .
NETSOL:
Email : [email protected] Phone: +92 42 111-44-88-00 Web: www.netsolpk.com
Lahore
Pakistan
The General Manager, Pakistan Stock Exchange limited, Stock Exchange Building, Stock Exchange Road, Karachi.
Subject : Transmission of Annual Report For the Year Ended June 30, 2018
Dear Sir,
FORM-OS
Date :OS/10/2018
We have to inform you that the Annual Report of the Company for the year ended June 30,
2018 have been transmitted through PUCARS and is also available on Company's website.
You may please inform the TRE Certificate Holders of the Exchange accordingly.
Yours Sincerely,
~~~ SEHRISH Company Secretary
Horsham
UK Sydney
Australia
Beijing
China
Shanghai
China
Bangkok
Thailand
Jakarta
Indonesia
Calabasas
USA
Table ofContents
Business ReviewCompany Profile 2Vision & Mission Statement 4Quality Focus 6Services Portfolio 7Global Customers 8NetSol Events 10Chairman’s Review Report 12Shareholder’s Information 13Share Price & Volume 14
Financials StatementsFinancial StatementsAuditors’ Report to the Members 47Statement of Financial Position 52Statement of Profit or Loss 54Statement of Other Comprehensive Income 55
Statement of Cash Flows 56Statement of Changes in Equity 57Notes to the Accounts 58
Consolidated Financial StatementsDirectors’ Report 90
91Auditors’ Report on ConsolidatedFinancial Statements 92
Consolidated Statement of Financial Position 98
Consolidated Statement of Profit or Loss 100
Consolidated Statement of Other Comprehensive Income 101
Consolidated Statement of Cash Flows 102
Consolidated Statement ofChanges in Equity 103
Notes to the Consolidated Accounts 104
Annual General MeetingNotice of Annual General Meeting
140
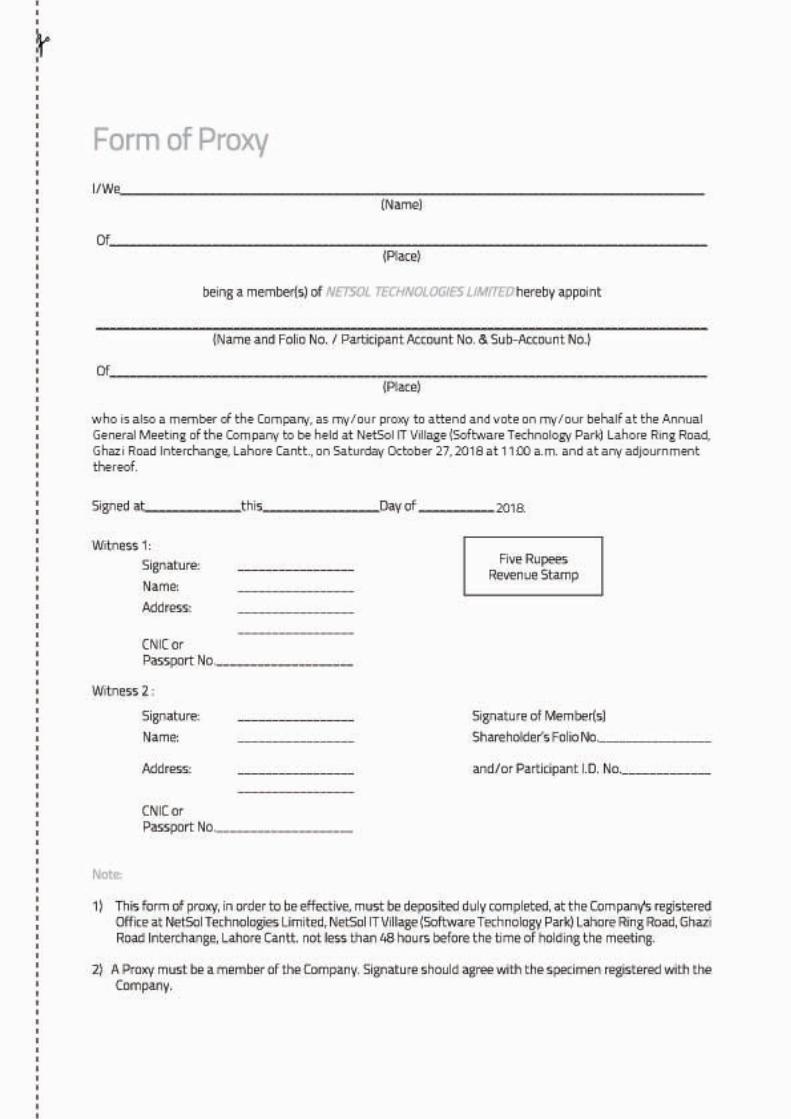
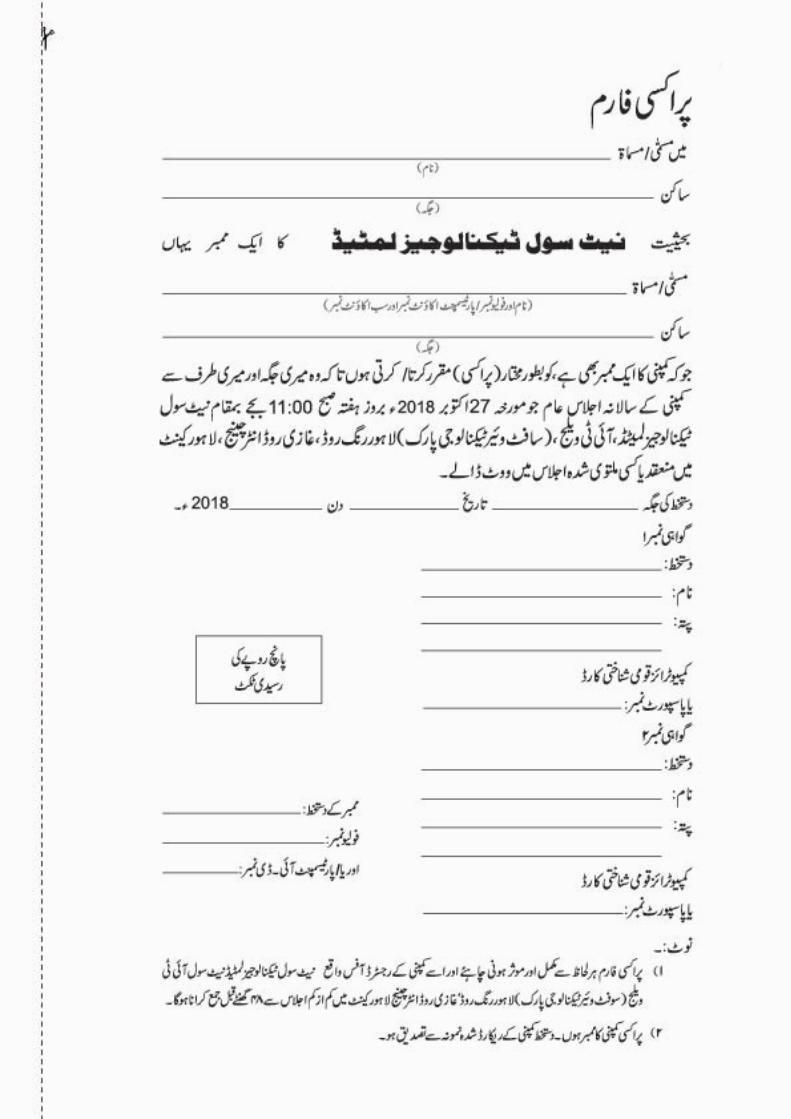
Form of Proxy 147
149
Financial HighlightsStatement of Value Addition 16Six Years’ Summary 17Key Financial Ratios 18Financial Summary 19
GovernanceBoard of Directors 22Directors’ Report 24
29Corporate Social Responisbility 33Core Values & Code of Conduct 37Independent Assurance Report to Members on the Statement of Compliance with Employees Share Option Scheme
39
Review Report to the Members on Statement of Compliance with the Code of Corporate Governance
40
Statement of Compliance with Code of Corporate Governance 41
Pattern of Shareholding 42
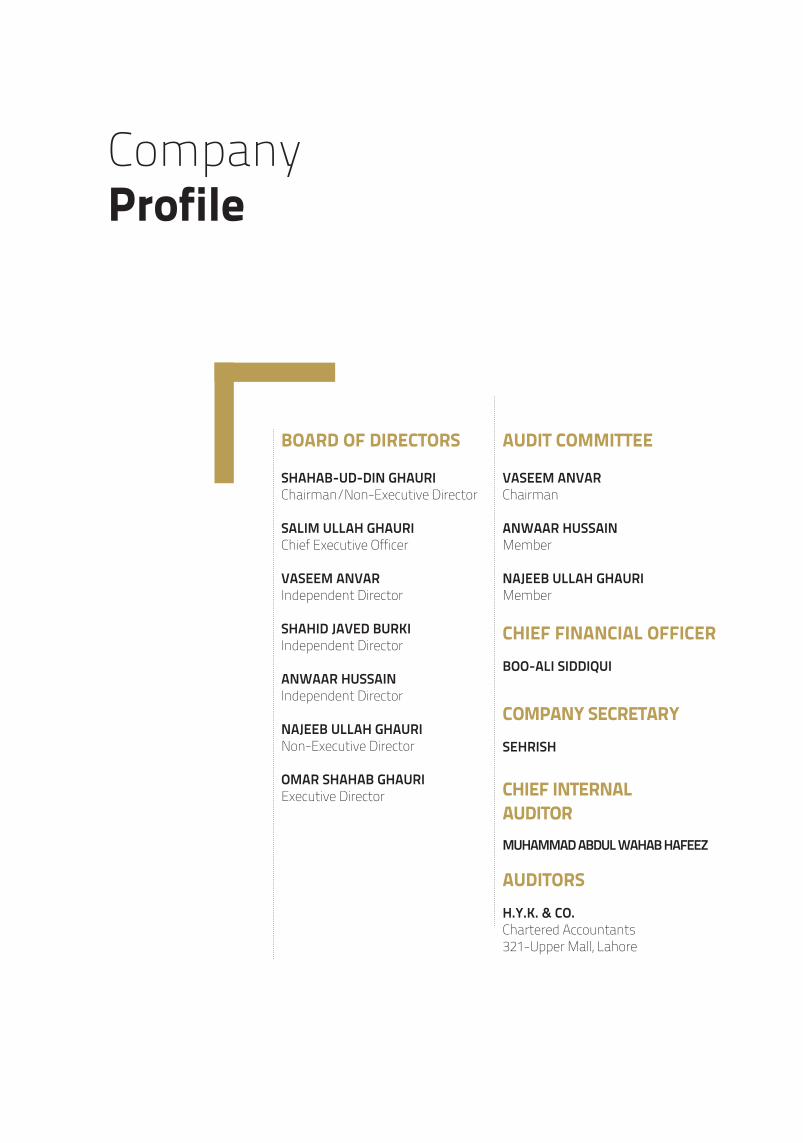
BOARD OF DIRECTORS
SHAHAB-UD-DIN GHAURIChairman/Non-Executive Director
SALIM ULLAH GHAURIChief Executive Officer
VASEEM ANVARIndependent Director
SHAHID JAVED BURKIIndependent Director
ANWAAR HUSSAINIndependent Director
NAJEEB ULLAH GHAURINon-Executive Director
OMAR SHAHAB GHAURIExecutive Director
COMPANY SECRETARY
CHIEF FINANCIAL OFFICER
SEHRISH
BOO-ALI SIDDIQUI
AUDITORSH.Y.K. & CO.Chartered Accountants321-Upper Mall, Lahore
CHIEF INTERNAL AUDITORMUHAMMAD ABDUL WAHAB HAFEEZ
AUDIT COMMITTEE
VASEEM ANVARChairman
ANWAAR HUSSAINMember
NAJEEB ULLAH GHAURIMember
Company Profile
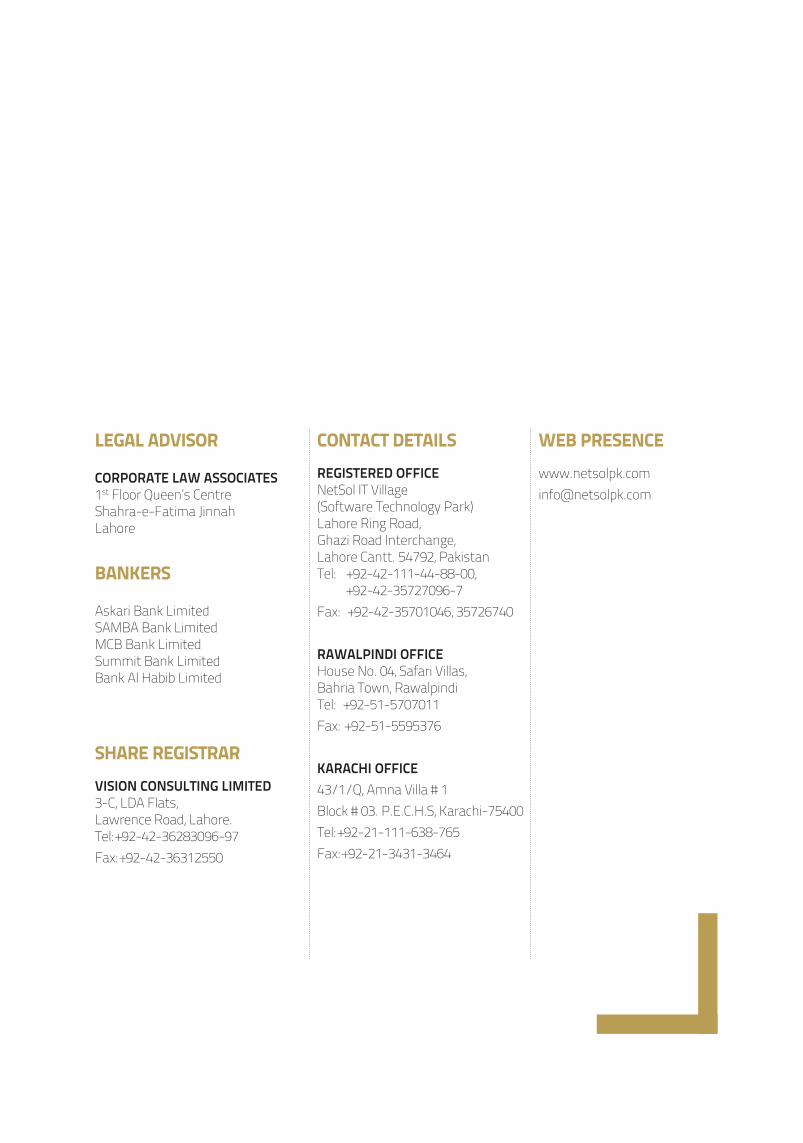
WEB PRESENCEwww.netsolpk.com [email protected]
CONTACT DETAILSREGISTERED OFFICENetSol IT Village(Software Technology Park)Lahore Ring Road, Ghazi Road Interchange, Lahore Cantt. 54792, PakistanTel: +92-42-111-44-88-00, +92-42-35727096-7Fax: +92-42-35701046, 35726740
RAWALPINDI OFFICEHouse No. 04, Safari Villas, Bahria Town, RawalpindiTel: +92-51-5707011Fax: +92-51-5595376
KARACHI OFFICE43/1/Q, Amna Villa # 1Block # 03. P.E.C.H.S, Karachi-75400Tel: +92-21-111-638-765Fax: +92-21-3431-3464
BOO-ALI SIDDIQUI
BANKERS
Askari Bank LimitedSAMBA Bank LimitedMCB Bank LimitedSummit Bank LimitedBank Al Habib Limited
SHARE REGISTRARVISION CONSULTING LIMITED3-C, LDA Flats, Lawrence Road, Lahore.Tel: +92-42-36283096-97Fax: +92-42-36312550
LEGAL ADVISOR
CORPORATE LAW ASSOCIATES1st Floor Queen’s CentreShahra-e-Fatima JinnahLahore
Vision Phrase ExplanationThe leading and world class provider We will continue to invest in highest quality human resource, certifications,
processes, infrastructure and product development.In each market We will focus individually on each market, while growing globally.By leveraging our global positioning We will fully use our global solutions, customer base, presence and knowledge.
Creating strong growth potential We will invest in capacity building, research and development and emerging technology markets.
Increasing shareholders’ value We aim to provide above average and superior returns to our shareholders.
Great environment for our employees A caring environment that fosters growth and development, learning, open-ness, opportunities and creativity.
Vision StatementTo become the leading and world class provider of IT solutions and services in each market of operations, by leveraging our global positioning and creating strong growth potential, resulting in increasing shareholders’ value and providing great environment for our employees.
Vision & MissionStatement
NETSOL TECHNOLOGIES LIMITED4

Mission StatementTo be the premium solutions vendor to the global leasing and finance businesses. We will leverage our market leading position in APAC, and our European and US presence, to continue to drive strong revenues from our current generation of leasing and financing solutions, and successfully grow our next generation platform. We will leverage our world class software development capabilities to develop new IP in business segments where we can add value. We will excite, motivate, train and reward our employees to be the best in their domain. We will tirelessly explore ways to improve the breadth and depth of our offerings, both organically and through M&A. We ultimately aim to enhance shareholder value, incrementally and exponentially, by growing existing streams as well as building new streams through R&D, partnerships, acquisitions and spin-offs.
ANNUAL REPORT 2018 5
QualityFocus
We are committed to contin-uously improve the effective-ness of our quality manage-ment system through;• effective implementation
of software measure-ment programs
• regular assessments against international standards
• monitoring and enhanc-ing customer satisfaction
• developing and maintain-ing skilled & motivated
resource base• reviewing and enhancing
quality objectivesOur focus in quality engineer-ing and process improvement has been definitive in ensur-ing excellence of operations and customer satisfaction. We are also continuously investing in software pro-cesses improvement and ISO authorized trainings for our teams.
NETSOL TECHNOLOGIES LIMITED6
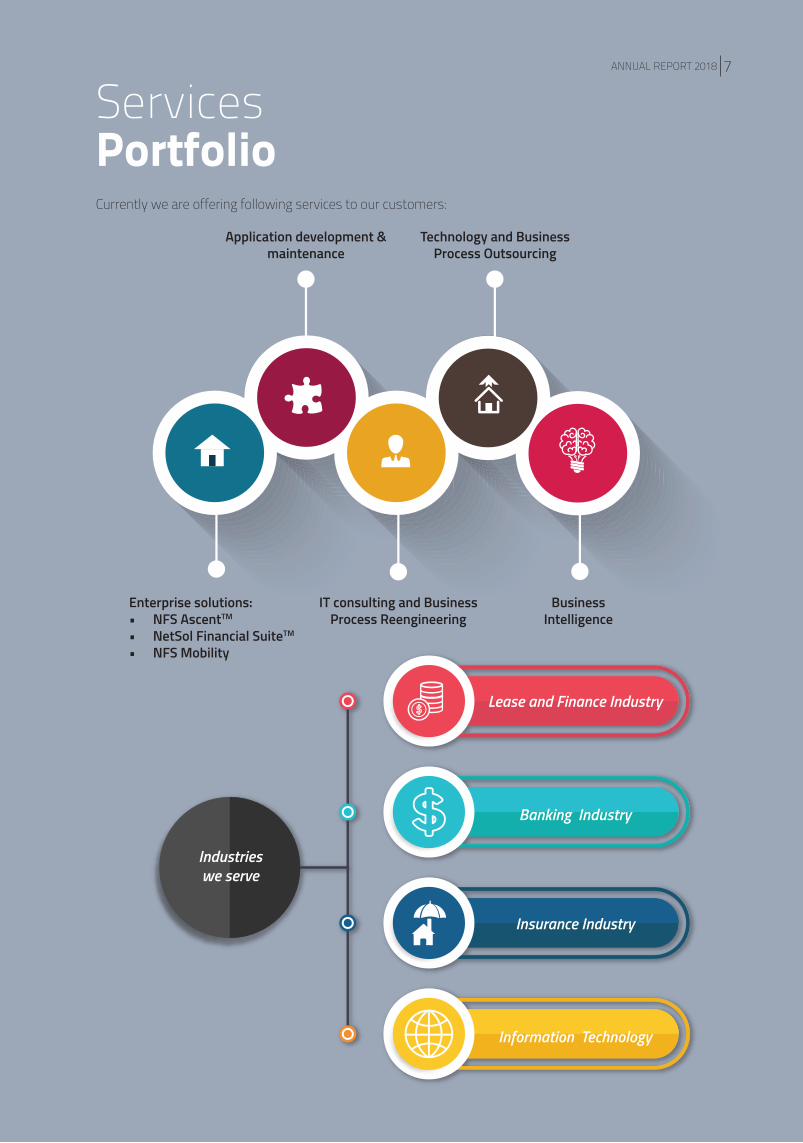
Services PortfolioCurrently we are offering following services to our customers:
Industries we serve
Enterprise solutions:• NFS AscentTM
• NetSol Financial SuiteTM • NFS Mobility
Application development & maintenance
IT consulting and Business Process Reengineering
Business Intelligence
Technology and Business Process Outsourcing
Lease and Finance Industry
Insurance Industry
Banking Industry
Information Technology
ANNUAL REPORT 2018 7
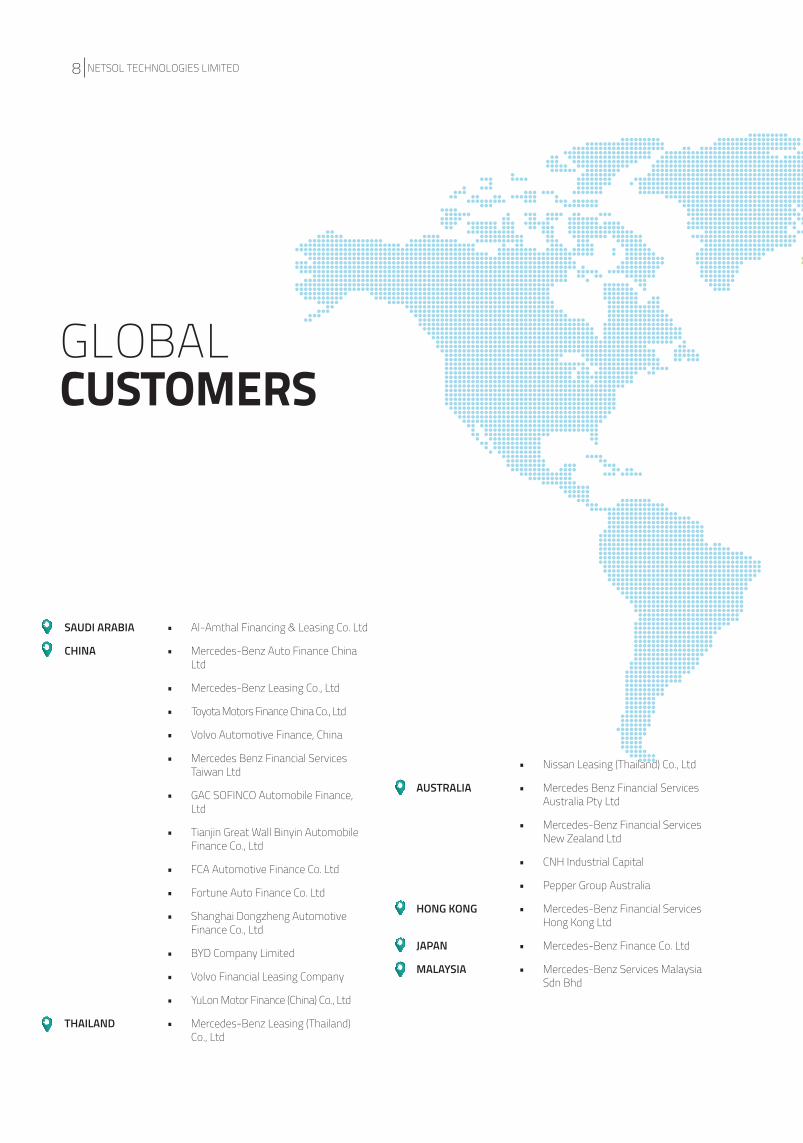
GLOBAL CUSTOMERS
• Nissan Leasing (Thailand) Co., Ltd
AUSTRALIA • Mercedes Benz Financial Services Australia Pty Ltd
• Mercedes-Benz Financial Services New Zealand Ltd
• CNH Industrial Capital
• Pepper Group Australia
HONG KONG • Mercedes-Benz Financial Services Hong Kong Ltd
JAPAN • Mercedes-Benz Finance Co. Ltd
MALAYSIA • Mercedes-Benz Services Malaysia Sdn Bhd
SAUDI ARABIA • Al-Amthal Financing & Leasing Co. Ltd
CHINA • Mercedes-Benz Auto Finance China Ltd
• Mercedes-Benz Leasing Co., Ltd
• Toyota Motors Finance China Co., Ltd
• Volvo Automotive Finance, China
• Mercedes Benz Financial Services Taiwan Ltd
• GAC SOFINCO Automobile Finance, Ltd
• Tianjin Great Wall Binyin Automobile Finance Co., Ltd
• FCA Automotive Finance Co. Ltd
• Fortune Auto Finance Co. Ltd
• Shanghai Dongzheng Automotive Finance Co., Ltd
• BYD Company Limited
• Volvo Financial Leasing Company
• YuLon Motor Finance (China) Co., Ltd
THAILAND • Mercedes-Benz Leasing (Thailand) Co., Ltd
NETSOL TECHNOLOGIES LIMITED8
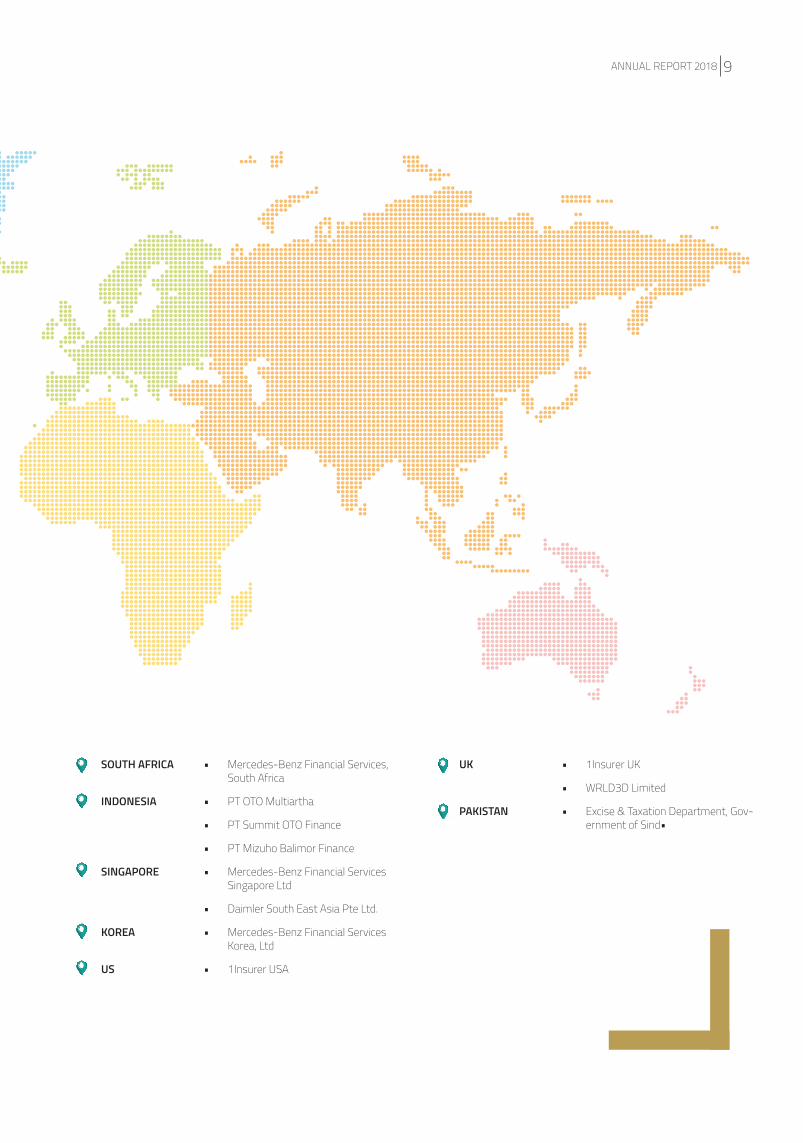
SOUTH AFRICA • Mercedes-Benz Financial Services, South Africa
INDONESIA • PT OTO Multiartha
• PT Summit OTO Finance
• PT Mizuho Balimor Finance
SINGAPORE • Mercedes-Benz Financial Services Singapore Ltd
• Daimler South East Asia Pte Ltd.
KOREA • Mercedes-Benz Financial Services Korea, Ltd
US • 1Insurer USA
UK • 1Insurer UK
• WRLD3D Limited
PAKISTAN • Excise & Taxation Department, Gov-ernment of Sind•
ANNUAL REPORT 2018 9
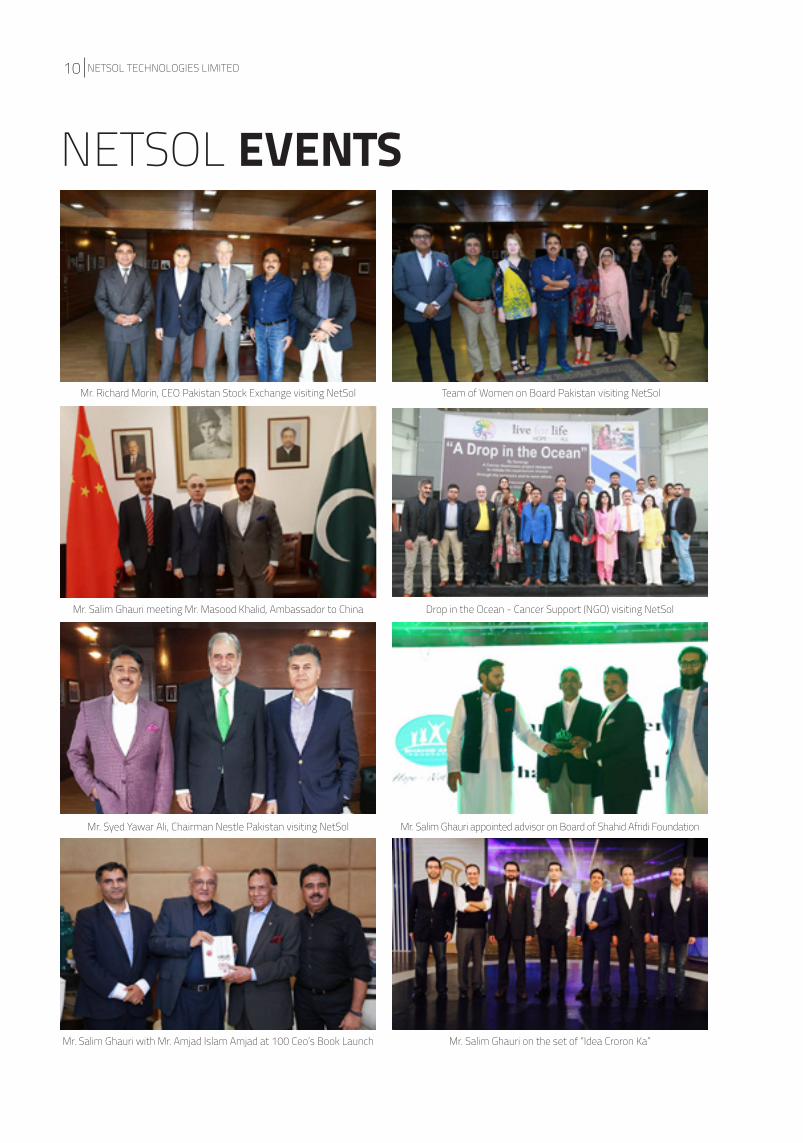
NETSOL EVENTS
Mr. Richard Morin, CEO Pakistan Stock Exchange visiting NetSol
Mr. Salim Ghauri meeting Mr. Masood Khalid, Ambassador to China
Mr. Syed Yawar Ali, Chairman Nestle Pakistan visiting NetSol
Mr. Salim Ghauri with Mr. Amjad Islam Amjad at 100 Ceo’s Book Launch
Team of Women on Board Pakistan visiting NetSol
Drop in the Ocean - Cancer Support (NGO) visiting NetSol
Mr. Salim Ghauri appointed advisor on Board of Shahid Afridi Foundation
Mr. Salim Ghauri on the set of “Idea Croron Ka”
NETSOL TECHNOLOGIES LIMITED10
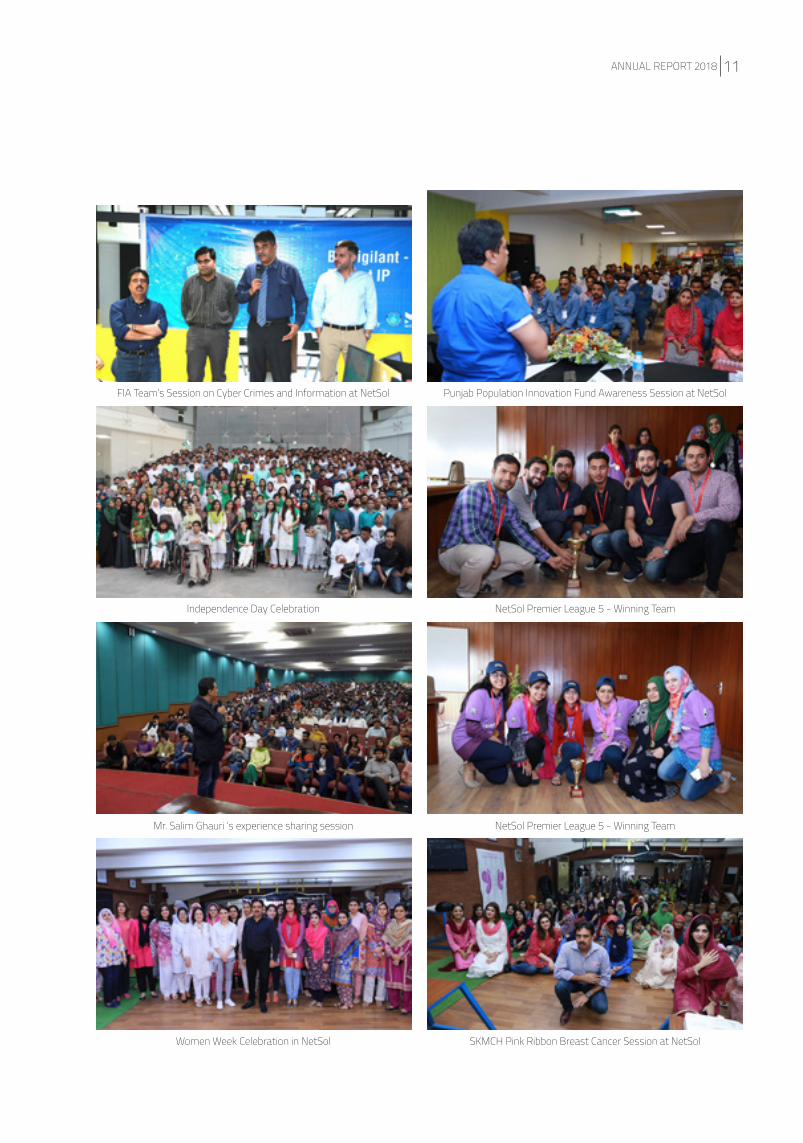
FIA Team’s Session on Cyber Crimes and Information at NetSol
Independence Day Celebration
Mr. Salim Ghauri ‘s experience sharing session
Women Week Celebration in NetSol
Punjab Population Innovation Fund Awareness Session at NetSol
NetSol Premier League 5 - Winning Team
NetSol Premier League 5 - Winning Team
SKMCH Pink Ribbon Breast Cancer Session at NetSol
ANNUAL REPORT 2018 11
CHAIRMAN’S REVIEW REPORT
I am pleased to present the review for the financial year ended June 30, 2018 highlighting the Company’s performance and the role played by the Board of Directors in guiding the management to carry out its responsibility for the benefit of all its stakeholders.
The year 2017-2018 was another successful year for the company; NETSOL has yet again proven its strength in APAC region as the leading asset finance solution provider in 2018. It has won for the sixth consecutive year, the “First Rate and Best Selling Finance and Leasing Solution Provider” Award at the 2018 Annual China Leasing Summit (CLS), as well as, the “Auto Finance Software System Leading Enterprise” Award at the China International Automotive Finance and Risk Management Summit. We continue to maintain our dominance as a leading global business services and enterprise solutions provider to the asset finance and leasing industry across the world. We remain ahead of the curve and maintain our stronghold in the highly competitive industry we operate in. Our expertise and innovation in the industry has enabled us to maintain the highest quality standards in delivering our services to our diverse client base across the world including blue-chip organizations and Fortune 500 companies. Our core flagship product NFS AscentTM has been performing exceptionally well across all major regions of the world. There have been a number of implementations and new contracts, as well as closings of previous similar contracts with major global auto captives. The key objectives that we are targeting are enhancements to our existing enterprise solutions plus new innovations in digital technologies of the further for the finance and leasing industry.
The Board has performed its duties and responsibilities diligently and has contributed effectively in guiding the Company in all its strategic affairs.
The Board also played a pivotal role in monitoring of management performance, focusing on major risk areas and achieving the Company’s objective. The Board was fully involved in strategic planning process and enhancing the vision of the Company. The Board recognizes that well defined corporate governance processes is vital in enhancing corporate accountability and is committed to ensure high standards of corporate governance to preserve and maintain stakeholder value. All directors, including the independent and non-executive directors, participated and contributed towards the decision making process of the board. Boards’ audit committee also met regularly and strengthened the functions of the board. The company has also established an independent internal audit department which follows risk based audit methodology. Audit reports were presented at each audit committee meeting and were also made available for the review by the board, where necessary. The Board carried out its annual self-evaluation in line with requirements of Code of Corporate Governance and found its performance to be most satisfactory and improved over previous years.
In the end, on behalf of the board, I would like to acknowledge the contribution of our employees in the success of the Company. I would also like to thank our shareholders, business partners, customers and suppliers for their continued support and confidence in the Company.
Shahab Ud Din GhauriChairman
LahoreSeptember 25, 2018
NETSOL TECHNOLOGIES LIMITED12
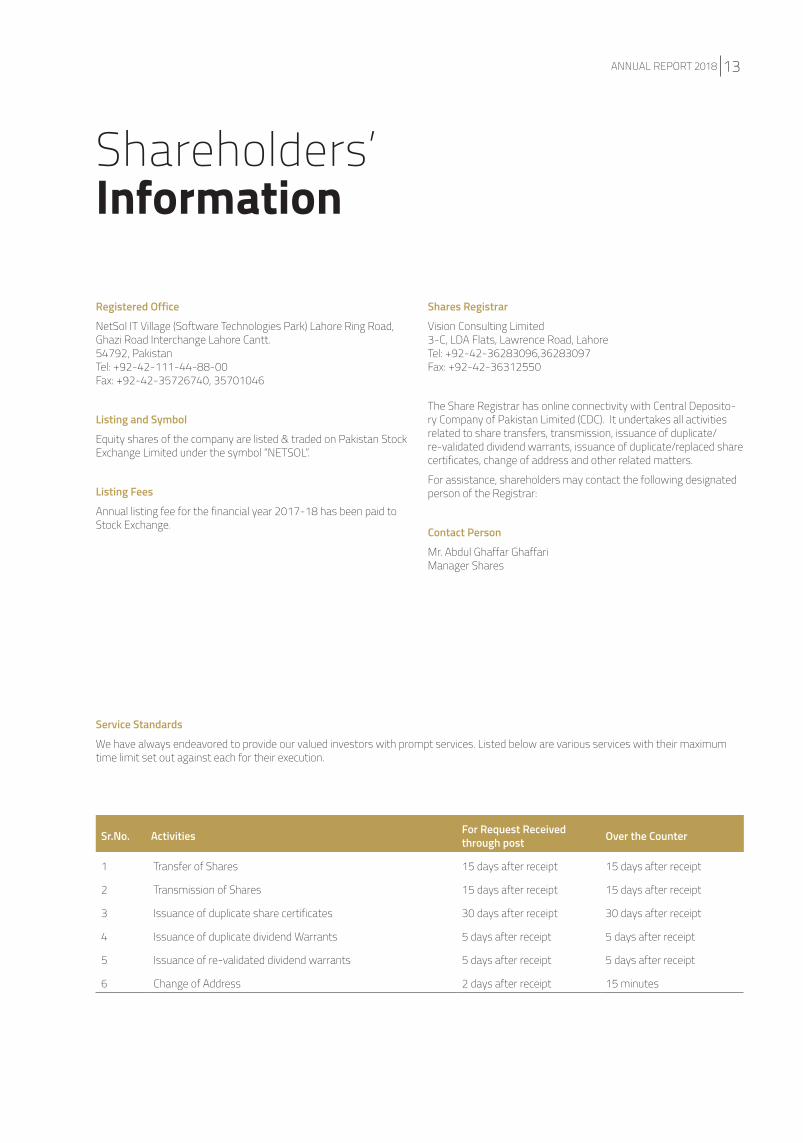
Shareholders’Information
Registered Office
NetSol IT Village (Software Technologies Park) Lahore Ring Road, Ghazi Road Interchange Lahore Cantt.54792, PakistanTel: +92-42-111-44-88-00Fax: +92-42-35726740, 35701046
Listing and Symbol
Equity shares of the company are listed & traded on Pakistan Stock Exchange Limited under the symbol “NETSOL”.
Listing Fees
Annual listing fee for the financial year 2017-18 has been paid to Stock Exchange.
Shares Registrar
Vision Consulting Limited3-C, LDA Flats, Lawrence Road, LahoreTel: +92-42-36283096,36283097Fax: +92-42-36312550
The Share Registrar has online connectivity with Central Deposito-ry Company of Pakistan Limited (CDC). It undertakes all activities related to share transfers, transmission, issuance of duplicate/re-validated dividend warrants, issuance of duplicate/replaced share certificates, change of address and other related matters.
For assistance, shareholders may contact the following designated person of the Registrar:
Contact Person
Mr. Abdul Ghaffar GhaffariManager Shares
Service Standards
We have always endeavored to provide our valued investors with prompt services. Listed below are various services with their maximum time limit set out against each for their execution.
Sr.No. Activities For Request Received through post Over the Counter
1 Transfer of Shares 15 days after receipt 15 days after receipt
2 Transmission of Shares 15 days after receipt 15 days after receipt
3 Issuance of duplicate share certificates 30 days after receipt 30 days after receipt
4 Issuance of duplicate dividend Warrants 5 days after receipt 5 days after receipt
5 Issuance of re-validated dividend warrants 5 days after receipt 5 days after receipt
6 Change of Address 2 days after receipt 15 minutes
ANNUAL REPORT 2018 13
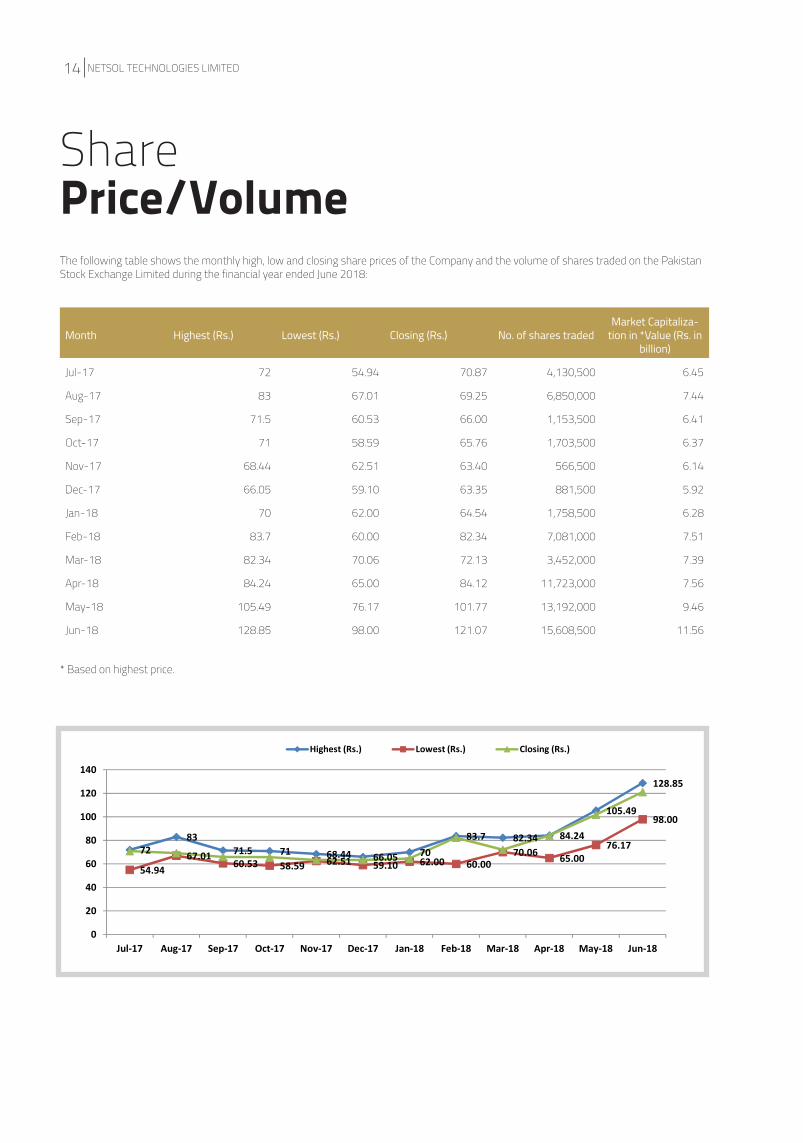
SharePrice/VolumeThe following table shows the monthly high, low and closing share prices of the Company and the volume of shares traded on the Pakistan Stock Exchange Limited during the financial year ended June 2018:
Month Highest (Rs.) Lowest (Rs.) Closing (Rs.) No. of shares tradedMarket Capitaliza-
tion in *Value (Rs. in billion)
Jul-17 72 54.94 70.87 4,130,500 6.45
Aug-17 83 67.01 69.25 6,850,000 7.44
Sep-17 71.5 60.53 66.00 1,153,500 6.41
Oct-17 71 58.59 65.76 1,703,500 6.37
Nov-17 68.44 62.51 63.40 566,500 6.14
Dec-17 66.05 59.10 63.35 881,500 5.92
Jan-18 70 62.00 64.54 1,758,500 6.28
Feb-18 83.7 60.00 82.34 7,081,000 7.51
Mar-18 82.34 70.06 72.13 3,452,000 7.39
Apr-18 84.24 65.00 84.12 11,723,000 7.56
May-18 105.49 76.17 101.77 13,192,000 9.46
Jun-18 128.85 98.00 121.07 15,608,500 11.56
* Based on highest price.
Lowest (Rs.) Closing (Rs.) No. of shares traded
Market Capitalization in
*Value (Rs. in billion)
54.94 70.87 4,130,500 6.4567.01 69.25 6,850,000 7.4460.53 66.00 1,153,500 6.4158.59 65.76 1,703,500 6.3762.51 63.40 566,500 6.1459.10 63.35 881,500 5.9262.00 64.54 1,758,500 6.2860.00 82.34 7,081,000 7.5170.06 72.13 3,452,000 7.3965.00 84.12 11,723,000 7.5676.17 101.77 13,192,000 9.4698.00 121.07 15,608,500 11.56
*Based on Highest Price
68.4466.05
Nov-17
Apr-18May-18Jun-18
Dec-17Jan-18Feb-18Mar-18
72Jul-17
82.34
Sep-17Oct-17
83.7
8371.571
NetSol Technologies LimitedShare Price / Volume
128.85105.49
The following table shows the monthly high, low and closing share prices of the Company and the volume of shares traded on the Pakistan Stock Exchange Limited during the financial year ended June 2018 :
84.24
Aug-17
70
Highest (Rs.)
7283
71.5 71 68.44 66.05 7083.7 82.34 84.24
105.49
128.85
54.9467.01
60.53 58.59 62.51 59.10 62.00 60.0070.06 65.00
76.17
98.00
0
20
40
60
80
100
120
140
Highest (Rs.) Lowest (Rs.) Closing (Rs.)
Jul-17 Aug-17 Sep-17 Oct-17 Nov-17 Dec-17 Jan-18 Feb-18 Mar-18 Apr-18 May-18 Jun-18
NETSOL TECHNOLOGIES LIMITED14

FINANCIAL HIGHLIGHTS
2018 2017
58%73%
4%2%
1%1%
1%1%
1%1%
35%22%
To Government
2018 % age 2017 % age
RUPEE IN THOUSAND
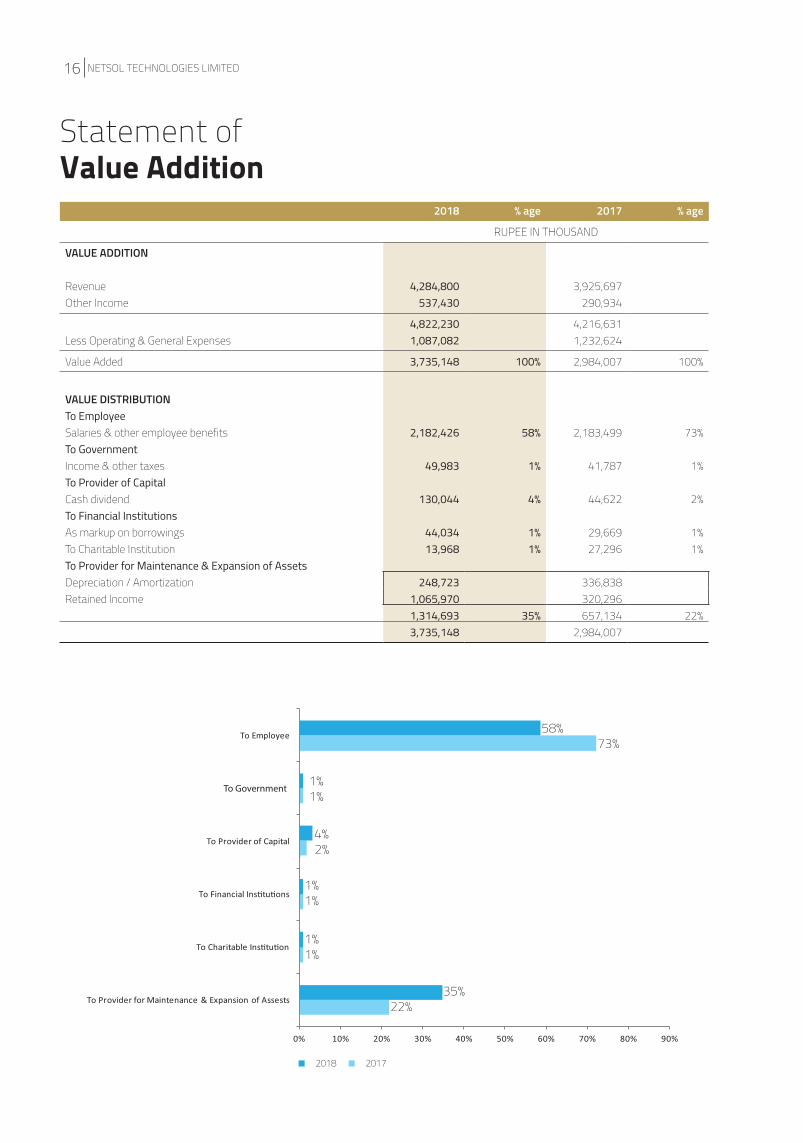
VALUE ADDITION
Revenue 4,284,800 3,925,697 Other Income 537,430 290,934
4,822,230 4,216,631 Less Operating & General Expenses 1,087,082 1,232,624
Value Added 3,735,148 100% 2,984,007 100%
VALUE DISTRIBUTIONTo EmployeeSalaries & other employee benefits 2,182,426 58% 2,183,499 73%To GovernmentIncome & other taxes 49,983 1% 41,787 1%To Provider of CapitalCash dividend 130,044 4% 44,622 2%To Financial InstitutionsAs markup on borrowings 44,034 1% 29,669 1%To Charitable Institution 13,968 1% 27,296 1%To Provider for Maintenance & Expansion of AssetsDepreciation / Amortization 248,723 336,838 Retained Income 1,065,970 320,296
1,314,693 35% 657,134 22% 3,735,148 2,984,007
Statement of Value Addition
NETSOL TECHNOLOGIES LIMITED16
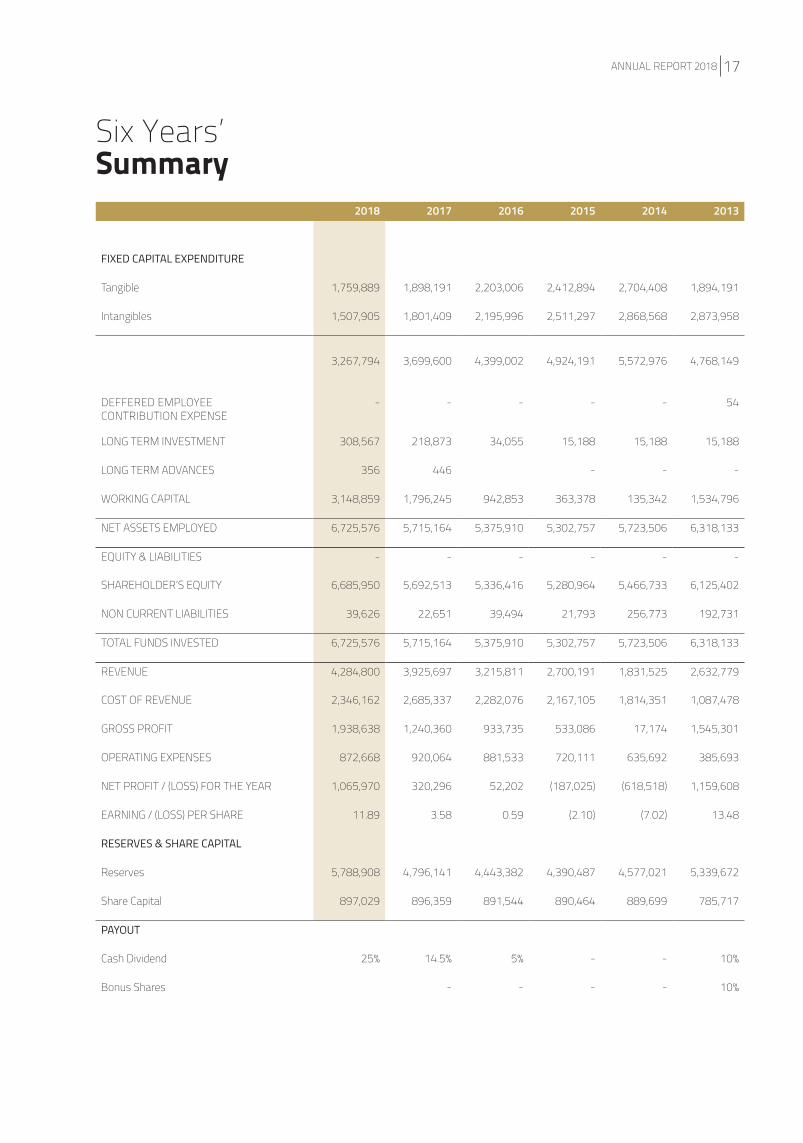
2018 2017 2016 2015 2014 2013
FIXED CAPITAL EXPENDITURE
Tangible 1,759,889 1,898,191 2,203,006 2,412,894 2,704,408 1,894,191
Intangibles 1,507,905 1,801,409 2,195,996 2,511,297 2,868,568 2,873,958
3,267,794 3,699,600 4,399,002 4,924,191 5,572,976 4,768,149
DEFFERED EMPLOYEE CONTRIBUTION EXPENSE
- - - - - 54
LONG TERM INVESTMENT 308,567 218,873 34,055 15,188 15,188 15,188
LONG TERM ADVANCES 356 446 - - -
WORKING CAPITAL 3,148,859 1,796,245 942,853 363,378 135,342 1,534,796
NET ASSETS EMPLOYED 6,725,576 5,715,164 5,375,910 5,302,757 5,723,506 6,318,133
EQUITY & LIABILITIES - - - - - -
SHAREHOLDER’S EQUITY 6,685,950 5,692,513 5,336,416 5,280,964 5,466,733 6,125,402
NON CURRENT LIABILITIES 39,626 22,651 39,494 21,793 256,773 192,731
TOTAL FUNDS INVESTED 6,725,576 5,715,164 5,375,910 5,302,757 5,723,506 6,318,133
REVENUE 4,284,800 3,925,697 3,215,811 2,700,191 1,831,525 2,632,779
COST OF REVENUE 2,346,162 2,685,337 2,282,076 2,167,105 1,814,351 1,087,478
GROSS PROFIT 1,938,638 1,240,360 933,735 533,086 17,174 1,545,301
OPERATING EXPENSES 872,668 920,064 881,533 720,111 635,692 385,693
NET PROFIT / (LOSS) FOR THE YEAR 1,065,970 320,296 52,202 (187,025) (618,518) 1,159,608
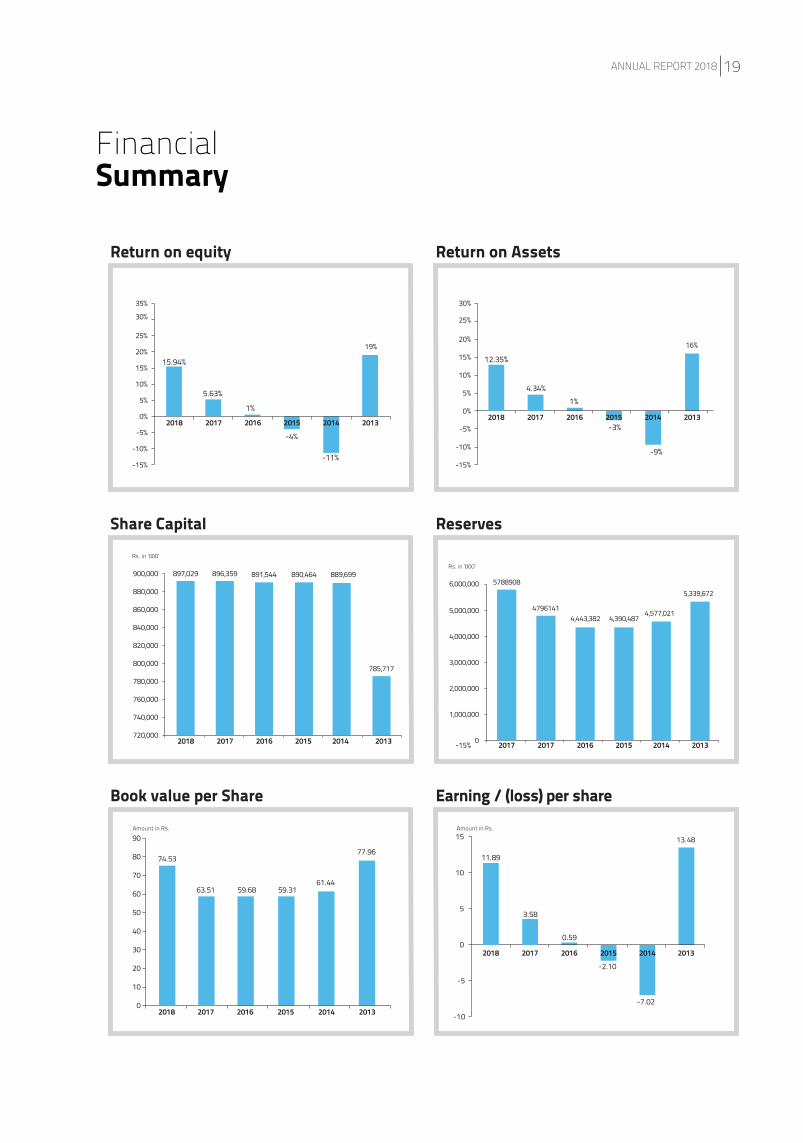
EARNING / (LOSS) PER SHARE 11.89 3.58 0.59 (2.10) (7.02) 13.48
RESERVES & SHARE CAPITAL
Reserves 5,788,908 4,796,141 4,443,382 4,390,487 4,577,021 5,339,672
Share Capital 897,029 896,359 891,544 890,464 889,699 785,717
PAYOUT
Cash Dividend 25% 14.5% 5% - - 10%
Bonus Shares - - - - 10%
Six Years’ Summary
ANNUAL REPORT 2018 17
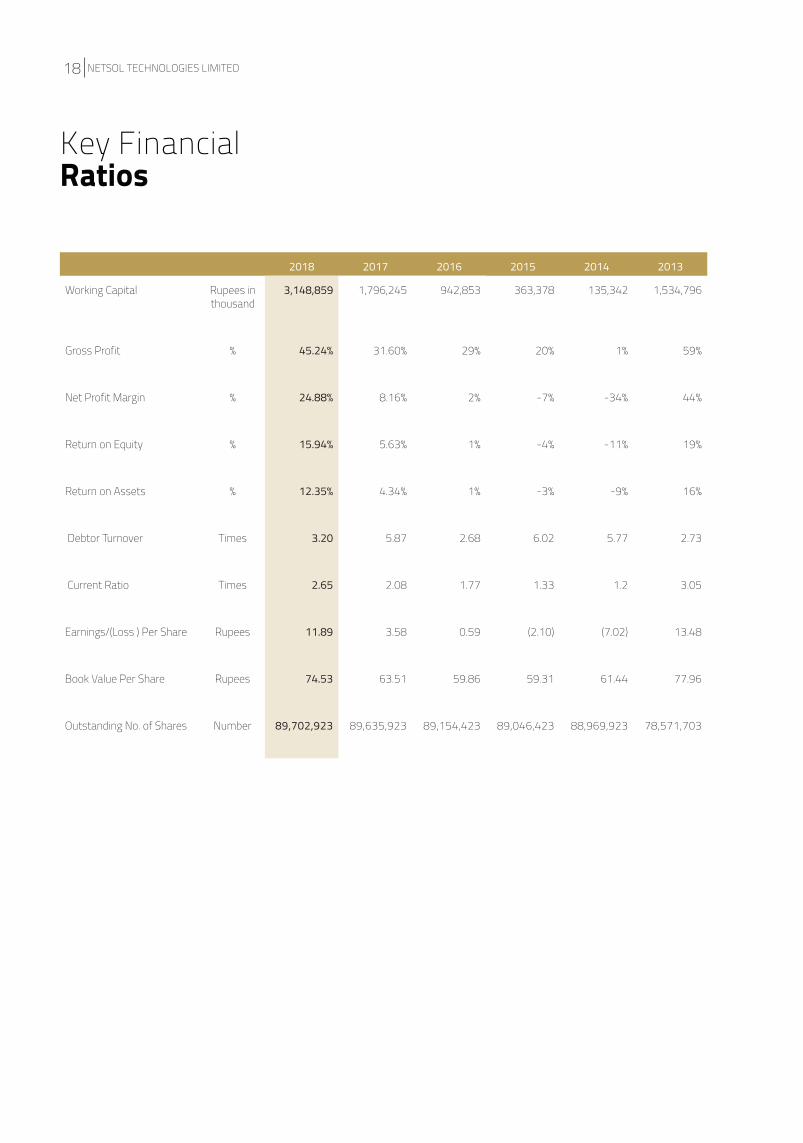
Key FinancialRatios
2018 2017 2016 2015 2014 2013
Working Capital Rupees in thousand
3,148,859 1,796,245 942,853 363,378 135,342 1,534,796
Gross Profit % 45.24% 31.60% 29% 20% 1% 59%
Net Profit Margin % 24.88% 8.16% 2% -7% -34% 44%
Return on Equity % 15.94% 5.63% 1% -4% -11% 19%
Return on Assets % 12.35% 4.34% 1% -3% -9% 16%
Debtor Turnover Times 3.20 5.87 2.68 6.02 5.77 2.73
Current Ratio Times 2.65 2.08 1.77 1.33 1.2 3.05
Earnings/(Loss ) Per Share Rupees 11.89 3.58 0.59 (2.10) (7.02) 13.48
Book Value Per Share Rupees 74.53 63.51 59.86 59.31 61.44 77.96
Outstanding No. of Shares Number 89,702,923 89,635,923 89,154,423 89,046,423 88,969,923 78,571,703
NETSOL TECHNOLOGIES LIMITED18
-15%
Rs. in ‘000’
720,000
740,000
760,000
780,000
800,000
820,000
840,000
860,000
880,000
900,000 889,699
785,717
890,464 Rs. in ‘000’
0
1,000,000
2,000,000
3,000,000
4,000,000
5,000,000
6,000,000
4,577,021
5,339,672
4,390,487 4,443,382
2014 2013 2016 2014 20132015 2015
Share Capital Reserves
891,544
2016
896,359
2017
4796141
2017
897,029
2018
5788908
2017
30% 25%
19%
-15%
-10%
-5%
0%
5%
10%
15%
20%
25%
35%
-15%
-10%
-5%
0%
5%
10%
15%
20%
30%
16%
-9%
2014 2013201520162014 201320152016 -3%
1%
-4%
1%
-11%
Return on equity Return on Assets
2017
5.63%
2017
4.34%
2018
15.94%
2018
12.35%
13.48
2014 2013
-7.02
2015-2.10
61.44
77.96
2014 2013
59.31
2015
Amount in Rs.
0
10
20
30
40
50
60
70
80
90
59.68
Amount in Rs.15
-10
-5
0
5
10
2016
2016
0.59
Book value per Share Earning / (loss) per share
63.51
2017
2017
3.58
74.53
2018
2018
11.89
FinancialSummary
ANNUAL REPORT 2018 19
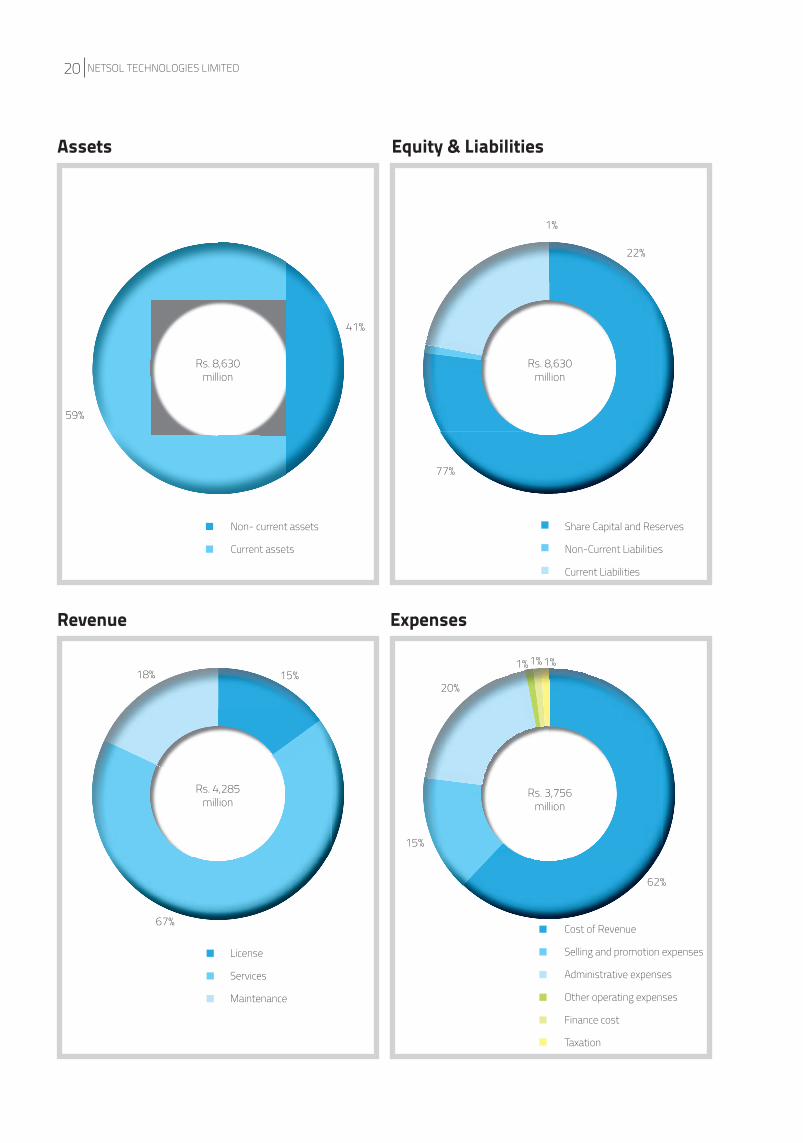
���������������������������������������Non- current assets
Current assets
Share Capital and Reserves
Non-Current Liabilities
Current Liabilities
License
Services
Maintenance
Cost of Revenue
Selling and promotion expenses
Administrative expenses
Other operating expenses
Finance cost
Taxation
59%
18% 15%
67%
41%
77%
1%
22%
1%1% 1%
62%
20%
15%
Assets Equity & Liabilities
Revenue Expenses
Rs. 8,630million
Rs. 4,285million
Rs. 8,630million
Rs. 3,756million
NETSOL TECHNOLOGIES LIMITED20
GOVERNANCE
Board ofDirectors
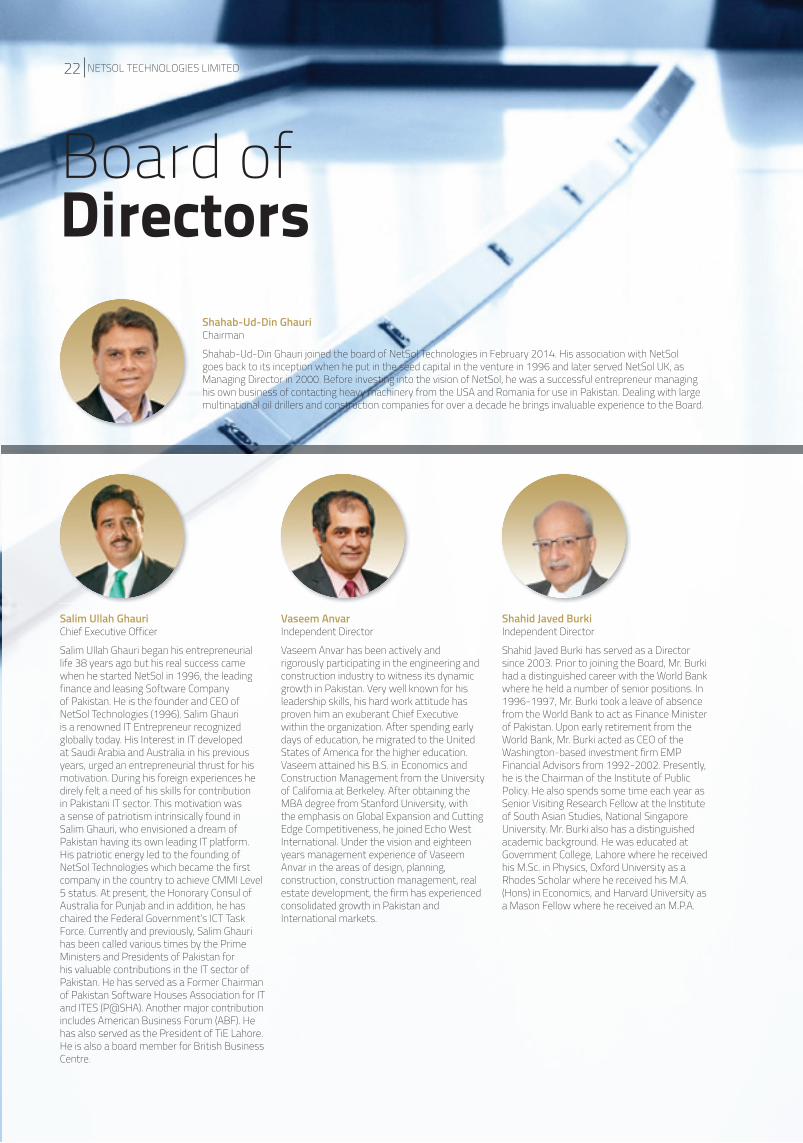
Shahab-Ud-Din GhauriChairman
Shahab-Ud-Din Ghauri joined the board of NetSol Technologies in February 2014. His association with NetSol goes back to its inception when he put in the seed capital in the venture in 1996 and later served NetSol UK, as Managing Director in 2000. Before investing into the vision of NetSol, he was a successful entrepreneur managing his own business of contacting heavy machinery from the USA and Romania for use in Pakistan. Dealing with large multinational oil drillers and construction companies for over a decade he brings invaluable experience to the Board.
Shahid Javed BurkiIndependent Director
Shahid Javed Burki has served as a Director since 2003. Prior to joining the Board, Mr. Burki had a distinguished career with the World Bank where he held a number of senior positions. In 1996-1997, Mr. Burki took a leave of absence from the World Bank to act as Finance Minister of Pakistan. Upon early retirement from the World Bank, Mr. Burki acted as CEO of the Washington-based investment firm EMP Financial Advisors from 1992-2002. Presently, he is the Chairman of the Institute of Public Policy. He also spends some time each year as Senior Visiting Research Fellow at the Institute of South Asian Studies, National Singapore University. Mr. Burki also has a distinguished academic background. He was educated at Government College, Lahore where he received his M.Sc. in Physics, Oxford University as a Rhodes Scholar where he received his M.A. (Hons) in Economics, and Harvard University as a Mason Fellow where he received an M.P.A.
Salim Ullah GhauriChief Executive Officer
Salim Ullah Ghauri began his entrepreneurial life 38 years ago but his real success came when he started NetSol in 1996, the leading finance and leasing Software Company of Pakistan. He is the founder and CEO of NetSol Technologies (1996). Salim Ghauri is a renowned IT Entrepreneur recognized globally today. His Interest in IT developed at Saudi Arabia and Australia in his previous years, urged an entrepreneurial thrust for his motivation. During his foreign experiences he direly felt a need of his skills for contribution in Pakistani IT sector. This motivation was a sense of patriotism intrinsically found in Salim Ghauri, who envisioned a dream of Pakistan having its own leading IT platform. His patriotic energy led to the founding of NetSol Technologies which became the first company in the country to achieve CMMI Level 5 status. At present, the Honorary Consul of Australia for Punjab and in addition, he has chaired the Federal Government’s ICT Task Force. Currently and previously, Salim Ghauri has been called various times by the Prime Ministers and Presidents of Pakistan for his valuable contributions in the IT sector of Pakistan. He has served as a Former Chairman of Pakistan Software Houses Association for IT and ITES (P@SHA). Another major contribution includes American Business Forum (ABF). He has also served as the President of TiE Lahore. He is also a board member for British Business Centre.
Vaseem AnvarIndependent Director
Vaseem Anvar has been actively and rigorously participating in the engineering and construction industry to witness its dynamic growth in Pakistan. Very well known for his leadership skills, his hard work attitude has proven him an exuberant Chief Executive within the organization. After spending early days of education, he migrated to the United States of America for the higher education. Vaseem attained his B.S. in Economics and Construction Management from the University of California at Berkeley. After obtaining the MBA degree from Stanford University, with the emphasis on Global Expansion and Cutting Edge Competitiveness, he joined Echo West International. Under the vision and eighteen years management experience of Vaseem Anvar in the areas of design, planning, construction, construction management, real estate development, the firm has experienced consolidated growth in Pakistan and International markets.
NETSOL TECHNOLOGIES LIMITED22
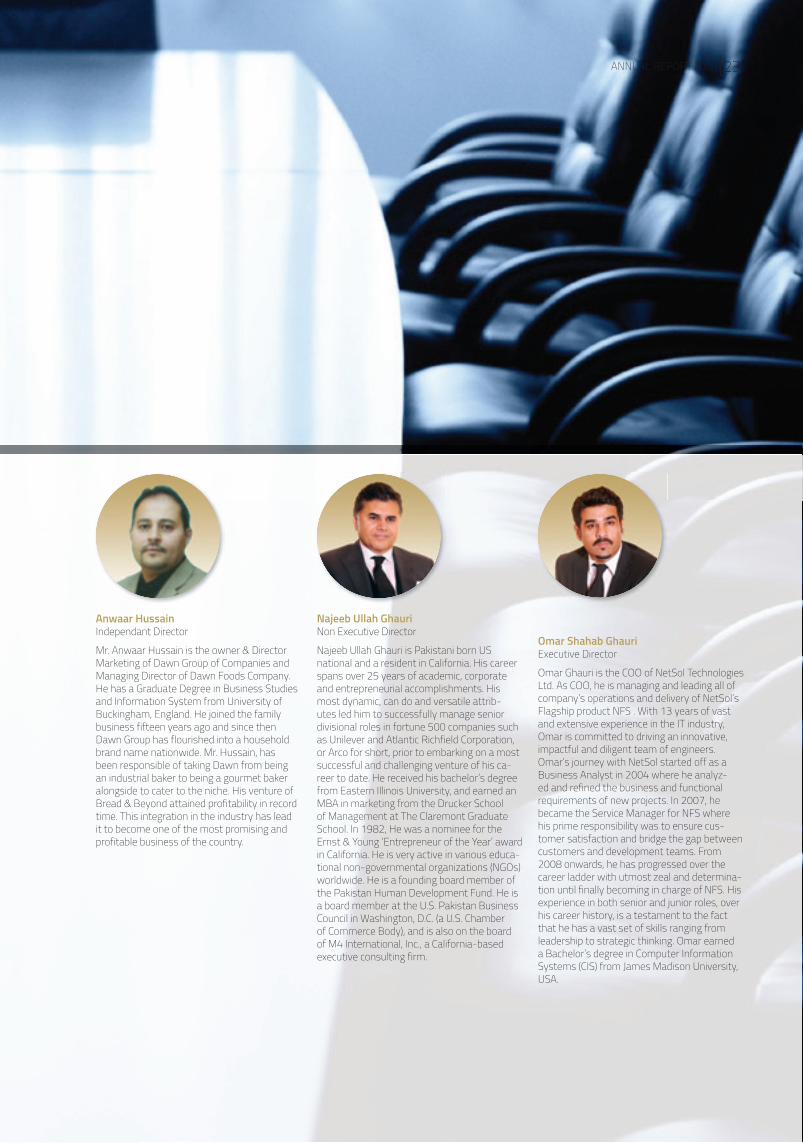
Najeeb Ullah GhauriNon Executive Director
Najeeb Ullah Ghauri is Pakistani born US national and a resident in California. His career spans over 25 years of academic, corporate and entrepreneurial accomplishments. His most dynamic, can do and versatile attrib-utes led him to successfully manage senior divisional roles in fortune 500 companies such as Unilever and Atlantic Richfield Corporation, or Arco for short, prior to embarking on a most successful and challenging venture of his ca-reer to date. He received his bachelor’s degree from Eastern Illinois University, and earned an MBA in marketing from the Drucker School of Management at The Claremont Graduate School. In 1982, He was a nominee for the Ernst & Young ‘Entrepreneur of the Year’ award in California. He is very active in various educa-tional non-governmental organizations (NGOs) worldwide. He is a founding board member of the Pakistan Human Development Fund. He is a board member at the U.S. Pakistan Business Council in Washington, D.C. (a U.S. Chamber of Commerce Body), and is also on the board of M4 International, Inc., a California-based executive consulting firm.
Anwaar HussainIndependant Director
Mr. Anwaar Hussain is the owner & Director Marketing of Dawn Group of Companies and Managing Director of Dawn Foods Company. He has a Graduate Degree in Business Studies and Information System from University of Buckingham, England. He joined the family business fifteen years ago and since then Dawn Group has flourished into a household brand name nationwide. Mr. Hussain, has been responsible of taking Dawn from being an industrial baker to being a gourmet baker alongside to cater to the niche. His venture of Bread & Beyond attained profitability in record time. This integration in the industry has lead it to become one of the most promising and profitable business of the country.
Omar Shahab GhauriExecutive Director
Omar Ghauri is the COO of NetSol Technologies Ltd. As COO, he is managing and leading all of company’s operations and delivery of NetSol’s Flagship product NFS . With 13 years of vast and extensive experience in the IT industry, Omar is committed to driving an innovative, impactful and diligent team of engineers. Omar’s journey with NetSol started off as a Business Analyst in 2004 where he analyz-ed and refined the business and functional requirements of new projects. In 2007, he became the Service Manager for NFS where his prime responsibility was to ensure cus-tomer satisfaction and bridge the gap between customers and development teams. From 2008 onwards, he has progressed over the career ladder with utmost zeal and determina-tion until finally becoming in charge of NFS. His experience in both senior and junior roles, over his career history, is a testament to the fact that he has a vast set of skills ranging from leadership to strategic thinking. Omar earned a Bachelor’s degree in Computer Information Systems (CIS) from James Madison University, USA.
ANNUAL REPORT 2018 23
On behalf of the Board of Directors, we are pleased to present the 22nd Annual Report of NetSol Technologies Limited (“NETSOL” or “the Company”) along with audited financial statements for the year ended June 30, 2018 and the Auditors’ Report thereon.
PRINCIPAL ACTIVITIES, THE DEVELOPMENT AND PERFORMANCE OF THE COMPANY’S BUSINESS
During the current fiscal year, NETSOL continued to grow with noteworthy successful implementations and a healthy number of potential leads. Fiscal 2018 closed with a multi-million-dollar agreement with a leading Asian auto captive finance company to deploy NFS Ascent platform, specifically Loan Origination System along with the Contract Management System for the company’s auto finance operations.
The Company also secured an agreement with a top tier mul-ti-finance company in Indonesia to deploy its mobile origination Point of Sale system. The new contract includes product license, multiple-year maintenance agreement and agreed rates for any additional customizations of the mPOS application. The client will be leveraging NETSOL’s system to originate credit applications and provide quick turnaround to customers seeking finance and leasing products.
NETSOL’s evergreen commitment to innovation leads the manage-ment to constitute a department, Innovation Lab, with the directive to generate new and future focused products. The management tasked a high-profile innovation expert from Deloitte to head the dynamic team. In the short while the team has been working, sever-al novel prospects have been conceived. This initiative is expected to usher in an era of innovation and take the company in exciting new directions in the days ahead.
FINANCIAL PERFORMANCE
RESULTS
SEPARATE ACCOUNTS
June 30 2018 June 30 2017
Rupees in ‘000’
Revenue (in 000) 4,284,800 3,925,697
Gross Profit (in 000) 1,938,638 1,240,360
Net Profit (in 000) 1,065,970 320,296
Earnings per share – basic (Rs.) 11.89 3.58
Earnings per share – diluted (Rs.) 11.87 3.56
Adjusted EBITDAper share – diluted (Rs.) 18.68 12.37
Net revenues for the year ended June 30, 2018 were Rs. 4,285 million compared to Rs. 3,926 million in fiscal 2017. License revenue decreased from Rs. 1,236 million to Rs. 651 million. During the last year, implementation at four different customer sites were started parallel out of which couple of implementations have already been completed and products gone live resulting in less license revenue in current fiscal year. Service revenue increased from Rs. 1,874 million in the previous fiscal year to Rs. 2,877 million in the current year.
The increase in services revenue is mainly due to services associat-ed with the implementation of NFS AscentTM at different client sites both in China and South Africa. In addition to it, certain additional services revenue was also recorded from a code split activity for a customer in China. Maintenance revenue slightly decreased from Rs. 816 million in the previous fiscal year to Rs. 757 million in the current year.
Gross profit for the year was Rs. 1,939 million, up from Rs. 1,240 million in the same period last year. The company posted net profit of Rs. 1,066 million in the current year compared to a net profit of Rs. 320 million in the previous year. Basic and diluted earnings per share were Rs. 11.89 and Rs. 11.87 respectively in comparison with last year’s basic and diluted earnings per share of Rs. 3.58 and Rs. 3.56 respectively.
Adjusted EBITDA profit was Rs. 18.68 per share in the current fiscal year compared to Rs. 12.37 in the last fiscal year. EBITDA is a non-IFRS measure which is commonly used by the investors and analysts to analyze the financial health of any company. EBITDA is earnings before interest, tax, depreciation and amortization. Due to better realization of accounts receivables, the Company is also showing improved trends in its cash flows.
The financial results of the Company are a reflection of the unre-lenting commitment and contribution of its people and the trust placed in the Company by its customers, suppliers, service providers and shareholders.
Directors’ Report to the Members
NETSOL TECHNOLOGIES LIMITED24
DIVIDEND
The Board of Directors in their meeting held on September 25, 2018 has recommended 25% cash dividend for the fiscal year ended June 30, 2018.
FUTURE OUTLOOK
The company will continue to promote its flagship, premier product, NFS AscentTM, and NetSol Financial Suite in the coming quarters alongside focusing on its state-of-the-art enterprise digitization applications suite (NFS Mobility) which has gained considerable traction in various regions across the globe.
We will also continue to maintain our presence at international summits, conferences and events across the world. The Compa-ny will continue to sponsor and attend industry events that could possibly result in qualified leads and increase the organization’s reach. Being a leader in the finance and leasing industry, NETSOL has already signed up to attend/sponsor certain upcoming leasing summits and events in the United States, United Kingdom, Europe, China and other countries in the region.
Besides, the Innovation Lab will leap forward for the company, taking it past its competition. It will not only modernize existing products and generate new products for the future and in turn cre-ate new revenue streams but the initiative will incubate a corporate culture of innovation as well.
AWARDS & RECOGNITION
NETSOL was awarded the First Rate and Best Selling Finance and Leasing Solution Provider Award at the 2018 Annual China Leasing Summit (CLS) for the sixth consecutive year. This recognition, for being the most superior software solution provider to finance and leasing companies across the country further strengthened NET-SOL’s position as an industry leader in China.
The Company also received the “Auto Finance Software System Leading Enterprise Award” at the China International Automotive Finance and Risk Management Summit held in Shanghai on March 22nd and March 23rd 2018.
PRINCIPAL RISK AND UNERTAINTIES FACING THE COMPANY
Despite the fact that the Company’s financial performance is outstanding for the past few years and the Company successfully crossed all the barriers in its way to continue to write its journey of success, still there are certain risk factors which may have an impact on the future performance of the Company.
RISK FACTORS
A) CYBER SECURITY THREATS
Owing to the rise in cyber-crimes globally, the Company’s ICT infrastructure is susceptible to certain threats. To ensure privacy and confidentiality of the Company and its employee’s data, the Com-pany has taken different measures including Intrusion Prevention System (IPS), encryption, and access control mechanism and using secure transmission protocols for client and server communications.
B) FOREIGN EXCHANGE RISK
Foreign currency risk arises mainly where receivables and payables exist due to transactions entered into foreign currencies. The Com-pany is exposed to foreign currency risk on trade debts, payables and revenues which are entered in a currency other than Pak Rupee. Majority of the revenue of the Company is in currencies other than Pak Rupees. The Company also holds cash and cash equivalents denominated in foreign currencies for working capital purposes.
C) LIQUIDITY RISK
Liquidity risk reflects an enterprise’s inability in raising funds to meet
its commitments. The Company’s exposure to liquidity risk arises primarily from mismatch of the maturities of financial assets and liabilities. We however follow an effective cash management and planning policy to ensure ready availability of funds and to take appropriate actions for any new requirements.
D) CREDIT RISK
Credit risk represents the accounting loss that would be recognized at the reporting date if counter-parties failed completely to perform as contracted. To reduce exposure to credit risk the Company has developed a formal approval process whereby credit limits are applied to its customers. The Management also continuously mon-itors credit exposure towards its customers and makes provision, if required against any balance considered doubtful of recovery.
E) INTEREST RATE RISK
Interest rate risk is the risk that the fair value of future cash flows of a financial instrument will fluctuate because of changes in market interest rates. Majority of the interest rate exposure arises from short and long term borrowings from bank, term deposits and deposits in profit and loss/saving accounts with banks and invest-ments in mutual funds.
MAIN TRENDS AND FACTORS LIKELY TO AFFECT THE FUTURE DEVELOPMENT, PERFORMANCE AND POSITION OF THE COMPA-NY BUSINESS
Technological advancements around the globe are increasing rapidly. In order to grow, the Company has to capitalize in establishing proficiencies and competencies. Moreover, product development and extensive efforts in acquiring entry into fresh markets will have significant impact on future performance and position of the Com-pany’s business.
CHANGES DURING FINANCIAL YEAR CONCERNING NATURE OF THE BUSINESS OF THE COMPANY OR OF ITS SUBSIDIARIES AND JOINT OPERATION
NETSOL had established a subsidiary company called NetSol Innovation (Pvt) Limited in collaboration of a UK based partner Innovation Group. The Company is involved in providing outsourc-ing services to the joint venture partner. Innovation Group was bought out couple of years ago and due to major shift in the new owners’ business strategy, they decided to consolidate and reduce their insurance business operations across the globe. As a result of this decision, the Company’s outsourcing business was negatively impacted as they are the sole customers of the services provided by the joint venture. As a result of this change, the operating and net margins of the subsidiary became unfeasible for the operation to continue. Therefore, with the consent of the partner, the Board made a decision to provide any future services to the customer from the platform of NetSol Technologies Limited effective August 1, 2018. As a result, the subsidiary company’s business operations would be closed by the end of July 2018. The Company, however believes that there would be no material impact of this transition on the overall business, operations and cash flows of the Company.
IMPACT OF COMPANY BUSINESS ON THE ENVIRNOMENT
The Company is not a manufacturing concern but a software house involved in the software development. Therefore, it doesn’t have any adverse impact on the environment. We are, however, very con-scious of the environment and follow a go green policy religiously.
CORPORATE SOCIAL RESPONSIBILTY
A detailed report on corporate social responsibility is annexed herewith.
NSPIRE
The foundation laid in 2015 and availed the first mover advantage in
ANNUAL REPORT 2018 25
industry being first IT Company in Pakistan who took initiative for start-up eco-system. NETSOL played an active role to bring industry experts who have been there, done that and set success examples for young generation. During the year July 2017 - June 2018, NSPIRE success-fully completed its cycle 3rd and 4th and organized number of events including ‘Startup GIG’ - A carefully designed series of workshops com-prised on 5 days for budding entrepreneurs from different universities.
In Oct 2017, NSPIRE in collaboration with ‘DaftarKhawn’ conduct-ed learning sessions where founders of successful startups shared their journeys and do’s and don’ts with the aspiring entrepreneurs to motivate them. In first half of 2018, NSPIRE organized two events under name of Gigspire and Communication 360 where knowledge-able industry experts delivered their insights and inspired the young entrepreneurs. In addition to that, NSPIRE has done collaboration with Telenor Velocity to help startups in acceleration. Nspire also collaborat-ed with “Women Chamber of Commerce & Industry” signed an MOU for escalation of entrepreneurship and women empowerment. For providing legal services to startups Nspire signed an MOU with “Startu-pLawnch” who facilitates startups in initial legal help to assist and guide them. Further, Nspire signed an MOU with “Emagine” who are providing training to future entrepreneurs for skill development. Currently Nspire is receiving applications for 5th Cycle. Customized curriculum has been designed and diverse experts will be mentoring the startups. Nspire is collaborating with educational institutes and universities who are pro-ducing knowledge brain, researchers and innovators of future, to take their potential and convert them in overall Pakistan’s growth.
At Nspire the whole team is committed to deliver the best what an in-cubation center can do for building the eco-system and entrepreneurial development.
INSTITUTE FOR CORPORATE ADVANCEMENT AT NETSOL (ICAN)
NETSOL firmly believes in continuous learning and has a dedicated group called ICAN (Institute for Corporate Advancement at NETSOL) which runs all required trainings and professional development pro-grams for new and existing employees. ICAN is responsible to design, develop and execute all training programs within the company. Training need assessment is conducted on continuous basis with HR and department heads to ensure required development gaps are addressed through effective training programs.
The company has implemented a state of the art in-house Learn-ing Management System (LMS) which is upgraded every six to eight months to ensure we use latest features. Three training rooms, a recording studio and the necessary training infrastructure for a high quality training experience have also been set up. Every new-hire has to go through a specially designed program which covers business ethics, domain knowledge, development methodology, software program-ming as well as NFS application training. Training programs for existing employees are conducted as required.
In the fiscal year 2017-2018, ICAN delivered more than 1000 hours of training in about 180 different sessions (in-class plus e-Learning) and covered about 30 distinct topics. The topics ranged from very specific areas such as software programming in different technologies to general areas such as business communication, presentation skills and personal effectiveness. More than 500 participants attended at least one or more sessions. Additionally, ICAN also facilitated external train-ings, certifications and examinations of 100+ people across different departments.
ICAN has also procured access to the global knowledge pool via an online arrangement with one of the world’s leading learning platforms. In fiscal 2016-2017, NETSOL attained the status of an ACCA approved employer. The relationship with ACCA has enriched the knowledge and network of our business analysts, accounts and finance experts. NETSOL also encourages its employees to take global trainings and certifications (PMP, MCP, ACP, CCEI, CCNA, etc.) to enhance their knowl-edge base by providing with necessary sponsorship.
ADEQUACY OF INTERNAL FINANCIAL CONTROLS
The Board has the ultimate responsibility to establish and maintain adequate internal controls over financial reporting. Our internal controls are designed to provide reasonable assurance regarding the reliabil-ity of our financial reporting and preparation of our external financial statements in accordance with the International Financial Reporting Standards. Due to inherent limitations of any internal control system, management acknowledges that there may be limitations as to the effectiveness of internal controls over financial reporting and therefore recognizes that only reasonable assurance can be gained from any internal control system. The Company, however, maintains an effective internal control framework comprising of clear structures, authority limits and accountabilities and well understood policies and procedures for review processes.
COMPLIANCE WITH CODE OF CORPORATE GOVERNANCE
The Company is fully compliant with the requirements of the Listed Companies (Code of Corporate Governance), Regulations 2017. A statement to this effect is annexed with this report.
STATEMENT OF COMPLAINCE
The statement of compliance under the Companies Act, 2017 has not been notified. The statement of compliance under the Listed Companies (Code of Corporate Governance), Regulations 2017 is attached with this report.
COMPOSITION OF THE BOARD
Composition of the Board of Directors is in compliance with the requirement of Listed Companies (Code of Corporate Governance), Regulations 2017 which is given below:
The total number of directors is seven (07) as per the following:
Gender Number
Male 07
Female Applicable from next term of Board
Composition of the Board is given below:
Category Number
Independent Directors 03
Non-executive Directors 02
Executive Directors 02
NAME OF THE DIRECTORS
Following are the board members of the Company as at June 30, 2018:
• Mr. Shahab-Ud-Din Ghauri• Mr. Salim Ullah Ghauri• Mr. Vaseem Anvar• Mr. Shahid Javed Burki• Mr. Anwaar Hussain• Mr. Najeeb Ullah Ghauri• Mr. Omar Ghauri
ATTENDANCE AT THE BOARD MEETING
There was no change in the constitution of the Board during the fis-cal year 2018. During the year ended June 30, 2018, five (05) board meetings were held and attended as follows:
NETSOL TECHNOLOGIES LIMITED26
Names of Directors Attendance at meetings
Shahab-ud-Din Ghauri Five (05)
Salim Ullah Ghauri Five (05)
Vaseem Anvar Five (05)
Najeeb Ullah Ghauri Four (04)
Shahid Javed Burki Three (03)
Anwaar Hussain Three (03)
Omar Ghauri Five (05)
Leave of absence was granted to the members not able to attend the board meetings.
The board has also made sub-committees which have significant-ly contributed in achieving desired objectives. These committees include:
AUDIT COMMITTEE
The Board of Directors in compliance with the Code of Corporate Governance has established an Audit Committee comprising of the following three (03) members:
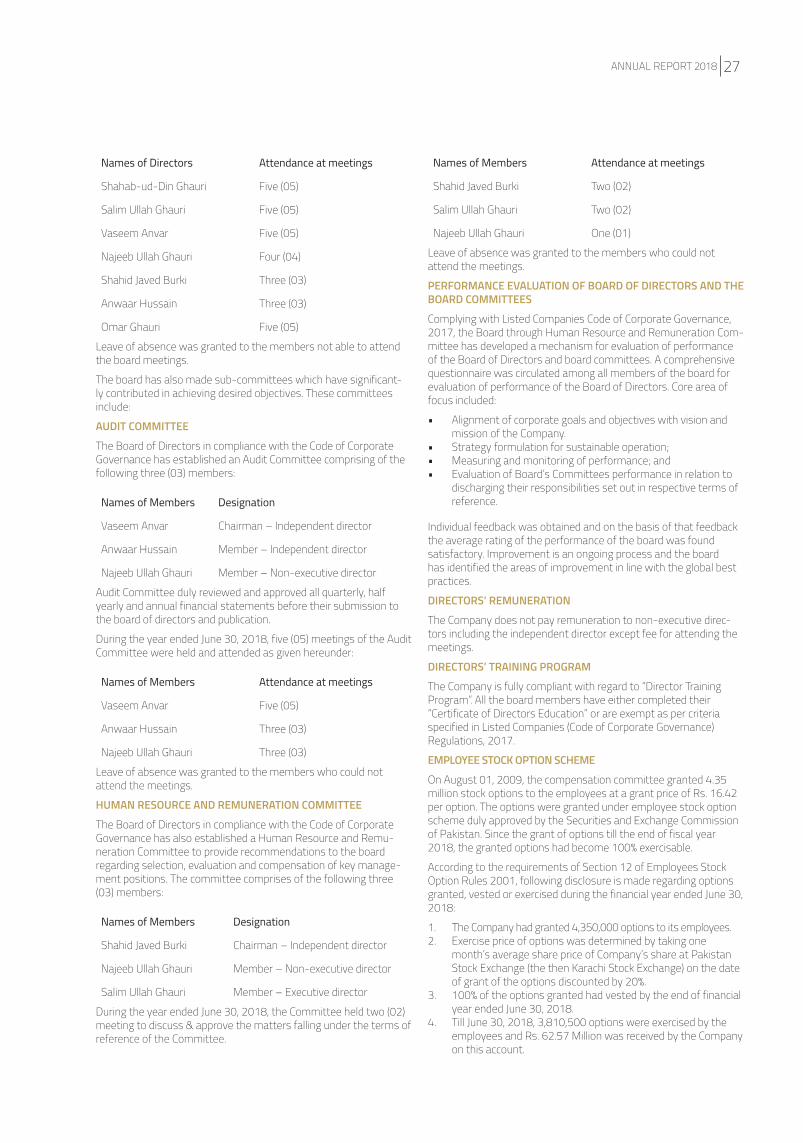
Names of Members Designation
Vaseem Anvar Chairman – Independent director
Anwaar Hussain Member – Independent director
Najeeb Ullah Ghauri Member – Non-executive director
Audit Committee duly reviewed and approved all quarterly, half yearly and annual financial statements before their submission to the board of directors and publication.
During the year ended June 30, 2018, five (05) meetings of the Audit Committee were held and attended as given hereunder:
Names of Members Attendance at meetings
Vaseem Anvar Five (05)
Anwaar Hussain Three (03)
Najeeb Ullah Ghauri Three (03)
Leave of absence was granted to the members who could not attend the meetings.
HUMAN RESOURCE AND REMUNERATION COMMITTEE
The Board of Directors in compliance with the Code of Corporate Governance has also established a Human Resource and Remu-neration Committee to provide recommendations to the board regarding selection, evaluation and compensation of key manage-ment positions. The committee comprises of the following three (03) members:
Names of Members Designation
Shahid Javed Burki Chairman – Independent director
Najeeb Ullah Ghauri Member – Non-executive director
Salim Ullah Ghauri Member – Executive director
During the year ended June 30, 2018, the Committee held two (02) meeting to discuss & approve the matters falling under the terms of reference of the Committee.
Names of Members Attendance at meetings
Shahid Javed Burki Two (02)
Salim Ullah Ghauri Two (02)
Najeeb Ullah Ghauri One (01)
Leave of absence was granted to the members who could not attend the meetings.
PERFORMANCE EVALUATION OF BOARD OF DIRECTORS AND THE BOARD COMMITTEES
Complying with Listed Companies Code of Corporate Governance, 2017, the Board through Human Resource and Remuneration Com-mittee has developed a mechanism for evaluation of performance of the Board of Directors and board committees. A comprehensive questionnaire was circulated among all members of the board for evaluation of performance of the Board of Directors. Core area of focus included:
• Alignment of corporate goals and objectives with vision and mission of the Company.
• Strategy formulation for sustainable operation;• Measuring and monitoring of performance; and• Evaluation of Board’s Committees performance in relation to
discharging their responsibilities set out in respective terms of reference.
Individual feedback was obtained and on the basis of that feedback the average rating of the performance of the board was found satisfactory. Improvement is an ongoing process and the board has identified the areas of improvement in line with the global best practices.
DIRECTORS’ REMUNERATION
The Company does not pay remuneration to non-executive direc-tors including the independent director except fee for attending the meetings.
DIRECTORS’ TRAINING PROGRAM
The Company is fully compliant with regard to “Director Training Program”. All the board members have either completed their “Certificate of Directors Education” or are exempt as per criteria specified in Listed Companies (Code of Corporate Governance) Regulations, 2017.
EMPLOYEE STOCK OPTION SCHEME
On August 01, 2009, the compensation committee granted 4.35 million stock options to the employees at a grant price of Rs. 16.42 per option. The options were granted under employee stock option scheme duly approved by the Securities and Exchange Commission of Pakistan. Since the grant of options till the end of fiscal year 2018, the granted options had become 100% exercisable.
According to the requirements of Section 12 of Employees Stock Option Rules 2001, following disclosure is made regarding options granted, vested or exercised during the financial year ended June 30, 2018:
1. The Company had granted 4,350,000 options to its employees.2. Exercise price of options was determined by taking one
month’s average share price of Company’s share at Pakistan Stock Exchange (the then Karachi Stock Exchange) on the date of grant of the options discounted by 20%.
3. 100% of the options granted had vested by the end of financial year ended June 30, 2018.
4. Till June 30, 2018, 3,810,500 options were exercised by the employees and Rs. 62.57 Million was received by the Company on this account.
ANNUAL REPORT 2018 27
5. 67,000 fresh shares were issued during the fiscal year ended June 30, 2018 due to exercise of options by the employees. Total shares issued against the employees’ stock option scheme till June 30, 2018 were 3,810,500.
6. 392,000 options have lapsed.7. Following options were granted to the senior managerial cadre
employees of the Company on August 01, 2009:
DESIGNATION OPTIONS GRANTED
Chief Executive Officer 250,000
Chief Operating Officer 100,000
Chief Financial Officer 100,000
8. Except the figures disclosed above, no employee was granted five percent or more of options during one year or one percent or more of the issued capital of the Company.
9. Certain amendments to Employees Stock Option Scheme 2009 were approved by Securities and Exchange Commis-sion of Pakistan vide letter dated June 10, 2016. The same amendments were also approved by the shareholders of the Company through a special resolution passed on October 27, 2015. Major amendments are narrated below:a. Vesting period for the options to be granted by the Com-
pany from the year 2016 onwards would be three years instead of seven years.
b. Options to be granted by the Company in the year 2016 onwards may be exercised in the following manner:- 50% of the options granted to an employee may be
exercised any time during the exercise period but one year after the date of grant.
- Up to 80% (inclusive of 50% above) of the options granted to an employee may be exercised any time during the exercise period but after completion of two years from the date of grant.
- Up to 100% (inclusive of 80% above) of the options granted to an employee may be exercised any time during the exercise period but after completion of three years from the date of grant.
HOLDING COMPANY
NetSol Technologies Inc., 23975 Park Sorrento, Suite 250, Calabasas CA 91302, USA holds majority of the shareholding of the Company.
APPOINTMENT OF AUDITORS
The present external auditors’ Messrs H.Y.K & CO., Chartered Ac-countants retire and being eligible, offer themselves for reappoint-ment. The Board of Directors has endorsed the recommendation of the Audit Committee for the re-appointment of Messrs H.Y.K & CO., as the auditors for the financial year ending June 30, 2019 on such terms and conditions and remuneration as may be decided.
The external auditors have confirmed that they have been given satisfactory rating under the Quality Control Review Program of the Institute of Chartered Accountants of Pakistan (ICAP). They have further confirmed that their firm is in compliance with International Federation of Accountants’ (IFAC) guidelines on Code of Ethics as adopted by the ICAP. The external auditors have not been appoint-ed to provide other services except in accordance with the Listing Regulations.
PATTERN OF SHAREHOLDING
A statement of the pattern of shareholding as at June 30, 2018 is annexed herewith.
SUBSEQUENT EVENTS
No material changes or commitments affecting the financial position of the Company have taken place between the end of the financial year and the date of this report.
ACKNOWLEDGEMENT
The Board of Directors places on record its appreciation for the continued support by its respected shareholders, valued custom-ers, government agencies and financial institutions. The Board also expresses its appreciation for the services, loyalty and efforts being continuously rendered by all the employees of the Company and hope that they will continue with the same efforts in future.
On behalf of the Board
Salim Ullah Ghauri Omar GhauriCheif Executive Officer Director
Lahore September 25, 2018
NETSOL TECHNOLOGIES LIMITED28
2018 30
Netsol 2018 (Leads)
(Asian Auto Captive Finance NFS AscentCompany)
Cont rac t Loan Or ig ina t i on Sys tem Management System
mobile origination Point of Sale System
mPOS
leveraging
Innovation Lab
Deloitte
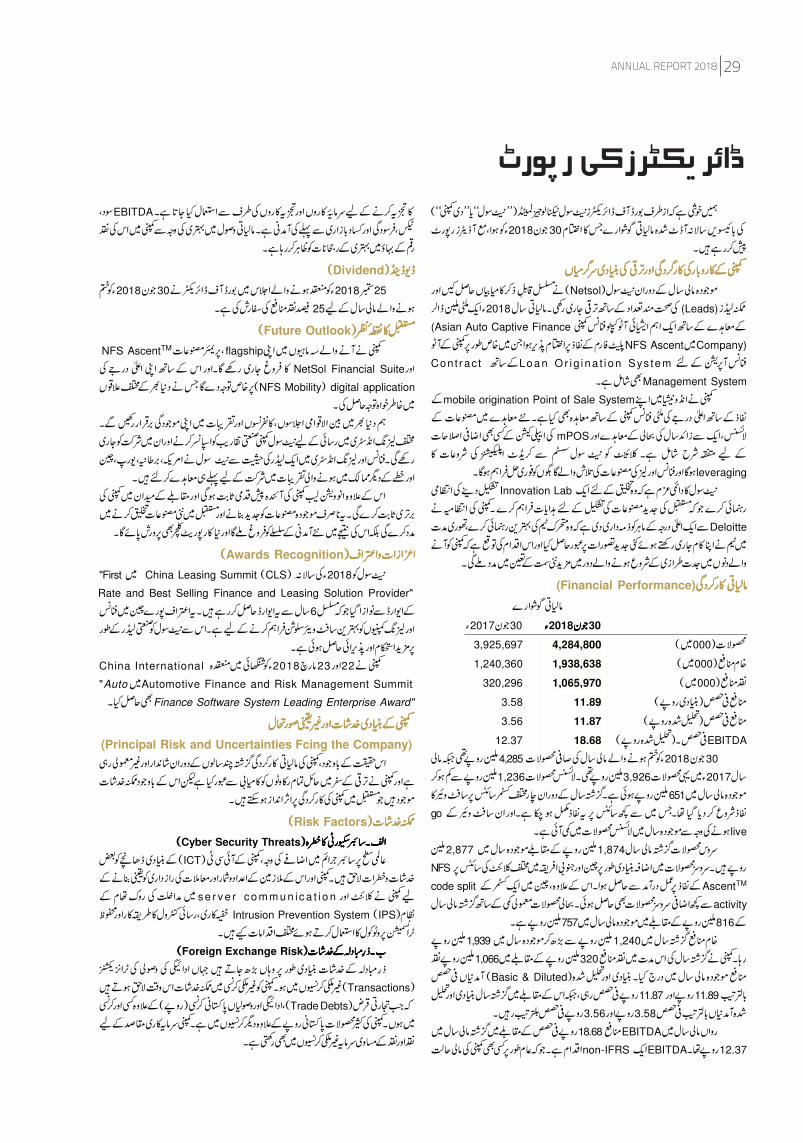
(Financial Performance)
2017 30 2018 30
3,925,697 4,284,800 000 1,240,360 1,938,638 000
320,296 1,065,970 000 3.58 11.89 3.56 11.87
12.37 18.68 EBITDA
4,285 2018 30
1,236 3,926 2017 651
go live
2,877 1,874 NFS code split AscentTM
activity
757 816 1,939 1,240 1,066 320
Basic & Diluted 11.87 11.89
3.56 3.58 18.68 EBITDA
non-IFRS EBITDA 12.37
EBITDA
Dividend
2018 30 201825
25 Future Outlook
NFS AscentTM flagship NetSol Financial Suite
NFS Mobility digital application
Awards Recognition "First China Leasing Summit CLS 2018 Rate and Best Selling Finance and Leasing Solution Provider"
6
China International 2018 23 22 "Auto Automotive Finance and Risk Management Summit
Finance Software System Leading Enterprise Award"
(Principal Risk and Uncertainties Fcing the Company)
Risk Factors Cyber Security Threats ICT
se r v e r c o m m u n ic a t i o n Intrusion Prevention System IPS
Foreign Exchange Risk
Transactions
Trade Debts
1
4,284,8004,284,800
1,938,6381,938,638
1,065,9701,065,970
11.8911.89
11.8711.87
18.6818.68
ANNUAL REPORT 2018 29
Liquidity Risk
Credit Risk
Interest Rate Risk financial instroment
(Main Trends and Factors Likely to Affect the Futute
Development, Performance and Position of the
Company Business)
(Changes During Financial Year Concerning Nature of
the Company or of its Subsidries and joint Operation)
outsourcing
outsourcing sole customers
2018
2018
(Impact of Company Business on Environment)
Corporate Social Responsibilty
(Nspire)
eco-system 2015
,cycle 4th 3rd 2018 2017 Startup GIG Nspire
5 Learining DaftarKhawn Nspire 2017
2018 session
Communication 360 GigspireNspire
Nspire Nspire Telenor velocity
MOU MOU StartupLawnch Nspire
MOU Emagine Nspire
cycle 5th,Nspire Nspire Startups
Nspire
Institute for Corporate Advoncement at NetSol (ICAN)
Institute of Corpotate Advoncement at NetSolICAN ICAN
HR
Development Gaps in-house Learning Managemnt System
Upgrade 68 (LMS)
NFS
(In-class plus e 180 1000ICAN 2017-18 30 -learning)
500 Presentation skills
100 ICAN
ICAN
Employer ACCA 2016-17 ACCA
PMP,MCP,ACP,CCEI,CCNA
2
NETSOL TECHNOLOGIES LIMITED30
Adequacy of internal Financial controls
(International Financial Reporting Standards)
(Compliance with Code of Corporate Governance)
2017
(Statement of Complaince) 2017
(Statement) Composition of the Board 2017
(07)
07
Composition
Category
03
02 02
: 2018 30
i
ii
iii
iv
v
vi
vii
(Attendance at Board Meeting) 2018 30 2018
: 05
05 05 05 04
03 03 05
(Audit Committee)
3
-
- -
(05) 2018 30
(05) (03) (03)
(Human Resource and Remuneration Committee)
- -
- (02) 2018 30
(02) (02)
(01)
(Performance Evaluation of Board of Directors the board committees)
2017
3
ANNUAL REPORT 2018 31
(Terms of Reference) Feedback
(Directors' Remuneration)
(Director's Tranning Programe)
2017 [Listed Companies (Code of Corporate Governance), Regulation
2017]
(Employee Stock Option Scheme) 4.35Compensation Committee 2009
(options) 16.42
100 2018
2018 30 12 2001 exercisedvested
: 4,350,000 i
20 Exercise Price ii
vested 2018 30 100 iii
3,810,500 2018 30 iv
62.57
2018 30 v
2018 30 67,000 3,810,500 lapse(Options) 392,000 vi
: 2009 vii
250,000 100,000 100,000
viii
2016 10 ix
2015 27 2009
Vesting 2016
Options 2016
Options
50 80
80 100
(Holding Company)
2 5 0 2 3 9 7 5 91302
(Appointment of Auditors)
(Rating) ICAP ICAPIFAC
ICAP (Listining
Regulations)
2019 30
(Pattern of Shareholding) (Pattern of Shareholding) 2018 30
(Subsequent Events)
Acknowledgement
:
201825
4
NETSOL TECHNOLOGIES LIMITED32
Corporate social responsibility (CSR) is an organization’s initiatives to assess and take responsibility for the company’s effects on environ-mental and social wellbeing. The term commonly applies to efforts that go beyond what may be required by regulators or environmental protection groups. CSR can also be referred to as corporate citizenship and can involve incurring short-term costs that do not provide an im-mediate financial benefit to the company, but instead promote positive social and environmental change.
NETSOL acts responsibly on behalf of the future generations for the fulfillment of economic, environmental, and social progress. The Com-pany works with various foundations and trusts towards improving healthcare infrastructure, supporting primary education, rehabilitating women and children.
As a responsible corporate citizen, NETSOL undertook various projects for community welfare during the year, some of which are described here under: .
Corporate Philanthropy
1.1 NetSol Education Support Program (NESP)
The NESP program is principally designed to support the educa-tion of children of eligible employees from Grade I - XII. It covers all permanent employees, working in “Admin Support Function” of NETSOL and its subsidiary company along with deserving individu-als of the community. The employees and external individuals cov-ered under this program are supported to educate their children and provide them with a better future. Currently, this initiative is helping 339 children with their education of 145 employees internally and externally 10 children of 3 families are being educated. These stu-dents go to both English and Urdu medium institutions. It is helping students throughout Pakistan; from Karachi to KPK, including the FATA area, Gilgit Baltistan, Chitral, and Azad Kashmir with children enrolled in 172 schools.
With higher education a top priority in the education sector, NetSol has fully supported over 5 students (children of NetSol’s permanent staff) with Financial Aid for Bachelors and Masters level education. These students are acquiring education from well-reputed colleges and universities.
Extending its goodwill in education, NetSol is dedicatedly running Farooq Charity Trust School, Khanqah, Bahawalpur which is a back-ward area and the school itself required immense attention for its infrastructure and development.
Amongst many charitable projects, NetSol also contributed and supported the growth of Development in Literacy, DIL School Sys-tem based in Khuda ki Basti, Sheikhupura, Punjab which encom-
passes state-of-the-art education for the underprivileged living in poor villages.
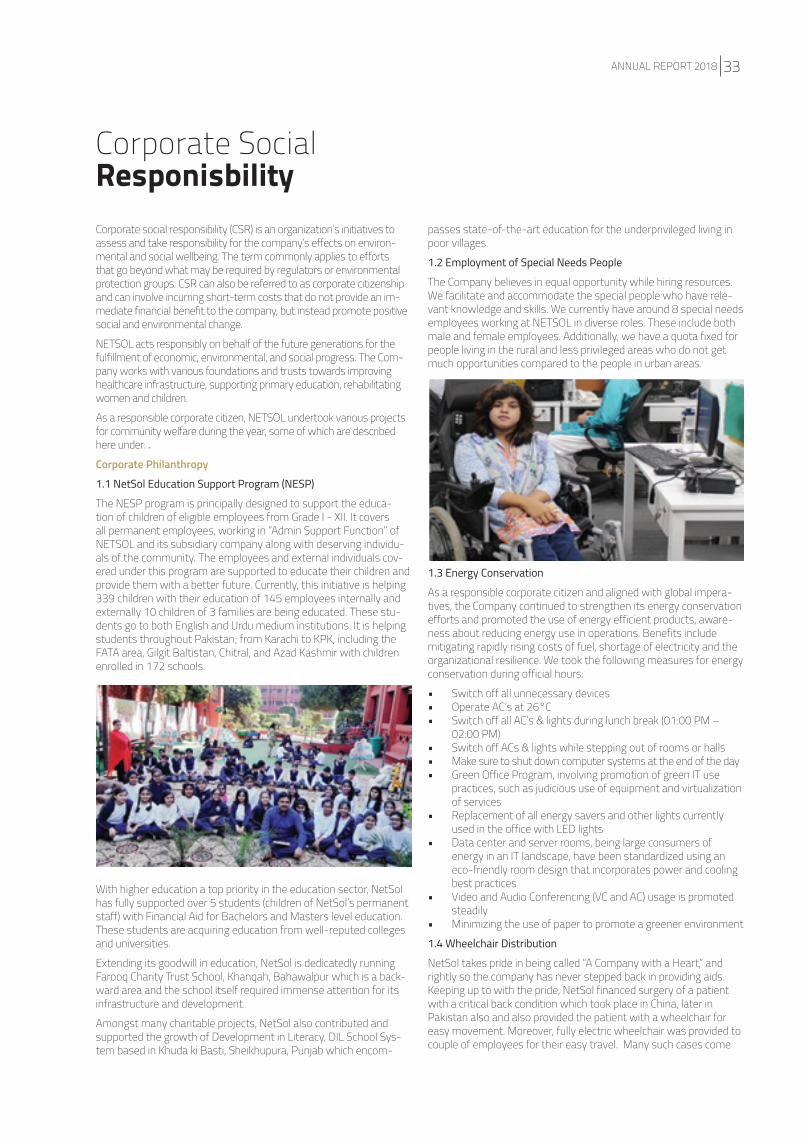
1.2 Employment of Special Needs People
The Company believes in equal opportunity while hiring resources. We facilitate and accommodate the special people who have rele-vant knowledge and skills. We currently have around 8 special needs employees working at NETSOL in diverse roles. These include both male and female employees. Additionally, we have a quota fixed for people living in the rural and less privileged areas who do not get much opportunities compared to the people in urban areas.
1.3 Energy Conservation
As a responsible corporate citizen and aligned with global impera-tives, the Company continued to strengthen its energy conservation efforts and promoted the use of energy efficient products, aware-ness about reducing energy use in operations. Benefits include mitigating rapidly rising costs of fuel, shortage of electricity and the organizational resilience. We took the following measures for energy conservation during official hours:
• Switch off all unnecessary devices• Operate AC’s at 26°C• Switch off all AC’s & lights during lunch break (01:00 PM –
02:00 PM)• Switch off ACs & lights while stepping out of rooms or halls• Make sure to shut down computer systems at the end of the day• Green Office Program, involving promotion of green IT use
practices, such as judicious use of equipment and virtualization of services
• Replacement of all energy savers and other lights currently used in the office with LED lights
• Data center and server rooms, being large consumers of energy in an IT landscape, have been standardized using an eco-friendly room design that incorporates power and cooling best practices
• Video and Audio Conferencing (VC and AC) usage is promoted steadily
• Minimizing the use of paper to promote a greener environment
1.4 Wheelchair Distribution
NetSol takes pride in being called “A Company with a Heart,” and rightly so the company has never stepped back in providing aids. Keeping up to with the pride, NetSol financed surgery of a patient with a critical back condition which took place in China, later in Pakistan also and also provided the patient with a wheelchair for easy movement. Moreover, fully electric wheelchair was provided to couple of employees for their easy travel. Many such cases come
Corporate Social Responisbility
ANNUAL REPORT 2018 33
across where NetSol wholeheartedly provides wheelchairs to those who truly need so.
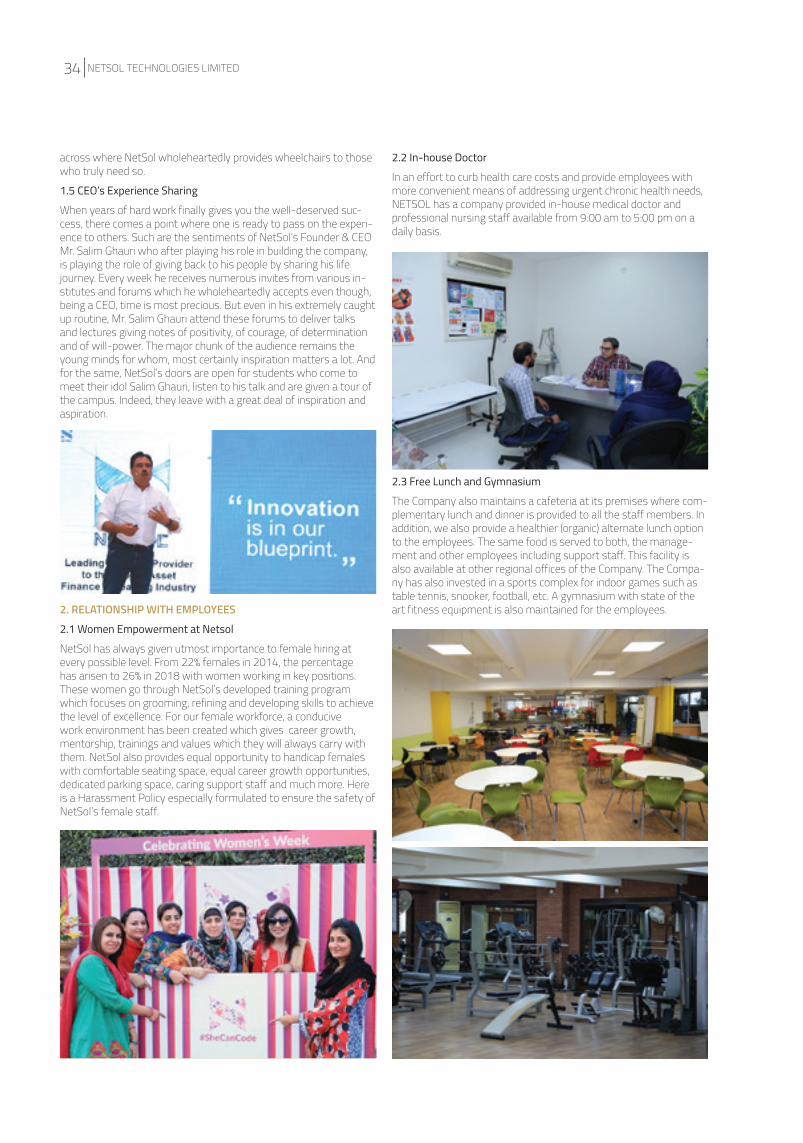
1.5 CEO’s Experience Sharing
When years of hard work finally gives you the well-deserved suc-cess, there comes a point where one is ready to pass on the experi-ence to others. Such are the sentiments of NetSol’s Founder & CEO Mr. Salim Ghauri who after playing his role in building the company, is playing the role of giving back to his people by sharing his life journey. Every week he receives numerous invites from various in-stitutes and forums which he wholeheartedly accepts even though, being a CEO, time is most precious. But even in his extremely caught up routine, Mr. Salim Ghauri attend these forums to deliver talks and lectures giving notes of positivity, of courage, of determination and of will-power. The major chunk of the audience remains the young minds for whom, most certainly inspiration matters a lot. And for the same, NetSol’s doors are open for students who come to meet their idol Salim Ghauri, listen to his talk and are given a tour of the campus. Indeed, they leave with a great deal of inspiration and aspiration.
2. RELATIONSHIP WITH EMPLOYEES
2.1 Women Empowerment at Netsol
NetSol has always given utmost importance to female hiring at every possible level. From 22% females in 2014, the percentage has arisen to 26% in 2018 with women working in key positions. These women go through NetSol’s developed training program which focuses on grooming, refining and developing skills to achieve the level of excellence. For our female workforce, a conducive work environment has been created which gives career growth, mentorship, trainings and values which they will always carry with them. NetSol also provides equal opportunity to handicap females with comfortable seating space, equal career growth opportunities, dedicated parking space, caring support staff and much more. Here is a Harassment Policy especially formulated to ensure the safety of NetSol’s female staff.
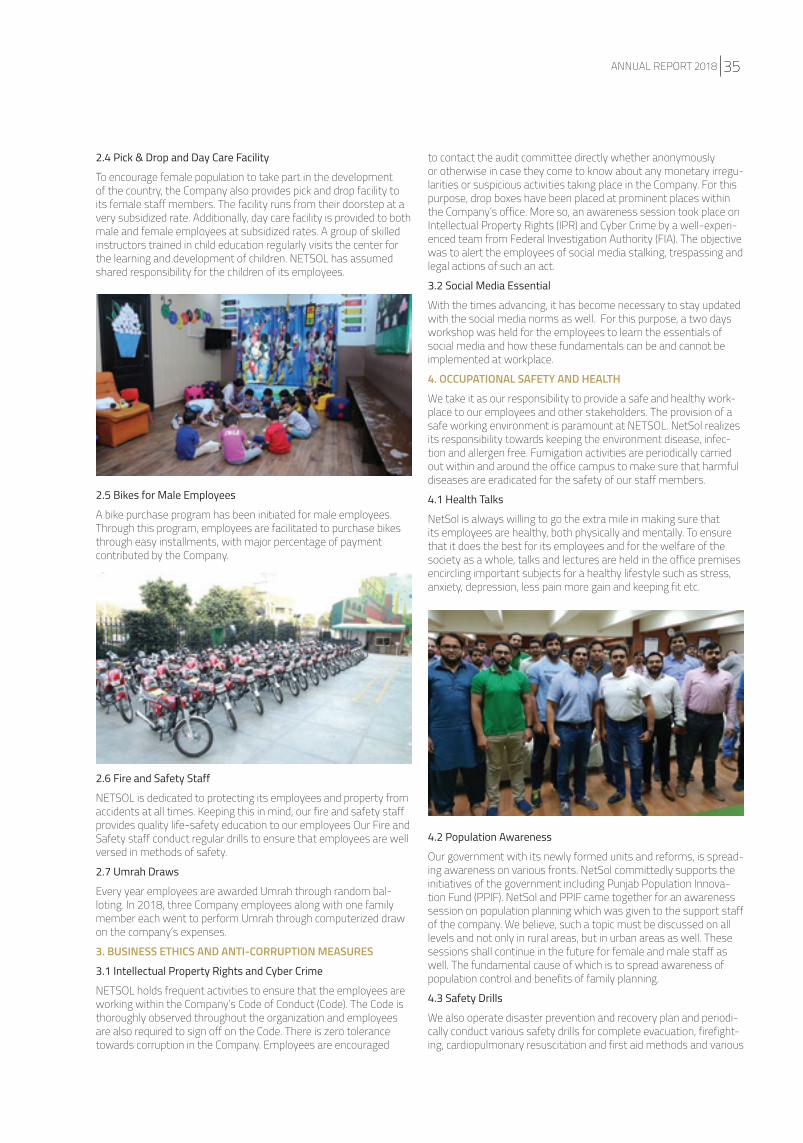
2.2 In-house Doctor
In an effort to curb health care costs and provide employees with more convenient means of addressing urgent chronic health needs, NETSOL has a company provided in-house medical doctor and professional nursing staff available from 9:00 am to 5:00 pm on a daily basis.
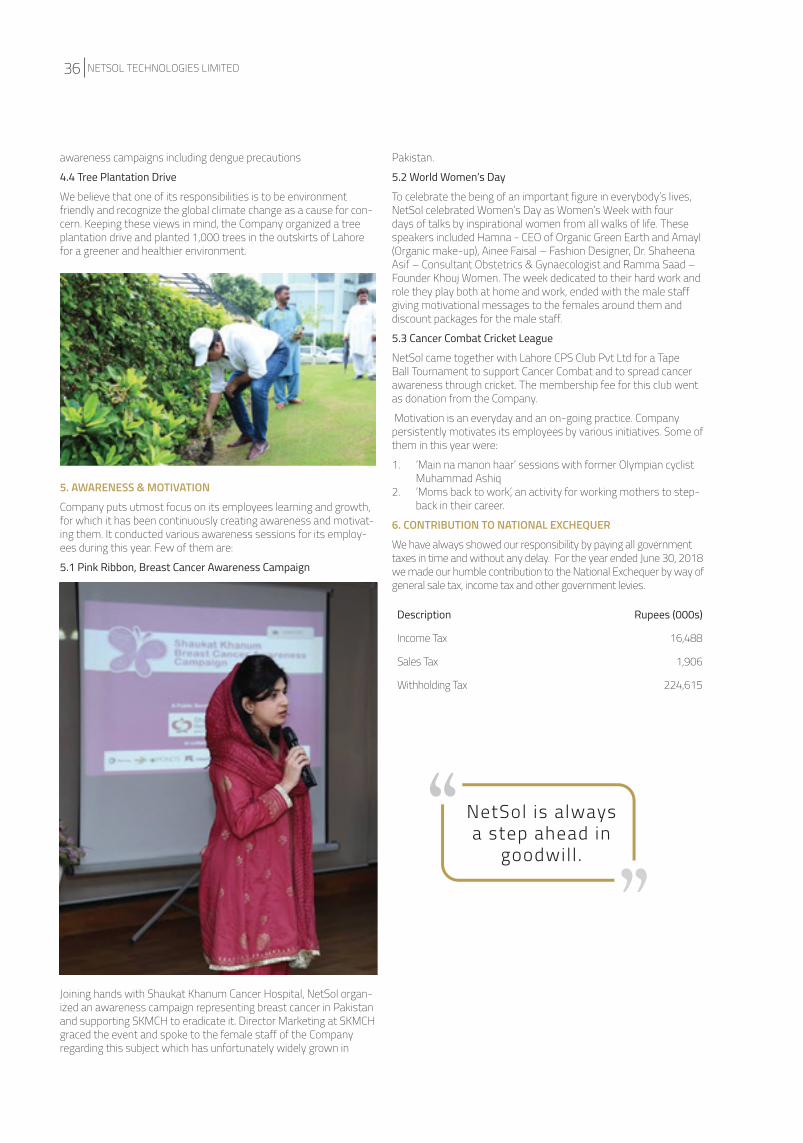
2.3 Free Lunch and Gymnasium
The Company also maintains a cafeteria at its premises where com-plementary lunch and dinner is provided to all the staff members. In addition, we also provide a healthier (organic) alternate lunch option to the employees. The same food is served to both, the manage-ment and other employees including support staff. This facility is also available at other regional offices of the Company. The Compa-ny has also invested in a sports complex for indoor games such as table tennis, snooker, football, etc. A gymnasium with state of the art fitness equipment is also maintained for the employees.
NETSOL TECHNOLOGIES LIMITED34
2.4 Pick & Drop and Day Care Facility
To encourage female population to take part in the development of the country, the Company also provides pick and drop facility to its female staff members. The facility runs from their doorstep at a very subsidized rate. Additionally, day care facility is provided to both male and female employees at subsidized rates. A group of skilled instructors trained in child education regularly visits the center for the learning and development of children. NETSOL has assumed shared responsibility for the children of its employees.
2.5 Bikes for Male Employees
A bike purchase program has been initiated for male employees. Through this program, employees are facilitated to purchase bikes through easy installments, with major percentage of payment contributed by the Company.
2.6 Fire and Safety Staff
NETSOL is dedicated to protecting its employees and property from accidents at all times. Keeping this in mind, our fire and safety staff provides quality life-safety education to our employees Our Fire and Safety staff conduct regular drills to ensure that employees are well versed in methods of safety.
2.7 Umrah Draws
Every year employees are awarded Umrah through random bal-loting. In 2018, three Company employees along with one family member each went to perform Umrah through computerized draw on the company’s expenses.
3. BUSINESS ETHICS AND ANTI-CORRUPTION MEASURES
3.1 Intellectual Property Rights and Cyber Crime
NETSOL holds frequent activities to ensure that the employees are working within the Company’s Code of Conduct (Code). The Code is thoroughly observed throughout the organization and employees are also required to sign off on the Code. There is zero tolerance towards corruption in the Company. Employees are encouraged
to contact the audit committee directly whether anonymously or otherwise in case they come to know about any monetary irregu-larities or suspicious activities taking place in the Company. For this purpose, drop boxes have been placed at prominent places within the Company’s office. More so, an awareness session took place on Intellectual Property Rights (IPR) and Cyber Crime by a well-experi-enced team from Federal Investigation Authority (FIA). The objective was to alert the employees of social media stalking, trespassing and legal actions of such an act.
3.2 Social Media Essential
With the times advancing, it has become necessary to stay updated with the social media norms as well. For this purpose, a two days workshop was held for the employees to learn the essentials of social media and how these fundamentals can be and cannot be implemented at workplace.
4. OCCUPATIONAL SAFETY AND HEALTH
We take it as our responsibility to provide a safe and healthy work-place to our employees and other stakeholders. The provision of a safe working environment is paramount at NETSOL. NetSol realizes its responsibility towards keeping the environment disease, infec-tion and allergen free. Fumigation activities are periodically carried out within and around the office campus to make sure that harmful diseases are eradicated for the safety of our staff members.
4.1 Health Talks
NetSol is always willing to go the extra mile in making sure that its employees are healthy, both physically and mentally. To ensure that it does the best for its employees and for the welfare of the society as a whole, talks and lectures are held in the office premises encircling important subjects for a healthy lifestyle such as stress, anxiety, depression, less pain more gain and keeping fit etc.
4.2 Population Awareness
Our government with its newly formed units and reforms, is spread-ing awareness on various fronts. NetSol committedly supports the initiatives of the government including Punjab Population Innova-tion Fund (PPIF). NetSol and PPIF came together for an awareness session on population planning which was given to the support staff of the company. We believe, such a topic must be discussed on all levels and not only in rural areas, but in urban areas as well. These sessions shall continue in the future for female and male staff as well. The fundamental cause of which is to spread awareness of population control and benefits of family planning.
4.3 Safety Drills
We also operate disaster prevention and recovery plan and periodi-cally conduct various safety drills for complete evacuation, firefight-ing, cardiopulmonary resuscitation and first aid methods and various
ANNUAL REPORT 2018 35
awareness campaigns including dengue precautions
4.4 Tree Plantation Drive
We believe that one of its responsibilities is to be environment friendly and recognize the global climate change as a cause for con-cern. Keeping these views in mind, the Company organized a tree plantation drive and planted 1,000 trees in the outskirts of Lahore for a greener and healthier environment.
5. AWARENESS & MOTIVATION
Company puts utmost focus on its employees learning and growth, for which it has been continuously creating awareness and motivat-ing them. It conducted various awareness sessions for its employ-ees during this year. Few of them are:
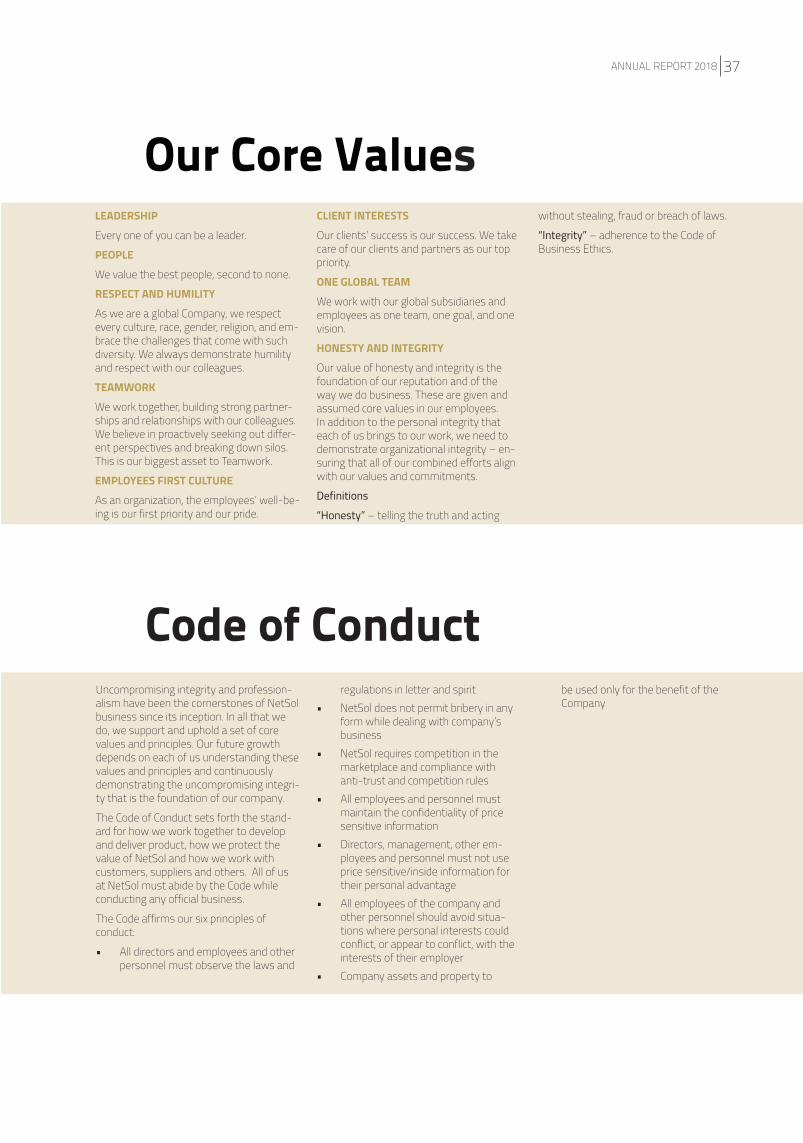
5.1 Pink Ribbon, Breast Cancer Awareness Campaign
Joining hands with Shaukat Khanum Cancer Hospital, NetSol organ-ized an awareness campaign representing breast cancer in Pakistan and supporting SKMCH to eradicate it. Director Marketing at SKMCH graced the event and spoke to the female staff of the Company regarding this subject which has unfortunately widely grown in
Pakistan.
5.2 World Women’s Day
To celebrate the being of an important figure in everybody’s lives, NetSol celebrated Women’s Day as Women’s Week with four days of talks by inspirational women from all walks of life. These speakers included Hamna - CEO of Organic Green Earth and Amayl (Organic make-up), Ainee Faisal – Fashion Designer, Dr. Shaheena Asif – Consultant Obstetrics & Gynaecologist and Ramma Saad – Founder Khouj Women. The week dedicated to their hard work and role they play both at home and work, ended with the male staff giving motivational messages to the females around them and discount packages for the male staff.
5.3 Cancer Combat Cricket League
NetSol came together with Lahore CPS Club Pvt Ltd for a Tape Ball Tournament to support Cancer Combat and to spread cancer awareness through cricket. The membership fee for this club went as donation from the Company.
Motivation is an everyday and an on-going practice. Company persistently motivates its employees by various initiatives. Some of them in this year were:
1. ‘Main na manon haar’ sessions with former Olympian cyclist Muhammad Ashiq
2. ‘Moms back to work’, an activity for working mothers to step-back in their career.
6. CONTRIBUTION TO NATIONAL EXCHEQUER
We have always showed our responsibility by paying all government taxes in time and without any delay. For the year ended June 30, 2018 we made our humble contribution to the National Exchequer by way of general sale tax, income tax and other government levies.
Description Rupees (000s)
Income Tax 16,488
Sales Tax 1,906
Withholding Tax 224,615
NetSol is always a step ahead in
goodwill .
NETSOL TECHNOLOGIES LIMITED36
Our Core ValuesLEADERSHIP
Every one of you can be a leader.
PEOPLE
We value the best people, second to none.
RESPECT AND HUMILITY
As we are a global Company, we respect every culture, race, gender, religion, and em-brace the challenges that come with such diversity. We always demonstrate humility and respect with our colleagues.
TEAMWORK
We work together, building strong partner-ships and relationships with our colleagues. We believe in proactively seeking out differ-ent perspectives and breaking down silos. This is our biggest asset to Teamwork.
EMPLOYEES FIRST CULTURE
As an organization, the employees’ well-be-ing is our first priority and our pride.
CLIENT INTERESTS
Our clients’ success is our success. We take care of our clients and partners as our top priority.
ONE GLOBAL TEAM
We work with our global subsidiaries and employees as one team, one goal, and one vision.
HONESTY AND INTEGRITY
Our value of honesty and integrity is the foundation of our reputation and of the way we do business. These are given and assumed core values in our employees. In addition to the personal integrity that each of us brings to our work, we need to demonstrate organizational integrity – en-suring that all of our combined efforts align with our values and commitments.
Definitions
“Honesty” – telling the truth and acting
without stealing, fraud or breach of laws.
“Integrity” – adherence to the Code of Business Ethics.
Uncompromising integrity and profession-alism have been the cornerstones of NetSol business since its inception. In all that we do, we support and uphold a set of core values and principles. Our future growth depends on each of us understanding these values and principles and continuously demonstrating the uncompromising integri-ty that is the foundation of our company.
The Code of Conduct sets forth the stand-ard for how we work together to develop and deliver product, how we protect the value of NetSol and how we work with customers, suppliers and others. All of us at NetSol must abide by the Code while conducting any official business.
The Code affirms our six principles of conduct:
• All directors and employees and other personnel must observe the laws and
regulations in letter and spirit• NetSol does not permit bribery in any
form while dealing with company’s business
• NetSol requires competition in the marketplace and compliance with anti-trust and competition rules
• All employees and personnel must maintain the confidentiality of price sensitive information
• Directors, management, other em-ployees and personnel must not use price sensitive/inside information for their personal advantage
• All employees of the company and other personnel should avoid situa-tions where personal interests could conflict, or appear to conflict, with the interests of their employer
• Company assets and property to
be used only for the benefit of the Company
Code of Conduct
ANNUAL REPORT 2018 37

This Page is intentionally left blank
NETSOL TECHNOLOGIES LIMITED38
ANNUAL REPORT 2018 39
NETSOL TECHNOLOGIES LIMITED40
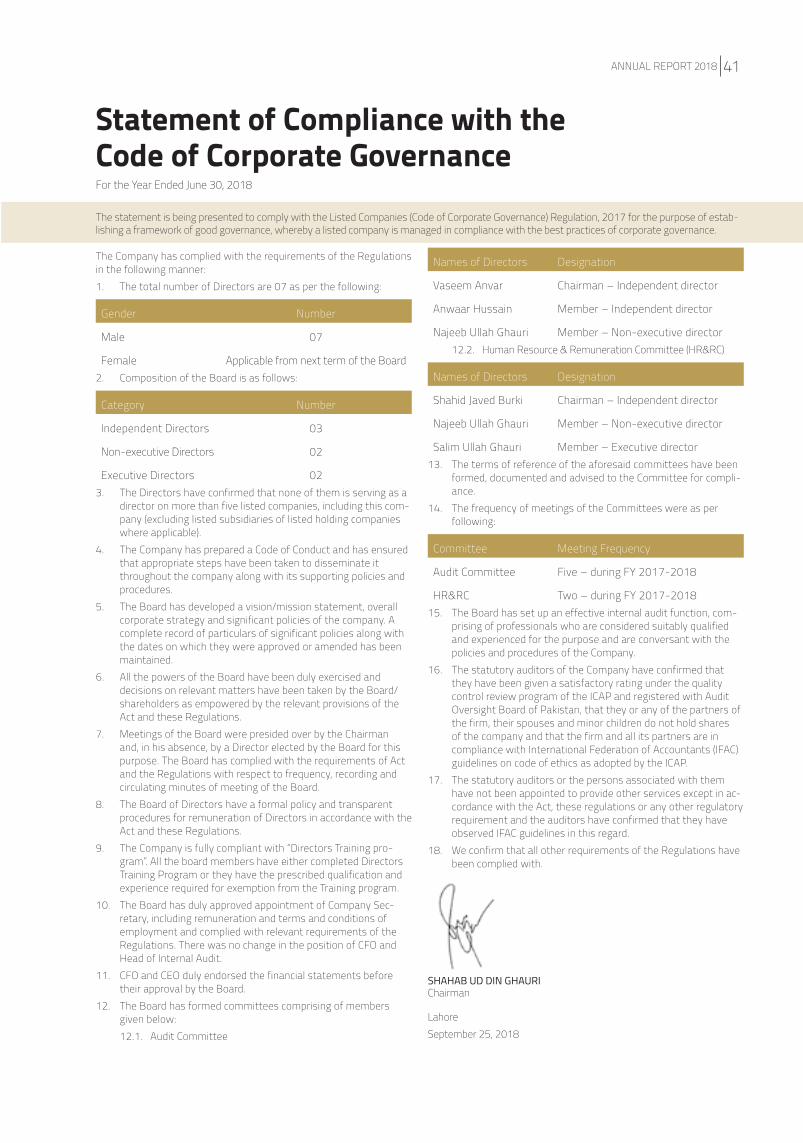
The Company has complied with the requirements of the Regulations in the following manner:1. The total number of Directors are 07 as per the following:
Gender Number
Male 07
Female Applicable from next term of the Board2. Composition of the Board is as follows:
Category Number
Independent Directors 03
Non-executive Directors 02
Executive Directors 023. The Directors have confirmed that none of them is serving as a
director on more than five listed companies, including this com-pany (excluding listed subsidiaries of listed holding companies where applicable).
4. The Company has prepared a Code of Conduct and has ensured that appropriate steps have been taken to disseminate it throughout the company along with its supporting policies and procedures.
5. The Board has developed a vision/mission statement, overall corporate strategy and significant policies of the company. A complete record of particulars of significant policies along with the dates on which they were approved or amended has been maintained.
6. All the powers of the Board have been duly exercised and decisions on relevant matters have been taken by the Board/ shareholders as empowered by the relevant provisions of the Act and these Regulations.
7. Meetings of the Board were presided over by the Chairman and, in his absence, by a Director elected by the Board for this purpose. The Board has complied with the requirements of Act and the Regulations with respect to frequency, recording and circulating minutes of meeting of the Board.
8. The Board of Directors have a formal policy and transparent procedures for remuneration of Directors in accordance with the Act and these Regulations.
9. The Company is fully compliant with “Directors Training pro-gram”. All the board members have either completed Directors Training Program or they have the prescribed qualification and experience required for exemption from the Training program.
10. The Board has duly approved appointment of Company Sec-retary, including remuneration and terms and conditions of employment and complied with relevant requirements of the Regulations. There was no change in the position of CFO and Head of Internal Audit.
11. CFO and CEO duly endorsed the financial statements before their approval by the Board.
12. The Board has formed committees comprising of members given below: 12.1. Audit Committee
Names of Directors Designation
Vaseem Anvar Chairman – Independent director
Anwaar Hussain Member – Independent director
Najeeb Ullah Ghauri Member – Non-executive director12.2. Human Resource & Remuneration Committee (HR&RC)
Names of Directors Designation
Shahid Javed Burki Chairman – Independent director
Najeeb Ullah Ghauri Member – Non-executive director
Salim Ullah Ghauri Member – Executive director13. The terms of reference of the aforesaid committees have been
formed, documented and advised to the Committee for compli-ance.
14. The frequency of meetings of the Committees were as per following:
Committee Meeting Frequency
Audit Committee Five – during FY 2017-2018
HR&RC Two – during FY 2017-201815. The Board has set up an effective internal audit function, com-
prising of professionals who are considered suitably qualified and experienced for the purpose and are conversant with the policies and procedures of the Company.
16. The statutory auditors of the Company have confirmed that they have been given a satisfactory rating under the quality control review program of the ICAP and registered with Audit Oversight Board of Pakistan, that they or any of the partners of the firm, their spouses and minor children do not hold shares of the company and that the firm and all its partners are in compliance with International Federation of Accountants (IFAC) guidelines on code of ethics as adopted by the ICAP.
17. The statutory auditors or the persons associated with them have not been appointed to provide other services except in ac-cordance with the Act, these regulations or any other regulatory requirement and the auditors have confirmed that they have observed IFAC guidelines in this regard.
18. We confirm that all other requirements of the Regulations have been complied with.
SHAHAB UD DIN GHAURIChairman
Lahore September 25, 2018
Statement of Compliance with theCode of Corporate GovernanceFor the Year Ended June 30, 2018
The statement is being presented to comply with the Listed Companies (Code of Corporate Governance) Regulation, 2017 for the purpose of estab-lishing a framework of good governance, whereby a listed company is managed in compliance with the best practices of corporate governance.
ANNUAL REPORT 2018 41
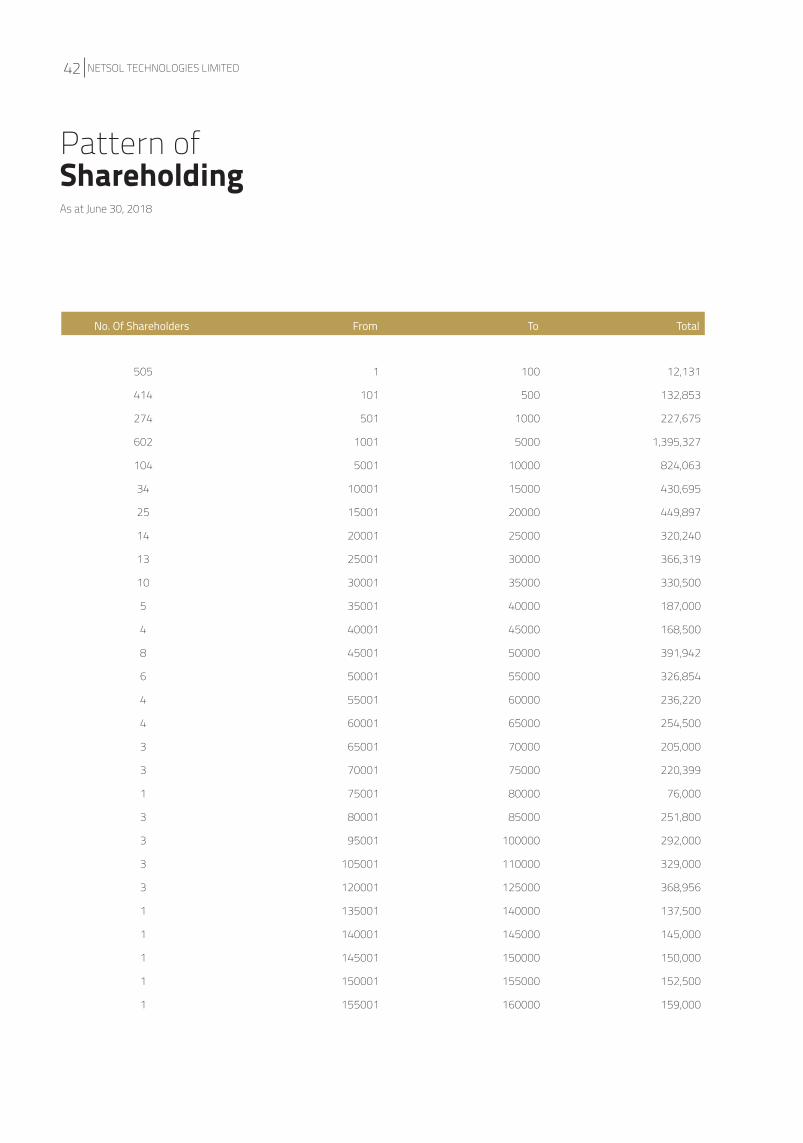
Pattern of ShareholdingAs at June 30, 2018
505 1 100 12,131
414 101 500 132,853
274 501 1000 227,675
602 1001 5000 1,395,327
104 5001 10000 824,063
34 10001 15000 430,695
25 15001 20000 449,897
14 20001 25000 320,240
13 25001 30000 366,319
10 30001 35000 330,500
5 35001 40000 187,000
4 40001 45000 168,500
8 45001 50000 391,942
6 50001 55000 326,854
4 55001 60000 236,220
4 60001 65000 254,500
3 65001 70000 205,000
3 70001 75000 220,399
1 75001 80000 76,000
3 80001 85000 251,800
3 95001 100000 292,000
3 105001 110000 329,000
3 120001 125000 368,956
1 135001 140000 137,500
1 140001 145000 145,000
1 145001 150000 150,000
1 150001 155000 152,500
1 155001 160000 159,000
No. Of Shareholders From To Total
NETSOL TECHNOLOGIES LIMITED42
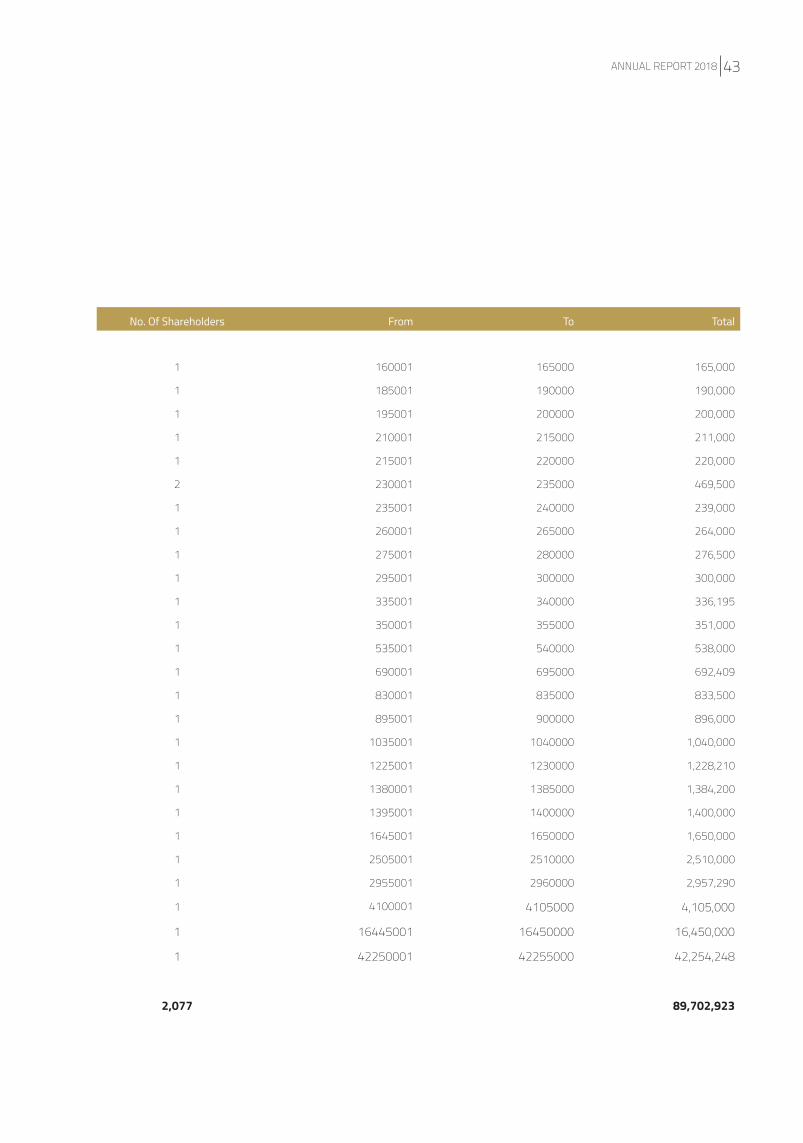
1 160001 165000 165,000
1 185001 190000 190,000
1 195001 200000 200,000
1 210001 215000 211,000
1 215001 220000 220,000
2 230001 235000 469,500
1 235001 240000 239,000
1 260001 265000 264,000
1 275001 280000 276,500
1 295001 300000 300,000
1 335001 340000 336,195
1 350001 355000 351,000
1 535001 540000 538,000
1 690001 695000 692,409
1 830001 835000 833,500
1 895001 900000 896,000
1 1035001 1040000 1,040,000
1 1225001 1230000 1,228,210
1 1380001 1385000 1,384,200
1 1395001 1400000 1,400,000
1 1645001 1650000 1,650,000
1 2505001 2510000 2,510,000
1 2955001 2960000 2,957,290
1 4100001 4105000 4,105,000
1 16445001 16450000 16,450,000
1 42250001 42255000 42,254,248
2,077 89,702,923
No. Of Shareholders From To Total
ANNUAL REPORT 2018 43
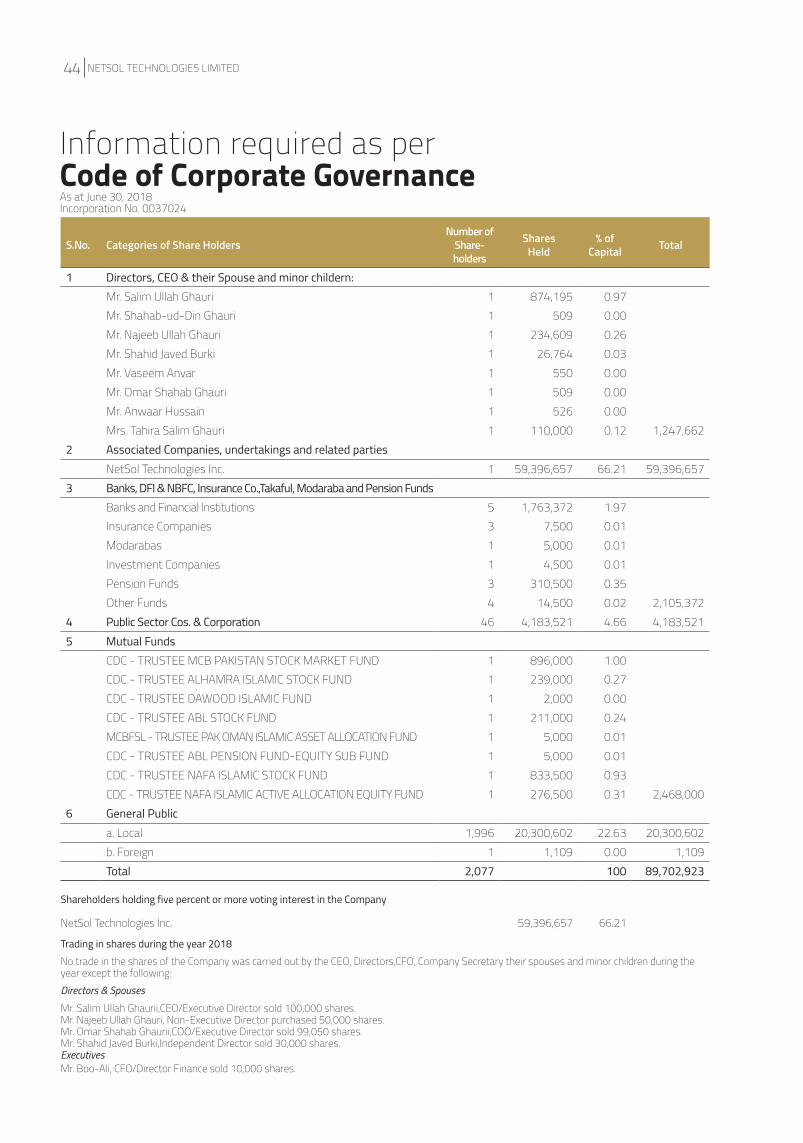
Information required as per Code of Corporate GovernanceAs at June 30, 2018Incorporation No. 0037024
S.No. Categories of Share HoldersNumber of
Share-holders
SharesHeld
% of Capital Total
1 Directors, CEO & their Spouse and minor childern:Mr. Salim Ullah Ghauri 1 874,195 0.97 Mr. Shahab-ud-Din Ghauri 1 509 0.00 Mr. Najeeb Ullah Ghauri 1 234,609 0.26 Mr. Shahid Javed Burki 1 26,764 0.03 Mr. Vaseem Anvar 1 550 0.00 Mr. Omar Shahab Ghauri 1 509 0.00 Mr. Anwaar Hussain 1 526 0.00 Mrs. Tahira Salim Ghauri 1 110,000 0.12 1,247,662
2 Associated Companies, undertakings and related partiesNetSol Technologies Inc. 1 59,396,657 66.21 59,396,657
3 Banks, DFI & NBFC, Insurance Co.,Takaful, Modaraba and Pension FundsBanks and Financial Institutions 5 1,763,372 1.97 Insurance Companies 3 7,500 0.01 Modarabas 1 5,000 0.01 Investment Companies 1 4,500 0.01 Pension Funds 3 310,500 0.35 Other Funds 4 14,500 0.02 2,105,372
4 Public Sector Cos. & Corporation 46 4,183,521 4.66 4,183,521 5 Mutual Funds
CDC - TRUSTEE MCB PAKISTAN STOCK MARKET FUND 1 896,000 1.00 CDC - TRUSTEE ALHAMRA ISLAMIC STOCK FUND 1 239,000 0.27 CDC - TRUSTEE DAWOOD ISLAMIC FUND 1 2,000 0.00 CDC - TRUSTEE ABL STOCK FUND 1 211,000 0.24 MCBFSL - TRUSTEE PAK OMAN ISLAMIC ASSET ALLOCATION FUND 1 5,000 0.01 CDC - TRUSTEE ABL PENSION FUND-EQUITY SUB FUND 1 5,000 0.01 CDC - TRUSTEE NAFA ISLAMIC STOCK FUND 1 833,500 0.93 CDC - TRUSTEE NAFA ISLAMIC ACTIVE ALLOCATION EQUITY FUND 1 276,500 0.31 2,468,000
6 General Publica. Local 1,996 20,300,602 22.63 20,300,602 b. Foreign 1 1,109 0.00 1,109 Total 2,077 100 89,702,923
Shareholders holding five percent or more voting interest in the Company
NetSol Technologies Inc. 59,396,657 66.21
Trading in shares during the year 2018 No trade in the shares of the Company was carried out by the CEO, Directors,CFO, Company Secretary their spouses and minor children during the year except the following: Directors & Spouses
Mr. Salim Ullah Ghaurii,CEO/Executive Director sold 100,000 shares. Mr. Najeeb Ullah Ghauri, Non-Executive Director purchased 50,000 shares. Mr. Omar Shahab Ghaurii,COO/Executive Director sold 99,050 shares. Mr. Shahid Javed Burki,Independent Director sold 30,000 shares. Executives Mr. Boo-Ali, CFO/Director Finance sold 10,000 shares.
NETSOL TECHNOLOGIES LIMITED44
FINANCIAL STATEMENTSFor the Year Ended June 30, 2018
ANNUAL REPORT 2018 45

This Page is intentionally left blank
NETSOL TECHNOLOGIES LIMITED46
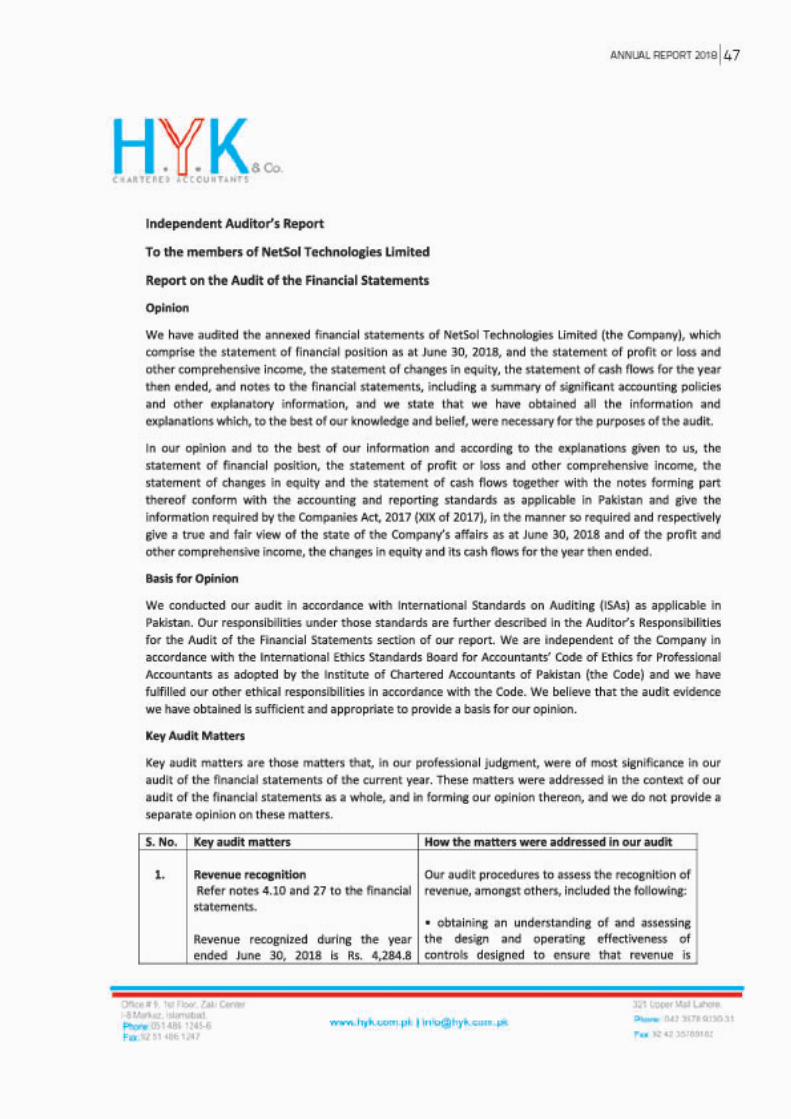
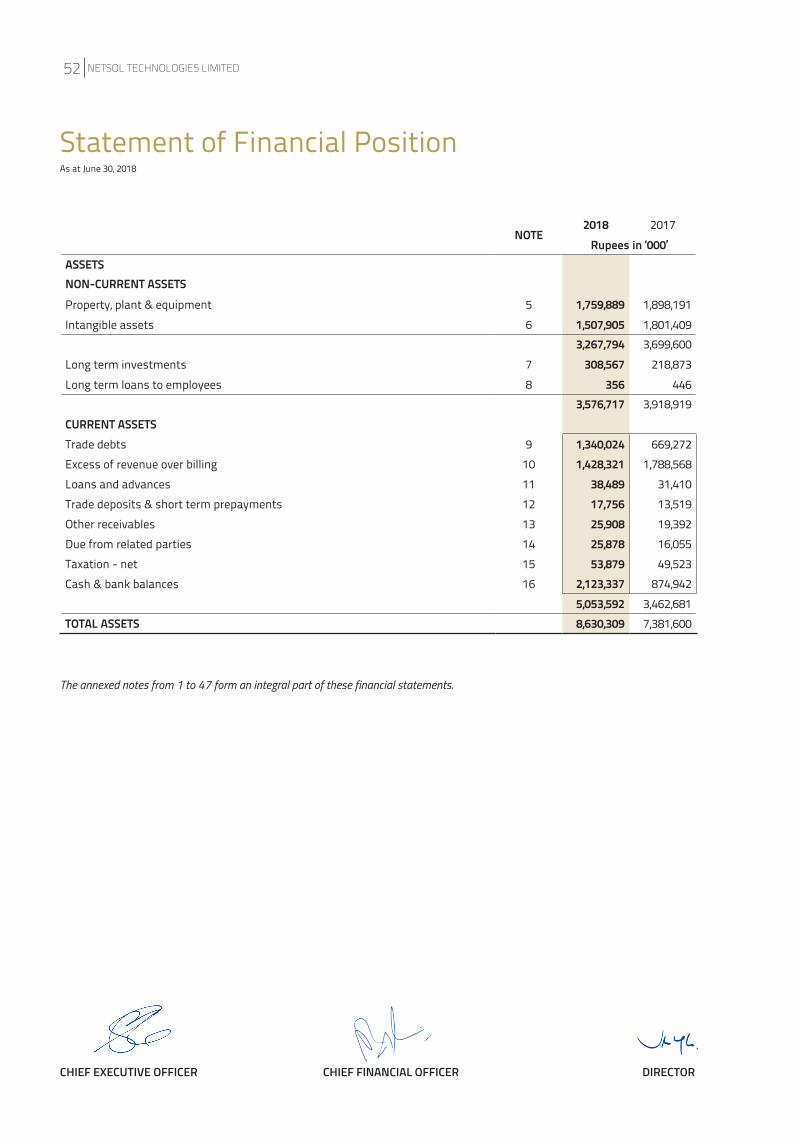
The annexed notes from 1 to 47 form an integral part of these financial statements.
Statement of Financial PositionAs at June 30, 2018
NOTE2018 2017
Rupees in ‘000’ASSETSNON-CURRENT ASSETSProperty, plant & equipment 5 1,759,889 1,898,191 Intangible assets 6 1,507,905 1,801,409
3,267,794 3,699,600 Long term investments 7 308,567 218,873 Long term loans to employees 8 356 446
3,576,717 3,918,919 CURRENT ASSETSTrade debts 9 1,340,024 669,272 Excess of revenue over billing 10 1,428,321 1,788,568 Loans and advances 11 38,489 31,410 Trade deposits & short term prepayments 12 17,756 13,519 Other receivables 13 25,908 19,392 Due from related parties 14 25,878 16,055 Taxation - net 15 53,879 49,523 Cash & bank balances 16 2,123,337 874,942
5,053,592 3,462,681 TOTAL ASSETS 8,630,309 7,381,600
CHIEF EXECUTIVE OFFICER CHIEF FINANCIAL OFFICER DIRECTOR
NETSOL TECHNOLOGIES LIMITED52
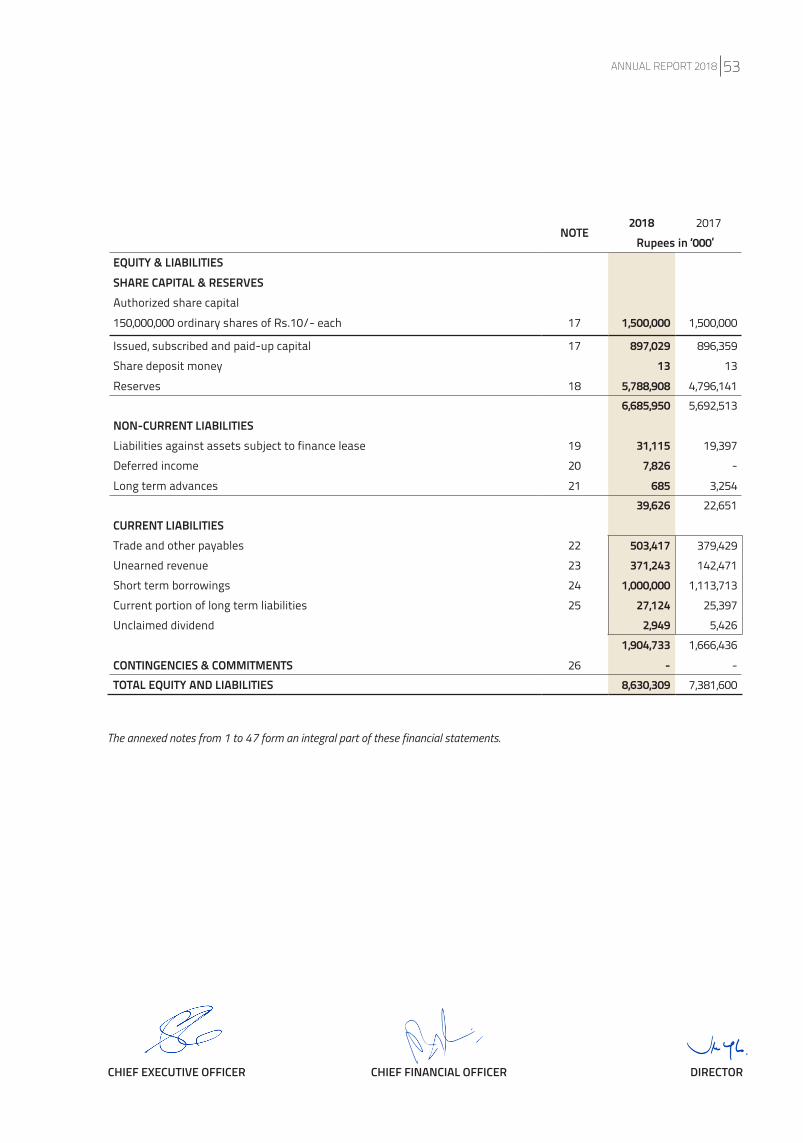
The annexed notes from 1 to 47 form an integral part of these financial statements.
NOTE2018 2017
Rupees in ‘000’EQUITY & LIABILITIESSHARE CAPITAL & RESERVESAuthorized share capital150,000,000 ordinary shares of Rs.10/- each 17 1,500,000 1,500,000
Issued, subscribed and paid-up capital 17 897,029 896,359 Share deposit money 13 13 Reserves 18 5,788,908 4,796,141
6,685,950 5,692,513 NON-CURRENT LIABILITIESLiabilities against assets subject to finance lease 19 31,115 19,397 Deferred income 20 7,826 - Long term advances 21 685 3,254
39,626 22,651 CURRENT LIABILITIES Trade and other payables 22 503,417 379,429 Unearned revenue 23 371,243 142,471 Short term borrowings 24 1,000,000 1,113,713 Current portion of long term liabilities 25 27,124 25,397 Unclaimed dividend 2,949 5,426
1,904,733 1,666,436 CONTINGENCIES & COMMITMENTS 26 - -TOTAL EQUITY AND LIABILITIES 8,630,309 7,381,600
CHIEF EXECUTIVE OFFICER CHIEF FINANCIAL OFFICER DIRECTOR
ANNUAL REPORT 2018 53
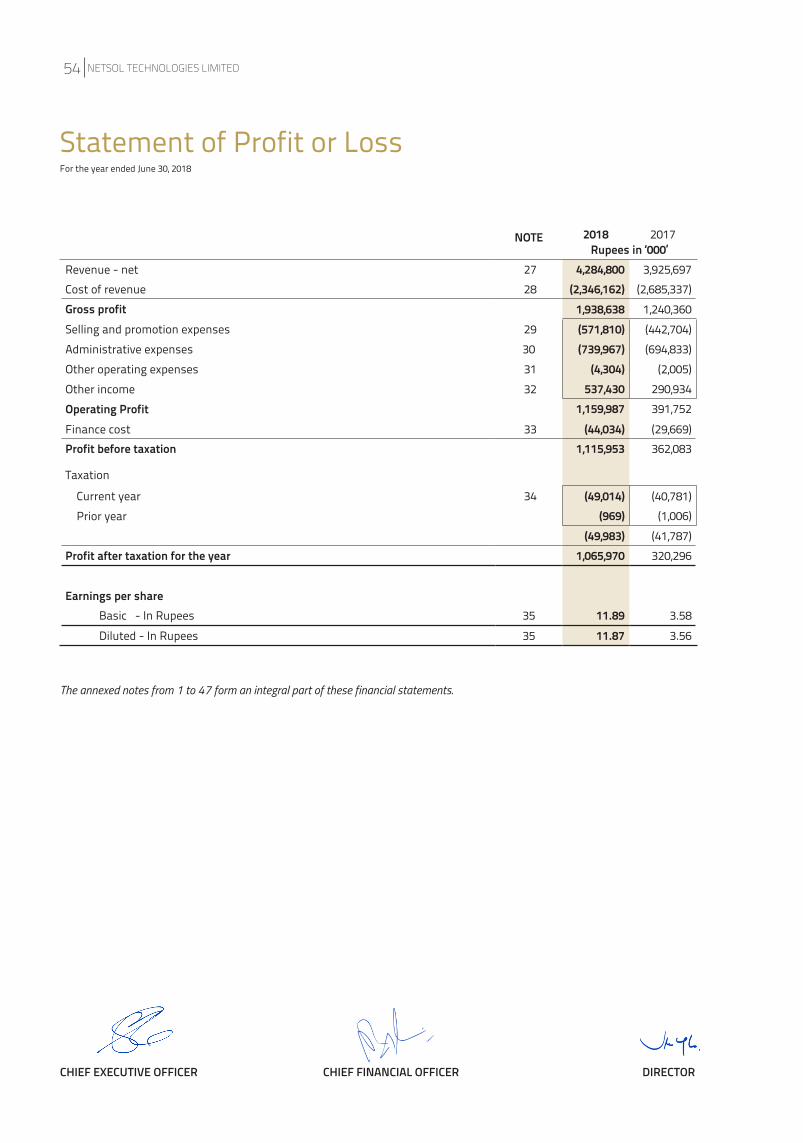
The annexed notes from 1 to 47 form an integral part of these financial statements.
Statement of Profit or LossFor the year ended June 30, 2018
NOTE 2018 2017Rupees in ‘000’
Revenue - net 27 4,284,800 3,925,697 Cost of revenue 28 (2,346,162) (2,685,337)Gross profit 1,938,638 1,240,360 Selling and promotion expenses 29 (571,810) (442,704)Administrative expenses 30 (739,967) (694,833)Other operating expenses 31 (4,304) (2,005)Other income 32 537,430 290,934 Operating Profit 1,159,987 391,752 Finance cost 33 (44,034) (29,669)Profit before taxation 1,115,953 362,083
Taxation
Current year 34 (49,014) (40,781) Prior year (969) (1,006)
(49,983) (41,787)Profit after taxation for the year 1,065,970 320,296
Earnings per share Basic - In Rupees 35 11.89 3.58 Diluted - In Rupees 35 11.87 3.56
CHIEF EXECUTIVE OFFICER CHIEF FINANCIAL OFFICER DIRECTOR
NETSOL TECHNOLOGIES LIMITED54
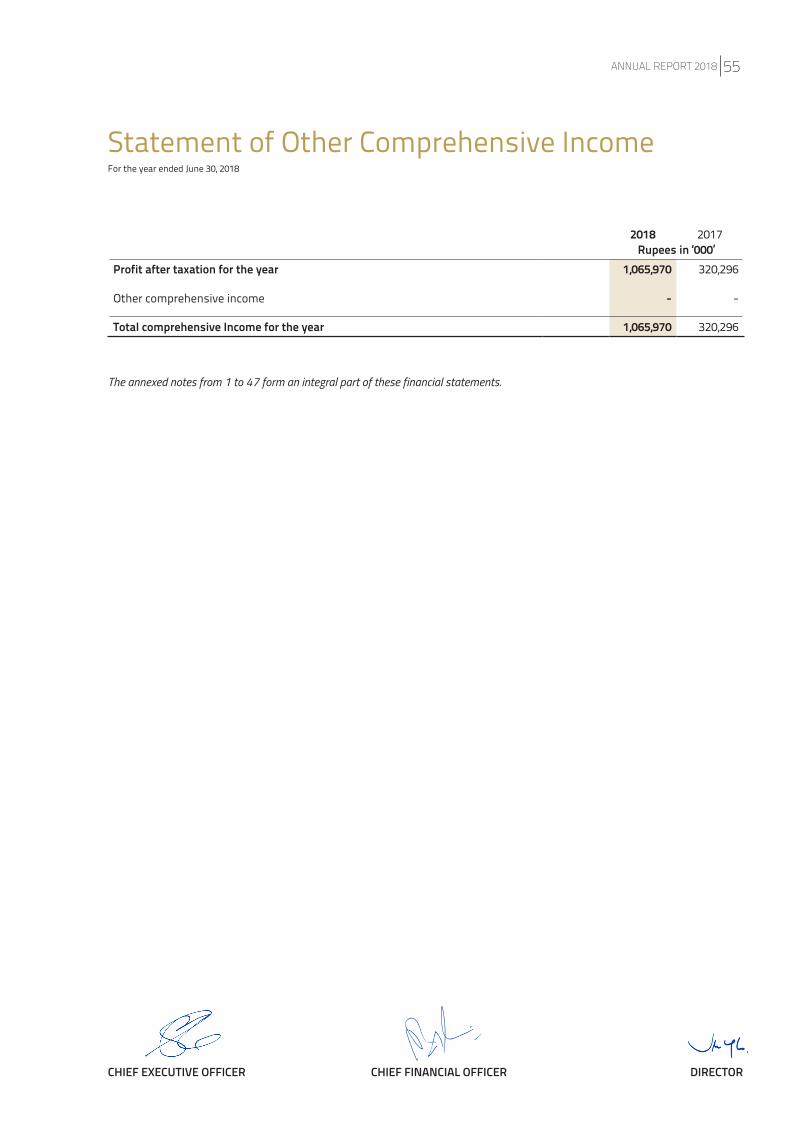
The annexed notes from 1 to 47 form an integral part of these financial statements.
Statement of Other Comprehensive IncomeFor the year ended June 30, 2018
2018 2017Rupees in ‘000’
Profit after taxation for the year 1,065,970 320,296
Other comprehensive income - -
Total comprehensive Income for the year 1,065,970 320,296
CHIEF EXECUTIVE OFFICER CHIEF FINANCIAL OFFICER DIRECTOR
ANNUAL REPORT 2018 55
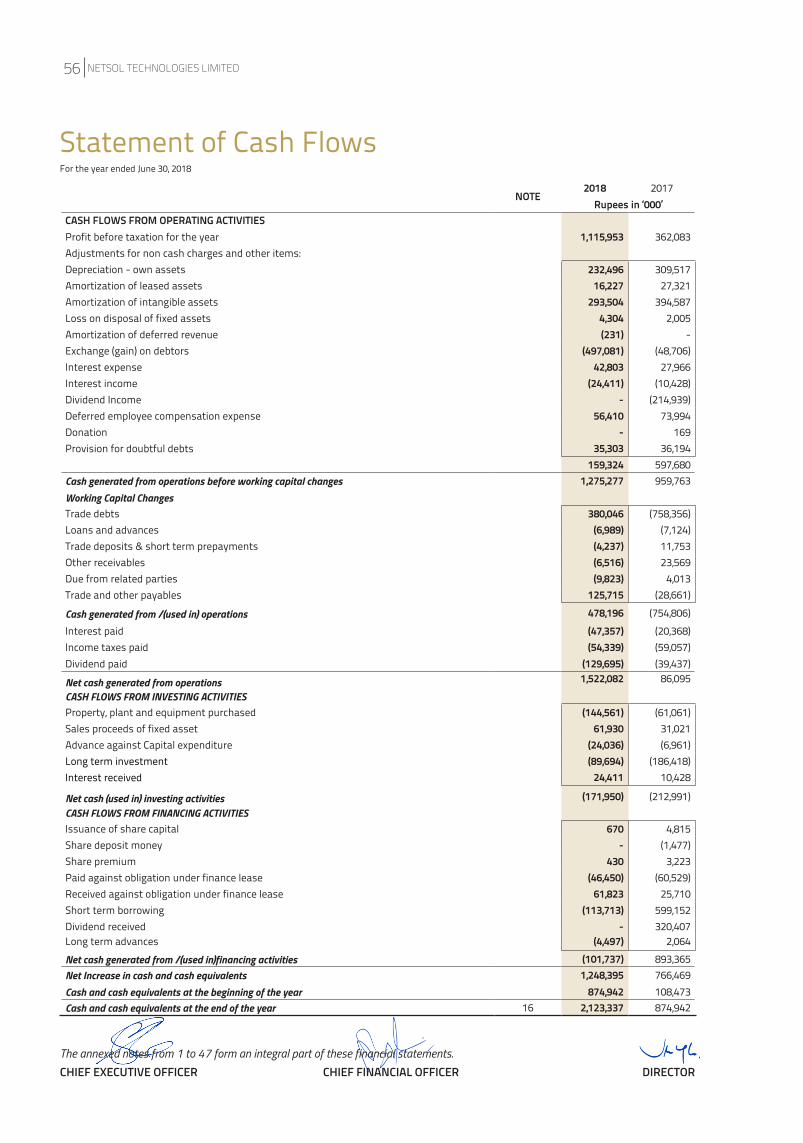
The annexed notes from 1 to 47 form an integral part of these financial statements.
Statement of Cash FlowsFor the year ended June 30, 2018
NOTE2018 2017
Rupees in ‘000’CASH FLOWS FROM OPERATING ACTIVITIESProfit before taxation for the year 1,115,953 362,083 Adjustments for non cash charges and other items:Depreciation - own assets 232,496 309,517 Amortization of leased assets 16,227 27,321 Amortization of intangible assets 293,504 394,587 Loss on disposal of fixed assets 4,304 2,005 Amortization of deferred revenue (231) - Exchange (gain) on debtors (497,081) (48,706)Interest expense 42,803 27,966 Interest income (24,411) (10,428)Dividend Income - (214,939)Deferred employee compensation expense 56,410 73,994 Donation - 169 Provision for doubtful debts 35,303 36,194
159,324 597,680Cash generated from operations before working capital changes 1,275,277 959,763 Working Capital ChangesTrade debts 380,046 (758,356)Loans and advances (6,989) (7,124)Trade deposits & short term prepayments (4,237) 11,753 Other receivables (6,516) 23,569 Due from related parties (9,823) 4,013 Trade and other payables 125,715 (28,661)
Cash generated from /(used in) operations 478,196 (754,806)Interest paid (47,357) (20,368)Income taxes paid (54,339) (59,057)Dividend paid (129,695) (39,437)
Net cash generated from operations 1,522,082 86,095CASH FLOWS FROM INVESTING ACTIVITIESProperty, plant and equipment purchased (144,561) (61,061)Sales proceeds of fixed asset 61,930 31,021 Advance against Capital expenditure (24,036) (6,961)Long term investment (89,694) (186,418)Interest received 24,411 10,428
Net cash (used in) investing activities (171,950) (212,991)CASH FLOWS FROM FINANCING ACTIVITIESIssuance of share capital 670 4,815 Share deposit money - (1,477)Share premium 430 3,223 Paid against obligation under finance lease (46,450) (60,529)Received against obligation under finance lease 61,823 25,710 Short term borrowing (113,713) 599,152 Dividend received - 320,407 Long term advances (4,497) 2,064
Net cash generated from /(used in)financing activities (101,737) 893,365 Net Increase in cash and cash equivalents 1,248,395 766,469 Cash and cash equivalents at the beginning of the year 874,942 108,473 Cash and cash equivalents at the end of the year 16 2,123,337 874,942
CHIEF EXECUTIVE OFFICER CHIEF FINANCIAL OFFICER DIRECTOR
NETSOL TECHNOLOGIES LIMITED56
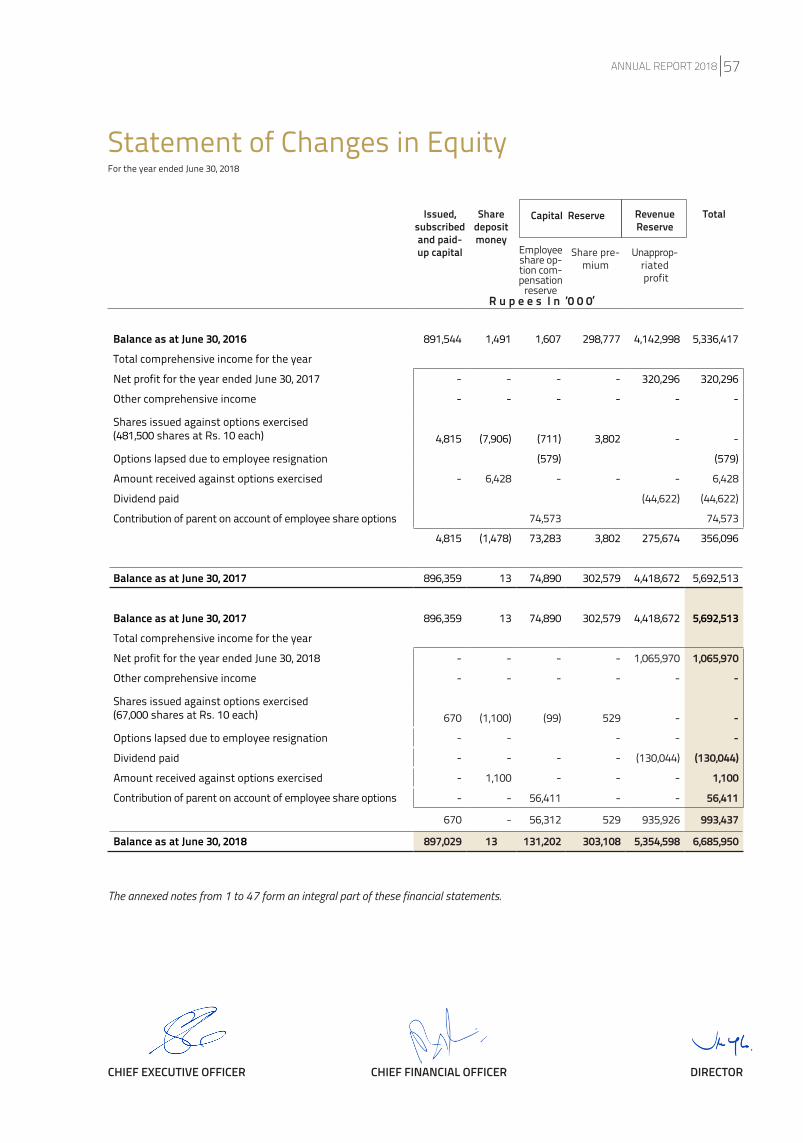
Issued, subscribed and paid-up capital
Share deposit money
Employee share op-tion com-pensation
reserve
Capital Reserve
Share pre-mium
Capital Reserve Revenue Reserve
Unapprop- riated profit
Total
R u p e e s I n ‘0 0 0’
The annexed notes from 1 to 47 form an integral part of these financial statements.
Statement of Changes in EquityFor the year ended June 30, 2018
Balance as at June 30, 2016 891,544 1,491 1,607 298,777 4,142,998 5,336,417
Total comprehensive income for the year
Net profit for the year ended June 30, 2017 - - - - 320,296 320,296
Other comprehensive income - - - - - -
Shares issued against options exercised(481,500 shares at Rs. 10 each) 4,815 (7,906) (711) 3,802 - -
Options lapsed due to employee resignation (579) (579)
Amount received against options exercised - 6,428 - - - 6,428
Dividend paid (44,622) (44,622)
Contribution of parent on account of employee share options 74,573 74,573
4,815 (1,478) 73,283 3,802 275,674 356,096
Balance as at June 30, 2017 896,359 13 74,890 302,579 4,418,672 5,692,513
Balance as at June 30, 2017 896,359 13 74,890 302,579 4,418,672 5,692,513 Total comprehensive income for the year
Net profit for the year ended June 30, 2018 - - - - 1,065,970 1,065,970Other comprehensive income - - - - - -
Shares issued against options exercised(67,000 shares at Rs. 10 each) 670 (1,100) (99) 529 - -Options lapsed due to employee resignation - - - - -Dividend paid - - - - (130,044) (130,044)Amount received against options exercised - 1,100 - - - 1,100 Contribution of parent on account of employee share options - - 56,411 - - 56,411
670 - 56,312 529 935,926 993,437
Balance as at June 30, 2018 897,029 13 131,202 303,108 5,354,598 6,685,950
CHIEF EXECUTIVE OFFICER CHIEF FINANCIAL OFFICER DIRECTOR
ANNUAL REPORT 2018 57
1. LEGAL STATUS AND NATURE OF BUSINESS
NetSol Technologies Limited (”the Company”) was incorporated in Pakistan on August 22, 1996 under the repealed Companies Ordinance, 1984, (Now Companies Act 2017) as a private company, limited by shares and was later on converted into public limited company on November 05, 2004 and subsequently listed on stock exchange on August 26, 2005. The company is listed at Pakistan Stock Exchange Limited. The business of the Company is development and sale of computer software and provision of related services in Pakistan as well as abroad.
Geographical location and addresses of business units:
Address/Location Purpose1 NetSol IT Village,(Software Technology Park) Lahore Ring Road, Registered office Ghazi Road Interchange, Lahore Cantt. Pakistan. and business unit
2 43/1/Q, Amna Villa 1, Block-6, PECHS Housing Society Karachi. Branch office
3 House No. 4, Safari villas 1, Bahria town, Rawalpindi. Pakistan. Branch office
4 Summitmas 2 Ground Floor JI. Jend Sudirman Kav 61-62 Senayan-Kebayoran Branch office Baru Jakarta Selatan 12190, Indonessia
The Company is a majority owned subsidiary of NetSol Technologies Inc., USA.
2. BASIS OF PREPARATION2.1 Separate financial statements
These financial statements are separate financial statements of the company. Consolidated financial statements of the company are prepared separately.
2.2 Statement of complianceThese financial statements have been prepared in accordance with the accounting and reporting standards as applicable in Pakistan. The accounting and reporting standards applicable in Pakistan comprise of:
-International Financial Reporting Standards (IFRS Standards) issued by the International Accounting Standards Board (IASB) as notified under the Companies Act, 2017; and
-Provisions of and directives issued under the Companies Act, 2017.
Where the provisions of and directives issued under the Companies Act, 2017 differ from the IFRS, the provisions of and directives issued under the Companies Act, 2017 have been followed.
2.3 Basis of measurementThese financial statements have been prepared under the historical cost convention, except for revaluation of certain financial instruments at fair value as disclosed in respective accounting notes.
2.4 Functional and presentation currencyThese financial statements are presented in Pak Rupee, which is the Company’s functional currency. All financial information presented in Pak Rupee has been rounded off to the nearest thousand unless stated otherwise.
2.5 Accounting policiesThe accounting policies adopted for the preparation of these financial statements are consistent with those applied in the preparation of the preceding annual published financial statements of the company for the year ended June 30, 2017.
2.6 Standards and interpretations that became effectiveThe third and fourth schedule to the Companies Act, 2017 became applicable to the Company for the first time for the preparation of these financial statements. The Companies Act, 2017 (including its third and fourth schedule) forms an integral part of the statutory financial reporting framework applicable to the Company and amongst others, prescribes the nature and content of disclosures in relation to various elements of the financial statements. Additional disclosures include but are not limited to, particulars of immovable assets of the Company (refer note 5.7), management assessment of sufficiency of tax provision in the financial statements (refer note 34), change in threshold for identification of executives (refer note 36), Investments in foreign entities (refer note 7.1) additional disclosure requirements for related parties (refer note 38.1 and 38.2) etc.
Apart from companies Act 2017, following standards (revised or amended) and interpretations became effective for the current financial year but either they are not relevant or do not have any material effect on the financial statements of the Company:
IAS 7 (Amendment) Cash flow statements: Disclosure initiative (Amendments)
IAS 12 Income taxes-Recognition of deferred tax assets for unrealized losses (Amendments)
IFRS 12 Disclosure of interests in other entities-Annual improvements to IFRS standards 2014-2016
cycle (Amendments)
Notes to the AccountsFor the year ended June 30, 2018
NETSOL TECHNOLOGIES LIMITED58
2.7 Standards and interpretations issued but not yet effective for the current financial year
Effective for periods beginning on or after
IFRS 2 Share-based Payments – Classification and Measurement of Share-based Payments Transactions (Amendments) Jan-01 2018
IFRS 4 Insurance Contracts: Applying IFRS 9 Financial Instruments with IFRS 4 Insurance Contracts (Amendments) Jan-01 2018
IAS 40 Investment Property: Transfers of Investment Property (Amendments) Jan-01 2018IFRIC 22 Foreign Currency Transactions and Advance Consideration Jan-01 2018
IFRS 1 First-time Adoption of International Financial Reporting Standards - Annual improvements to IFRS standards 2014-2016 cycle Jan-01 2018
IAS 28 Investment in Associates and Joint Ventures - Annual improvements to IFRS standards 2014-2016 cycle Jan-01 2018
IFRS 9 Financial Instruments Jan-01 2018IFRS 15 Revenue from contracts with customers Jan-01 2018IFRS 16 Leases Jan-01 2019IFRIC 23 Uncertainty over Income Tax Treatments Jan-01 2019
IFRS 9 Financial Instruments - Prepayment features with negative compensation (Amendments) Jan-01 2019
IAS 19 Employee benefits - Plan Amendment, curtailment or settlement (Amendments) Jan-01 2019
IAS 28 Investment in Associates and Joint Ventures - Long term interests in associates and joint ventures (Amendments) Jan-01 2019
IFRS 3 Business combinations - Annual improvements to IFRS standards 2015-2017 cycle (Amendments) Jan-01 2019
IFRS 11 Joint arrangements - Annual improvements to IFRS standards 2015-2017 cycle (Amendments) Jan-01 2019
IAS 12 Income taxes - Annual improvements to IFRS standards 2015-2017 cycle (Amendments) Jan-01 2019
IAS 23 Borrowing costs - Annual improvements to IFRS standards 2015-2017 cycle (Amendments) Jan-01 2019
Conceptual framework of financial reporting Jan-01 2020IFRS 17 Insurance Contracts Jan-01 2021The above standards and amendments are not expected to have any material impact on the Company’s financial statements in the period of initial application except for IFRS 15-Revenue from contracts with customers. The Company is currently in the process of evaluating the impact of the said standard.
3. USE OF ESTIMATES AND JUDGMENT
The preparation of financial statements in conformity with approved accounting standards, as applicable in Pakistan, requires the management to make judgments, estimates and assumptions that affect the application of policies and the reported amounts of assets and liabilities, income and expenses.
The estimates and associated assumptions are based on historical experience and various other factors that are believed to be reasonable under the circumstances, the results of which form the basis of making judgments about the carrying values of assets and liabilities that are not readily apparent from other sources. Actual results may differ from these estimates.
The estimates and underlying assumptions are reviewed on an ongoing basis. Revisions to accounting estimates are recognized in the period in which the estimate is revised if the revision affects only that period, or in the period of revision and future periods if the revision affects both current and future periods.
The areas involving higher degree of judgement or complexity are as follows:
i. Provision for doubtful debtsii. Provision for taxationiii. Useful life of depreciable assetsiv. Useful life of intangible assetsv. Contingencies
ANNUAL REPORT 2018 59
(ii) Assets subject to finance lease
Assets acquired under finance leases are capitalized and are stated at lower of present value of minimum lease payments under the lease agreements and the fair value of the assets. The related obligations of the leases are accounted for as current and non-current liabilities. Leasing payments are recognized as interest and repayment of liability.
Assets acquired under finance lease are amortized over the useful life of the assets using reducing balance method at the rates given in note 5.4.
Amortization on additions is charged for the month in which an asset is acquired under the finance lease while no amortization is charged for the month in which the asset is disposed off.
(iii) Capital work in progress
Capital work in progress is stated at cost less any identified impairment losses. It represents expenditure incurred on property, plant and equipment during construction and installation. Cost also includes applicable borrowing costs under IAS 23. These expenditures are transferred to relevant assets’ category as and when assets are available for use.
Notes to the AccountsFor the year ended June 30, 2018
4. SUMMARY OF SIGNIFICANT ACCOUNTING POLICIES
4.1 Property, plant and equipment
(i) Owned assets
Property, plant and equipment except for free hold land are stated at cost less accumulated depreciation and any impairment losses. Free hold land is stated at cost less any identified impairment loss.
Depreciation is charged by applying reducing balance method to write off the cost over the remaining useful life of the assets. Rates of depreciation are stated in note 5.1.
Depreciation on additions to property, plant and equipment is charged for the month in which an asset is acquired or capitalized while no depreciation is charged for the month in which the asset is disposed off.
Subsequent costs are included in the asset’s carrying amounts or recognized as a separate asset, as appropriate, only when it is probable that future economic benefits associated with the item will flow to the Company and the cost of the item can be measured reliably.
Maintenance and normal repairs are charged to profit and loss account as and when incurred. Major repairs and improvements are capitalized.
The carrying amount of property and equipment is removed from the balance sheet upon scrapping or disposal or when no future economic benefit is expected from its use, scrapping or disposal.
Gain or loss on scrapping or disposal of assets, if any, is charged to statement of profit or loss.
4.2 Intangible assets
Research and software products development
Research costs are expensed as incurred. Software product development costs are expensed as incurred unless technical and commercial feasibility of the project is demonstrated, it is probable that future economic benefits will flow to the Company, the Company has an intention and ability to complete and use or sell the software and cost can be measured reliably.
There are two components of intangible assets:
a. In-house developed intangible assets
b. Intangible assets acquired from market
NETSOL TECHNOLOGIES LIMITED60
(a) In-house developed intangible assets
The Company capitalizes certain computer software development costs in accordance with IAS 38 Intangible Assets. Costs incurred internally to create a computer software product or to develop an enhancement to an existing product are charged to expense when incurred as research and development expense until technological feasibility for the respective product is established. Thereafter, all software development costs are capitalized and reported at the lower of unamortized cost or recoverable amount. Capitalization ceases when the product or enhancement is available for general release to customers.
Amortization is charged on straight line basis over the useful life of the intangible assets. All intangible assets with an indefinite useful life are tested for impairment at each balance sheet date. Rates of amortization are stated in note 6.
(b) Intangible assets acquired from market
Intangible assets acquired from market are stated at cost less accumulated amortization and impairment losses, if any.
Subsequent costs are included in the asset’s carrying amounts or recognized as a separate asset, as appropriate, only when it is probable that future economic benefits associated with the item will flow to the Company and the cost of the item can be measured reliably. All other expenses are charged to statement of profit or loss when they occur.
Amortization is charged by applying reducing balance method to write off the cost over the remaining useful life of the intangible assets unless such lives are indefinite. All intangible assets with an indefinite useful life are tested for impairment at each balance sheet date. Amortization on additions to acquired intangible assets is charged for the month in which an asset is acquired while no amortization is charged for the month in which the asset is disposed off. Rates of amortization are stated in note 6.
4.3 Impairment
(a) Financial Asset
The Company assesses at each Statement of Financial Position date whether there is any objective evidence that a financial asset or a group of financial asset is impaired. A financial asset is deemed to be impaired if and only if there is an objective evidence of impairment as a result of one or more events that have occurred after the initial recognition of the asset and that event has an impact on the estimated future cash flows of the financial asset that can be reliably estimated. Any impairment loss on financial assets, including the financial assets carried at amortized cost, is recognized in statement of profit or loss.
(b) Non Financial Asset
The Company continually assesses at each Statement of Financial Position date whether there is any indication that an asset may be impaired. If such indication exists, the carrying amounts of such assets are reviewed to assess whether they are recorded in excess of their recoverable amount. Where carrying values exceed the respective recoverable amount, assets are written down to their recoverable amounts and the resulting impairment loss is recognized in profit and loss account for the year. The recoverable amount is the higher of an assets’ fair value less costs to sell and value in use. Where an impairment loss is recognized, the depreciation charge is adjusted in the future periods to allocate the assets’ revised carrying amount over its estimated useful life.
4.4 Foreign currency translation
Transactions denominated in foreign currencies are translated in Pak Rupees at the foreign exchange rate prevailing at the date of transaction. Monetary assets and liabilities in foreign currencies are translated into Pak Rupees at the foreign exchange rates prevailing at the Statement of Financial Position date. Non-monetary assets and liabilities measured at historical cost are translated at the exchange rate prevailing at the date of the transaction. Non-monetary assets and liabilities denominated in foreign currencies that are stated at fair value are translated at the exchange rate prevailing at the date when fair values were determined. All exchange differences are charged to statement of profit or loss.
4.5 Staff benefits
(i) Retirement benefits
The Company operates a defined contributory provident fund for its permanent employees. Contributions are made equally by the company and the employee at 8% of basic salary in the provident fund on monthly basis. Company’s contribution is recognized as a cost in the statement of profit or loss. The fund is administrated by the Trustees.
ANNUAL REPORT 2018 61
(ii) Short-term benefits
Short-term benefits to employees are calculated without discounting and are recognised as cost when related services are received.
(iii) Employee’s share option scheme
The company operates an equity settled share based Employee’ Share Option Scheme (”Scheme”). At the grant date of share options (”Options”) to the employees, the company initially recognizes ”Deferred Employee Compensation Expense” with corresponding credit to equity as ”Deferred Employee Compensation Reserve” at the fair value of option at the grant date. The fair value of options determined at the grant date is recognized as an employee compensation expense on a straight line basis over the vesting period. Fair value of options is arrived at using Black Scholes pricing model.
When an unvested option lapses by virtue of an employee not conforming to the vesting conditions after recognition of an employee compensation expense in statement of profit or loss, employee compensation expense in profit or loss will be reversed equal to the amortized portion with a corresponding effect to deferred employee compensation reserve in the balance sheet. When a vested option lapses on expiry of the exercise period, employee compensation expense already recognized in the statement of profit or loss is reversed with a corresponding reduction to deferred employee compensation reserve in the Statement of Financial Position. When the options are exercised, deferred employee compensation reserve relating to these options is transferred to share capital and share premium account. An amount equivalent to the face value of related shares is transferred to share capital. Any amount over and above the share capital is transferred to share premium account.
4.6 Taxation
Provision for current tax is based on taxable income for the year determined in accordance with the prevailing law for taxation of income. The charge for tax on income is calculated at the current rates of taxation as applicable after taking into account tax credit and tax rebates available, if any. Income tax expense is recognized in profit and loss account except to the extent that it relates to items recognized directly in equity, in which case it is recognized in equity. Charge for tax expense also includes adjustments where necessary, relating to prior years which arise from assessments finalized during the current year.
4.7 Creditors, accruals and provisions
Liabilities for creditors and other amounts payable are carried at cost which is the fair value of the consideration to be paid in future for the goods and / or services received, whether or not billed to the Company.
Liabilities for creditors and other amounts payable in foreign currency are revalued by applying the exchange rate applicable on Statement of Financial Position date.
Provisions are recognized when the Company has a present legal or constructive obligation as a result of past events and, it is probable that an outflow of resources embodying economic benefits will be required to settle the obligation and reliable estimate of the amount can be made. Provisions are reviewed at each Statement of Financial Position date and adjusted to reflect the current best estimate.
4.8 Trade debts
Trade debts from local customers are stated at invoice value while foreign debtors are stated at re-valued amount by applying exchange rate applicable on Statement of Financial Position date. An estimate is made for doubtful receivables when collection of amount is not probable and the amount of trade debts is reduced by such provision. The provision for doubtful debt is recognized in statement of profit or loss. Debts considered irrecoverable are written off against provision.
4.9 Cash and cash equivalents
Cash and cash equivalents comprise of cash in hand and at current or saving accounts held with banks, fixed deposits and short-term, highly liquid investments that are readily convertible to known amounts of cash and which are subject to an insignificant risk of changes in value. These also include facilities of running finance that form an integral part of the Company’s cash management.
Notes to the AccountsFor the year ended June 30, 2018
NETSOL TECHNOLOGIES LIMITED62
4.13 Financial instruments
(i) Financial assets
All financial assets have been stated in accordance with the requirements of IAS–39 (Financial Instruments: Recognition and Measurement). Financial assets and liabilities are recognized when the Company becomes a party to the contractual provisions of the instrument. Financial assets are initially recognized at cost, which is the fair value of the consideration given at initial recognition. Subsequent to initial recognition, financial assets are carried at fair value except for any financial assets whose fair value cannot be estimated reliably. Financial assets are derecognized when the Company loses control of the contractual rights that comprises the financial asset.
The Company classifies its financial assets in the following categories: held to maturity investments, loans and receivables, available for sale investments and investments at fair value through profit or loss. The classification depends on the purpose for which the financial assets were acquired. Management determines the classification of its financial assets at initial recognition. Regular purchases and sales of financial assets are recognized on the trade date, the date on which the Company commits to purchase or sell the asset.
4.12 Off-setting of financial asset and liability
Financial assets and liabilities are offset and the net amount is reported in the financial statements only when there is legally enforceable right to set-off the recognized amount and the Company intends either to settle on a net basis, or to realize the assets and to settle the liabilities simultaneously.
(ii) Rendering of services
Revenue from software services is recognized in accordance with the percentage of completion method. An output measure i.e. Unit Completion Method is used to determine the percentage of completion. Unit completed are certified by the Chief Financial Officer and Chief Operating Officer.
(iii) Maintenance
Revenue from maintenance is recognized on time proportion basis.
(iv) Sale of hardware and third party software
Revenue from sale of hardware and third party software is recognized when delivery has occurred and invoices are raised to customers.
The Company’s revenue recognition policies are in compliance with all applicable accounting regulations including IAS 18 “Revenue”.
(v) Miscellaneous
Interest on bank deposits is recognized on a time proportion basis on the principal amount outstanding and at the rate applicable.
Gains or losses resulting from re-measurement of investment at fair value through profit or loss are recognised in the profit and loss account.
Rental income is recognized on time proportion basis.
Dividend income is recognized as income when the right of receipt is established.
Miscellaneous income is recognized on receipt basis.
4.11 Borrowing costs
Borrowing costs directly attributable to the construction /acquisition of qualifying assets are capitalized up to the date, including the period when technical and administrative work is carried on; the respective assets are available for the intended use. All other mark-up, interest and other related charges are taken to the statement of profit or loss currently. Qualifying assets are assets that necessarily take substantial period of time to get ready for their intended use.
4.10 Revenue recognition
(i) License sale
The Company recognizes revenue from license contracts without major customization when a non-cancellable, non-contingent license agreement has been signed, delivery of the software has occurred, fee is fixed or determinable, and collectability is probable.
Revenue from sale of license with major customization, modification, and development is recognized on percentage of completion basis.
ANNUAL REPORT 2018 63

(a) Held to maturity investments
Investments with fixed payments and maturity that the Company has the intent and ability to hold to maturity are classified as held to maturity investments and are carried at amortized cost less impairment losses. These are classified as current and non-current assets in accordance with criteria set out by IFRSs.
(b) Loans and receivables
Loans and receivables are non-derivative financial assets with fixed or determinable payments that are not quoted in an active market. Loans and receivables are initially measured at fair value plus directly attributable transaction costs. After initial measurement loans and receivables are subsequently measured at amortized cost using the effective interest rate method less any impairment. These are classified as current and non-current assets in accordance with criteria set out by IFRSs.
(c) Available for sale investments
Available for sale financial assets are non derivatives that are either designated in this category or not classified in any of the other categories. They are included in non current assets unless management intends to dispose of the investment within twelve months of the Statement of Financial Position date.
Available for sale investments are initially recognized at cost and carried at fair value at the Statement of Financial Position date. Fair value of a quoted investment is determined in relation to its market value (current bid prices) at the balance sheet date. If the market for a financial asset is not active (and for unlisted securities), the Company establishes fair value by using valuation techniques. Adjustment arising from re-measurement of investment to fair value is recorded in other comprehensive income and taken to statement of profit or loss on disposal of investment or when the investment is determined to be impaired.
(d) Financial assets at fair value through profit or loss
This category consists of two subcategories: (i) financial assets held for trading and (ii) financial assets that the com-pany initially chooses to put in this category. A financial asset is classified as held for trading if it is acquired with the aim of being sold in the short term. Assets in this category are measured continually at fair value, and the changes in value are recognized directly in the statement of profit or loss.
(ii) Financial liabilities
All financial liabilities have been stated in accordance with the requirements of IAS–39 (Financial Instruments: Recognition and Measurement). Financial liabilities are recognized when the Company becomes a party to the contractual provisions of the instrument. All financial liabilities are initially recognized at cost, which is the fair value of the consideration received at initial recognition. Subsequent to initial recognition financial liabilities are carried at fair value, amortized cost or cost as the case may be. Financial liabilities are removed from the Statement of Financial Position when the obligation is extinguished, discharged, cancelled or expired. Any gain or loss on subsequent re-measurement or derecognizing is included in the statement of profit or loss for the period in which it arises.
4.14 Investments
Investment in subsidiary and other investments are stated at cost less any impairment losses.
Notes to the AccountsFor the year ended June 30, 2018
NETSOL TECHNOLOGIES LIMITED64
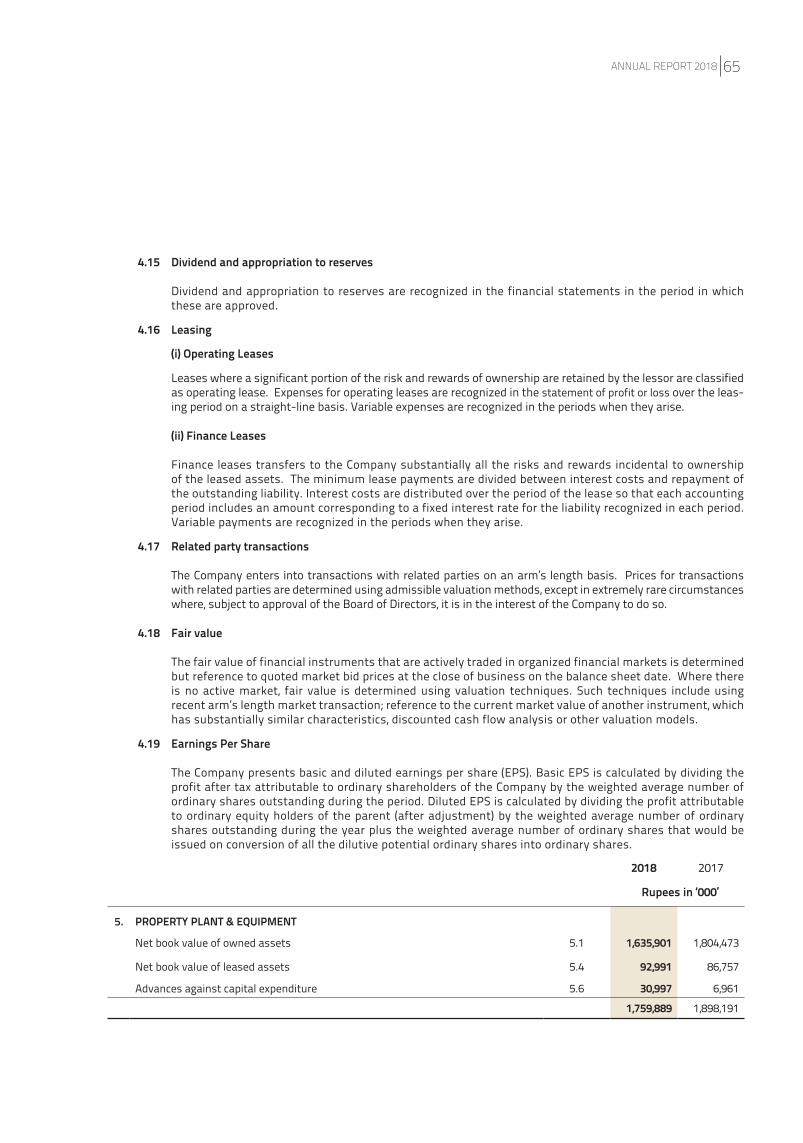
4.15 Dividend and appropriation to reserves
Dividend and appropriation to reserves are recognized in the financial statements in the period in which these are approved.
4.16 Leasing
(i) Operating Leases
Leases where a significant portion of the risk and rewards of ownership are retained by the lessor are classified as operating lease. Expenses for operating leases are recognized in the statement of profit or loss over the leas-ing period on a straight-line basis. Variable expenses are recognized in the periods when they arise.
(ii) Finance Leases
Finance leases transfers to the Company substantially all the risks and rewards incidental to ownership of the leased assets. The minimum lease payments are divided between interest costs and repayment of the outstanding liability. Interest costs are distributed over the period of the lease so that each accounting period includes an amount corresponding to a fixed interest rate for the liability recognized in each period. Variable payments are recognized in the periods when they arise.
4.17 Related party transactions
The Company enters into transactions with related parties on an arm’s length basis. Prices for transactions with related parties are determined using admissible valuation methods, except in extremely rare circumstances where, subject to approval of the Board of Directors, it is in the interest of the Company to do so.
4.18 Fair value
The fair value of financial instruments that are actively traded in organized financial markets is determined but reference to quoted market bid prices at the close of business on the balance sheet date. Where there is no active market, fair value is determined using valuation techniques. Such techniques include using recent arm’s length market transaction; reference to the current market value of another instrument, which has substantially similar characteristics, discounted cash flow analysis or other valuation models.
4.19 Earnings Per Share
The Company presents basic and diluted earnings per share (EPS). Basic EPS is calculated by dividing the profit after tax attributable to ordinary shareholders of the Company by the weighted average number of ordinary shares outstanding during the period. Diluted EPS is calculated by dividing the profit attributable to ordinary equity holders of the parent (after adjustment) by the weighted average number of ordinary shares outstanding during the year plus the weighted average number of ordinary shares that would be issued on conversion of all the dilutive potential ordinary shares into ordinary shares.
2018 2017
Rupees in ‘000’
5. PROPERTY PLANT & EQUIPMENT
Net book value of owned assets 5.1 1,635,901 1,804,473
Net book value of leased assets 5.4 92,991 86,757
Advances against capital expenditure 5.6 30,997 6,961
1,759,889 1,898,191
ANNUAL REPORT 2018 65
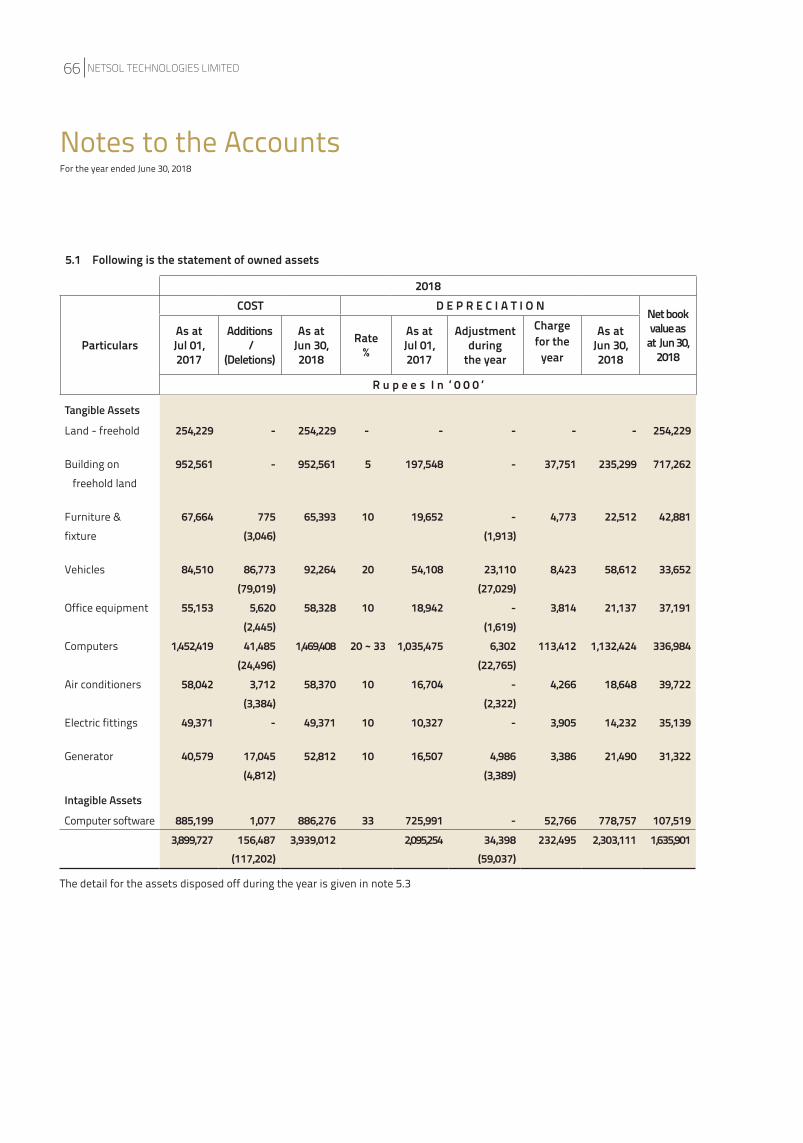
5.1 Following is the statement of owned assets
2018
Particulars
COST D E P R E C I A T I O N Net bookvalue as
at Jun 30,2018
As atJul 01,2017
Additions /
(Deletions)
As atJun 30,2018
Rate%
As atJul 01,2017
Adjustmentduring
the year
Charge for the
year
As atJun 30,2018
R u p e e s I n ‘ 0 0 0 ‘
Tangible Assets
Land - freehold 254,229 - 254,229 - - - - - 254,229
Building on 952,561 - 952,561 5 197,548 - 37,751 235,299 717,262 freehold land
Furniture & 67,664 775 65,393 10 19,652 - 4,773 22,512 42,881 fixture (3,046) (1,913)
Vehicles 84,510 86,773 92,264 20 54,108 23,110 8,423 58,612 33,652 (79,019) (27,029)
Office equipment 55,153 5,620 58,328 10 18,942 - 3,814 21,137 37,191 (2,445) (1,619)
Computers 1,452,419 41,485 1,469,408 20 ~ 33 1,035,475 6,302 113,412 1,132,424 336,984 (24,496) (22,765)
Air conditioners 58,042 3,712 58,370 10 16,704 - 4,266 18,648 39,722 (3,384) (2,322)
Electric fittings 49,371 - 49,371 10 10,327 - 3,905 14,232 35,139
Generator 40,579 17,045 52,812 10 16,507 4,986 3,386 21,490 31,322 (4,812) (3,389)
Intagible Assets
Computer software 885,199 1,077 886,276 33 725,991 - 52,766 778,757 107,519 3,899,727 156,487 3,939,012 2,095,254 34,398 232,495 2,303,111 1,635,901
(117,202) (59,037)
The detail for the assets disposed off during the year is given in note 5.3
Notes to the AccountsFor the year ended June 30, 2018
NETSOL TECHNOLOGIES LIMITED66
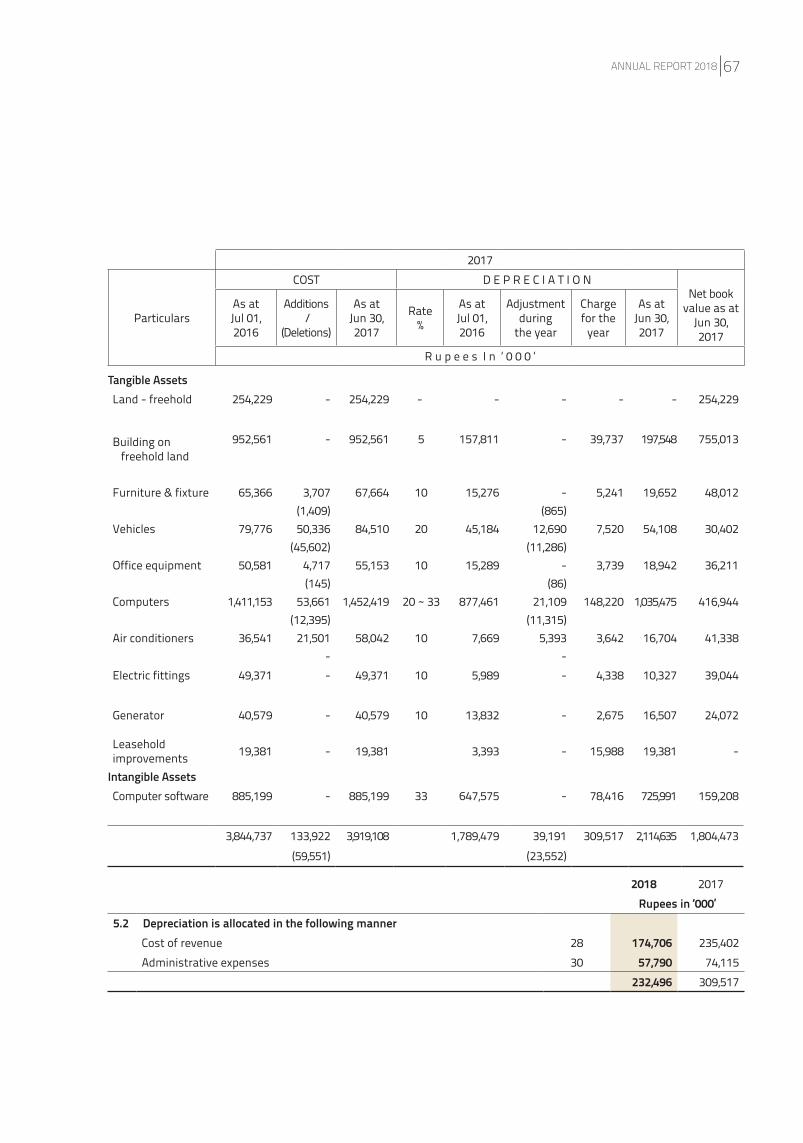
2018 2017Rupees in ‘000’
5.2 Depreciation is allocated in the following mannerCost of revenue 28 174,706 235,402 Administrative expenses 30 57,790 74,115
232,496 309,517
2017
Particulars
COST D E P R E C I A T I O NNet book
value as atJun 30,2017
As atJul 01,2016
Additions /
(Deletions)
As atJun 30,2017
Rate%
As atJul 01,2016
Adjustmentduring
the year
Charge for the
year
As atJun 30,2017
R u p e e s I n ‘ 0 0 0 ‘
Tangible AssetsLand - freehold 254,229 - 254,229 - - - - - 254,229
Building on freehold land
952,561 - 952,561 5 157,811 - 39,737 197,548 755,013
Furniture & fixture 65,366 3,707 67,664 10 15,276 - 5,241 19,652 48,012 (1,409) (865)
Vehicles 79,776 50,336 84,510 20 45,184 12,690 7,520 54,108 30,402 (45,602) (11,286)
Office equipment 50,581 4,717 55,153 10 15,289 - 3,739 18,942 36,211 (145) (86)
Computers 1,411,153 53,661 1,452,419 20 ~ 33 877,461 21,109 148,220 1,035,475 416,944 (12,395) (11,315)
Air conditioners 36,541 21,501 58,042 10 7,669 5,393 3,642 16,704 41,338 - -
Electric fittings 49,371 - 49,371 10 5,989 - 4,338 10,327 39,044
Generator 40,579 - 40,579 10 13,832 - 2,675 16,507 24,072
Leasehold improvements 19,381 - 19,381 3,393 - 15,988 19,381 -
Intangible AssetsComputer software 885,199 - 885,199 33 647,575 - 78,416 725,991 159,208
3,844,737 133,922 3,919,108 1,789,479 39,191 309,517 2,114,635 1,804,473 (59,551) (23,552)
ANNUAL REPORT 2018 67
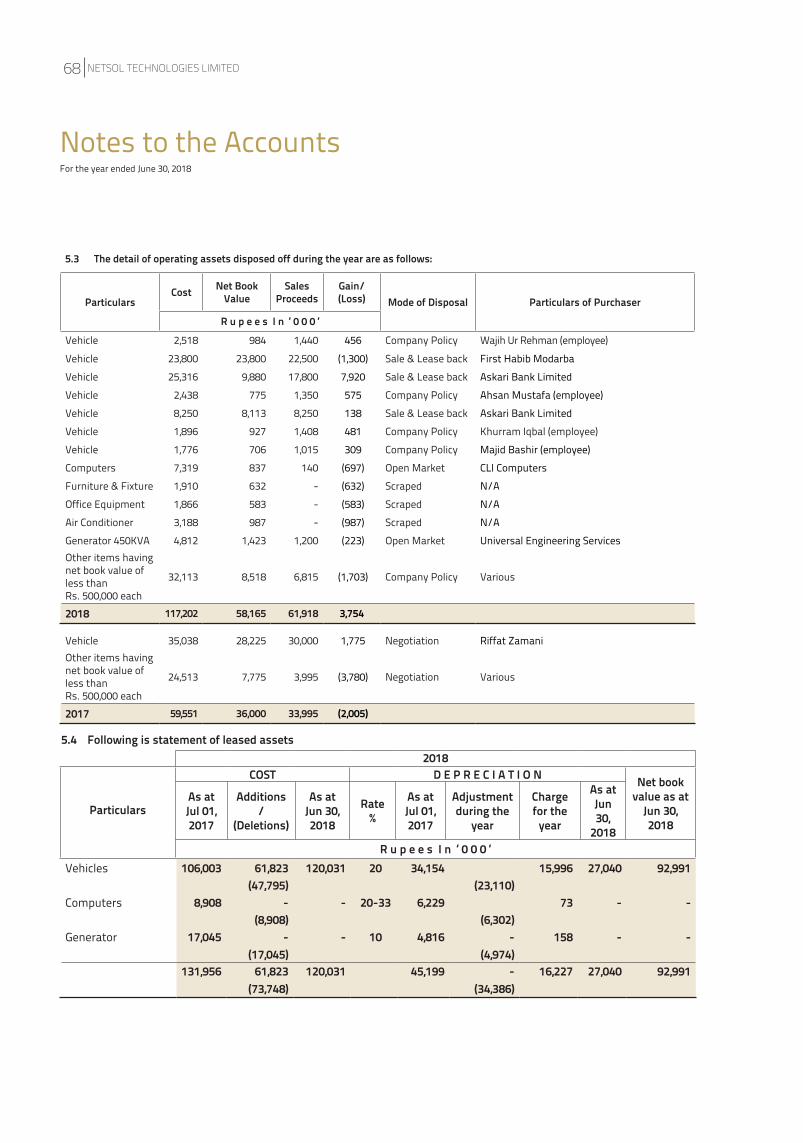
5.3 The detail of operating assets disposed off during the year are as follows:
ParticularsCost Net Book
ValueSales
ProceedsGain/(Loss) Mode of Disposal Particulars of Purchaser
R u p e e s I n ‘ 0 0 0 ‘Vehicle 2,518 984 1,440 456 Company Policy Wajih Ur Rehman (employee)
Vehicle 23,800 23,800 22,500 (1,300) Sale & Lease back First Habib ModarbaVehicle 25,316 9,880 17,800 7,920 Sale & Lease back Askari Bank Limited Vehicle 2,438 775 1,350 575 Company Policy Ahsan Mustafa (employee)Vehicle 8,250 8,113 8,250 138 Sale & Lease back Askari Bank LimitedVehicle 1,896 927 1,408 481 Company Policy Khurram Iqbal (employee)Vehicle 1,776 706 1,015 309 Company Policy Majid Bashir (employee)Computers 7,319 837 140 (697) Open Market CLI ComputersFurniture & Fixture 1,910 632 - (632) Scraped N/AOffice Equipment 1,866 583 - (583) Scraped N/AAir Conditioner 3,188 987 - (987) Scraped N/AGenerator 450KVA 4,812 1,423 1,200 (223) Open Market Universal Engineering ServicesOther items having net book value of less than Rs. 500,000 each
32,113 8,518 6,815 (1,703) Company Policy Various
2018 117,202 58,165 61,918 3,754
Vehicle 35,038 28,225 30,000 1,775 Negotiation Riffat ZamaniOther items having net book value of less than Rs. 500,000 each
24,513 7,775 3,995 (3,780) Negotiation Various
2017 59,551 36,000 33,995 (2,005)
2018
Particulars
COST D E P R E C I A T I O N Net bookvalue as at
Jun 30,2018
As atJul 01,2017
Additions /
(Deletions)
As atJun 30,2018
Rate%
As atJul 01,2017
Adjustment during the
year
Charge for the
year
As atJun 30,
2018R u p e e s I n ‘ 0 0 0 ‘
Vehicles 106,003 61,823 120,031 20 34,154 15,996 27,040 92,991 (47,795) (23,110)
Computers 8,908 - - 20-33 6,229 73 - - (8,908) (6,302)
Generator 17,045 - - 10 4,816 - 158 - - (17,045) (4,974)
131,956 61,823 120,031 45,199 - 16,227 27,040 92,991 (73,748) (34,386)
5.4 Following is statement of leased assets
Notes to the AccountsFor the year ended June 30, 2018
NETSOL TECHNOLOGIES LIMITED68
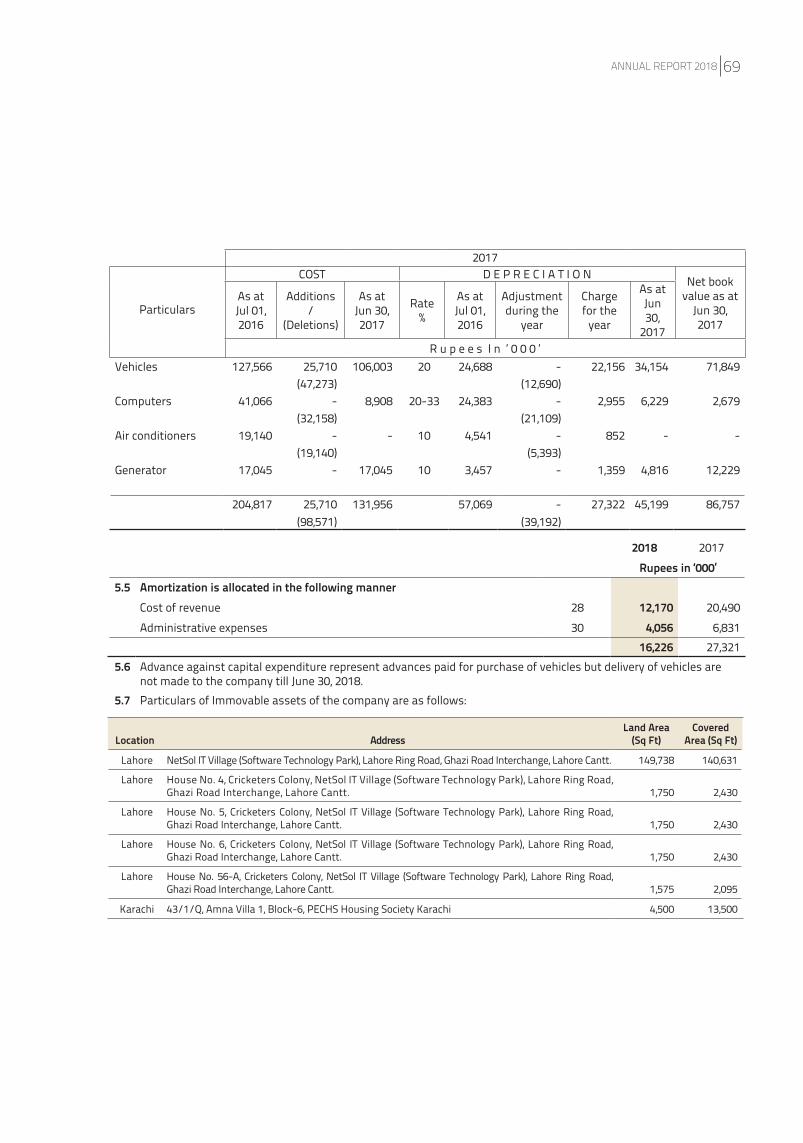
2017
Particulars
COST D E P R E C I A T I O N Net bookvalue as at
Jun 30,2017
As atJul 01,2016
Additions /
(Deletions)
As atJun 30,2017
Rate%
As atJul 01,2016
Adjustment during the
year
Charge for the
year
As atJun 30,
2017R u p e e s I n ‘ 0 0 0 ‘
Vehicles 127,566 25,710 106,003 20 24,688 - 22,156 34,154 71,849 (47,273) (12,690)
Computers 41,066 - 8,908 20-33 24,383 - 2,955 6,229 2,679 (32,158) (21,109)
Air conditioners 19,140 - - 10 4,541 - 852 - - (19,140) (5,393)
Generator 17,045 - 17,045 10 3,457 - 1,359 4,816 12,229
204,817 25,710 131,956 57,069 - 27,322 45,199 86,757 (98,571) (39,192)
2018 2017Rupees in ‘000’
5.5 Amortization is allocated in the following mannerCost of revenue 28 12,170 20,490Administrative expenses 30 4,056 6,831
16,226 27,3215.6 Advance against capital expenditure represent advances paid for purchase of vehicles but delivery of vehicles are
not made to the company till June 30, 2018.5.7 Particulars of Immovable assets of the company are as follows:
Location AddressLand Area
(Sq Ft)Covered
Area (Sq Ft)
Lahore NetSol IT Village (Software Technology Park), Lahore Ring Road, Ghazi Road Interchange, Lahore Cantt. 149,738 140,631
Lahore House No. 4, Cricketers Colony, NetSol IT Village (Software Technology Park), Lahore Ring Road, Ghazi Road Interchange, Lahore Cantt. 1,750 2,430
Lahore House No. 5, Cricketers Colony, NetSol IT Village (Software Technology Park), Lahore Ring Road, Ghazi Road Interchange, Lahore Cantt. 1,750 2,430
Lahore House No. 6, Cricketers Colony, NetSol IT Village (Software Technology Park), Lahore Ring Road, Ghazi Road Interchange, Lahore Cantt. 1,750 2,430
Lahore House No. 56-A, Cricketers Colony, NetSol IT Village (Software Technology Park), Lahore Ring Road, Ghazi Road Interchange, Lahore Cantt. 1,575 2,095
Karachi 43/1/Q, Amna Villa 1, Block-6, PECHS Housing Society Karachi 4,500 13,500
ANNUAL REPORT 2018 69
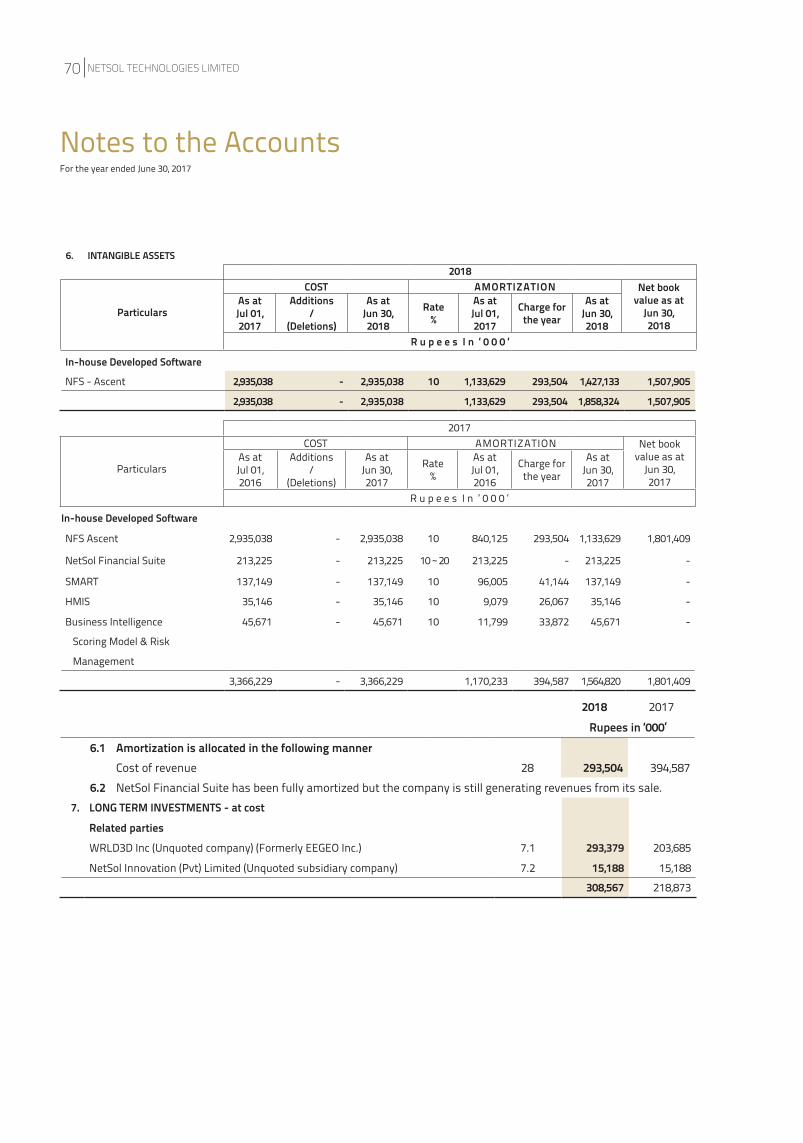
2018 2017Rupees in ‘000’
6.1 Amortization is allocated in the following manner Cost of revenue 28 293,504 394,587
6.2 NetSol Financial Suite has been fully amortized but the company is still generating revenues from its sale.7. LONG TERM INVESTMENTS - at cost
Related partiesWRLD3D Inc (Unquoted company) (Formerly EEGEO Inc.) 7.1 293,379 203,685
NetSol Innovation (Pvt) Limited (Unquoted subsidiary company) 7.2 15,188 15,188
308,567 218,873
Notes to the AccountsFor the year ended June 30, 2017
2017
Particulars
COST AMORTIZATION Net bookvalue as at
Jun 30,2017
As atJul 01,2016
Additions /
(Deletions)
As atJun 30,2017
Rate%
As atJul 01,2016
Charge for the year
As atJun 30,2017
R u p e e s I n ‘ 0 0 0 ‘
In-house Developed Software
NFS Ascent 2,935,038 - 2,935,038 10 840,125 293,504 1,133,629 1,801,409
NetSol Financial Suite 213,225 - 213,225 10 ~ 20 213,225 - 213,225 -
SMART 137,149 - 137,149 10 96,005 41,144 137,149 -
HMIS 35,146 - 35,146 10 9,079 26,067 35,146 -
Business Intelligence 45,671 - 45,671 10 11,799 33,872 45,671 -
Scoring Model & Risk
Management
3,366,229 - 3,366,229 1,170,233 394,587 1,564,820 1,801,409
6. INTANGIBLE ASSETS2018
Particulars
COST AMORTIZATION Net bookvalue as at
Jun 30,2018
As atJul 01,2017
Additions /
(Deletions)
As atJun 30,2018
Rate%
As atJul 01,2017
Charge for the year
As atJun 30,2018
R u p e e s I n ‘ 0 0 0 ‘
In-house Developed Software
NFS - Ascent 2,935,038 - 2,935,038 10 1,133,629 293,504 1,427,133 1,507,905
2,935,038 - 2,935,038 1,133,629 293,504 1,858,324 1,507,905
NETSOL TECHNOLOGIES LIMITED70
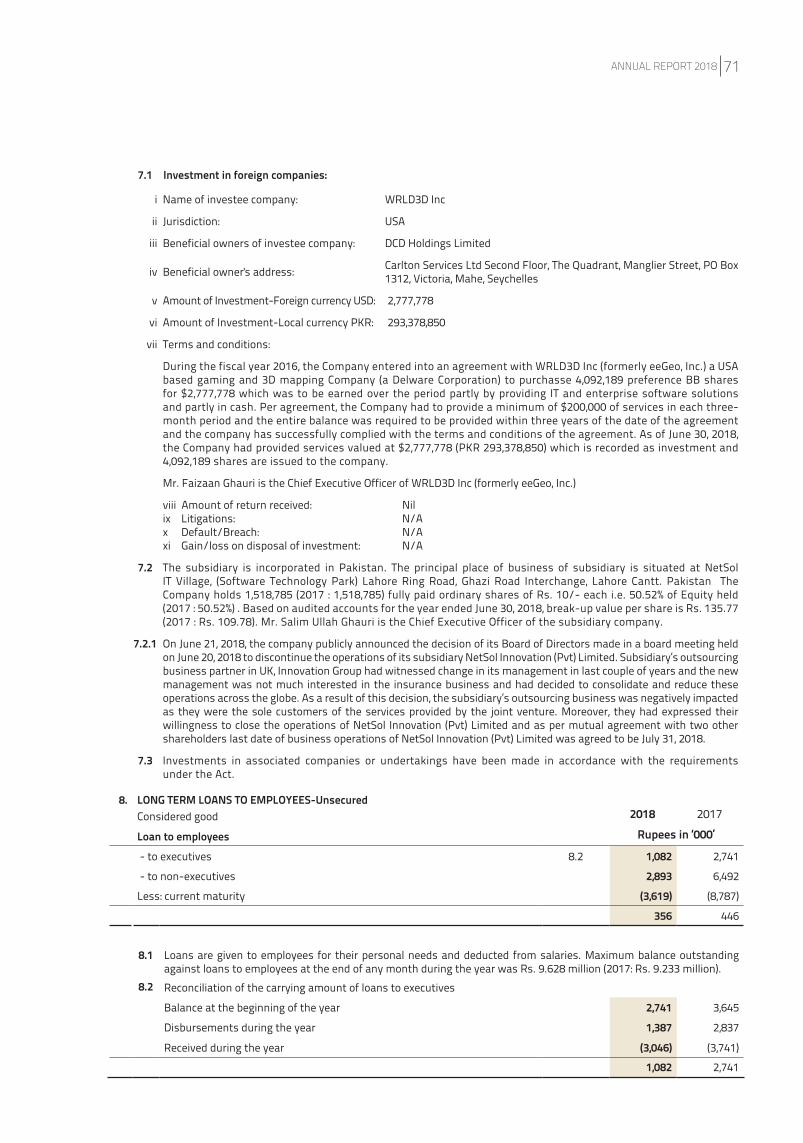
8. LONG TERM LOANS TO EMPLOYEES-UnsecuredConsidered good
Loan to employees - to executives 8.2 1,082 2,741
- to non-executives 2,893 6,492
Less: current maturity (3,619) (8,787)
356 446
8.1 Loans are given to employees for their personal needs and deducted from salaries. Maximum balance outstanding against loans to employees at the end of any month during the year was Rs. 9.628 million (2017: Rs. 9.233 million).
8.2 Reconciliation of the carrying amount of loans to executives
Balance at the beginning of the year 2,741 3,645
Disbursements during the year 1,387 2,837
Received during the year (3,046) (3,741)
1,082 2,741
7.1 Investment in foreign companies:
i Name of investee company: WRLD3D Inc
ii Jurisdiction: USA
iii Beneficial owners of investee company: DCD Holdings Limited
iv Beneficial owner's address: Carlton Services Ltd Second Floor, The Quadrant, Manglier Street, PO Box 1312, Victoria, Mahe, Seychelles
v Amount of Investment-Foreign currency USD: 2,777,778
vi Amount of Investment-Local currency PKR: 293,378,850
vii Terms and conditions:
During the fiscal year 2016, the Company entered into an agreement with WRLD3D Inc (formerly eeGeo, Inc.) a USA based gaming and 3D mapping Company (a Delware Corporation) to purchasse 4,092,189 preference BB shares for $2,777,778 which was to be earned over the period partly by providing IT and enterprise software solutions and partly in cash. Per agreement, the Company had to provide a minimum of $200,000 of services in each three-month period and the entire balance was required to be provided within three years of the date of the agreement and the company has successfully complied with the terms and conditions of the agreement. As of June 30, 2018, the Company had provided services valued at $2,777,778 (PKR 293,378,850) which is recorded as investment and 4,092,189 shares are issued to the company.
Mr. Faizaan Ghauri is the Chief Executive Officer of WRLD3D Inc (formerly eeGeo, Inc.)
viii Amount of return received: Nilix Litigations: N/Ax Default/Breach: N/Axi Gain/loss on disposal of investment: N/A
7.2 The subsidiary is incorporated in Pakistan. The principal place of business of subsidiary is situated at NetSol IT Village, (Software Technology Park) Lahore Ring Road, Ghazi Road Interchange, Lahore Cantt. Pakistan The Company holds 1,518,785 (2017 : 1,518,785) fully paid ordinary shares of Rs. 10/- each i.e. 50.52% of Equity held (2017 : 50.52%) . Based on audited accounts for the year ended June 30, 2018, break-up value per share is Rs. 135.77 (2017 : Rs. 109.78). Mr. Salim Ullah Ghauri is the Chief Executive Officer of the subsidiary company.
7.2.1 On June 21, 2018, the company publicly announced the decision of its Board of Directors made in a board meeting held on June 20, 2018 to discontinue the operations of its subsidiary NetSol Innovation (Pvt) Limited. Subsidiary’s outsourcing business partner in UK, Innovation Group had witnessed change in its management in last couple of years and the new management was not much interested in the insurance business and had decided to consolidate and reduce these operations across the globe. As a result of this decision, the subsidiary’s outsourcing business was negatively impacted as they were the sole customers of the services provided by the joint venture. Moreover, they had expressed their willingness to close the operations of NetSol Innovation (Pvt) Limited and as per mutual agreement with two other shareholders last date of business operations of NetSol Innovation (Pvt) Limited was agreed to be July 31, 2018.
7.3 Investments in associated companies or undertakings have been made in accordance with the requirements under the Act.
2018 2017Rupees in ‘000’
ANNUAL REPORT 2018 71
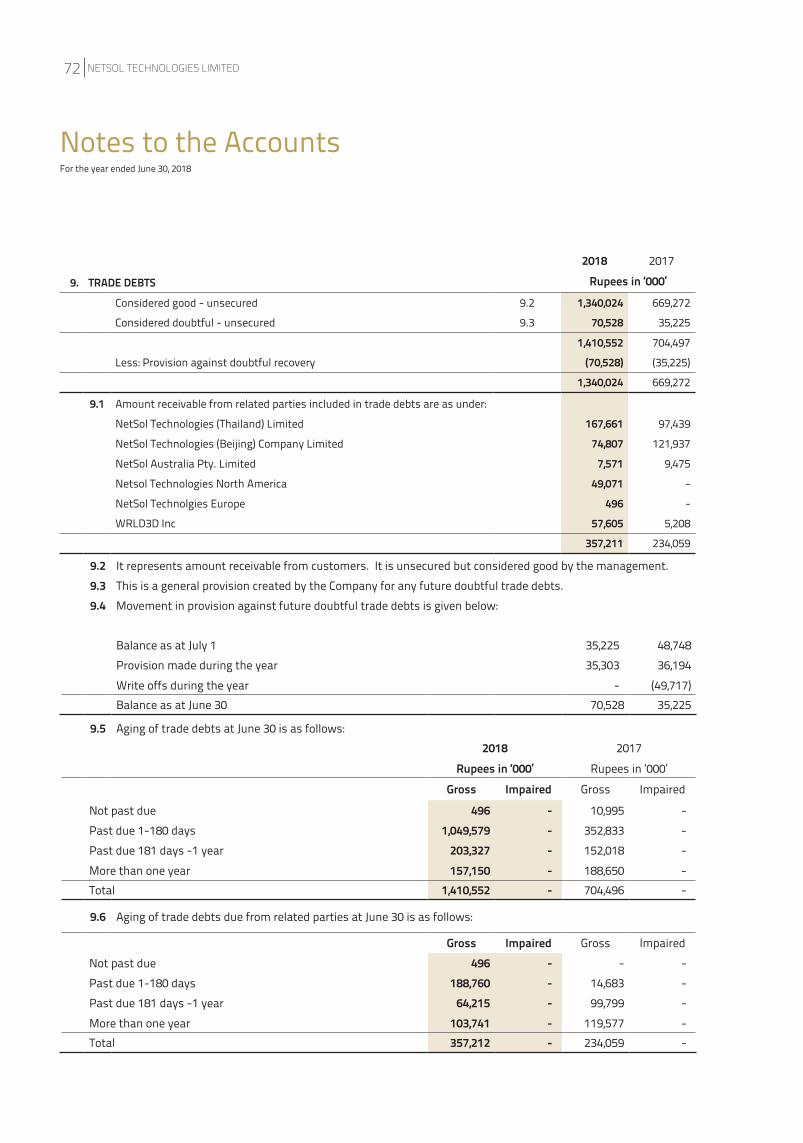
Notes to the AccountsFor the year ended June 30, 2018
9.5 Aging of trade debts at June 30 is as follows:2018 2017
Rupees in ‘000’ Rupees in ‘000’
Gross Impaired Gross Impaired
Not past due 496 - 10,995 - Past due 1-180 days 1,049,579 - 352,833 - Past due 181 days -1 year 203,327 - 152,018 - More than one year 157,150 - 188,650 - Total 1,410,552 - 704,496 -
9.6 Aging of trade debts due from related parties at June 30 is as follows:
Gross Impaired Gross ImpairedNot past due 496 - - - Past due 1-180 days 188,760 - 14,683 - Past due 181 days -1 year 64,215 - 99,799 - More than one year 103,741 - 119,577 - Total 357,212 - 234,059 -
9.2 It represents amount receivable from customers. It is unsecured but considered good by the management.9.3 This is a general provision created by the Company for any future doubtful trade debts.9.4 Movement in provision against future doubtful trade debts is given below:
Balance as at July 1 35,225 48,748 Provision made during the year 35,303 36,194 Write offs during the year - (49,717)Balance as at June 30 70,528 35,225
9.1 Amount receivable from related parties included in trade debts are as under:
NetSol Technologies (Thailand) Limited 167,661 97,439
NetSol Technologies (Beijing) Company Limited 74,807 121,937
NetSol Australia Pty. Limited 7,571 9,475
Netsol Technologies North America 49,071 -
NetSol Technolgies Europe 496 -
WRLD3D Inc 57,605 5,208
357,211 234,059
2018 2017Rupees in ‘000’9. TRADE DEBTS
Considered good - unsecured 9.2 1,340,024 669,272
Considered doubtful - unsecured 9.3 70,528 35,225
1,410,552 704,497
Less: Provision against doubtful recovery (70,528) (35,225)
1,340,024 669,272
NETSOL TECHNOLOGIES LIMITED72
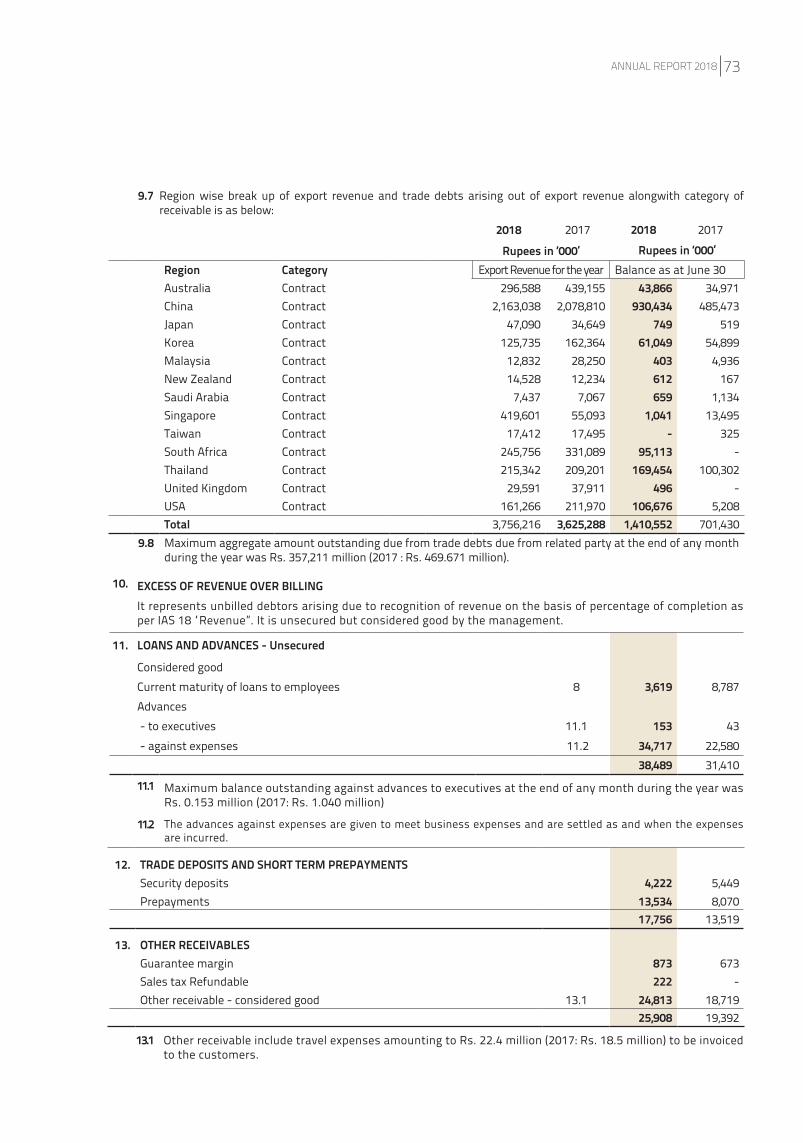
12. TRADE DEPOSITS AND SHORT TERM PREPAYMENTSSecurity deposits 4,222 5,449 Prepayments 13,534 8,070
17,756 13,519
13. OTHER RECEIVABLESGuarantee margin 873 673Sales tax Refundable 222 -Other receivable - considered good 13.1 24,813 18,719
25,908 19,392
13.1 Other receivable include travel expenses amounting to Rs. 22.4 million (2017: Rs. 18.5 million) to be invoiced to the customers.
10. EXCESS OF REVENUE OVER BILLINGIt represents unbilled debtors arising due to recognition of revenue on the basis of percentage of completion as per IAS 18 “Revenue”. It is unsecured but considered good by the management.
11. LOANS AND ADVANCES - Unsecured
Considered goodCurrent maturity of loans to employees 8 3,619 8,787 Advances - to executives 11.1 153 43 - against expenses 11.2 34,717 22,580
38,489 31,410
11.1 Maximum balance outstanding against advances to executives at the end of any month during the year was Rs. 0.153 million (2017: Rs. 1.040 million)
11.2 The advances against expenses are given to meet business expenses and are settled as and when the expenses are incurred.
9.7 Region wise break up of export revenue and trade debts arising out of export revenue alongwith category of receivable is as below:
2018 2017 2018 2017
Rupees in ‘000’ Rupees in ‘000’Region Category Export Revenue for the year Balance as at June 30Australia Contract 296,588 439,155 43,866 34,971 China Contract 2,163,038 2,078,810 930,434 485,473 Japan Contract 47,090 34,649 749 519 Korea Contract 125,735 162,364 61,049 54,899 Malaysia Contract 12,832 28,250 403 4,936 New Zealand Contract 14,528 12,234 612 167 Saudi Arabia Contract 7,437 7,067 659 1,134 Singapore Contract 419,601 55,093 1,041 13,495 Taiwan Contract 17,412 17,495 - 325 South Africa Contract 245,756 331,089 95,113 - Thailand Contract 215,342 209,201 169,454 100,302 United Kingdom Contract 29,591 37,911 496 - USA Contract 161,266 211,970 106,676 5,208 Total 3,756,216 3,625,288 1,410,552 701,430
9.8 Maximum aggregate amount outstanding due from trade debts due from related party at the end of any month during the year was Rs. 357,211 million (2017 : Rs. 469.671 million).
ANNUAL REPORT 2018 73
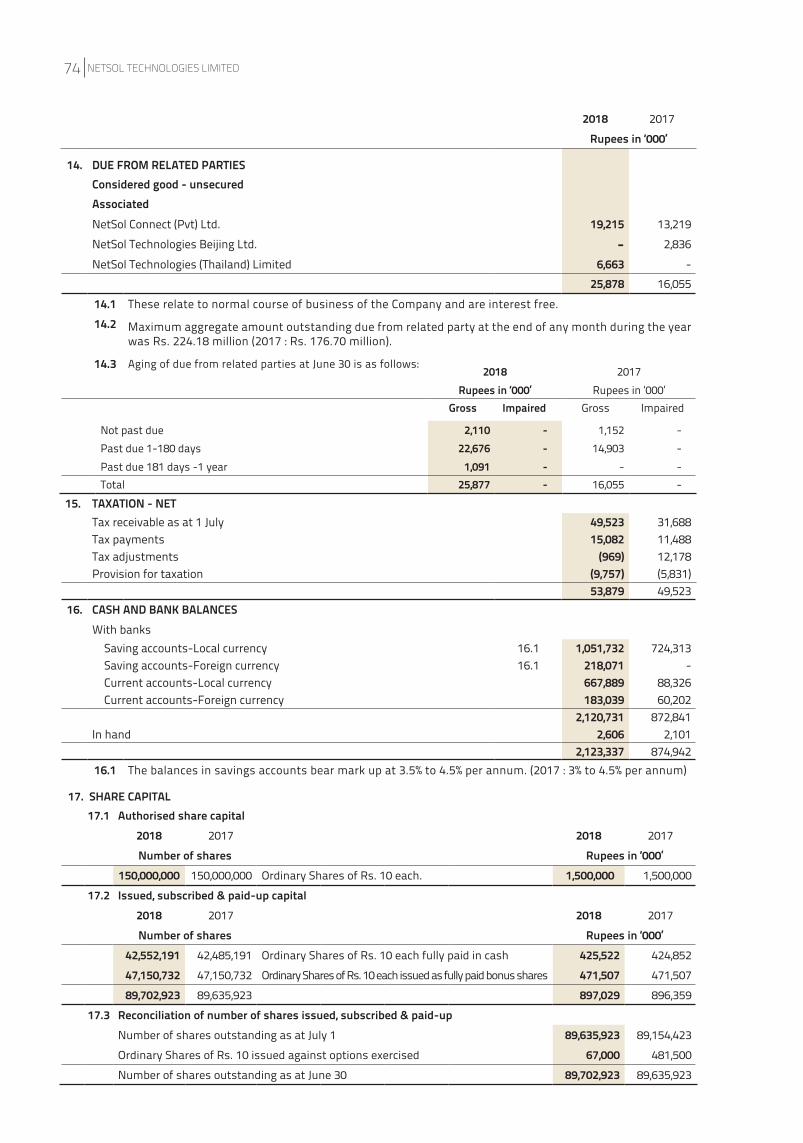
17. SHARE CAPITAL17.1 Authorised share capital
2018 2017 2018 2017Number of shares Rupees in ‘000’
150,000,000 150,000,000 Ordinary Shares of Rs. 10 each. 1,500,000 1,500,000 17.2 Issued, subscribed & paid-up capital
2018 2017 2018 2017Number of shares Rupees in ‘000’
42,552,191 42,485,191 Ordinary Shares of Rs. 10 each fully paid in cash 425,522 424,852 47,150,732 47,150,732 Ordinary Shares of Rs. 10 each issued as fully paid bonus shares 471,507 471,507 89,702,923 89,635,923 897,029 896,359
17.3 Reconciliation of number of shares issued, subscribed & paid-upNumber of shares outstanding as at July 1 89,635,923 89,154,423 Ordinary Shares of Rs. 10 issued against options exercised 67,000 481,500 Number of shares outstanding as at June 30 89,702,923 89,635,923
14. DUE FROM RELATED PARTIESConsidered good - unsecured AssociatedNetSol Connect (Pvt) Ltd. 19,215 13,219 NetSol Technologies Beijing Ltd. - 2,836 NetSol Technologies (Thailand) Limited 6,663 -
25,878 16,055 14.1 These relate to normal course of business of the Company and are interest free.14.2 Maximum aggregate amount outstanding due from related party at the end of any month during the year
was Rs. 224.18 million (2017 : Rs. 176.70 million).
14.3 Aging of due from related parties at June 30 is as follows:
15. TAXATION - NETTax receivable as at 1 July 49,523 31,688 Tax payments 15,082 11,488Tax adjustments (969) 12,178 Provision for taxation (9,757) (5,831)
53,879 49,52316. CASH AND BANK BALANCES
With banks Saving accounts-Local currency 16.1 1,051,732 724,313 Saving accounts-Foreign currency 16.1 218,071 - Current accounts-Local currency 667,889 88,326 Current accounts-Foreign currency 183,039 60,202
2,120,731 872,841 In hand 2,606 2,101
2,123,337 874,942 16.1 The balances in savings accounts bear mark up at 3.5% to 4.5% per annum. (2017 : 3% to 4.5% per annum)
2018 2017Rupees in ‘000’
2018 2017Rupees in ‘000’ Rupees in ‘000’
Gross Impaired Gross Impaired
Not past due 2,110 - 1,152 - Past due 1-180 days 22,676 - 14,903 - Past due 181 days -1 year 1,091 - - - Total 25,877 - 16,055 -
NETSOL TECHNOLOGIES LIMITED74
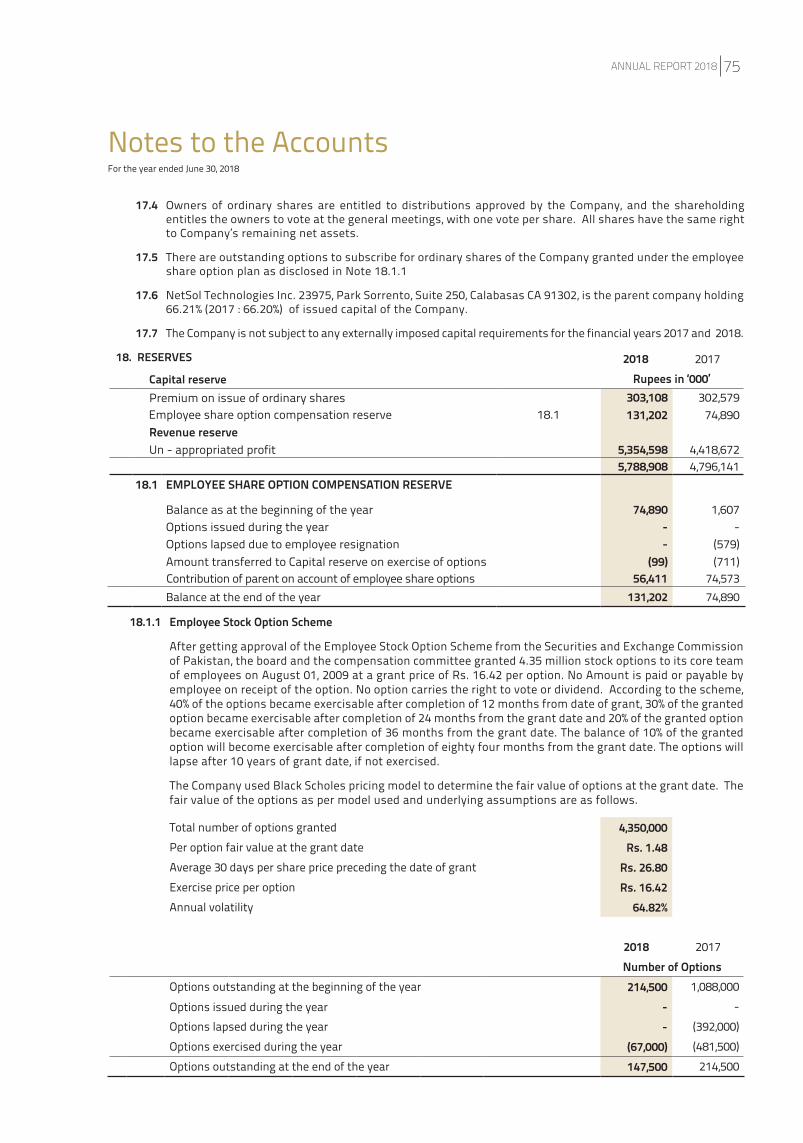
18.1.1 Employee Stock Option Scheme
After getting approval of the Employee Stock Option Scheme from the Securities and Exchange Commission of Pakistan, the board and the compensation committee granted 4.35 million stock options to its core team of employees on August 01, 2009 at a grant price of Rs. 16.42 per option. No Amount is paid or payable by employee on receipt of the option. No option carries the right to vote or dividend. According to the scheme, 40% of the options became exercisable after completion of 12 months from date of grant, 30% of the granted option became exercisable after completion of 24 months from the grant date and 20% of the granted option became exercisable after completion of 36 months from the grant date. The balance of 10% of the granted option will become exercisable after completion of eighty four months from the grant date. The options will lapse after 10 years of grant date, if not exercised.
The Company used Black Scholes pricing model to determine the fair value of options at the grant date. The fair value of the options as per model used and underlying assumptions are as follows.
Total number of options granted 4,350,000 Per option fair value at the grant date Rs. 1.48Average 30 days per share price preceding the date of grant Rs. 26.80Exercise price per option Rs. 16.42Annual volatility 64.82%
2018 2017Number of Options
Options outstanding at the beginning of the year 214,500 1,088,000 Options issued during the year - - Options lapsed during the year - (392,000)Options exercised during the year (67,000) (481,500)Options outstanding at the end of the year 147,500 214,500
Notes to the AccountsFor the year ended June 30, 2018
17.4 Owners of ordinary shares are entitled to distributions approved by the Company, and the shareholding entitles the owners to vote at the general meetings, with one vote per share. All shares have the same right to Company’s remaining net assets.
17.5 There are outstanding options to subscribe for ordinary shares of the Company granted under the employee share option plan as disclosed in Note 18.1.1
17.6 NetSol Technologies Inc. 23975, Park Sorrento, Suite 250, Calabasas CA 91302, is the parent company holding 66.21% (2017 : 66.20%) of issued capital of the Company.
17.7 The Company is not subject to any externally imposed capital requirements for the financial years 2017 and 2018.
18. RESERVES
Capital reservePremium on issue of ordinary shares 303,108 302,579
Employee share option compensation reserve 18.1 131,202 74,890 Revenue reserveUn - appropriated profit 5,354,598 4,418,672
5,788,908 4,796,141 18.1 EMPLOYEE SHARE OPTION COMPENSATION RESERVE
Balance as at the beginning of the year 74,890 1,607 Options issued during the year - - Options lapsed due to employee resignation - (579)Amount transferred to Capital reserve on exercise of options (99) (711)
Contribution of parent on account of employee share options 56,411 74,573
2018 2017Rupees in ‘000’
Balance at the end of the year 131,202 74,890
ANNUAL REPORT 2018 75
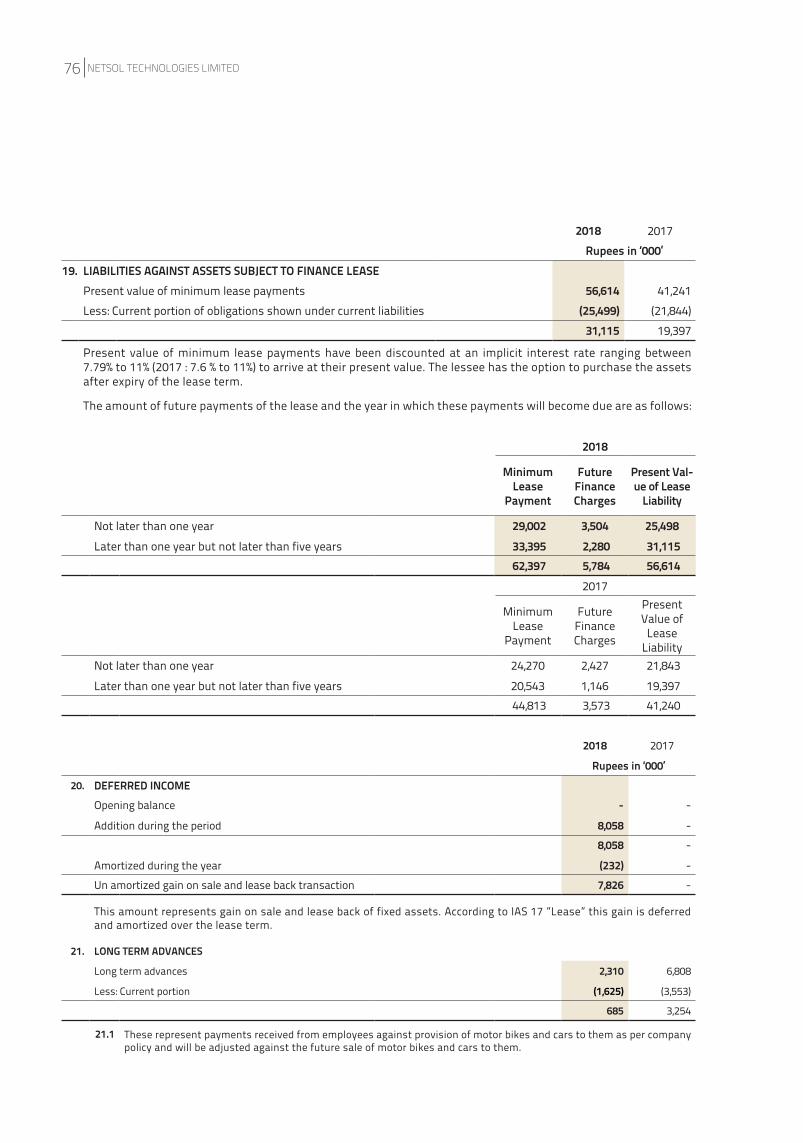
2018
Minimum Lease
Payment
Future Finance Charges
Present Val-ue of Lease
Liability
Not later than one year 29,002 3,504 25,498 Later than one year but not later than five years 33,395 2,280 31,115
62,397 5,784 56,614 2017
Minimum Lease
Payment
Future Finance Charges
Present Value of
Lease Liability
Not later than one year 24,270 2,427 21,843 Later than one year but not later than five years 20,543 1,146 19,397
44,813 3,573 41,240
2018 2017
Rupees in ‘000’20. DEFERRED INCOME
Opening balance - -
Addition during the period 8,058 -
8,058 -
Amortized during the year (232) -
Un amortized gain on sale and lease back transaction 7,826 -
This amount represents gain on sale and lease back of fixed assets. According to IAS 17 ”Lease” this gain is deferred and amortized over the lease term.
21. LONG TERM ADVANCES
Long term advances 2,310 6,808
Less: Current portion (1,625) (3,553)
685 3,254
21.1 These represent payments received from employees against provision of motor bikes and cars to them as per company policy and will be adjusted against the future sale of motor bikes and cars to them.
2018 2017Rupees in ‘000’
19. LIABILITIES AGAINST ASSETS SUBJECT TO FINANCE LEASEPresent value of minimum lease payments 56,614 41,241 Less: Current portion of obligations shown under current liabilities (25,499) (21,844)
31,115 19,397
Present value of minimum lease payments have been discounted at an implicit interest rate ranging between 7.79% to 11% (2017 : 7.6 % to 11%) to arrive at their present value. The lessee has the option to purchase the assets after expiry of the lease term.
The amount of future payments of the lease and the year in which these payments will become due are as follows:
NETSOL TECHNOLOGIES LIMITED76
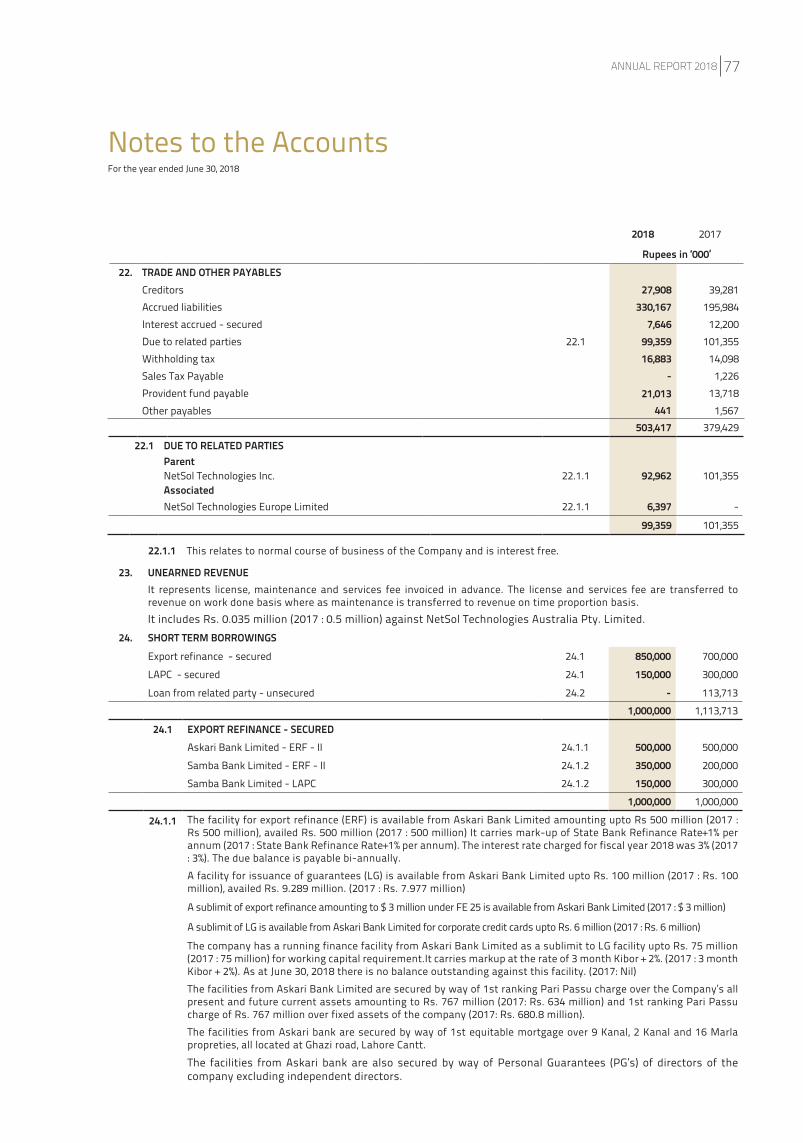
22.1 DUE TO RELATED PARTIESParentNetSol Technologies Inc. 22.1.1 92,962 101,355AssociatedNetSol Technologies Europe Limited 22.1.1 6,397 -
99,359 101,355
22.1.1 This relates to normal course of business of the Company and is interest free.
23. UNEARNED REVENUEIt represents license, maintenance and services fee invoiced in advance. The license and services fee are transferred to revenue on work done basis where as maintenance is transferred to revenue on time proportion basis.It includes Rs. 0.035 million (2017 : 0.5 million) against NetSol Technologies Australia Pty. Limited.
24. SHORT TERM BORROWINGSExport refinance - secured 24.1 850,000 700,000 LAPC - secured 24.1 150,000 300,000
Loan from related party - unsecured 24.2 - 113,713 1,000,000 1,113,713
24.1 EXPORT REFINANCE - SECUREDAskari Bank Limited - ERF - II 24.1.1 500,000 500,000 Samba Bank Limited - ERF - II 24.1.2 350,000 200,000 Samba Bank Limited - LAPC 24.1.2 150,000 300,000
1,000,000 1,000,000
24.1.1 The facility for export refinance (ERF) is available from Askari Bank Limited amounting upto Rs 500 million (2017 : Rs 500 million), availed Rs. 500 million (2017 : 500 million) It carries mark-up of State Bank Refinance Rate+1% per annum (2017 : State Bank Refinance Rate+1% per annum). The interest rate charged for fiscal year 2018 was 3% (2017 : 3%). The due balance is payable bi-annually.
A facility for issuance of guarantees (LG) is available from Askari Bank Limited upto Rs. 100 million (2017 : Rs. 100 million), availed Rs. 9.289 million. (2017 : Rs. 7.977 million)
A sublimit of export refinance amounting to $ 3 million under FE 25 is available from Askari Bank Limited (2017 : $ 3 million)
A sublimit of LG is available from Askari Bank Limited for corporate credit cards upto Rs. 6 million (2017 : Rs. 6 million)
The company has a running finance facility from Askari Bank Limited as a sublimit to LG facility upto Rs. 75 million (2017 : 75 million) for working capital requirement.It carries markup at the rate of 3 month Kibor + 2%. (2017 : 3 month Kibor + 2%). As at June 30, 2018 there is no balance outstanding against this facility. (2017: Nil)The facilities from Askari Bank Limited are secured by way of 1st ranking Pari Passu charge over the Company’s all present and future current assets amounting to Rs. 767 million (2017: Rs. 634 million) and 1st ranking Pari Passu charge of Rs. 767 million over fixed assets of the company (2017: Rs. 680.8 million).The facilities from Askari bank are secured by way of 1st equitable mortgage over 9 Kanal, 2 Kanal and 16 Marla propreties, all located at Ghazi road, Lahore Cantt.The facilities from Askari bank are also secured by way of Personal Guarantees (PG’s) of directors of the company excluding independent directors.
Notes to the AccountsFor the year ended June 30, 2018
2018 2017
Rupees in ‘000’22. TRADE AND OTHER PAYABLES
Creditors 27,908 39,281 Accrued liabilities 330,167 195,984 Interest accrued - secured 7,646 12,200 Due to related parties 22.1 99,359 101,355 Withholding tax 16,883 14,098 Sales Tax Payable - 1,226 Provident fund payable 21,013 13,718 Other payables 441 1,567
503,417 379,429
ANNUAL REPORT 2018 77
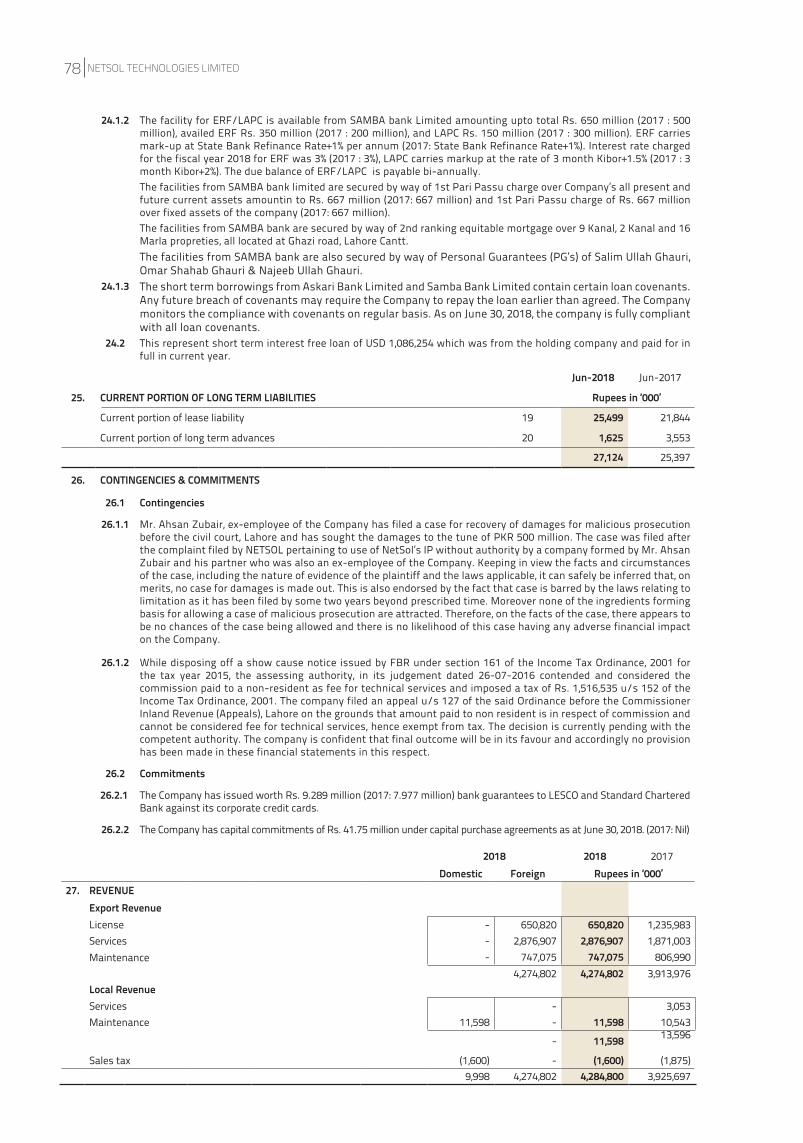
25. CURRENT PORTION OF LONG TERM LIABILITIES
Current portion of lease liability 19 25,499 21,844
Current portion of long term advances 20 1,625 3,553
27,124 25,397
26. CONTINGENCIES & COMMITMENTS
26.1 Contingencies
26.1.1 Mr. Ahsan Zubair, ex-employee of the Company has filed a case for recovery of damages for malicious prosecution before the civil court, Lahore and has sought the damages to the tune of PKR 500 million. The case was filed after the complaint filed by NETSOL pertaining to use of NetSol’s IP without authority by a company formed by Mr. Ahsan Zubair and his partner who was also an ex-employee of the Company. Keeping in view the facts and circumstances of the case, including the nature of evidence of the plaintiff and the laws applicable, it can safely be inferred that, on merits, no case for damages is made out. This is also endorsed by the fact that case is barred by the laws relating to limitation as it has been filed by some two years beyond prescribed time. Moreover none of the ingredients forming basis for allowing a case of malicious prosecution are attracted. Therefore, on the facts of the case, there appears to be no chances of the case being allowed and there is no likelihood of this case having any adverse financial impact on the Company.
26.1.2 While disposing off a show cause notice issued by FBR under section 161 of the Income Tax Ordinance, 2001 for the tax year 2015, the assessing authority, in its judgement dated 26-07-2016 contended and considered the commission paid to a non-resident as fee for technical services and imposed a tax of Rs. 1,516,535 u/s 152 of the Income Tax Ordinance, 2001. The company filed an appeal u/s 127 of the said Ordinance before the Commissioner Inland Revenue (Appeals), Lahore on the grounds that amount paid to non resident is in respect of commission and cannot be considered fee for technical services, hence exempt from tax. The decision is currently pending with the competent authority. The company is confident that final outcome will be in its favour and accordingly no provision has been made in these financial statements in this respect.
26.2 Commitments
26.2.1 The Company has issued worth Rs. 9.289 million (2017: 7.977 million) bank guarantees to LESCO and Standard Chartered Bank against its corporate credit cards.
26.2.2 The Company has capital commitments of Rs. 41.75 million under capital purchase agreements as at June 30, 2018. (2017: Nil)
Jun-2018 Jun-2017
Rupees in ‘000’
2018 2018 2017Domestic Foreign Rupees in ‘000’
27. REVENUEExport RevenueLicense - 650,820 650,820 1,235,983 Services - 2,876,907 2,876,907 1,871,003 Maintenance - 747,075 747,075 806,990
4,274,802 4,274,802 3,913,976 Local RevenueServices - 3,053 Maintenance 11,598 - 11,598 10,543
- 11,598 13,596
Sales tax (1,600) - (1,600) (1,875)9,998 4,274,802 4,284,800 3,925,697
24.1.2 The facility for ERF/LAPC is available from SAMBA bank Limited amounting upto total Rs. 650 million (2017 : 500 million), availed ERF Rs. 350 million (2017 : 200 million), and LAPC Rs. 150 million (2017 : 300 million). ERF carries mark-up at State Bank Refinance Rate+1% per annum (2017: State Bank Refinance Rate+1%). Interest rate charged for the fiscal year 2018 for ERF was 3% (2017 : 3%), LAPC carries markup at the rate of 3 month Kibor+1.5% (2017 : 3 month Kibor+2%). The due balance of ERF/LAPC is payable bi-annually.The facilities from SAMBA bank limited are secured by way of 1st Pari Passu charge over Company’s all present and future current assets amountin to Rs. 667 million (2017: 667 million) and 1st Pari Passu charge of Rs. 667 million over fixed assets of the company (2017: 667 million). The facilities from SAMBA bank are secured by way of 2nd ranking equitable mortgage over 9 Kanal, 2 Kanal and 16 Marla propreties, all located at Ghazi road, Lahore Cantt.The facilities from SAMBA bank are also secured by way of Personal Guarantees (PG’s) of Salim Ullah Ghauri, Omar Shahab Ghauri & Najeeb Ullah Ghauri.
24.1.3 The short term borrowings from Askari Bank Limited and Samba Bank Limited contain certain loan covenants. Any future breach of covenants may require the Company to repay the loan earlier than agreed. The Company monitors the compliance with covenants on regular basis. As on June 30, 2018, the company is fully compliant with all loan covenants.
24.2 This represent short term interest free loan of USD 1,086,254 which was from the holding company and paid for in full in current year.
NETSOL TECHNOLOGIES LIMITED78
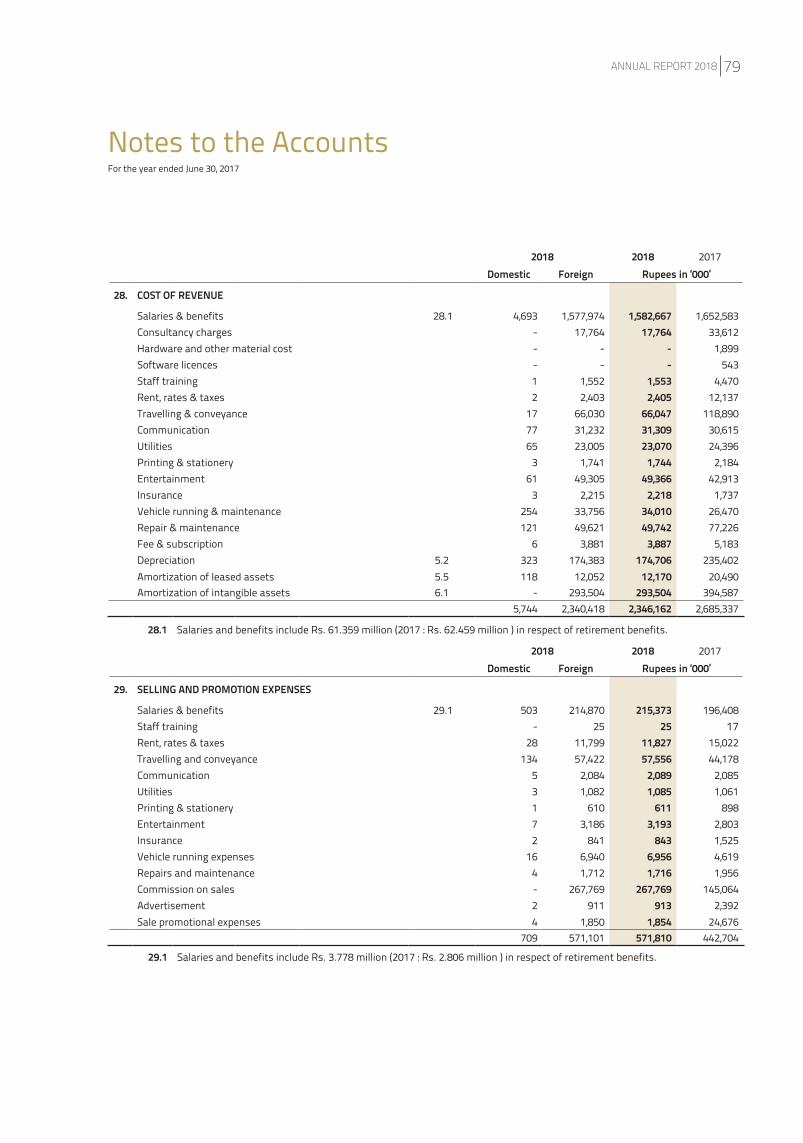
2018 2018 2017Domestic Foreign Rupees in ‘000’
28. COST OF REVENUE
Salaries & benefits 28.1 4,693 1,577,974 1,582,667 1,652,583 Consultancy charges - 17,764 17,764 33,612 Hardware and other material cost - - - 1,899 Software licences - - - 543 Staff training 1 1,552 1,553 4,470 Rent, rates & taxes 2 2,403 2,405 12,137 Travelling & conveyance 17 66,030 66,047 118,890 Communication 77 31,232 31,309 30,615 Utilities 65 23,005 23,070 24,396 Printing & stationery 3 1,741 1,744 2,184 Entertainment 61 49,305 49,366 42,913 Insurance 3 2,215 2,218 1,737 Vehicle running & maintenance 254 33,756 34,010 26,470 Repair & maintenance 121 49,621 49,742 77,226 Fee & subscription 6 3,881 3,887 5,183 Depreciation 5.2 323 174,383 174,706 235,402 Amortization of leased assets 5.5 118 12,052 12,170 20,490 Amortization of intangible assets 6.1 - 293,504 293,504 394,587
5,744 2,340,418 2,346,162 2,685,337
28.1 Salaries and benefits include Rs. 61.359 million (2017 : Rs. 62.459 million ) in respect of retirement benefits.
2018 2018 2017Domestic Foreign Rupees in ‘000’
29. SELLING AND PROMOTION EXPENSES
Salaries & benefits 29.1 503 214,870 215,373 196,408 Staff training - 25 25 17 Rent, rates & taxes 28 11,799 11,827 15,022 Travelling and conveyance 134 57,422 57,556 44,178 Communication 5 2,084 2,089 2,085 Utilities 3 1,082 1,085 1,061 Printing & stationery 1 610 611 898 Entertainment 7 3,186 3,193 2,803 Insurance 2 841 843 1,525 Vehicle running expenses 16 6,940 6,956 4,619 Repairs and maintenance 4 1,712 1,716 1,956 Commission on sales - 267,769 267,769 145,064 Advertisement 2 911 913 2,392 Sale promotional expenses 4 1,850 1,854 24,676
709 571,101 571,810 442,704
29.1 Salaries and benefits include Rs. 3.778 million (2017 : Rs. 2.806 million ) in respect of retirement benefits.
Notes to the AccountsFor the year ended June 30, 2017
ANNUAL REPORT 2018 79
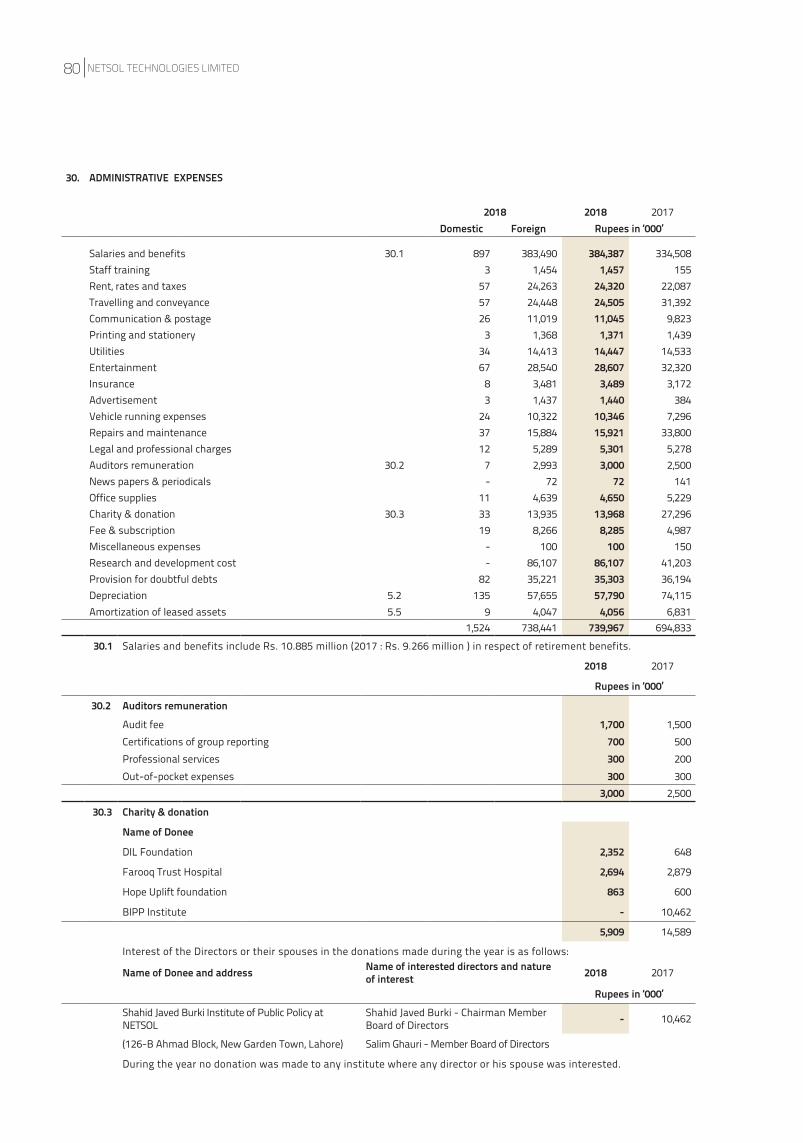
30. ADMINISTRATIVE EXPENSES
2018 2018 2017Domestic Foreign Rupees in ‘000’
Salaries and benefits 30.1 897 383,490 384,387 334,508 Staff training 3 1,454 1,457 155 Rent, rates and taxes 57 24,263 24,320 22,087 Travelling and conveyance 57 24,448 24,505 31,392 Communication & postage 26 11,019 11,045 9,823 Printing and stationery 3 1,368 1,371 1,439 Utilities 34 14,413 14,447 14,533 Entertainment 67 28,540 28,607 32,320 Insurance 8 3,481 3,489 3,172 Advertisement 3 1,437 1,440 384 Vehicle running expenses 24 10,322 10,346 7,296 Repairs and maintenance 37 15,884 15,921 33,800 Legal and professional charges 12 5,289 5,301 5,278 Auditors remuneration 30.2 7 2,993 3,000 2,500 News papers & periodicals - 72 72 141 Office supplies 11 4,639 4,650 5,229 Charity & donation 30.3 33 13,935 13,968 27,296 Fee & subscription 19 8,266 8,285 4,987 Miscellaneous expenses - 100 100 150 Research and development cost - 86,107 86,107 41,203 Provision for doubtful debts 82 35,221 35,303 36,194 Depreciation 5.2 135 57,655 57,790 74,115 Amortization of leased assets 5.5 9 4,047 4,056 6,831
1,524 738,441 739,967 694,833 30.1 Salaries and benefits include Rs. 10.885 million (2017 : Rs. 9.266 million ) in respect of retirement benefits.
2018 2017
Rupees in ‘000’
30.2 Auditors remunerationAudit fee 1,700 1,500 Certifications of group reporting 700 500 Professional services 300 200 Out-of-pocket expenses 300 300
3,000 2,500
30.3 Charity & donation
Name of Donee
DIL Foundation 2,352 648
Farooq Trust Hospital 2,694 2,879
Hope Uplift foundation 863 600
BIPP Institute - 10,462
5,909 14,589
Interest of the Directors or their spouses in the donations made during the year is as follows:
Name of Donee and address Name of interested directors and nature of interest 2018 2017
Rupees in ‘000’Shahid Javed Burki Institute of Public Policy at NETSOL
Shahid Javed Burki - Chairman Member Board of Directors - 10,462
(126-B Ahmad Block, New Garden Town, Lahore) Salim Ghauri - Member Board of Directors
During the year no donation was made to any institute where any director or his spouse was interested.
NETSOL TECHNOLOGIES LIMITED80
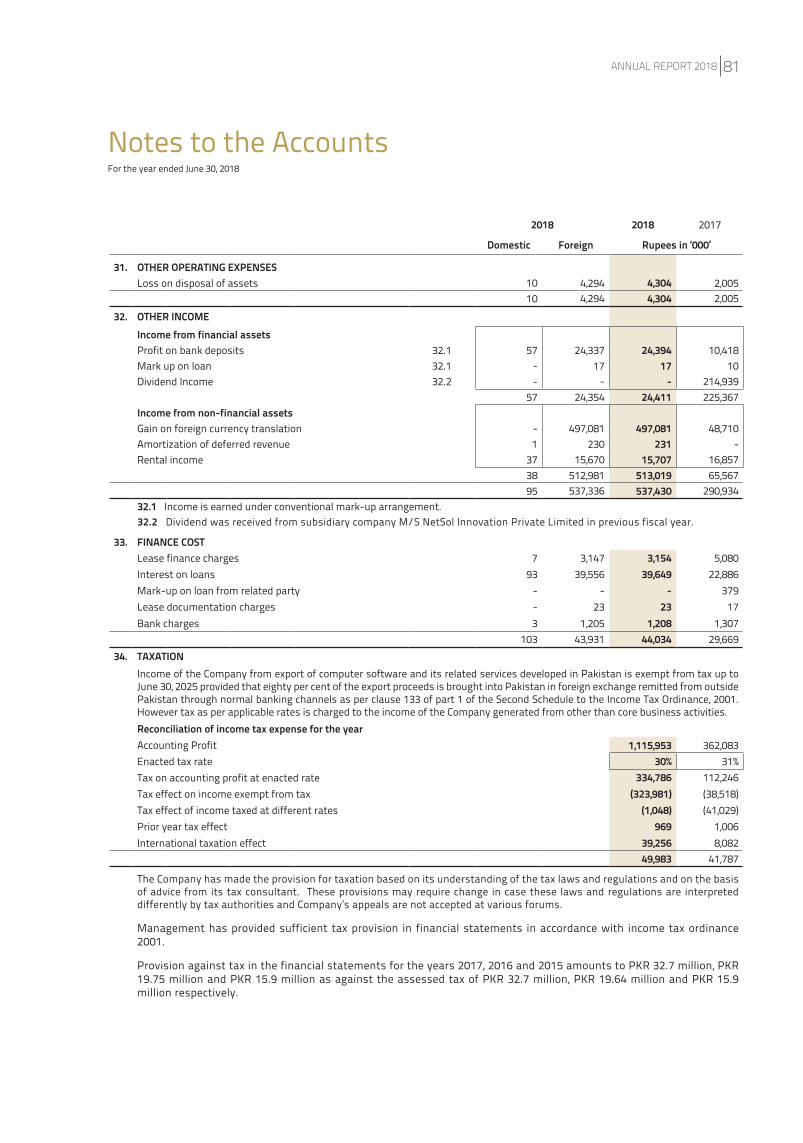
2018 2018 2017
Domestic Foreign Rupees in ‘000’
31. OTHER OPERATING EXPENSESLoss on disposal of assets 10 4,294 4,304 2,005
10 4,294 4,304 2,005 32. OTHER INCOME
Income from financial assetsProfit on bank deposits 32.1 57 24,337 24,394 10,418 Mark up on loan 32.1 - 17 17 10 Dividend Income 32.2 - - - 214,939
57 24,354 24,411 225,367 Income from non-financial assetsGain on foreign currency translation - 497,081 497,081 48,710 Amortization of deferred revenue 1 230 231 - Rental income 37 15,670 15,707 16,857
38 512,981 513,019 65,567 95 537,336 537,430 290,934
32.1 Income is earned under conventional mark-up arrangement.32.2 Dividend was received from subsidiary company M/S NetSol Innovation Private Limited in previous fiscal year.
33. FINANCE COSTLease finance charges 7 3,147 3,154 5,080 Interest on loans 93 39,556 39,649 22,886 Mark-up on loan from related party - - - 379 Lease documentation charges - 23 23 17 Bank charges 3 1,205 1,208 1,307
103 43,931 44,034 29,669 34. TAXATION
Income of the Company from export of computer software and its related services developed in Pakistan is exempt from tax up to June 30, 2025 provided that eighty per cent of the export proceeds is brought into Pakistan in foreign exchange remitted from outside Pakistan through normal banking channels as per clause 133 of part 1 of the Second Schedule to the Income Tax Ordinance, 2001. However tax as per applicable rates is charged to the income of the Company generated from other than core business activities.Reconciliation of income tax expense for the yearAccounting Profit 1,115,953 362,083 Enacted tax rate 30% 31%Tax on accounting profit at enacted rate 334,786 112,246 Tax effect on income exempt from tax (323,981) (38,518)Tax effect of income taxed at different rates (1,048) (41,029)Prior year tax effect 969 1,006 International taxation effect 39,256 8,082
49,983 41,787
The Company has made the provision for taxation based on its understanding of the tax laws and regulations and on the basis of advice from its tax consultant. These provisions may require change in case these laws and regulations are interpreted differently by tax authorities and Company’s appeals are not accepted at various forums.
Management has provided sufficient tax provision in financial statements in accordance with income tax ordinance 2001.
Provision against tax in the financial statements for the years 2017, 2016 and 2015 amounts to PKR 32.7 million, PKR 19.75 million and PKR 15.9 million as against the assessed tax of PKR 32.7 million, PKR 19.64 million and PKR 15.9 million respectively.
Notes to the AccountsFor the year ended June 30, 2018
ANNUAL REPORT 2018 81
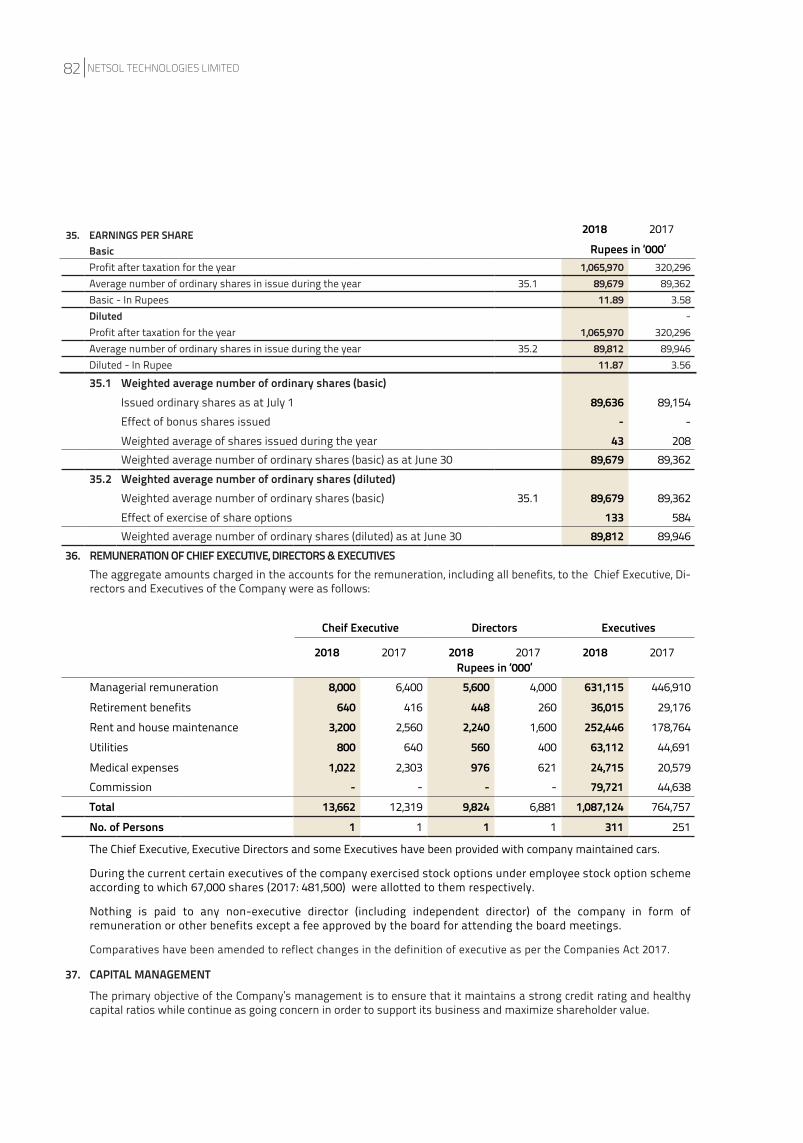
35.1 Weighted average number of ordinary shares (basic)Issued ordinary shares as at July 1 89,636 89,154 Effect of bonus shares issued - - Weighted average of shares issued during the year 43 208 Weighted average number of ordinary shares (basic) as at June 30 89,679 89,362
35.2 Weighted average number of ordinary shares (diluted)Weighted average number of ordinary shares (basic) 35.1 89,679 89,362 Effect of exercise of share options 133 584 Weighted average number of ordinary shares (diluted) as at June 30 89,812 89,946
36. REMUNERATION OF CHIEF EXECUTIVE, DIRECTORS & EXECUTIVESThe aggregate amounts charged in the accounts for the remuneration, including all benefits, to the Chief Executive, Di-rectors and Executives of the Company were as follows:
Cheif Executive Directors Executives
2018 2017 2018 2017 2018 2017Rupees in ‘000’
Managerial remuneration 8,000 6,400 5,600 4,000 631,115 446,910
Retirement benefits 640 416 448 260 36,015 29,176 Rent and house maintenance 3,200 2,560 2,240 1,600 252,446 178,764 Utilities 800 640 560 400 63,112 44,691
Medical expenses 1,022 2,303 976 621 24,715 20,579 Commission - - - - 79,721 44,638Total 13,662 12,319 9,824 6,881 1,087,124 764,757
No. of Persons 1 1 1 1 311 251
The Chief Executive, Executive Directors and some Executives have been provided with company maintained cars.
During the current certain executives of the company exercised stock options under employee stock option scheme according to which 67,000 shares (2017: 481,500) were allotted to them respectively.
Nothing is paid to any non-executive director (including independent director) of the company in form of remuneration or other benefits except a fee approved by the board for attending the board meetings.
Comparatives have been amended to reflect changes in the definition of executive as per the Companies Act 2017.
37. CAPITAL MANAGEMENT
The primary objective of the Company’s management is to ensure that it maintains a strong credit rating and healthy capital ratios while continue as going concern in order to support its business and maximize shareholder value.
35. EARNINGS PER SHAREBasicProfit after taxation for the year 1,065,970 320,296 Average number of ordinary shares in issue during the year 35.1 89,679 89,362Basic - In Rupees 11.89 3.58Diluted -Profit after taxation for the year 1,065,970 320,296 Average number of ordinary shares in issue during the year 35.2 89,812 89,946Diluted - In Rupee 11.87 3.56
2018 2017
Rupees in ‘000’
NETSOL TECHNOLOGIES LIMITED82
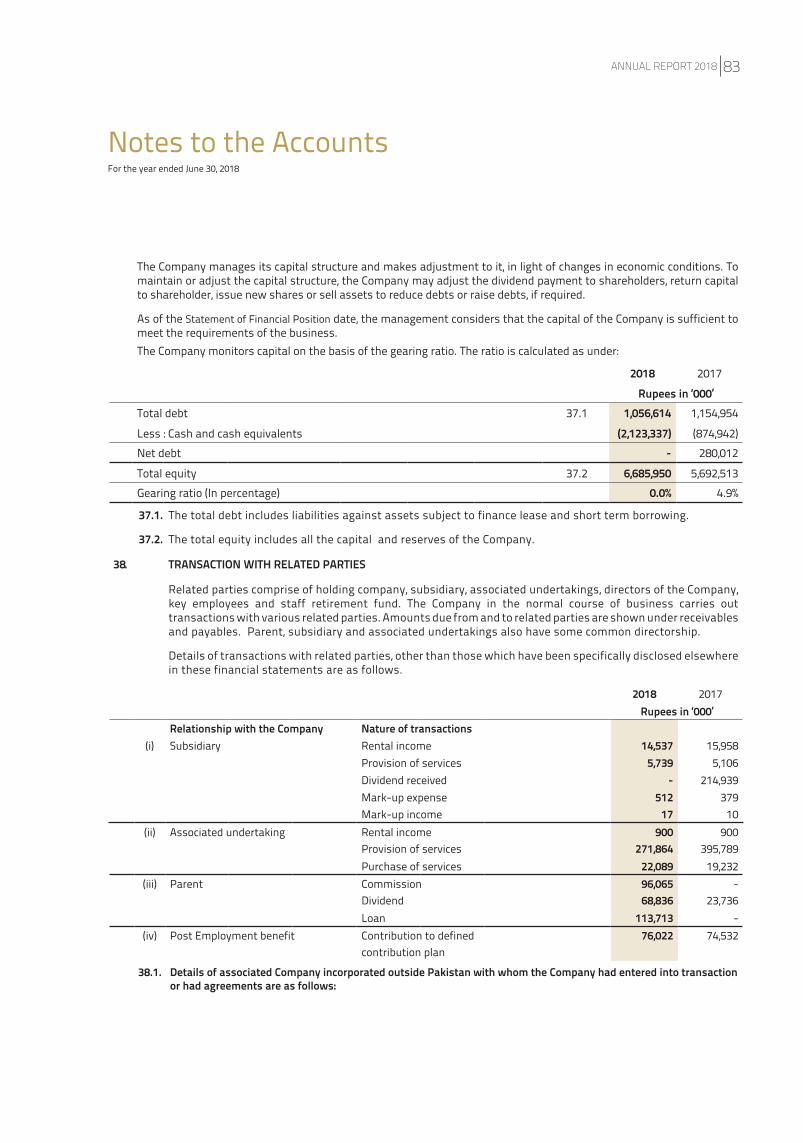
2018 2017Rupees in ‘000’
Relationship with the Company Nature of transactions(i) Subsidiary Rental income 14,537 15,958
Provision of services 5,739 5,106 Dividend received - 214,939 Mark-up expense 512 379 Mark-up income 17 10
(ii) Associated undertaking Rental income 900 900 Provision of services 271,864 395,789 Purchase of services 22,089 19,232
(iii) Parent Commission 96,065 - Dividend 68,836 23,736 Loan 113,713 -
(iv) Post Employment benefit Contribution to defined 76,022 74,532contribution plan
38.1. Details of associated Company incorporated outside Pakistan with whom the Company had entered into transaction or had agreements are as follows:
2018 2017
Rupees in ‘000’Total debt 37.1 1,056,614 1,154,954
Less : Cash and cash equivalents (2,123,337) (874,942)Net debt - 280,012
Total equity 37.2 6,685,950 5,692,513 Gearing ratio (In percentage) 0.0% 4.9%
37.1. The total debt includes liabilities against assets subject to finance lease and short term borrowing.
37.2. The total equity includes all the capital and reserves of the Company.
38. TRANSACTION WITH RELATED PARTIES
Related parties comprise of holding company, subsidiary, associated undertakings, directors of the Company, key employees and staff retirement fund. The Company in the normal course of business carries out transactions with various related parties. Amounts due from and to related parties are shown under receivables and payables. Parent, subsidiary and associated undertakings also have some common directorship.
Details of transactions with related parties, other than those which have been specifically disclosed elsewhere in these financial statements are as follows.
Notes to the AccountsFor the year ended June 30, 2018
The Company manages its capital structure and makes adjustment to it, in light of changes in economic conditions. To maintain or adjust the capital structure, the Company may adjust the dividend payment to shareholders, return capital to shareholder, issue new shares or sell assets to reduce debts or raise debts, if required.
As of the Statement of Financial Position date, the management considers that the capital of the Company is sufficient to meet the requirements of the business.The Company monitors capital on the basis of the gearing ratio. The ratio is calculated as under:
ANNUAL REPORT 2018 83
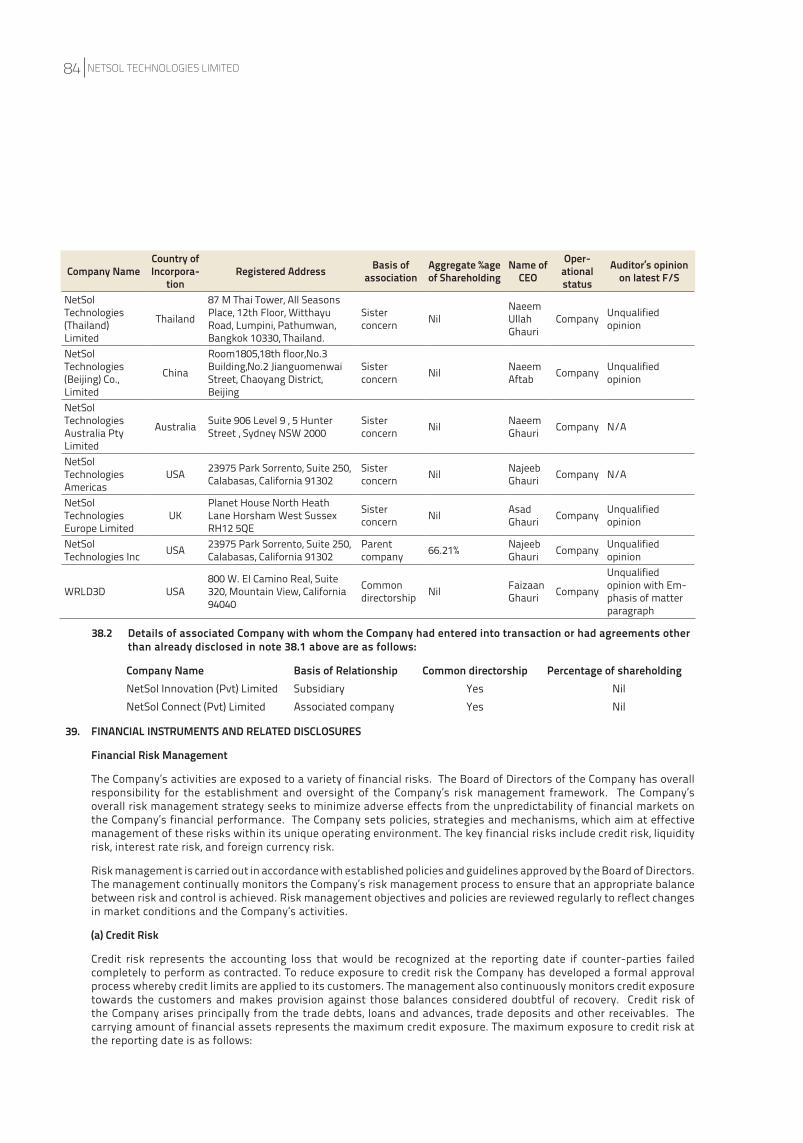
39. FINANCIAL INSTRUMENTS AND RELATED DISCLOSURES
Financial Risk Management
The Company’s activities are exposed to a variety of financial risks. The Board of Directors of the Company has overall responsibility for the establishment and oversight of the Company’s risk management framework. The Company’s overall risk management strategy seeks to minimize adverse effects from the unpredictability of financial markets on the Company’s financial performance. The Company sets policies, strategies and mechanisms, which aim at effective management of these risks within its unique operating environment. The key financial risks include credit risk, liquidity risk, interest rate risk, and foreign currency risk.
Risk management is carried out in accordance with established policies and guidelines approved by the Board of Directors. The management continually monitors the Company’s risk management process to ensure that an appropriate balance between risk and control is achieved. Risk management objectives and policies are reviewed regularly to reflect changes in market conditions and the Company’s activities.
(a) Credit Risk
Credit risk represents the accounting loss that would be recognized at the reporting date if counter-parties failed completely to perform as contracted. To reduce exposure to credit risk the Company has developed a formal approval process whereby credit limits are applied to its customers. The management also continuously monitors credit exposure towards the customers and makes provision against those balances considered doubtful of recovery. Credit risk of the Company arises principally from the trade debts, loans and advances, trade deposits and other receivables. The carrying amount of financial assets represents the maximum credit exposure. The maximum exposure to credit risk at the reporting date is as follows:
Company NameCountry of Incorpora-
tionRegistered Address Basis of
associationAggregate %age of Shareholding
Name of CEO
Oper-ational status
Auditor’s opinion on latest F/S
NetSol Technologies (Thailand) Limited
Thailand
87 M Thai Tower, All Seasons Place, 12th Floor, Witthayu Road, Lumpini, Pathumwan, Bangkok 10330, Thailand.
Sister concern Nil
Naeem Ullah Ghauri
Company Unqualified opinion
NetSol Technologies (Beijing) Co., Limited
China
Room1805,18th floor,No.3 Building,No.2 Jianguomenwai Street, Chaoyang District, Beijing
Sister concern Nil Naeem
Aftab Company Unqualified opinion
NetSol Technologies Australia Pty Limited
Australia Suite 906 Level 9 , 5 Hunter Street , Sydney NSW 2000
Sister concern Nil Naeem
Ghauri Company N/A
NetSol Technologies Americas
USA 23975 Park Sorrento, Suite 250, Calabasas, California 91302
Sister concern Nil Najeeb
Ghauri Company N/A
NetSol Technologies Europe Limited
UKPlanet House North Heath Lane Horsham West Sussex RH12 5QE
Sister concern Nil Asad
Ghauri Company Unqualified opinion
NetSol Technologies Inc USA 23975 Park Sorrento, Suite 250,
Calabasas, California 91302Parent company 66.21% Najeeb
Ghauri Company Unqualified opinion
WRLD3D USA800 W. EI Camino Real, Suite 320, Mountain View, California 94040
Common directorship Nil Faizaan
Ghauri Company
Unqualified opinion with Em-phasis of matter paragraph
Company Name Basis of Relationship Common directorship Percentage of shareholding NetSol Innovation (Pvt) Limited Subsidiary Yes NilNetSol Connect (Pvt) Limited Associated company Yes Nil
38.2 Details of associated Company with whom the Company had entered into transaction or had agreements other than already disclosed in note 38.1 above are as follows:
NETSOL TECHNOLOGIES LIMITED84
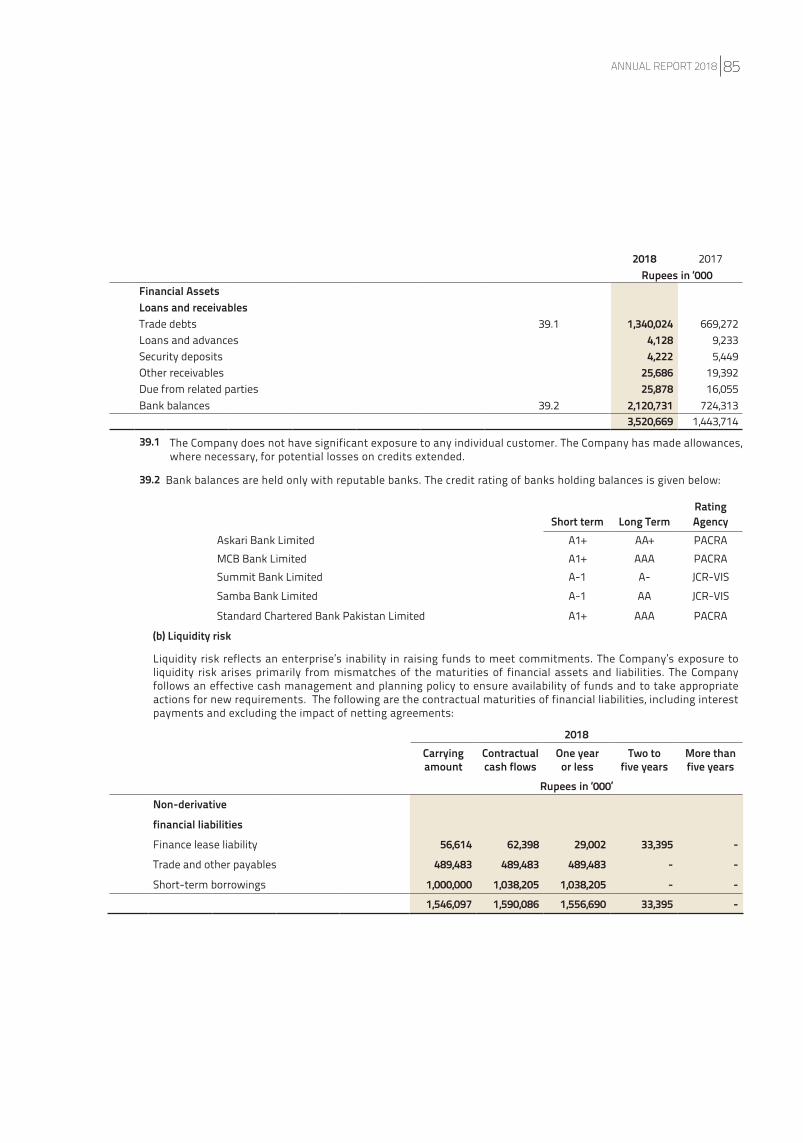
RatingShort term Long Term Agency
Askari Bank Limited A1+ AA+ PACRAMCB Bank Limited A1+ AAA PACRASummit Bank Limited A-1 A- JCR-VISSamba Bank Limited A-1 AA JCR-VIS
Standard Chartered Bank Pakistan Limited A1+ AAA PACRA
(b) Liquidity risk
Liquidity risk reflects an enterprise’s inability in raising funds to meet commitments. The Company’s exposure to liquidity risk arises primarily from mismatches of the maturities of financial assets and liabilities. The Company follows an effective cash management and planning policy to ensure availability of funds and to take appropriate actions for new requirements. The following are the contractual maturities of financial liabilities, including interest payments and excluding the impact of netting agreements:
2018Carryingamount
Contractualcash flows
One yearor less
Two tofive years
More thanfive years
Rupees in ‘000’Non-derivative
financial liabilitiesFinance lease liability 56,614 62,398 29,002 33,395 - Trade and other payables 489,483 489,483 489,483 - -
Short-term borrowings 1,000,000 1,038,205 1,038,205 - - 1,546,097 1,590,086 1,556,690 33,395 -
2018 2017Rupees in ‘000
Financial Assets Loans and receivablesTrade debts 39.1 1,340,024 669,272 Loans and advances 4,128 9,233 Security deposits 4,222 5,449 Other receivables 25,686 19,392 Due from related parties 25,878 16,055 Bank balances 39.2 2,120,731 724,313
3,520,669 1,443,714
39.1 The Company does not have significant exposure to any individual customer. The Company has made allowances, where necessary, for potential losses on credits extended.
39.2 Bank balances are held only with reputable banks. The credit rating of banks holding balances is given below:
ANNUAL REPORT 2018 85
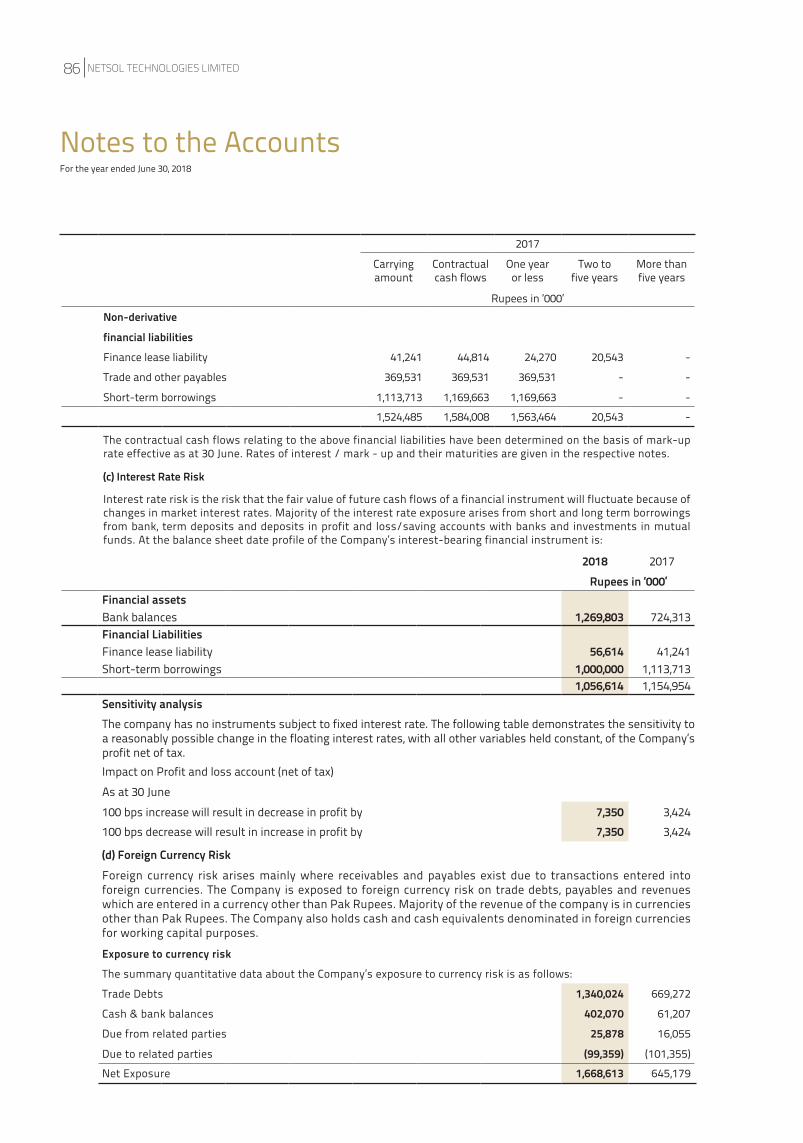
2017
Carryingamount
Contractualcash flows
One yearor less
Two tofive years
More thanfive years
Rupees in ‘000’Non-derivative
financial liabilitiesFinance lease liability 41,241 44,814 24,270 20,543 -
Trade and other payables 369,531 369,531 369,531 - -
Short-term borrowings 1,113,713 1,169,663 1,169,663 - -
1,524,485 1,584,008 1,563,464 20,543 -
The contractual cash flows relating to the above financial liabilities have been determined on the basis of mark-up rate effective as at 30 June. Rates of interest / mark - up and their maturities are given in the respective notes.
(c) Interest Rate Risk
Interest rate risk is the risk that the fair value of future cash flows of a financial instrument will fluctuate because of changes in market interest rates. Majority of the interest rate exposure arises from short and long term borrowings from bank, term deposits and deposits in profit and loss/saving accounts with banks and investments in mutual funds. At the balance sheet date profile of the Company’s interest-bearing financial instrument is:
2018 2017Rupees in ‘000’
Financial assetsBank balances 1,269,803 724,313Financial LiabilitiesFinance lease liability 56,614 41,241 Short-term borrowings 1,000,000 1,113,713
1,056,614 1,154,954 Sensitivity analysisThe company has no instruments subject to fixed interest rate. The following table demonstrates the sensitivity to a reasonably possible change in the floating interest rates, with all other variables held constant, of the Company’s profit net of tax.Impact on Profit and loss account (net of tax)As at 30 June100 bps increase will result in decrease in profit by 7,350 3,424 100 bps decrease will result in increase in profit by 7,350 3,424
(d) Foreign Currency RiskForeign currency risk arises mainly where receivables and payables exist due to transactions entered into foreign currencies. The Company is exposed to foreign currency risk on trade debts, payables and revenues which are entered in a currency other than Pak Rupees. Majority of the revenue of the company is in currencies other than Pak Rupees. The Company also holds cash and cash equivalents denominated in foreign currencies for working capital purposes.
Exposure to currency riskThe summary quantitative data about the Company’s exposure to currency risk is as follows:
Trade Debts 1,340,024 669,272
Cash & bank balances 402,070 61,207
Due from related parties 25,878 16,055
Due to related parties (99,359) (101,355)
Net Exposure 1,668,613 645,179
Notes to the AccountsFor the year ended June 30, 2018
NETSOL TECHNOLOGIES LIMITED86
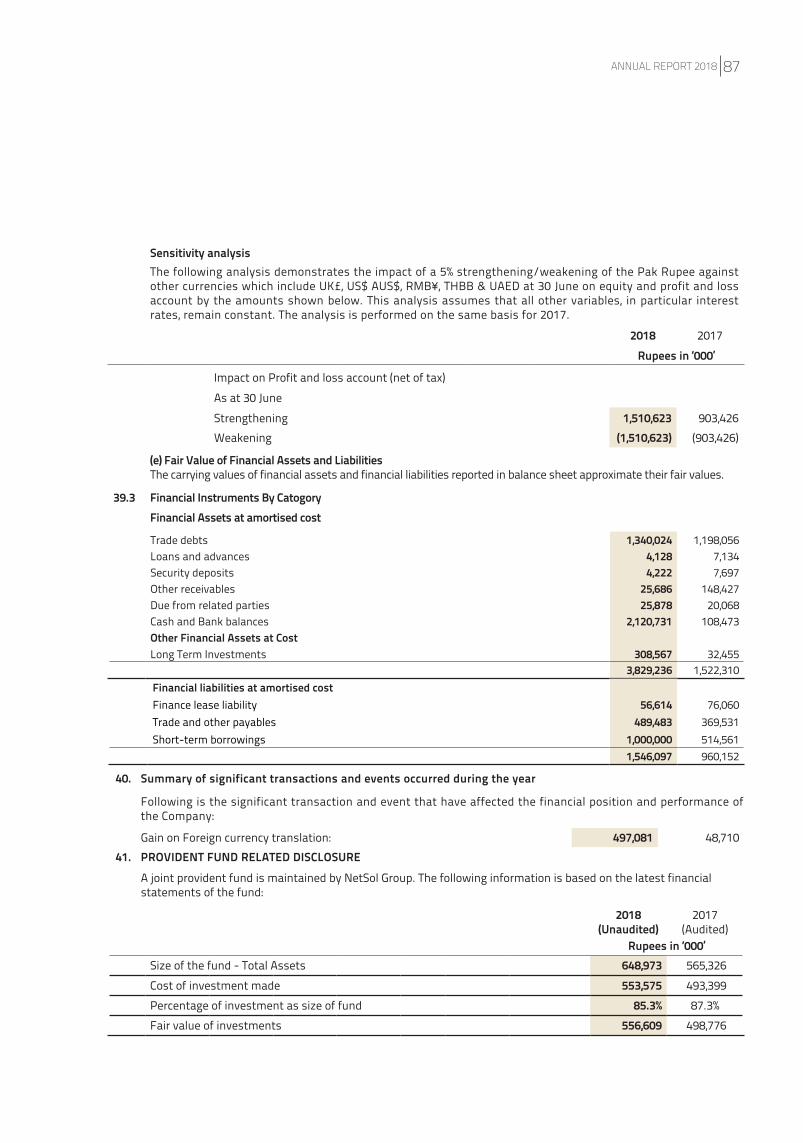
Trade debts 1,340,024 1,198,056 Loans and advances 4,128 7,134 Security deposits 4,222 7,697 Other receivables 25,686 148,427 Due from related parties 25,878 20,068 Cash and Bank balances 2,120,731 108,473 Other Financial Assets at CostLong Term Investments 308,567 32,455
3,829,236 1,522,310 Financial liabilities at amortised costFinance lease liability 56,614 76,060 Trade and other payables 489,483 369,531 Short-term borrowings 1,000,000 514,561
1,546,097 960,152
Impact on Profit and loss account (net of tax)As at 30 JuneStrengthening 1,510,623 903,426 Weakening (1,510,623) (903,426)
(e) Fair Value of Financial Assets and LiabilitiesThe carrying values of financial assets and financial liabilities reported in balance sheet approximate their fair values.
39.3 Financial Instruments By CatogoryFinancial Assets at amortised cost
2018 2017Rupees in ‘000’
2018(Unaudited)
2017(Audited)
Rupees in ‘000’Size of the fund - Total Assets 648,973 565,326 Cost of investment made 553,575 493,399 Percentage of investment as size of fund 85.3% 87.3%Fair value of investments 556,609 498,776
40. Summary of significant transactions and events occurred during the year
Following is the significant transaction and event that have affected the financial position and performance of the Company:
Gain on Foreign currency translation: 497,081 48,710 41. PROVIDENT FUND RELATED DISCLOSURE
A joint provident fund is maintained by NetSol Group. The following information is based on the latest financial statements of the fund:
Sensitivity analysisThe following analysis demonstrates the impact of a 5% strengthening/weakening of the Pak Rupee against other currencies which include UK£, US$ AUS$, RMB¥, THBB & UAED at 30 June on equity and profit and loss account by the amounts shown below. This analysis assumes that all other variables, in particular interest rates, remain constant. The analysis is performed on the same basis for 2017.
ANNUAL REPORT 2018 87
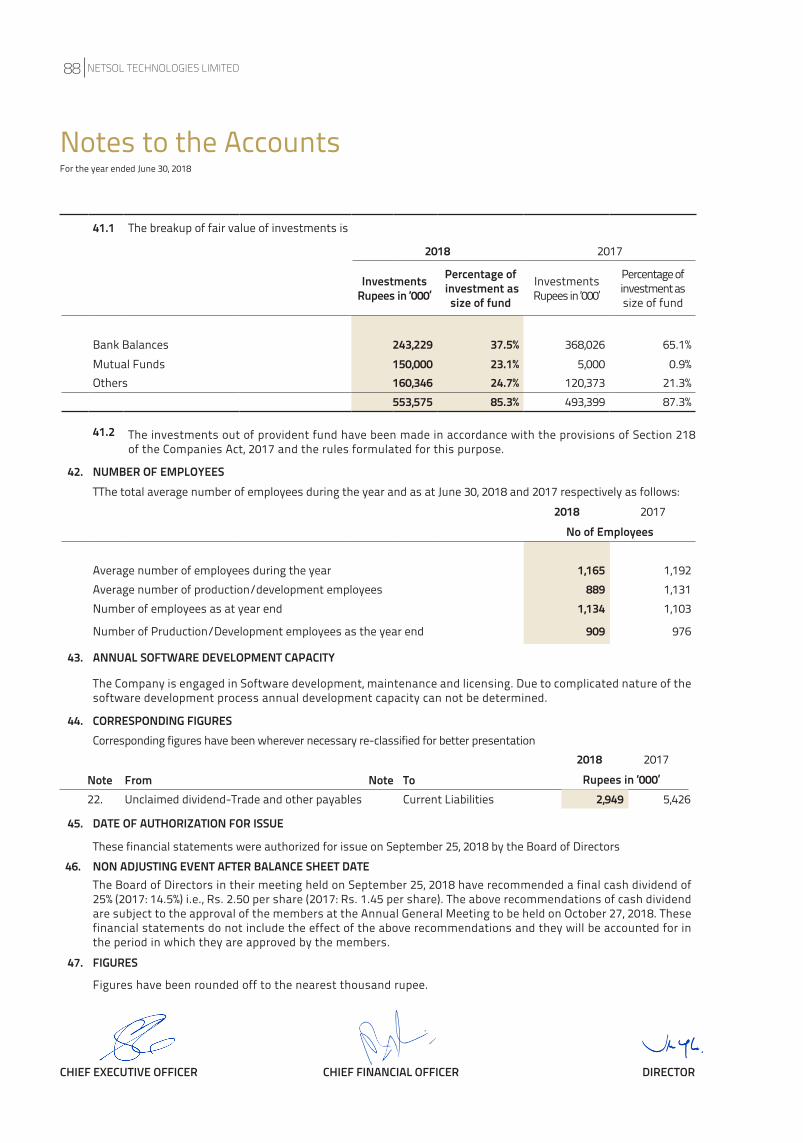
41.1 The breakup of fair value of investments is
2018 2017
Investments Rupees in ‘000’
Percentage of investment as
size of fund
Investments Rupees in ‘000’
Percentage of investment as size of fund
Bank Balances 243,229 37.5% 368,026 65.1%Mutual Funds 150,000 23.1% 5,000 0.9%Others 160,346 24.7% 120,373 21.3%
553,575 85.3% 493,399 87.3%
41.2 The investments out of provident fund have been made in accordance with the provisions of Section 218 of the Companies Act, 2017 and the rules formulated for this purpose.
42. NUMBER OF EMPLOYEESTThe total average number of employees during the year and as at June 30, 2018 and 2017 respectively as follows:
2018 2017No of Employees
Average number of employees during the year 1,165 1,192 Average number of production/development employees 889 1,131 Number of employees as at year end 1,134 1,103
Number of Pruduction/Development employees as the year end 909 976
43. ANNUAL SOFTWARE DEVELOPMENT CAPACITY
The Company is engaged in Software development, maintenance and licensing. Due to complicated nature of the software development process annual development capacity can not be determined.
44. CORRESPONDING FIGURESCorresponding figures have been wherever necessary re-classified for better presentation
45. DATE OF AUTHORIZATION FOR ISSUE
These financial statements were authorized for issue on September 25, 2018 by the Board of Directors46. NON ADJUSTING EVENT AFTER BALANCE SHEET DATE
The Board of Directors in their meeting held on September 25, 2018 have recommended a final cash dividend of 25% (2017: 14.5%) i.e., Rs. 2.50 per share (2017: Rs. 1.45 per share). The above recommendations of cash dividend are subject to the approval of the members at the Annual General Meeting to be held on October 27, 2018. These financial statements do not include the effect of the above recommendations and they will be accounted for in the period in which they are approved by the members.
47. FIGURES
Figures have been rounded off to the nearest thousand rupee.
Notes to the AccountsFor the year ended June 30, 2018
CHIEF EXECUTIVE OFFICER CHIEF FINANCIAL OFFICER DIRECTOR
2018 2017Rupees in ‘000’Note From Note To
22. Unclaimed dividend-Trade and other payables Current Liabilities 2,949 5,426
NETSOL TECHNOLOGIES LIMITED88
ANNUAL REPORT 2018 89
CONSOLIDATED FINANCIAL STATEMENTSFor the Year Ended June 30, 2018
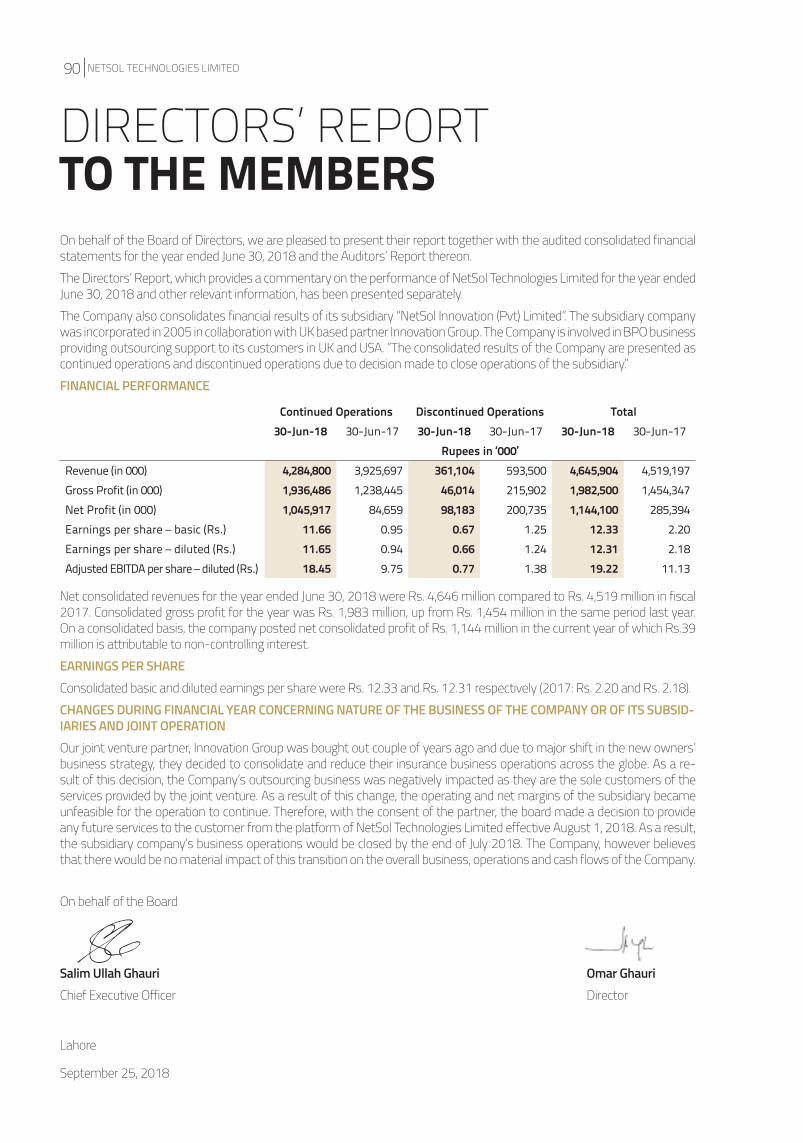
On behalf of the Board of Directors, we are pleased to present their report together with the audited consolidated financial statements for the year ended June 30, 2018 and the Auditors’ Report thereon. The Directors’ Report, which provides a commentary on the performance of NetSol Technologies Limited for the year ended June 30, 2018 and other relevant information, has been presented separately.The Company also consolidates financial results of its subsidiary “NetSol Innovation (Pvt) Limited”. The subsidiary company was incorporated in 2005 in collaboration with UK based partner Innovation Group. The Company is involved in BPO business providing outsourcing support to its customers in UK and USA. “The consolidated results of the Company are presented as continued operations and discontinued operations due to decision made to close operations of the subsidiary.”FINANCIAL PERFORMANCE
Continued Operations Discontinued Operations Total30-Jun-18 30-Jun-17 30-Jun-18 30-Jun-17 30-Jun-18 30-Jun-17
Rupees in ‘000’Revenue (in 000) 4,284,800 3,925,697 361,104 593,500 4,645,904 4,519,197Gross Profit (in 000) 1,936,486 1,238,445 46,014 215,902 1,982,500 1,454,347Net Profit (in 000) 1,045,917 84,659 98,183 200,735 1,144,100 285,394Earnings per share – basic (Rs.) 11.66 0.95 0.67 1.25 12.33 2.20Earnings per share – diluted (Rs.) 11.65 0.94 0.66 1.24 12.31 2.18Adjusted EBITDA per share – diluted (Rs.) 18.45 9.75 0.77 1.38 19.22 11.13
Net consolidated revenues for the year ended June 30, 2018 were Rs. 4,646 million compared to Rs. 4,519 million in fiscal 2017. Consolidated gross profit for the year was Rs. 1,983 million, up from Rs. 1,454 million in the same period last year. On a consolidated basis, the company posted net consolidated profit of Rs. 1,144 million in the current year of which Rs.39 million is attributable to non-controlling interest. EARNINGS PER SHAREConsolidated basic and diluted earnings per share were Rs. 12.33 and Rs. 12.31 respectively (2017: Rs. 2.20 and Rs. 2.18).CHANGES DURING FINANCIAL YEAR CONCERNING NATURE OF THE BUSINESS OF THE COMPANY OR OF ITS SUBSID-IARIES AND JOINT OPERATIONOur joint venture partner, Innovation Group was bought out couple of years ago and due to major shift in the new owners’ business strategy, they decided to consolidate and reduce their insurance business operations across the globe. As a re-sult of this decision, the Company’s outsourcing business was negatively impacted as they are the sole customers of the services provided by the joint venture. As a result of this change, the operating and net margins of the subsidiary became unfeasible for the operation to continue. Therefore, with the consent of the partner, the board made a decision to provide any future services to the customer from the platform of NetSol Technologies Limited effective August 1, 2018. As a result, the subsidiary company’s business operations would be closed by the end of July 2018. The Company, however believes that there would be no material impact of this transition on the overall business, operations and cash flows of the Company.
On behalf of the Board
Salim Ullah Ghauri Omar GhauriChief Executive Officer Director
Lahore
September 25, 2018
DIRECTORS’ REPORTTO THE MEMBERS
NETSOL TECHNOLOGIES LIMITED90
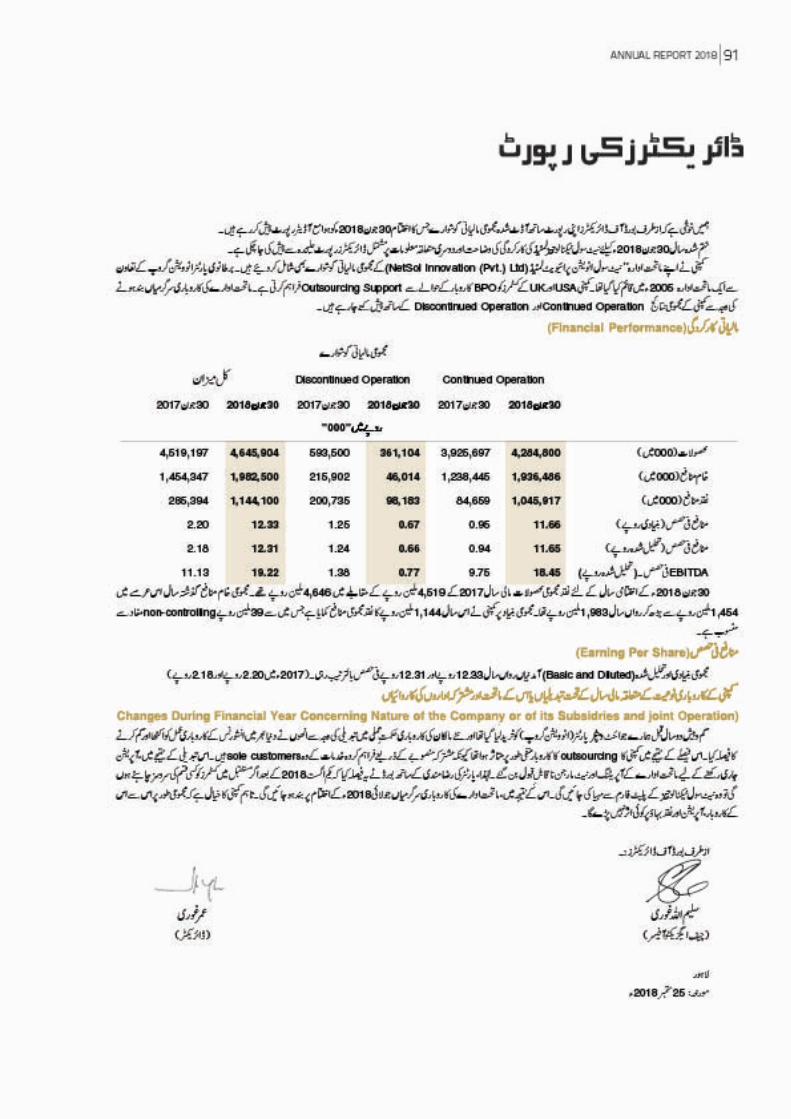
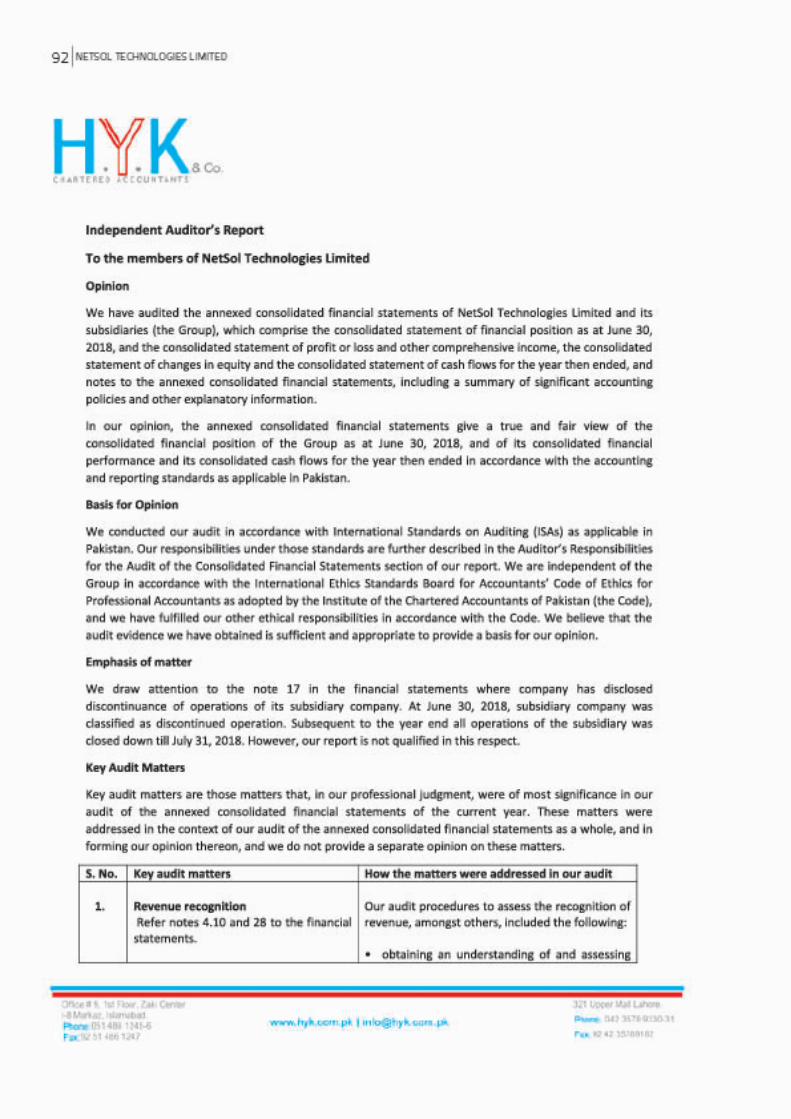
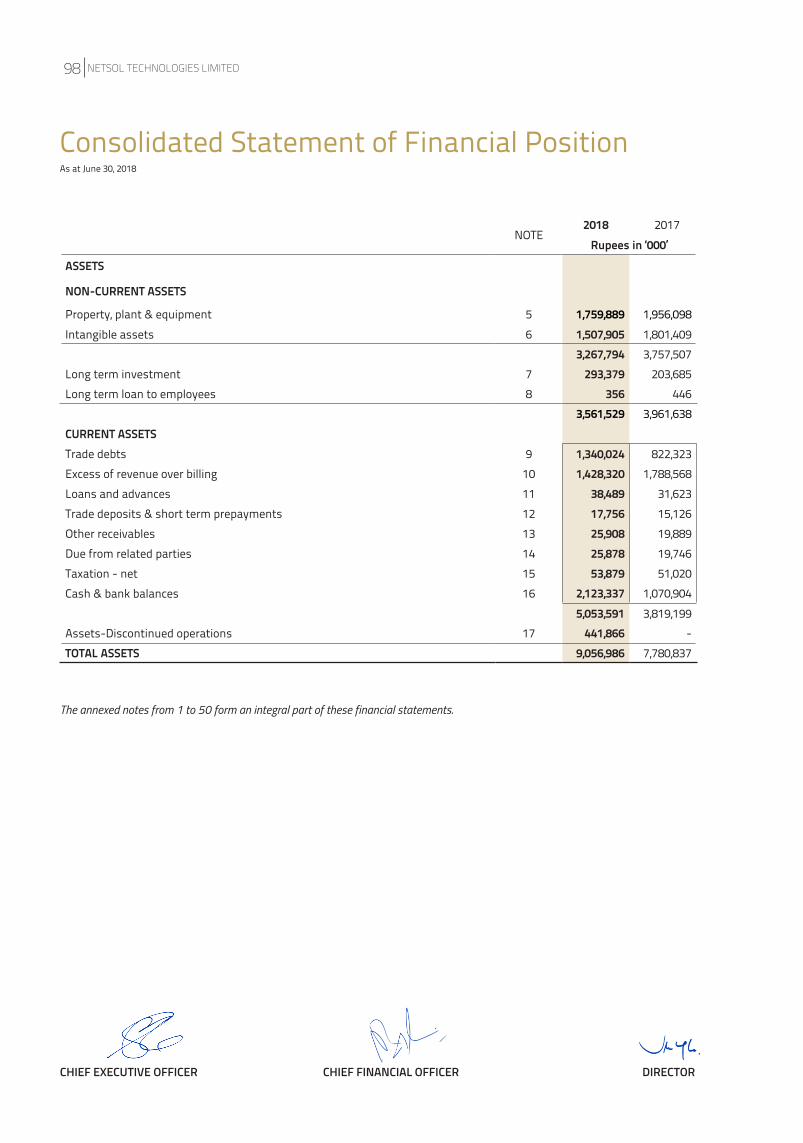
The annexed notes from 1 to 50 form an integral part of these financial statements.
Consolidated Statement of Financial PositionAs at June 30, 2018
NOTE2018 2017
Rupees in ‘000’ASSETS
NON-CURRENT ASSETS
Property, plant & equipment 5 1,759,889 1,956,098 Intangible assets 6 1,507,905 1,801,409
3,267,794 3,757,507 Long term investment 7 293,379 203,685 Long term loan to employees 8 356 446
3,561,529 3,961,638 CURRENT ASSETSTrade debts 9 1,340,024 822,323 Excess of revenue over billing 10 1,428,320 1,788,568 Loans and advances 11 38,489 31,623 Trade deposits & short term prepayments 12 17,756 15,126 Other receivables 13 25,908 19,889 Due from related parties 14 25,878 19,746 Taxation - net 15 53,879 51,020 Cash & bank balances 16 2,123,337 1,070,904
5,053,591 3,819,199 Assets-Discontinued operations 17 441,866 -TOTAL ASSETS 9,056,986 7,780,837
CHIEF EXECUTIVE OFFICER CHIEF FINANCIAL OFFICER DIRECTOR
NETSOL TECHNOLOGIES LIMITED98
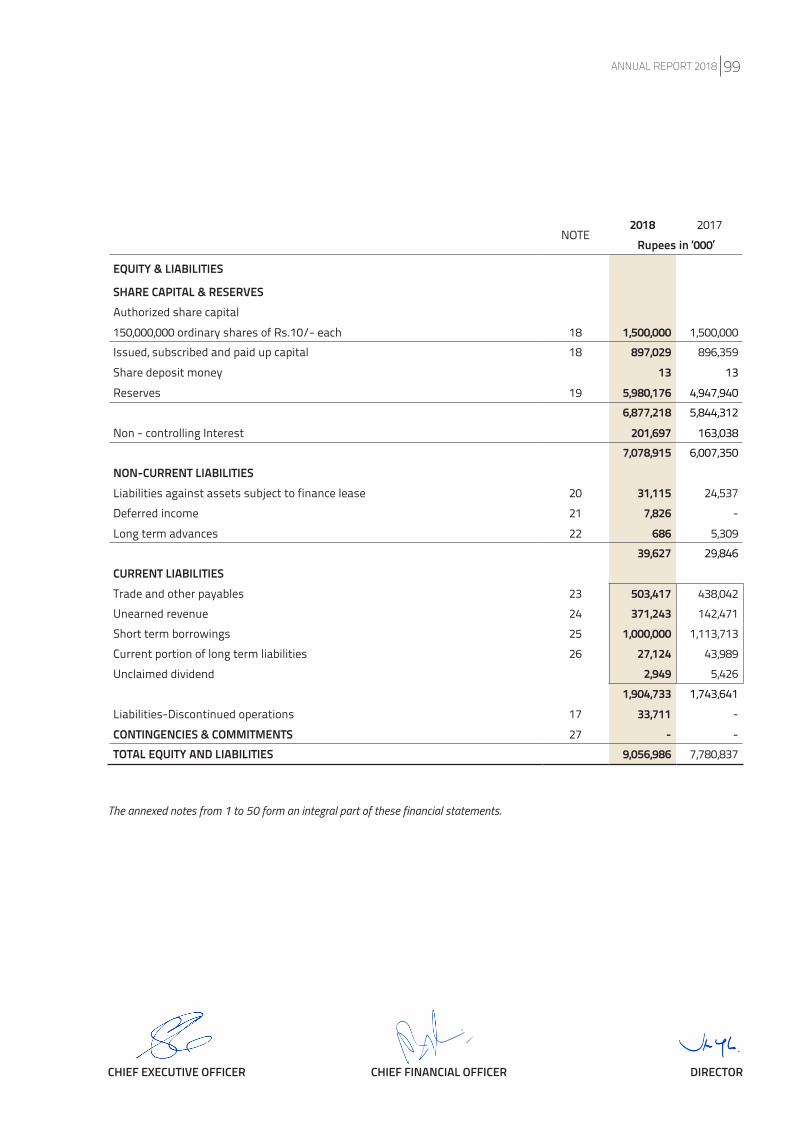
The annexed notes from 1 to 50 form an integral part of these financial statements.
NOTE2018 2017
Rupees in ‘000’
EQUITY & LIABILITIES
SHARE CAPITAL & RESERVESAuthorized share capital150,000,000 ordinary shares of Rs.10/- each 18 1,500,000 1,500,000 Issued, subscribed and paid up capital 18 897,029 896,359 Share deposit money 13 13 Reserves 19 5,980,176 4,947,940
6,877,218 5,844,312 Non - controlling Interest 201,697 163,038
7,078,915 6,007,350 NON-CURRENT LIABILITIESLiabilities against assets subject to finance lease 20 31,115 24,537 Deferred income 21 7,826 - Long term advances 22 686 5,309
39,627 29,846 CURRENT LIABILITIES Trade and other payables 23 503,417 438,042 Unearned revenue 24 371,243 142,471 Short term borrowings 25 1,000,000 1,113,713 Current portion of long term liabilities 26 27,124 43,989 Unclaimed dividend 2,949 5,426
1,904,733 1,743,641 Liabilities-Discontinued operations 17 33,711 -CONTINGENCIES & COMMITMENTS 27 - - TOTAL EQUITY AND LIABILITIES 9,056,986 7,780,837
CHIEF EXECUTIVE OFFICER CHIEF FINANCIAL OFFICER DIRECTOR
ANNUAL REPORT 2018 99

The annexed notes from 1 to 50 form an integral part of these financial statements.
Consolidated Statement of Profit or LossFor the year ended June 30, 2018
NOTE2018 2017
(Restated)Rupees in ‘000’
Continuing operationsRevenue - Net 28 4,284,800 3,925,697 Cost of revenue 29 (2,348,314) (2,687,252)Gross Profit 1,936,486 1,238,445 Selling and promotion expenses 30 (571,810) (442,704)Administrative expenses 31 (743,554) (698,024)Other operating expenses 32 (4,304) (2,005)Other income 33 522,603 60,024 Operating profit 1,139,421 155,736 Finance cost 34 (43,521) (29,290)Profit before taxation from continuing operations 1,095,900 126,446 Taxation Current 35 (49,014) (40,781) Prior (969) (1,006)
(49,983) (41,787)Profit after taxation for the year from continuing operations 1,045,917 84,659 Discontinued operations:Profit after tax for the year from discontinued operations 17 98,183 200,735Profit for the year 1,144,100 285,394 Attributable to: Equity holders of NetSol Technologies Limited 1,105,441 196,311 Non - controlling interest 38,659 89,083
1,144,100 285,394 Earnings per share
Basic - In Rupees 36 12.33 2.20 Diluted - In Rupees 36 12.31 2.18
Earnings per share for continuing operationsBasic - In Rupees 36 11.66 0.95 Diluted - In Rupees 36 11.65 0.94
CHIEF EXECUTIVE OFFICER CHIEF FINANCIAL OFFICER DIRECTOR
NETSOL TECHNOLOGIES LIMITED100
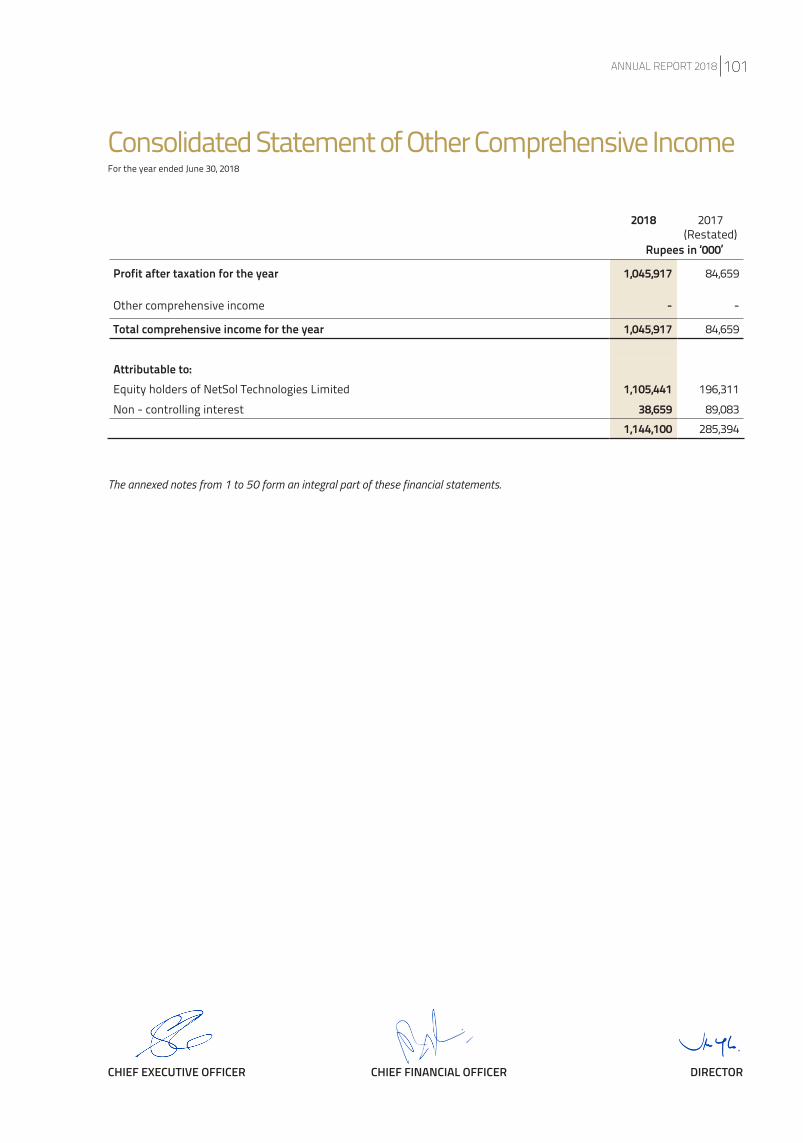
The annexed notes from 1 to 50 form an integral part of these financial statements.
Consolidated Statement of Other Comprehensive IncomeFor the year ended June 30, 2018
2018 2017(Restated)
Rupees in ‘000’
Profit after taxation for the year 1,045,917 84,659
Other comprehensive income - -
Total comprehensive income for the year 1,045,917 84,659
Attributable to:Equity holders of NetSol Technologies Limited 1,105,441 196,311 Non - controlling interest 38,659 89,083
1,144,100 285,394
CHIEF EXECUTIVE OFFICER CHIEF FINANCIAL OFFICER DIRECTOR
ANNUAL REPORT 2018 101
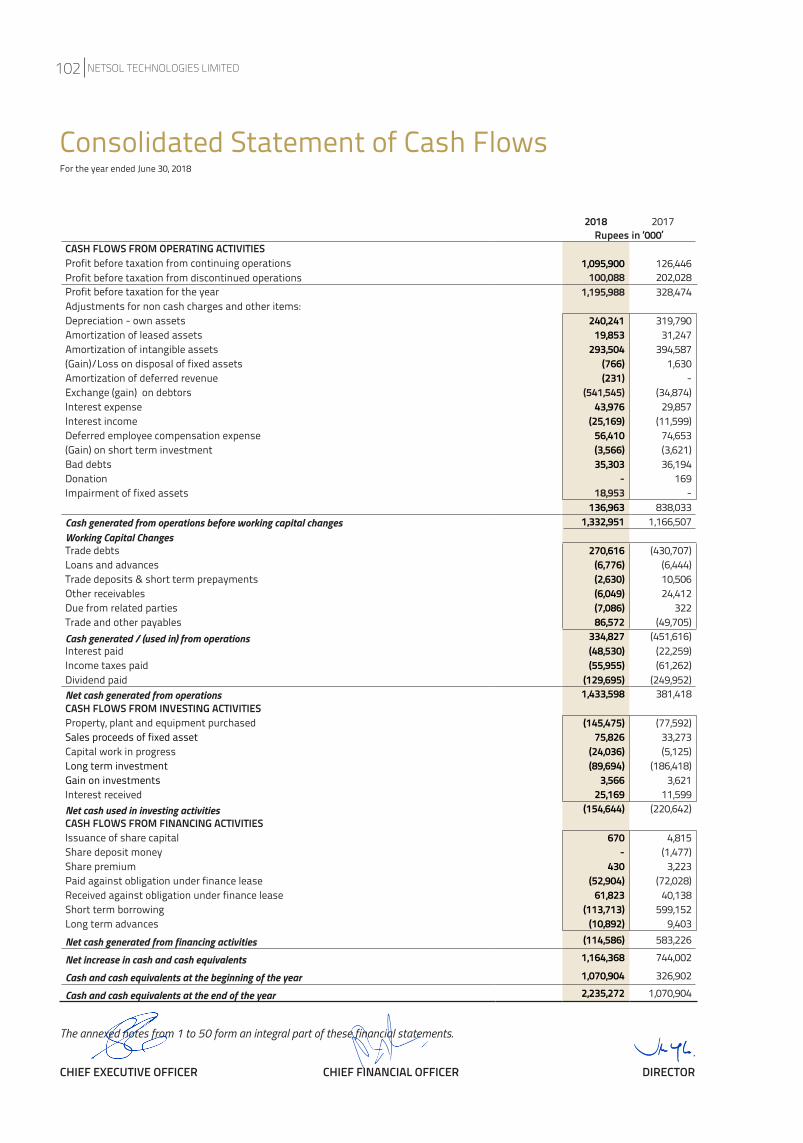
The annexed notes from 1 to 50 form an integral part of these financial statements.
Consolidated Statement of Cash FlowsFor the year ended June 30, 2018
2018 2017 Rupees in ‘000’
CASH FLOWS FROM OPERATING ACTIVITIESProfit before taxation from continuing operations 1,095,900 126,446 Profit before taxation from discontinued operations 100,088 202,028 Profit before taxation for the year 1,195,988 328,474Adjustments for non cash charges and other items:Depreciation - own assets 240,241 319,790 Amortization of leased assets 19,853 31,247 Amortization of intangible assets 293,504 394,587 (Gain)/Loss on disposal of fixed assets (766) 1,630 Amortization of deferred revenue (231) - Exchange (gain) on debtors (541,545) (34,874)Interest expense 43,976 29,857 Interest income (25,169) (11,599)Deferred employee compensation expense 56,410 74,653 (Gain) on short term investment (3,566) (3,621)Bad debts 35,303 36,194 Donation - 169 Impairment of fixed assets 18,953 -
136,963 838,033 Cash generated from operations before working capital changes 1,332,951 1,166,507Working Capital ChangesTrade debts 270,616 (430,707)Loans and advances (6,776) (6,444)Trade deposits & short term prepayments (2,630) 10,506 Other receivables (6,049) 24,412 Due from related parties (7,086) 322 Trade and other payables 86,572 (49,705)Cash generated / (used in) from operations 334,827 (451,616)Interest paid (48,530) (22,259)Income taxes paid (55,955) (61,262)Dividend paid (129,695) (249,952)Net cash generated from operations 1,433,598 381,418 CASH FLOWS FROM INVESTING ACTIVITIESProperty, plant and equipment purchased (145,475) (77,592)Sales proceeds of fixed asset 75,826 33,273 Capital work in progress (24,036) (5,125)Long term investment (89,694) (186,418)Gain on investments 3,566 3,621 Interest received 25,169 11,599 Net cash used in investing activities (154,644) (220,642)CASH FLOWS FROM FINANCING ACTIVITIESIssuance of share capital 670 4,815 Share deposit money - (1,477)Share premium 430 3,223 Paid against obligation under finance lease (52,904) (72,028)Received against obligation under finance lease 61,823 40,138 Short term borrowing (113,713) 599,152 Long term advances (10,892) 9,403 Net cash generated from financing activities (114,586) 583,226
Net increase in cash and cash equivalents 1,164,368 744,002
Cash and cash equivalents at the beginning of the year 1,070,904 326,902
Cash and cash equivalents at the end of the year 2,235,272 1,070,904
CHIEF EXECUTIVE OFFICER CHIEF FINANCIAL OFFICER DIRECTOR
NETSOL TECHNOLOGIES LIMITED102
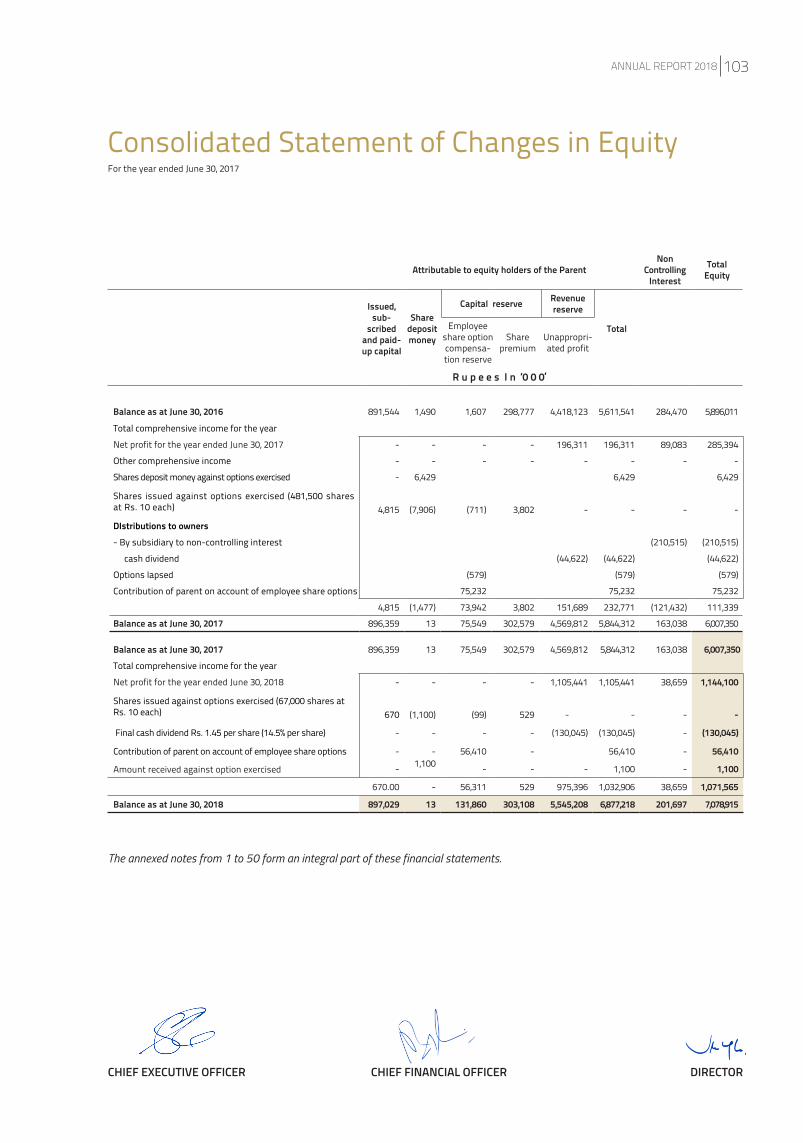
Attributable to equity holders of the Parent Non
ControllingInterest
TotalEquity
Issued, sub-
scribed and paid-up capital
Share deposit money
Capital reserve Revenue reserve
TotalEmployee share option compensa-tion reserve
Share premium
Unappropri-ated profit
R u p e e s I n ‘0 0 0’
The annexed notes from 1 to 50 form an integral part of these financial statements.
Consolidated Statement of Changes in EquityFor the year ended June 30, 2017
Balance as at June 30, 2016 891,544 1,490 1,607 298,777 4,418,123 5,611,541 284,470 5,896,011
Total comprehensive income for the year
Net profit for the year ended June 30, 2017 - - - - 196,311 196,311 89,083 285,394
Other comprehensive income - - - - - - - -
Shares deposit money against options exercised - 6,429 6,429 6,429
Shares issued against options exercised (481,500 shares at Rs. 10 each)
4,815 (7,906) (711) 3,802 - - - -
DIstributions to owners- By subsidiary to non-controlling interest (210,515) (210,515)
cash dividend (44,622) (44,622) (44,622)
Options lapsed (579) (579) (579)
Contribution of parent on account of employee share options 75,232 75,232 75,232
4,815 (1,477) 73,942 3,802 151,689 232,771 (121,432) 111,339
Balance as at June 30, 2017 896,359 13 75,549 302,579 4,569,812 5,844,312 163,038 6,007,350
Balance as at June 30, 2017 896,359 13 75,549 302,579 4,569,812 5,844,312 163,038 6,007,350 Total comprehensive income for the year
Net profit for the year ended June 30, 2018 - - - - 1,105,441 1,105,441 38,659 1,144,100
Shares issued against options exercised (67,000 shares at Rs. 10 each) 670 (1,100) (99) 529 - - - -
Final cash dividend Rs. 1.45 per share (14.5% per share) - - - - (130,045) (130,045) - (130,045)
Contribution of parent on account of employee share options - - 56,410 - 56,410 - 56,410
Amount received against option exercised - 1,100 - - - 1,100 - 1,100
670.00 - 56,311 529 975,396 1,032,906 38,659 1,071,565
Balance as at June 30, 2018 897,029 13 131,860 303,108 5,545,208 6,877,218 201,697 7,078,915
CHIEF EXECUTIVE OFFICER CHIEF FINANCIAL OFFICER DIRECTOR
ANNUAL REPORT 2018 103
1. LEGAL STATUS AND NATURE OF BUSINESSNetSol Group (‘‘the Group”) consists of:
- NetSol Technologies Limited
- NetSol Innovation (Private) Limited
NetSol Technologies Limited (”the Company”) was incorporated in Pakistan on August 22, 1996 under the repealed Companies Ordinance, 1984 (Now Companies Act 2017) as a private company, limited by shares and was later on converted into public limited company on November 05, 2004 and subsequently listed on stock exchange on August 26, 2005. The Company is listed on Pakistan Stock Exchange Limited. The business of the Company is development and sale of computer software and provision of related services in Pakistan as well as abroad.Geographical location and addresses of business units:
Address/Location Purpose1 NetSol IT Village,(Software Technology Park) Lahore Ring Road, Registered office Ghazi Road Interchange, Lahore Cantt. Pakistan. and business unit
2 43/1/Q, Amna Villa 1, Block-6, PECHS Housing Society Karachi. Branch office
3 House No. 4, Safari villas 1, Bahria town, Rawalpindi. Pakistan. Branch office
4 Summitmas 2 Ground Floor JI. Jend Sudirman Kav 61-62 Senayan-Kebayoran Branch office Baru Jakarta Selatan 12190, Indonessia
NetSol Innovation (Private) Limited (”the subsidiary Company” or ”Subsidiary” ) is incorporated in Pakistan as a private limited company in which NetSol Technologies Limited has share holding of 50.52%, The subsidiary company is engaged in business of providing online software development services. The registered office of the Company is situated NetSol IT Village, Lahore Ring Road, Main Ghazi Interchange, Lahore Cantt. Pakistan.
NetSol Technologies Limited is a majority owned subsidiary of NetSol Technologies Inc., USA.
2. BASIS OF PREPARATION2.1 Statement of compliance
These financial statements have been prepared in accordance with the accounting and reporting standards as applicable in Pakistan. The accounting and reporting standards applicable in Pakistan comprise of:
-International Financial Reporting Standards (IFRS Standards) issued by the International Accounting Standards Board (IASB) as notified under the Companies Act, 2017; and
-Provisions of and directives issued under the Companies Act, 2017.
Where the provisions of and directives issued under the Companies Act, 2017 differ from the IFRS, the provisions of and directives issued under the Companies Act, 2017 have been followed.
2.2 Basis of measurementThese consolidated financial statements have been prepared under the historical cost convention, except for revaluation of certain financial instruments at fair value as disclosed in respective accounting notes.
2.3 Functional and presentation currencyThese consolidated financial statements are presented in Pak Rupee, which is the Group’s functional currency. All financial information presented in Pak Rupee has been rounded to the nearest thousand unless stated otherwise.
2.4 Accounting policiesThe accounting policies adopted for the preparation of these consolidated financial statements are consistent with those applied in the preparation of the preceding annual published financial statements of the Group for the year ended June 30, 2017.
2.5 Standards and interpretations that became effectiveThe third and fourth schedule to the Companies Act, 2017 became applicable to the Company for the first time for the preparation of these financial statements. The Companies Act, 2017 (including its third and fourth schedule) forms an integral part of the statutory financial reporting framework applicable to the Company and amongst others, prescribes the nature and content of disclosures in relation to various elements of the financial statements. Additional disclosures include but are not limited to, particulars of immovable assets of the Company (refer note 5.7), management assessment of sufficiency of tax provision in the financial statements (refer note 35), change in threshold for identification of executives (refer note 37), Investments in foreign entities (refer note 7.1) additional disclosure requirements for related parties (refer note 39.1 and 39.2) etc.
Apart from companies Act 2017, the following standards (revised or amended) and interpretations became effective for the current financial year but either they are not relevant or do not have any material effect on the financial statements of the Company:
Notes to the Consolidated AccountsFor the year ended June 30, 2018
NETSOL TECHNOLOGIES LIMITED104
IAS7 (Amend-ment)
Cash flow statements: Disclosure initiative (Amendments)
IAS 12 Income taxes-Recognition of deferred tax assets for unrealized losses (Amendments)IFRS 12 Disclosure of interests in other entities-Annual improvements to IFRS standards 2014-2016 cycle (Amendments)
2.6 Standards and interpretations issued but not yet effective for the current financial year Effective for periods beginning on or after
IFRS 2 Share-based Payments – Classification and Measurement of Share-based Payments Transactions (Amendments) Jan-01 2018
IFRS 4 Insurance Contracts: Applying IFRS 9 Financial Instruments with IFRS 4 Insurance Contracts (Amendments) Jan-01 2018
IAS 40 Investment Property: Transfers of Investment Property (Amendments) Jan-01 2018IFRIC 22 Foreign Currency Transactions and Advance Consideration Jan-01 2018
IFRS 1 First-time Adoption of International Financial Reporting Standards - Annual improvements to IFRS standards 2014-2016 cycle Jan-01 2018
IAS 28 Investment in Associates and Joint Ventures - Annual improvements to IFRS standards 2014-2016 cycle Jan-01 2018
IFRS 9 Financial Instruments Jan-01 2018IFRS 15 Revenue from contracts with customers Jan-01 2018IFRS 16 Leases Jan-01 2019IFRIC 23 Uncertainty over Income Tax Treatments Jan-01 2019
IFRS 9 Financial Instruments - Prepayment features with negative compensation (Amendments) Jan-01 2019
IAS 19 Employee benefits - Plan Amendment, curtailment or settlement (Amendments) Jan-01 2019
IAS 28 Investment in Associates and Joint Ventures - Long term interests in associates and joint ventures (Amendments) Jan-01 2019
IFRS 3 Business combinations - Annual improvements to IFRS standards 2015-2017 cycle (Amendments) Jan-01 2019
IFRS 11 Joint arrangements - Annual improvements to IFRS standards 2015-2017 cycle (Amendments) Jan-01 2019
IAS 12 Income taxes - Annual improvements to IFRS standards 2015-2017 cycle (Amendments) Jan-01 2019
IAS 23 Borrowing costs - Annual improvements to IFRS standards 2015-2017 cycle (Amendments) Jan-01 2019
Conceptual framework of financial reporting Jan-01 2020IFRS 17 Insurance Contracts Jan-01 2021
The above standards and amendments are not expected to have any material impact on the Company’s financial statements in the period of initial application except for IFRS 15-Revenue from contracts with customers. The Company is currently in the process of evaluating the impact of the said standard.
2.7 Basis of ConsolidationThe consolidated financial statements include the financial statement of the holding Company and its subsidiary.The financial statements of the subsidiary are prepared for the same reporting period as the Company, using consistent accounting policies.The assets, liabilities and results of the subsidiary have been consolidated in accordance with IFRS 5, the carrying values of the investment held by the holding Company is eliminated against the subsidiary’s share capital and pre-acquisition reserves, if any in the consolidated financial statements. Material intra-group balances and transactions are eliminated.Subsidiaries are all entities (including special purpose entities) over which the group has the control generally accompanying a shareholding of more than one half of the voting rights.Subsidiary companies are consolidated from the date on which the Group obtains the control and continue to be consolidated until the date when such control ceases. Generally it is presumed that when more than 50% voting rights are transferred to the holding Company control of the subsidiary is established.Non-controlling interest is the equity in a subsidiary not attributable, directly or indirectly, to the holding Company.
ANNUAL REPORT 2018 105
3. USE OF ESTIMATES AND JUDGMENTThe preparation of consolidated financial statements in conformity with approved accounting standards, as applicable in Pakistan, requires the management to make judgments, estimates and assumptions that affect the application of policies and the reported amounts of assets and liabilities, income and expenses.The estimates and associated assumptions are based on historical experience and various other factors that are believed to be reasonable under the circumstances, the results of which form the basis of making judgments about the carrying values of assets and liabilities that are not readily apparent from other sources. Actual results may differ from these estimates.The estimates and underlying assumptions are reviewed on an ongoing basis. Revisions to accounting estimates are recognized in the period in which the estimate is revised if the revision affects only that period, or in the period of revision and future periods if the revision affects both current and future periods.The areas involving higher degree of judgement or complexity are as follows:
i. Provision for doubtful debtsii. Provision for taxationiii. Useful life and recoverable amounts of depreciable assetsiv. Useful life of intangible assetsv. Contingencies
4. SUMMARY OF SIGNIFICANT ACCOUNTING POLICIES
4.1 Property Plant and equipment
(i) Owned assets
Property, plant and equipment except for free hold land are stated at cost less accumulated depreciation and any impairment losses. Free hold land is stated at cost less any identified impairment loss.
Depreciation is charged by applying reducing balance method to write off the cost over the remaining useful life of the assets. Rates of depreciation are stated in note 5.1
Depreciation on additions to property, plant and equipment is charged for the month in which an asset is acquired or capitalized while no depreciation is charged for the month in which the asset is disposed off.
Subsequent costs are included in the asset’s carrying amounts or recognized as a separate asset, as appropriate, only when it is probable that future economic benefits associated with the item will flow to the Group and the cost of the item can be measured reliably.
Maintenance and normal repairs are charged to Statement of Profit or Loss as and when incurred. Major repairs and improvements are capitalized.
The carrying amount of property, plant and equipment is removed from the Statement of Financial Position upon scrapping or disposal or when no future economic benefit is expected from its use, scrapping or disposal.
Gain or loss on scrapping or disposal of assets, if any, is charged to Statement of Profit or Loss.
(ii) Assets subject to finance lease
Assets acquired under finance leases are capitalized and are stated at lower of present value of minimum lease payments under the lease agreements and the fair value of the assets. The related obligations of the leases are accounted for as current and non-current liabilities. Leasing payments are recognized as interest and repayment of liability.
Assets acquired under finance lease are amortized over the useful life of the assets using reducing balance method at the rates given in note 5.4
Amortization on additions is charged for the month in which an asset is acquired under the finance lease while no amortization is charged for the month in which the asset is disposed off.
Notes to the Consolidated AccountsFor the year ended June 30, 2017
NETSOL TECHNOLOGIES LIMITED106
(a) In-house developed intangible assets
The Group capitalizes certain computer software development costs in accordance with IAS 38 Intangible Assets. Costs incurred internally to create a computer software product or to develop an enhancement to an existing product are charged to expense when incurred as research and development expense until technological feasibility for the respective product is established. Thereafter, all software development costs are capitalized and reported at the lower of unamortized cost or net realizable value. Capitalization ceases when the product or enhancement is available for general release to customers.
The Group makes ongoing evaluations of the recoverability of its capitalized software projects developed in-house by comparing the amount capitalized for each product to the estimated net realizable value of the product. If such evaluations indicate that the unamortized software development costs exceed the net realizable value, the Group writes off the amount by which the unamortized software development costs exceed net realizable value. Capitalized software costs are amortized on a product-by-product basis. Annual amortization is charged by using straight-line method over the remaining estimated economic life of the product including the period being reported on. Amortization starts when the product is available for general release to customers.
(b) Intangible assets acquired from market
Intangible assets acquired from market are stated at cost less accumulated amortization and impairment losses, if any.
Subsequent costs are included in the asset’s carrying amounts or recognized as a separate asset, as appropriate, only when it is probable that future economic benefits associated with the item will flow to the Group and the cost of the item can be measured reliably. All other expenses are charged to Statement of Profit or Loss when they occur.
Amortization is charged by applying reducing balance method to write off the cost over the remaining useful life of the intangible assets unless such lives are indefinite. All intangible assets with an indefinite useful life are tested for impairment at each Statement of Financial Position date. Amortization on additions to acquired intangible assets is charged for the month in which an asset is acquired while no amortization is charged for the month in which the asset is disposed off. Rates of amortization are stated in note 6.
4.3 Impairment
(a) Financial Asset
At each Statement of Financial Position date the company assesses whether there is any objective evidence that a financial asset or a group of financial asset is impaired. A financial asset is deemed to be impaired if and only if there is an objective evidence of impairment as a result of one or more events that have occurred after the initial recognition of the asset and that event has an impact on the estimated future cash flows of the financial asset that can be reliably estimated. Any impairment loss on financial assets, including the financial assets carried at amortized cost, is recognized in Statement of Profit or Loss.
(iii) Capital work in progress
Capital work in progress is stated at cost less any impairment losses. It represents expenditure incurred on property plant and equipment during construction and installation. Cost also includes applicable borrowing costs. These expenditures are transferred to relevant assets’ category as and when assets are available for use.
4.2 Intangible assets
Research and software products development
Research costs are expensed as incurred. Software product development costs are expensed as incurred unless technical and commercial feasibility of the project is demonstrated, it is probable that future economic benefits will flow to the Group, the Group has an intention and ability to complete and use or sell the software and cost can be measured reliably.
There are two components of intangible assets:
a. In-house developed intangible assets
b. Intangible assets acquired from market
ANNUAL REPORT 2018 107
(b) Non Financial Asset
The Group continually assesses at each Statement of Financial Position date whether there is any indication that an asset may be impaired. If such indication exists, the carrying amounts of such assets are reviewed to assess whether they are recorded in excess of their recoverable amount. Where carrying values exceed the respective recoverable amount, assets are written down to their recoverable amounts and the resulting impairment loss is recognized in Statement of Profit or Loss for the year. The recoverable amount is the higher of an assets’ fair value less costs to sell and value in use. Where an impairment loss is recognized, the depreciation charge is adjusted in the future periods to allocate the assets’ revised carrying amount over its estimated useful life.
4.4 Foreign currency translation
Transactions denominated in foreign currencies are translated in Pak Rupees at the foreign exchange rate prevailing at the date of transaction. Monetary assets and liabilities in foreign currencies are translated into Pak Rupees at the foreign exchange rates prevailing at the Statement of Financial Position date. Non-monetary assets and liabilities measured at historical cost are translated at the exchange rate prevailing at the date of the transaction. Non-monetary assets and liabilities denominated in foreign currencies that are stated at fair value are translated at the exchange rate prevailing at the date when fair values were determined. All exchange differences are charged to Statement of Profit or Loss.
4.5 Staff benefits
(i) Retirement benefits
The Group operates contributory provident fund for all its permanent staff. Contributions are made equally by the Group and the employee at 8% of basic salary in the provident fund on monthly basis. Group’s contribution is recognized as a cost in the Statement of Profit or Loss. The fund is administrated by the Trustees.
(ii) Short-term benefits
Short-term benefits to employees are calculated without discounting and are recognized as cost when related services are received.
(iii) Employees’ share option scheme
The holding Company operates an equity settled share based Employee’ Share Option Scheme (”Scheme”). At the grant date of share options (”Options”) to the employees, the holding Company initially recognizes ”Deferred Employee Compensation Expense” with corresponding credit to equity as Deferred Employee Compensation Reserve” at the fair value of option at the grant date. The fair value of options determined at the grant date is recognized as an employee compensation expense on a straight line basis over the vesting period. Fair value of options is arrived at using Black Scholes pricing model.
When an unvested option lapses by virtue of an employee not conforming to the vesting conditions after recognition of an employee compensation expense in profit or loss, employee compensation expense in profit or loss will be reversed equal to the amortized portion with a corresponding effect to deferred employee compensation reserve in the Statement of Financial Position. When a vested option lapses on expiry of the exercise period, employee compensation expense already recognized in the profit or loss is reversed with a corresponding reduction to deferred employee compensation reserve in the Statement of Financial Position. When the options are exercised, deferred employee compensation reserve relating to these options is transferred to share capital and share premium account. An amount equivalent to the face value of related shares is transferred to share capital. Any amount over and above the share capital is transferred to share premium account.
4.6 Taxation
Provision for current tax is based on taxable income for the year determined in accordance with the prevailing law for taxation of income. The charge for tax on income is calculated at the current rates of taxation as applicable after taking into account tax credit and tax rebates available, if any. Income tax expense is recognized in Statement of Profit or Loss except to the extent that it relates to items recognized directly in equity, in which case it is recognized in equity. Charge for tax expense also includes adjustments where necessary, relating to prior years which arise from assessments finalized during the current year.
4.7 Creditors, accruals and provisions
Liabilities for creditors and other amounts payable are carried at cost which is the fair value of the consideration to be paid in future for the goods and / or services received, whether or not billed to the Group.
Notes to the Consolidated AccountsFor the year ended June 30, 2018
NETSOL TECHNOLOGIES LIMITED108
Liabilities for creditors and other amounts payable in foreign currency are revalued by applying the exchange rate applicable on Statement of Financial Position date.
Provisions are recognized when the Group has a present legal or constructive obligation as a result of past events and, it is probable that an outflow of resources embodying economic benefits will be required to settle the obligation and reliable estimate of the amount can be made. Provisions are reviewed at each Statement of Financial Position date and adjusted to reflect the current best estimate.
4.8 Trade debts
Trade debts from local customers are stated at invoice while foreign debtors are stated at re-valued amount by applying exchange rate applicable on Statement of Financial Position date. An estimate is made for doubtful receiv-ables when collection of amount is not probable and the amount of trade debts is reduced by such provision. Debts considered irrecoverable are written off.
4.9 Cash and cash equivalents
Cash and cash equivalents comprise of cash in hand and at current or saving accounts held with banks, fixed deposits and short-term, highly liquid investments that are readily convertible to known amounts of cash and which are sub-ject to an insignificant risk of changes in value. These also include facilities of running finance that form an integral part of the Group’s cash management.
4.10 Revenue recognition
(i) License sale
The Group recognizes revenue from license contracts without major customization when a non-cancellable, non-con-tingent license agreement has been signed, delivery of the software has occurred, fee is fixed or determinable, and collectability is probable.
Revenue from sale of license with major customization, modification, and development is recognized on percentage of completion basis.
(ii) Rendering of services
Revenue from software services is recognized in accordance with the percentage of completion method. An output measure i.e. Unit Completion Method is used to determine the percentage of completion. Unit completed are certified by the CFO and COO.
(iii) Maintenance
Revenue from maintenance is recognized on time proportion basis.
(iv) Sale of hardware and third party software
Revenue from sale of hardware and third party software is recognized when delivery has occurred and invoices are raised to customers.
The Group’s revenue recognition policies are in compliance with all applicable accounting regulations including IAS 18 ”Revenue”.
(v) Miscellaneous
Interest on bank deposits is recognized on a time proportion basis on the principal amount outstanding and at the rate applicable.
Gains or losses resulting from re-measurement of investment at fair value through profit or loss are recognized in the Statement of Profit or Loss.
Rental income is recognized on time proportion basis.
Dividend income is recognized as income when the right of receipt is established.
Miscellaneous income is recognized on receipt basis.
ANNUAL REPORT 2018 109
4.11 Borrowing costs
Borrowing costs directly attributable to the construction /acquisition of qualifying assets are capitalized up to the date, including the period when technical and administrative work is carried on, the respective assets are available for the in-tended use. All other mark-up, interest and other related charges are taken to the Statement of Profit or Loss currently. Qualifying assets are assets that necessarily take substantial period of time to get ready for their intended use.
4.12 Off-setting of financial asset and liability
Financial assets and liabilities are offset and the net amount is reported in the financial statements only when there is legally enforceable right to set-off the recognized amount and the Group intends either to settle on a net basis, or to realize the assets and to settle the liabilities simultaneously.
4.13 Financial instruments(i) Financial assets
All financial assets have been stated in accordance with the requirements of IAS–39 (Financial Instruments: Recognition and Measurement). Financial assets and liabilities are recognized when the Group becomes a party to the contractual provisions of the instrument. Financial assets are initially recognized at cost, which is the fair value of the consideration given at initial recognition. Subsequent to initial recognition, financial assets are carried at fair value except for any financial assets whose fair value cannot be estimated reliably. Financial assets are derecognized when the Company loses control of the contractual rights that comprises the financial asset.
The Group classifies its financial assets in the following categories: held to maturity investments, loans and receivables, available for sale investments and investments at fair value through profit or loss. The classification depends on the purpose for which the financial assets were acquired. Management determines the classification of its financial assets at initial recognition. Regular purchases and sales of financial assets are recognized on the trade date, the date on which the Group commits to purchase or sell the asset.
(a) Held to maturity investments
Investments with fixed payments and maturity that the Group has the intent and ability to hold to maturity are classified as held to maturity investments and are carried at amortized cost less impairment losses. These are classified as current and non-current assets in accordance with criteria set out by IFRSs.
(b) Loans and receivables
Loans and receivables are non-derivative financial assets with fixed or determinable payments that are not quoted in an active market. Loans and receivables are initially measured at fair value plus directly attributable transaction costs. After initial measurement loans and receivables are subsequently measured at amortized cost using the effective interest rate method less any impairment. These are classified as current and non-current assets in accordance with criteria set out by IFRSs.
(c) Available for sale investments
Available for sale financial assets are non derivatives that are either designated in this category or not classified in any of the other categories. They are included in non current assets unless management intends to dispose of the investment within twelve months of the Statement of Financial Position date.
Available for sale investments are initially recognized at cost and carried at fair value at the Statement of Financial Position date. Fair value of a quoted investment is determined in relation to its market value (current bid prices) at the Statement of Financial Position date. If the market for a financial asset is not active (and for unlisted securities), the Group establishes fair value by using valuation techniques. Adjustment arising from re-measurement of investment to fair value is recorded in other comprehensive income and taken to Statement of Profit or Loss on disposal of investment or when the investment is determined to be impaired.
(d) Financial assets at fair value through profit or loss
This category consists of two subcategories: (i) financial assets held for trading and (ii) financial assets that the Group initially chooses to put in this category. A financial asset is classified as held for trading if it is acquired with the aim of being sold in the short term. Assets in this category are measured continually at fair value, and the changes in value are recognized directly in the Statement of Profit or Loss.
Notes to the Consolidated AccountsFor the year ended June 30, 2018
NETSOL TECHNOLOGIES LIMITED110
(ii) Financial liabilitiesAll financial liabilities have been stated in accordance with the requirements of IAS–39 (Financial Instruments: Recognition and Measurement). Financial liabilities are recognized when the Group becomes a party to the contractual provisions of the instrument.All financial liabilities are initially recognized at cost, which is the fair value of the consideration received at initial recognition. Subsequent to initial recognition financial liabilities are carried at fair value, amortized cost or cost as the case may be. Financial liabilities are removed from the Statement of Financial Position when the obligation is extinguished, discharged, cancelled or expired. Any gain or loss on subsequent re-measurement or derecognizing is included in the Statement of Profit or Loss for the period in which it arises.
4.14 Dividend and appropriation to reservesDividend and appropriation to reserves are recognized in the financial statements in the period in which these are approved.
4.15 Leasing(i) Operating LeasesLeases where a significant portion of the risk and rewards of ownership are retained by the lessor are classified as operating lease. Expenses for operating leases are recognized in the Statement of Profit or Loss over the leasing period on a straight-line basis. Variable expenses are recognized in the periods when they arise.(ii) Finance LeasesFinance leases transfers to the Group substantially all the risks and rewards incidental to ownership of the leased assets. The minimum lease payments are divided between interest costs and repayment of the outstanding liability. Interest costs are distributed over the period of the lease so that each accounting period includes an amount corresponding to a fixed interest rate for the liability recognized in each period. Variable payments are recognized in the periods when they arise.
4.16 Related party transactionsThe Group enters into transactions with related parties on an arm’s length basis. Prices for transactions with related parties are determined using admissible valuation methods, except in extremely rare circumstances where, subject to approval of the Board of Directors, it is in the interest of the group to do so.
4.17 Fair valueThe fair value of financial instruments that are actively traded in organized financial markets is determined but reference to quoted market bid prices at the close of business on the Statement of Financial Position date. Where there is no active market, fair value is determined using valuation techniques. Such techniques include using recent arm’s length market transaction; reference to the current market value of another instrument, which has substantially similar characteristics, discounted cash flow analysis or other valuation models.
4.18 Segment reportingThe chief operating decision-maker (CODM), who is responsible for allocating resources and assessing performance of the operating segments, has been identified as the Senior Management Team that makes strategic decisions. The management has determined the operating segments based on the reports reviewed by CODM of the Group. For management purposes, the Group is organized into operating segments based on their products and services. Each operating segment has a manager responsible for the operations who periodically reports to the CODM the outcome of the operating segment’s efforts and its resource requirements. Additional disclosures on each of these segments are shown in Notes, including the factors used to identify the reportable segments and the measurement basis of segment information.
4.19 InvestmentsInvestments are stated at cost less any impairment losses.
4.20 Earnings Per ShareThe Company presents basic and diluted earnings per share (EPS). Basic EPS is calculated by dividing the profit after tax attributable to ordinary shareholders of the Company by the weighted average number of ordinary shares outstanding during the period. Diluted EPS is calculated by dividing the profit attributable to ordinary equity holders of the parent (after adjustment) by the weighted average number of ordinary shares outstand-ing during the year plus the weighted average number of ordinary shares that would be issued on conversion of all the dilutive potential ordinary shares into ordinary shares.
4.21 Discontinued operationsA component of the Group is classified as “discontinued operation” when the criteria to be classified as held for sale have been met or it has been disposed of and such a component represents a separate major line of business or geographical area of operations or is part of a single coordinated plan to dispose of a separate major line of business or geographical area or operations.When an operation is classified as a discontinued operation, the comparative profit or loss is restated as if the operation had been discontinued from the start of the comparative period. In the statement of profit or loss and other comprehensive income of the current financial, and of the comparative period, all income and expenses from discontinued operation are reported separately from income and expenses from continuing operations, down to the level of profit after tax.
ANNUAL REPORT 2018 111
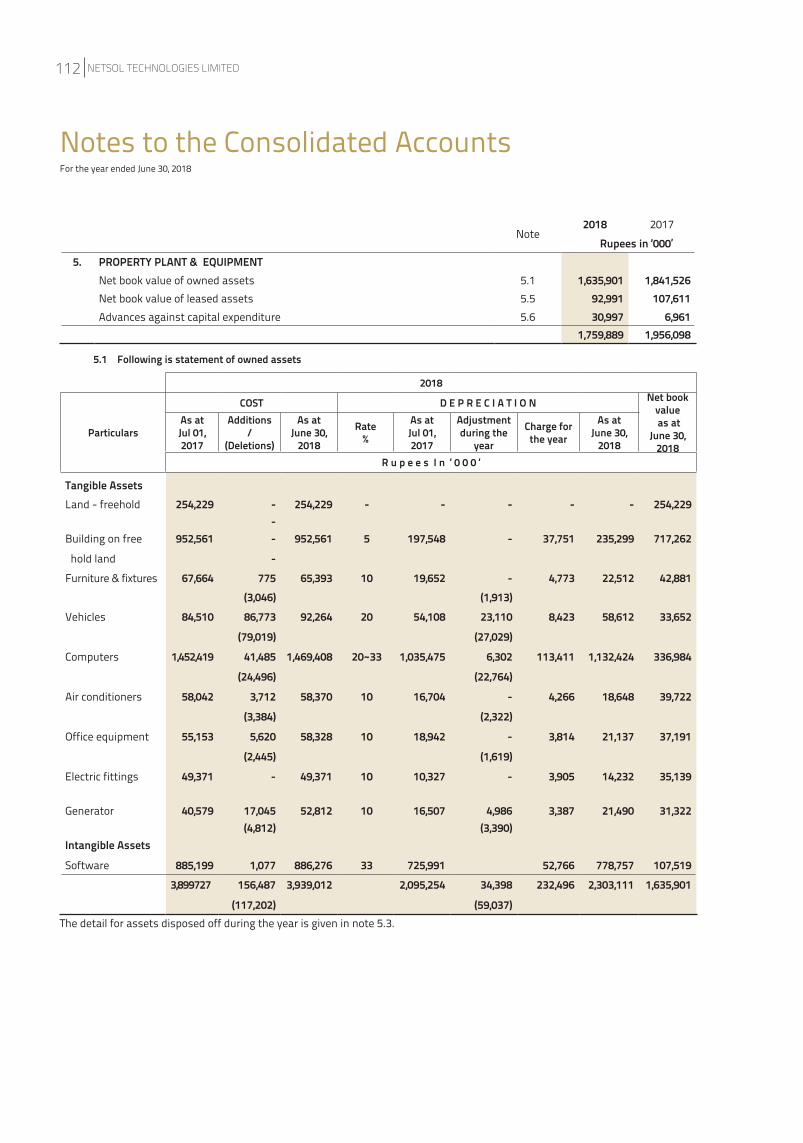
5.1 Following is statement of owned assets
Note2018 2017 Rupees in ‘000’
5. PROPERTY PLANT & EQUIPMENTNet book value of owned assets 5.1 1,635,901 1,841,526 Net book value of leased assets 5.5 92,991 107,611 Advances against capital expenditure 5.6 30,997 6,961
1,759,889 1,956,098
2018
Particulars
COST D E P R E C I A T I O N Net bookvalue as at
June 30,2018
As atJul 01,2017
Additions /
(Deletions)
As atJune 30,
2018
Rate%
As atJul 01,2017
Adjustment during the
year
Charge forthe year
As atJune 30,
2018R u p e e s I n ‘ 0 0 0 ‘
Tangible AssetsLand - freehold 254,229 - 254,229 - - - - - 254,229
-Building on free 952,561 - 952,561 5 197,548 - 37,751 235,299 717,262 hold land -Furniture & fixtures 67,664 775 65,393 10 19,652 - 4,773 22,512 42,881
(3,046) (1,913)Vehicles 84,510 86,773 92,264 20 54,108 23,110 8,423 58,612 33,652
(79,019) (27,029)Computers 1,452,419 41,485 1,469,408 20~33 1,035,475 6,302 113,411 1,132,424 336,984
(24,496) (22,764)Air conditioners 58,042 3,712 58,370 10 16,704 - 4,266 18,648 39,722
(3,384) (2,322) Office equipment 55,153 5,620 58,328 10 18,942 - 3,814 21,137 37,191
(2,445) (1,619)Electric fittings 49,371 - 49,371 10 10,327 - 3,905 14,232 35,139
Generator 40,579 17,045 52,812 10 16,507 4,986 3,387 21,490 31,322 (4,812) (3,390)
Intangible Assets
Software 885,199 1,077 886,276 33 725,991 52,766 778,757 107,519 3,899727 156,487 3,939,012 2,095,254 34,398 232,496 2,303,111 1,635,901
(117,202) (59,037)The detail for assets disposed off during the year is given in note 5.3.
Notes to the Consolidated AccountsFor the year ended June 30, 2018
NETSOL TECHNOLOGIES LIMITED112
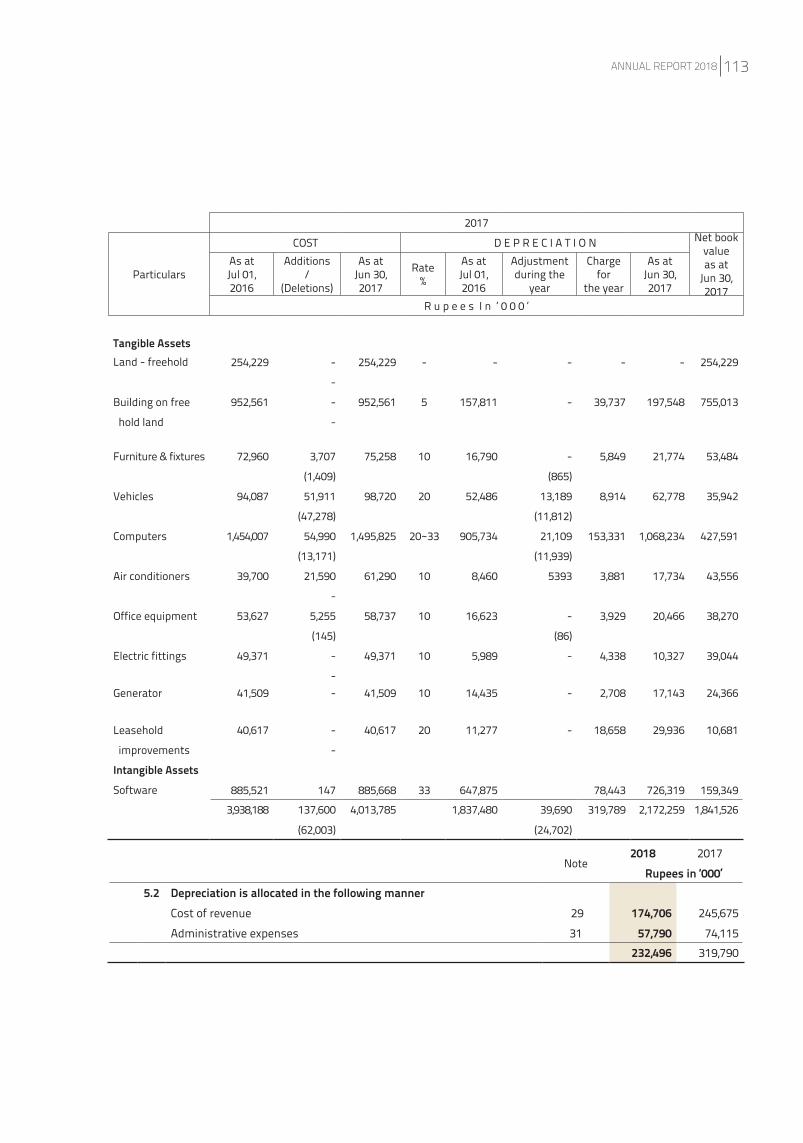
2017
Particulars
COST D E P R E C I A T I O N Net bookvalue as at
Jun 30,2017
As atJul 01,2016
Additions /
(Deletions)
As atJun 30,2017
Rate%
As atJul 01,2016
Adjustment during the
year
Charge for
the year
As atJun 30,2017
R u p e e s I n ‘ 0 0 0 ‘
Tangible AssetsLand - freehold 254,229 - 254,229 - - - - - 254,229
-
Building on free 952,561 - 952,561 5 157,811 - 39,737 197,548 755,013
hold land -
Furniture & fixtures 72,960 3,707 75,258 10 16,790 - 5,849 21,774 53,484
(1,409) (865)
Vehicles 94,087 51,911 98,720 20 52,486 13,189 8,914 62,778 35,942
(47,278) (11,812)
Computers 1,454,007 54,990 1,495,825 20~33 905,734 21,109 153,331 1,068,234 427,591
(13,171) (11,939)
Air conditioners 39,700 21,590 61,290 10 8,460 5393 3,881 17,734 43,556
-
Office equipment 53,627 5,255 58,737 10 16,623 - 3,929 20,466 38,270
(145) (86)
Electric fittings 49,371 - 49,371 10 5,989 - 4,338 10,327 39,044
-Generator 41,509 - 41,509 10 14,435 - 2,708 17,143 24,366
Leasehold 40,617 - 40,617 20 11,277 - 18,658 29,936 10,681
improvements -
Intangible AssetsSoftware 885,521 147 885,668 33 647,875 78,443 726,319 159,349
3,938,188 137,600 4,013,785 1,837,480 39,690 319,789 2,172,259 1,841,526
(62,003) (24,702)
Note2018 2017
Rupees in ‘000’5.2 Depreciation is allocated in the following manner
Cost of revenue 29 174,706 245,675Administrative expenses 31 57,790 74,115
232,496 319,790
ANNUAL REPORT 2018 113
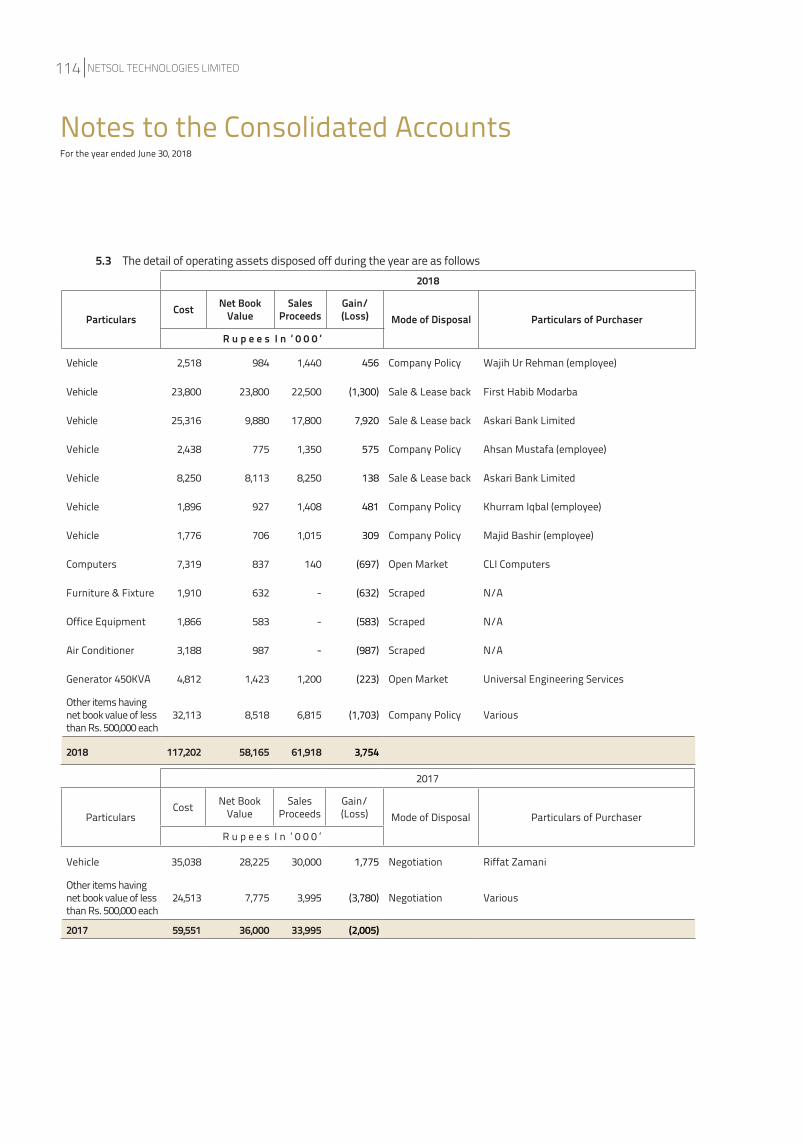
5.3 The detail of operating assets disposed off during the year are as follows2018
ParticularsCost Net Book
ValueSales
ProceedsGain/(Loss) Mode of Disposal Particulars of Purchaser
R u p e e s I n ‘ 0 0 0 ‘
Vehicle 2,518 984 1,440 456 Company Policy Wajih Ur Rehman (employee)
Vehicle 23,800 23,800 22,500 (1,300) Sale & Lease back First Habib Modarba
Vehicle 25,316 9,880 17,800 7,920 Sale & Lease back Askari Bank Limited
Vehicle 2,438 775 1,350 575 Company Policy Ahsan Mustafa (employee)
Vehicle 8,250 8,113 8,250 138 Sale & Lease back Askari Bank Limited
Vehicle 1,896 927 1,408 481 Company Policy Khurram Iqbal (employee)
Vehicle 1,776 706 1,015 309 Company Policy Majid Bashir (employee)
Computers 7,319 837 140 (697) Open Market CLI Computers
Furniture & Fixture 1,910 632 - (632) Scraped N/A
Office Equipment 1,866 583 - (583) Scraped N/A
Air Conditioner 3,188 987 - (987) Scraped N/A
Generator 450KVA 4,812 1,423 1,200 (223) Open Market Universal Engineering Services
Other items having net book value of less than Rs. 500,000 each
32,113 8,518 6,815 (1,703) Company Policy Various
2018 117,202 58,165 61,918 3,754
2017
ParticularsCost Net Book
ValueSales
ProceedsGain/(Loss) Mode of Disposal Particulars of Purchaser
R u p e e s I n ‘ 0 0 0 ‘
Vehicle 35,038 28,225 30,000 1,775 Negotiation Riffat Zamani
Other items having net book value of less than Rs. 500,000 each
24,513 7,775 3,995 (3,780) Negotiation Various
2017 59,551 36,000 33,995 (2,005)
Notes to the Consolidated AccountsFor the year ended June 30, 2018
NETSOL TECHNOLOGIES LIMITED114
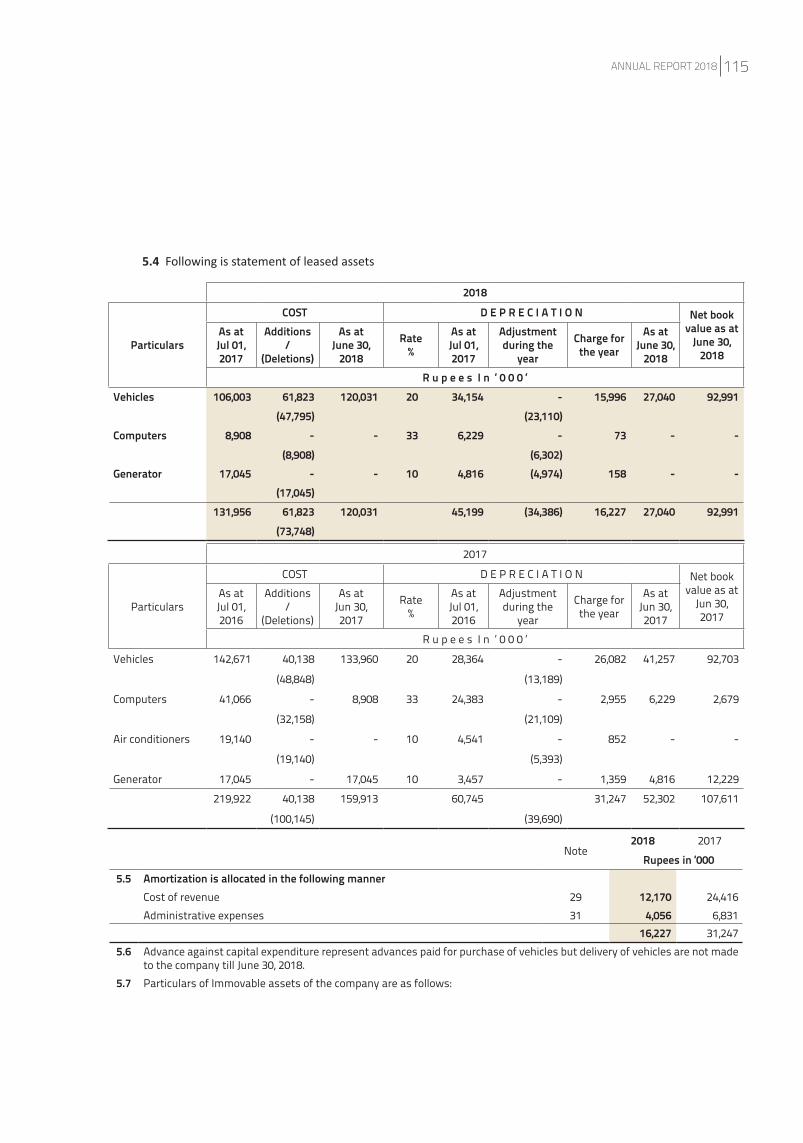
2017
Particulars
COST D E P R E C I A T I O N Net bookvalue as at
Jun 30,2017
As atJul 01,2016
Additions /
(Deletions)
As atJun 30,2017
Rate%
As atJul 01,2016
Adjustment during the
year
Charge forthe year
As atJun 30,2017
R u p e e s I n ‘ 0 0 0 ‘
Vehicles 142,671 40,138 133,960 20 28,364 - 26,082 41,257 92,703
(48,848) (13,189)
Computers 41,066 - 8,908 33 24,383 - 2,955 6,229 2,679
(32,158) (21,109)
Air conditioners 19,140 - - 10 4,541 - 852 - -
(19,140) (5,393)
Generator 17,045 - 17,045 10 3,457 - 1,359 4,816 12,229
219,922 40,138 159,913 60,745 31,247 52,302 107,611
(100,145) (39,690)
Note2018 2017
Rupees in ‘0005.5 Amortization is allocated in the following manner
Cost of revenue 29 12,170 24,416Administrative expenses 31 4,056 6,831
16,227 31,2475.6 Advance against capital expenditure represent advances paid for purchase of vehicles but delivery of vehicles are not made
to the company till June 30, 2018.5.7 Particulars of Immovable assets of the company are as follows:
5.4 Following is statement of leased assets
2018
Particulars
COST D E P R E C I A T I O N Net bookvalue as at
June 30,2018
As atJul 01,2017
Additions /
(Deletions)
As atJune 30,
2018
Rate%
As atJul 01,2017
Adjustment during the
year
Charge forthe year
As atJune 30,
2018R u p e e s I n ‘ 0 0 0 ‘
Vehicles 106,003 61,823 120,031 20 34,154 - 15,996 27,040 92,991 (47,795) (23,110)
Computers 8,908 - - 33 6,229 - 73 - - (8,908) (6,302)
Generator 17,045 - - 10 4,816 (4,974) 158 - - (17,045)
131,956 61,823 120,031 45,199 (34,386) 16,227 27,040 92,991 (73,748)
ANNUAL REPORT 2018 115
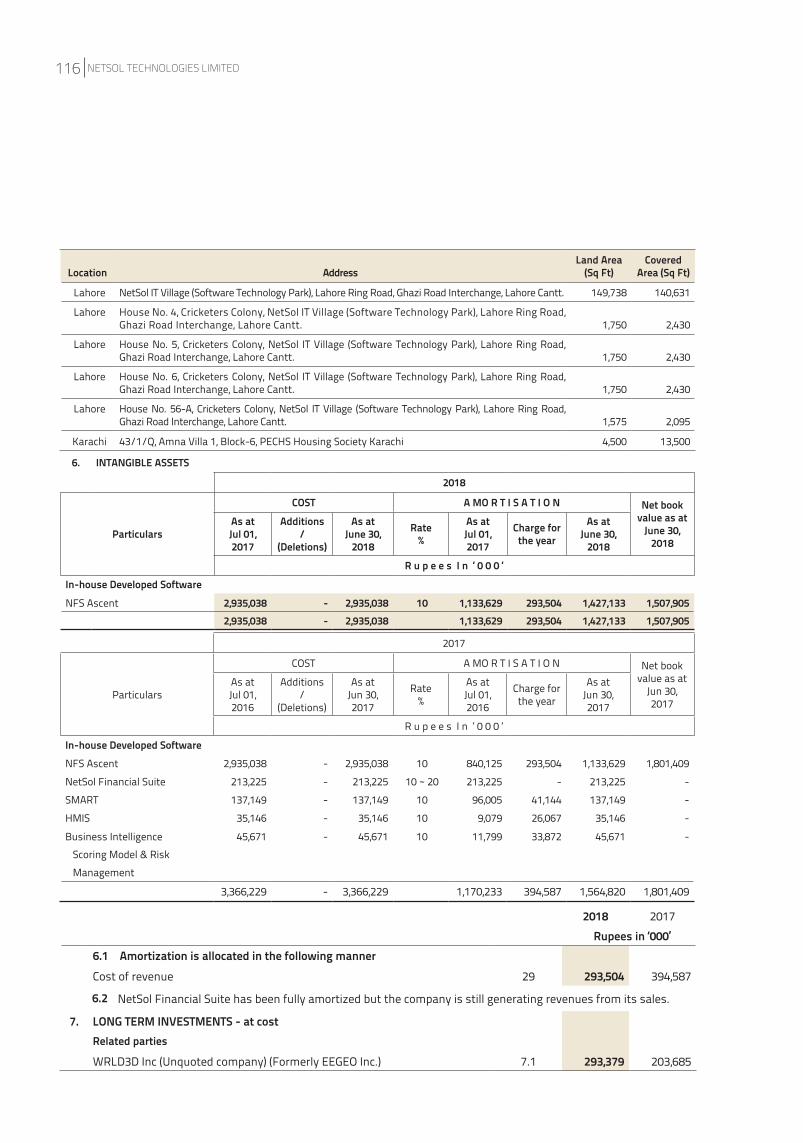
6. INTANGIBLE ASSETS
2018
Particulars
COST A MO R T I S A T I O N Net bookvalue as at
June 30,2018
As atJul 01,2017
Additions /
(Deletions)
As atJune 30,
2018
Rate%
As atJul 01,2017
Charge for the year
As atJune 30,
2018R u p e e s I n ‘ 0 0 0 ‘
In-house Developed SoftwareNFS Ascent 2,935,038 - 2,935,038 10 1,133,629 293,504 1,427,133 1,507,905
2,935,038 - 2,935,038 1,133,629 293,504 1,427,133 1,507,905
7. LONG TERM INVESTMENTS - at costRelated parties
WRLD3D Inc (Unquoted company) (Formerly EEGEO Inc.) 7.1 293,379 203,685
2017
Particulars
COST A MO R T I S A T I O N Net bookvalue as at
Jun 30,2017
As atJul 01,2016
Additions /
(Deletions)
As atJun 30,2017
Rate%
As atJul 01,2016
Charge for the year
As atJun 30,2017
R u p e e s I n ‘ 0 0 0 ‘
In-house Developed SoftwareNFS Ascent 2,935,038 - 2,935,038 10 840,125 293,504 1,133,629 1,801,409 NetSol Financial Suite 213,225 - 213,225 10 ~ 20 213,225 - 213,225 - SMART 137,149 - 137,149 10 96,005 41,144 137,149 -HMIS 35,146 - 35,146 10 9,079 26,067 35,146 -
Business Intelligence 45,671 - 45,671 10 11,799 33,872 45,671 - Scoring Model & Risk Management
3,366,229 - 3,366,229 1,170,233 394,587 1,564,820 1,801,409
2018 2017 Rupees in ‘000’
6.1 Amortization is allocated in the following mannerCost of revenue 29 293,504 394,587
6.2 NetSol Financial Suite has been fully amortized but the company is still generating revenues from its sales.
Location AddressLand Area
(Sq Ft)Covered
Area (Sq Ft)
Lahore NetSol IT Village (Software Technology Park), Lahore Ring Road, Ghazi Road Interchange, Lahore Cantt. 149,738 140,631
Lahore House No. 4, Cricketers Colony, NetSol IT Village (Software Technology Park), Lahore Ring Road, Ghazi Road Interchange, Lahore Cantt. 1,750 2,430
Lahore House No. 5, Cricketers Colony, NetSol IT Village (Software Technology Park), Lahore Ring Road, Ghazi Road Interchange, Lahore Cantt. 1,750 2,430
Lahore House No. 6, Cricketers Colony, NetSol IT Village (Software Technology Park), Lahore Ring Road, Ghazi Road Interchange, Lahore Cantt. 1,750 2,430
Lahore House No. 56-A, Cricketers Colony, NetSol IT Village (Software Technology Park), Lahore Ring Road, Ghazi Road Interchange, Lahore Cantt. 1,575 2,095
Karachi 43/1/Q, Amna Villa 1, Block-6, PECHS Housing Society Karachi 4,500 13,500
NETSOL TECHNOLOGIES LIMITED116
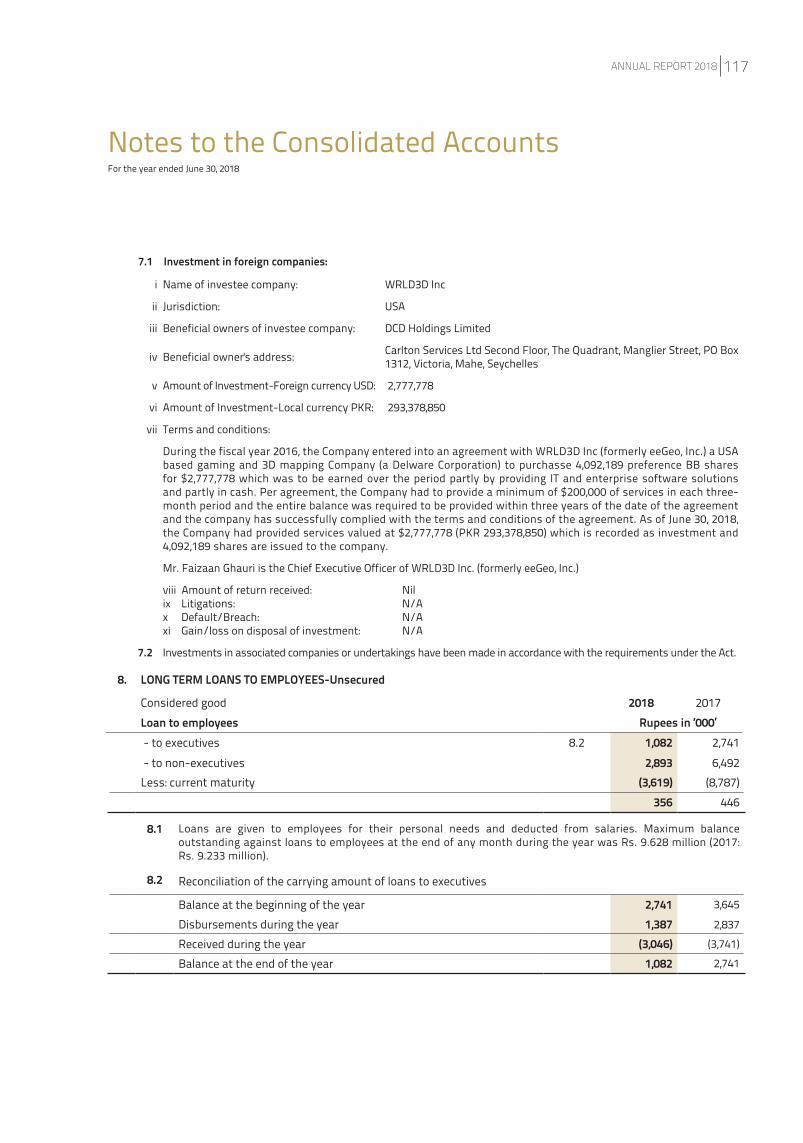
8. LONG TERM LOANS TO EMPLOYEES-Unsecured
Considered goodLoan to employees - to executives 8.2 1,082 2,741 - to non-executives 2,893 6,492 Less: current maturity (3,619) (8,787)
356 446
Notes to the Consolidated AccountsFor the year ended June 30, 2018
2018 2017 Rupees in ‘000’
i Name of investee company: WRLD3D Inc
ii Jurisdiction: USA
iii Beneficial owners of investee company: DCD Holdings Limited
iv Beneficial owner's address: Carlton Services Ltd Second Floor, The Quadrant, Manglier Street, PO Box 1312, Victoria, Mahe, Seychelles
v Amount of Investment-Foreign currency USD: 2,777,778
vi Amount of Investment-Local currency PKR: 293,378,850
vii Terms and conditions:
During the fiscal year 2016, the Company entered into an agreement with WRLD3D Inc (formerly eeGeo, Inc.) a USA based gaming and 3D mapping Company (a Delware Corporation) to purchasse 4,092,189 preference BB shares for $2,777,778 which was to be earned over the period partly by providing IT and enterprise software solutions and partly in cash. Per agreement, the Company had to provide a minimum of $200,000 of services in each three-month period and the entire balance was required to be provided within three years of the date of the agreement and the company has successfully complied with the terms and conditions of the agreement. As of June 30, 2018, the Company had provided services valued at $2,777,778 (PKR 293,378,850) which is recorded as investment and 4,092,189 shares are issued to the company.
Mr. Faizaan Ghauri is the Chief Executive Officer of WRLD3D Inc. (formerly eeGeo, Inc.)
viii Amount of return received: Nilix Litigations: N/Ax Default/Breach: N/Axi Gain/loss on disposal of investment: N/A
7.2 Investments in associated companies or undertakings have been made in accordance with the requirements under the Act.
7.1 Investment in foreign companies:
8.1 Loans are given to employees for their personal needs and deducted from salaries. Maximum balance outstanding against loans to employees at the end of any month during the year was Rs. 9.628 million (2017: Rs. 9.233 million).
8.2 Reconciliation of the carrying amount of loans to executives
Balance at the beginning of the year 2,741 3,645
Disbursements during the year 1,387 2,837
Received during the year (3,046) (3,741)
Balance at the end of the year 1,082 2,741
ANNUAL REPORT 2018 117
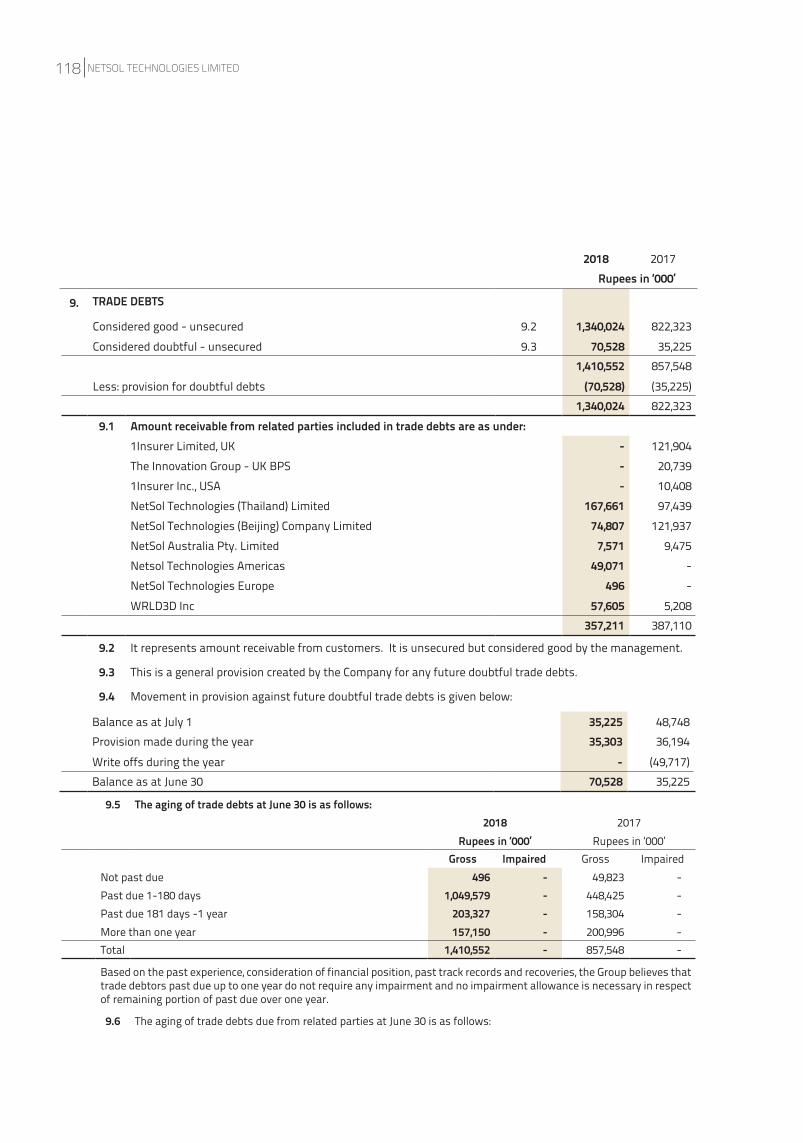
Balance as at July 1 35,225 48,748 Provision made during the year 35,303 36,194 Write offs during the year - (49,717)Balance as at June 30 70,528 35,225
9.5 The aging of trade debts at June 30 is as follows:2018 2017
Rupees in ‘000’ Rupees in ‘000’ Gross Impaired Gross Impaired
Not past due 496 - 49,823 - Past due 1-180 days 1,049,579 - 448,425 - Past due 181 days -1 year 203,327 - 158,304 - More than one year 157,150 - 200,996 - Total 1,410,552 - 857,548 -
Based on the past experience, consideration of financial position, past track records and recoveries, the Group believes that trade debtors past due up to one year do not require any impairment and no impairment allowance is necessary in respect of remaining portion of past due over one year.
9.6 The aging of trade debts due from related parties at June 30 is as follows:
9. TRADE DEBTS
Considered good - unsecured 9.2 1,340,024 822,323 Considered doubtful - unsecured 9.3 70,528 35,225
1,410,552 857,548 Less: provision for doubtful debts (70,528) (35,225)
1,340,024 822,323 9.1 Amount receivable from related parties included in trade debts are as under:
1Insurer Limited, UK - 121,904 The Innovation Group - UK BPS - 20,739 1Insurer Inc., USA - 10,408 NetSol Technologies (Thailand) Limited 167,661 97,439 NetSol Technologies (Beijing) Company Limited 74,807 121,937 NetSol Australia Pty. Limited 7,571 9,475 Netsol Technologies Americas 49,071 - NetSol Technologies Europe 496 - WRLD3D Inc 57,605 5,208
357,211 387,110
9.2 It represents amount receivable from customers. It is unsecured but considered good by the management.
9.3 This is a general provision created by the Company for any future doubtful trade debts.
9.4 Movement in provision against future doubtful trade debts is given below:
2018 2017 Rupees in ‘000’
NETSOL TECHNOLOGIES LIMITED118
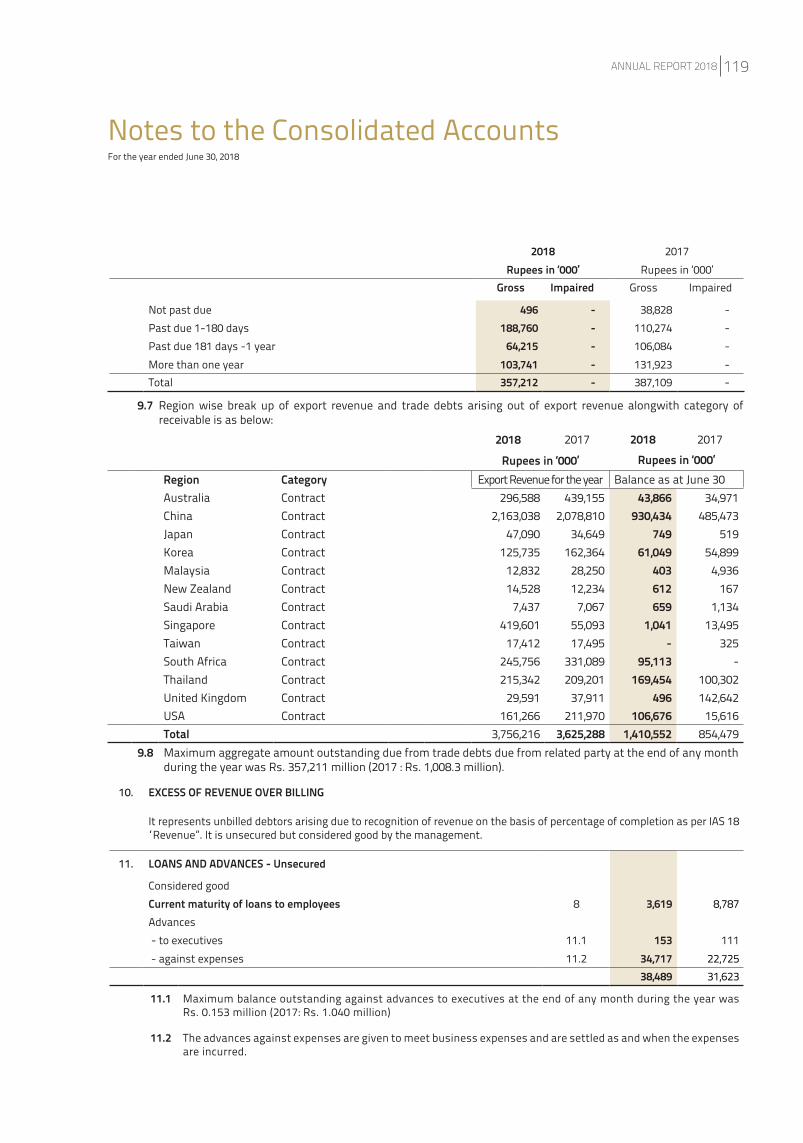
2018 2017Rupees in ‘000’ Rupees in ‘000’
Gross Impaired Gross Impaired
Not past due 496 - 38,828 - Past due 1-180 days 188,760 - 110,274 - Past due 181 days -1 year 64,215 - 106,084 - More than one year 103,741 - 131,923 - Total 357,212 - 387,109 -
Notes to the Consolidated AccountsFor the year ended June 30, 2018
10. EXCESS OF REVENUE OVER BILLING
It represents unbilled debtors arising due to recognition of revenue on the basis of percentage of completion as per IAS 18 “Revenue”. It is unsecured but considered good by the management.
11. LOANS AND ADVANCES - Unsecured
Considered goodCurrent maturity of loans to employees 8 3,619 8,787 Advances - to executives 11.1 153 111 - against expenses 11.2 34,717 22,725
38,489 31,623
11.1 Maximum balance outstanding against advances to executives at the end of any month during the year was Rs. 0.153 million (2017: Rs. 1.040 million)
11.2 The advances against expenses are given to meet business expenses and are settled as and when the expenses are incurred.
9.7 Region wise break up of export revenue and trade debts arising out of export revenue alongwith category of receivable is as below:
2018 2017 2018 2017
Rupees in ‘000’ Rupees in ‘000’Region Category Export Revenue for the year Balance as at June 30Australia Contract 296,588 439,155 43,866 34,971 China Contract 2,163,038 2,078,810 930,434 485,473 Japan Contract 47,090 34,649 749 519 Korea Contract 125,735 162,364 61,049 54,899 Malaysia Contract 12,832 28,250 403 4,936 New Zealand Contract 14,528 12,234 612 167 Saudi Arabia Contract 7,437 7,067 659 1,134 Singapore Contract 419,601 55,093 1,041 13,495 Taiwan Contract 17,412 17,495 - 325 South Africa Contract 245,756 331,089 95,113 - Thailand Contract 215,342 209,201 169,454 100,302 United Kingdom Contract 29,591 37,911 496 142,642 USA Contract 161,266 211,970 106,676 15,616 Total 3,756,216 3,625,288 1,410,552 854,479
9.8 Maximum aggregate amount outstanding due from trade debts due from related party at the end of any month during the year was Rs. 357,211 million (2017 : Rs. 1,008.3 million).
ANNUAL REPORT 2018 119
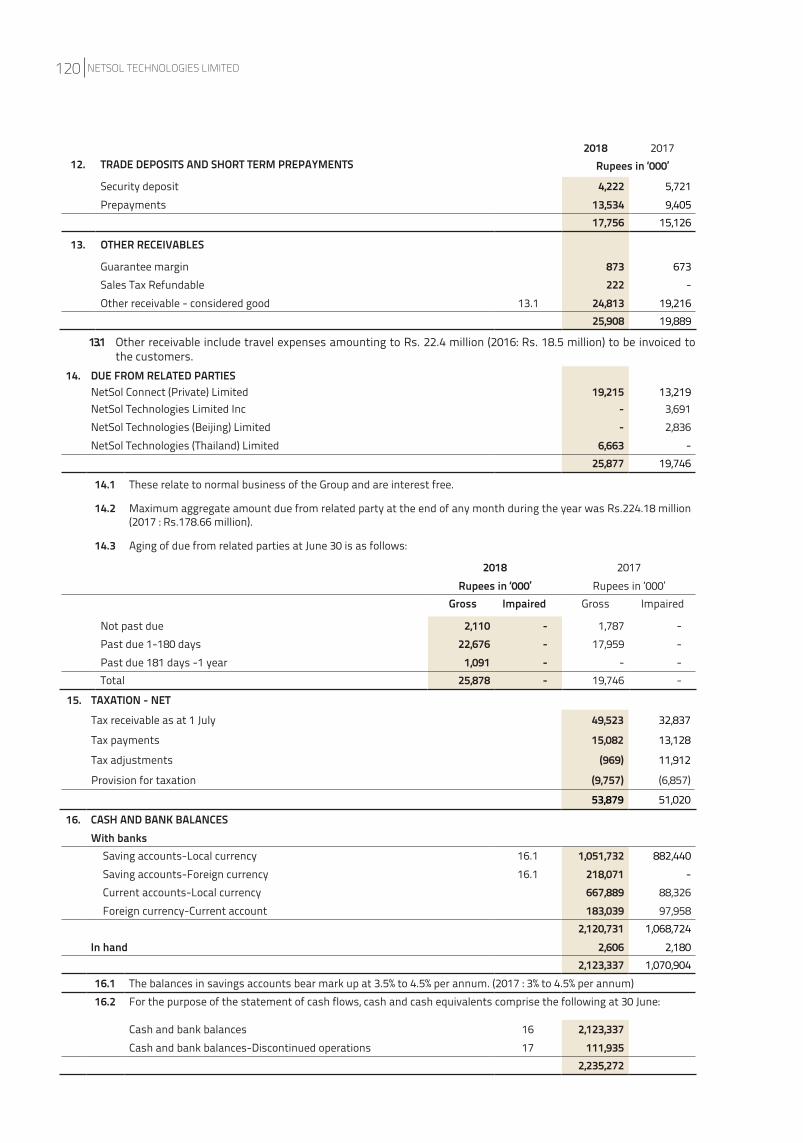
16. CASH AND BANK BALANCESWith banks
Saving accounts-Local currency 16.1 1,051,732 882,440 Saving accounts-Foreign currency 16.1 218,071 - Current accounts-Local currency 667,889 88,326 Foreign currency-Current account 183,039 97,958
2,120,731 1,068,724 In hand 2,606 2,180
2,123,337 1,070,904 16.1 The balances in savings accounts bear mark up at 3.5% to 4.5% per annum. (2017 : 3% to 4.5% per annum)16.2 For the purpose of the statement of cash flows, cash and cash equivalents comprise the following at 30 June:
Cash and bank balances 16 2,123,337 Cash and bank balances-Discontinued operations 17 111,935
2,235,272
2018 2017 Rupees in ‘000’12. TRADE DEPOSITS AND SHORT TERM PREPAYMENTS
Security deposit 4,222 5,721 Prepayments 13,534 9,405
17,756 15,126
13. OTHER RECEIVABLES
Guarantee margin 873 673 Sales Tax Refundable 222 - Other receivable - considered good 13.1 24,813 19,216
25,908 19,889
14. DUE FROM RELATED PARTIESNetSol Connect (Private) Limited 19,215 13,219 NetSol Technologies Limited Inc - 3,691 NetSol Technologies (Beijing) Limited - 2,836 NetSol Technologies (Thailand) Limited 6,663 -
25,877 19,746
14.1 These relate to normal business of the Group and are interest free.
14.2 Maximum aggregate amount due from related party at the end of any month during the year was Rs.224.18 million (2017 : Rs.178.66 million).
14.3 Aging of due from related parties at June 30 is as follows:
15. TAXATION - NETTax receivable as at 1 July 49,523 32,837
Tax payments 15,082 13,128
Tax adjustments (969) 11,912
Provision for taxation (9,757) (6,857)
53,879 51,020
13.1 Other receivable include travel expenses amounting to Rs. 22.4 million (2016: Rs. 18.5 million) to be invoiced to the customers.
2018 2017Rupees in ‘000’ Rupees in ‘000’
Gross Impaired Gross Impaired
Not past due 2,110 - 1,787 - Past due 1-180 days 22,676 - 17,959 - Past due 181 days -1 year 1,091 - - - Total 25,878 - 19,746 -
NETSOL TECHNOLOGIES LIMITED120
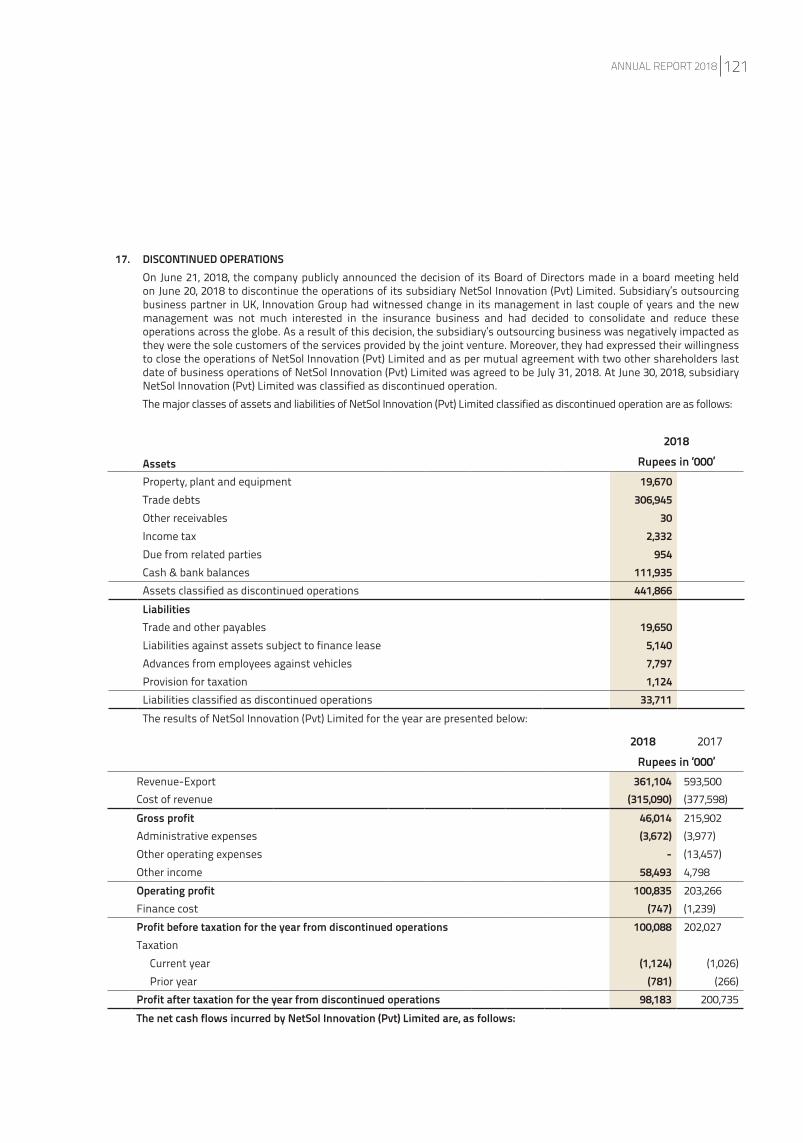
AssetsProperty, plant and equipment 19,670 Trade debts 306,945 Other receivables 30 Income tax 2,332 Due from related parties 954 Cash & bank balances 111,935 Assets classified as discontinued operations 441,866 LiabilitiesTrade and other payables 19,650 Liabilities against assets subject to finance lease 5,140 Advances from employees against vehicles 7,797 Provision for taxation 1,124 Liabilities classified as discontinued operations 33,711 The results of NetSol Innovation (Pvt) Limited for the year are presented below:
17. DISCONTINUED OPERATIONSOn June 21, 2018, the company publicly announced the decision of its Board of Directors made in a board meeting held on June 20, 2018 to discontinue the operations of its subsidiary NetSol Innovation (Pvt) Limited. Subsidiary’s outsourcing business partner in UK, Innovation Group had witnessed change in its management in last couple of years and the new management was not much interested in the insurance business and had decided to consolidate and reduce these operations across the globe. As a result of this decision, the subsidiary’s outsourcing business was negatively impacted as they were the sole customers of the services provided by the joint venture. Moreover, they had expressed their willingness to close the operations of NetSol Innovation (Pvt) Limited and as per mutual agreement with two other shareholders last date of business operations of NetSol Innovation (Pvt) Limited was agreed to be July 31, 2018. At June 30, 2018, subsidiary NetSol Innovation (Pvt) Limited was classified as discontinued operation.The major classes of assets and liabilities of NetSol Innovation (Pvt) Limited classified as discontinued operation are as follows:
2018 2017Rupees in ‘000’
Revenue-Export 361,104 593,500 Cost of revenue (315,090) (377,598)Gross profit 46,014 215,902 Administrative expenses (3,672) (3,977)Other operating expenses - (13,457)Other income 58,493 4,798 Operating profit 100,835 203,266 Finance cost (747) (1,239)Profit before taxation for the year from discontinued operations 100,088 202,027 Taxation Current year (1,124) (1,026) Prior year (781) (266)Profit after taxation for the year from discontinued operations 98,183 200,735 The net cash flows incurred by NetSol Innovation (Pvt) Limited are, as follows:
2018Rupees in ‘000’
ANNUAL REPORT 2018 121
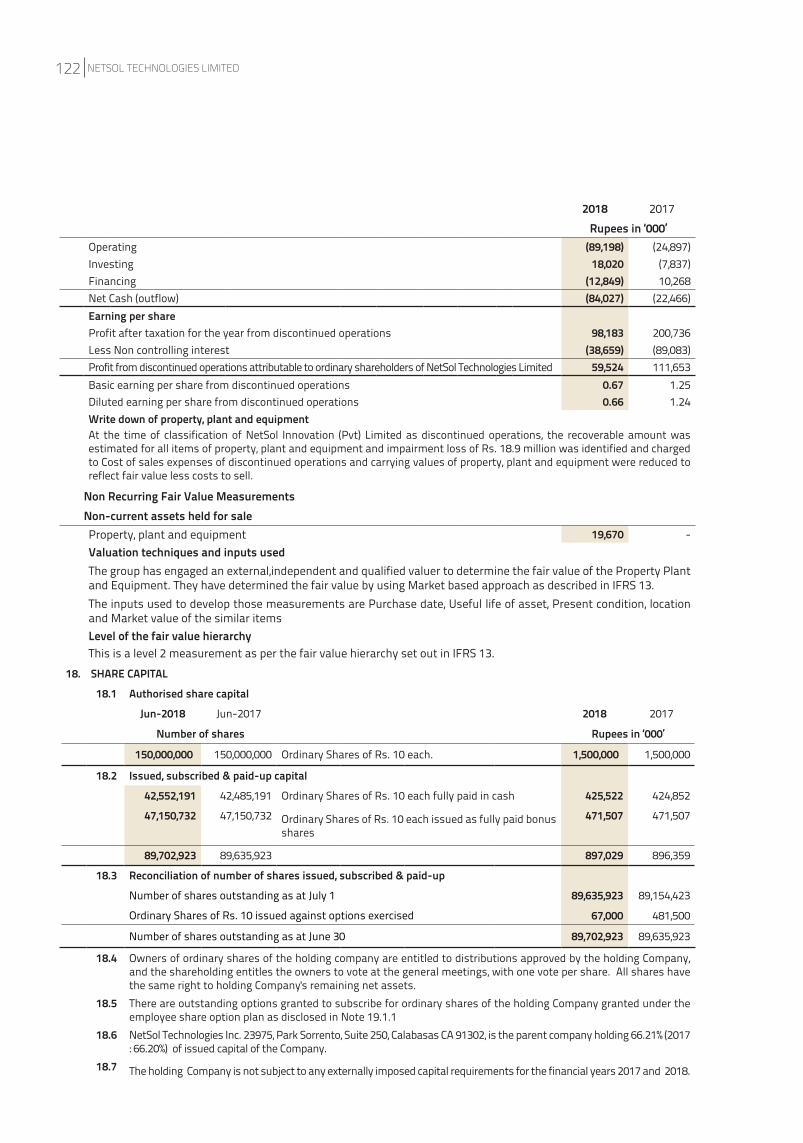
18.4 Owners of ordinary shares of the holding company are entitled to distributions approved by the holding Company, and the shareholding entitles the owners to vote at the general meetings, with one vote per share. All shares have the same right to holding Company's remaining net assets.
18.5 There are outstanding options granted to subscribe for ordinary shares of the holding Company granted under the employee share option plan as disclosed in Note 19.1.1
18.6 NetSol Technologies Inc. 23975, Park Sorrento, Suite 250, Calabasas CA 91302, is the parent company holding 66.21% (2017 : 66.20%) of issued capital of the Company.
18.7 The holding Company is not subject to any externally imposed capital requirements for the financial years 2017 and 2018.
18. SHARE CAPITAL 18.1 Authorised share capital
Jun-2018 Jun-2017 2018 2017
Number of shares Rupees in ‘000’
150,000,000 150,000,000 Ordinary Shares of Rs. 10 each. 1,500,000 1,500,000
18.2 Issued, subscribed & paid-up capital 42,552,191 42,485,191 Ordinary Shares of Rs. 10 each fully paid in cash 425,522 424,852
47,150,732 47,150,732 Ordinary Shares of Rs. 10 each issued as fully paid bonus shares
471,507 471,507
89,702,923 89,635,923 897,029 896,359
18.3 Reconciliation of number of shares issued, subscribed & paid-upNumber of shares outstanding as at July 1 89,635,923 89,154,423
Ordinary Shares of Rs. 10 issued against options exercised 67,000 481,500
Number of shares outstanding as at June 30 89,702,923 89,635,923
2018 2017Rupees in ‘000’
Operating (89,198) (24,897)Investing 18,020 (7,837)Financing (12,849) 10,268 Net Cash (outflow) (84,027) (22,466)Earning per shareProfit after taxation for the year from discontinued operations 98,183 200,736 Less Non controlling interest (38,659) (89,083)Profit from discontinued operations attributable to ordinary shareholders of NetSol Technologies Limited 59,524 111,653 Basic earning per share from discontinued operations 0.67 1.25 Diluted earning per share from discontinued operations 0.66 1.24 Write down of property, plant and equipmentAt the time of classification of NetSol Innovation (Pvt) Limited as discontinued operations, the recoverable amount was estimated for all items of property, plant and equipment and impairment loss of Rs. 18.9 million was identified and charged to Cost of sales expenses of discontinued operations and carrying values of property, plant and equipment were reduced to reflect fair value less costs to sell.
Non Recurring Fair Value MeasurementsNon-current assets held for saleProperty, plant and equipment 19,670 -Valuation techniques and inputs usedThe group has engaged an external,independent and qualified valuer to determine the fair value of the Property Plant and Equipment. They have determined the fair value by using Market based approach as described in IFRS 13.The inputs used to develop those measurements are Purchase date, Useful life of asset, Present condition, location and Market value of the similar itemsLevel of the fair value hierarchyThis is a level 2 measurement as per the fair value hierarchy set out in IFRS 13.
NETSOL TECHNOLOGIES LIMITED122
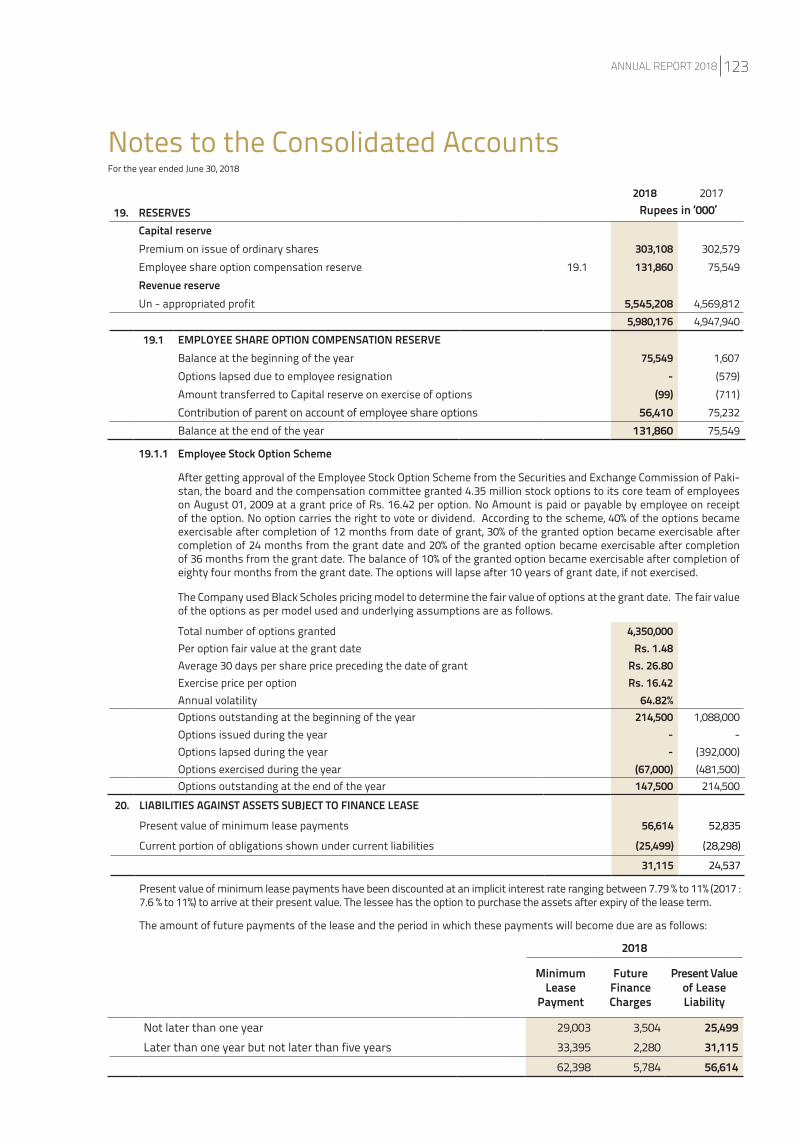
The Company used Black Scholes pricing model to determine the fair value of options at the grant date. The fair value of the options as per model used and underlying assumptions are as follows.
Total number of options granted 4,350,000 Per option fair value at the grant date Rs. 1.48Average 30 days per share price preceding the date of grant Rs. 26.80Exercise price per option Rs. 16.42Annual volatility 64.82%Options outstanding at the beginning of the year 214,500 1,088,000 Options issued during the year - - Options lapsed during the year - (392,000)Options exercised during the year (67,000) (481,500)Options outstanding at the end of the year 147,500 214,500
20. LIABILITIES AGAINST ASSETS SUBJECT TO FINANCE LEASE
Present value of minimum lease payments 56,614 52,835
Current portion of obligations shown under current liabilities (25,499) (28,298)
31,115 24,537
Present value of minimum lease payments have been discounted at an implicit interest rate ranging between 7.79 % to 11% (2017 : 7.6 % to 11%) to arrive at their present value. The lessee has the option to purchase the assets after expiry of the lease term.
The amount of future payments of the lease and the period in which these payments will become due are as follows:
2018
Minimum Lease
Payment
Future Finance Charges
Present Value of Lease Liability
Not later than one year 29,003 3,504 25,499 Later than one year but not later than five years 33,395 2,280 31,115
62,398 5,784 56,614
19.1.1 Employee Stock Option Scheme
After getting approval of the Employee Stock Option Scheme from the Securities and Exchange Commission of Paki-stan, the board and the compensation committee granted 4.35 million stock options to its core team of employees on August 01, 2009 at a grant price of Rs. 16.42 per option. No Amount is paid or payable by employee on receipt of the option. No option carries the right to vote or dividend. According to the scheme, 40% of the options became exercisable after completion of 12 months from date of grant, 30% of the granted option became exercisable after completion of 24 months from the grant date and 20% of the granted option became exercisable after completion of 36 months from the grant date. The balance of 10% of the granted option became exercisable after completion of eighty four months from the grant date. The options will lapse after 10 years of grant date, if not exercised.
Notes to the Consolidated AccountsFor the year ended June 30, 2018
19. RESERVESCapital reservePremium on issue of ordinary shares 303,108 302,579 Employee share option compensation reserve 19.1 131,860 75,549 Revenue reserveUn - appropriated profit 5,545,208 4,569,812
5,980,176 4,947,940 19.1 EMPLOYEE SHARE OPTION COMPENSATION RESERVE
Balance at the beginning of the year 75,549 1,607 Options lapsed due to employee resignation - (579)Amount transferred to Capital reserve on exercise of options (99) (711)Contribution of parent on account of employee share options 56,410 75,232Balance at the end of the year 131,860 75,549
2018 2017Rupees in ‘000’
ANNUAL REPORT 2018 123
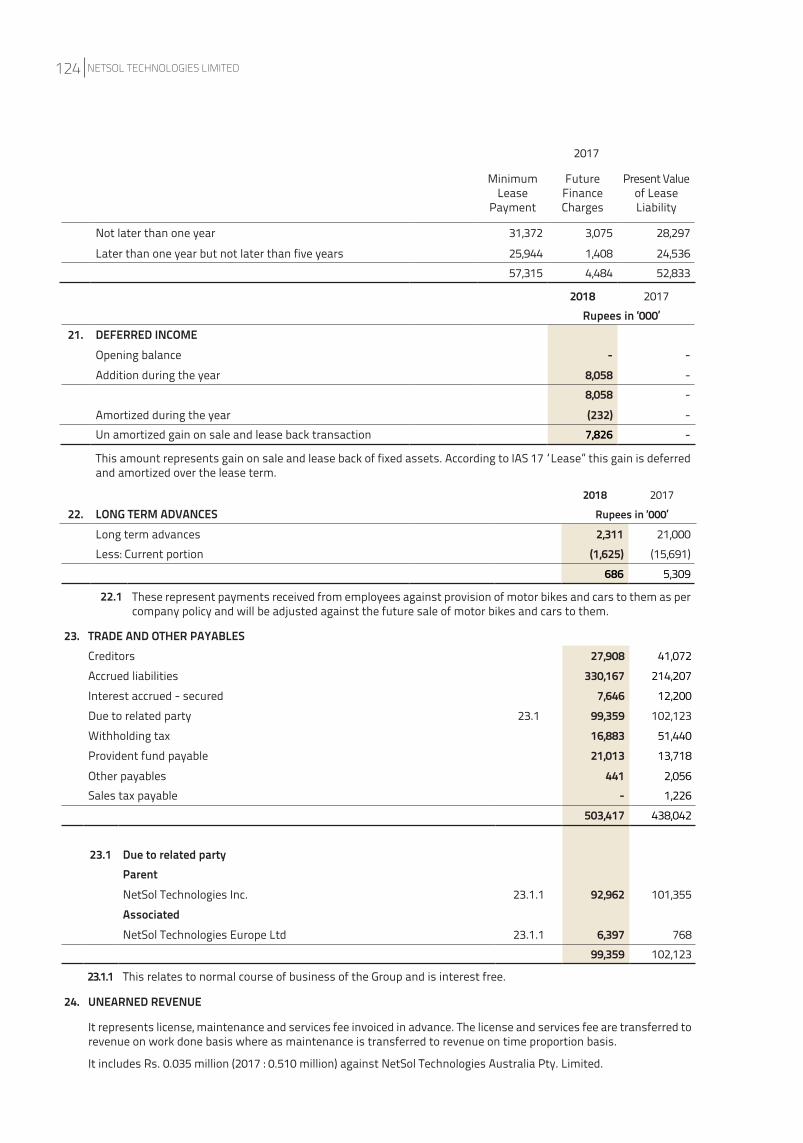
23. TRADE AND OTHER PAYABLESCreditors 27,908 41,072 Accrued liabilities 330,167 214,207 Interest accrued - secured 7,646 12,200 Due to related party 23.1 99,359 102,123 Withholding tax 16,883 51,440 Provident fund payable 21,013 13,718 Other payables 441 2,056 Sales tax payable - 1,226
503,417 438,042
23.1 Due to related partyParentNetSol Technologies Inc. 23.1.1 92,962 101,355 AssociatedNetSol Technologies Europe Ltd 23.1.1 6,397 768
99,359 102,123
23.1.1 This relates to normal course of business of the Group and is interest free.
24. UNEARNED REVENUE
It represents license, maintenance and services fee invoiced in advance. The license and services fee are transferred to revenue on work done basis where as maintenance is transferred to revenue on time proportion basis.
It includes Rs. 0.035 million (2017 : 0.510 million) against NetSol Technologies Australia Pty. Limited.
This amount represents gain on sale and lease back of fixed assets. According to IAS 17 “Lease” this gain is deferred and amortized over the lease term.
2018 201722. LONG TERM ADVANCES Rupees in ‘000’
Long term advances 2,311 21,000 Less: Current portion (1,625) (15,691)
686 5,309
22.1 These represent payments received from employees against provision of motor bikes and cars to them as per company policy and will be adjusted against the future sale of motor bikes and cars to them.
2018 2017Rupees in ‘000’
21. DEFERRED INCOMEOpening balance - -Addition during the year 8,058 -
8,058 -Amortized during the year (232) -Un amortized gain on sale and lease back transaction 7,826 -
2017
Minimum Lease
Payment
Future Finance Charges
Present Value of Lease Liability
Not later than one year 31,372 3,075 28,297 Later than one year but not later than five years 25,944 1,408 24,536
57,315 4,484 52,833
NETSOL TECHNOLOGIES LIMITED124
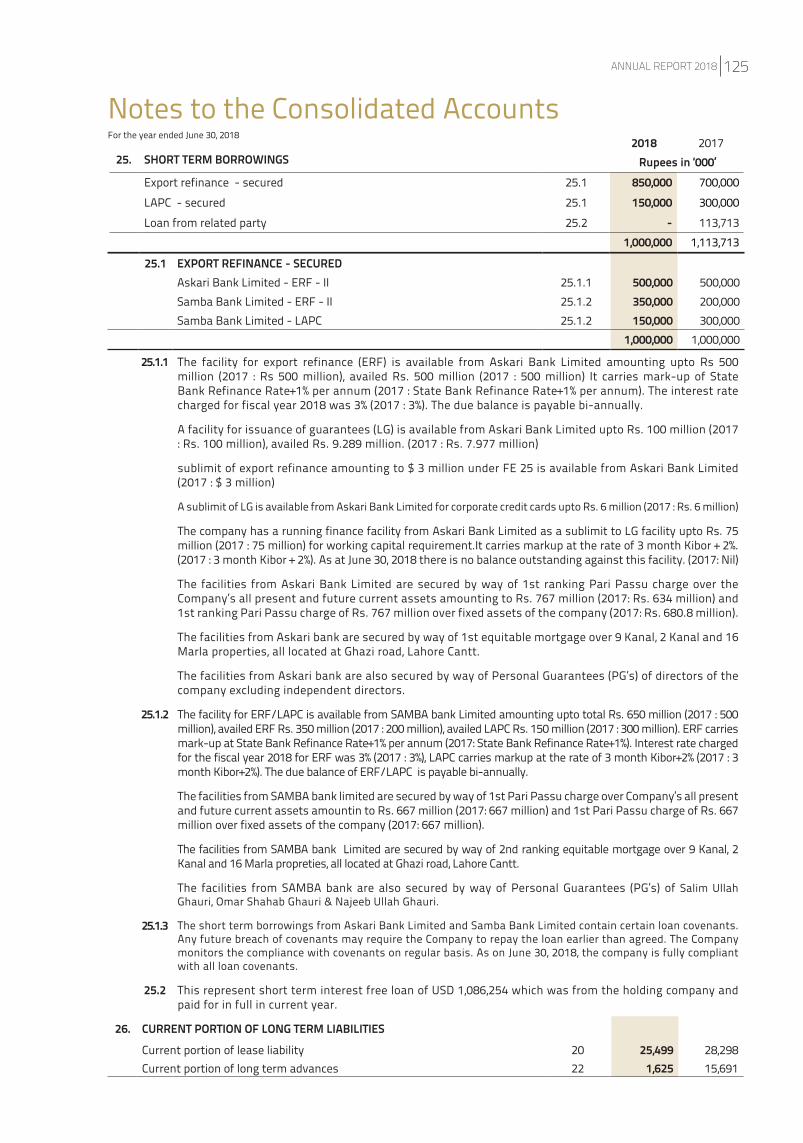
25.1.1 The facility for export refinance (ERF) is available from Askari Bank Limited amounting upto Rs 500 million (2017 : Rs 500 million), availed Rs. 500 million (2017 : 500 million) It carries mark-up of State Bank Refinance Rate+1% per annum (2017 : State Bank Refinance Rate+1% per annum). The interest rate charged for fiscal year 2018 was 3% (2017 : 3%). The due balance is payable bi-annually.
A facility for issuance of guarantees (LG) is available from Askari Bank Limited upto Rs. 100 million (2017 : Rs. 100 million), availed Rs. 9.289 million. (2017 : Rs. 7.977 million)
sublimit of export refinance amounting to $ 3 million under FE 25 is available from Askari Bank Limited (2017 : $ 3 million)
A sublimit of LG is available from Askari Bank Limited for corporate credit cards upto Rs. 6 million (2017 : Rs. 6 million)
The company has a running finance facility from Askari Bank Limited as a sublimit to LG facility upto Rs. 75 million (2017 : 75 million) for working capital requirement.It carries markup at the rate of 3 month Kibor + 2%. (2017 : 3 month Kibor + 2%). As at June 30, 2018 there is no balance outstanding against this facility. (2017: Nil)
The facilities from Askari Bank Limited are secured by way of 1st ranking Pari Passu charge over the Company’s all present and future current assets amounting to Rs. 767 million (2017: Rs. 634 million) and 1st ranking Pari Passu charge of Rs. 767 million over fixed assets of the company (2017: Rs. 680.8 million).
The facilities from Askari bank are secured by way of 1st equitable mortgage over 9 Kanal, 2 Kanal and 16 Marla properties, all located at Ghazi road, Lahore Cantt.
The facilities from Askari bank are also secured by way of Personal Guarantees (PG’s) of directors of the company excluding independent directors.
25.1.2 The facility for ERF/LAPC is available from SAMBA bank Limited amounting upto total Rs. 650 million (2017 : 500 million), availed ERF Rs. 350 million (2017 : 200 million), availed LAPC Rs. 150 million (2017 : 300 million). ERF carries mark-up at State Bank Refinance Rate+1% per annum (2017: State Bank Refinance Rate+1%). Interest rate charged for the fiscal year 2018 for ERF was 3% (2017 : 3%), LAPC carries markup at the rate of 3 month Kibor+2% (2017 : 3 month Kibor+2%). The due balance of ERF/LAPC is payable bi-annually.
The facilities from SAMBA bank limited are secured by way of 1st Pari Passu charge over Company’s all present and future current assets amountin to Rs. 667 million (2017: 667 million) and 1st Pari Passu charge of Rs. 667 million over fixed assets of the company (2017: 667 million).
The facilities from SAMBA bank Limited are secured by way of 2nd ranking equitable mortgage over 9 Kanal, 2 Kanal and 16 Marla propreties, all located at Ghazi road, Lahore Cantt.
The facilities from SAMBA bank are also secured by way of Personal Guarantees (PG’s) of Salim Ullah Ghauri, Omar Shahab Ghauri & Najeeb Ullah Ghauri.
25.1.3 The short term borrowings from Askari Bank Limited and Samba Bank Limited contain certain loan covenants. Any future breach of covenants may require the Company to repay the loan earlier than agreed. The Company monitors the compliance with covenants on regular basis. As on June 30, 2018, the company is fully compliant with all loan covenants.
25.2 This represent short term interest free loan of USD 1,086,254 which was from the holding company and paid for in full in current year.
26. CURRENT PORTION OF LONG TERM LIABILITIESCurrent portion of lease liability 20 25,499 28,298 Current portion of long term advances 22 1,625 15,691
25.1 EXPORT REFINANCE - SECUREDAskari Bank Limited - ERF - II 25.1.1 500,000 500,000 Samba Bank Limited - ERF - II 25.1.2 350,000 200,000 Samba Bank Limited - LAPC 25.1.2 150,000 300,000
1,000,000 1,000,000
25. SHORT TERM BORROWINGS
Export refinance - secured 25.1 850,000 700,000 LAPC - secured 25.1 150,000 300,000Loan from related party 25.2 - 113,713
1,000,000 1,113,713
2018 2017Rupees in ‘000’
Notes to the Consolidated AccountsFor the year ended June 30, 2018
ANNUAL REPORT 2018 125
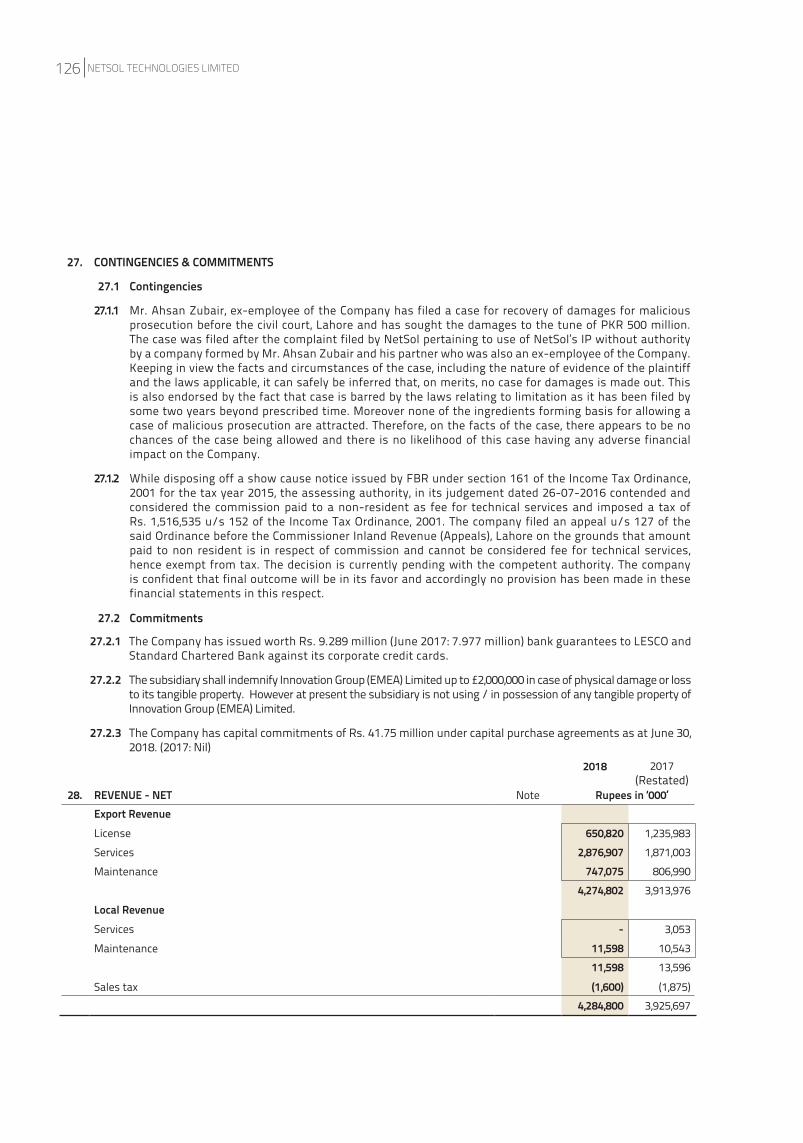
27.2.1 The Company has issued worth Rs. 9.289 million (June 2017: 7.977 million) bank guarantees to LESCO and Standard Chartered Bank against its corporate credit cards.
27.2.2 The subsidiary shall indemnify Innovation Group (EMEA) Limited up to £2,000,000 in case of physical damage or loss to its tangible property. However at present the subsidiary is not using / in possession of any tangible property of Innovation Group (EMEA) Limited.
27.2.3 The Company has capital commitments of Rs. 41.75 million under capital purchase agreements as at June 30, 2018. (2017: Nil)
27.2 Commitments
27. CONTINGENCIES & COMMITMENTS
27.1 Contingencies
27.1.1 Mr. Ahsan Zubair, ex-employee of the Company has filed a case for recovery of damages for malicious prosecution before the civil court, Lahore and has sought the damages to the tune of PKR 500 million. The case was filed after the complaint filed by NetSol pertaining to use of NetSol’s IP without authority by a company formed by Mr. Ahsan Zubair and his partner who was also an ex-employee of the Company. Keeping in view the facts and circumstances of the case, including the nature of evidence of the plaintiff and the laws applicable, it can safely be inferred that, on merits, no case for damages is made out. This is also endorsed by the fact that case is barred by the laws relating to limitation as it has been filed by some two years beyond prescribed time. Moreover none of the ingredients forming basis for allowing a case of malicious prosecution are attracted. Therefore, on the facts of the case, there appears to be no chances of the case being allowed and there is no likelihood of this case having any adverse financial impact on the Company.
27.1.2 While disposing off a show cause notice issued by FBR under section 161 of the Income Tax Ordinance, 2001 for the tax year 2015, the assessing authority, in its judgement dated 26-07-2016 contended and considered the commission paid to a non-resident as fee for technical services and imposed a tax of Rs. 1,516,535 u/s 152 of the Income Tax Ordinance, 2001. The company filed an appeal u/s 127 of the said Ordinance before the Commissioner Inland Revenue (Appeals), Lahore on the grounds that amount paid to non resident is in respect of commission and cannot be considered fee for technical services, hence exempt from tax. The decision is currently pending with the competent authority. The company is confident that final outcome will be in its favor and accordingly no provision has been made in these financial statements in this respect.
2018 2017(Restated)
28. REVENUE - NET Note Rupees in ‘000’Export RevenueLicense 650,820 1,235,983 Services 2,876,907 1,871,003 Maintenance 747,075 806,990
4,274,802 3,913,976 Local RevenueServices - 3,053 Maintenance 11,598 10,543
11,598 13,596
Sales tax (1,600) (1,875) 4,284,800 3,925,697
NETSOL TECHNOLOGIES LIMITED126
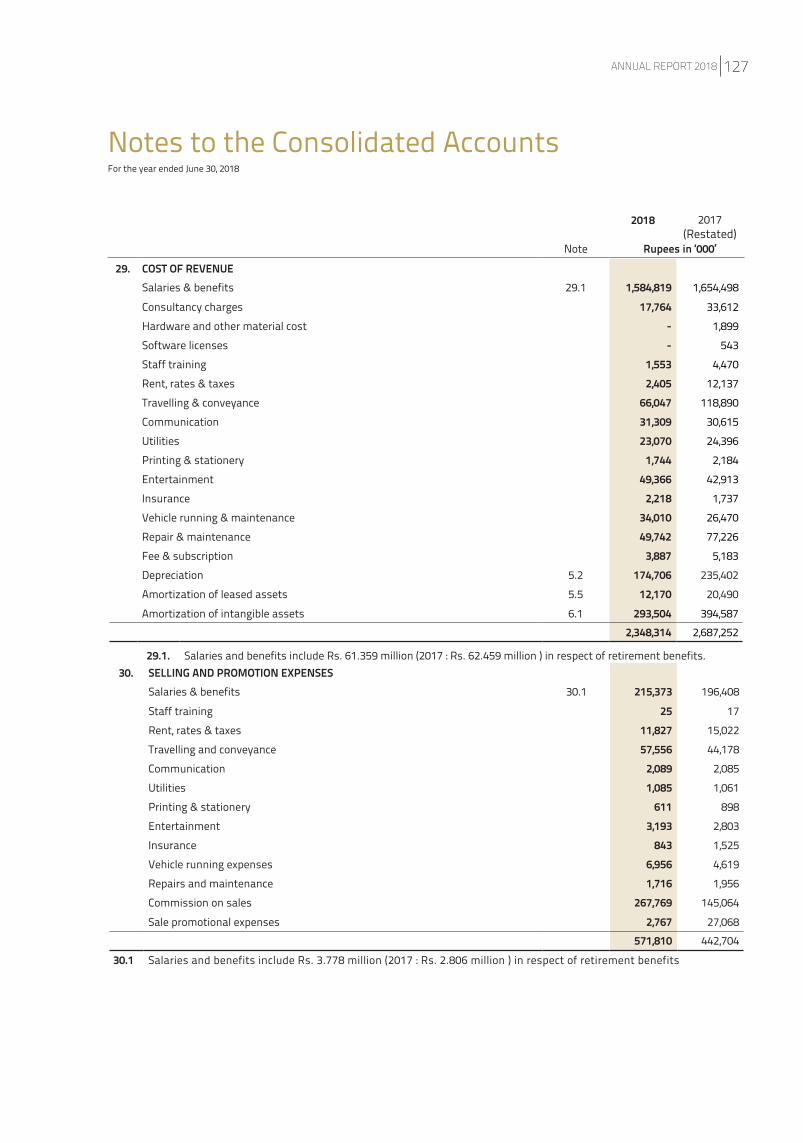
29. COST OF REVENUESalaries & benefits 29.1 1,584,819 1,654,498
Consultancy charges 17,764 33,612 Hardware and other material cost - 1,899 Software licenses - 543 Staff training 1,553 4,470 Rent, rates & taxes 2,405 12,137 Travelling & conveyance 66,047 118,890 Communication 31,309 30,615 Utilities 23,070 24,396 Printing & stationery 1,744 2,184 Entertainment 49,366 42,913 Insurance 2,218 1,737 Vehicle running & maintenance 34,010 26,470 Repair & maintenance 49,742 77,226 Fee & subscription 3,887 5,183 Depreciation 5.2 174,706 235,402 Amortization of leased assets 5.5 12,170 20,490 Amortization of intangible assets 6.1 293,504 394,587
2,348,314 2,687,252
29.1. Salaries and benefits include Rs. 61.359 million (2017 : Rs. 62.459 million ) in respect of retirement benefits.
2018 2017(Restated)
Note Rupees in ‘000’
30. SELLING AND PROMOTION EXPENSESSalaries & benefits 30.1 215,373 196,408
Staff training 25 17 Rent, rates & taxes 11,827 15,022 Travelling and conveyance 57,556 44,178 Communication 2,089 2,085 Utilities 1,085 1,061 Printing & stationery 611 898 Entertainment 3,193 2,803 Insurance 843 1,525 Vehicle running expenses 6,956 4,619 Repairs and maintenance 1,716 1,956 Commission on sales 267,769 145,064 Sale promotional expenses 2,767 27,068
571,810 442,704 30.1 Salaries and benefits include Rs. 3.778 million (2017 : Rs. 2.806 million ) in respect of retirement benefits
Notes to the Consolidated AccountsFor the year ended June 30, 2018
ANNUAL REPORT 2018 127
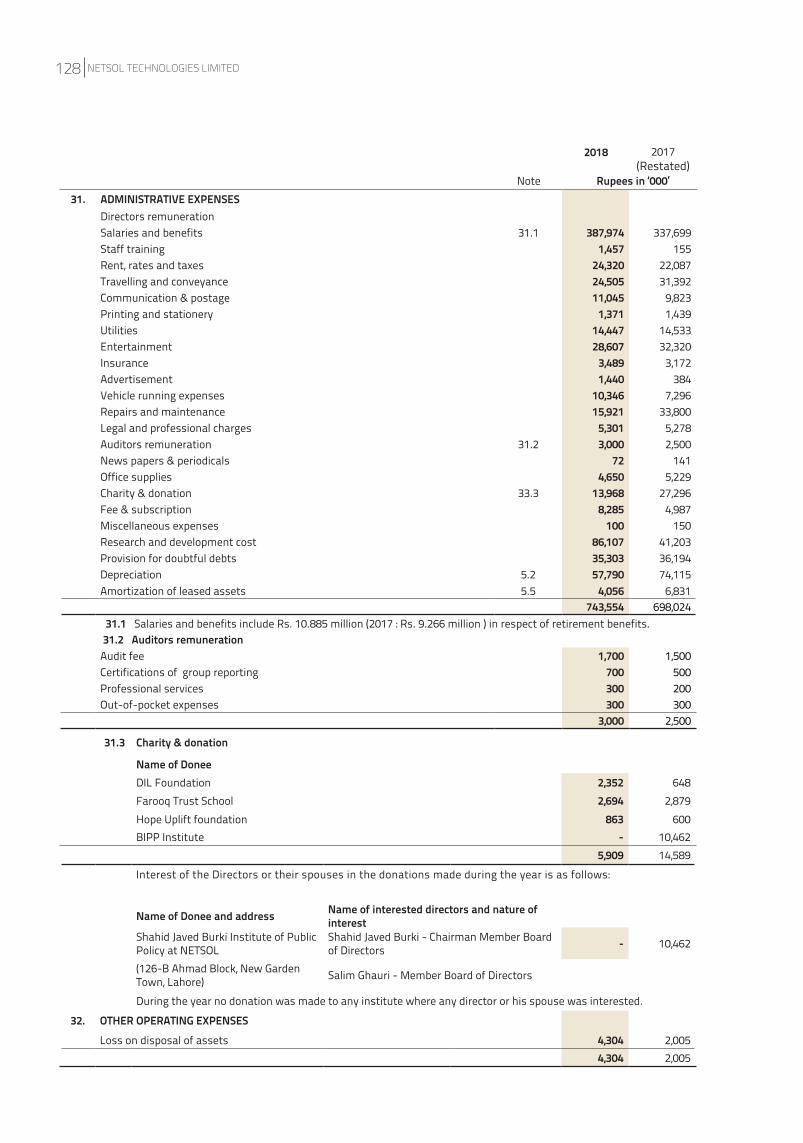
31. ADMINISTRATIVE EXPENSESDirectors remunerationSalaries and benefits 31.1 387,974 337,699 Staff training 1,457 155 Rent, rates and taxes 24,320 22,087 Travelling and conveyance 24,505 31,392 Communication & postage 11,045 9,823 Printing and stationery 1,371 1,439 Utilities 14,447 14,533 Entertainment 28,607 32,320 Insurance 3,489 3,172 Advertisement 1,440 384 Vehicle running expenses 10,346 7,296 Repairs and maintenance 15,921 33,800 Legal and professional charges 5,301 5,278 Auditors remuneration 31.2 3,000 2,500 News papers & periodicals 72 141 Office supplies 4,650 5,229 Charity & donation 33.3 13,968 27,296 Fee & subscription 8,285 4,987 Miscellaneous expenses 100 150 Research and development cost 86,107 41,203 Provision for doubtful debts 35,303 36,194 Depreciation 5.2 57,790 74,115 Amortization of leased assets 5.5 4,056 6,831
743,554 698,024 31.1 Salaries and benefits include Rs. 10.885 million (2017 : Rs. 9.266 million ) in respect of retirement benefits. 31.2 Auditors remunerationAudit fee 1,700 1,500 Certifications of group reporting 700 500 Professional services 300 200 Out-of-pocket expenses 300 300
3,000 2,500
31.3 Charity & donation
Name of DoneeDIL Foundation 2,352 648Farooq Trust School 2,694 2,879Hope Uplift foundation 863 600BIPP Institute - 10,462
5,909 14,589Interest of the Directors or their spouses in the donations made during the year is as follows:
Name of Donee and address Name of interested directors and nature of interest
Shahid Javed Burki Institute of Public Policy at NETSOL
Shahid Javed Burki - Chairman Member Board of Directors - 10,462
(126-B Ahmad Block, New Garden Town, Lahore) Salim Ghauri - Member Board of Directors
During the year no donation was made to any institute where any director or his spouse was interested.
32. OTHER OPERATING EXPENSESLoss on disposal of assets 4,304 2,005
4,304 2,005
2018 2017(Restated)
Note Rupees in ‘000’
NETSOL TECHNOLOGIES LIMITED128
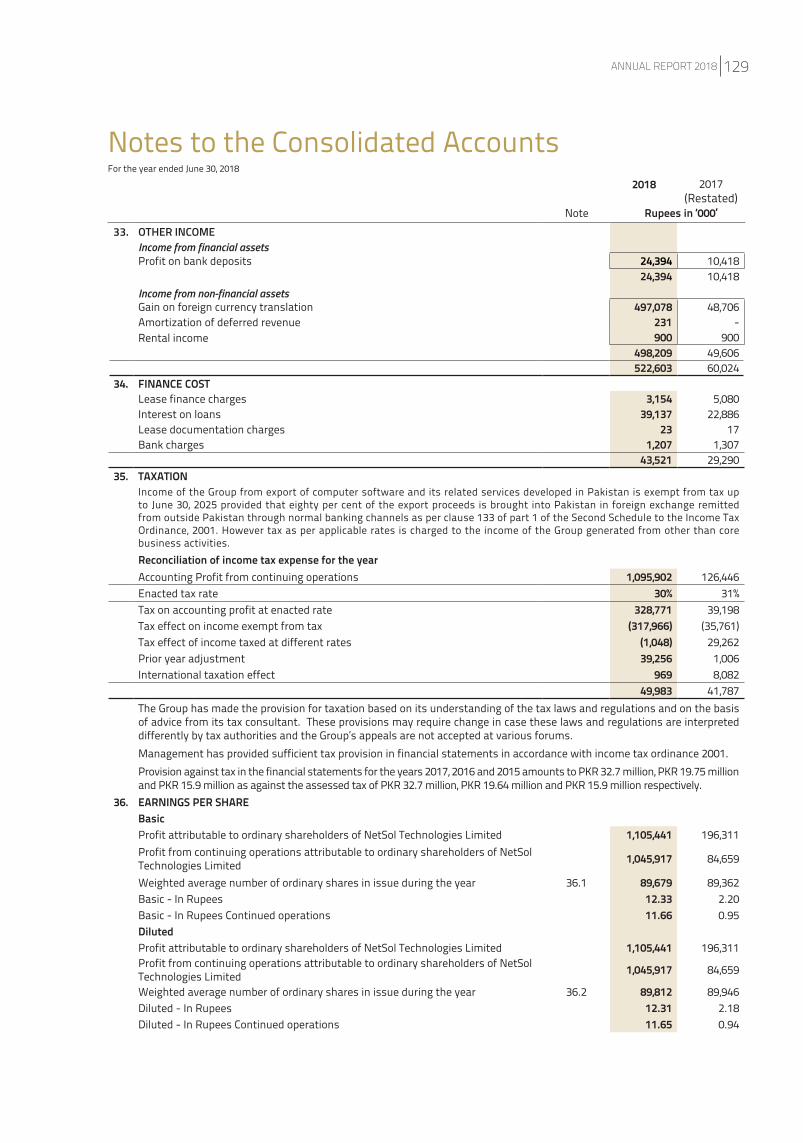
33. OTHER INCOMEIncome from financial assetsProfit on bank deposits 24,394 10,418
24,394 10,418 Income from non-financial assetsGain on foreign currency translation 497,078 48,706 Amortization of deferred revenue 231 -Rental income 900 900
498,209 49,606 522,603 60,024
34. FINANCE COSTLease finance charges 3,154 5,080 Interest on loans 39,137 22,886 Lease documentation charges 23 17 Bank charges 1,207 1,307
43,521 29,290 35. TAXATION
Income of the Group from export of computer software and its related services developed in Pakistan is exempt from tax up to June 30, 2025 provided that eighty per cent of the export proceeds is brought into Pakistan in foreign exchange remitted from outside Pakistan through normal banking channels as per clause 133 of part 1 of the Second Schedule to the Income Tax Ordinance, 2001. However tax as per applicable rates is charged to the income of the Group generated from other than core business activities.Reconciliation of income tax expense for the yearAccounting Profit from continuing operations 1,095,902 126,446 Enacted tax rate 30% 31%Tax on accounting profit at enacted rate 328,771 39,198 Tax effect on income exempt from tax (317,966) (35,761)Tax effect of income taxed at different rates (1,048) 29,262Prior year adjustment 39,256 1,006 International taxation effect 969 8,082
49,983 41,787The Group has made the provision for taxation based on its understanding of the tax laws and regulations and on the basis of advice from its tax consultant. These provisions may require change in case these laws and regulations are interpreted differently by tax authorities and the Group’s appeals are not accepted at various forums.Management has provided sufficient tax provision in financial statements in accordance with income tax ordinance 2001.Provision against tax in the financial statements for the years 2017, 2016 and 2015 amounts to PKR 32.7 million, PKR 19.75 million and PKR 15.9 million as against the assessed tax of PKR 32.7 million, PKR 19.64 million and PKR 15.9 million respectively.
36. EARNINGS PER SHARE BasicProfit attributable to ordinary shareholders of NetSol Technologies Limited 1,105,441 196,311 Profit from continuing operations attributable to ordinary shareholders of NetSol Technologies Limited 1,045,917 84,659
Weighted average number of ordinary shares in issue during the year 36.1 89,679 89,362 Basic - In Rupees 12.33 2.20 Basic - In Rupees Continued operations 11.66 0.95 Diluted Profit attributable to ordinary shareholders of NetSol Technologies Limited 1,105,441 196,311 Profit from continuing operations attributable to ordinary shareholders of NetSol Technologies Limited 1,045,917 84,659
Weighted average number of ordinary shares in issue during the year 36.2 89,812 89,946 Diluted - In Rupees 12.31 2.18 Diluted - In Rupees Continued operations 11.65 0.94
2018 2017(Restated)
Note Rupees in ‘000’
Notes to the Consolidated AccountsFor the year ended June 30, 2018
ANNUAL REPORT 2018 129
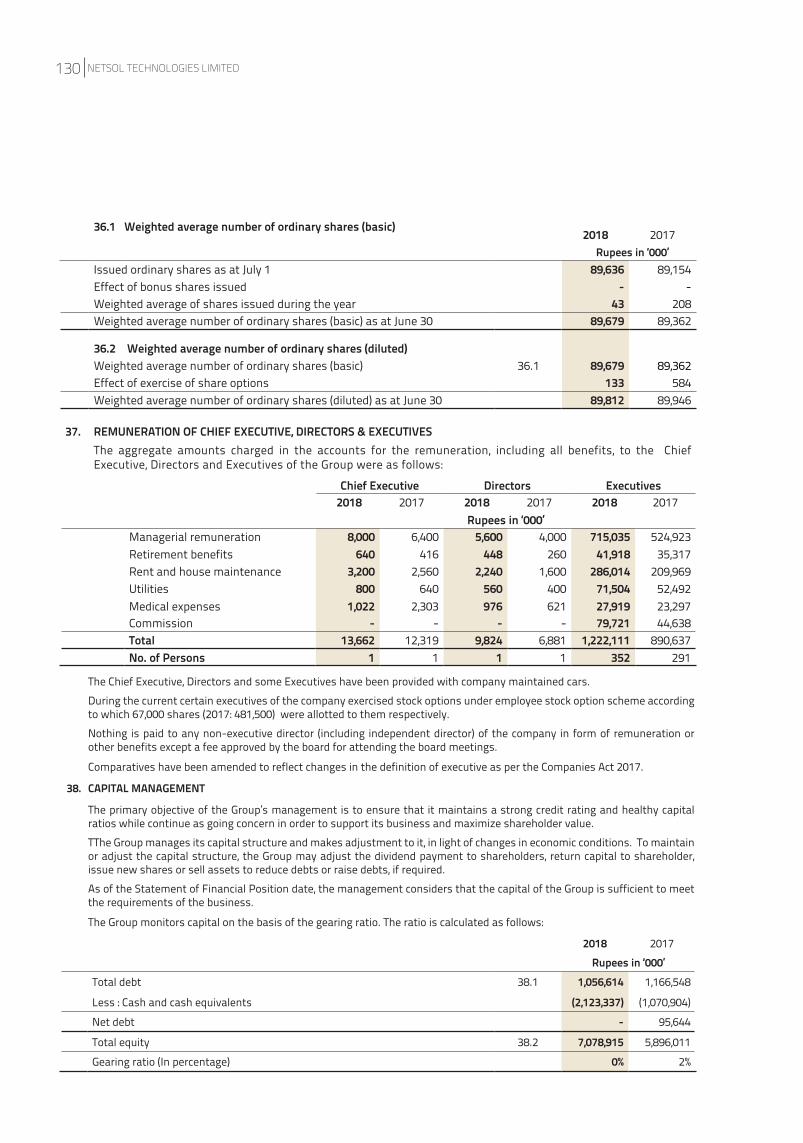
36.1 Weighted average number of ordinary shares (basic)
Issued ordinary shares as at July 1 89,636 89,154 Effect of bonus shares issued - - Weighted average of shares issued during the year 43 208 Weighted average number of ordinary shares (basic) as at June 30 89,679 89,362
36.2 Weighted average number of ordinary shares (diluted)Weighted average number of ordinary shares (basic) 36.1 89,679 89,362 Effect of exercise of share options 133 584 Weighted average number of ordinary shares (diluted) as at June 30 89,812 89,946
37. REMUNERATION OF CHIEF EXECUTIVE, DIRECTORS & EXECUTIVESThe aggregate amounts charged in the accounts for the remuneration, including all benefits, to the Chief Executive, Directors and Executives of the Group were as follows:
Chief Executive Directors Executives 2018 2017 2018 2017 2018 2017
Rupees in ‘000’Managerial remuneration 8,000 6,400 5,600 4,000 715,035 524,923 Retirement benefits 640 416 448 260 41,918 35,317 Rent and house maintenance 3,200 2,560 2,240 1,600 286,014 209,969 Utilities 800 640 560 400 71,504 52,492 Medical expenses 1,022 2,303 976 621 27,919 23,297 Commission - - - - 79,721 44,638Total 13,662 12,319 9,824 6,881 1,222,111 890,637No. of Persons 1 1 1 1 352 291
The Chief Executive, Directors and some Executives have been provided with company maintained cars.During the current certain executives of the company exercised stock options under employee stock option scheme according to which 67,000 shares (2017: 481,500) were allotted to them respectively.Nothing is paid to any non-executive director (including independent director) of the company in form of remuneration or other benefits except a fee approved by the board for attending the board meetings.
Comparatives have been amended to reflect changes in the definition of executive as per the Companies Act 2017.
38. CAPITAL MANAGEMENT
The primary objective of the Group’s management is to ensure that it maintains a strong credit rating and healthy capital ratios while continue as going concern in order to support its business and maximize shareholder value.TThe Group manages its capital structure and makes adjustment to it, in light of changes in economic conditions. To maintain or adjust the capital structure, the Group may adjust the dividend payment to shareholders, return capital to shareholder, issue new shares or sell assets to reduce debts or raise debts, if required.As of the Statement of Financial Position date, the management considers that the capital of the Group is sufficient to meet the requirements of the business.
The Group monitors capital on the basis of the gearing ratio. The ratio is calculated as follows:
2018 2017 Rupees in ‘000’
2018 2017Rupees in ‘000’
Total debt 38.1 1,056,614 1,166,548
Less : Cash and cash equivalents (2,123,337) (1,070,904)
Net debt - 95,644
Total equity 38.2 7,078,915 5,896,011
Gearing ratio (In percentage) 0% 2%
NETSOL TECHNOLOGIES LIMITED130
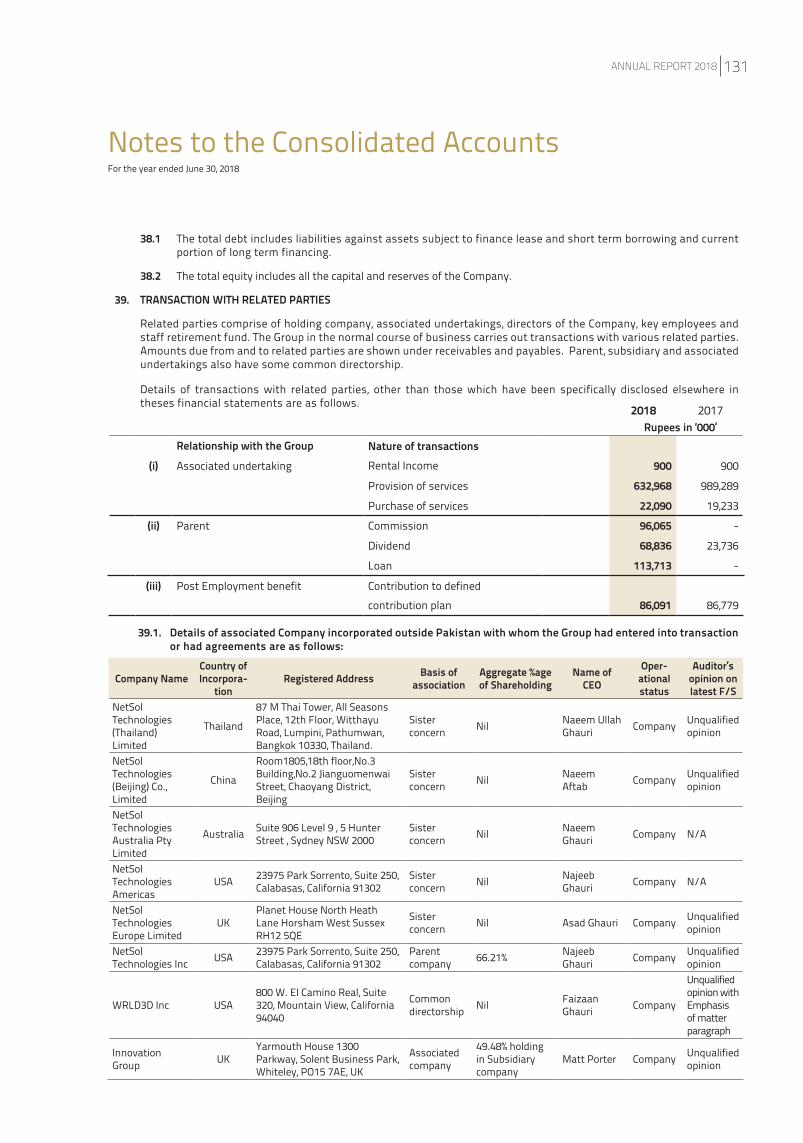
38.1 The total debt includes liabilities against assets subject to finance lease and short term borrowing and current portion of long term financing.
38.2 The total equity includes all the capital and reserves of the Company.
39. TRANSACTION WITH RELATED PARTIES
Related parties comprise of holding company, associated undertakings, directors of the Company, key employees and staff retirement fund. The Group in the normal course of business carries out transactions with various related parties. Amounts due from and to related parties are shown under receivables and payables. Parent, subsidiary and associated undertakings also have some common directorship.
Details of transactions with related parties, other than those which have been specifically disclosed elsewhere in theses financial statements are as follows.
Relationship with the Group Nature of transactions(i) Associated undertaking Rental Income 900 900
Provision of services 632,968 989,289
Purchase of services 22,090 19,233
(ii) Parent Commission 96,065 -
Dividend 68,836 23,736
Loan 113,713 -
(iii) Post Employment benefit Contribution to defined contribution plan 86,091 86,779
2018 2017 Rupees in ‘000’
Notes to the Consolidated AccountsFor the year ended June 30, 2018
Company NameCountry of Incorpora-
tionRegistered Address Basis of
associationAggregate %age of Shareholding
Name of CEO
Oper-ational status
Auditor’s opinion on latest F/S
NetSol Technologies (Thailand) Limited
Thailand
87 M Thai Tower, All Seasons Place, 12th Floor, Witthayu Road, Lumpini, Pathumwan, Bangkok 10330, Thailand.
Sister concern Nil Naeem Ullah
Ghauri Company Unqualified opinion
NetSol Technologies (Beijing) Co., Limited
China
Room1805,18th floor,No.3 Building,No.2 Jianguomenwai Street, Chaoyang District, Beijing
Sister concern Nil Naeem
Aftab Company Unqualified opinion
NetSol Technologies Australia Pty Limited
Australia Suite 906 Level 9 , 5 Hunter Street , Sydney NSW 2000
Sister concern Nil Naeem
Ghauri Company N/A
NetSol Technologies Americas
USA 23975 Park Sorrento, Suite 250, Calabasas, California 91302
Sister concern Nil Najeeb
Ghauri Company N/A
NetSol Technologies Europe Limited
UKPlanet House North Heath Lane Horsham West Sussex RH12 5QE
Sister concern Nil Asad Ghauri Company Unqualified
opinion
NetSol Technologies Inc USA 23975 Park Sorrento, Suite 250,
Calabasas, California 91302Parent company 66.21% Najeeb
Ghauri Company Unqualified opinion
WRLD3D Inc USA800 W. EI Camino Real, Suite 320, Mountain View, California 94040
Common directorship Nil Faizaan
Ghauri Company
Unqualified opinion with Emphasis of matter paragraph
Innovation Group UK
Yarmouth House 1300 Parkway, Solent Business Park, Whiteley, PO15 7AE, UK
Associated company
49.48% holding in Subsidiary company
Matt Porter Company Unqualified opinion
39.1. Details of associated Company incorporated outside Pakistan with whom the Group had entered into transaction or had agreements are as follows:
ANNUAL REPORT 2018 131
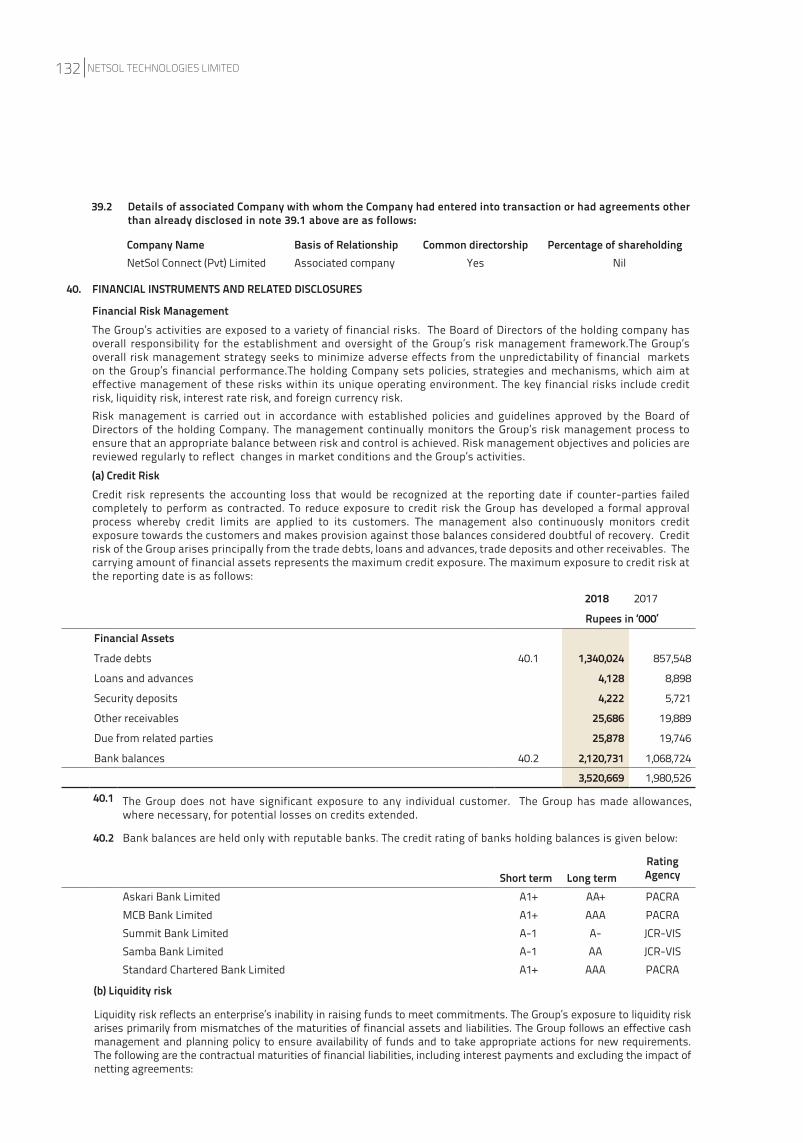
2018 2017
Rupees in ‘000’ Financial Assets
Trade debts 40.1 1,340,024 857,548
Loans and advances 4,128 8,898
Security deposits 4,222 5,721
Other receivables 25,686 19,889
Due from related parties 25,878 19,746
Bank balances 40.2 2,120,731 1,068,724
3,520,669 1,980,526
40.1 The Group does not have significant exposure to any individual customer. The Group has made allowances, where necessary, for potential losses on credits extended.
40.2 Bank balances are held only with reputable banks. The credit rating of banks holding balances is given below:
Rating AgencyShort term Long term
Askari Bank Limited A1+ AA+ PACRAMCB Bank Limited A1+ AAA PACRASummit Bank Limited A-1 A- JCR-VISSamba Bank Limited A-1 AA JCR-VISStandard Chartered Bank Limited A1+ AAA PACRA
(b) Liquidity risk
Liquidity risk reflects an enterprise’s inability in raising funds to meet commitments. The Group’s exposure to liquidity risk arises primarily from mismatches of the maturities of financial assets and liabilities. The Group follows an effective cash management and planning policy to ensure availability of funds and to take appropriate actions for new requirements. The following are the contractual maturities of financial liabilities, including interest payments and excluding the impact of netting agreements:
40. FINANCIAL INSTRUMENTS AND RELATED DISCLOSURES
Financial Risk ManagementThe Group’s activities are exposed to a variety of financial risks. The Board of Directors of the holding company has overall responsibility for the establishment and oversight of the Group’s risk management framework.The Group’s overall risk management strategy seeks to minimize adverse effects from the unpredictability of financial markets on the Group’s financial performance.The holding Company sets policies, strategies and mechanisms, which aim at effective management of these risks within its unique operating environment. The key financial risks include credit risk, liquidity risk, interest rate risk, and foreign currency risk.Risk management is carried out in accordance with established policies and guidelines approved by the Board of Directors of the holding Company. The management continually monitors the Group’s risk management process to ensure that an appropriate balance between risk and control is achieved. Risk management objectives and policies are reviewed regularly to reflect changes in market conditions and the Group’s activities.(a) Credit RiskCredit risk represents the accounting loss that would be recognized at the reporting date if counter-parties failed completely to perform as contracted. To reduce exposure to credit risk the Group has developed a formal approval process whereby credit limits are applied to its customers. The management also continuously monitors credit exposure towards the customers and makes provision against those balances considered doubtful of recovery. Credit risk of the Group arises principally from the trade debts, loans and advances, trade deposits and other receivables. The carrying amount of financial assets represents the maximum credit exposure. The maximum exposure to credit risk at the reporting date is as follows:
39.2 Details of associated Company with whom the Company had entered into transaction or had agreements other than already disclosed in note 39.1 above are as follows:
Company Name Basis of Relationship Common directorship Percentage of shareholding NetSol Connect (Pvt) Limited Associated company Yes Nil
NETSOL TECHNOLOGIES LIMITED132
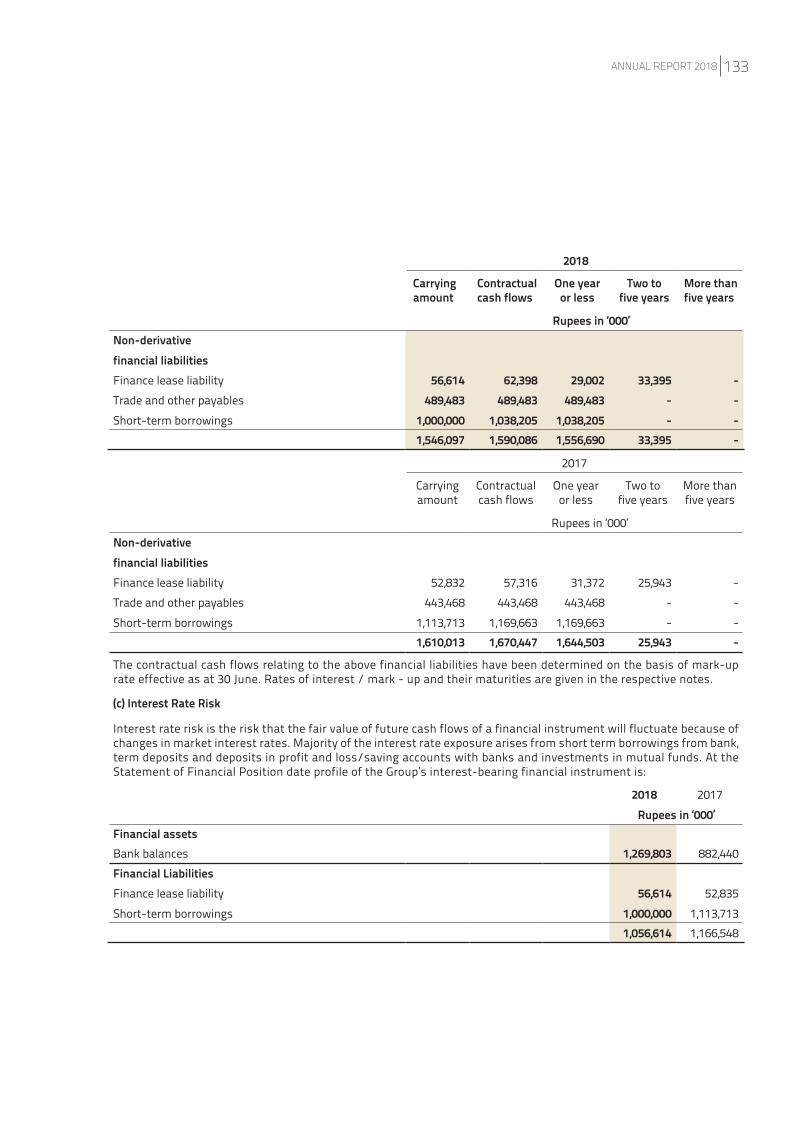
2018
Carrying amount
Contractual cash flows
One year or less
Two to five years
More than five years
Rupees in ‘000’ Non-derivativefinancial liabilitiesFinance lease liability 56,614 62,398 29,002 33,395 - Trade and other payables 489,483 489,483 489,483 - - Short-term borrowings 1,000,000 1,038,205 1,038,205 - -
1,546,097 1,590,086 1,556,690 33,395 -
2017
Carryingamount
Contractualcash flows
One yearor less
Two tofive years
More thanfive years
Rupees in ‘000’Non-derivativefinancial liabilitiesFinance lease liability 52,832 57,316 31,372 25,943 - Trade and other payables 443,468 443,468 443,468 - -Short-term borrowings 1,113,713 1,169,663 1,169,663 - -
1,610,013 1,670,447 1,644,503 25,943 -
The contractual cash flows relating to the above financial liabilities have been determined on the basis of mark-up rate effective as at 30 June. Rates of interest / mark - up and their maturities are given in the respective notes.
(c) Interest Rate Risk
Interest rate risk is the risk that the fair value of future cash flows of a financial instrument will fluctuate because of changes in market interest rates. Majority of the interest rate exposure arises from short term borrowings from bank, term deposits and deposits in profit and loss/saving accounts with banks and investments in mutual funds. At the Statement of Financial Position date profile of the Group’s interest-bearing financial instrument is:
2018 2017Rupees in ‘000’
Financial assetsBank balances 1,269,803 882,440Financial LiabilitiesFinance lease liability 56,614 52,835 Short-term borrowings 1,000,000 1,113,713
1,056,614 1,166,548
ANNUAL REPORT 2018 133
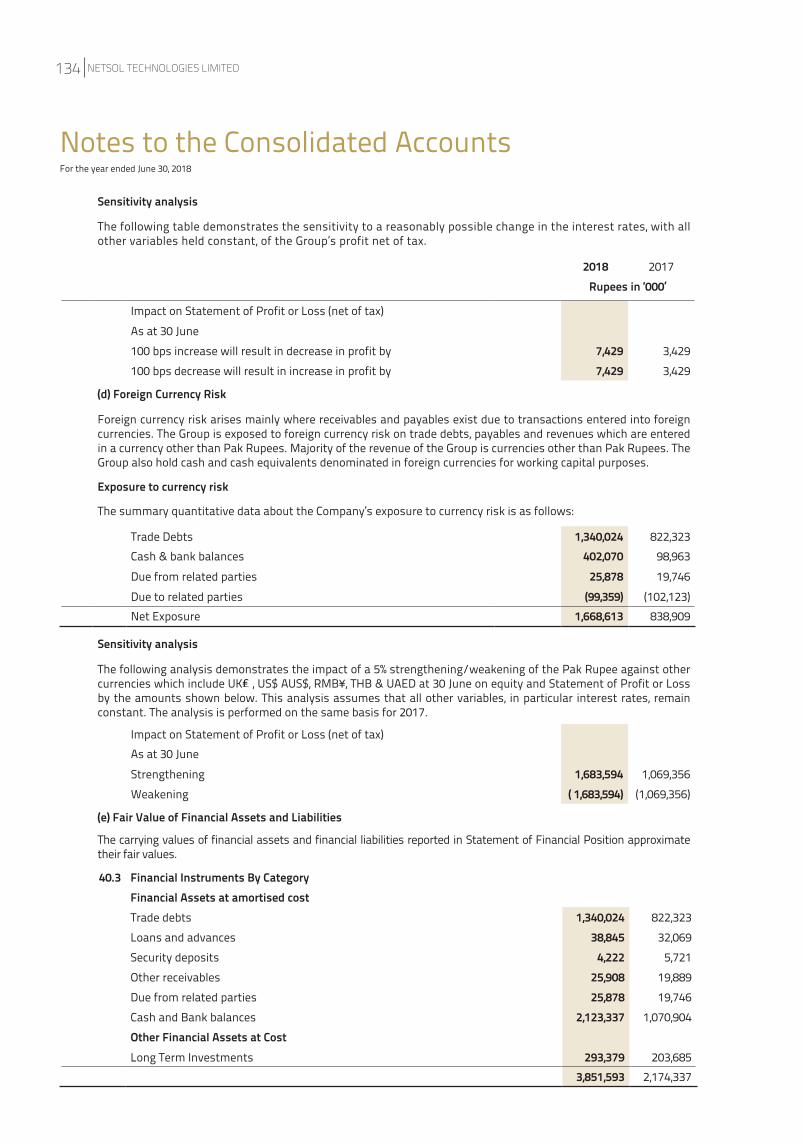
Sensitivity analysis
The following table demonstrates the sensitivity to a reasonably possible change in the interest rates, with all other variables held constant, of the Group’s profit net of tax.
Impact on Statement of Profit or Loss (net of tax)As at 30 June100 bps increase will result in decrease in profit by 7,429 3,429 100 bps decrease will result in increase in profit by 7,429 3,429
(d) Foreign Currency Risk
Foreign currency risk arises mainly where receivables and payables exist due to transactions entered into foreign currencies. The Group is exposed to foreign currency risk on trade debts, payables and revenues which are entered in a currency other than Pak Rupees. Majority of the revenue of the Group is currencies other than Pak Rupees. The Group also hold cash and cash equivalents denominated in foreign currencies for working capital purposes.
Exposure to currency risk
The summary quantitative data about the Company’s exposure to currency risk is as follows:
Notes to the Consolidated AccountsFor the year ended June 30, 2018
40.3 Financial Instruments By CategoryFinancial Assets at amortised costTrade debts 1,340,024 822,323 Loans and advances 38,845 32,069 Security deposits 4,222 5,721 Other receivables 25,908 19,889 Due from related parties 25,878 19,746 Cash and Bank balances 2,123,337 1,070,904 Other Financial Assets at CostLong Term Investments 293,379 203,685
3,851,593 2,174,337
Sensitivity analysis
The following analysis demonstrates the impact of a 5% strengthening/weakening of the Pak Rupee against other currencies which include UK₤ , US$ AUS$, RMB¥, THB & UAED at 30 June on equity and Statement of Profit or Loss by the amounts shown below. This analysis assumes that all other variables, in particular interest rates, remain constant. The analysis is performed on the same basis for 2017.
Impact on Statement of Profit or Loss (net of tax)As at 30 JuneStrengthening 1,683,594 1,069,356 Weakening ( 1,683,594) (1,069,356)
(e) Fair Value of Financial Assets and Liabilities
The carrying values of financial assets and financial liabilities reported in Statement of Financial Position approximate their fair values.
Trade Debts 1,340,024 822,323 Cash & bank balances 402,070 98,963 Due from related parties 25,878 19,746 Due to related parties (99,359) (102,123)Net Exposure 1,668,613 838,909
2018 2017Rupees in ‘000’
NETSOL TECHNOLOGIES LIMITED134
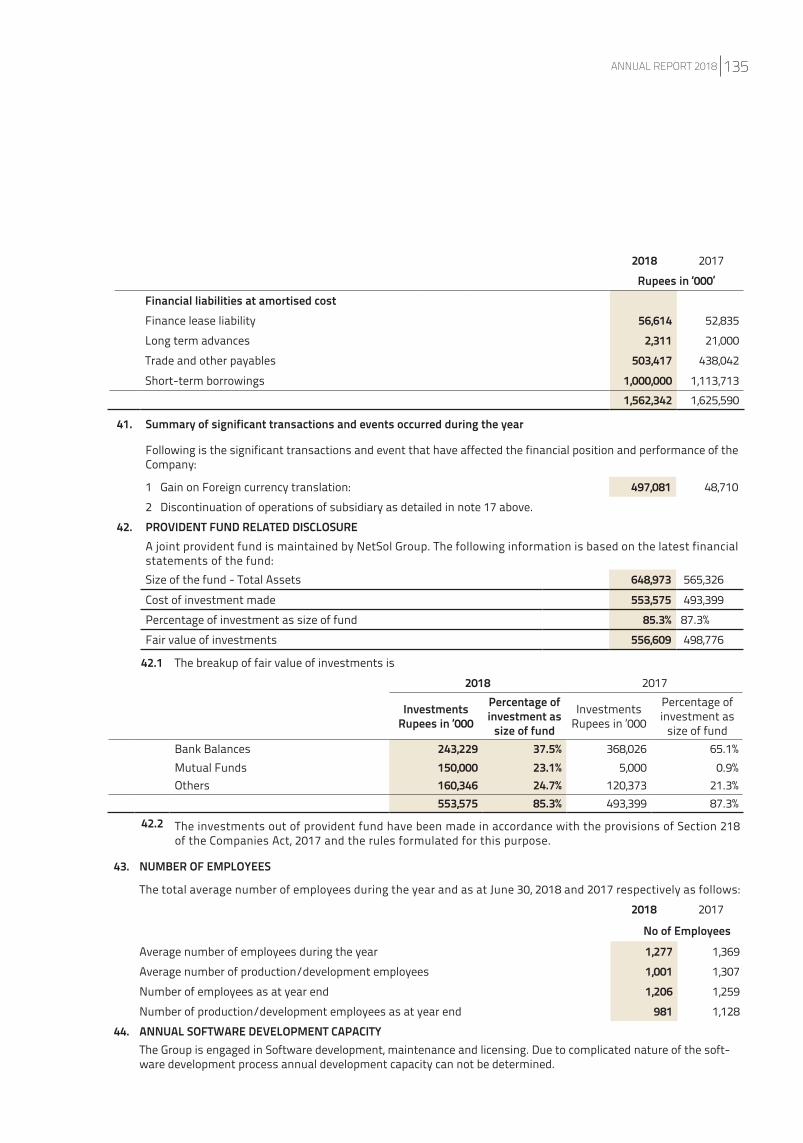
41. Summary of significant transactions and events occurred during the year
Following is the significant transactions and event that have affected the financial position and performance of the Company:
1 Gain on Foreign currency translation: 497,081 48,7102 Discontinuation of operations of subsidiary as detailed in note 17 above.
42. PROVIDENT FUND RELATED DISCLOSUREA joint provident fund is maintained by NetSol Group. The following information is based on the latest financial statements of the fund:Size of the fund - Total Assets 648,973 565,326 Cost of investment made 553,575 493,399 Percentage of investment as size of fund 85.3% 87.3%Fair value of investments 556,609 498,776
Financial liabilities at amortised costFinance lease liability 56,614 52,835 Long term advances 2,311 21,000 Trade and other payables 503,417 438,042 Short-term borrowings 1,000,000 1,113,713
1,562,342 1,625,590
2018 2017Rupees in ‘000’
42.2 The investments out of provident fund have been made in accordance with the provisions of Section 218 of the Companies Act, 2017 and the rules formulated for this purpose.
43. NUMBER OF EMPLOYEES
The total average number of employees during the year and as at June 30, 2018 and 2017 respectively as follows:2018 2017
No of EmployeesAverage number of employees during the year 1,277 1,369 Average number of production/development employees 1,001 1,307 Number of employees as at year end 1,206 1,259 Number of production/development employees as at year end 981 1,128
44. ANNUAL SOFTWARE DEVELOPMENT CAPACITYThe Group is engaged in Software development, maintenance and licensing. Due to complicated nature of the soft-ware development process annual development capacity can not be determined.
42.1 The breakup of fair value of investments is 2018 2017
Investments Rupees in ‘000
Percentage of investment as
size of fund
Investments Rupees in ‘000
Percentage of investment as
size of fundBank Balances 243,229 37.5% 368,026 65.1%Mutual Funds 150,000 23.1% 5,000 0.9%Others 160,346 24.7% 120,373 21.3%
553,575 85.3% 493,399 87.3%
ANNUAL REPORT 2018 135
45. SEGMENT REPORTING
For Management purposes, the Group’s operating businesses are organized and managed separately according to the nature of products and services provided, with each segment representing a strategic business unit that offers different products and serves different to industries.
The Group measures the performance of its operating segments through a measure of segment’s gross profit or loss referred to as segment results. Segment results are determined by deducting directly attributable segment expenses from segment revenues. The accounting policies of the reportable segments are the same as that of the Group’s accounting policies. This measure is reported to the CODM for the purposes of resource allocation and assessment of performance. All other expenses are reported separately to CODM.
Intersegment revenue is recorded at fair market price.
Segment assets and liabilities are not regularly provided to the CODM. The Group has elected as provided under IFRS 8 ‘Operating Segments’ (amended) not to disclose a measure of segment assets or liabilities where these amounts are not regularly provided to the CODM.
With respect to geographical regions, revenue is generally allocated to regions based on the location where the products and services are provided.
Fixed assets used in the business or liabilities contracted have not been identified to any of the reportable segments, as the fixed assets and services are used interchangeably between segments. Accordingly, no disclosure relating to total segment assets and liabilities are made.
Reportable Segments
The CODM has identified the segments which may earn revenues and incur expenses and whose operating results are subject to regular. Following are identified segments.
(i) Global Leasing and Financial Solutions (NFS)
The Group is primarily engaged in the selling of licenses of its state-of-the-art NetSol Financial Suit (NFS), its custom-ization and maintenance. This segment mainly operates in Asia Pacific region.
Notes to the Consolidated AccountsFor the year ended June 30, 2018
(ii) Information Security (IS) and Software Services and Solutions (SSS)
The Group globally offers a full range of Information Security services and software services solutions to help companies safeguard the confidentiality, veracity, and accessibility of information regarding their valuable assets.
(iv) Business Process Outsourcing (BPO)
The Group provides IT Related Outsourcing services mainly in the USA and European regions.
Except as indicated above, no operating segments have been aggregated to form the above reportable.
NETSOL TECHNOLOGIES LIMITED136
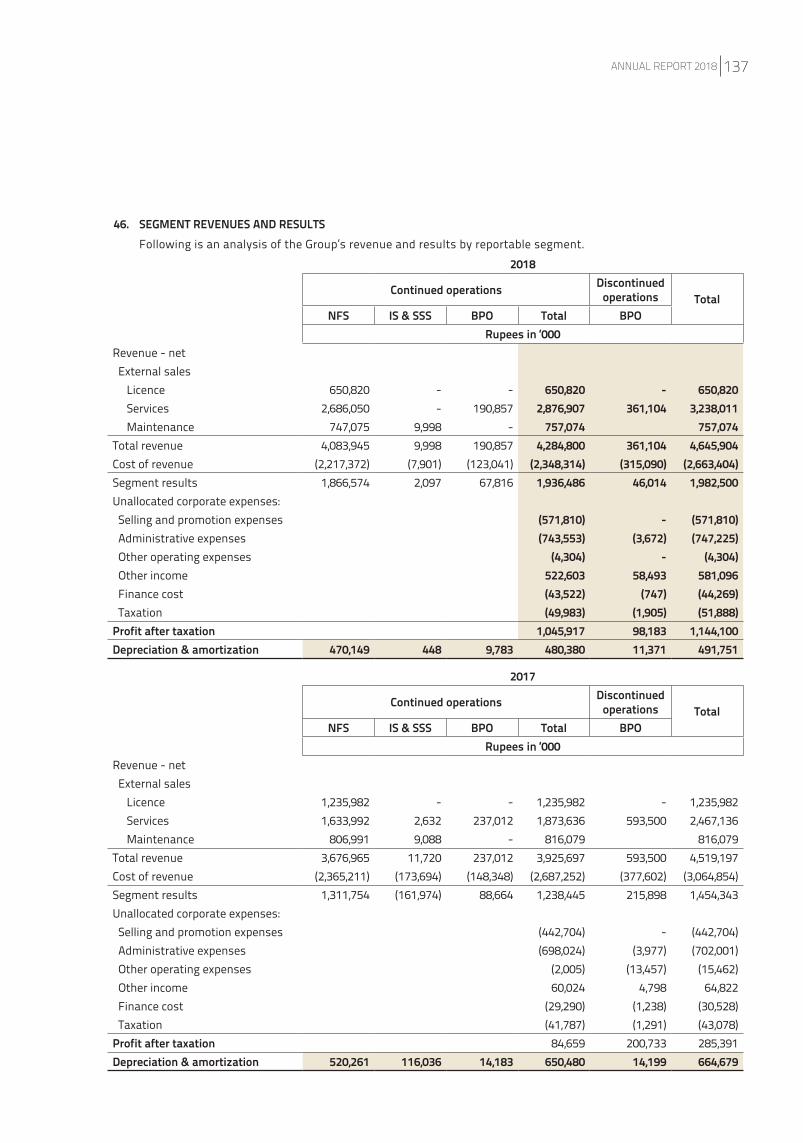
2018
Continued operations Discontinued operations Total
NFS IS & SSS BPO Total BPORupees in ‘000
Revenue - net External sales Licence 650,820 - - 650,820 - 650,820 Services 2,686,050 - 190,857 2,876,907 361,104 3,238,011 Maintenance 747,075 9,998 - 757,074 757,074 Total revenue 4,083,945 9,998 190,857 4,284,800 361,104 4,645,904 Cost of revenue (2,217,372) (7,901) (123,041) (2,348,314) (315,090) (2,663,404)Segment results 1,866,574 2,097 67,816 1,936,486 46,014 1,982,500 Unallocated corporate expenses: Selling and promotion expenses (571,810) - (571,810) Administrative expenses (743,553) (3,672) (747,225) Other operating expenses (4,304) - (4,304) Other income 522,603 58,493 581,096 Finance cost (43,522) (747) (44,269) Taxation (49,983) (1,905) (51,888)Profit after taxation 1,045,917 98,183 1,144,100 Depreciation & amortization 470,149 448 9,783 480,380 11,371 491,751
2017
Continued operations Discontinued operations Total
NFS IS & SSS BPO Total BPORupees in ‘000
Revenue - net External sales Licence 1,235,982 - - 1,235,982 - 1,235,982 Services 1,633,992 2,632 237,012 1,873,636 593,500 2,467,136 Maintenance 806,991 9,088 - 816,079 816,079 Total revenue 3,676,965 11,720 237,012 3,925,697 593,500 4,519,197 Cost of revenue (2,365,211) (173,694) (148,348) (2,687,252) (377,602) (3,064,854)Segment results 1,311,754 (161,974) 88,664 1,238,445 215,898 1,454,343 Unallocated corporate expenses: Selling and promotion expenses (442,704) - (442,704) Administrative expenses (698,024) (3,977) (702,001) Other operating expenses (2,005) (13,457) (15,462) Other income 60,024 4,798 64,822 Finance cost (29,290) (1,238) (30,528) Taxation (41,787) (1,291) (43,078)Profit after taxation 84,659 200,733 285,391 Depreciation & amortization 520,261 116,036 14,183 650,480 14,199 664,679
46. SEGMENT REVENUES AND RESULTSFollowing is an analysis of the Group’s revenue and results by reportable segment.
ANNUAL REPORT 2018 137
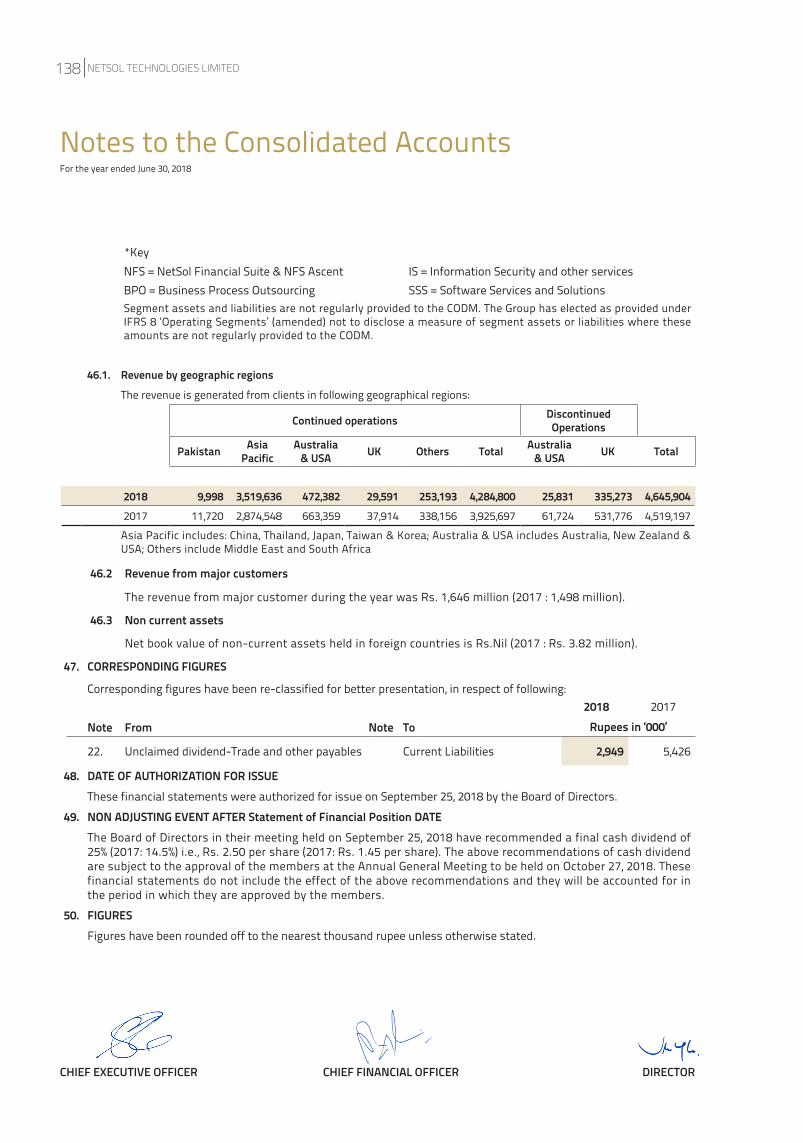
*KeyNFS = NetSol Financial Suite & NFS Ascent IS = Information Security and other servicesBPO = Business Process Outsourcing SSS = Software Services and SolutionsSegment assets and liabilities are not regularly provided to the CODM. The Group has elected as provided under IFRS 8 ‘Operating Segments’ (amended) not to disclose a measure of segment assets or liabilities where these amounts are not regularly provided to the CODM.
Notes to the Consolidated AccountsFor the year ended June 30, 2018
46.2 Revenue from major customers
The revenue from major customer during the year was Rs. 1,646 million (2017 : 1,498 million).
46.3 Non current assets
Net book value of non-current assets held in foreign countries is Rs.Nil (2017 : Rs. 3.82 million).
47. CORRESPONDING FIGURES
Corresponding figures have been re-classified for better presentation, in respect of following:
Note From Note To
22. Unclaimed dividend-Trade and other payables Current Liabilities 2,949 5,426
48. DATE OF AUTHORIZATION FOR ISSUEThese financial statements were authorized for issue on September 25, 2018 by the Board of Directors.
49. NON ADJUSTING EVENT AFTER Statement of Financial Position DATE The Board of Directors in their meeting held on September 25, 2018 have recommended a final cash dividend of 25% (2017: 14.5%) i.e., Rs. 2.50 per share (2017: Rs. 1.45 per share). The above recommendations of cash dividend are subject to the approval of the members at the Annual General Meeting to be held on October 27, 2018. These financial statements do not include the effect of the above recommendations and they will be accounted for in the period in which they are approved by the members.
50. FIGURESFigures have been rounded off to the nearest thousand rupee unless otherwise stated.
CHIEF EXECUTIVE OFFICER CHIEF FINANCIAL OFFICER DIRECTOR
46.1. Revenue by geographic regionsThe revenue is generated from clients in following geographical regions:
Continued operations Discontinued Operations
Pakistan Asia Pacific
Australia & USA UK Others Total Australia
& USA UK Total
2018 9,998 3,519,636 472,382 29,591 253,193 4,284,800 25,831 335,273 4,645,904 2017 11,720 2,874,548 663,359 37,914 338,156 3,925,697 61,724 531,776 4,519,197 Asia Pacific includes: China, Thailand, Japan, Taiwan & Korea; Australia & USA includes Australia, New Zealand & USA; Others include Middle East and South Africa
2018 2017Rupees in ‘000’
NETSOL TECHNOLOGIES LIMITED138
ANNUAL REPORT 2018 139
ANNUAL GENERAL MEETING
Ordinary Business
1. To receive, consider and adopt the Reports of Directors, Chairman and Auditors together with audited annual separate and consolidat-ed financial statements for the year ended June 30, 2018.
2. To approve the payment of final cash dividend of Rs. 2.50 per share (i.e., @ 25%) as recommended by the board of directors.
3. To appoint Auditors and fix their remuneration.
By Order of the Board
________________
SEHRISH
Company Secretary
Lahore
October 05, 2018
NOTE:
1. Share transfer books of the Company will remain closed from October 21, 2018 to October 27, 2018 (both days inclusive). Physical/ CDC transfers received in order at the Shares Registrar, M/s Vision Consulting Ltd., 3-C, LDA Flats, Lawrence Road, Lahore Tel: (92 42) 36283096, 36283097 and Fax: (+92 42) 36312550 by the close of business on October 20, 2018 will be treated in time for determin-ing the entitlement of cash dividend to the transferees and to attend and vote at the meeting.
2. Shareholders are requested to notify the change of address, if any.
3. A member entitled to attend and vote at the general meeting may appoint another member as his/her proxy to attend and vote on his/her behalf and a proxy so appointed shall have such rights, as respects attending, speaking and voting at the Annual General Meeting as are available to the Member. In order to be effective, proxies, complete in all respect, must be received at the registered office of the Company not less than 48 hours before the scheduled time of the meeting. Proxy Form in English and Urdu languages is attached herewith.
4. CDC account holders will further have to follow the under mentioned guidelines as laid down by the Securities and Exchange Commis-sion of Pakistan:
A) For Attending the Meeting:
a) In case of individuals, the account holder or sub-account holder and/or the persons whose shares are in group accounts and their registration details are uploaded as per CDC regulations shall authenticate their identity by showing their original computerized national identity cards (CNICs) or original passport at the time of attending the meeting.
b) In case of corporate entity, the Board of Directors’ resolution/ power of attorney with specimen signature of the nominee shall be produced (unless it has been provided earlier) at the time of the meeting.
B) For Appointing Proxies:
a) In case of individuals, the account holder or sub-account holder and/or persons whose shares are in group accounts and their registration details are uploaded as per CDC regulations, shall submit the proxy form as per the above requirements.
b) The proxy form shall be witnessed by two persons whose names, addresses and CNIC numbers shall be mentioned on the form.c) Attested copies of CNICs or the passport of the beneficial owners and the proxy shall be furnished with the proxy form.d) The proxy shall produce his/ her original CNIC or original passport at the time of the meeting.
e) In case of corporate entity, the Board of Directors’ resolution/ power of attorney with specimen signature of the person nominat-ed to represent and vote on behalf of the corporate entity shall be submitted (unless it has been provided earlier) along with proxy form to the Company.
5. CNIC, IBAN & Zakat
a) Members are requested to provide their International Banking Account Number (IBAN) together with a copy of the Computerized National Identity Card (CNIC) to update our records. In case of non-submission, all future dividend warrants may by withheld.
b) Members are requested to submit declaration (CZ-50) as per Zakat & Ushr Ordinance 1980 for zakat exemption and to advise change in address, if any.
6. E-DIVIDEND
As per Section 242 of the Companies Act 2017, it is mandatory for a listed company, to pay cash dividend to its shareholders only
NOTICE OF ANNUAL GENERAL MEETINGNOTICE IS HEREBY GIVEN THAT the 22nd Annual General Meeting of the shareholders of NetSol Technologies Limited will be held on October 27, 2018 at 11:00 A.M at at the Registered Office of the the Company situated at NetSol IT Village (Software Technology Park) Lahore Ring Road, Ghazi Road Interchange, Lahore Cantt., to transact the following business:
NETSOL TECHNOLOGIES LIMITED140
through electronic mode directly into the bank account designated by the entitled shareholders.
SECP has advised in their Circular No. 18 of 2017 dated August 01, 2017 to all listed companies to ensure that with effect from No-vember 1, 2017 (as also provided in Companies (Distribution of Dividends) Regulations, 2017 (as amended time to time) cash dividends shall be paid through electronic mode only. Therefore, through this notice, all shareholders are requested to update their bank account details in Central Depository System through respective participants and in case of physical shares, to provide bank account details to our registrar M/s Vision Consulting Ltd.
Please note that as per Section 243(3) of the Companies Act, 2017 listed companies are entitled to withhold payment of dividend, if necessary information is not provided by the shareholders. For the convenience of shareholder e-Dividend form is provided in the annual report and also available on the website of the Company, www.netsolpk.com.
7. Statement of Unclaimed Dividends & Bonus Shares
The Securities and Exchange Commission of Pakistan, pursuant to section 244 read with section 510 of the Companies Act 2017 (the “Act”), directs all Companies to submit a statement to the Commission through eServices portal (https://eservices.secp.gov.pk/eServic-es/) stating therein the number or amounts, as the case may be, which remain unclaimed or unpaid for a period of three years from the date it is due and payable in respect of shares of a company/dividend and any other instrument or amount which remain unclaimed or unpaid, as may be specified.
Please note that in compliance with Section 244 of the Companies Act, 2017, after having completed the stipulated procedure, all div-idends unclaimed for a period of three years from the date due and payable shall be deposited to the credit of the Federal Government and in case of shares, shall be delivered to the Securities and Exchange Commission of Pakistan.
Therefore, through this notice, shareholders are intimated to contact with the Company for any unclaimed dividend/shares within a period of seven days after publishing this notice to meet the compliance of SECP Direction # 16 of 2017 dated July 7, 2017. List of Shareholders having unclaimed dividend/shares are available on the Company’s website www.netsolpk.com. The shareholders are requested to contact the Registrar of the Company regarding any unclaimed dividends or undelivered shares (if any).
8. Deduction of Income Tax from Dividend at Revised Rates
i) Pursuant to the provision of Finance Act, 2018, effective July 01, 2018, applicable rates on payment of dividend have been amended and the rates of deduction of income tax, under Section 150 of Income Tax Ordinance, 2001 have been revised as follows:a) For filers of income tax returns - 15%b) For non-filers of income tax returns - 20%
To enable the Company to make tax deduction on the amount of cash dividend @ 15% instead of 20%, all the shareholders whose names are not entered into the Active Tax payers List (ATL) provided on the website of FBR, despite the fact that they are filers, are advised to make sure that their names are entered into ATL on or before the date of approval of cash dividend at the Annual General Meeting of October 27, 2018 otherwise tax on their cash dividend will be deducted @ 20% instead at @ 15%.
In the case of shares registered in the name of two or more shareholders, each joint-holder is to be treated individually as either a filer or non-filer and tax will be deducted by Company accordingly on the basis of shareholding of each joint-holder as may be notified to the Company in writing. The joint-holders are, therefore, requested to submit their shareholdings otherwise each joint holder shall be presumed to have an equal number of shares.
The CNIC number/NTN detail is now mandatory and is required for checking the tax status as per the Active Taxpayers List (ATL) issued by Federal Board of Revenue (FBR) from time to time.
ii) For any query/problem/information, the investors may contact the Company and /or the Share Registrar at the following phone Numbers, email address: The Manager SharesM/s Vision Consulting Ltd., 3-C, LDA Flats, Lawrence Road, Lahore Tel: (92 42) 36283096, 36283097 Fax: (+92 42) 36312550E-mail: [email protected]
iii) The corporate shareholders having CDC accounts are required to have their National Tax Number (NTN) updated with their respective participants, whereas corporate members having physical shares should send a copy of their NTN certificate to the Company or its Share Registrar i.e. M/s Vision Consulting Ltd. The shareholders while sending NTN or NTN certificates, as the case may be, must quote company name their respective folio numbers.
9. Dissemination of Annual Audited Accounts and Notice of Annual General Meeting
The Company has placed the Audited Annual Separate and Consolidated Financial Statements for the year ended June 30, 2018 along with Auditors’ and Directors’ Reports thereon on company’s website.i.e. http://www.netsolpk.com/investor-information/ at least twen-ty one (21) days prior to the date of the Annual General Meeting.
ANNUAL REPORT 2018 141
I/We, ____________________________of ______________________being a member of NetSol Technologies
Limited, holder of ________Ordinary shares as per Register Folio No.______ hereby opt for video conference facility at
_________________.
------------------------
Signature of member
Further, in accordance with SRO 470(I)/2016 dated May 31, 2016, through which SECP has allowed companies to circulate the annual audited accounts to its members through CD/DVD/USB instead of transmitting the hard copies at their registered addresses, subject to the consent of shareholders and compliance with certain other conditions, the Company had obtained shareholder’s approval in its Annual General Meeting held on October 25, 2016. Accordingly, annual audited accounts of the Company for the year ended June 30, 2018 are being dispatched to the shareholders through CD. The shareholders may request a hard copy of annual audited accounts, which shall be provided free of cost within seven days of receipt of such request.
Further, in terms of SRO No.787(I)/2014 dated September 8, 2014, shareholders can also opt to obtain annual balance sheet and profit and loss accounts, auditors’ report and directors’ report etc., along with the Notice of the Annual General Meeting through email. For this purpose, we hereby give you the opportunity to send us your written request along with your valid email ID to provide you the same via email.
For the convenience of shareholders, a Standard Request Form (for the provision of annual audited accounts) is enclosed and also available at the company’s website. i.e. www.netsolpk.com
10. Video Conference Facility
The Company shall provide video conference facility to its members for attending the Annual General Meeting, at places other than the town in which the Annual General Meeting is taking place, after considering the geographical dispersal of its members: provided that if members, collectively holding 10% or more shareholding residing at a geographical location, provide their consent to participate in the meeting through video conference at least 10 days prior to date of the meeting, the Company shall arrange video conference facility in that city subject to availability of such facility in that city.
In this regard, please fill the following form and submit to the registered address of the Company 10 days before holding of the Annual General Meeting;-
NETSOL TECHNOLOGIES LIMITED142
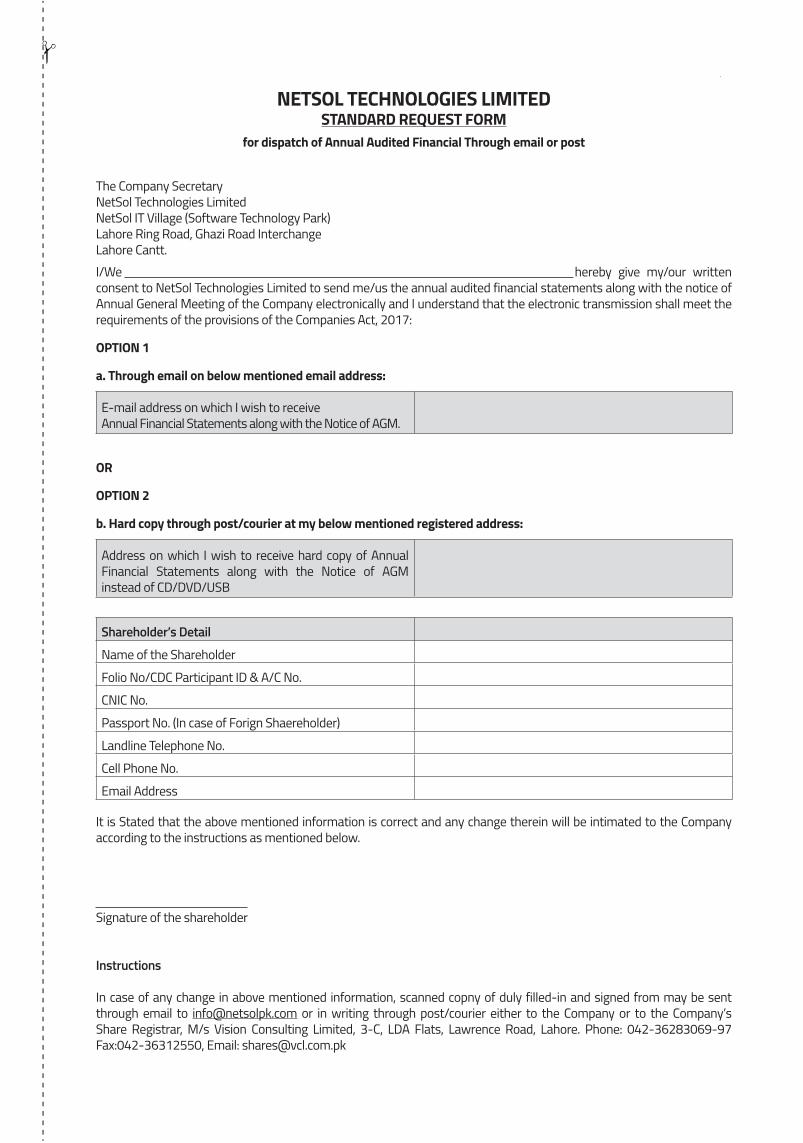
NETSOL TECHNOLOGIES LIMITED STANDARD REQUEST FORM
for dispatch of Annual Audited Financial Through email or post
The Company Secretary NetSol Technologies Limited NetSol IT Village (Software Technology Park) Lahore Ring Road, Ghazi Road Interchange Lahore Cantt.I/We hereby give my/our written consent to NetSol Technologies Limited to send me/us the annual audited financial statements along with the notice of Annual General Meeting of the Company electronically and I understand that the electronic transmission shall meet the requirements of the provisions of the Companies Act, 2017:
OPTION 1
a. Through email on below mentioned email address:
E-mail address on which I wish to receiveAnnual Financial Statements along with the Notice of AGM.
OR
OPTION 2
b. Hard copy through post/courier at my below mentioned registered address:
Address on which I wish to receive hard copy of Annual Financial Statements along with the Notice of AGM instead of CD/DVD/USB
Shareholder’s DetailName of the Shareholder
Folio No/CDC Participant ID & A/C No.
CNIC No.
Passport No. (In case of Forign Shaereholder)
Landline Telephone No.
Cell Phone No.
Email Address
It is Stated that the above mentioned information is correct and any change therein will be intimated to the Company according to the instructions as mentioned below.
Signature of the shareholder
Instructions
In case of any change in above mentioned information, scanned copny of duly filled-in and signed from may be sent through email to [email protected] or in writing through post/courier either to the Company or to the Company’s Share Registrar, M/s Vision Consulting Limited, 3-C, LDA Flats, Lawrence Road, Lahore. Phone: 042-36283069-97 Fax:042-36312550, Email: [email protected]
ANNUAL REPORT 2018 143

NETSOL TECHNOLOGIES LIMITED144
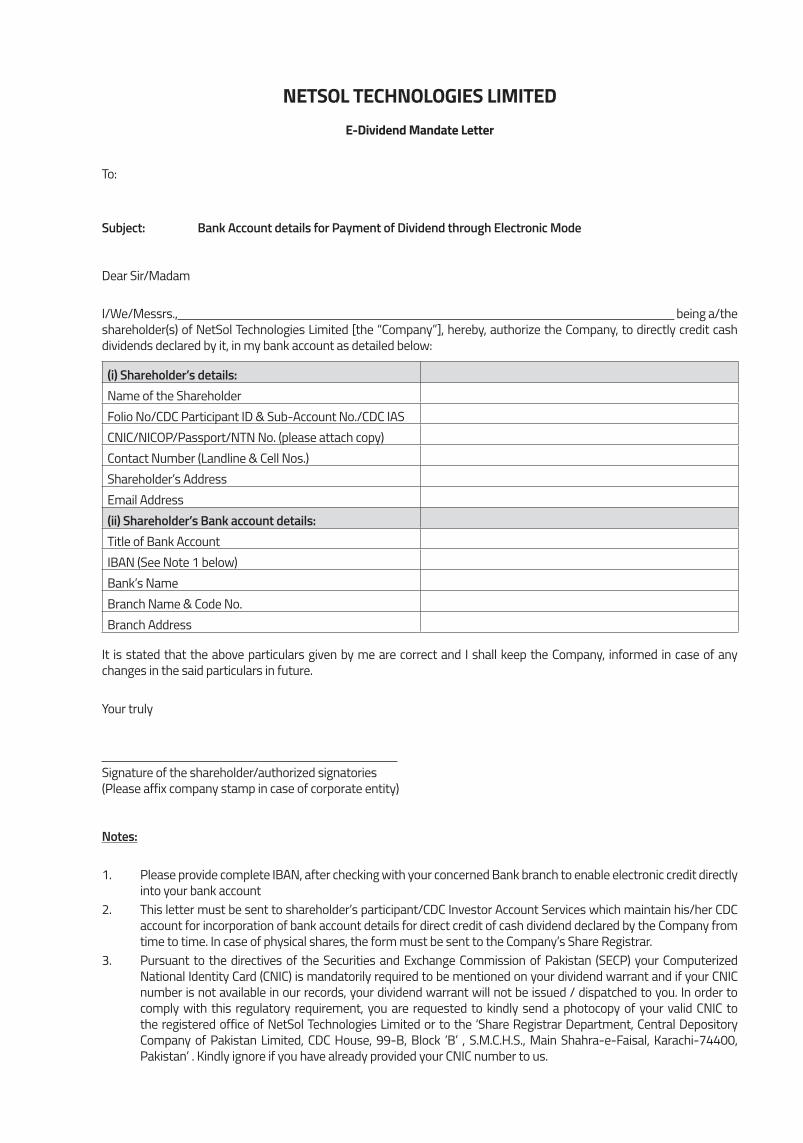
ANNUAL REPORT 2018 145
NETSOL TECHNOLOGIES LIMITED
E-Dividend Mandate Letter
To:
Subject: Bank Account details for Payment of Dividend through Electronic Mode Dear Sir/Madam
I/We/Messrs., being a/the shareholder(s) of NetSol Technologies Limited [the “Company”], hereby, authorize the Company, to directly credit cash dividends declared by it, in my bank account as detailed below:
(i) Shareholder’s details:Name of the ShareholderFolio No/CDC Participant ID & Sub-Account No./CDC IASCNIC/NICOP/Passport/NTN No. (please attach copy)Contact Number (Landline & Cell Nos.)Shareholder’s AddressEmail Address(ii) Shareholder’s Bank account details:Title of Bank AccountIBAN (See Note 1 below)Bank’s NameBranch Name & Code No.Branch Address
It is stated that the above particulars given by me are correct and I shall keep the Company, informed in case of any changes in the said particulars in future.
Your truly
Signature of the shareholder/authorized signatories(Please affix company stamp in case of corporate entity)
Notes:
1. Please provide complete IBAN, after checking with your concerned Bank branch to enable electronic credit directly into your bank account
2. This letter must be sent to shareholder’s participant/CDC Investor Account Services which maintain his/her CDC account for incorporation of bank account details for direct credit of cash dividend declared by the Company from time to time. In case of physical shares, the form must be sent to the Company’s Share Registrar.
3. Pursuant to the directives of the Securities and Exchange Commission of Pakistan (SECP) your Computerized National Identity Card (CNIC) is mandatorily required to be mentioned on your dividend warrant and if your CNIC number is not available in our records, your dividend warrant will not be issued / dispatched to you. In order to comply with this regulatory requirement, you are requested to kindly send a photocopy of your valid CNIC to the registered office of NetSol Technologies Limited or to the ‘Share Registrar Department, Central Depository Company of Pakistan Limited, CDC House, 99-B, Block ‘B’ , S.M.C.H.S., Main Shahra-e-Faisal, Karachi-74400, Pakistan’ . Kindly ignore if you have already provided your CNIC number to us.

NETSOL TECHNOLOGIES LIMITED146