NETFLOW ANALYZER 9600 - AN OVERVIEW
29
ManageEngine NetFlow Analyzer Bandwidth Monitoring, Traffic Analytics and Network Anomaly Detection Product Overview
-
Upload
netflow-analyzer -
Category
Technology
-
view
791 -
download
4
description
Transcript of NETFLOW ANALYZER 9600 - AN OVERVIEW
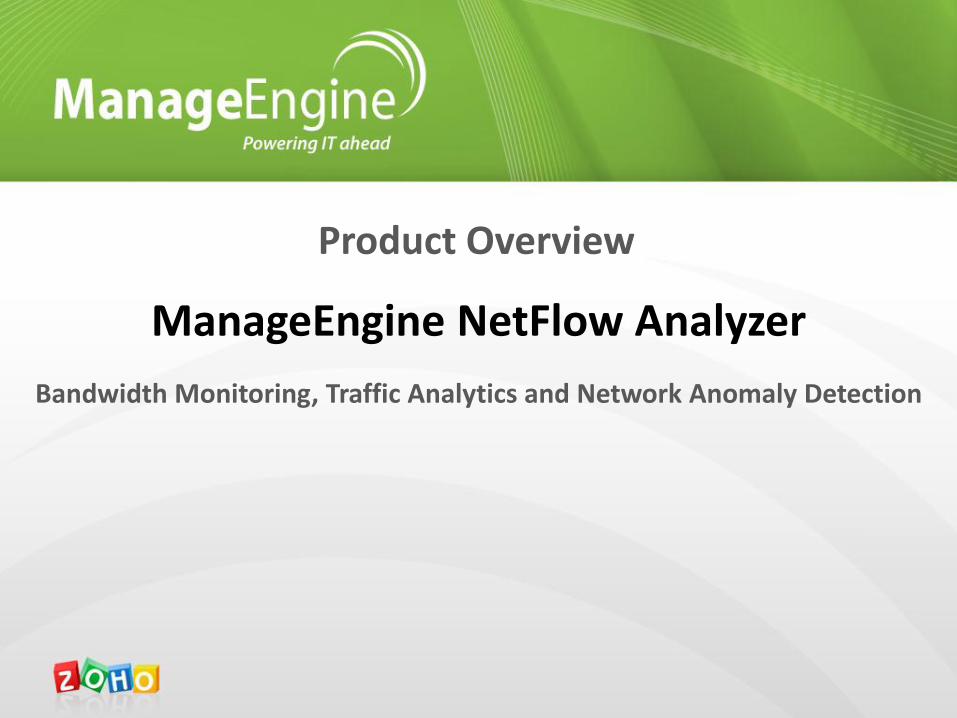
ManageEngine NetFlow Analyzer
Bandwidth Monitoring, Traffic Analytics and Network Anomaly Detection
Product Overview

About ManageEngine
OEM / Telecom division is also the World’s #1 EMS
IT Management division with 55K + customers
Web 2.0 division with the most comprehensive
suite of SAAS applications
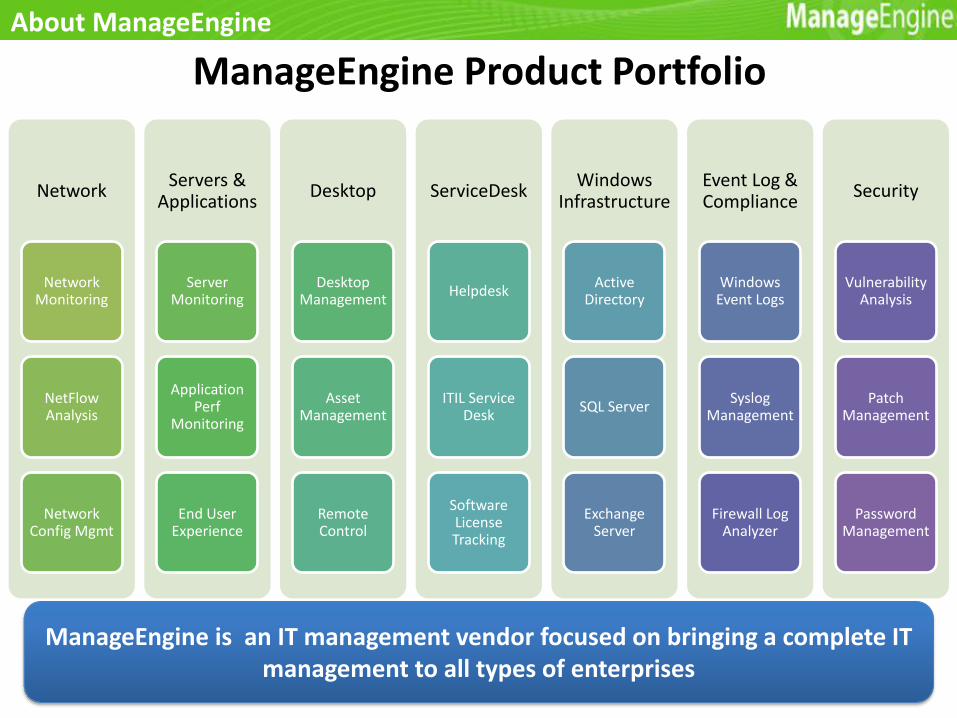
About ManageEngine
Network
Network Monitoring
NetFlow Analysis
Network Config Mgmt
Servers & Applications
Server Monitoring
Application Perf
Monitoring
End User Experience
Desktop
Desktop Management
Asset Management
Remote Control
ServiceDesk
Helpdesk
ITIL Service Desk
Software License Tracking
Windows Infrastructure
Active Directory
SQL Server
Exchange Server
Event Log & Compliance
Windows Event Logs
Syslog Management
Firewall Log Analyzer
Security
Vulnerability Analysis
Patch Management
Password Management
ManageEngine is an IT management vendor focused on bringing a complete IT management to all types of enterprises
ManageEngine Product Portfolio
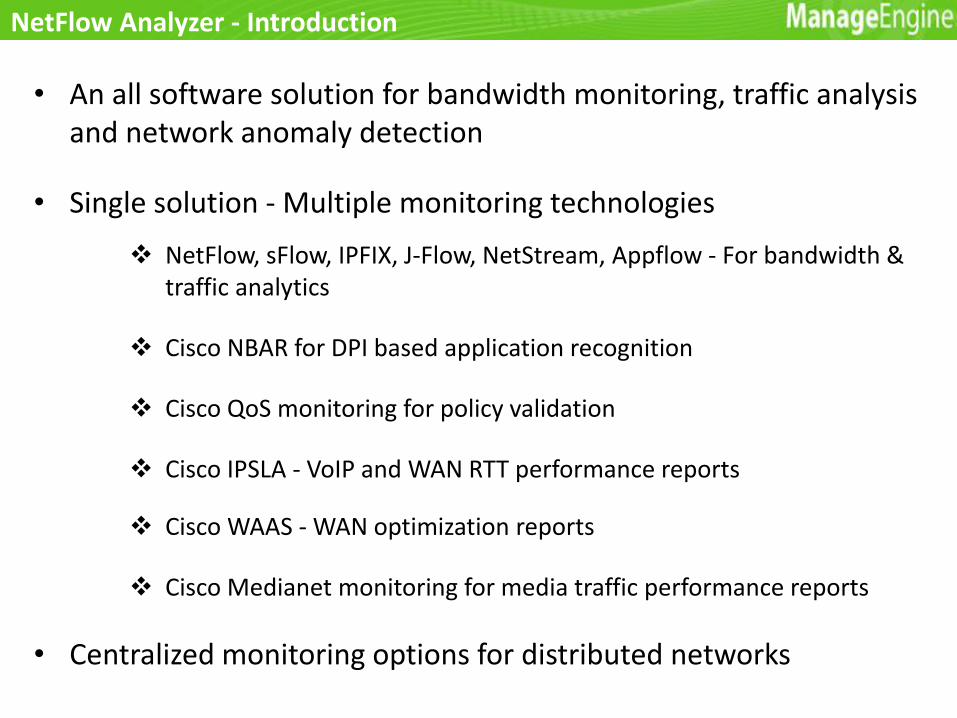
NetFlow Analyzer - Introduction
• An all software solution for bandwidth monitoring, traffic analysis and network anomaly detection
• Single solution - Multiple monitoring technologies
NetFlow, sFlow, IPFIX, J-Flow, NetStream, Appflow - For bandwidth & traffic analytics
Cisco NBAR for DPI based application recognition
Cisco QoS monitoring for policy validation
Cisco IPSLA - VoIP and WAN RTT performance reports
Cisco WAAS - WAN optimization reports
Cisco Medianet monitoring for media traffic performance reports
• Centralized monitoring options for distributed networks

Traffic
NetFlow Analyzer NFA Web GUI
Device with Flexible NetFlow, NBAR, QoS and IPSLA enabled
Cisco WAAS with WAAS CM 4.1 or higher
SNMP to collect NBAR, QoS and IPSLA stats
Web Service Management Agent(WSMA) for Cisco Mediatrace
UDP NetFlow for Traffic, NBAR and Medianet reports
Via API for Cisco WAAS stats
NetFlow Analyzer – Working Architecture
• NBAR, QoS, IPSLA, Medianet and Mediatrace available only for Cisco devices
• Non-Cisco devices export flows like sFlow or IPFIX for bandwidth and traffic reports

Major Product Features
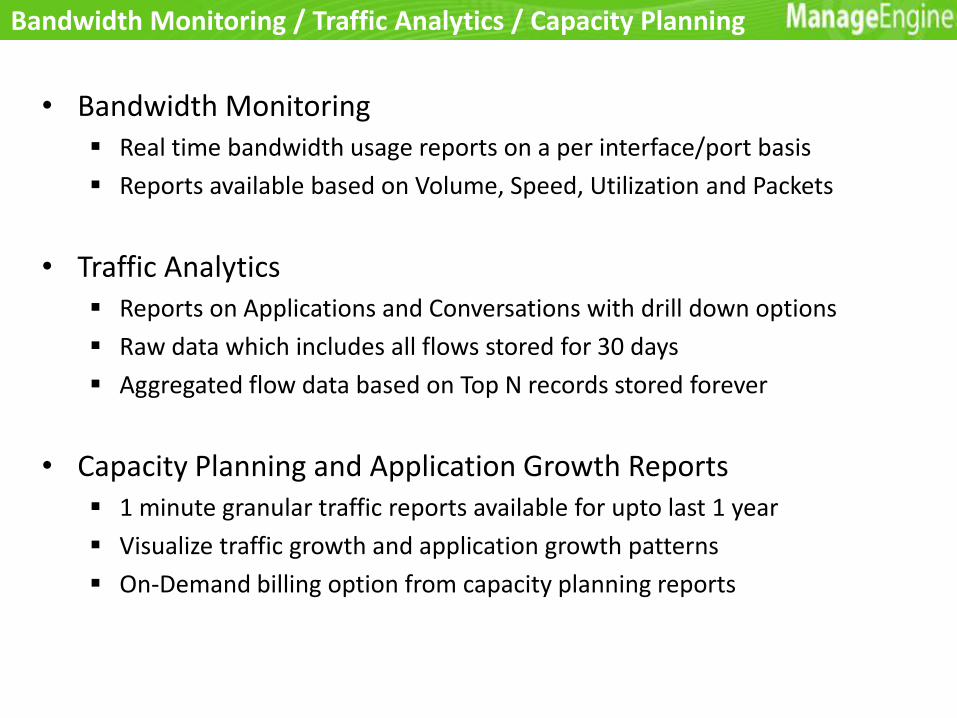
Bandwidth Monitoring / Traffic Analytics / Capacity Planning
• Bandwidth Monitoring Real time bandwidth usage reports on a per interface/port basis
Reports available based on Volume, Speed, Utilization and Packets
• Traffic Analytics Reports on Applications and Conversations with drill down options
Raw data which includes all flows stored for 30 days
Aggregated flow data based on Top N records stored forever
• Capacity Planning and Application Growth Reports 1 minute granular traffic reports available for upto last 1 year
Visualize traffic growth and application growth patterns
On-Demand billing option from capacity planning reports
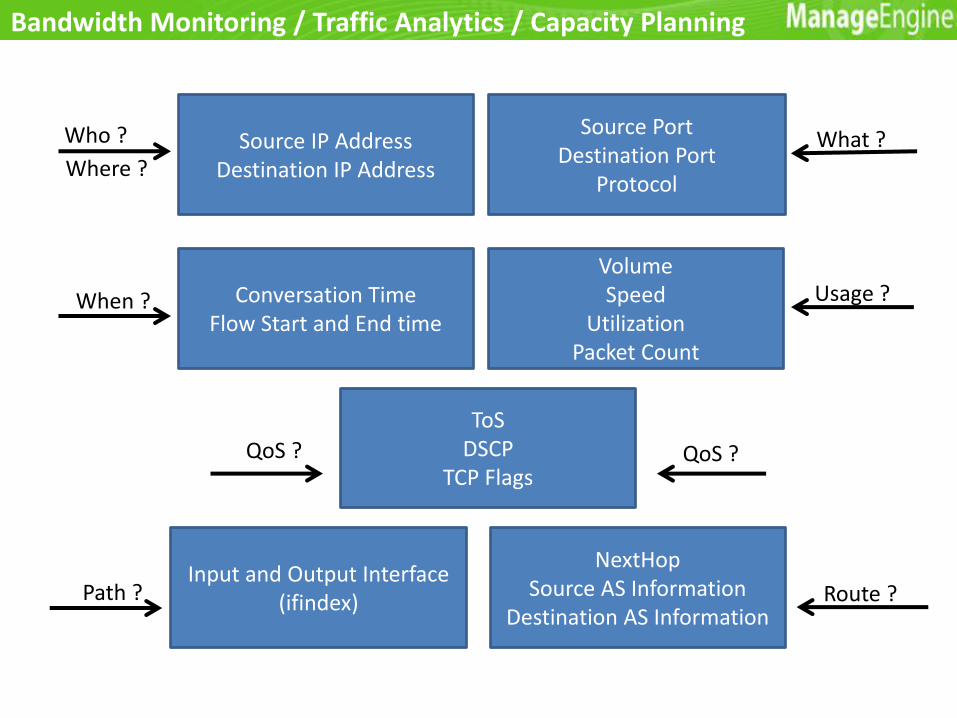
Volume Speed
Utilization Packet Count
Source Port Destination Port
Protocol
Input and Output Interface (ifindex)
Source IP Address Destination IP Address
ToS DSCP
TCP Flags
Conversation Time Flow Start and End time
NextHop
Source AS Information Destination AS Information
Who ? What ?
When ? Usage ?
Path ? Route ?
QoS ? QoS ?
Where ?
Bandwidth Monitoring / Traffic Analytics / Capacity Planning

Bandwidth Monitoring / Traffic Analytics / Capacity Planning
Bandwidth - Speed
Bandwidth - Utilization

Bandwidth Monitoring / Traffic Analytics / Capacity Planning
Application report
Conversation report from Raw data

• Capacity planning
Bandwidth Monitoring / Traffic Analytics / Capacity Planning
Capacity Planning
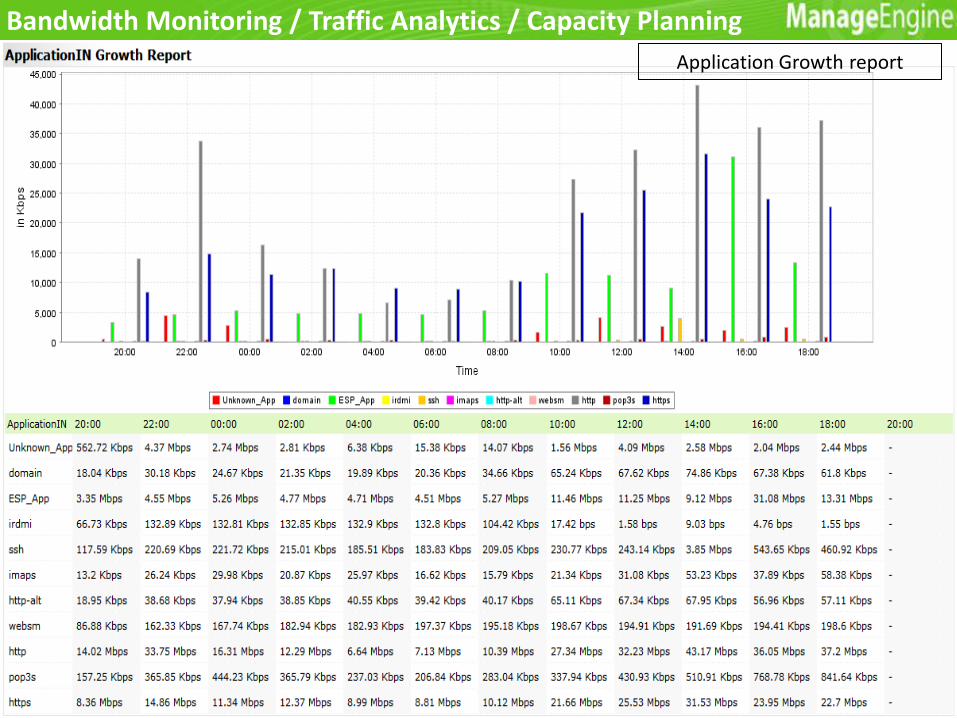
Application Growth report
Bandwidth Monitoring / Traffic Analytics / Capacity Planning

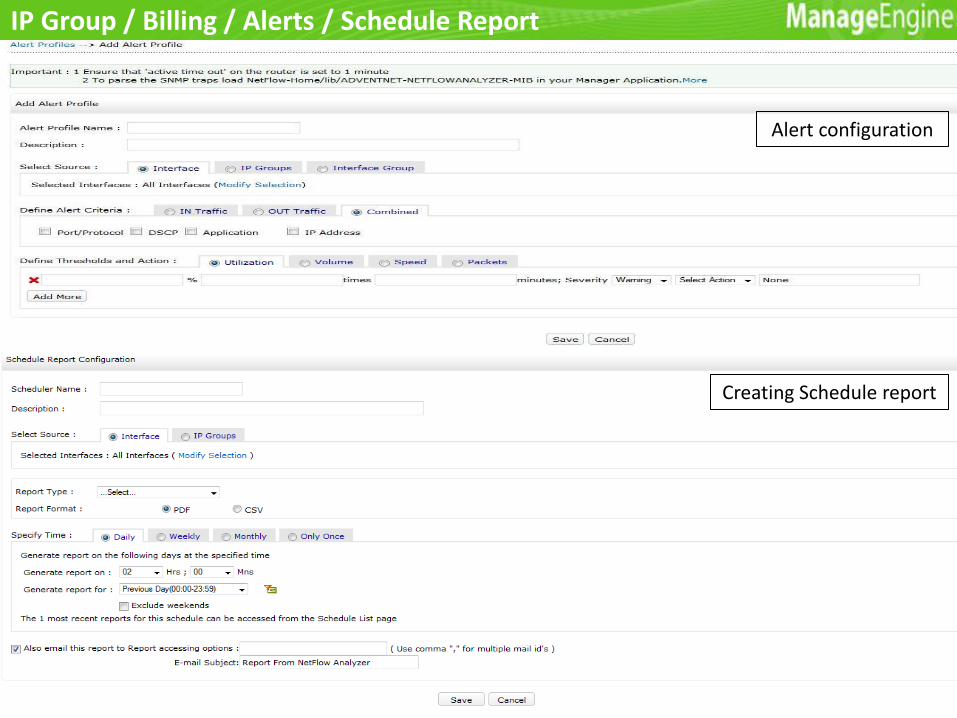
IP Group / Billing / Alerts / Schedule Report
• IP Groups Traffic grouping feature for customized reporting
Create ‘Groups’ based on
IP Address / IP Network / IP Range / Port / Port Range
IP and Port combination
• Usage based Billing Volume & Speed based billing with alerts and automatic emailing
Chargeback customers / departments / projects for bandwidth usage
• Threshold Violation Alerts Alert for traffic threshold violation on Interface, Application, Port, IP & DSCP
Alert options: SNMP Traps to any management product and Email Alerts
• Scheduled Report Emailing Auto emailing of all reports based on user defined schedules

IP Group / Billing / Alerts / Schedule Report
• Ip group creation IP Group creation

IP Group / Billing / Alerts / Schedule Report
• Billing
Creating ‘Bill’ plans
IP Group / Billing / Alerts / Schedule Report
Alert configuration
Creating Schedule report

Cisco NBAR, Cisco QoS and Cisco IPSLA Reports
• Cisco NBAR Report
Reports applications identified by Cisco NBAR
Visibility into applications using dynamic ports or well-known ports
Identifies Worms, Peer to Peer apps, Skype, etc.
• Cisco QoS Reports
QoS policy performance validation
Pre and post policy statistics and queuing information
Per Match statement drop reports
• Cisco IPSLA – VoIP and WAN RTT Reports
VoIP performance and WAN RTT metrics
Monitor jitter, latency, packet loss and MoS for VoIP packets
Measure Round-Trip time and link availability for data packets

NBAR Report
Cisco NBAR, Cisco QoS and Cisco IPSLA Reports

QoS Reports
Cisco NBAR, Cisco QoS and Cisco IPSLA Reports

IPSLA – VOIP Reports
Cisco NBAR, Cisco QoS and Cisco IPSLA Reports

IPSLA - WAN RTT Reports
Cisco NBAR, Cisco QoS and Cisco IPSLA Reports

Advanced Security Analytics Module
• Leverages on flow data to detect network behavior anomalies
• Real-time pattern matching and event correlation using Continuous Stream Mining Engine
• Identifies worms, viruses, suspicious traffic, scans and DoS attacks
• Detect and mitigate attacks that surpasses your firewalls and IDS
• In-depth reports with information on offenders, target and path

ASAM Dashboard
Advanced Security Analytics Module

Drill down to events
Advanced Security Analytics Module

Product Editions and Add-Ons
Professional Edition Real-time reports on: Bandwidth, application, port, protocol, host,
conversation, ToS, DSCP, TCP Flags. Alerts based on threshold violations for interface, IP, port and DSCP Automatic report scheduling, compare reports and custom dashboards Extensive grouping options to help with department, network and IP wise
traffic categorization 30 days raw NetFlow data retention and forever storage of aggregated data Cisco ASA NSEL, Cisco Medianet and Cisco WAAS reports
Professional Plus Edition All features of Professional Edition Cisco NBAR reports, Cisco QoS reports and Usage based Billing
Add-Ons for Professional and Professional Plus Cisco IPSLA Module - Upto 100 monitors can be created and monitored Advanced Security Analytics Module - Licensed for same number of
interfaces as the base license

Product Editions and Add-Ons
Enterprise Edition Distributed architecture using central reporting server and flow collectors Highly scalable – Supports 100,000 flows per second and 20,000 interfaces Includes most ‘Professional Edition’ features for bandwidth monitoring and
traffic analytics Ability to view and schedule reports in user defined “Time Zones” 30 days raw NetFlow data retention and forever storage of aggregated data
Add-Ons for Enterprise Edition Usage based Billing
Speed and Volume based billing reports Licensed for same number of interfaces as base license
Cisco QoS and NBAR QoS policy validation and Cisco NBAR reports Licensed for same number of interfaces as base license
Failover High Availability and data redundancy using automatic failover License for each central reporting server

For the complete list of supported devices visit:
http://www.manageengine.com/products/netflow/supported-devices.html
Vendor Flows Device List
Cisco NetFlow 800, 1700, 2600, 1800, 1900, 2800, 2900, 3660, 3800, 3900, 4500, 6500, 7200, 7600, 10000, 12000, Cisco ASA (IOS 8.2 onwards), Catalyst 4000, 4500, 6000, and 6500 series, Nexus 7000, Cisco ASR and even more
Hewlett-Packard sFlow ProCurve series
Juniper Networks NetFlow, J-Flow Juniper SRX series, M10i series and more Juniper devices
Nortel IPFIX 5500 & 8600 Series
Adtran NetFlow NetVanta 3200, 3305, 4305, 5305, 1524, 1624, 3430, 3448, 3130, 340, and 344
3Com NetFlow 8800 Series Switches
Extreme Networks NetFlow Alpine 3800 series, BlackDiamond 6800 series, BlackDiamond 8800 series, BlackDiamond 10808, BlackDiamond 12804C , BlackDiamond 12804R ,Summit X450 Series , Summit i
series
Force10 Networks sFlow E series
Dell – Force 10 Networks
sFlow PowerConnect 6200 series, PowerConnect 8200 series
Huawei NetStream Huawei AR1200, NE40EX3 and more
Supported Devices

Customers
More than 5000 Enterprises worldwide use ManageEngiNetFlow Analyzer
www.netflowanalyzer.com
Technical Support Team:
ManageEngine Sales:
NetFlow Analyzer Blogs:
https://blogs.netflowanalyzer.com
User Forums:
http://forums.netflowanalyzer.com
LinkedIn:
http://www.linkedin.com/groups?gid=4208806&trk=hb_side_g
Contact Us