
Netcraft Analysis: Online Speed Testing Tools - SETDA€¦ · Netcraft Analysis: Online Speed...
17
Copyright Notice: This document is copyright Netcraft Ltd, 2013. Netcraft Analysis: Online Speed Testing Tools 25 February 2013 Netcraft Ltd. 2 Belmont Bath BA1 5DZ Author: Dr Matt Foster Email: [email protected]
Transcript of Netcraft Analysis: Online Speed Testing Tools - SETDA€¦ · Netcraft Analysis: Online Speed...

Copyright Notice: This document is copyright Netcraft Ltd, 2013.
Netcraft Analysis:
Online Speed Testing Tools
25 February 2013
Netcraft Ltd.
2 Belmont
Bath
BA1 5DZ
Author: Dr Matt Foster
Email: [email protected]

Copyright © Netcraft 2013 25 February 2013 Page 2 of 17
0 Table of Contents
0 Table of Contents ...................................................................................................... 2
1 Introduction .............................................................................................................. 3
2 Terminology .............................................................................................................. 4
2.1 Bandwidth ............................................................................................................................... 4
2.2 Latency & Round-trip Time ..................................................................................................... 4
2.3 CDN ......................................................................................................................................... 5
3 Tools & Speed Testing Methodologies........................................................................ 6
3.1 SpeedTest.net ......................................................................................................................... 7
3.2 SchoolSpeedTest ..................................................................................................................... 8
3.3 Smarter Balanced .................................................................................................................... 9
JavaScript ...................................................................................................................... 10 3.3.1
Java ................................................................................................................................ 10 3.3.2
4 Measurements ........................................................................................................ 11
4.1 Wireless Office Network ....................................................................................................... 11
4.2 New York Server .................................................................................................................... 12
4.3 Wired Office Network ........................................................................................................... 12
5 Summary of Tools .................................................................................................... 15
6 Conclusions ............................................................................................................. 16
7 About Netcraft ........................................................................................................ 17
8 Disclaimer ............................................................................................................... 17

Copyright © Netcraft 2013 25 February 2013 Page 3 of 17
1 Introduction
The internet has revolutionised the way business around the world is handled and has ushered in a
new age of information and learning. It has never been easier to share and consume images, videos
and text and as time progresses computers evolve further into devices which rely upon high-speed
internet access to provide almost all of their functionality. Outside of schools, personal education
has been revolutionised by sites like Khan Academy1, which make it possible for anyone with an
internet connection to “learn anything for free”.
Within schools, the increasing use of streaming video and interactive online learning tools pose
particular problems not often seen in other settings. Classes can consist of many students, and
multiple classes can run simultaneously, leading to potentially large numbers of users contending for
bandwidth at any one time. In order to take full advantage of these new resources, schools will need
very high-speed internet connectivity.
This document analyses three tools specified by the State Educational Technology Directors
Association (SETDA) that are used to assess the current level of internet connectivity available within
schools. It presents a detailed description of each tool, including its strengths and weaknesses
followed by observations based on measured data, and finally, conclusions.
1 http://www.khanacademy.com

Copyright © Netcraft 2013 25 February 2013 Page 4 of 17
2 Terminology
Before describing the tools and their methodologies, several terms must first be explained. This
section describes the various meanings of bandwidth, as well as latency and CDNs.
2.1 Bandwidth When accessing resources on the internet the rate at which a user can download these resources is
often called the bandwidth or speed of connection. Due to the fact that resources are downloaded
from remote servers, often in different cities, states and countries, users will find that access speeds
vary greatly from site to site. Access speeds to these remote servers are affected by a large number
of factors. For example, when repeatedly accessing the same resources, users may find the speed
varies diurnally in sympathy with the number of users sharing the connection to the site. These
effects will often be due to users of a local network competing for access, and also along the
networks shared with other users accessing the same resources. In some cases, when using remote
wireless links, connection speeds can also be affected by the weather.
Bandwidth or speed can be defined in multiple ways, depending on the context in which it is used.
For example, the capacity of a link is the maximum speed at which data can be transmitted across it,
the available bandwidth (sometimes colloquially called the “goodput”) of a link is the amount of
spare capacity during a certain period, and the bulk transfer capacity is the maximum speed
obtainable by a single (TCP) connection to a server.
For our purposes, the available bandwidth of a link will usually be the most useful of these, as it the
amount of capacity available for use at any given time, and will be an important limit on how many
users can utilise the link. This will be the main metric used here and will be referred to as ‘speed’
throughout this document.
Bandwidth is measured in bits per second, written as bps, or more commonly megabits per second,
written as Mbps. One megabit per second is usually considered to be 1,000,000 bits per second. In
some cases, the alternative units of bytes per second or megabytes per second are used. These are
written as Bps (note the capital ‘b’), or MBps respectively. To convert from MBps to Mbps, multiply
by 8 – the number of bits in a byte.
2.2 Latency & Round-trip Time The amount of time it takes a remote computer to respond to requests is known as its latency. The
total time taken for a message to pass from a local computer to a remote server, and then back
again is known as the round-trip time (or RTT, typically double the latency). Latency is important
because it moderates the bulk transfer capacity of a connection, which means that servers which
take a long time to respond will also have a lower connection speed. For this reason, some speed
test software picks servers with a lower latency when performing tests.
Latency affects bulk transfer capacity because each connection only allows a certain amount of data
to be in flight at any given time, and because the latency describes how long it takes for data to
travel across the connection. This means that a connection with a high latency cannot transmit data
as quickly as one with a low latency. This is often described using a measurement called the
bandwidth-delay product2, which is a measurement of how much data can be travelling in a
connection at any given time. This is calculated by multiplying the bandwidth with the round-trip
2 http://en.wikipedia.org/wiki/Bandwidth-delay_product

Copyright © Netcraft 2013 25 February 2013 Page 5 of 17
time, hence the name. The fact that the RTT is used and not the latency is due to the fact that TCP
requires data to be acknowledged by its receiver before more can be sent, which adds to the delay.
2.3 CDN A CDN (content delivery network) is a system in which servers are distributed across multiple
locations, and where each server can be used to deliver content to end users. When a user accesses
a site hosted using a CDN, the user will connect via a close server. This is designed to ensure a high
speed, low latency connection regardless of the relative locations of the user and the servers hosting
the site.

Copyright © Netcraft 2013 25 February 2013 Page 6 of 17
3 Tools & Speed Testing Methodologies
When measuring the available bandwidth to a remote server it is important to consider what is
actually being measured.
Connecting to a server involves communications from the device which is making the connection
passing through the local network to which it is connected, and then across links between several
other networks which form a path between the device and server. If any one of the links between or
within these networks is slower than any other, the available bandwidth will be reduced; the
measured speed will always be lowest available bandwidth on any individual link between the device
and server. Many connections are also asymmetric, which means that the available download and
upload speeds differ. In this case, advertised upload speeds are generally significantly lower than
download speeds, as most web traffic is downloaded by users rather than uploaded.
When taking measurements using a device which is connected to a wireless network, it is important
to realise that modern internet connections can be considerably faster than wireless networks, and
that because of their use of a shared transmission medium (air), heavily used wireless networks can
perform significantly worse than their theoretical optimum speeds. Moving devices away from
wireless access points can also result in a loss of connection speed. In these cases a speed test which
was run from a device connected to a wireless network may measure the speed of the wireless
network rather than the internet connection.
In some cases, the device being used to perform the tests may not be fast enough to generate or
consume enough data to saturate the available bandwidth; in this case, the measured speed will be
limited by the device running the speed tests.
Finally, the speed testing tool itself may not be able to accurately measure speeds over (or under)
certain thresholds which could cause measurements to be falsely deflated or elevated.
Netcraft examined three tools which are commonly used to assess the internet connection speed of
US schools, in order to assess how they work as well as their similarities and differences.
The following section examines how the tools operate, as well as highlighting limitations and
advantages.
The three tools assessed were:
● SpeedTest.net3
● http://www.schoolspeedtest.org/4
● Smarter Balanced diagnostic tools5
3 http://www.speedtest.net
4 http://www.schoolspeedtest.org/
5 http://air.tds.airast.org/student/Pages/LoginShell.aspx?section=sectionDiagnostics&c=SBAC_PT

Copyright © Netcraft 2013 25 February 2013 Page 7 of 17
3.1 SpeedTest.net SpeedTest.net is among the best known speed measurement tools. It operates by picking one of
over 1000 remote hosts, in order to minimize latency. By picking the server with the lowest latency
(which can severely affect bulk transfer speeds – see section 2.2), SpeedTest.net aims to provide an
accurate estimate of the maximum available bandwidth. All of these remote hosts are operated by
third parties. The tool itself uses Adobe Flash and makes use of between two and four simultaneous
connections. The results presented by SpeedTest.net include ping (round-trip time), download speed
and upload speed.
SpeedTest.net maintains a comprehensive library of technical documentation at
https://support.speedtest.net/home. This documentation describes how its test works in detail.
Before both the main download and upload tests, small-scale tests are carried out to approximate
the available bandwidth. The results of these tests are then used to estimate how large the files and
data used by the full tests should be. The download speed test works by downloading a series of
images of random pixels over a period of approximately 10 seconds, using between two and four
simultaneous connections to attempt to maximise the speed. Using multiple connections allows
SpeedTest.net to download or upload more traffic than using a single connection allows. Most
modern web browsers use between two and six connections to each visited site for the same
reason. During the test process, the speed is measured about 30 times per second. This contrasts
with the other tools, which do not take measurements during the testing processes. These
measurements are then converted into a histogram, and the top 10% and bottom 30% of samples
are discarded. Finally the remaining samples are averaged and the result is used as the total
download speed. Discarding samples is designed to reduce the effects of performance issues which
can cause fluctuations in speed, as well as the fact that the TCP protocol uses a technique called slow
start6, which causes connections to start slowly, and increase in speed according to network
conditions.
6 http://en.wikipedia.org/wiki/Slow-start

Copyright © Netcraft 2013 25 February 2013 Page 8 of 17
Figure 1 (below) shows a simulated histogram of the type of measurements which might be
gathered by SpeedTest.net during testing. The areas highlighted in red cover the bottom 30% and
top 10% of the measurements taken, which are discarded for the final result. Both the modified
average (in green), and average of all measurements (in blue) are shown. This demonstrates that
SpeedTest.net's method of removing samples causes the measured values to be higher than they
would be without the modifications.
Figure 1: simulated bandwidth measurements showing the effect of truncating data on the average
SpeedTest.net’s upload speed measurements are less well documented, but operate in a similar
fashion to the download tests. The flash applet generates and sends random data to the test server
using up to four connections (depending on the network speed). Measurements of speed are taken
whilst the upload process is running, and then the top 50% of measurements are used to calculate
the final speed.
While testing the tools, Netcraft observed that SpeedTest.net’s results tend to be higher than the
other tools.
3.2 SchoolSpeedTest SchoolSpeedTest is an EducationSuperHighway7 project designed to survey the actual internet
connection speed available to schools and classrooms across the US. It is hoped that the information
gathered by schools running tests will help inform policy makers and demonstrate the need for
improvements in education infrastructure.
The SchoolSpeedTest site contains a database of frequently asked questions, at:
http://www.schoolspeedtest.org/faq.html.
7 http://www.educationsuperhighway.org

Copyright © Netcraft 2013 25 February 2013 Page 9 of 17
SchoolSpeedTest is designed to run on computers within schools and requires no special plugins or
software to run. However, it is likely that measured performance will be higher when using modern
web browser software. On first loading the site, a variety of requests for commonly used websites
are made to determine which (if any) are blocked. It also checks if the address being used to access
the site is located within the United States, and will only function if it is. Finally, the site checks
several different CDNs (see section 2.3 for definition) to determine which has the lowest latency, the
fastest is then used during download speed tests. The CDNs used by this tool are AWS CloudFront,
RackCDN, Limelight Networks and Google, all of which are well-known and commonly used by large
numbers of websites.
SchoolSpeedTest employs two different download speed testing methodologies, the first of these
work by downloading a series of images files from the selected CDN over a period of approximately
15 seconds, and recording both how long the transfers take and how large the images are in order to
perform speed calculations.
The second method involves simultaneously download several images, and then calculating the
aggregate download speed. This method often leads to a higher speed measurement than
downloading images individually, and emulates the way web browsing software loads images and
other resources when browsing.
Following these two tests, the system then picks maximum of either the highest of the series
measurements, or the aggregated speed measurement and displays this to the user. All speed
measurements are sent to SchoolSpeedTest’s systems.
SchoolSpeedTest’s upload tests make use of three different pre-generated payloads, which are
uploaded to the server over a period of approximately 10 seconds. Rather than use one of several
CDNs as in the download test, all uploads are made to Amazon’s CloudFront. The uploads are timed,
and the fastest upload speed is calculated and displayed to the user. As with the download tests, the
instantaneous speeds are not sampled during the test, but calculated at the end, using the total time
taken to upload each set of data. All measurements are sent to SchoolSpeedTest’s systems.
SchoolSpeedTest’s upload speed measurements do not appear to make multiple simultaneous
uploads, which could limit the maximum measurable upload speed.
This methodology differs from SpeedTest.net in that it picks from a list of average speeds, rather
than averaging a (modified) list of samples. SchoolSpeedTest’s documentation explains that this is
because it aims to measure the “actual capacity available for digital learning”. This was reflected in
the results gathered by Netcraft, which were slightly lower on average than those produced by
SpeedTest.net.
3.3 Smarter Balanced The Smarter Balanced Diagnostics page picks between two different speed testing methodologies,
favouring a Java applet when a functional Java plugin is available, and falling back on using JavaScript
otherwise. The site does not operate when accessed using Internet Explorer.
After determining the available bandwidth, the Smarter Balanced Diagnostics page makes use of a
user-supplied number of users, and one of two possible exam profiles to determine if the amount of
bandwidth is sufficient. An exam profile contains information on the number of questions, average
response times and bandwidth requirements for typical exams. This is done using a statistical model,
which is one of the most sophisticated features of any of the tools tested by Netcraft. This model

Copyright © Netcraft 2013 25 February 2013 Page 10 of 17
and the selected parameters do not affect the speed measurements displayed by this tool, but are
instead used to determine if the measured bandwidth is sufficient for the selected exam profile.
JavaScript 3.3.1
The JavaScript-based test methodology is intended as a fall-back mechanism for use on devices
without Java. It downloads the same random image three times, and then calculates the speed by
timing the download and then dividing by the image size. This provides the average download speed.
The site then displays the average of these three measurements to the user.
Upload testing is carried out by generating approximately 1 MB of test data and uploading it to the
server three times. These requests are timed and the measured times used to calculate bandwidth
measurements. The average of these three measurements is used as the measured upload speed.
During testing, Netcraft found that this measurement method produces the least accurate results of
all three tools, with a maximum measured download bandwidth of approximately 10 Mbps
(although tests results taken approximately one week after the first set did not appear to have the
same limitations). This is likely due to the fact that only limited measurements are carried out (the
images are approximately 1 MB in size), and that the server hosting the Smarter Balanced site has a
high latency (approximately 25 ms from New York, 100 ms from the United Kingdom). Some of the
other tools make use of CDNs to minimize this issue.
Java 3.3.2
As with the other download tools, the Smarter Balanced Java based methodology makes use of
image downloads to estimate download speed, starting with a small-scale test in which three small
images are downloaded. The speed of these downloads is then used to determine which of several
larger images will be used for the main test. The larger image is then downloaded three times, and
the final speed result is calculated by averaging the speeds of the three downloads. As with
SchoolSpeedTest’s methodology, measurements are calculated once each download is completed,
rather than during the download process.
The Java applet uses up to two simultaneous connections in order to increase the range of
measureable bandwidth. However, whilst Netcraft found that this methodology was more reliable
than the JavaScript method, it was still only able to accurately measure bandwidths of around 20
Mbps during the first round of testing. This is likely to be sufficient for schools with lower-bandwidth
internet connections, but inadequate for higher speed connections. This limitation was not present
in results made approximately one week after the first measurements were taken, although
measured values were still low from other locations.

Copyright © Netcraft 2013 25 February 2013 Page 11 of 17
4 Measurements
Netcraft made a large number of measurements to assess how the tools behave under differing
conditions.
These included measurements from a Macintosh connected to a wired office network in the United
Kingdom with a 100 Mbps (symmetric - i.e. same available upload and download bandwidth) leased
line, a Windows 7 laptop connected to a heavily used 802.11g wireless network and an Ubuntu
(virtual) machine hosted in a datacenter in New York. In each case, Netcraft recorded the results of
30 sequential runs of each tool in order to get an idea of how consistently they performed under
potentially changing conditions.
4.1 Wireless Office Network A boxplot of the download and upload speed results gathered from the wireless network is shown in
Figure 2. This figure illustrates how the measurements taken using each tool differ, and are spread
out. The line in the centre of each box shows the median, the sides of the box show the upper and
lower quartile, and the ‘whiskers’ extend to 1.5 times the distance between the upper and lower
quartiles.
Figure 2: Measurements taken on a wireless network
Comparing the medians in the figure, it is clear that SpeedTest.net has a tendency to produce higher
results than the other tools, especially in upload tests. SchoolSpeedTest produces lower results than
SpeedTest.net, with a much lower spread, and the Smarter Balanced tools both produce results
which are much lower than the other tools report, in both upload and download tests. In this case,
the maximum theoretical bandwidth is 54 Mbps, although the available bandwidth is lower, due to
the contention with other users. Measurements taken on the other networks show similar trends,

Copyright © Netcraft 2013 25 February 2013 Page 12 of 17
although the difference between upload speed measurements in more pronounced in this case. This
could be due to the network conditions occurring during the test, as available bandwidth can be
affected by many factors.
4.2 New York Server Results gathered on the Ubuntu machine in New York are shown in Figure 3. These results show
broadly similar characteristics to those of Figure 2. Although in this case the Smarter Balanced – Java
results are higher than in the other tests they are still substantially lower than those provided by the
other tools.
Figure 3 : Measurements taken on an Ubuntu virtual machine in New York
4.3 Wired Office Network Figure 4 shows results gathered on the 100Mbps wired network. These were taken on a (2007
model) MacBook Pro laptop, using Chrome. Once again, similar trends are in evidence, however the
measured upload speeds are all fairly low. This is likely to be due to network usage during the period
the measurements were taken, demonstrating the need to take measurements at multiple times in
order to get an accurate picture of network speeds, especially on high speed networks where
computers may not be able to generate or consume sufficient amounts of data to accurately
measure the available capacity.

Copyright © Netcraft 2013 25 February 2013 Page 13 of 17
Figure 4: Measurements taken on a wired network with a 100 Mbit/s internet connection.
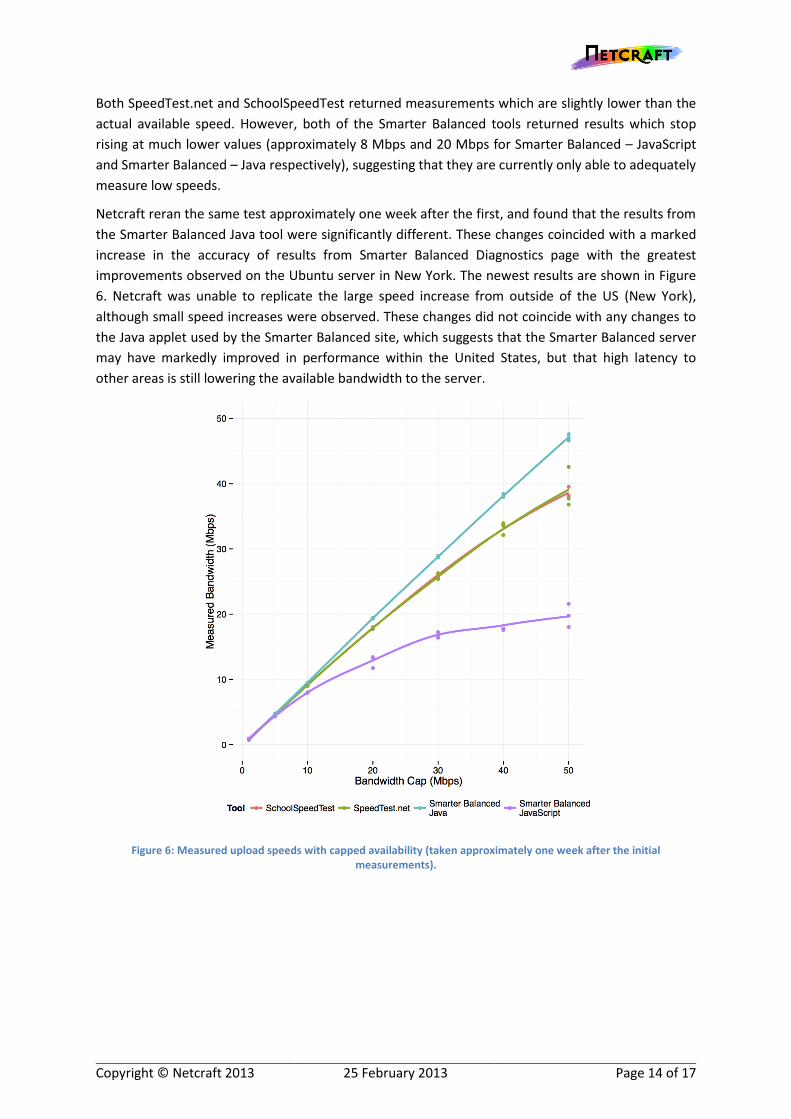
To further investigate the differences between the speed testing tools and their results, Netcraft artificially limited the available upload bandwidth on an Ubuntu virtual machine hosted in New York. The results, (which are shown in Figure 5) clearly illustrate the tools’ differing behaviour.
Figure 5: Measured upload speeds with capped availability
Copyright © Netcraft 2013 25 February 2013 Page 14 of 17
Both SpeedTest.net and SchoolSpeedTest returned measurements which are slightly lower than the
actual available speed. However, both of the Smarter Balanced tools returned results which stop
rising at much lower values (approximately 8 Mbps and 20 Mbps for Smarter Balanced – JavaScript
and Smarter Balanced – Java respectively), suggesting that they are currently only able to adequately
measure low speeds.
Netcraft reran the same test approximately one week after the first, and found that the results from
the Smarter Balanced Java tool were significantly different. These changes coincided with a marked
increase in the accuracy of results from Smarter Balanced Diagnostics page with the greatest
improvements observed on the Ubuntu server in New York. The newest results are shown in Figure
6. Netcraft was unable to replicate the large speed increase from outside of the US (New York),
although small speed increases were observed. These changes did not coincide with any changes to
the Java applet used by the Smarter Balanced site, which suggests that the Smarter Balanced server
may have markedly improved in performance within the United States, but that high latency to
other areas is still lowering the available bandwidth to the server.
Figure 6: Measured upload speeds with capped availability (taken approximately one week after the initial measurements).
Copyright Notice: This document is copyright Netcraft Ltd, 2013.
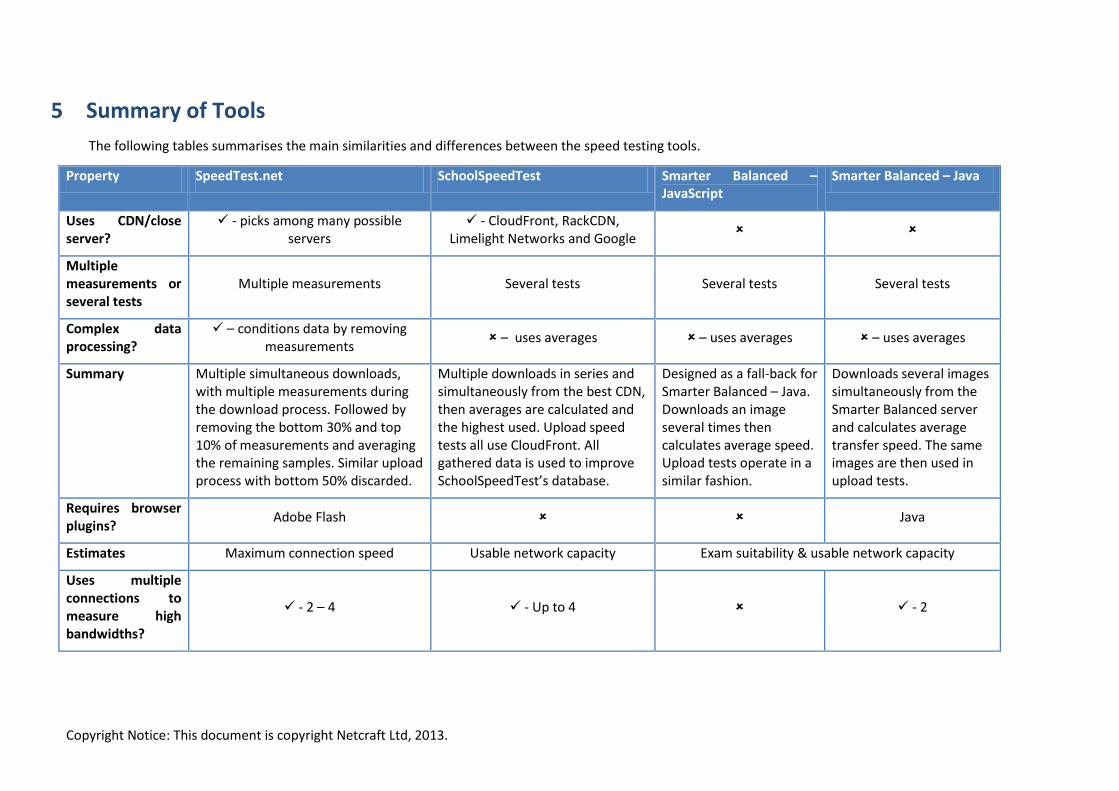
5 Summary of Tools
The following tables summarises the main similarities and differences between the speed testing tools.
Property SpeedTest.net SchoolSpeedTest Smarter Balanced – JavaScript
Smarter Balanced – Java
Uses CDN/close server?
- picks among many possible servers
- CloudFront, RackCDN, Limelight Networks and Google
Multiple measurements or several tests
Multiple measurements Several tests Several tests Several tests
Complex data processing?
– conditions data by removing measurements
– uses averages – uses averages – uses averages
Summary Multiple simultaneous downloads, with multiple measurements during the download process. Followed by removing the bottom 30% and top 10% of measurements and averaging the remaining samples. Similar upload process with bottom 50% discarded.
Multiple downloads in series and simultaneously from the best CDN, then averages are calculated and the highest used. Upload speed tests all use CloudFront. All gathered data is used to improve SchoolSpeedTest’s database.
Designed as a fall-back for Smarter Balanced – Java. Downloads an image several times then calculates average speed. Upload tests operate in a similar fashion.
Downloads several images simultaneously from the Smarter Balanced server and calculates average transfer speed. The same images are then used in upload tests.
Requires browser plugins?
Adobe Flash Java
Estimates Maximum connection speed Usable network capacity Exam suitability & usable network capacity
Uses multiple connections to measure high bandwidths?
- 2 – 4 - Up to 4 - 2

Copyright Notice: This document is copyright Netcraft Ltd, 2013.
6 Conclusions
Both SpeedTest.net and SchoolSpeedTest make excellent choices for examining network speed
because of their use of close servers and CDNs to ensure accurate measurements regardless of
physical location. SpeedTest.net is a good fit for technical support and evaluating the raw speed of
newly installed internet connections, as its vast network of servers means the likelihood of obtaining
a realistic estimate of the connection’s available bandwidth is high. Also the results produced by the
tool are designed to be slightly higher than other tools. SchoolSpeedTest is suitable for evaluating
existing networks for information on useable speed, as it simulates actual browsing by making use of
a content delivery network and measuring average available bandwidth, without discarding low
results. It has the added advantage that results gathered with be to help determine future education
policies. Finally, results produced by the Smarter Balanced tools are generally less consistent than
those produced by the other tools. However, in Netcraft’s later tests (see Figure 6) the Java based
tests performed well. This suggests that the Smarter Balanced diagnostic tools may be useful for
testing devices on which an up to date Java plugin is available.
When testing, it is important to remember that it is only possible to measure the speed of the
slowest link in the path between the measuring device and remote server, and that measured
results will vary according to many different factors, including the number of users, time of day and
server performance. For these reasons, it is necessary to take multiple measurements using different
devices and networks.

Copyright © Netcraft 2013 25 February 2013 Page 17 of 17
7 About Netcraft
Netcraft is an Internet services company based in Bath, England.
Netcraft is funded through retained profit and derives its revenue by providing internet security
services, including anti-fraud and anti-phishing services, application testing, code reviews,
automated penetration testing and bespoke consulting services. Netcraft also provides research
data and analysis on many aspects of the Internet. Having explored the Internet since 1995, Netcraft
is a respected authority on the market share of web servers, operating systems, hosting providers,
ISPs, encrypted transactions, electronic commerce, scripting languages and content technologies on
the internet.
8 Disclaimer
The information contained in this document is provided for general information purposes only.
Whilst care has been taken in compiling the information in this report, Netcraft does not warrant or
represent that this information is free from errors or omissions. To the maximum extent permitted
by law, Netcraft accepts no responsibility in respect of this document and any loss or damage
suffered or incurred by a person for any reason relying on any of the information provided in this
document and for acting, or failing to act, on any information contained on or referred to in this
document.
The report may only be made available in full, including all disclaimers and notices, and is not to be
resold. Written permission is required prior to the release of any excerpts from the report.


![DMCA and the First Amendment - zoo.cs.yale.edu · • Getting harder to ignore success Market Share for Top [Web] Servers Across Domains Source: Netcraft Survey April 2003; Slide](https://static.fdocuments.in/doc/165x107/5f1b0bf8a29a5b75f53d5df4/dmca-and-the-first-amendment-zoocsyaleedu-a-getting-harder-to-ignore-success.jpg)

