© 2003-2004 COOP Systems, Inc. and 2001-2004 PreEmpt, Inc. 1 COOP Introduction Chris Alvord, CBCP.

Branch Out
Annual Report 2004

NetBank has diversifi ed into much more than a bank without branches. Our innovative fi nancial services attract customers who are different — high achievers who continually challenge the status quo. Like NetBank, they stand out from the crowd.
TABLE OF CONTENTS
1_Letter 6_Branch Out 14_At-A-Glance 15_Financial Highlights and Shareholder Information
16_Board of Directors and Corporate Offi cers Inside Back Cover_Corporate Information
On the cover:
StephanieCustomer Since 2001

NetBank, Inc._AR04 1
DEAR SHAREHOLDER:
The results of our efforts to branch out are paying off. The online bank had a superb year, and our transaction
processing business made solid contributions. Non-conforming mortgage production was also above trajectory.
In short, we took a number of steps toward our long-term goal of diversifying the company’s income across our
three primary operating segments.
I mention these highlights up front because NetBank’s 2004 fi nancial metrics partially mask this progress. Our
2004 earnings were not as strong as 2003’s. They refl ect a conforming mortgage market where volumes and
margins declined signifi cantly. Remember, record conforming mortgage production fueled extra ordinary perfor-
mance for us and others in 2003. Our 2004 results were also impacted by the continuing Commercial Money
Center (CMC) litigation and our decision to book an additional loss provision of $29 million, pre-tax, related to
the CMC lease receivables. This charge affected after-tax earnings by $.38 per share.
At NetBank, we continue to branch out — taking advantage of opportunities to balance our business and serve customers who want things done their way, not the same old way.
Douglas K. Freeman_Chairman and
Chief Executive Offi cer
2 NetBank, Inc._AR04
For the year, NetBank posted earnings of $4.2 million or $.09 per share, compared to a record $50.5 million or
$1.04 per share in 2003. Return on assets and return on equity were .09 percent and .98 percent respectively.
Exclusive of the $29.0 million CMC loss provision, return on assets and return on equity were .46 percent and
5.15 percent respectively.
Despite the earnings pressure, NetBank continued to create value for shareholders. We paid quarterly dividends
of $.02 per share and repurchased 1.5 million shares at a weighted average cost of $11.28. In addition, we closed
on several strategic acquisitions. We executed on our plan to grow our retail conforming mortgage presence as
a way to reduce dependency on originations from third-party sources. For example, Market Street Mortgage,
our retail conforming franchise, acquired 19 branches from Guaranty Residential Lending. These branches origi-
nated more than $600 million in loans during 2004, and we expect them to contribute signifi cantly to Market
Street’s production in 2005.
Acquiring the principal operating assets of Beacon Credit Services also fi t with our goal of diversifying NetBank’s
loan products. Beacon provides fi nancing for recreational vehicles (RVs), boats and aircraft. The company origi-
nated $339 million in loans during 2003 and $116 million in loans during the second half of 2004 as part of
NetBank. We have worked with Beacon’s management team in the past, and we welcome their expertise in continu-
ing to oversee this business. This is the type of acquisition we will continue to pursue in the future — one that fi ts
with our vision and is accompanied by a strong management team.
SEGMENT PERFORMANCE: GROWTH AND CHALLENGES
Our online bank’s core performance in 2004 was simply stellar. Exclusive of the $29.0 million CMC provision,
pre-tax income rose to $17.9 million, compared with a loss of $61.0 million last year. This turnaround is no accident.
Careful planning and disciplined execution over the past two years have allowed us to put our banking segment
on solid fi nancial footing. We remain confi dent that this segment will continue to show steady improvement
going forward. In 2004, we actually surpassed or neared several metrics we identifi ed as crucial to our long-term
success. For example, our strategic vision depends on the banking segment achieving a risk-adjusted net interest
margin of 177 basis points. During the third quarter, the segment posted a margin of 191 basis points — showing
that our goals are reasonable and reachable.
Bank deposits totaled $2.6 billion, representing an increase of 4 percent from 2003. Small business deposits
more than doubled, rising to $55.1 million from $26.6 million a year earlier. On the deposit front, a less visible
success is the marked improvement in the underlying quality of our deposit relationships. Throughout 2004,
we moved toward a tiered deposit pricing strategy in which we extended our best rates to customers who
maintain multiple NetBank products and services. This shift enabled us to strengthen our relationship with
transactional-based customers who tend to remain with NetBank longer than non-transactional customers.

NetBank, Inc._AR04 3
The transaction processing segment also had measurable progress. Pre-tax income grew to $2.3 million versus
last year’s $4.0 million loss. NetBank Payment Systems, our ATM and merchant processing business, was the
stand-out performer, posting impressive growth with pre-tax income of $2.0 in 2004 — its fi rst full year of oper-
ation as part of NetBank. Its performance was enhanced by the purchase of several small ATM and payment
service providers. These deals enabled us to double the size of NetBank Payment Systems’ business within the
year. At year-end, NetBank Payment Systems operated 8,327 ATMs and 2,586 merchant service terminals com-
pared to 4,316 ATMs and 178 terminals in 2003. Our ATM network is now the country’s second-largest
bank-operated network.
As expected, our fi nancial intermediary segment came under signifi cant earnings pressure during the year
as mortgage volumes and margins declined from 2003’s record highs. Pre-tax income totaled $23.2 million, a
decrease of 84 percent compared to 2003. Overall loan production totaled $13.6 billion with a pre-tax margin
of 12 basis points, decreases of 28 percent and 87 percent respectively. The earnings decline was centered in
the conforming channel. Although conforming production held up better than we anticipated, pre-tax margins
were signifi cantly off. Production was down 36 percent, while pre-tax margins declined by 95 percent.
Non-conforming profi tability remained relatively constant. Margins within this channel also experienced pres-
sure and declined by 58 percent from 2003. However, the non-conforming operation overcame an earnings
shortfall through volume — its production grew by 35 percent year over year. Going forward, we expect non-
conforming margins to widen sooner than conforming margins. This should allow our non-conforming operation
to improve on its 2004 performance.
It’s worth noting that the increase in non-conforming production represents measurable progress toward our
goal of achieving non-conforming production of $333 million per month. During 2004, non-conforming produc-
tion averaged $249 million per month, compared to $185 million per month in 2003.
VALUE: WHAT CUSTOMERS WANT
For consumers, small business owners and institutions that use NetBank’s transaction processing services, our
goal is to offer the most needed products and services in the most convenient and versatile setting. To deliver
these effectively, we implemented a new online platform and opened a state-of-the-art payment processing
center that positioned NetBank to take immediate advantage of legislation authorizing the use of electronic
check images. The new processing center also made it possible for NetBank to develop QuickPostSM, a service
that allows customers to drop off deposits and payments at approximately 3,800 locations of The UPS Store®
for overnight delivery and next-day processing. We plan to market QuickPost to other fi nancial institutions in
the near future.
Our new deposit and payment processing center takes advantage of the latest technology. We are positioned to provide customers with industry-leading access to funds.

4 NetBank, Inc._AR04
We also made good on our promise to focus on building long-term, mutually benefi cial relationships with
customers. Through our new NetConnect offering, customers who maintain multiple products and services can
earn a higher money market rate than the standard, published rate. We also provide customers with an inno-
vative fi nancial planning program that enables them to execute against their personal fi nancial objectives.
Along with our new products and services, NetBank continues to maintain its low-fee positioning, industry-
leading deposit rates and free access to more than 8,300 ATMs across the nation. These accomplishments
demonstrate our ongoing efforts to create value and attract more customers who appreciate the benefi ts
of fi nancial services offered on their terms.
BALANCING OUR BUSINESSES: STILL A STRATEGIC PRIORITY
Looking ahead, we expect muted profi tability from our conforming mortgage channel throughout 2005, as
overall origination volumes and margins return to more sustainable levels and the industry adjusts accordingly.
However, other areas should provide increasing offset. Within the fi nancial intermediary segment, we anticipate
greater contributions from our non-conforming and RV/boat lending operations. Plus, our banking and transac-
tion processing segments are on track to generate a higher percentage of our earnings than ever before.
Our game plan of balancing the company’s income across the three business segments is clearly working. We
intend to stick to it and look for ways to implement it more rapidly whenever possible. I want to reiterate that
we are managing this company for the long term, headed toward a pre-tax income goal of $45 million per seg-
ment in a normal business environment. When we achieve this goal, we believe investors will value NetBank at
a premium, given the improved quality of our earnings profi le and our ability to deliver on our word.
To get there, we will continue to rely on the expert guidance of our Board of Directors and management team.
I want to thank them for supporting our vision with counsel and much hard work. I also want to thank our share-
holders for their commitment to NetBank over the long haul. Finally, I want to recognize my more than 2,300
NetBank colleagues, who have worked tirelessly to transform this company. Through their ongoing efforts, we
continue to branch out into new and exciting opportunities that benefi t all of our stakeholders.
Douglas K. Freeman
Chairman and Chief Executive Offi cer
March 2005

NetBank, Inc._AR04 5
At NetBank, we believe new ways of operating are essential to grow our businesses. By branching out in thought and action, we are deepening customer relationships and building a stronger company.

6 NetBank, Inc._AR04
Loves online bill pay
Two employees
Married, father of two
Avid tennis player, wicked backhand
Manoj_Computer Programming Consultant
“ NetBank’s online bill pay for small
businesses makes paying my payroll
taxes much more convenient — I
don’t have time to go to a branch.”
Founder and owner of Hybrid Solutions,
a seven-year-old technology consulting
business based in Atlanta, Georgia, Manoj
has used NetBank for his personal banking
needs since 1999. He moved his small
business accounts to NetBank in 2003.

NetBank, Inc._AR04 7
Expanded Financial Services _Our Expanded Financial ServicesBenefi t Small Businesses and Individuals
Small business banking services are a huge success story for NetBank. Having launched the
program in mid-2003, we fi nished 2004 with more than 2,000 customers and $55.1 million in
deposits. Through research, we discovered that 79 percent of small business owners view the
Internet as important to their business. This fi nding verifi es our belief that the convenience,
effi ciency and personalization we offer are valuable to them.
Accordingly, we continued to expand our small business product offerings. During 2004, we
introduced Internet payroll services and business credit cards. NetBank XpressPayroll allows
employers of up to 10 individuals to process their payrolls with a few mouse clicks, printing
checks and reports onsite within two hours of payroll processing. NetBank PowerPayroll for
companies with up to 150 employees enables online payroll processing as well as nationwide
tax fi ling and other services. Our business credit card features a credit line of up to $100,000,
individual credit limits for employees, employee misuse protection, and an optional reward points
program. In addition, we offered a small business version of our NetConnect bundled product
suite that allows customers who use multiple products or services to earn a higher yield on their
money market account.
We also expanded fi nancial services for individuals in 2004. Our auto loan products are now
being offered directly through NetBank instead of a third-party provider. The change allows
NetBank to retain the asset and better control the loan experience for customers. Our acquisition
of Beacon Credit Services’ assets allows NetBank to further diversify our lending business with
RV, boat and aircraft fi nancing. We expect that NetBank customers will continue to benefi t from
these and other ways we are branching out.

8 NetBank, Inc._AR04
Customer-focused
30-year banking veteran
Quick to laugh
Enjoys horseback riding
Lynette_Managing Director of Product Management, NetBank
“ We developed NetConnect with the
goals of retaining existing customer
relationships and attracting new
customers.”
With 30 years of diverse banking
experience, Lynette is involved in
developing new products for NetBank
and enhancing existing ones. Her job
involves understanding customer needs
and the ways to meet those needs.

NetBank, Inc._AR04 9
Rewarding Our Customers _Rewarding Our Customers Is a Win for Everyone
NetBank is taking customer relationship management to the next level by rewarding customers
who use multiple products and services. In a new cross-selling initiative, we introduced NetConnect
during the last quarter of 2004. NetConnect offers tiered money market rates for customers who
have more than one account. For example, our standard money market rate, which is typically three
times the national average, is boosted even higher if a customer has a checking account linked to
their money market along with a Visa® check card or a loan. Those who take advantage of all of
these products receive our highest annual percentage yield on their money market account —
nearly fi ve times higher than the national average.
NetConnect is only one of the ways we encourage customers to expand their relationship with
us and reward those who view NetBank as their primary bank. We have started to incorporate
this principle into our CD pricing. We empowered our associates to offer an additional 30 basis
points on a CD renewal to customers with multiple products whenever they call in to discuss a CD
that is about to mature. The results have been impressive. More than 40 percent of the customers
who received this offer elected to renew.
We provide a version of NetConnect to small business customers, and we expect to extend our
relationship pricing strategy to lending products soon. At NetBank, we believe the best way to
branch out with our products is to give customers the best value for their dollar and the highest
level of service. By meeting customers’ needs, we aim to create solid, long-term relationships.

10 NetBank, Inc._AR04
Advanced Technological Systems _Our Advanced Technological Systems Deliver Competitive Advantages
Strategic planning coupled with technical innovation has enabled NetBank to implement industry-
leading systems to process deposits and other payments. Opened in 2004, our payment processing
center was designed to make the greatest possible use of electronic check imaging technology.
We built it with Check 21 legislation in mind. Check 21, which became law in 2004, facilitates check
clearing by allowing electronic check images to be exchanged in substitution of the original paper
check. The new law is intended to reduce the costs and delay of paper processing.
Our payment processing center’s advanced software converts the majority of checks received
into electronic images. These images are then presented for payment to the originating institution.
The center is also highly scalable. Although it currently processes 250,000 to 300,000 items per
month, it has the capacity to handle 10 times that number in the future.
The Check 21 legislation and the capabilities of our payment processing center led to another
NetBank innovation — QuickPostSM. QuickPost is a service designed to dramatically reduce the time
from check drop-off to availability of funds. Through our agreement with UPS, a customer can take
a deposit or mortgage payment to one of approximately 3,800 The UPS Store® locations for free
overnight shipment to our payment processing center. Customers receive an e-mail acknowledgment
when the deposit is received the following business day. This service provides customers greater
convenience, security and quicker access to funds.
Initially piloted in Atlanta, Chicago, New York, Oakland and San Francisco, QuickPost is now available
to all NetBank customers. We also plan to market the QuickPost concept to other fi nancial institu-
tions that have limited physical presence, such as insurance companies, brokerages and credit
unions. QuickPost represents one more way NetBank is branching out with innovative services.

NetBank, Inc._AR04 11
Has drama-major daughter
Genuinely helpful
Always smiling
Laura_Associate, The UPS Store®
“ People seem to have incorporated
QuickPost into their normal routine,
along with other errands. They tell
me it’s a great convenience.”
Laura works at one of The UPS Store®
locations in Atlanta that participated
in the initial QuickPost pilot program.
She has seen the number of NetBank
customers using the service increase
steadily since it was introduced.

12 NetBank, Inc._AR04
Balancing Our Businesses_Balancing Our BusinessesCreates Greater Earnings Potential
For NetBank shareholders, balancing the company’s business segments is the key to long-term
earnings growth. Our goal is for each segment to contribute $45 million in a normal business
environment. As we branch out into new opportunities, we believe this goal is achievable within
four to seven years.
The online bank is well on its way. With a more disciplined investment approach and the ability to
hold diverse, high-quality assets that we originate ourselves, we are strategically growing the size
of the bank’s balance sheet to $6 billion. This incremental increase of approximately $2 billion in
assets and liabilities over time will improve the bank’s profi tability and provide better leverage over
the bank’s cost structure. And, by containing costs, we can continue to preserve our value proposi-
tion for customers. The banking segment’s pre-tax income for 2004 totaled $17.9 million, exclusive
of the $29.0 million CMC-related provision expense.
We are also making great strides in the fi nancial intermediary segment. This segment is generally
at scale in terms of our strategic plan. The work we need to do involves balancing the segment’s
earnings profi le. Historically, we have relied on our third-party conforming mortgage operations
for the bulk of earnings. However, production in this channel is highly cyclical. We have begun to
reduce our dependency on it by expanding our retail and non-conforming operations, which tend
to be less volatile. In 2004, the fi nancial intermediary segment generated pre-tax income of
$23.2 million. Approximately half of these earnings came from the non-conforming operation.
Still in its infancy, our transaction processing business is poised for solid growth. Its two largest
components — our mortgage servicing operation and NetBank Payment Systems — are making
steady progress toward their goals. Combined, these businesses are expected to contribute nearly
half of the $45 million pre-tax income goal. The remaining half will come through start-up initia-
tives or new acquisitions. Breaking into the black during 2004, the transaction processing segment
contributed pre-tax income of $2.3 million.
Shareholders who take a long-term view of their NetBank investment have the potential for greater
returns from a company that is taking the initiative to branch out.
NetBank, Inc._AR04 13
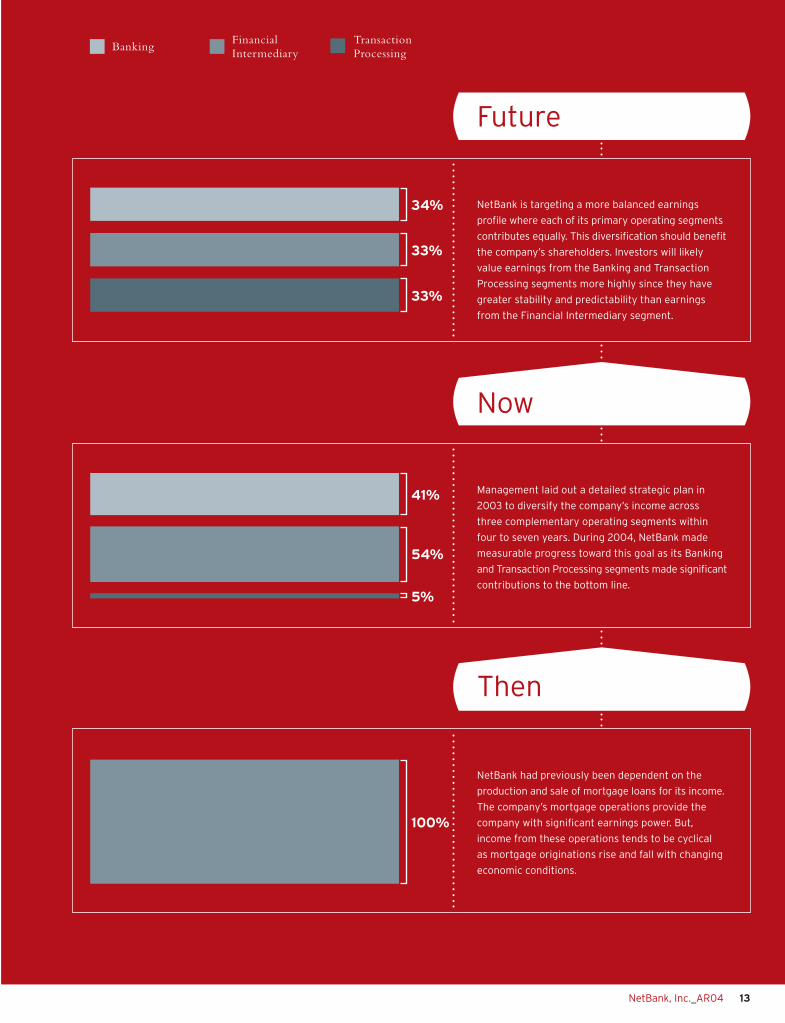
NetBank is targeting a more balanced earnings
profi le where each of its primary operating segments
contributes equally. This diversifi cation should benefi t
the company’s shareholders. Investors will likely
value earnings from the Banking and Transaction
Processing segments more highly since they have
greater stability and predictability than earnings
from the Financial Intermediary segment.
Management laid out a detailed strategic plan in
2003 to diversify the company’s income across
three complementary operating segments within
four to seven years. During 2004, NetBank made
measurable progress toward this goal as its Banking
and Transaction Processing segments made signifi cant
contributions to the bottom line.
NetBank had previously been dependent on the
production and sale of mortgage loans for its income.
The company’s mortgage operations provide the
company with signifi cant earnings power. But,
income from these operations tends to be cyclical
as mortgage originations rise and fall with changing
economic conditions.
5%
41%
54%
100%
34%
33%
33%
Future
Now
Then
BankingFinancialIntermediary
TransactionProcessing
14 NetBank, Inc._AR04
• Individual consumers
• Small business owners
• Affi nity marketing partners
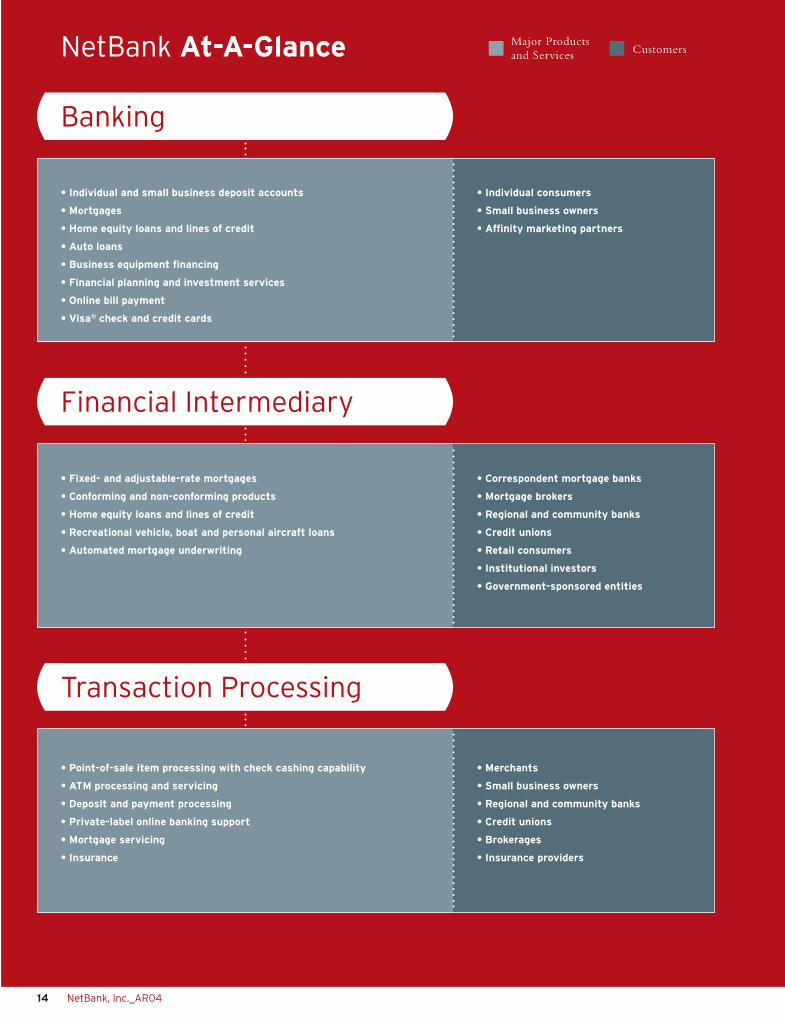
NetBank At-A-Glance Major Productsand Services Customers
• Individual and small business deposit accounts
• Mortgages
• Home equity loans and lines of credit
• Auto loans
• Business equipment fi nancing
• Financial planning and investment services
• Online bill payment
• Visa® check and credit cards
• Correspondent mortgage banks
• Mortgage brokers
• Regional and community banks
• Credit unions
• Retail consumers
• Institutional investors
• Government-sponsored entities
• Fixed- and adjustable-rate mortgages
• Conforming and non-conforming products
• Home equity loans and lines of credit
• Recreational vehicle, boat and personal aircraft loans
• Automated mortgage underwriting
• Merchants
• Small business owners
• Regional and community banks
• Credit unions
• Brokerages
• Insurance providers
• Point-of-sale item processing with check cashing capability
• ATM processing and servicing
• Deposit and payment processing
• Private-label online banking support
• Mortgage servicing
• Insurance
Banking
Financial Intermediary
Transaction Processing
NetBank, Inc._AR04 15
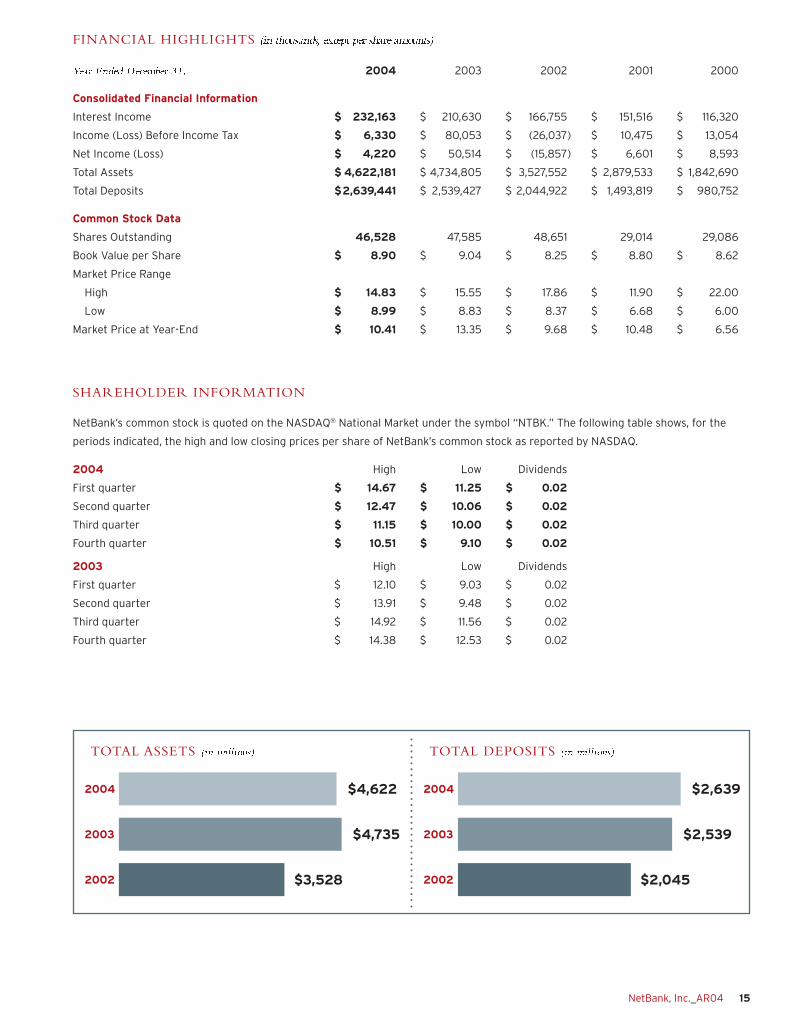
FINANCIAL HIGHLIGHTS �������������� ������������������������������������������ 2004 2003 2002 2001 2000
Consolidated Financial Information
Interest Income $ 232,163 $ 210,630 $ 166,755 $ 151,516 $ 116,320
Income (Loss) Before Income Tax $ 6,330 $ 80,053 $ (26,037) $ 10,475 $ 13,054
Net Income (Loss) $ 4,220 $ 50,514 $ (15,857) $ 6,601 $ 8,593
Total Assets $ 4,622,181 $ 4,734,805 $ 3,527,552 $ 2,879,533 $ 1,842,690
Total Deposits $ 2,639,441 $ 2,539,427 $ 2,044,922 $ 1,493,819 $ 980,752
Common Stock Data
Shares Outstanding 46,528 47,585 48,651 29,014 29,086
Book Value per Share $ 8.90 $ 9.04 $ 8.25 $ 8.80 $ 8.62
Market Price Range
High $ 14.83 $ 15.55 $ 17.86 $ 11.90 $ 22.00
Low $ 8.99 $ 8.83 $ 8.37 $ 6.68 $ 6.00
Market Price at Year-End $ 10.41 $ 13.35 $ 9.68 $ 10.48 $ 6.56
SHAREHOLDER INFORMATION
NetBank’s common stock is quoted on the NASDAQ® National Market under the symbol “NTBK.” The following table shows, for the
periods indicated, the high and low closing prices per share of NetBank’s common stock as reported by NASDAQ.
2004 High Low Dividends
First quarter $ 14.67 $ 11.25 $ 0.02
Second quarter $ 12.47 $ 10.06 $ 0.02
Third quarter $ 11.15 $ 10.00 $ 0.02
Fourth quarter $ 10.51 $ 9.10 $ 0.02
2003 High Low Dividends
First quarter $ 12.10 $ 9.03 $ 0.02
Second quarter $ 13.91 $ 9.48 $ 0.02
Third quarter $ 14.92 $ 11.56 $ 0.02
Fourth quarter $ 14.38 $ 12.53 $ 0.02
TransactionProcessing TOTAL ASSETS �������������
$3,528
$4,735
$4,6222004
2003
2002
BankingTransactionProcessing TOTAL DEPOSITS �������������
$2,045
$2,539
$2,6392004
2003
2002

16 NetBank, Inc._AR04
Tamara L. Adler Managing Director, Principal InvestmentsJP Morgan ChaseNew York, N.Y.
Douglas K. Freeman, Chairman Chief Executive Offi cerNetBank, Inc. Alpharetta, Ga.
J. Stephen Heard PresidentHeard Systems, Inc.Roswell, Ga.
Joel A. Smith, III Dean, The Moore School of BusinessUniversity of South CarolinaColumbia, S.C.
T. Stephen Johnson, Chairman Emeritus ChairmanT. Stephen Johnson & AssociatesAlpharetta, Ga.
Eula L. Adams VP, Global ServicesStorageTekLouisville, Colo.
Thomas H. Muller, Jr. PresidentMuller & AssociatesNorcross, Ga.
Catherine A. Ghiglieri PresidentGhiglieri & CompanyAustin, Texas
Stuart M. Cable PartnerGoodwin Procter, LLPBoston, Mass.
David W. Johnson, Jr. Retired PresidentResource Bancshares Mortgage Group, Inc.Columbia, S.C.
Robin C. Kelton ChairmanKelton International LimitedLondon, England
�����������������(listed clockwise from top left)
R. Theodore BrauchChief Risk Executive
Russell L. BurdsallChief Sales & Customer Fulfi llment Executive
Douglas K. FreemanChairman and Chief Executive Offi cer
Dwight GallowayPresident, NetBank Business Finance
Steven F. HerbertChief Finance Executive
A.H. Hethcox, Jr.Managing Director, Mortgage Loan Administration
Randall C. JohnsonPresident, Market Street MortgageCorporation
Virginia K. JohnstonManaging Director, Performance Support and Bank Operations
Thomas J. Little, Jr.Chief Human Resources Executive
Charles E. MapsonChief Legal Executive
Jerald W. McCoyChief Capital Markets Executiveand Chief Marketing & Customer Segmentation Executive
William M. RossChief Transaction Processing Executive
����������������(listed alphabetically)

UNITED STATES SECURITIES AND EXCHANGE COMMISSION
Washington, D.C. 20549
FORM 10-K (Mark One)
⌧ Annual report pursuant to Section 13 or 15(d) of the Securities Exchange Act of 1934
For fiscal year ended December 31, 2004
or
� Transition report under Section 13 or 15(d) of the Securities Exchange Act of 1934
For the transition period from to
Commission file number 0-22361
NetBank, Inc. (Exact Name of Registrant as Specified in Its Charter)
Georgia 58-2224352(State of incorporation) (IRS Employer Identification No.)
11475 Great Oaks WayAlpharetta, Georgia 30022
(Address of principal executive offices) (zip code)
(770) 343-6006(Registrant’s telephone number, including area code)
Securities registered pursuant to Section 12(b) of the Act: None.
Securities registered pursuant to Section 12(g) of the Act:
Common Stock, $.01 par value Preferred Share Purchase Rights
(Title of Class) Indicate by check mark whether the registrant: (1) has filed all reports required to be filed by
Section 13 or 15(d) of the Exchange Act during the preceding 12 months (or for such shorter period that the registrant was required to file such reports), and (2) has been subject to such filing requirements for past 90 days. Yes ⌧ No �
Indicate by check mark if disclosure of delinquent filers pursuant to Item 405 of Regulation S-K is not contained herein, and will not be contained, to the best of registrant’s knowledge, in definitive proxy or information statements incorporated by reference in Part III of this Form 10-K or any amendment to this Form 10-K. Yes ⌧ No �
Indicate by check mark whether the registrant is an accelerated filer (as defined in Exchange Act Rule 12b-2): Yes ⌧ No �
Aggregate market value of the voting and non-voting common equity held by non-affiliates of theRegistrant, computed by reference to the closing price of $10.93 of such common equity as of June 30, 2004: $470,855,853.
Number of shares outstanding of each of the issuer’s classes of common equity, as of the latest practicable date: 46,322,131 shares of Common Stock at March 7, 2005.

2
DOCUMENTS INCORPORATED BY REFERENCE
Portions of the Registrant’s Proxy Statement for the Annual Meeting of Shareholders, scheduled to be held on April 28, 2005 are incorporated by reference into Part III.
TABLE OF CONTENTS OF INFORMATION REQUIRED IN REPORT
Part I Item 1. Business . . . . . . . . . . . . . . . . . . . . . . . . . . . . . . . . . . . . . . . . . . . . . . . . . . . . . . . . . . . . . . . . . . . . 3Item 2. Property . . . . . . . . . . . . . . . . . . . . . . . . . . . . . . . . . . . . . . . . . . . . . . . . . . . . . . . . . . . . . . . . . . . . 37Item 3. Legal Proceedings . . . . . . . . . . . . . . . . . . . . . . . . . . . . . . . . . . . . . . . . . . . . . . . . . . . . . . . . . . . . 37Item 4. Submission of matters to a vote of security holders . . . . . . . . . . . . . . . . . . . . . . . . . . . . . . . 40
Part II Item 5. Market for registrant’s common equity, related shareholder matters and issuer
purchases of equity securities . . . . . . . . . . . . . . . . . . . . . . . . . . . . . . . . . . . . . . . . . . . . . . . . 40Item 6 Selected financial data . . . . . . . . . . . . . . . . . . . . . . . . . . . . . . . . . . . . . . . . . . . . . . . . . . . . . . . . 42Item 7. Management’s discussion and analysis of financial condition and results of operation . 43Item 7A. Quantitative and qualitative disclosures about market risk . . . . . . . . . . . . . . . . . . . . . . . . . 71Item 8. Financial statements and supplementary data . . . . . . . . . . . . . . . . . . . . . . . . . . . . . . . . . . . . 73Item 9. Changes in and disagreements with accountants on accounting and financial
disclosure . . . . . . . . . . . . . . . . . . . . . . . . . . . . . . . . . . . . . . . . . . . . . . . . . . . . . . . . . . . . . . . . . 120Item 9A. Controls and procedures . . . . . . . . . . . . . . . . . . . . . . . . . . . . . . . . . . . . . . . . . . . . . . . . . . . . . . 120Item 9B. Other information. . . . . . . . . . . . . . . . . . . . . . . . . . . . . . . . . . . . . . . . . . . . . . . . . . . . . . . . . . . . 122
Part III Item 10. Directors and executive officers of the registrant . . . . . . . . . . . . . . . . . . . . . . . . . . . . . . . . . 123Item 11. Executive compensation. . . . . . . . . . . . . . . . . . . . . . . . . . . . . . . . . . . . . . . . . . . . . . . . . . . . . . . 123Item 12. Security ownership of certain beneficial owners and management . . . . . . . . . . . . . . . . . . 123Item 13. Certain relationships and related transactions. . . . . . . . . . . . . . . . . . . . . . . . . . . . . . . . . . . . 123Item 14. Principal accountant fees and services. . . . . . . . . . . . . . . . . . . . . . . . . . . . . . . . . . . . . . . . . . . 123
Part IV Item 15. Exhibits and financial statement schedules. . . . . . . . . . . . . . . . . . . . . . . . . . . . . . . . . . . . . . . 123
Signatures . . . . . . . . . . . . . . . . . . . . . . . . . . . . . . . . . . . . . . . . . . . . . . . . . . . . . . . . . . . . . . . . . . . . . . . . . . . . . . 124

3
PART I
ITEM 1. BUSINESS
General
NetBank, Inc. is a financial holding company engaged primarily in retail banking, mortgage banking, business finance and providing ATM and merchant processing services. NetBank, Inc. wholly owns the outstanding stock of NetBank (“NetBank, FSB” or “the Bank”), a federal savings bank; MG ReinsuranceCompany (“MG Reinsurance”), a captive reinsurance company; NetInsurance, Inc. (“NetInsurance”), a licensed insurance agency; and NB Partners, Inc., a corporation involved in strategic partnering opportunities. NB Partners, Inc. owns all of the outstanding stock of Financial Technologies, Inc., acorporation formed in 2004 to market transaction processing services to other financial services companies.NetBank, FSB owns all of the outstanding stock of Market Street Mortgage Corporation (“Market Street”), a retail mortgage company, NetBank Payment Systems, Inc. (“NPS”), a provider of ATM and merchant processing services for retail and other non-bank businesses and Meritage MortgageCorporation (“Meritage”), a wholesale non-conforming mortgage provider. The consolidated company is referred to herein as “we,” “our,” “NetBank,” or “the Company”.
During the third quarter of 2004, Resource Bancshares Mortgage Group, Inc. (“Resource”) and Republic Leasing Company, Inc., both of which had been subsidiaries of NetBank, FSB, were legally consolidated into NetBank, FSB and ceased to exist as separate corporations. Republic Leasing Company, Inc. now operates as the NetBank Business Finance division of NetBank, FSB. In addition, during the fourth quarter of 2004, RBMG, Inc., formerly a subsidiary of NetBank, FSB, was legally consolidated into NetBank, FSB and ceased to exist as a separate corporation. RBMG, Inc. now operates as the NetBank Funding division of NetBank, FSB.
NetBank was founded in October 1996 and completed its initial public offering of stock in July 1997. It is one of the pioneers of the Internet banking industry, and NetBank, FSB is recognized as one of the first successful internet-only banks. For further information and a description of the growth of the Company through recent acquisitions see note 2 of the notes to the consolidated financial statementsincluded in this report.
All dollar figures are presented in thousands (000s), except per share data, unless otherwise noted.Net income per share is presented on a diluted basis. All of the Company’s operations and assets are located within the United States.
NetBank’s business model has three basic strategies:
Retail Banking—NetBank, FSB, through its Internet banking operations, operates as an FDIC-insured, federally chartered thrift institution that currently serves approximately 160,000 customersthroughout the United States and in more than 80 foreign countries. NetBank, FSB delivers its products and services through remote delivery channels, such as the Internet, telephone and ATMs. It does not maintain a branch network to support its banking business. This branchless model provides it with anopportunity to operate with less overhead expense than traditional branch banks. Passing along part of thiscost savings to customers through higher deposit rates and better technology has been the cornerstone of our value proposition. NetBank, FSB offers a full line of deposit and loan products, including checking andsavings accounts, a small business banking program, online bill payment, auto loans, mortgages and financial planning services. Customers also enjoy continuous access to customer support—24 hours a day, seven days a week.
Financial Intermediary—Through the Company’s various loan operations, it serves as an intermediary between consumers and institutional investors. The bulk of the Company’s business in this segment relates to mortgage lending, including both conforming and non-conforming products. We obtain mortgage loans

4
by originating loans directly with consumers or through a nationwide network of brokers. We also buyclosed loans from a network of correspondent banks, thrifts and independent mortgage companies. The majority of the loans are held for sale on the Company’s balance sheet prior to sale into the secondary market. The Company thus earns a long-term yield on an asset held short-term. We also earn originationfees and the opportunity for gains on the sale of the mortgages or resulting mortgage-backed securities. The Company recently diversified, through acquisition, its operations to include the origination of loans for recreational vehicles (RVs), boats and personal aircraft. The Company has not retained any of these loans, which have been sold to investors in the capital markets under the same intermediary strategy the Company employs in its mortgage businesses.
Transaction Processing—NetBank provides a variety of financial-related processing services to merchants, community banks and other organizations. The Company entered into these lines of businessinitially by leveraging core competencies from its other operating segments. These competencies were packaged and re-sold to other banks. NetBank has also been an active acquirer of small, profitableprocessing businesses that complement our overall business strategy. In late 2003, the Company acquired an ATM and merchant transaction processing operation. During 2004 we grew this operation through acquisition and internal growth, and we intend to continue this strategy in the future. This business now operates approximately 8,000 ATMs across the country, which the Company has made available to its banking customers on a surcharge-free basis. This network of ATMs currently ranks as the second largestbank-operated ATM network in the country.
Segmented Revenue Information
The tables in note 18 of the notes to the consolidated financial statements included in this report present a summary of the revenues and expenses for each of the Company’s business segments for each of the years ended December 31, 2004, 2003, and 2002, respectively. The following represents the percentage and amount of total Company revenues contributed by the Company’s business segments for the years ended December 31, 2004, 2003, and 2002:
2004 2003 2002Amount Percentage Amount Percentage Amount Percentage
Retail banking . . . . . . . . . $ 118,140 38% $ 110,512 25% $ 47,312 22 % Financial intermediary . . 180,147 58% 316,415 74% 163,224 75 % Transaction processing. . 31,907 10% 20,685 5% 6,616 3 % Other/eliminations . . . . . (18,074) (6)% (18,832) (4)% 828 0 % Total revenues . . . . . . . . . $ 312,120 100% $ 428,780 100% $ 217,980 100 %
Retail Banking Segment
The retail banking segment, through its Internet banking operations (“Internet Bank”), competes in a commoditized, highly competitive marketplace for personal and small business banking relationships. It offers a full line of deposit and loan products along with ancillary account services. It competes head-to-head with large national financial institutions, small community banks and credit unions, and, for certain product relationships, alternative providers, such as brokerages, insurance companies and credit card issuers. The retail banking segment also includes the operations of Dealer Financial Services (“DFS”), NetBank, FSB’s indirect auto lending division; and NetBank Business Finance, NetBank, FSB’s businessfinancing division.
Market Position
The Internet Bank operates a branchless business model. Its products and services are delivered through remote delivery channels, including the Internet, phone, ATM and overnight mail delivery. This
5
branchless model provides it with an opportunity to operate with lower overhead expense than traditional branch banks. Its value proposition has been based historically on sharing its operating cost savings withcustomers through higher deposit rates, fewer fees and better technology.
When the Internet Bank began operations in 1996, it was one of the early movers in online banking. Its value proposition and product line was differentiated in the marketplace since few direct competitors existed. Its products and services were designed to appeal to a highly targeted group of technology-savvyconsumers who seek both convenience and greater economic value.
Its typical customer fits the following profile:
• Late 30s to early 40s in age
• Married with children
• Two income household
• Homeowner
• College educated
The market for online banking has grown exponentially since it helped pioneer the marketplace, and we believe that online banking has reached critical mass today. According to a November 2004 study by the Pew Internet and American Life Project, approximately 50% of all U.S. Internet users now bank online—making it the fastest growing online activity the annual survey measures. Jupiter Research estimates that 35 million or approximately one-third of all U.S. households banked online at the end of 2004.
The Internet Bank has seen increased competition as consumer demand has grown. Over the pastseveral years, large national banks, such as Bank of America, Citibank and Wells Fargo, have deployed and aggressively promoted their own online banking platforms. These institutions were arguably motivated by the characteristics of the typical online banking customer. Independent market research continues to show that online banking customers tend to be more profitable than offline customers due to the simple fact that these customers are able to help themselves and conduct their transactions electronically without the assistance of a teller in a branch. In addition, online banking customers tend to have lower attrition rates than offline customers.
The increased competition from large national banks has affected the Internet Bank’s ability to differentiate itself in the marketplace. Previously, it was able to compete more effectively on convenience and price. Competitors have now closed the gap in terms of convenience since their online functionality rivals its. Despite increased competition, the Company still has an opportunity to differentiate its banking products and services in the marketplace. Management believes it can continue to compete effectively by combining its pricing advantages with focuses on 1) ease of use; 2) bundled product offerings; and 3) highly integrated technology. Its branding efforts and marketing campaigns will begin to reflect this refined positioning beginning in 2005.
Products & Services
The Company’s goal is to be a trusted, comprehensive financial services partner to its customers. Itmaintains a full line of financial products and services, from deposit and loan products to financial planning and investment services.
FDIC-insured products include:
• Individual and small business checking accounts
• Individual and small business money market accounts

6
• Individual and small business certificates of deposit
Additional products include:
• IRAs
• Mortgages
• Home equity loans and lines of credit
• Auto loans
• Boat and recreational vehicle loans
• Credit cards
• Overdraft protection
• Brokerage
• Financial planning
• Insurance
• Small business payroll services
• Business equipment leasing
• Foreign currency exchange
Ancillary services include:
• Online bill payment and presentment
• Online check imaging
• Online statements
• Online account funding
• ATM cards
• ATM deposit-gathering
• VISA® Check Card
• Wireless account access
• Account aggregation
• Consumer credit report monitoring
Many of the offerings listed above are provided on a proprietary basis. For non-core services, the Internet Bank partners with specialty providers to make them available to customers. For example, the Internet Bank works with CheckFree Corporation for online bill payment and presentment and withMBNA America Bank for credit card services.
The Internet Bank is able to extend its product and service offerings through these partnershipswithout the assumption of significant expense and operational risk, which might put its underlying value proposition at jeopardy. The partnerships also provide us with additional revenue opportunities. To mitigate some of the inherent reputation risk, it maintains service level agreements with substantially all of

7
its specialty service providers and monitors the solvency of such providers on a periodic basis as part of itsvendor management process.
Marketing Efforts
The Internet Bank presently attracts the majority of its new banking customers through highly targeted online advertising campaigns. It also relies on marketing alliances with other businesses to reach prospective customers.
The Internet Bank’s online advertising efforts tend to focus on key word searches in various search engines or high-traffic, financial-related sites. Campaigns on these sites are typically presented in banner advertisements that promote a specific product or service along with a cash incentive for first-time customers. Campaigns may also center on sponsorship of an area of the site or specific content.
The Internet Bank also has a sales force that pursues marketing alliances with other businesses. Its alliance partners agree to promote certain products and services to their customer bases in exchange for a fee on each successful lead they generate. These partnerships provide it with a highly cost-effective means of marketing to select, targeted groups of consumers. In turn, its partner is able to offer its customer value-added services while generating additional revenue.
Significant cross-selling opportunities also exist for the Internet Bank through the Company’s various lines of business. The Company’s mortgage and auto lending operations assist tens of thousands of customers each year. The Internet Bank actively promotes additional banking products and services through these channels whenever possible.
Security & Technology
The Company relies on state-of-the art technology and prevailing industry standards to ensure a safe, secure business environment. Data is encrypted and exchanged only over secure connections. The Internet Bank’s operating system does not connect directly to the Internet. It is isolated and protected by “firewalls” that comply with National Computer Security Association standards.
The Company uses a hybrid approach in acquiring technology to run its operations. Although it may develop proprietary applications for certain services, the Company typically partners with specialty technology providers and works to customize the partner’s existing solution to meet our needs. This outsourced approach is less capital intensive and allows us to take advantage of the partner’s larger infrastructure and operating scale. In addition, we are able to switch to another provider in the future if acompeting, more compelling technology emerges.
The Internet Bank’s top technology partners include, but are not limited to: BISYS; Corillian; CheckFree; and NCR. We mitigate our exposure to security risks by continually testing our systems. These tests include annual disaster recovery exercises by the Company and its key vendors.
Lending & Investment Activity
The retail banking segment’s primary investment strategy for its deposits is to fund the origination of assets that can be sold into the capital markets. It lends money on an intra-company basis to several lending units in the financial intermediary segment. These operations include NetBank Funding, Market Street and Beacon Credit Services. These businesses originate residential mortgages, recreational vehicle (RV), marine and aircraft loans. Their production is typically sold into forward commitments within the secondary market.
The Company believes this investment strategy has numerous advantages. Credit and interest rate risks are reduced because loans are typically sold into the capital markets within 30 to 90 days, thereby
8
limiting exposure to this period. Once the loans are sold, the proceeds can then be reinvested in new originations.
Additionally, the retail banking segment maintains a loan and investment portfolio separate from the funding lines for the lending operations. The retail banking segment chooses to retain loans made to its core customers. By retaining the loans or servicing rights, we can continue to own the relationship and ensure a more consistent, higher-quality customer experience. If the asset was sold to another provider, then we could not guarantee consistent service or prevent the other provider from cross-selling our customer its own products and services.
The retail banking segment also needs to invest excess liquidity that it cannot actively deploy throughits lending operations. Management believes that deposits are likely to grow more quickly over time thanthe lending operations’ need for additional funding. Plus, consumer demand affects production within these businesses. In a rising interest rate environment, the lending operations tend to experience lower production levels and, therefore, have reduced funding needs. During these times, the retail banking segment must shift liquidity into other investments to attempt to offset the corresponding drop in earnings from the lending businesses.
Servicing Asset
The Company maintains a sizeable portfolio of mortgage servicing rights (“MSRs”), primarily with respect to agency-eligible loans that were securitized and sold by the Company as described below. Thisservicing asset is a natural economic hedge against the Company’s mortgage origination operations, since MSRs tend to increase in value in a rising interest rate environment when origination volumes tend to decline and mortgage lending profitability comes under pressure.
To serve as a more effective hedge, the Company believes that the size of its servicing portfolio should approximate two-times peak or four-times trough of the Company’s annual mortgage production. This implies a general target range of $25 to $30 billion. The portfolio stood at $12.9 billion at year-end 2004.
While the Company services loans, it earns servicing revenue (usually stated as a percent of the outstanding principal balance). The Company earns late charges assessed to borrowers on payments not paid when contractually due. We also receive a float benefit from escrow accounts for taxes and insurance and for collections of principal and interest that have not yet been passed on to the investor. The retail banking segment pays the transaction processing segment an inter-segment subservicing fee for the servicing of the underlying loans.
As a servicer of mortgage loans underlying mortgage-backed securities, the Company is obligated to make timely payments of principal and interest to security holders, whether or not such payments have been made by mortgagors on the underlying mortgage loans. Similarly, in the event of foreclosure, the Company is responsible for covering with its own funds principal and foreclosure costs to the extent not covered by FHA insurance or a VA guarantee.
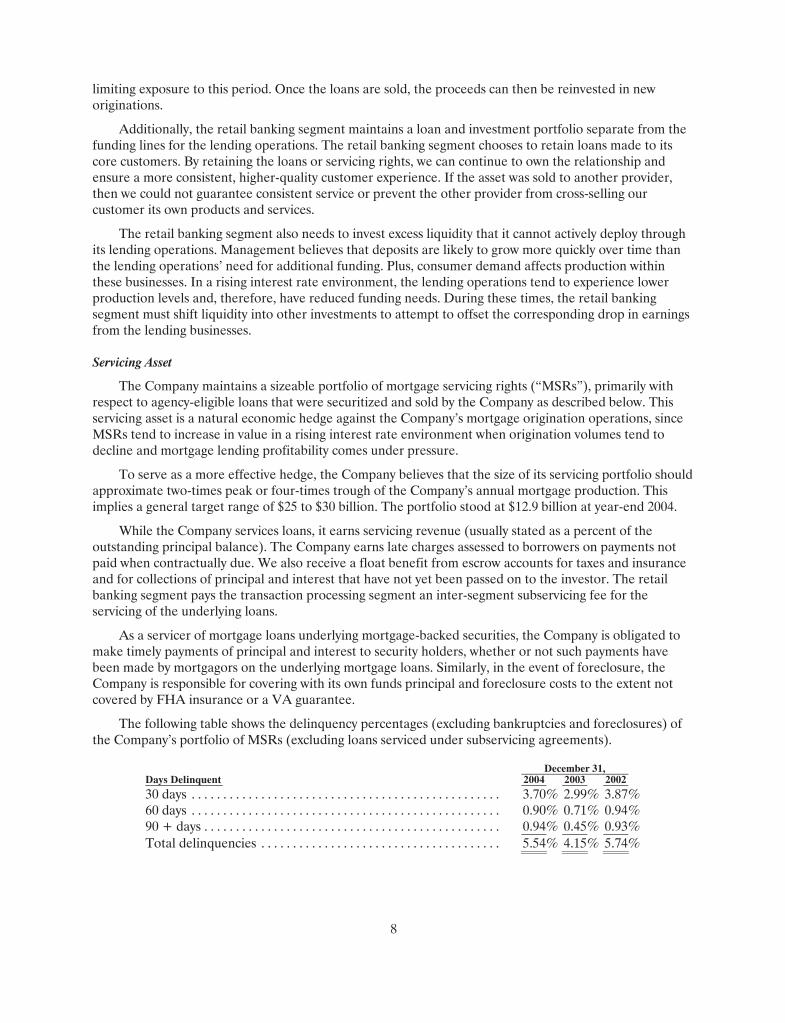
The following table shows the delinquency percentages (excluding bankruptcies and foreclosures) of the Company’s portfolio of MSRs (excluding loans serviced under subservicing agreements).
December 31, Days Delinquent 2004 2003 200230 days . . . . . . . . . . . . . . . . . . . . . . . . . . . . . . . . . . . . . . . . . . . . . . . . . 3.70% 2.99% 3.87%60 days . . . . . . . . . . . . . . . . . . . . . . . . . . . . . . . . . . . . . . . . . . . . . . . . . 0.90% 0.71% 0.94%90 + days . . . . . . . . . . . . . . . . . . . . . . . . . . . . . . . . . . . . . . . . . . . . . . . 0.94% 0.45% 0.93%Total delinquencies . . . . . . . . . . . . . . . . . . . . . . . . . . . . . . . . . . . . . . 5.54% 4.15% 5.74%

9
At December 31, 2004, the portfolio of MSRs had an underlying unpaid principal balance of $12.9 billion with book value of $173 million. The portfolio had a weighted average note rate of 5.96%. Asmore fully described in note 3 of the notes to the consolidated financial statements included in this report, the Company accounts for all mortgage servicing rights at the aggregate of the lower of cost or market. For purposes of managing risk, the Company segregates its owned portfolio of MSRs into two tranches: available for sale and held for sale. The available for sale portfolio contains those rights which we intend to hold as longer-term investments. The held for sale portfolio contains rights generated as a by-product of recent production which we intend to sell, generally within 120 days. The held for sale portfolio is generally not as susceptible to changes in interest rates and other market factors as the available for sale portfolio since the held for sale rights are generally allocated to a specific forward sales contract.
The following tables provide information regarding of the Company’s available for sale portfolio of MSRs at December 31, 2004:
Year of Origination Number of
Loans Percentage ofTotal Loans
Aggregate Unpaid
Principal
Percentage ofUnpaid
Principal 1994 or earlier . . . . . . . . . . . . . . . . . . . . . . . . . . 3,284 3.3% $ 124,755 1.0 %1995 . . . . . . . . . . . . . . . . . . . . . . . . . . . . . . . . . . . 292 0.3% 15,406 0.1 %1996 . . . . . . . . . . . . . . . . . . . . . . . . . . . . . . . . . . . 412 0.4% 30,620 0.2 %1997 . . . . . . . . . . . . . . . . . . . . . . . . . . . . . . . . . . . 1,245 1.3% 93,950 0.7 %1998 . . . . . . . . . . . . . . . . . . . . . . . . . . . . . . . . . . . 2,481 2.5% 202,427 1.6 %1999 . . . . . . . . . . . . . . . . . . . . . . . . . . . . . . . . . . . 1,444 1.5% 105,386 0.8 %2000 . . . . . . . . . . . . . . . . . . . . . . . . . . . . . . . . . . . 251 0.3% 18,520 0.2 %2001 . . . . . . . . . . . . . . . . . . . . . . . . . . . . . . . . . . . 1,182 1.2% 112,061 0.9 %2002 . . . . . . . . . . . . . . . . . . . . . . . . . . . . . . . . . . . 15,621 15.8% 1,895,156 14.9 %2003 . . . . . . . . . . . . . . . . . . . . . . . . . . . . . . . . . . . 53,664 54.4% 7,600,816 59.9 %2004 . . . . . . . . . . . . . . . . . . . . . . . . . . . . . . . . . . . 18,683 19.0% 2,500,838 19.7 %Total . . . . . . . . . . . . . . . . . . . . . . . . . . . . . . . . . . 98,559 100.0% $12,699,935 100.0 %
Loan TypeNumber of
Loans
Aggregate Unpaid
Principal
Weighted Average Coupon
WeightedAverage
Service FeeConventional fixed . . . . . . . . . . . . . . . . . . . . . . 89,504 $ 11,013,244 6.04% 0.323Conventional arms . . . . . . . . . . . . . . . . . . . . . . 3,926 620,733 4.87% 0.289FHA . . . . . . . . . . . . . . . . . . . . . . . . . . . . . . . . . . 2,028 224,937 5.95% 0.553VA. . . . . . . . . . . . . . . . . . . . . . . . . . . . . . . . . . . . 525 64,859 5.66% 0.449Jumbo . . . . . . . . . . . . . . . . . . . . . . . . . . . . . . . . . 2,455 770,253 5.56% 0.312Seconds. . . . . . . . . . . . . . . . . . . . . . . . . . . . . . . . 106 5,223 7.42% 0.407Other. . . . . . . . . . . . . . . . . . . . . . . . . . . . . . . . . . 15 686 8.07% 0.530Total . . . . . . . . . . . . . . . . . . . . . . . . . . . . . . . . . . 98,559 $12,699,935 5.95 % 0.325

10
Since the Company’s available for sale MSRs are held as longer-term investments, they are subject to interest rate (prepayment) risk. During periods of declining interest rates, prepayments of mortgage loans increase as homeowners seek to refinance at lower rates, resulting in a decrease in value of the related MSRs. Mortgage loans with higher interest rates are more likely to result in prepayments. The followingtable sets forth certain information regarding the aggregate unpaid principal balance of mortgage loans underlying the Company’s tranche of available for sale MSRs. The table includes both fixed and adjustable rate loans at December 31, 2004:
Mortgage Interest Rate Loans
Aggregate Unpaid
Principal
Percentage of Total Unpaid
Principal Less than 5.00% . . . . . . . . . . . . . . . . . . . . . . . . . . 7,253 $ 1,150,979 9.1%5.00% to 5.49%. . . . . . . . . . . . . . . . . . . . . . . . . . . 12,450 1,798,162 14.0%5.50% to 6.00%. . . . . . . . . . . . . . . . . . . . . . . . . . . 24,552 3,475,091 27.4%6.00% to 6.49%. . . . . . . . . . . . . . . . . . . . . . . . . . . 25,711 3,439,155 27.1%6.50% to 6.99%. . . . . . . . . . . . . . . . . . . . . . . . . . . 15,135 1,703,373 13.4%7.00% to 7.49%. . . . . . . . . . . . . . . . . . . . . . . . . . . 6,187 577,851 4.6%7.50% to 7.99%. . . . . . . . . . . . . . . . . . . . . . . . . . . 4,172 356,263 2.8%Greater than 8%. . . . . . . . . . . . . . . . . . . . . . . . . . 3,099 199,061 1.6%Total . . . . . . . . . . . . . . . . . . . . . . . . . . . . . . . . . . . . 98,559 $ 12,699,935 100.0%
The following table sets forth the geographic distribution of the aggregate unpaid principal balance of mortgage loans underlying the Company’s tranche of available for sale MSRs at December 31, 2004:
State Loans
Aggregate Unpaid
Principal
Percentage of Total Unpaid
Principal Georgia. . . . . . . . . . . . . . . . . . . . . . . . . . . . . . . . . . 9,856 $ 1,355,029 10.7%Minnesota . . . . . . . . . . . . . . . . . . . . . . . . . . . . . . . 10,555 1,315,423 10.4%Massachusetts . . . . . . . . . . . . . . . . . . . . . . . . . . . . 5,104 916,901 7.2%California . . . . . . . . . . . . . . . . . . . . . . . . . . . . . . . . 4,684 826,274 6.5%Florida . . . . . . . . . . . . . . . . . . . . . . . . . . . . . . . . . . 6,392 760,521 6.0%Maryland . . . . . . . . . . . . . . . . . . . . . . . . . . . . . . . . 4,329 697,702 5.5%Illinois. . . . . . . . . . . . . . . . . . . . . . . . . . . . . . . . . . . 4,947 696,035 5.5%Missouri . . . . . . . . . . . . . . . . . . . . . . . . . . . . . . . . . 5,746 638,422 5.0%Colorado . . . . . . . . . . . . . . . . . . . . . . . . . . . . . . . . 2,744 451,717 3.6%Ohio . . . . . . . . . . . . . . . . . . . . . . . . . . . . . . . . . . . . 3,837 420,019 3.3%All others . . . . . . . . . . . . . . . . . . . . . . . . . . . . . . . . 40,365 4,621,892 36.3%Total . . . . . . . . . . . . . . . . . . . . . . . . . . . . . . . . . . . . 98,559 $ 12,699,935 100.0%
To help the Company manage risk related to prepayments in its portfolio of MSRs, the Company has purchased interest-rate floor contracts, which provide an interest rate differential on a fixed portion of the portfolio in the event interest rates fall below a certain level, interest rate caps, interest rate swap transactions, and forward purchase contracts on Fannie Mae mortgage backed securities (“FNMA TBA”). For a more detailed discussion of derivative instruments purchased by the Company to hedge interest rate risk on its portfolio of MSRs see note 21 of the notes to the consolidated financial statements included inthis report.
In those cases where the Company sells its MSRs on a flow basis or in bulk sales, the Company may temporarily subservice the loans until the servicing files are transferred to the acquiror of the MSRs. Likewise, the Company subservices loans on behalf of other third parties pursuant to subservicingagreements. Those agreements provide for compensation to the Company usually on a monthly per loan basis. At December 31, 2004, the Company was subservicing 6,781 loans under such subservicingarrangements with an aggregate unpaid principal balance of $979 million.

11
Financial Intermediary Segment
The financial intermediary segment originates and purchases (for purposes of this discussion the term “originate” is used to describe both the origination and the purchase of loans) loans to be aggregated and re-sold into the secondary markets in the form of mortgage-backed securities or whole loans. The servicing of such loans is sold on a flow or bulk sale basis to external and internal customers. The financial intermediary segment principally originates 1-4 family, first and second mortgage loans. Additionally, on a smaller scale, NetBank originates loans collateralized by boats, planes and other recreational vehicles through Beacon Credit Services, which it acquired in June of 2004, see note 2 of the notes to consolidated financial statements included in this report for additional details regarding this acquisition.
NetBank originates agency-eligible mortgages via its 75 retail branches, operated by its subsidiary Market Street, or its nationwide network of 7,291 brokers and 865 correspondents, operated by its NetBank Funding division. We originate non-conforming mortgages through a nationwide network of12,775 brokers, operated by its subsidiary Meritage. For the year ended December 2004, NetBank originated $10.6 billion of conforming mortgage loans and $3.0 billion of non-conforming mortgages.
Agency-eligible mortgages are those mortgage loans that meet the size, documentation, borrower and credit standards to qualify to be pooled into mortgage-backed securities guaranteed by Fannie Mae, Freddie Mac or Ginnie Mae.
After the sale or securitization of agency-eligible mortgage loan production, NetBank, in some cases, continues to service mortgages on behalf of the permanent investor. Servicing activities include collecting and remitting mortgage loan payments, accounting for principal and interest, holding escrow funds forpayment of mortgage-related expenses such as taxes and insurance, making inspections of the mortgaged premises as required, making advances to cover delinquent payments, supervising foreclosures and property dispositions in the event of unremedied default, and generally administering agency-eligible mortgage loans. Under the Company’s internal reporting structure, the servicing assets retained for internal investment are deemed to be “sold” to the retail banking segment, and the revenues generated from servicing activities are included in the transaction processing segment.
Non-conforming mortgages, which are not eligible to be securitized by the aforementioned government sponsored enterprises, are sold to private whole loan investors and private-label mortgage conduits. NetBank does not retain an interest in non-conforming mortgages once they are sold.
NetBank also sells its entire range of mortgage competencies on a private-label basis to financial institutions that lack the knowledge or infrastructure to originate mortgages themselves. NetBank has partnered with the Independent Community Bankers of America (ICBA) to offer mortgage services to its 5,000 community bank members.
Mortgage Loan Production Channels
Retail Production. NetBank offers mortgage products directly to consumers through 75 retail branches located in 14 states. Market Street maintains relationships directly with realtors and builders to focus on purchase mortgage transactions (as opposed to refinancing transactions) business. NetBank also offers construction-to-permanent loans enabling consumers to finance the construction and permanent financing of their new home in one seamless transaction. Although production costs in its retail channelare higher than in the correspondent and broker channels, the retail channel offers higher margins than those channels. Likewise, the retail channel offers a direct relationship with the customer, which allows for more potential cross-selling of other products and services to the customer. Market Street’s production is less affected by cyclical trends that affect the volumes and margins in the correspondent and wholesale channels because a larger portion of Market Street’s volume comes from home purchase transactions.

12
In its retail offices, Market Street’s representatives take mortgage applications, process and underwrite the loans, and fund the approved loans. At its home office in Clearwater, Florida, Market Street performs quality control tests, secondary marketing and loan shipping.
Correspondent Production. NetBank Funding, acquires recently originated mortgages from a nationwide network of correspondent lenders. Correspondents are primarily mortgage lenders, mortgage brokers, savings and loan associations and small commercial banks. At December 31, 2004, the Company had approximately 865 correspondents originating mortgage loans in 48 states and the District ofColumbia. Agency-eligible residential loan production by correspondents is widely dispersed, with the top 20 correspondents supplying the Company with 39% of its dollar volume of correspondent loans.
NetBank Funding attracts and maintains relationships with correspondents by offering a variety ofservices that provide incentives for the correspondents to sell NetBank Funding agency-eligible mortgage loans. NetBank Funding’s strategy with respect to its correspondents is to provide a high level of service rather than the lowest price. Services provided include timely underwriting and approval or rejection of a loan, timely purchase of loans, seminars on how to process and prepare a loan application and updates on current underwriting practices. In addition, NetBank Funding provides correspondents with a variety of products and delivery capabilities and multiple means of funding loans. NetBank Funding’s business-to-business Internet offering makes it easier for correspondents to interact with the Company by automatingthe flow of information between the correspondent and NetBank Funding. The site allows correspondentlenders to upload/key files, register and lock a loan, submit a loan to Fannie Mae Desktop Underwriting,print out a fax cover with a bar code to be faxed and routed electronically, submit an electronic file to one of NetBank Funding’s regional operating centers for validation and request closing funds on-line. As the mortgage lending market increases in sophistication and loan-price differentials narrow among mortgage bankers, NetBank Funding believes that the level of service and commitment it provides to its correspondents will be paramount to its success.
Management believes that through correspondent lending it can manage risks and maintain good quality control. Correspondents have to meet established standards to be approved by the Veteran’s Administration (“VA”), the U. S. Department of Housing and Urban Development (“HUD”) or private mortgage insurance companies. A correspondent qualifies to participate in NetBank Funding’scorrespondent program only after a thorough review of its reputation and mortgage lending expertise, including a review of references and financial statements and a personal visit by one or more representatives of NetBank Funding. After a correspondent qualifies for NetBank Funding’s program, NetBank Funding closely monitors the correspondent’s performance in terms of delinquency ratios, document exceptions and other pertinent data. Furthermore, all mortgage loans purchased by NetBank Funding through correspondents are subject to various aspects of NetBank Funding’s underwriting criteria, and correspondents are required to repurchase loans or otherwise indemnify NetBank Funding forits losses in the event of fraud or misrepresentation in the origination process and for certain other reasons, including noncompliance with underwriting standards.
All loan applications are subject to NetBank Funding’s underwriting criteria and the guidelines set forth by the Federal Housing Authority (“FHA”), the VA, Ginnie Mae, Fannie Mae, Freddie Mac or private investors, as applicable. NetBank Funding or the correspondent, in the case of a correspondentwith delegated underwriting authority, verifies, as appropriate for the loan type, each applicant’s income and bank deposits, as well as the accuracy of the other information submitted by the applicant, and obtains and reviews a credit report from a credit reporting agency, a preliminary title report and a real estate appraisal. Generally, delegated underwriting authority is granted by NetBank Funding to its larger correspondents that meet specified financial strength, delinquency ratio, underwriting and quality controlstandards.
13
With respect to FHA and VA loans, HUD and the VA, respectively, have established approval guidelines for the underwriting of loans to be covered by FHA insurance or a VA guaranty. The Company is approved by both HUD and the VA to underwrite FHA and VA loans submitted by specified correspondents and wholesale brokers. The Company purchases FHA and VA loans only from those correspondents who are approved to underwrite FHA and VA loans and from those correspondents for whom the Company has been approved to underwrite FHA and VA loans.
NetBank Funding has implemented a quality control program to monitor compliance with its established lending and servicing policies and procedures, as well as with applicable laws and regulatory guidelines. NetBank Funding believes that the implementation and enforcement of its comprehensive underwriting criteria and its quality control program are significant elements in the Company’s efforts to purchase high-quality mortgage loans and servicing rights. NetBank Funding’s quality control department examines loans in order to evaluate the loan purchasing function for compliance with underwriting criteria. The quality control department also reviews loan applications for compliance with federal and state lending standards, which may involve re-verifying employment and bank information and obtainingseparate credit reports and property appraisals.
Wholesale Production. The wholesale division of NetBank Funding receives loan applications through brokers, underwrites the loans, funds the loans at closing and prepares all closing documentation. Typically, mortgage brokers are responsible for taking applications and accumulating the information priorto NetBank Funding’s processing of the loans. All loan applications processed by the wholesale division are subject to underwriting and quality control comparable to the standards used in NetBank Funding’s correspondent lending program.
NetBank Funding processes wholesale loans through regional operations centers. At December 31, 2004, NetBank Funding had three regional operations centers serving approximately 7,291 brokers. These offices are located in Portland, Oregon; St. Louis, Missouri; and Jacksonville, Florida. Although maintaining regional operations centers involves the incurrence of fixed expenses associated withmaintaining those offices, wholesale operations generally provide for higher profit margins than correspondent loan production. Additionally, each regional operations center can serve a relatively sizable geographic area by establishing relationships with large numbers of independent mortgage loan brokers who bear much of the cost of identifying and interacting directly with loan applicants. NetBank Funding’s Internet site is also available to its brokers with the same features and benefits for brokers as enumerated above for the correspondent lending program.
Non-conforming Production. Through Meritage, the Company originates mortgage loans that will not qualify to be pooled into agency-eligible mortgage-backed securities due to loan size, the extent of loandocumentation, or borrower credit. Meritage originates such non-conforming mortgages through a nationwide network of brokers. Meritage underwrites and processes loans at two regional processing centers located in Portland, Oregon and Jacksonville, Florida, which are shared with the correspondentand wholesale production channels as described above. All non-conforming loans are sold into thesecondary market for cash, and Meritage retains no recourse risk beyond that associated with normal seller representations and warranties.
Non-conforming mortgage loans are more expensive to process than agency-eligible mortgage loans. However, the margin on sale makes these products generally the Company’s highest profit mortgage offering. Likewise, the majority of the loans funded through Meritage’s non-conforming channel are homepurchase mortgage loans as opposed to refinance transactions. Accordingly, Meritage’s production volumes tend to be less cyclical than the volumes in NetBank’s correspondent and wholesale channels.

14
The following summarizes NetBank’s production volumes by channel:
2004 2003 2002Retail . . . . . . . . . . . . . . . . . . . . . . . . . . . . . . . . . . . . . . . . . . . . . . . . $ 2,510,558 $ 3,059,215 $ 2,449,319Correspondent . . . . . . . . . . . . . . . . . . . . . . . . . . . . . . . . . . . . . . . . 4,871,980 8,239,984 5,066,168Wholesale/broker . . . . . . . . . . . . . . . . . . . . . . . . . . . . . . . . . . . . . 3,263,638 5,404,629 2,809,386Total agency-eligible. . . . . . . . . . . . . . . . . . . . . . . . . . . . . . . . . . . 10,646,176 16,703,828 10,324,873Non-conforming . . . . . . . . . . . . . . . . . . . . . . . . . . . . . . . . . . . . . . 2,986,768 2,217,928 1,406,566Total . . . . . . . . . . . . . . . . . . . . . . . . . . . . . . . . . . . . . . . . . . . . . . . . $ 13,632,944 $ 18,921,756 $ 11,731,439
NetBank purchases and originates a variety of mortgage loan products that are designed, inconjunction with the requirements of prospective purchasers of such loans, to respond to consumer needs and competitive factors. In addition to 15-year and 30-year conventional mortgage loans and 15-year and 30-year FHA loans and VA loans, NetBank purchases and originates products designed to provide lower interest rates to borrowers or lower principal and interest payments by borrowers, including balloon mortgage loans that have relatively short terms (i.e., five or seven years) and longer amortization schedules (i.e., 25 or 30 years) and adjustable rate mortgage loans. The Company also purchases and originates mortgage loans featuring a variety of combinations of interest rates and discount points so that borrowers may elect to pay higher points at closing and less interest over the life of the loan, or pay a higher interest rate and reduce or eliminate points payable at closing. The portion of total loans held for sale at any time that consists of a particular product type depends, among other factors, primarily upon the interest rate environment at the time such loans are originated.
The following is a summary of NetBank’s mortgage loan production for 2004, 2003 and 2002 by major product type.
Year Ended December 31, 2004 2003 2002
Conventional Loans: Volume . . . . . . . . . . . . . . . . . . . . . . . . . . . . . . . . . . . . . . . . . . . $ 7,399,350 $11,822,919 $ 7,429,171Percentage of total volume . . . . . . . . . . . . . . . . . . . . . . . . . . 54% 63% 63%
FHA / VA Loans: Volume . . . . . . . . . . . . . . . . . . . . . . . . . . . . . . . . . . . . . . . . . . . $ 1,920,675 $ 2,901,475 $ 2,312,513Percentage of total volume . . . . . . . . . . . . . . . . . . . . . . . . . . 14% 15% 20%
Other Loans:Volume . . . . . . . . . . . . . . . . . . . . . . . . . . . . . . . . . . . . . . . . . . . $ 1,326,151 $ 1,979,434 $ 583,189Percentage of total volume . . . . . . . . . . . . . . . . . . . . . . . . . . 10% 10% 5%
Non-conforming Loans Volume . . . . . . . . . . . . . . . . . . . . . . . . . . . . . . . . . . . . . . . . . . . $ 2,986,768 $ 2,217,928 $ 1,406,566Percentage of total volume . . . . . . . . . . . . . . . . . . . . . . . . . . 22% 12% 12%
Total Loans: Volume . . . . . . . . . . . . . . . . . . . . . . . . . . . . . . . . . . . . . . . . . . . $13,632,944 $18,921,756 $11,731,439Percentage of total volume . . . . . . . . . . . . . . . . . . . . . . . . . . 100% 100% 100%Average loan size . . . . . . . . . . . . . . . . . . . . . . . . . . . . . . . . . . $ 140 $ 141 $ 136

15
The following table shows the geographic distribution of NetBank’s residential mortgage loanproduction volume for the top ten states for the year ended December 31, 2004:
State Amount Percentage of totalFlorida. . . . . . . . . . . . . . . . . . . . . . . . . . . . . . . . . . . . . . . . . . . . . . . . . . . . . . . . $ 1,723,686 13%California . . . . . . . . . . . . . . . . . . . . . . . . . . . . . . . . . . . . . . . . . . . . . . . . . . . . . 1,522,302 11%Georgia . . . . . . . . . . . . . . . . . . . . . . . . . . . . . . . . . . . . . . . . . . . . . . . . . . . . . . . 983,870 7%Illinois . . . . . . . . . . . . . . . . . . . . . . . . . . . . . . . . . . . . . . . . . . . . . . . . . . . . . . . . 827,606 6%Minnesota. . . . . . . . . . . . . . . . . . . . . . . . . . . . . . . . . . . . . . . . . . . . . . . . . . . . . 712,136 5%Massachusetts . . . . . . . . . . . . . . . . . . . . . . . . . . . . . . . . . . . . . . . . . . . . . . . . . 642,808 5%Missouri . . . . . . . . . . . . . . . . . . . . . . . . . . . . . . . . . . . . . . . . . . . . . . . . . . . . . . 635,100 5%Maryland. . . . . . . . . . . . . . . . . . . . . . . . . . . . . . . . . . . . . . . . . . . . . . . . . . . . . . 537,448 4%Texas . . . . . . . . . . . . . . . . . . . . . . . . . . . . . . . . . . . . . . . . . . . . . . . . . . . . . . . . . 522,807 4%Colorado . . . . . . . . . . . . . . . . . . . . . . . . . . . . . . . . . . . . . . . . . . . . . . . . . . . . . . 522,351 4%All others . . . . . . . . . . . . . . . . . . . . . . . . . . . . . . . . . . . . . . . . . . . . . . . . . . . . . 5,002,830 36%Total . . . . . . . . . . . . . . . . . . . . . . . . . . . . . . . . . . . . . . . . . . . . . . . . . . . . . . . . . $13,632,944
Sale of Residential Loans
NetBank customarily sells fixed rate agency-eligible mortgage loans that it originates, retaining themortgage servicing rights, which may be sold separately or retained by NetBank. Under ongoing programs established with Fannie Mae and Freddie Mac, NetBank aggregates such conforming conventional loans into pools that are assigned to Fannie Mae or Freddie Mac in exchange for mortgage-backed securities. NetBank’s FHA mortgage loans and VA mortgage loans are generally pooled and sold in the form of Ginnie Mae mortgage-backed securities. NetBank pays specified fees to Freddie Mac, Fannie Mae or Ginnie Mae, as applicable, in connection with these programs. NetBank then sells Freddie Mac, Fannie Mae and Ginnie Mae mortgage-backed securities to securities dealers. Substantially all of the Company’s agency-eligible mortgage loans qualify under the various Fannie Mae, Freddie Mac and Ginnie Mae program guidelines, which include specific property and credit standards, including a loan size limit. Depending on market conditions for conforming loans and the related servicing rights, NetBank from time to time will sell a portion of its conventional loan production in whole loan sales to other conventional loan seller/servicers to optimize its overall execution into the secondary markets. Depending on its appetite for earning assets, NetBank retains certain mortgages, primarily adjustable rate mortgages, second mortgages and home equity loans (“HELOCS”), for long-term investment. During 2004, NetBank retained mortgages with principal balances aggregating $838 million.
The Company customarily sells non-conforming residential mortgage loans to private investors through whole loan sales for cash and retains no residual interests.
In the case of conventional loans, subject to the obligations of any primary mortgage insurer, NetBank is generally at risk for any mortgage loan default until the loan is sold (typically less than 90 days). Once NetBank sells the loan, the risk of loss from mortgage loan default and foreclosure generally passes to the purchaser or insurer of the loan. In the case of FHA and VA loans, NetBank has, from the time such aloan is originated or purchased until the first borrower payment is due, a minimum of 31 days to request insurance or a guarantee certificate. Once the insurance or the guarantee certificate is issued, NetBank has no risk of default, except with respect to certain losses related to foreclosures of FHA mortgage loans and losses that exceed the VA’s guarantee limitations. In connection with NetBank’s loan exchanges and sales, NetBank makes representations and warranties customary in the industry relating to, among other things, compliance with laws, regulations and program standards and as to accuracy of information. NetBank may become liable for certain damages or may be required to repurchase such loans and bear any potentialrelated loss on the disposition of those loans. Typically, with respect to loans that NetBank repurchases,

16
NetBank corrects the flaws that had resulted in the repurchase, and the loans are resold in the market or are repurchased by the original correspondent pursuant to the prior agreement. The Company maintains a reserve for future expected repurchases such as these is maintained by the Company as described more fully in notes 3 and 19 of the notes to the consolidated financial statements contained included in this report.
The sale of mortgage loans may generate a gain or loss to NetBank. Gains or losses result primarily from two factors. First, NetBank may originate or purchase a loan at a price (i.e., interest rate and discount) that may be higher or lower than NetBank would receive if it immediately sold the loan in the secondary market. These pricing differences occur principally as a result of competitive pricing conditions in the primary loan origination market. Second, gains or losses upon the sale of loans may result from changes in interest rates, which cause changes in the market value of the loans, or commitments tooriginate loans, from the time the price commitment is given to the customer until the time that the loan is sold by NetBank to the investor.
To reduce the effects of changes in interest rates on NetBank’s inventory of mortgage loans and pipeline of commitments to fund mortgage loans, NetBank uses various hedging techniques. As part of itshedging program, NetBank projects the portion of its commitments that it anticipates will close and assesses the associated risk. The risk assessment is based upon a number of factors, including the remaining term of the commitment, the interest rate at which the commitment was provided, currentinterest rates and interest-rate volatility. NetBank constantly monitors these factors and adjusts its hedging instruments when appropriate throughout each business day. NetBank’s hedging strategy currently consists of utilizing a combination of mandatory forward sales commitments on mortgage-backed securities and mortgage loans and options on mortgage-backed securities.
In connection with its agency-eligible mortgage loan sale program, which involves the sale of mortgage loans and mortgage-backed securities on a forward or other deferred delivery and payment basis, NetBank has credit risk exposure to the extent purchasers are unable to meet the terms of their forward purchase contracts. As is customary in the mortgage industry, none of the forward payment obligations of any of the Company’s counterparties is secured; however, NetBank attempts to limit its credit exposure on forward sales arrangements by entering into forward sales contracts solely with institutions that NetBank believes are sound credit risks and by limiting exposure to any single counterparty by selling to a number of investors. For example, it is NetBank’s current policy that not more than the lesser of (i) $500 million or(ii) 30% of the total forward purchase contracts outstanding at any time be with any single counterparty. All counterparties are obligated to settle such sales in accordance with the terms of the related forward sale agreement.
Transaction Processing Segment
The Company offers a growing line of financial related transaction processing services to merchants, community banks and other organizations. Many of these services are offered on a private-label basis.
Current offerings include:
• ATM services
• Point of Sale (“POS”) transaction processing
• Mortgage servicing
• Online banking programs
• Payment and deposit processing

17
The Company intensified its efforts to diversify into this segment in late 2003. Management had previously identified this segment as a significant growth prospect, since the segment has an attractiveearnings profile with minimal capital requirements. Management believes investors will value income from this segment more favorably than earnings from the Company’s retail banking and financial intermediary segments over time, since transaction processing-related income tends to be more stable and predictable with a generally higher long-term cyclical growth rate.
The Company has made a number of strategic acquisitions increase the services it offers. In late 2003, the Company acquired an ATM and merchant processing business. This acquisition serves as the model for the types of transactions management will continue to pursue for this segment. This acquisition provided the Company with a new line of business that complemented its transaction processing strategy and dovetailed with the Company’s other operating segments. The Company has branded the majority of the approximately 8,000 ATMs in its ATM servicing network and made them available on a surcharge-free basis to the Company’s retail banking customers. This network ranks as the second-largest bank-operated network. According to internal research, the Company now provides its banking customer access to more surcharge-free machines than any other U.S. bank except one.
The Company was able to also develop its transaction processing operations by leveraging corecompetencies that already existed within its other segments. These competencies have simply beenpackaged and marketed to other banks or financial institutions on a business-to-business basis. The Company’s decision to market the small business online banking platform that it developed for its own banking customers is a good example of this approach.
Management does not believe its strategy of re-selling the Company’s core competencies will greatly undermine the ability for the Company’s own direct-to-consumer operations to compete and grow market share. The small community banks and credit unions that are interested in the Company’s transactionprocessing services generally cater to a different consumer demographic and market segment than the Company’s retail banking operations reach.
The overall landscape for the Company’s transaction processing initiatives is fairly crowded and competitive. Within each line of business, the Company competes against a few larger, well-knownproviders. However, the Company seeks to focus on an underserved niche of smaller businesses or banksthat the larger competitors generally do not pursue on a proactive basis. Management believes this focus will ultimately be successful.
The transaction processing segment achieved profitability during 2004, contributing $2.3 million ofpre-tax income.
Procedures for Determining the Adequacy of the Allowance for Credit Losses
The Company reviews large, heterogeneous loans for collectibility on a loan level basis. Specifically, the Company reviews collateral appraisals, current rent rolls, cash projections and financial statements for each property. Guarantor financial statements are reviewed where appropriate. The Company thenclassifies each loan as “Pass,” “Special Mention,” “Substandard,” “Doubtful” or “Loss”, as appropriate, and applies percentages or ranges of allowances to each classification.
The Company considers each of its portfolios of first mortgages, second mortgages, HELOCs, consumer loans, and auto loans as being respective portfolios of homogeneous assets. The Company evaluates the adequacy of its allowance for each of these portfolios based on the risk characteristics of each portfolio taken as a whole. Additionally, the Company reviews the delinquency status of each of the loans within the portfolio and classifies it as “Pass,” “Special Mention,” “Substandard,” “Doubtful” or “Loss”based on delinquency status. Allowance percentages are applied to each risk category. The Company generally provides allowances of 15%, 50% and 100% for loans classified “Substandard,” “Doubtful” and

18
“Loss”, respectively. For “Pass” and “Special Mention” credits, the Company reviews loss estimates made by rating agencies for securitizations of loans of similar type and determines a range of life of loan losses for each group of mortgage loans and HELOCs. For auto loans, the Company provides, at a minimum,allowances based upon loss estimates for the succeeding twelve months for each vintage year of production. The Company selects its point estimate in that range based upon the seasoning of the groups of loans in its portfolio including the age of the respective portfolios, incidence of default, and loss severity to date. The Company maintains a data base of vintage year loss history on loans in its portfolio that it originated. When the Company’s vintage analysis has adequate statistical data on the loss behaviors of loans that it produced and retained, it will supplement the data used from rating agencies with its ownexperience and use the combined data to estimate expected losses.
For lease receivables, the Company uses its historic “vintage analysis” to estimate probable losses for leases originated by its NetBank Business Finance division. In the past, the Company acquired certain leases from an outside third party that were guaranteed by various sureties. The Company is currently inlitigation with the sureties on those leases. See Item 3. Legal Proceedings. and note 19 of the notes to the consolidated financial statements within this report for information related to those leases.
See the heading “Financial Condition—Asset Quality and Non-performing Assets” in Item 7.Management’s Discussion and Analysis of Financial Condition and Results of Operations of this report for additional qualitative and quantitative information regarding the Company’s allowance for credit losses including information regarding management estimates as to the sufficiency of the allowance for credit losses.
Seasonality
While the Company as a whole is not materially influenced by seasonal trends, the residential mortgage banking industry, generally, and the Company’s Financial Intermediary segment are subject to seasonal trends. These trends reflect the general pattern of resale of homes, which typically peaks duringthe spring and summer seasons and declines to lower levels from mid-November through January. Refinancings tend to be less seasonal and more closely related to changes in interest rates.
Competition
Retail Banking
The marketplace for general banking services is highly competitive and commoditized. The Company previously enjoyed a unique market position as one of the few online banking providers and had no head-to-head competitors. It also had the potential for a significant pricing advantage since it operated a branchless business model and did not have the fixed overhead expenses of its branch-based competitors. As a result, the Company was able to compete aggressively on convenience and price.
These advantages have diminished recently. Over the past several years, traditional branch banks began to offer online services. Initially, these banks charged a fee for their service since it represented anadditional, incremental cost to the bank. Within the last 18 months, these banks have generally dropped these fees. Many of these banks now recognize that online banking customers tend to be more profitable than offline customers. Industry research has shown that online customers generally maintain higher balances, require less customer support and have lower attrition rates than their offline counterparts.
Today, the Company competes directly with large national banks, such as Bank of America, Citigroup and Wells Fargo, along with community banks, credit unions and non-traditional banking providers, suchas E*Trade, Charles Schwab and others. As these institutions have closed the gap on the convenience front, the Company has found that it is competing more frequently on price alone. The Company does not consider price leadership a viable or prudent marketing strategy over the long term. Higher deposit rates may not be compelling enough to convince the average consumer to choose a branchless bank over a traditional bank that can provide branches and an online offering.

19
Management believes the Company has an opportunity to regain competitive advantage in the future by focusing on bundled product offerings, ease of use and highly integrated technology, but there can be noassurance that the Company’s efforts will be successful.
Financial Intermediary
The mortgage banking industry is highly competitive. The Company competes with financial institutions, mainly mortgage banking companies, commercial banks and savings and loan associations and, to a lesser extent, credit unions and insurance companies. The Company competes principally by purchasing or originating a variety of mortgage loans, emphasizing the quality of its service and pricing the loans at competitive rates. Many of the Company’s competitors may have greater financial resources, better operating efficiencies and longer operating histories than the Company. Many of the nation’s largest mortgage banking companies and commercial banks have a significant number of branch offices in areas in which the Company’s correspondents and wholesale regional operations centers operate. Increased competition for mortgage loans from larger lenders may result in a decrease in the volume of loans purchased or originated by the Company, thereby likely reducing the Company’s revenues. At the same time, Fannie Mae and Freddie Mac are developing technologies and business practices that could reduce their reliance on large mortgage banking companies for loan production and enable them to directly access smaller producers for volume. Due to the current highly competitive market-pricing environment, the Company may be unable to achieve its planned level of originations or consummate acquisitions ofmortgage servicing rights at a satisfactory cost. The Company does not have a significant market share of mortgage banking activities in the areas in which it conducts operations.
Due to the foregoing considerations, there can be no assurance that the Company will be able to continue to compete successfully in the markets it serves. Inability to compete successfully would have a material adverse effect on the results of operations and financial condition of the Company.
Transaction Processing
The transaction processing marketplace is highly competitive and fairly fractured, with a few large and well-known providers dominating in different areas of specialty. The Company is competing in a number of emerging markets, such as electronic deposit and payment clearing. However, larger providers are also targeting these markets for growth. The Company believes it can compete effectively by catering to smaller companies who are unlikely to attract the interest of these larger providers.
The Company does operate in one marketplace that is generally more mature. The ATM processing industry is fairly saturated. In 2004, there was significant consolidation among providers. The Company’s ATM operation participated in the consolidation by acquiring the servicing contracts for a number of smaller, independent ATM networks. These additions led to greater scale and efficiency improvements, and the Company believes the operation is well positioned for continued growth. At year-end, the operation had 7,936 ATMs and 2,153 merchant processing terminals in deployment.
Intellectual Property and Proprietary Rights
NetBank regards the form and substance of its name and other intellectual property that it has developed as proprietary, and NetBank attempts to protect them by seeking court enforcement of its intellectual property rights. NetBank takes active measures to safeguard its name and other proprietary intellectual property. Policing unauthorized use of proprietary information is difficult, however, because of the uncertain and complicated nature of this kind of litigation. For a court ruling canceling NetBank’s federally registered service mark in the name “NetBank®,” see Item 3. Legal Proceedings included in this report.

20
NetBank owns the Internet domain name “netbank.com.” as well as other domain names related tothe businesses the Company operates. Domain names in the United States and in foreign countries are regulated, but the laws and regulations governing the Internet are continually evolving. NetBank actively monitors the use of potentially infringing names on the Internet and takes action to protect its intellectual property rights.
Supervision and Regulation
Savings and loan holding companies and federal savings banks are extensively regulated under federal law, as are operating subsidiaries of federal savings banks. The following is a brief summary of certain statutes and rules and regulations that affect or may affect the Company and its major subsidiaries withregard to Savings and Loan Holding Company Regulation, Bank Regulation and Mortgage Banking Regulation. This summary is qualified in its entirety by reference to the particular statute and regulatory provision referred to below and is not intended to be an exhaustive description of the statutes or regulations applicable to the businesses of the Company and its subsidiaries. Certain of the Company’s subsidiaries are subject to insurance laws and regulations. Supervision, regulation and examination of the Company and its subsidiaries by the regulatory agencies are intended primarily for the protection of depositors and borrowers rather than shareholders and creditors of the Company. The terms savings association, federal savings bank and thrift are used interchangeably in this section.
Savings and Loan Holding Company Regulation
The Company is a registered holding company under both the Savings and Loan Holding Company Act (the “SLHCA”) set forth in Section 10 of the Home Owners Loan Act (“HOLA”) and the FinancialInstitutions Code of Georgia (“FICG”). The Company is regulated under such acts by the Office of Thrift Supervision (the “OTS”) and by the Georgia Department of Banking and Finance (the “Georgia Department”), respectively. As a savings and loan holding company, the Company is required to file withthe OTS an annual report and such additional information as the OTS may require pursuant to the SLHCA. The OTS also conducts annual safety and soundness and information technology examinations of the Company.
Savings and loan holding companies and their subsidiaries are prohibited from engaging in any activity or rendering any services for or on behalf of their savings institution subsidiaries for the purpose or withthe effect of evading any law or regulation applicable to the institution. This restriction is designed to prevent the use of holding company affiliates to evade requirements of the SLHCA that are designed to protect the holding company’s savings institution subsidiaries. However, if the holding company owns only one insured institution (a unitary holding company) and was in existence prior to May 4, 1999, the SLHCA and the FICG impose no such restrictions on the activities of its non-bank subsidiaries, provided that the lone savings institution satisfies the qualified thrift lender test (discussed below). Moreover, a unitary holding company that satisfies these requirements is not restricted to any statutory prescribed list of permissible activities. However, the Financial Services Modernization Act of 1999 (the “FSM Act”) provides that, while existing unitary holding companies retain these unrestricted powers, if the unitary holding company is then acquired by another party, its powers are restricted to those permitted for financial holding companies under the Act. The Company is currently a unitary holding company thatsatisfies these requirements.
The SLHCA and the FICG makes it unlawful for any savings and loan holding company, directly or indirectly, or through one or more subsidiaries or one or more transactions, to acquire control of anothersavings association or another savings and loan holding company without prior approval from the OTS and the Georgia Department, respectively. The acquisition of more than 25% of any class of voting stock of a savings association or holding company is deemed to be conclusive evidence of control. Savings and loan holding companies are allowed to acquire or to retain as much as 5% of the voting shares of an unaffiliated

21
savings institution or savings and loan holding company without regulatory approval. On December 7,2000, Congress passed the American Homeownership and Economic Opportunity Act of 2000, which permits savings and loan holding companies to acquire or to retain a 5% to 25% non-controlling interest inan unaffiliated savings institution or savings and loan holding company with prior regulatory approval.
An acquisition by merger, consolidation or purchase of assets of such an institution or holding company or of substantially all of the assets of such an institution or holding company is also prohibited without prior OTS or Georgia Department approval. When considering an application for such an acquisition, the OTS and the Georgia Department take into consideration the financial and managerial resources and future prospects of the prospective acquiring company and the institution involved. This includes consideration of the competence, experience and integrity of the officers, directors and principal shareholders of the acquiring company and savings institution. In addition, the OTS and the Georgia Department consider the effect of the acquisition on the institution, the insurance risk to the Savings Association Insurance Fund (“SAIF”), the convenience and needs of the community to be served and any possible anti-competitive effect.
The OTS may not approve an acquisition that would result in the formation of certain types ofinterstate holding company networks. The OTS is precluded from approving an acquisition that would result in the formation of a multiple holding company controlling institutions in more than one state unless the acquiring company or one of its savings institution subsidiaries is authorized to acquire control of aninstitution or to operate an office in the additional state pursuant to a supervisory acquisition authorized under Section 13(k) of the Federal Deposit Insurance Act or unless the statutes of the state in which the institution to be acquired is located permits such an acquisition.
In connection with the March 31, 2002 acquisition of Resource by the Company, the regional director of the OTS and the Company entered into a side letter agreement providing that the Company, on a consolidated basis, maintain a minimum common equity capital-to-total assets ratio of 10.0% throughDecember 31, 2004. Subsequently, the OTS approved excluding from this calculation capital held against forward sold conforming mortgages, for which required capital would be the greater of 5% or $50,000,provided that the total capital to total assets would not fall below 8%. Additionally, NetBank, FSB was required to maintain a minimum of 6% core capital and 12% total risk-based capital ratios throughDecember 31, 2004. While NetBank, FSB was not in compliance with the terms of the side letter agreement on December 31, 2004, it expired on January 1, 2005 and therefore, the Company and NetBank, FSB are no longer subject to its restrictive terms. The Company is not aware of any negative consequences associated with the expired side letter agreement. NetBank, FSB was categorized as well-capitalized with a total risk-based capital ratio of 11.30% as of December 31, 2004. See note 20 of the notes to the consolidated financial statements included in this report for additional details regarding NetBank’s capital.
The Georgia Department requires that savings and loan holding companies, such as the Company,maintain a 5% Tier 1 leverage ratio on a consolidated basis.
Bank Regulation
General. The Bank is a federal savings bank organized under the laws of the United States. The Bank and its operating subsidiaries are subject to annual examination by the OTS for safety and soundness,for compliance with consumer protection laws and regulations and for information technology. The OTS regulates all areas of the Bank’s operations including reserves, loans, mergers, payment of dividends, interest rates, establishment of branches, and other aspects of operations. OTS regulations generally provide that federal savings banks and their operating subsidiaries must be examined no less frequentlythan every 12 months, with certain exceptions. The Bank is subject to assessments by the OTS to cover the costs of such examinations.
22
The Bank is also insured and regulated by the Federal Deposit Insurance Corporation (the “FDIC”). The major functions of the FDIC with respect to insured federal savings banks include paying depositors to the extent provided by law in the event an insured bank is closed without adequately providing for payment of the claims of depositors. The FDIC also works to prevent the development and continuance of unsound and unsafe banking practices.
Subsidiary institutions of a savings and loan holding company, such as the Bank, are subject to certainrestrictions imposed by the Federal Reserve Act on any extension of credit to the holding company or any of its subsidiaries, on investment in the stock or other securities thereof, and on the taking of such stock orsecurities as collateral for loans to any borrower. See the section entitled “Transactions with Affiliates Restriction” below for greater detail. In addition, a holding company and its subsidiaries are prohibited from engaging in certain tying arrangements in connection with any extension of credit or provision of any property or services.
Capital Requirements. OTS regulations require that federal savings banks maintain (i) “tangiblecapital” in an amount of not less than 1.5% of total assets, (ii) “core capital” in an amount not less than4.0% of total assets, and (iii) a level of risk-based capital equal to 8% of risk-weighted assets. Under OTS regulations, the term “core capital” generally includes common stockholders’ equity, noncumulative perpetual preferred stock and related surplus, and minority interests in the equity accounts of consolidated subsidiaries less unidentifiable intangible assets (other than certain amounts of supervisory goodwill) and certain investments in certain subsidiaries plus 90% of the fair market value of readily marketable purchased mortgage servicing rights (“PMSRs”) and purchased credit card relationships (subject to certain conditions). “Tangible capital” generally is defined as core capital minus intangible assets and investments in certain subsidiaries, except PMSRs.
In determining total risk-weighted assets for purposes of the risk-based requirement, (i) each off-balance sheet asset must be converted to its on-balance sheet credit equivalent amount by multiplying the face amount of each such item by a credit conversion factor ranging from 0% to 100% (depending uponthe nature of the asset), (ii) the credit equivalent amount of each off-balance sheet asset and each on-balance sheet asset must be multiplied by a risk factor ranging from 0% to 200% (depending upon the nature of the asset) and (iii) the resulting amounts are added together and constitute total risk-weighted assets. “Total capital,” for purposes of the risk-based capital requirement equals the sum of core capital plus supplementary capital (which, as defined, includes the sum of, among other items, perpetual preferred stock not counted as core capital, limited life preferred stock, subordinated debt, and general loan and lease loss allowances up to 1.25% of risk-weighted assets) less certain deductions. The amount ofsupplementary capital that may be counted towards satisfaction of the total capital requirement may not exceed 100% of core capital, and OTS regulations require the maintenance of a minimum ratio of corecapital to total risk-weighted assets of 4%.
OTS regulations also include an interest-rate risk component in the risk-based capital requirement. Under this regulation, an institution is considered to have excess interest rate-risk if, based upon a 200-basis point change in market interest rates, the market value of an institution’s capital changes by more than 2%. This requirement does not have any material effect on the ability of the Bank to meet the risk-based capital requirement. The OTS also revised its risk-based capital standards to ensure that itsstandards provide adequately for concentration of credit risk, risk from nontraditional activities and actual performance and expected risk of loss on multi-family mortgages.
Capital requirements higher than the generally applicable minimum requirement may be established for a particular savings association if the OTS determines that the institution’s capital was or may become inadequate in view of its particular circumstances.
Prompt Corrective Action. The Federal Deposit Insurance Corporation Improvement Act of 1991establishes a system of prompt corrective action to resolve the problems of undercapitalized financial
23
institutions. Under this system, the federal banking regulators have established five capital categories (“well capitalized,” “adequately capitalized,” “undercapitalized,” “significantly undercapitalized” and “critically undercapitalized”) in which all institutions are placed. Federal banking regulators are required to take some mandatory supervisory actions and are authorized to take other discretionary actions, with respect to institutions in the three undercapitalized categories. The severity of the action depends upon the capital category in which the institution is placed. Generally, subject to a narrow exception, the bankingregulator must appoint a receiver or conservator for an institution that is critically undercapitalized. The federal banking agencies have specified by regulation the relevant capital level for each category.
An institution that is categorized as undercapitalized, significantly undercapitalized, or critically undercapitalized is required to submit an acceptable capital restoration plan to its appropriate federal banking agency. A holding company must guarantee that a subsidiary depository institution meets its capital restoration plan, subject to certain limitations. The controlling holding company’s obligation tofund a capital restoration plan is limited to the lesser of 5% of an undercapitalized subsidiary’s assets or the amount required to meet regulatory capital requirements. An undercapitalized institution is also generally prohibited from increasing its average total assets, making acquisitions, establishing any branches or engaging in any new line of business, except under an accepted capital restoration plan or with regulatory approval. An institution may be downgraded to a lower capital category based on supervisory factors other than capital.
FDIC Insurance Assessments. The FDIC has adopted a risk-based assessment system for insured depository institutions that takes into account the risks attributable to different categories and concentrations of assets and liabilities. The system assigns an institution to one of three capital categories:(1) well capitalized; (2) adequately capitalized; and (3) undercapitalized. These three categories are substantially similar to the prompt corrective action categories described above, with the “undercapitalized” category including institutions that are undercapitalized, significantly undercapitalized,and critically undercapitalized for prompt corrective action purposes. The FDIC also assigns an institution to one of three supervisory subgroups within each capital group. The supervisory subgroup to which an institution is assigned is based on a supervisory evaluation that the institution’s primary federal regulator provides to the FDIC and information that the FDIC determines to be relevant to the institution’s financial condition and the risk posed to the deposit insurance funds. The FDIC then determines aninstitution’s insurance assessment rate based on the institution’s capital category and supervisory category. Under the risk-based assessment system, there are nine combinations of capital groups and supervisory subgroups to which different assessment rates are applied. Assessments range from $0.0 to $0.27 cents per $100 of deposits, depending on the institution’s capital group and supervisory subgroup.
In addition, effective January 1, 1997, the FDIC imposed assessments to help pay off the $780 million in annual interest payments on the $8 billion Financing Corporation bonds issued in the late 1980s as part of the government rescue of the thrift industry. The assessment is adjusted quarterly and is set at 1.54 cents per $100 of deposits (the same assessment rate that is imposed on commercial banks) for the first quarter of 2004.
The FDIC may terminate its insurance of deposits if it finds that the institution has engaged in unsafe and unsound practices, is in an unsafe or unsound condition to continue operations or has violated anyapplicable law, regulation, rule, order, or condition imposed by the FDIC.
Community Reinvestment Act. The Community Reinvestment Act (“CRA”) requires that, in connection with examinations of financial institutions within their respective jurisdictions, the federalbanking regulators shall evaluate the record of each financial institution in meeting the credit needs of its local community, including low and moderate income neighborhoods. These facts are also considered inevaluating mergers, acquisitions, and applications to open a branch or facility. Failure to adequately meet these criteria could impose additional requirements and limitations on the Bank. The CRA requires that

24
the board of directors of financial institutions, such as the Bank, adopt a CRA statement for eachassessment area that, among other things, describes its efforts to help meet community credit needs and the specific types of credit that the institution is willing to extend. The Bank’s CRA performance will beassessed pursuant to the following criteria: (1) the Bank’s loan to deposit ratio, adjusted for seasonal variation and, as appropriate, other related lending activities such as loan originations for sale to the secondary markets, community development loans and qualified investments; (2) the percentage of loans and, as appropriate, other lending related activities located in the Bank’s assessment area; (3) the Bank’s record of lending to and, as appropriate, engaging in other lending related activities for borrowers of different income levels and businesses and farms of different sizes; (4) the geographic distribution of the Bank’s loans; and (5) the Bank’s record of taking action if warranted in response to written complaints about its performance in helping to meet credit needs in its assessment area. Additionally, the terms of any CRA-related agreements must be publicly disclosed.
Capital Distributions. An OTS rule requires prior notice of all capital distributions by savings associations that are subsidiaries of a holding company (including dividends, stock repurchases and cash-out mergers). An institution that both before and after a proposed capital distribution has net capital equal to or in excess of its capital requirements may, subject to any otherwise applicable statutory or regulatory requirements or agreements entered into with the regulators, without an application to the OTS make capital distributions in any calendar year up to 100% of its net income to date during the calendar year to date plus the retained net income for the two preceding calendar years.
An institution that either before or after a proposed capital distribution fails to meet its thenapplicable minimum capital requirement or that has been notified that it needs more than normal supervision may not make any capital distributions without the prior written approval of the OTS. In addition, the OTS may prohibit a proposed capital distribution, which would otherwise be permitted by the regulation, if the OTS determines that such distribution would constitute an unsafe or unsound practice.
Equity Investments. The OTS has revised its risk-based capital regulation to modify the treatment of certain equity investments and to clarify the treatment of other equity investments. Equity investments that are permissible for both savings banks and national banks will no longer be deducted from savings associations’ calculations of total capital over a five-year period. Instead, permissible equity investments will be placed in the 100% risk-weight category, mirroring the capital treatment prescribed for those investments when made by national banks under the regulations of the Office of the Comptroller of the Currency. Equity investments held by savings associations that are not permissible for national banks muststill be deducted from assets and total capital.
Qualified Thrift Lender Requirement. A federal savings bank is deemed to be a “qualified thrift lender” (“QTL”) as long as its “qualified thrift investments” equal or exceed 65% of its “portfolio assets” on a monthly average basis in nine out of every 12 months. Qualified thrift investments generally consist of(i) various housing related loans and investments (such as residential construction and mortgage loans, home improvement loans, mobile home loans, home equity loans and mortgage-backed securities), (ii) certain obligations of the FDIC and (iii) shares of stock issued by any Federal Home Loan Bank (“FHLB”), the Federal Home Loan Mortgage Corporation (“Freddie Mac”) or the Federal National Mortgage Association (“Fannie Mae”). In addition, the following assets may be categorized as qualified thrift investments in an amount not to exceed 20% in the aggregate of portfolio assets: (i) 50% of the dollar amount of residential mortgage loans originated and sold within 90 days of origination; (ii) investments in securities of a service corporation that derives at least 80% of its income fromresidential housing finance; (iii) 200% of loans and investments made to acquire, develop or construct starter homes or homes in credit needy areas (subject to certain conditions); (iv) loans for the purchase or construction of churches, schools, nursing homes and hospitals; and (v) consumer loans (in an amount up to 20% of portfolio assets). For purposes of the QTL test, the term “portfolio assets” means the savings institution’s total assets minus goodwill and other intangible assets, the value of property used by the

25
savings institution to conduct its business, and liquid assets held by the savings institution in an amount up to 20% of its total assets.
OTS regulations provide that any savings association that fails to meet the definition of a QTL must either convert to a national bank charter or limit its future investments and activities (including branching and payments of dividends) to those permitted for both savings associations and national banks. Further,within one year of the loss of QTL status, a holding company of a savings association that does not convert to a bank charter must register as a bank holding company and will be subject to all statutes applicable to bank holding companies. In order for the Bank to exercise the powers granted to federally chartered savings associations and for the Company to retain the power of a unitary holding company, the Bank must meet the definition of a QTL. As of December 31, 2004 NetBank, FSB was deemed to be a QTL.
Loans to One Borrower Limitations. HOLA generally requires savings associations to comply with the loans to one borrower limitations applicable to national banks. National banks generally may make loans to a single borrower in amounts up to 15% of their unimpaired capital and surplus, plus an additional 10% of capital and surplus for loans secured by readily marketable collateral. HOLA provides exceptions under which a savings association may make loans to one borrower in excess of the generally applicable national bank limits. A savings association may make loans to one borrower in excess of such limits under one of the following circumstances: (i) for any purpose, in any amount not to exceed $500,000; or (ii) to develop domestic residential housing units, in an amount not to exceed the lesser of $30 million or 30% of the savings association’s unimpaired capital and unimpaired surplus, provided other conditions are satisfied. The Federal Institutions Reform, Recovery, and Enforcement Act of 1989 provided that a savings association could make loans to one borrower to finance the sale of real property acquired in satisfaction of debts previously contracted in good faith in amounts up to 50% of the savings association’s unimpairedcapital and unimpaired surplus. The OTS, however, has modified this standard by limiting loans to one borrower to finance the sale of real property acquired in satisfaction of debts to 15% of unimpaired capital and surplus. That rule provides, however, that purchase money mortgages received by a savings association to finance the sale of such real property do not constitute “loans” (provided no new funds are advancedand the savings association is not placed in a more detrimental position holding the note than holding the real estate) and, therefore, are not subject to the loans to one borrower limitations.
Commercial Real Property Loans. HOLA limits the aggregate amount of commercial real estate loans that a federal savings association may make to an amount not in excess of 400% of the savings association’scapital.
Federal Home Loan Bank System. The FHLB System consists of 12 regional FHLBs, each subject to supervision and regulation by the Federal Housing Finance Board (the “FHFB”). The FHLBs provide a central credit facility for member savings associations. The maximum amount that the FHLB of Atlanta will advance fluctuates from time to time in accordance with changes in policies of the FHFB and the FHLB of Atlanta, and the maximum amount generally is reduced by borrowings from any other source. The Financial Services Modernization Act has enabled the FHLB to expand the credit window for members by expanding the purposes for which FHLB’s may make secured advances and the types of collateral eligible to secure these advances, as well as eliminating restrictions on advances to thrifts not meeting the QTL test.
Federal Reserve System. The Federal Reserve Board has adopted regulations that require savings associations to maintain non-earning reserves against their transaction accounts (primarily NOW and regular checking accounts). Because required reserves must be maintained in the form of cash or a non-interest-bearing account at a Federal Reserve Bank, the effect of this reserve requirement is to reduce the amount of the Bank’s interest-earning assets.
26
Savings institutions also have the authority to borrow from the Federal Reserve “discount window.” Federal Reserve Board regulations, however, require savings associations to exhaust all FHLB sources before borrowing from a Federal Reserve bank.
Privacy. Financial institutions are regulated by federal law and federal regulatory agency rules that are designed to protect the privacy rights of its customers who obtain goods or services from the institution that are to be used primarily for personal, family or household purposes. State legislatures and agencies are increasingly active in the same regard. In general, this body of law requires the institutions to disclose their policies for collecting, sharing and protecting the confidential information of their customers. Under the Gramm-Leach Bliley Act of 1999 (the “GLBA”), for example, customers generally may prevent financial institutions from sharing nonpublic personal financial information with nonaffiliated third parties except under certain circumstances, such as in the course of processing a transaction requested by the customer, in connection with the institution’s joint sponsorship of a product or service with a nonaffiliated third party, or when required to do so under various state or federal laws (i.e., complying with a subpoena).Additionally, the GLBA provides that financial institutions generally may not disclose consumer account numbers to any nonaffiliated third party for use in telemarketing, direct mail marketing or other marketing to consumers. Customer’s rights to privacy are also protected by the Fair Credit Reporting Act, addressed below in “Consumer Credit Reporting.”
Regulatory agencies, including the OTS and the FDIC, jointly published a Privacy Rule that establishes information security safeguards, including a requirement for annual risk assessments and otheradministrative, technical and physical safeguards. Such safeguards are to insure the security of the customers’ records in light of potential threats, hazards or unauthorized access to or use of such records that could harm the customer.
Consumer Credit Reporting. On December 4, 2003, and in part due to the growing threat of identity theft in our society, President George W. Bush signed the Fair and Accurate Credit Transactions Act (the “FACT Act”), amending the federal Fair Credit Reporting Act (the “FCRA”). Most of the amendments to the FCRA (the “FCRA Amendments”) were to have become effective in late 2004, depending on implementing regulations to be issued by the Federal Trade Commission and the federal bank regulatory agencies.
The FCRA Amendments include, among other things:
• new requirements for financial institutions to develop policies and procedures to identify potential identity theft and, upon the request of a consumer, place a fraud alert in the consumer’s credit file stating that the consumer may be the victim of identity theft or other fraud;
• new consumer notice requirements for lenders that use consumer report information in connection with risk-based credit pricing programs;
• new notice requirement when negative information about the consumer is reported to a credit reporting agency;
• a new requirement for mortgage lenders to disclose credit scores and related information to consumers;
• a new requirement prohibiting users of consumer reports that contain identity theft and military alerts from taking certain actions until a reasonable belief of the identity of the requester has been established;
• restrictions on the sale or transfer of debt caused by identity theft; and
• for entities that furnish information to consumer reporting agencies, new requirements to implement procedures and policies regarding the accuracy and integrity of the furnished

27
information and regarding the correction of previously furnished information that is later determined to be inaccurate.
The FCRA Amendments also prohibit a business that receives consumer information from an affiliate from using that information for marketing purposes unless the consumer is first provided a notice and anopportunity to direct the business not to use the information for such marketing purposes (the “opt-out”), subject to certain exceptions. While the FCRA Amendments will limit NetBank’s ability to share information with its affiliates for marketing purposes, the actual impact of these limitations will depend on the extent to which our customers elect to prohibit the use of their personal information for marketing purposes. We have no basis at this time to predict the volume of consumer “opt-outs.”
NetBank and its subsidiaries have implemented policies and procedures for those provisions with a mandatory compliance date on or before December 1, 2004. Prior to the effective date of the remaining FCRA Amendments, NetBank and its subsidiaries will implement policies and procedures to comply withthe new rules.
Anti-Money Laundering and Anti-Terrorism Legislation. The Uniting and Strengthening America by Providing Appropriate Tools Required to Intercept and Obstruct Terrorism (“USA PATRIOT”) Act of 2001, signed by the President on October 26, 2001, imposed new requirements and limitations on specified financial transactions and account relationships, intended to guard against money laundering andterrorism. Most of these requirements and limitations took effect in 2002. Additional “know your customer” rules became effective in June 2003, requiring NetBank’s banking, mortgage banking, and insurance subsidiaries to establish a customer identification program under Section 326 of the USA PATRIOT Act. NetBank and these subsidiaries implemented procedures and policies to comply with these rules prior to the effective date of each of the rules.
The Bank Secrecy Act and its implementing regulations, designed to fight drug trafficking, money laundering, and other federal crimes require financial institutions to keep extensive records for possible use in criminal, tax, and regulatory investigations or proceedings. Financial institutions are required to report and/or retain records of various types of transactions, for example, currency transaction reports iftransactions involve more than $10,000 in currency, certain cash purchases of monetary instruments, known or suspected crimes and suspicious activities, and certain wire (funds) transfers, creating a “paper trail” to track certain financial transactions.
Executive Order 13224 was signed by the President on September 23, 2001, blocking property and prohibiting transactions with persons who commit, threaten to commit, or support terrorism. All U.S. persons are prohibited from making or receiving any contribution of funds, goods, or services to or for the benefit of a blocked person.
In addition, The Office of Foreign Assets Control (“OFAC”) require financial institutions to block or otherwise freeze accounts and certain other assets of sanctioned countries, entities, and individuals identified as being hostile to U.S. foreign policy and a threat to national security. Unlicensed trade and financial transactions are also prohibited. Transactions involving target countries or Specially Designated Nationals subject to economic sanctions or persons associated with international narcotics trafficking or terrorism must be reported.
Check Cashing for the 21st Century Act. The “Check 21 Act,” which became effective on October 28, 2004, authorizes substitute checks to replace paper checks if they contain the same information as the original and meet certain other conditions. The Check 21 Act enables institutions to process checks electronically. The rules do not require institutions to send or receive electronic images. However, once a properly created substitute check is created or presented by a financial institution, the substitute check is deemed to be warranted by such financial institution, becomes the legal equivalent of the original check and must be accepted by all persons for all purposes.
28
Flood Disaster Protection. The Flood Disaster Protection Act prohibits a lender from making, renewing, or extending loans secured by property or inventory located in a FEMA designated special flood hazard area unless the loan is covered its entire term by flood insurance.
Consumer Protection Laws and Regulations—Loan Operations. Interest and other charges collected or contracted for by the Bank and its operating subsidiaries are subject to various laws concerning interestrates and disclosures. In addition, their loan operations are also subject to various laws applicable to credit transactions, such as:
• The federal Truth-In-Lending Act and Regulation Z, requiring disclosure of the costs of credit, providing for the right to rescind certain transactions, and error resolution procedures for open-end transactions. Regulation Z also implements HOEPA requiring expanded disclosures and prohibiting certain practices with regard to high cost home loans to consumer borrowers;
• The Home Mortgage Disclosure Act and Regulation C, requiring financial institutions and other mortgage lenders to collect and report certain data in connection with home purchase and home improvement loans, including refinancings. This information can be used by the public and publicofficials to help determine whether a financial institution is fulfilling its obligation to help meet the housing needs of the community it serves, assist in the distribution of public sector investments, and assist in identifying possible discriminatory lending patterns and enforcing anti-discrimation statutes;
• The Equal Credit Opportunity Act and Regulation B, promoting the availability of credit to all credit worthy applicants and prohibiting discrimination against a borrower or potential borrowerson the basis of race, color, religion, national origin, sex, marital status, age, the receipt of public assistance income, or the exercise of a consumer protection right;
• The Fair Housing Act prohibiting discrimination in the sale or rental of housing, including financing and advertising, on the basis of race, color, religion, sex, handicap or familial status;
• The Real Estate Settlement Procedures Act and HUD’s Regulation X, which requires the disclosure of certain basic information to mortgagors concerning settlement costs and prohibits the charging of unearned fees and certain “kickbacks” or other fees for referrals in connection with a residential mortgage settlement service;
• The Soldiers’ and Sailors Civil Relief Act of 1940, recently revised by the Servicemembers Civil Relief Act governing the repayment terms of, and property rights underlying, secured obligations while persons are in active military service;
• The Fair Credit Reporting Act, governing consumer reports by consumer reporting agencies; the reporting of information to consumer reporting agencies; making prescreened offers of credit; the sharing of consumer report information among affiliated and unaffiliated third parties; andrequirements for users of consumer report information;
• The Fair Debt Collection Practices Act, governing the manner in which consumer debts may becollected and prohibiting certain practices considered abusive; and
• As applicable, the rules and regulations of the various state and federal supervisory and enforcement agencies charged with the responsibility of implementing and enforcing compliance for such laws.

29
Consumer Protection Laws and Regulations—Deposit Operations. The deposit operations of the Bankare subject to:
• The Electronic Funds Transfer Act and Regulation E issued by the Federal Reserve to implement that act, which governs automatic deposits to and withdrawals from deposit accounts and customers’ rights and liabilities arising from the use of automated teller machines and other electronic banking services;
• The Truth In Savings Act and Regulation DD, requires depository institutions to provide certain account related advertising and account opening disclosures to consumers so that they can meaningfully compare products among depository institutions. Subsequent disclosures must also be provided prior to changing terms or prior to the maturity of certain time accounts;
• Interest on Deposits—Regulation Q prohibits paying interest on demand deposits such as checking accounts, or other deposits having a maturity of seven days or less; and
• The Expedited Funds Availability Act and Regulation CC requires depository institutions to make deposited funds available within certain timeframe, provide disclosures of their funds availability policies, and post notices at ATMs and other places where consumer deposits are taken.
Marketing, Sales and Credit Practices
Unfair or Deceptive Acts or Practices and Regulation AA. These laws prohibit banks from engaging inunfair and deceptive credit practices involving consumer credit transactions. In addition, Section 5(a) of the FTC Act prohibits unfair and deceptive trade practices including, but not limited to misrepresentationin advertising.
Do Not Call/Do Not Fax. The FTC and the FCC’s telemarketing rules prohibit placing telemarketing sales calls to a telephone number on the FTC’s Do Not Call Registry, except where there is an established business relationship or the consumer has given their expressed written authority to call. These rules also require maintenance of company specific Do Not Call lists, and prohibits sending marketing related faxes to consumer or business prospects without their written consent.
CAN-SPAM Act of 2003. CAN-SPAM went into effect on January 1, 2004 preempting most state laws governing the same. It requires senders of commercial electronic messages whose primary purpose is promotion of a commercial product or service, to clearly and conspicuously identify the message as an advertisement or solicitation, include an clear and conspicuous notice to the recipient that they can opt-out of receiving future commercial e-mail messages from the sender, and provide an electronic way for them to exercise that option. It also prohibits certain practices like falsifying header information or using deceptive subject lines.
Mortgage Banking Regulation
The mortgage banking operations of the Company are subject to extensive regulation by federal governmental authorities. The Company’s mortgage operations are also subject to various laws, including those discussed above under the heading “Consumer Protection Laws and Regulations—Loan Operations” and judicial and administrative decisions that, among other things, regulate credit-granting activities, require disclosures to customers, govern secured transactions and establish collection, repossession and claims handling procedures and other trade practices. The Company’s mortgageoperations are also subject to the rules and regulations of the FHA, Freddie Mac, Fannie Mae, Ginnie Mae, HUD and the VA with respect to originating, processing, underwriting, selling, securitizing and servicing mortgage loans.
30
In addition, there are other federal and state statutes and regulations, as well as judicial decisions, affecting such activities. Those rules and regulations, among other things, impose licensing obligations on the Company, establish eligibility criteria for mortgage loans, prohibit discrimination and establishunderwriting guidelines that include provisions for inspections and appraisals, require credit reports on prospective borrowers and fix maximum loan amounts, and with respect to VA loans, fix maximum interest rates. Moreover, lenders such as the Company are required to submit annually to the FHA, Freddie Mac, Fannie Mae, Ginnie Mae and the VA audited financial statements, and each regulatory entity has its own financial requirements. The Company’s mortgage operations also are subject to examination by the FHA, Freddie Mac, Fannie Mae, Ginnie Mae and the VA at all times to assure compliance with applicable regulations, policies and procedures. Many of the aforementioned requirements are designed to protect the interests of consumers, while others protect the owners or insurers of mortgage loans. Failure to comply with these requirements can lead to loss of approved status, termination of servicing contracts without compensation to the servicer, demands for indemnification or loan repurchases, class-action lawsuits and administrative enforcement actions. Such regulatory requirements are subject to change from time to time and may in the future become more restrictive, thereby making compliance more difficult or expensive or otherwise restricting the ability of the Company to conduct its business as such business isnow conducted.
There are various state and local laws and regulations affecting the Company’s mortgage operations. The Company’s mortgage businesses are in possession of licenses in all states in which they do business if such licenses are required and the requirement for such license is not preempted by federal law. Some of the Company’s mortgage loans also may be subject to state usury statutes.
Effect of Governmental Monetary Polices
The Company’s earnings are affected by domestic economic conditions and the monetary and fiscal policies of the United States government and its agencies. The Federal Reserve Bank’s monetary policies have had, and are likely to continue to have, an important impact on the operating results of financial institutions through its power to implement national monetary policy in order, among other things, to curb inflation or combat a recession. The monetary policies of the Federal Reserve Board have major effects upon the levels of bank loans, investments and deposits through its open market operations in United States government securities and through its regulation of the discount rate on borrowings of member banks and the reserve requirements against member bank deposits. Likewise, the monetary policies of the Federal Reserve can dramatically impact the level of overall mortgage industry volumes and the volumes of mortgages produced and servicing prepayments experienced by the Company’s mortgage banking operations. It is not possible to predict the nature or impact of future changes in monetary and fiscal policies.
Transactions with Affiliates Restrictions
The Bank and its subsidiaries are subject to the provisions of Section 23A of the Federal Reserve Act. Section 23A places limits on:
• The amount of loans or extensions of credit to affiliates;
• The amount of investment in affiliates;
• The amount of the purchase of assets from affiliates, except for real and personal property exempted by the Federal Reserve;
• The amount of loans or extensions of credit to third parties collateralized by the securities or obligations of affiliates; and
• The amount of any guarantee, acceptance or letter of credit issued on behalf of an affiliate.
31
For purposes of Section 23A, an “affiliate” generally includes a bank’s parent and all other affiliates, except the bank and its subsidiaries. The aggregate of all of the above transactions is limited in amount, asto any one affiliate, to 10% of a savings bank’s capital and surplus and, as to all affiliates combined, to 20% of a bank’s capital and surplus. In addition to the limitation on the amount of these transactions, each of the above transactions must also meet specified collateral requirements. The Bank and its subsidiaries must also comply with certain provisions designed to avoid the taking of low-quality assets from affiliates.
The Bank and its subsidiaries are also subject to the provisions of Section 23B of the Federal Reserve Act which, among other things, prohibits an institution from engaging in certain transactions with affiliates, including the above types, unless the transactions are on terms substantially the same, or at least as favorable to the institution or its subsidiaries, as those prevailing at the time for comparable transactions with nonaffiliated companies.
The Bank is also subject to restrictions on extensions of credit to its executive officers, directors,certain principal shareholders and their related interests. Generally, these extensions of credit (1) must be made on substantially the same terms, including interest rates and collateral, as those prevailing at the time for comparable transactions with third parties, and (2) must not involve more than the normal risk of repayment or present other unfavorable features.
Proposed Legislation and Regulatory Action
New regulations and statutes are regularly proposed that contain wide-ranging proposals for altering the structures, regulations and competitive relationships of the nation’s financial institutions. TheCompany cannot predict whether or in what form any proposed regulation or statute will be adopted or the extent to which its business may be affected by any new regulation or statute. Legislation that would eliminate the federal savings bank charter is under discussion from time to time. If such legislation isenacted, the Bank would be required to convert its federal savings bank charter to either a national bankcharter or to a state depository institution charter. Various legislative proposals in recent years would have resulted in the restructuring of federal regulatory oversight, including, for example, consolidation of the OTS into another agency, or creation of a new Federal banking agency to replace the various agencies which presently exist. The Company is unable to predict whether such legislation will be enacted or, if enacted, whether it will contain relief as to bad debt deductions previously taken. In addition, certain recent and proposed state and local legislation and regulations designed to protect consumers from predatory lending practices of unscrupulous lenders has had and may continue to have the unintendedconsequence of imposing unrealistic barriers on legitimate lenders’ ability to make mortgage loans and of restricting a consumer’s access to mortgage credit.
Insurance Regulation
NetInsurance and MG Reinsurance are subject to insurance laws and regulations governing their activities in the jurisdictions where they operate.
Risks Relating to NetBank’s Business
Changes in Economic Conditions
NetBank’s business is subject to various business risks, including competition from other financialinstitutions and other mortgage banking companies. Economic conditions affect the consumer’s decision to buy or sell residences as well as the number of residential mortgage loan delinquencies and foreclosures, the value of collateral supporting loan portfolios, administrative costs in evaluating and processing mortgage loan applications, and the cost and availability of funds that lending companies rely upon to make or purchase loans. Changes in the level of consumer confidence, tax laws, real estate values, prevailing interest rates and investment returns expected by the financial community could make mortgage
32
loans of the types originated or purchased by the Company less attractive to borrowers or investors. Competition also may be affected by fluctuations in interest rates and general and local economic conditions.
The Company continues to face the same challenges as other companies within the banking and mortgage banking industries and, therefore, is not immune to significant volume declines, primarily in itsmortgage banking operations, precipitated by changes in interest rates or other factors beyond its control.
Interest Rate Risks
NetBank’s principal businesses are retail banking and the origination and purchase of mortgage loans. These businesses are funded by customer deposits and, to the extent necessary, other borrowed funds. Consequently, a significant portion of NetBank’s assets and liabilities are monetary in nature and fluctuations in interest rates will affect NetBank’s future net interest income and cash flows. Changes in long-term interest rates that do not correlate to changes in short-term interest rates can cause disproportionate changes in the value of NetBank’s interest-earning assets and interest-bearing liabilities or the shrinkage or widening of the spread NetBank expects to earn by holding interest-earning assets. A decrease in the spread would have a negative impact on NetBank’s earnings and cash flow.
Litigation in Mortgage Banking
In recent years, the mortgage banking industry has been subject to class action lawsuits that allegeviolations of federal and state laws and regulations, including the propriety of collecting and paying various fees and charges and the calculation of escrow amounts. Class action lawsuits have been commencedagainst various mortgage banking companies, including the Company, alleging, inter alia, that the payment of certain fees to mortgage brokers violates the anti-kickback provisions of RESPA.
Recent interpretations by HUD together with several subsequent appellate court decisions haveindicated that class actions regarding a lender’s compensation to brokers are inappropriate for resolution of the issue. So far, all of the cases have been resolved favorably for the mortgage banking industry, but if any of these cases are resolved against the lenders, it may cause an industry-wide change in the way independent mortgage brokers are compensated. Such a change could have a material adverse effect on the Company and the entire mortgage lending industry. The Company’s broker compensation and table-funded correspondent purchase programs permit such payments. Although the Company believes these programs comply with all applicable laws and are consistent with long-standing industry practice and regulatory interpretations, in the future new regulatory interpretations or judicial decisions may require the Company to change its broker compensation and table-funded correspondent purchase practices. Class action lawsuits may continue to be filed in the future against the mortgage banking industry generally.
Legislation Regarding Escrow Funds
Certain states require that interest be paid to mortgagors on escrow funds deposited by them to cover mortgage-related payments such as property taxes and insurance premiums. Federal legislation has in the past been introduced that would, if enacted, revise current escrow regulations and establish a uniform interest payment requirement in all states. If such federal legislation were enacted or if additional states enact legislation relating to payment of, or increases in the rate of interest on escrow balances, or if suchlegislation were retroactively applied to loans in the Company’s servicing portfolio, the Company’s earnings would be adversely affected.

33
Delinquency and Default
The Company’s profitability may be negatively impacted by economic downturns because, during such periods, the frequency of loan delinquencies and defaults tends to increase, thereby increasing defaults and loan losses on loans held in portfolio for long-term investment and increasing the cost to service the loansin the Company’s servicing portfolio. Also, the Company is generally at risk for delinquency or default of newly originated or purchased loans. In the case of conventional loans, the Company is generally at risk for any mortgage loan default from origination or purchase by the Company, as the case may be, until the loanis sold (typically less than 90 days). Once the Company sells the loan, the risk of loss from mortgage loandefault and foreclosure generally passes to the purchaser or insurer of the loan. The Company has from the time an FHA or VA mortgage loan is originated or purchased until the first payment is due, a minimum of 31 days, to request insurance or a guarantee certificate from the FHA and the VA, respectively. Once the insurance or the guarantee certificate is issued, the Company has no risk of default or foreclosure except with respect to certain losses related to foreclosures of FHA mortgage loans and losses that exceed the VA’s guarantee limitation.
Moreover, under certain types of servicing contracts, particularly contracts to service loans that have been pooled or securitized, the servicer must advance all or part of the scheduled payments to the owner of the loan, even when loan payments are delinquent. Also, to protect their liens on mortgaged properties, owners of mortgage loans usually require the servicer to advance mortgage and hazard insurance and tax payments on schedule even if sufficient escrow funds are unavailable.
Prior to the liquidation of a loan, the servicer must absorb the cost of funds advanced during the time the advance is outstanding. Further, the servicer must bear the increased costs of attempting to collect on delinquent and defaulted mortgage loans. The servicer generally is reimbursed for such advances ultimately by the mortgage loan owner or from liquidation proceeds. In addition, if a default is not cured, the mortgage loan will be extinguished as a result of foreclosure proceedings, and any servicing income will cease. As a consequence, the Company will forego servicing income from the time such loan becomesdelinquent until it is foreclosed upon or is brought current. The Company maintains a reserve for possible losses at a level considered adequate to provide for known and inherent risks related to foreclosure and disposition losses. The Company’s evaluation of an adequate level of foreclosure reserves considers past loss experience, industry loss experience, geographic and product concentrations, delinquency trends,economic conditions and other relevant factors. The Company uses currently available information to make such evaluation; therefore, future adjustments to the foreclosure reserve will be required as conditions and assumptions are revised in response to changes in trends and the other factors andassumptions relevant to the Company’s evaluation.
With respect to VA loans, the VA guarantees the initial losses on a loan. The guaranteed amountgenerally ranges from 20% to 35% of the original principal balance. Before each foreclosure sale, the VA determines whether to bid to purchase the foreclosed loan by comparing the estimated net sale proceeds to the outstanding principal balance and the servicer’s accumulated reimbursable costs and fees. If this amount is a loss and exceeds the guaranteed amount, the VA typically issues a no-bid and pays the servicer the guaranteed amount. Whenever a no-bid is issued, the servicer absorbs the loss, if any, in excess of the sum of the guaranteed principal and amounts recovered at the foreclosure sale. The Company’s historical delinquency and foreclosure rate experience on VA loans has generally been consistent with that of the industry.
In the case of loans insured by the FHA, the Company will not be reimbursed for certain amounts if foreclosure becomes necessary. Such amounts include interest on the mortgage loan for the first two months subsequent to the loan becoming delinquent and a portion of the costs of foreclosure (generally the unreimbursed amount of such costs is limited to one-third of such costs).

34
Changes in the Market for Mortgage Loans and Mortgage Servicing Rights
Volume of Mortgage Loans Produced. During periods of declining interest rates, the Company typically experiences an increase in loan originations because of increased home purchases and, particularly, increased refinancing activity. Increases in interest rates typically adversely affect refinancing activity, which has an adverse effect on the Company’s origination revenues. For the year ended December 31, 2004, 37% of the Company’s mortgage loan production was attributable to refinancings, compared to 48% during 2003.
Sales of Mortgage Loans. Gains or losses on sales of mortgage loans may result from changes ininterest rates from the time the interest rate on a customer’s mortgage loan application is established to the time the Company sells the loan. At any given time, the Company has committed to sell substantially all of its agency-eligible mortgage loans that are closed and a percentage of the agency-eligible mortgage loans that are not yet closed but for which the interest rate has been established (“rate locks”). To manage the interest rate risk of the Company’s rate locks, the Company continuously projects the percentage of the rate locks it expects to close and, on the basis of such projections, enters into forward sales commitments to sell such loans. To reduce the effect of such interest rate changes, the Company employs a variety of techniques, currently consisting of a combination of mandatory forward sales commitments for mortgage-backed securities and put and call option contracts on U.S. Treasuries.
If interest rates make an unanticipated change, the actual percentage of rate locks that close may differ from the projected percentage. A sudden increase in interest rates can cause a higher percentage of rate locks to close than projected. To the degree that this may not have been anticipated, the Company may not have made forward sales commitments to sell these additional loans and consequently may incur significant losses upon their sale at current market prices, adversely affecting results of operations. Likewise, if a lower percentage of rate locks close than was projected, due to a sudden decrease in interest rates or otherwise; the Company may have committed to sell more than actually close and as a result may incur significant losses in fulfilling these commitments, adversely affecting results of operations. This risk isgreater during times of interest rate volatility.
Value of Mortgage Servicing Rights. The value of the Company’s servicing portfolio may be adversely affected if mortgage interest rates decline and loan refinancings and prepayments increase. In periods of declining interest rates, the economic advantages to borrowers of refinancing their mortgage loans become greater. Increases in the rate of mortgage loan prepayments reduce the period during which the Company receives servicing income from such loans. The Company capitalizes the cost of the acquisition of servicing rights from third parties and capitalizes a value for the servicing rights on loans that it originates. The value of servicing rights is based upon the net present value of estimated future cash flows. If the rate of prepayment of the related loans exceeds the rate assumed by the Company, due to a significant reduction in interest rates or otherwise, the value of the Company’s servicing portfolio will decrease and accelerated amortization of servicing rights or recognition of an impairment provision may become necessary, thereby decreasing earnings. The Company attempts to mitigate these risks with respect to the value of its servicing rights by maintaining a portfolio of interest rate option and other derivative contracts whose value tends to increase in periods of declining interest rates, thus mitigating the decline in value typical during the same period with respect to servicing rights. However, there can be no assurance that the Company’s efforts to mitigate these risks will prevent value loss or impairment provisions.
Sales of Mortgage Servicing Rights. The prices obtained by the Company upon the sale of its mortgage servicing rights depend upon a number of factors, including the general supply of and demand for mortgage servicing rights, as well as prepayment and delinquency rates on the portfolio of mortgage servicing rights being sold. Interest rate changes can affect the ability to sell, or the profitability of a sale of, mortgage servicing rights. Purchasers of mortgage servicing rights analyze a variety of factors, including prepayment sensitivity of loans underlying servicing rights, to determine the purchase price they are willing
35
to pay. Thus, in periods of declining interest rates, sales of mortgage servicing rights related to higher interest rate loans may be less profitable than sales of mortgage servicing rights related to lower interest rate loans because it is possible that the loans bearing higher interest rates will be refinanced. Because these factors are largely beyond the control of the Company, there can be no assurance that the currentlevel of profitability from the sale of mortgage servicing rights will be maintained.
Liabilities Under Representations and Warranties
In the ordinary course of business, the Company makes representations and warranties to the purchasers and insurers of its mortgage loans and the purchasers of mortgage servicing rights regarding compliance with laws, regulations and program standards and as to accuracy of information. Under certain circumstances, the Company may become liable for certain damages or may be required to repurchase a loan if there has been a breach of representations or warranties. The Company generally receives similar representations and warranties from the correspondents from whom it purchases loans. However, in the event of breaches of such representations and warranties, the Company is subject to the risk that a correspondent may not have the financial capacity to repurchase loans when called upon to do so by the Company or otherwise may not respond to demands made by the Company. The Company estimates its liability with respect to such representations and warranties based upon a vintage analysis of repurchases of loans by year of production. Since the Company no longer services the vast majority of loans and servicing sold in prior years, the Company is unable to calculate the amount of loans still outstanding for which such representations and warranties relate. For example, increases or decreases in prepayments of loans and servicing previously sold can have a favorable or unfavorable impact on the amount of representation and warranty claims ultimately asserted. Therefore, there is no assurance that future claims for representations and warranties will be similar to the Company’s experience as depicted in its vintage analysis. See note 19 of the notes to the consolidated financial statements included in this report for additional details regarding the Company’s liabilities under representations and warranties, including the past repurchase and currentreserve information.
Environmental Matters
In the course of its business, through the foreclosure process, the Company has acquired, and may acquire in the future, properties securing loans that are in default. Although the Company lends to owners of residential properties, there is a risk that the Company could be required to investigate and clean uphazardous or toxic substances or chemical releases at such properties after its acquisition and might be held liable to a governmental entity or to third parties for property damage, personal injury and investigation or cleanup costs incurred by such parties in connection with the contamination.
To date, the Company has not been required to perform any investigation or cleanup activities of any material nature, nor has the Company been subject to any environmental claims. No assurance can be given, however, that this will remain the case in the future.
Dependence Upon Independent Mortgage Brokers and Mortgage Bankers
The Company depends largely upon independent mortgage bankers, including smaller mortgage companies and commercial banks, and, to a lesser extent, upon independent mortgage brokers, for its originations and purchases of mortgage loans. Substantially all of the independent mortgage brokers andmortgage bankers with whom the Company does business deal with multiple loan originators for each prospective borrower. Wholesale lenders compete for business based upon pricing, service, loan fees and costs and other factors. The Company’s competitors also seek to establish relationships with the same independent mortgage bankers and mortgage brokers with whom the Company seeks to do business, none of whom is obligated by contract or otherwise to continue to do business with the Company. Future operating and financial results of the Company will be susceptible to fluctuations in the volume and cost of

36
its broker and mortgage banker-sourced loans resulting from, among other things, competition from other purchasers of such loans.
Possible Changes in Accounting Estimates
In preparing the Company’s financial statements, management is required to make estimates based onavailable information that can affect the reported amounts of assets, liabilities and disclosures as of the balance sheet date and revenues and expenses for the related periods. Such estimates relate principally to the Company’s reserves for foreclosure losses and repurchased loans, its reserve for representation and warranty claims for previous sales of loans and mortgage servicing rights, and its allowances for credit losses on its loan and lease receivables. Additionally, estimates concerning the fair values of mortgage loans held for sale, servicing rights, servicing hedges and the Company’s other hedging instruments are all relevant to ensuring that mortgage loans are carried at the lower of cost or market, and that potential impairments of servicing rights are recognized as and if required. Because of the inherent uncertainties associated with any estimation process and due to possible future changes in market and economic conditions that will affect fair values, it is possible that actual future results in realization of the underlying assets and liabilities could differ significantly from the amounts reflected as of the balance sheet date. See the heading “Critical Accounting Policies” in Item 7. “Management’s Discussion and Analysis of Financial Condition and Results of Operations” included in this report.
Federal Programs: Availability of Active Secondary Market
The Company’s ability to generate revenue through sales of mortgage-backed securities is largely dependent upon the continuation of programs administered by Fannie Mae, Freddie Mac and Ginnie Mae, which facilitate the issuance of such securities, as well as the Company’s continued eligibility to participate in such programs. The Company anticipates that it will continue to remain eligible to participate in such programs, but any significant impairment of such eligibility would materially adversely affect its operations. In addition, the mortgage loan products eligible for such programs may be changed from time to time by the sponsor. The profitability of specific types of mortgage loan products may vary depending on a number of factors, including the administrative costs to the Company of originating or purchasing such types of mortgage loans. Proposals are being considered in Congress and by various regulators that would affect the manner in which these agencies conduct their businesses. These proposals include establishing a new independent regulatory authority to regulate these agencies, increasing the authority of the Securities and Exchange Commission over these agencies, and reducing or limiting the benefits these agencies receive from the federal government. In addition, the accounting practices employed by these agencies are being investigated, and to some extent have been alleged to be improper, by various regulatory authorities. These proposals, if enacted, and the results of these investigations could have an adverse impact on these agencies and in turn on the Company’s business.
Employees
At December 31, 2004, NetBank had 2,373 regular employees, substantially all of whom were full-time employees, and 319 contract temporary employees. None of NetBank’s employees are represented by a union. NetBank considers its relations with employees to be good.
Available Information
The Company’s Internet address is www.netbankinc.com. Information can also be accessed via the Bank’s Internet site www.netbank.com. The Company makes its annual reports on Form 10-K, quarterly reports on Form 10-Q, current reports on Form 8-K, and amendments to those reports available free of charge through its Web site as soon as reasonably practicable after they are electronically filed with, or furnished to, the Securities and Exchange Commission.

37
ITEM 2. PROPERTY
The Company leases 48,916 square feet of office space at 11475 Great Oaks Way, Suite 100,Alpharetta, Georgia 30022. This property houses the Company’s Retail Banking operations and corporate headquarters. It is subject to a renewable lease that expires on June 30, 2006. The Company leases 131,181square feet of office space at 9710 Two Notch Road, Columbia, South Carolina 29223 and 59,500 square feet at 7215 Financial Way, Jacksonville, Florida 32256. These properties house the correspondent and wholesale mortgage operations of the Company’s financial intermediary segment. These leases expire onMay 30, 2009 and December 31, 2006, respectively. Meritage leases 44,900 square feet of office space at 6000 S.W. Meadows Road, Suite 500, Lake Oswego, Oregon 97035 and 45,179 square feet at 9300 S.W. Gemini Drive, Suite 100, Beaverton, Oregon 97008. These properties house the majority of nonconformingmortgage operations of the Company’s financial intermediary segment. The properties are subject to renewable leases that expire September 30, 2006 and May 31, 2005, respectively. Market Street leases a facility located at 2650 McCormick Drive, Clearwater, Florida 33759, which houses the headquarters of the retail mortgage operations of the Company’s financial intermediary segment. This property is 36,853square feet and the lease expires on April 30, 2009. NPS leases 13,200 square feet of office space at 5712Briarwood West Drive, Jackson, Mississippi 39286, which houses the operations of the Bank’s ATM andmerchant processing operations. The lease expires on December 31, 2006. The Company leases 12,122square feet of office space at 100 Executive Drive Center, Suite 101, Columbia, SC 29210. This property houses the Bank’s Business Finance division. The lease expires on September 30, 2008. At December 31, 2004, the Bank either utilized or sublet all of its facilities with the exception of 12,933 square feet of space in closed offices.
ITEM 3. LEGAL PROCEEDINGS
Illinois Union Insurance Co. v. Commercial Money Center, Inc., et al., Case No. CV-01-0685-KJD-RJJ(District Court of Nevada) and related cases now pending in In re Commercial Money Center, Inc. EquipmentLease Litigation in the United States District Court for the Northern District of Ohio, Eastern Division, MDL Case No. 1:02-CV-16000, the pending bankruptcy proceedings of Commercial Money Center, Inc. and In reCommercial Money Center, Inc., Debtor (Kipperman v. NetBank, FSB), Bankruptcy No. 02-09721; In the United States Bankruptcy Court for the Southern District of California
As reported in previous filings, NetBank, FSB, filed a complaint in January 2002 against Commercial Money Center, Inc. (“CMC”), the originator, seller, and subservicer of equipment leases purchased by NetBank, FSB, and against Illinois Union Insurance Company (“Illinois Union”), Safeco InsuranceCompany of America (“Safeco”), and Royal Indemnity Company (“Royal,” with Illinois Union, Safeco and Royal, collectively, referred to as the “Sureties”), the insurance companies that issued surety bonds and insurance policies guaranteeing payment of the income stream from the leases and that also served as master servicers of the leases. The NetBank, FSB action alleges several claims, including claims for breach of contract, fraud, and bad faith, and seeks, among other things, payment under and enforcement of surety bonds and insurance policies issued by the insurance and surety companies. The Judicial Panel on Multi-District Litigation has consolidated the actions involving NetBank, FSB with more than 35 other cases pending around the country involving other banks and financial institutions that were seeking to enforce surety bonds and insurance policies relating to leases sold by CMC. All pre-trial activity is currently being held in the United States District Court for the Northern District of Ohio (the “MDL Court”).
As reported in previous filings, NetBank, FSB had joined with the other claimants in a motion for judgment on the pleadings, which motion was filed on January 31, 2003, and is still pending before the MDL Court. Meanwhile, discovery in the case has been proceeding and fact discovery is now complete. Amendments to the pleadings are currently due 14 days after the MDL Court rules on the motions for judgment on the pleadings. NetBank, FSB has prepared an amendment and supplement to its complaint to include additional claims against the Sureties based on discovery adduced and events that have occurred to

38
date and plans to file the amendment prior to the final date fixed by the MDL Court for filingamendments. Furthermore, NetBank, FSB has withdrawn its motion for judgment on the pleadings and now intends to file a motion for summary judgment based in part on such discovery. The Company believes that based on the overall facts and circumstances, the defenses asserted by the Sureties will fail and that NetBank, FSB will ultimately prevail on its claims.
Also, as reported in previous filings, on May 30, 2002, CMC filed for bankruptcy protection. The bankruptcy proceeding is not a part of the consolidation of cases in Ohio. On June 11, 2003, the Bankruptcy Court in California approved an amended settlement agreement (the “NetBank Agreement”) among NetBank, FSB, Lakeland Bank and the Trustee. The NetBank Agreement resolves all claims of the Trustee with respect to the lease payments that were guaranteed by surety bonds and insurance policies issued by Safeco and Illinois Union, as well as all claims related to the surety bonds and insurance policies. In addition to approving the NetBank Agreement, the Bankruptcy Court approved a settlement agreement between the Trustee and Royal (the “Royal Agreement’). Under the Royal Agreement, Royal has agreed, among other things, to fund litigation by the Trustee against NetBank, FSB to avoid its interests in the leases that were guaranteed by surety bonds issued by Royal, as well as NetBank, FSB’s interests in the surety bonds themselves. On September 4, 2003, the Trustee filed a Complaint against NetBank, FSB as contemplated by the Royal Agreement, seeking to avoid NetBank, FSB’s interest in the leases and surety bonds relating to the Royal guaranteed lease pools. On May 6, 2004, NetBank, FSB filed a motion for partial summary judgment against the Trustee. The Trustee filed a motion for partial summary judgment against NetBank, FSB on June 18, 2004.
At a status conference on July 15, 2004, the Bankruptcy Court ordered a stay in the bankruptcy proceedings pending a hearing on July 30, 2004. At that hearing the Bankruptcy Court continued the stay as to all adversary proceedings and requested the parties to attempt to mediate their disputes. At a status conference on October 1, 2004, the Bankruptcy Court lifted the stay of the adversary proceeding against NetBank, FSB. A hearing on NetBank, FSB’s and the Trustee’s motions for partial summary judgment was held on December 14, 2004. On January 27, 2005, the Bankruptcy Court entered its Memorandum Decision granting the Trustee’s motion for partial summary judgment and denying NetBank, FSB’s motion for partial summary judgment. An order to that effect was entered by the Bankruptcy Court on February 28, 2005. NetBank, FSB intends to appeal the decision of the Bankruptcy Court. In the meantime, the parties to the bankruptcy action have continued to mediate and resolve their disputes. Any resolution of disputes in the bankruptcy proceedings would not affect the decision entered by the Bankruptcy Court regarding the motions for partial summary judgment.
NetBank, FSB intends to vigorously pursue its claims against all the Sureties, including claims for any loss associated with the claims brought by the Trustee against NetBank, FSB. At this time, the Company is unable to express an opinion as to the likelihood of loss, or the amount or range of potential loss, with regard to this matter.
Clayton v. Commercial Money Center, Inc., Case No. BC 253169 (CA Sup, Ct., Los Angeles County)
On June 27, 2001, several lessees of equipment leased from CMC filed suit in Los Angeles Superior Court against CMC and several John Doe defendants alleging that the leases violated California usury laws, the California Financial Code, and the California Unfair Business Practices Act. The plaintiff lessees were seeking to rescind or reform their obligations under the leases and were seeking to recover statutory damages and attorney’s fees. The plaintiffs subsequently amended their complaint to name NetBank, FSB, several other investor banks, and several surety companies as co-defendants in the action. After CMC filed for bankruptcy, the action was removed to the bankruptcy court in the Central District of California, but the plaintiffs subsequently agreed to withdraw their claims against CMC and were successful in their motion to remand the case back to state court.

39
On March 15, 2004, the Superior Court sustained demurrers and motions to quash filed by NetBank, FSB and various other defendants on certain of the plaintiffs’ claims. The Superior Court sustained the demurrers under the California Financial Code, without leave to amend. The Superior Court also sustained demurrers on the Unfair Business Practices Act, with leave to amend the claims to add greater specificity to the claims, but without leave to amend as to unnamed representatives of the alleged class of plaintiffs harmed. The Superior Court also granted motions to strike: (1) plaintiffs’ claims under the California Unfair Business Practices Act as to unnamed representative plaintiffs; (2) plaintiffs’ request forrestitution (the named plaintiffs may amend to establish individual entitlement to restitution); (3) plaintiffs’ request for disgorgement; (4) plaintiffs’ request for punitive damages; (5) plaintiffs’ request for compensatory damages under the California Unfair Business Practices Act; and (6) plaintiffs’ request for attorneys’ fees.
On April 29, 2004, the plaintiffs served an amended complaint against NetBank, FSB alleging claims for, among other things, violations of another section of the California Financial Code, unfair competition under Section 17200 of the California Business and Professions Code and usury. On October 26, 2004, the court overruled the defendants’ demurrers to the third amended complaint. However, on December 13,2004, the court issued a stay in the action pending a decision by the appeals court on the plaintiffs’ claims that were dismissed without leave to amend. No discovery has been taken in this case and there will be noother movement on these surviving claims pending the outcome of plaintiffs’ appeal. The Company intends to vigorously defend the amended claims in the Clayton action and to pursue recovery against Safeco Insurance Company, Royal Indemnity Company, and Illinois Union Insurance Company in theCompany’s existing action against them for any damages and costs incurred in this case.
interstate NetBank v. NetBank, Inc. and NetBank, Case No. 1:01-CV-1324(JBS) (District of New Jersey)
On June 27, 2001, the Company was served with a complaint for a declaratory judgment filed by interState NetBank in the District of New Jersey challenging the “NETBANK®” service mark. The Company answered and counterclaimed for trademark infringement on July 13, 2001. Discovery was stayed pending a ruling on interState NetBank’s November 19, 2001 motion for summary judgment, which claimed that “NETBANK” is generic for all banking services delivered over the Internet. On September 22, 2002, the District Court ruled that “NETBANK” is generic for online banking services but did not cancel the Company’s existing service mark registration at that time. The Company filed a motion for reconsideration of the District Court’s decision. On June 23, 2003, the District Court denied the Company’s motion for reconsideration but clarified that two of the Company’s counterclaims remained inthe case: (1) a claim for infringement of the Company’s “NETBANK®” service mark to the extent that it covers online bill-payment services (as opposed to online banking services in general) and (2) a claim for unfair competition under New Jersey law. The parties completed fact discovery on February 27, 2004.
On April 30, 2004, interState NetBank filed a second motion for summary judgment, seeking the dismissal of the remaining two claims brought by NetBank, as well as an award of attorneys’ fees. OnDecember 14, 2004, the District Court granted interState Net Bank’s second motion for summary judgment, dismissing the Company’s claims for infringement and unfair competition. The District Court also canceled the Company’s service mark registration. The District Court did not award interStateNetBank its attorneys’ fees as requested in its motion for summary judgment, finding that the Company litigated its claims in good faith. The Company has decided not to appeal the District Court’s rulings onboth motions for summary judgment.
The Company believes it has built value in the “NetBank” brand. The Court’s ruling does not prohibitthe Company from continuing to use and develop national recognition of the brand. While the Company will not be able to restrict others from using the term “netbank” in a generic sense, the Court’s ruling does not prevent the Company from seeking to block others who unfairly compete through their use of the name “netbank.”
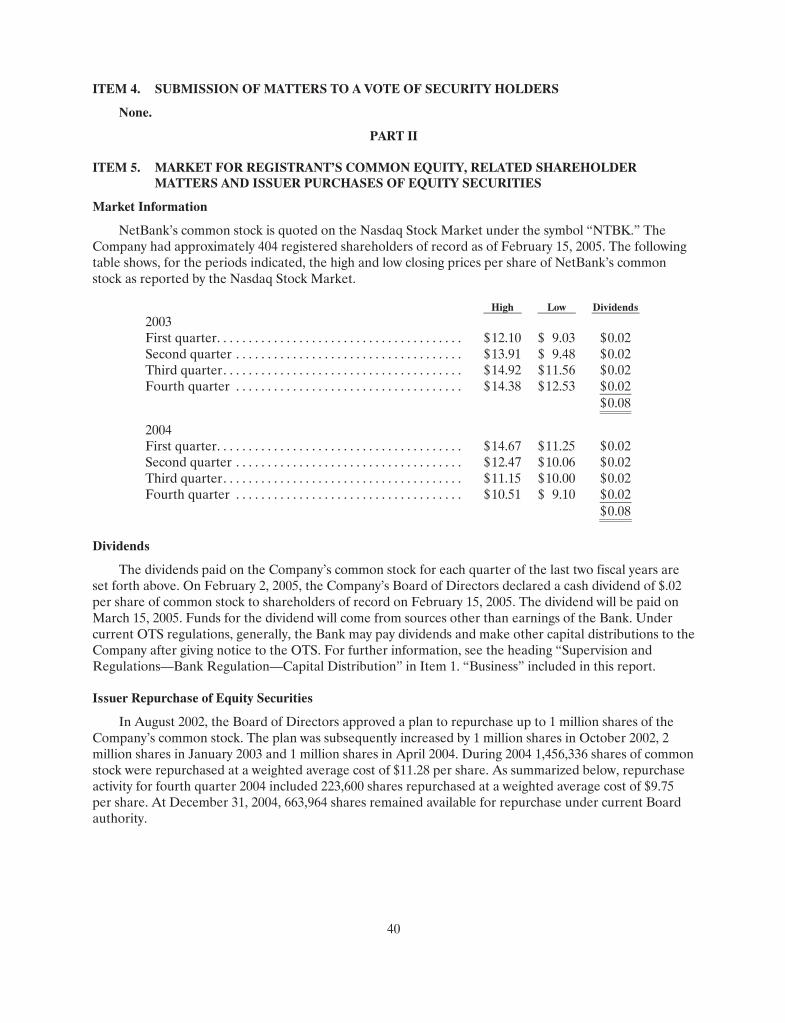
40
ITEM 4. SUBMISSION OF MATTERS TO A VOTE OF SECURITY HOLDERS
None.
PART II
ITEM 5. MARKET FOR REGISTRANT’S COMMON EQUITY, RELATED SHAREHOLDER MATTERS AND ISSUER PURCHASES OF EQUITY SECURITIES
Market Information
NetBank’s common stock is quoted on the Nasdaq Stock Market under the symbol “NTBK.” The Company had approximately 404 registered shareholders of record as of February 15, 2005. The followingtable shows, for the periods indicated, the high and low closing prices per share of NetBank’s common stock as reported by the Nasdaq Stock Market.
High Low Dividends 2003First quarter. . . . . . . . . . . . . . . . . . . . . . . . . . . . . . . . . . . . . . . $12.10 $ 9.03 $ 0.02 Second quarter . . . . . . . . . . . . . . . . . . . . . . . . . . . . . . . . . . . . $13.91 $ 9.48 $ 0.02 Third quarter. . . . . . . . . . . . . . . . . . . . . . . . . . . . . . . . . . . . . . $14.92 $11.56 $ 0.02 Fourth quarter . . . . . . . . . . . . . . . . . . . . . . . . . . . . . . . . . . . . $14.38 $12.53 $ 0.02
$ 0.08
2004First quarter. . . . . . . . . . . . . . . . . . . . . . . . . . . . . . . . . . . . . . . $14.67 $11.25 $ 0.02 Second quarter . . . . . . . . . . . . . . . . . . . . . . . . . . . . . . . . . . . . $12.47 $10.06 $ 0.02 Third quarter. . . . . . . . . . . . . . . . . . . . . . . . . . . . . . . . . . . . . . $11.15 $10.00 $ 0.02 Fourth quarter . . . . . . . . . . . . . . . . . . . . . . . . . . . . . . . . . . . . $10.51 $ 9.10 $ 0.02
$ 0.08
Dividends
The dividends paid on the Company’s common stock for each quarter of the last two fiscal years are set forth above. On February 2, 2005, the Company’s Board of Directors declared a cash dividend of $.02 per share of common stock to shareholders of record on February 15, 2005. The dividend will be paid onMarch 15, 2005. Funds for the dividend will come from sources other than earnings of the Bank. Under current OTS regulations, generally, the Bank may pay dividends and make other capital distributions to theCompany after giving notice to the OTS. For further information, see the heading “Supervision and Regulations—Bank Regulation—Capital Distribution” in Item 1. “Business” included in this report.
Issuer Repurchase of Equity Securities
In August 2002, the Board of Directors approved a plan to repurchase up to 1 million shares of the Company’s common stock. The plan was subsequently increased by 1 million shares in October 2002, 2 million shares in January 2003 and 1 million shares in April 2004. During 2004 1,456,336 shares of common stock were repurchased at a weighted average cost of $11.28 per share. As summarized below, repurchase activity for fourth quarter 2004 included 223,600 shares repurchased at a weighted average cost of $9.75per share. At December 31, 2004, 663,964 shares remained available for repurchase under current Board authority.

41
The following table sets forth information with respect to repurchases by the Company of shares of its common stock during the quarter ended December 31, 2004:
Period Total Number ofShares Purchased
Average PricePaid Per Share
Total Number ofShares Purchased as
Part of Publicly Announced Plans
Maximum Numberof Shares that MayYet Be PurchasedUnder the Plans
Balance as of September 30, 2004 . — — — 887,564 October 1 through October 31,
2004 . . . . . . . . . . . . . . . . . . . . . . . . . 211,200 $9.77 211,200 676,364November 1 through November 30,
2004 . . . . . . . . . . . . . . . . . . . . . . . . . 12,400 $ 9.34 12,400 663,964 December 1 through December 31,
2004 . . . . . . . . . . . . . . . . . . . . . . . . . — $ — — 663,964Total . . . . . . . . . . . . . . . . . . . . . . . . . . 223,600 $9.75 223,600 663,964
Equity Compensation Plan Information
The NetBank, Inc. 1996 Stock Incentive Plan (the “Plan”) was originally adopted by the Board of Directors on November 25, 1996, and approved by the shareholders of the Company on January 10, 1997. Through initial approval and subsequent amendments, as of December 31, 2004, 9,500,000 shares of the Company’s common stock are reserved for issuance pursuant to awards granted under the Plan. As of December 31, 2004, 5,253,833 shares of common stock are subject to outstanding Stock Incentives granted under the Plan. The committee appointed by the Board of Directors has not yet made any determinationas to which eligible participants will be granted Stock Incentives under the Plan in the future.
The following table provides information regarding compensation plans under which equity securities of the Company are authorized for issuance. The following data is presented as of December 31, 2004.
(a) (b) (c)
Plan Category
Number of Securities ToBe Issued Upon Exerciseof Outstanding Options,
Warrants and Rights
Weighted-AverageExercise Price of
Outstanding Options,Warrants and Rights
Number of Securities Remaining Available forFuture Issuance Under
Equity Compensation Plans(Excluding Securities
Reflected in Column (a) Equity Compensation Plans
Approved by Security Holders: 1996 Stock Incentive Plan . . . . . . . . 5,253,833 $11.27 2,248,704Employee Stock Purchase Plan. . . . N/A N/A 747,491 Equity Compensation Plans Not
Approved by Security Holders: None . . . . . . . . . . . . . . . . . . . . . . . . . . N/A N/A N/ATOTAL. . . . . . . . . . . . . . . . . . . . . . . . 5,253,833 $11.27 2,996,195
See note 14 of the notes to the consolidated financial statements included in this report for additional details regarding stock options.
Recent Sales of Unregistered Securities
On July 1, 2004, the Company acquired the principal operating assets of Beacon Credit Services, LLC (“Beacon”), a privately held provider of RV, boat and personal aircraft financing. The consideration paid consisted of 194,217 shares of the Company’s common stock and cash of $4,952,289. The shares of the Company’s common stock were issued to Beacon’s three members in private placement pursuant to Section 4(2) of the Securities Act of 1933, as amended (the “Securities Act”), and the issuance wastherefore exempt from the registration requirements of Section 5 of the Securities Act.
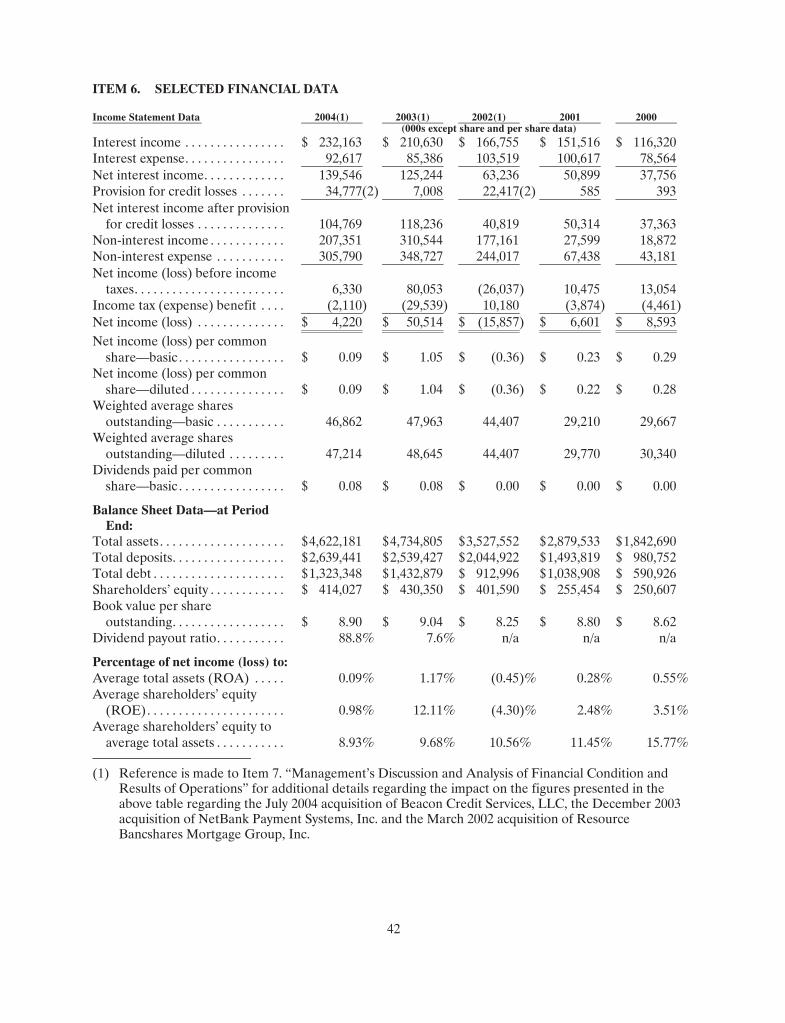
42
ITEM 6. SELECTED FINANCIAL DATA
Income Statement Data 2004(1) 2003(1) 2002(1) 2001 2000(000s except share and per share data)
Interest income . . . . . . . . . . . . . . . . $ 232,163 $ 210,630 $ 166,755 $ 151,516 $ 116,320Interest expense. . . . . . . . . . . . . . . . 92,617 85,386 103,519 100,617 78,564Net interest income. . . . . . . . . . . . . 139,546 125,244 63,236 50,899 37,756Provision for credit losses . . . . . . . 34,777(2) 7,008 22,417(2) 585 393Net interest income after provision
for credit losses . . . . . . . . . . . . . . 104,769 118,236 40,819 50,314 37,363Non-interest income . . . . . . . . . . . . 207,351 310,544 177,161 27,599 18,872Non-interest expense . . . . . . . . . . . 305,790 348,727 244,017 67,438 43,181Net income (loss) before income
taxes. . . . . . . . . . . . . . . . . . . . . . . . 6,330 80,053 (26,037) 10,475 13,054Income tax (expense) benefit . . . . (2,110) (29,539) 10,180 (3,874) (4,461)Net income (loss) . . . . . . . . . . . . . . $ 4,220 $ 50,514 $ (15,857) $ 6,601 $ 8,593Net income (loss) per common
share—basic . . . . . . . . . . . . . . . . . $ 0.09 $ 1.05 $ (0.36) $ 0.23 $ 0.29 Net income (loss) per common
share—diluted . . . . . . . . . . . . . . . $ 0.09 $ 1.04 $ (0.36) $ 0.22 $ 0.28Weighted average shares
outstanding—basic . . . . . . . . . . . 46,862 47,963 44,407 29,210 29,667Weighted average shares
outstanding—diluted . . . . . . . . . 47,214 48,645 44,407 29,770 30,340Dividends paid per common
share—basic . . . . . . . . . . . . . . . . . $ 0.08 $ 0.08 $ 0.00 $ 0.00 $ 0.00
Balance Sheet Data—at PeriodEnd:
Total assets . . . . . . . . . . . . . . . . . . . . $ 4,622,181 $ 4,734,805 $ 3,527,552 $ 2,879,533 $ 1,842,690Total deposits. . . . . . . . . . . . . . . . . . $ 2,639,441 $ 2,539,427 $ 2,044,922 $ 1,493,819 $ 980,752Total debt . . . . . . . . . . . . . . . . . . . . . $ 1,323,348 $ 1,432,879 $ 912,996 $ 1,038,908 $ 590,926Shareholders’ equity . . . . . . . . . . . . $ 414,027 $ 430,350 $ 401,590 $ 255,454 $ 250,607Book value per share
outstanding. . . . . . . . . . . . . . . . . . $ 8.90 $ 9.04 $ 8.25 $ 8.80 $ 8.62Dividend payout ratio. . . . . . . . . . . 88.8% 7.6% n/a n/a n/a
Percentage of net income (loss) to: Average total assets (ROA) . . . . . 0.09% 1.17% (0.45)% 0.28% 0.55%Average shareholders’ equity
(ROE). . . . . . . . . . . . . . . . . . . . . . 0.98% 12.11% (4.30)% 2.48 % 3.51%Average shareholders’ equity to
average total assets . . . . . . . . . . . 8.93% 9.68% 10.56% 11.45 % 15.77%
(1) Reference is made to Item 7. “Management’s Discussion and Analysis of Financial Condition and Results of Operations” for additional details regarding the impact on the figures presented in the above table regarding the July 2004 acquisition of Beacon Credit Services, LLC, the December 2003 acquisition of NetBank Payment Systems, Inc. and the March 2002 acquisition of Resource Bancshares Mortgage Group, Inc.

43
(2) The increase in provision expense during 2002 and 2004 is principally a result of non-performing leases in the Company’s CMC lease portfolio. See Item 3. “Legal Proceedings” and notes 5 and 6 of the notes to the consolidated financial statements included in this report for additional details.
ITEM 7. Management’s Discussion and Analysis of Financial Condition and Results of Operations
The following discussion may include forward-looking statements. Forward-looking statements regarding the intent, belief or current expectations of NetBank, Inc. or its officers and directors can be identified by the use of forward-looking terms such as “may,” “will,” “should,” “believe,” “expect,” “anticipate,” “estimate,” “continue,” or other comparable terminology. Various internal and external factors could cause the Company’s actual results to differ materially from those anticipated by the forward-looking statements. These factors include, but are in no way limited to, 1) the evolving nature of the market for Internet banking and financial services generally; 2) the public’s perception of the Internet as a secure, reliable channel for transactions; 3) thesuccess of new products and lines of business considered critical to the Company’s long-term strategy, such as small business banking and transaction processing services; 4) potential difficulties in integrating the Company’s operations across its multiple lines of business; 5) the cyclical nature of the mortgage banking industry generally; 6) a possible decline in asset quality; 7) the possible adverse effects of unexpected changes in the interest rate environment; 8) adverse legal rulings, particularly in the Company’s litigation over leases originated by the Commercial Money Center, Inc.; and/or 9) increased competition and regulatory changes. Item 1.”Business” ofthis 10-K filing includes additional information on these risks and others that have the potential to impact the Company in a material way. All forward-looking statements in this report are based on information available at the time of filing. The Company has no obligation to update any forward-looking statement included herein. Forward-looking statements are made in reliance upon the safe harbor provisions of Section 27A of the Securities Act of 1933, as amended, and Section 21E of the Securities Exchange Act of 1934, as amended.
General
NetBank, Inc. is a financial holding company engaged primarily in retail banking, mortgage banking, business finance and providing ATM and merchant processing services. NetBank, Inc. wholly owns the outstanding stock of NetBank (“NetBank, FSB” or “the Bank”), a federal savings bank; MG ReinsuranceCompany (“MG Reinsurance”), a captive reinsurance company; NetInsurance, Inc. (“NetInsurance”), a licensed insurance agency; and NB Partners, Inc., a corporation involved in strategic partnering opportunities. NB Partners, Inc. owns all of the outstanding stock of Financial Technologies, Inc., acorporation formed in 2004 to market transaction processing services to other financial services companies.NetBank, FSB owns all of the outstanding stock of Market Street Mortgage Corporation (“Market Street”), a retail mortgage company, NetBank Payment Systems, Inc. (“NPS”), a provider of ATM and merchant processing services for retail and other non-bank businesses and Meritage MortgageCorporation (“Meritage”), a wholesale non-conforming mortgage provider. The consolidated company is referred to herein as “we,” “our,” “NetBank,” or “the Company”.
During the third quarter of 2004, Resource Bancshares Mortgage Group, Inc. (“Resource”) and Republic Leasing Company, Inc., both of which had been subsidiaries of NetBank, FSB, were legally consolidated into NetBank, FSB and ceased to exist as separate corporations. Republic Leasing Company, Inc. now operates as the NetBank Business Finance division of NetBank, FSB. In addition, during the fourth quarter of 2004, RBMG, Inc., formerly a subsidiary of NetBank, FSB, was legally consolidated into NetBank, FSB and ceased to exist as a separate corporation. RBMG, Inc. now operates as the NetBank Funding division of NetBank, FSB.
All dollar figures are presented in thousands (000s), except per share data, unless otherwise noted.Net income per share is presented on a diluted basis. All of NetBank’s operations and assets are located within the United States.

44
Executive Summary
Net income for the year ended December 31, 2004 was $4,220 or $0.09 per share, compared to net income of $50,514 or $1.04 per share, for 2003. During 2004, NetBank recorded a $29,000 provision for loss on its investment in leases originated by CMC. In the absence of such charge, reported earnings and earnings per share would have been $22,200 and $0.47, respectively. See Item 3. “Legal Proceedings” and the heading “Material Pending litigation” below and notes 5 and 6 of the notes to the consolidated financial statements included in this report for additional details regarding the Company’s loan and lease receivables, including its investment in the CMC lease portfolio, the associated litigation and the associated allowance for credit losses.
NetBank’s management capitalized on the favorable interest rate environment in 2003 to post strong revenues from its financial intermediary segment. In contrast, rising interest rates and interest rate volatility during 2004 adversely affected the results reported from the financial intermediary segment. Mortgage production within the financial intermediary segment dropped from $18.9 billion to $13.6 billion, while sales of mortgages dropped from $18.3 billion to $14.1 billion comparing 2003 to 2004, respectively. NetBank also experienced pressure on its margins in the financial intermediary segment from increasingcompetition, especially in the correspondent channel. The financial intermediary segment’s pre-tax income, as a result, went from $158,079 in 2003 to $23,241 in 2004.
As a result of the potential volatility in its financial intermediary segment, NetBank announced in2002 its intention to diversify its sources of revenue. It set a long-term goal of achieving an equal balance of earnings between its retail banking, financial intermediary and transaction processing segments. Althoughthe volatility in the financial intermediary segment manifested itself during 2004, resulting in reduced earnings on a consolidated basis, the company made significant progress in growing the earnings and earnings capabilities of the other two segments.
During 2002 and 2003, the retail banking segment implemented a number of strategies to improve earnings. It restructured its portfolio of assets away from higher to lower risk loans. It prepaid a large number of higher costing, term FHLB advances. It became a warehouse bank for the financialintermediary segment, and it commenced hedging a portion of the interest rate risk of its servicing assets on balance sheet with agency mortgage-backed securities held available for sale. As a result, the retail banking segment’s pre-tax results improved by $49,942 to $(11,076) for the year ended December 31, 2004 compared with the same period in 2003. In the absence of the $29,000 provision on the leases acquired from CMC, the reported improvement would have been $78,942.
The transaction processing segment reported an improvement in pre-tax earnings of $6,308. This resulted from improved expense control and an increase in average loans serviced by its servicing operations. Likewise, the acquisition of NPS late in 2003 added $1,977 of pre-tax earnings to the transaction processing segment’s results for 2004.
Future Outlook
The Company is excited about the progress that it has made in becoming a premier provider of financial products and services to its targeted market segments. NetBank’s strategy is multi-faceted, involving:
Retail Banking. NetBank, FSB operates as an FDIC-insured, federally chartered thrift institution that currently serves over 160,000 customers throughout the United States and in more than 80 foreigncountries. NetBank, FSB operates a totally branchless model and passes on a portion of the cost savings to its customers in the form of attractive yields on deposits. NetBank, FSB’s array of products and services are available to its customers 24 hours per day, seven days a week, and all 365 days during the year.

45
Financial Intermediary. Through its mortgage banking operations, the Company serves as anintermediary between consumers and institutional investors. The Company obtains mortgage loans by originating loans directly with consumers or through brokers or by buying closed loans from a network of correspondent banks, thrifts and independent mortgage companies. The majority of these loans are held for sale on the Company’s balance sheet prior to delivery into the secondary market. The Company thus earns a long-term yield, on an asset held short-term, and also earns origination and servicing revenues and gains on the sale of the mortgages or resulting mortgage-backed securities.
Transaction Processing. The following summarizes NetBank’s transaction processing initiatives:
• NetBank runs a servicing factory that services over 120,000 loans for internal and external customers.
• Late in 2003, the Company expanded its transaction processing capabilities by acquiring NPS. NPS is one of the top five providers of ATM services for retail and non-bank businesses, and NetBankhas the 2nd largest bank ATM network in the country. At December 31, 2004, through organic growth and acquisition, NPS serviced approximately 8,000 ATM machines and 2,600 merchant processing terminals.
• �Check 21” legislation was passed by Congress in the fall of 2003, and it became effective onOctober 28, 2004. Banks may now clear checks through substitutes such as digital images. The checks may be truncated, customers may be provided images of checks, and banks may exchange data instead of physical checks. NetBank has built a new processing engine that can do ACH and Check 21 clearing. NetBank plans to offer these payment processing services to community banks. NetBank already offers mortgage processing services to community banks.
Late in 2002, NetBank announced its strategy to diversify its earnings so that one third of its earnings are provided by each of its principal operating segments: retail banking, financial intermediary and transaction processing. The following summarizes pre-tax income by segment for the years ended December 31, 2003 and 2004. The retail banking segment results for 2004 includes a $29.0 millionprovision for credit losses on its CMC lease portfolio as discussed below.
Retail banking
Financialintermediary
Transactionprocessing
Other / eliminations Total
2003. . . . . . . . . . . . . . . . . $ (61,018) $158,079 $ (3,984) $ (13,024 ) $ 80,0532004. . . . . . . . . . . . . . . . . $(11,076) $ 23,241 $ 2,324 $ (8,159 ) $ 6,330
Absent the $29 million charge for CMC, the retail banking segment would have contributed $17,924of pre-tax income.
NetBank is pleased with the progress made in 2004 in expanding its earnings from its retail banking and transaction processing segments.
NetBank believes that its deposit base will continue to grow as Internet usage and Internet-basedcommerce grow. NetBank believes that it can continue to invest those deposits profitably in mortgage loans held temporarily for sale and loans held for investment. NetBank also believes that its non-interest earnings in the form of fees and gain on sale resulting from its financial intermediary and transaction processing activities will provide a better diversity of earnings than the traditional banking model.
While NetBank is optimistic about its short- and long-term prospects, the following should be considered in evaluating its earnings and growth outlook.
Volatility of Mortgage Banking Income. All of NetBank’s earnings in 2003 came from its financial intermediary segment. Mortgage interest rates during 2003 were at historically low levels. This prompted

46
refinance and home purchase mortgage volumes to grow to the highest levels in history. Total mortgage industry production volumes were just under $3.8 trillion for 2003. Interest rates began climbing during thethird quarter of 2003, and mortgage banking industry production volumes dropped to an estimated $2.852 trillion during 2004. As volumes dropped, competitive pressures heated up resulting in a drop in gain on sale margins in 2004 compared with 2003. The Mortgage Bankers Association of America’s forecast calls for total mortgage production of just over $2.542 trillion for 2005, representing an 11% drop in volume from 2004. Although the Company believes that its offerings of adjustable rate products and non-conforming loan products will soften some of the impact of declines in available volume, there can be noassurance that the Company will be able to sustain current levels of production volumes. Likewise, there isno assurance that the current competitive pressures will subside. The following summarizes some of the major potential threats and opportunities of this reduced volume scenario:
• Total production volume could decline, resulting in less net interest margin on loans held for sale, less gain on sale, and less production-related fee revenue.
• Gain on sale margins could remain at present levels or drift even lower due to increased competition for available mortgage application volume.
• Production costs per unit could rise as the result of a reduction in leverage gained on fixed costs(fixed costs are spread over a smaller number of units).
This impact may be offset, in part, by the following additional potential effects of the rising rate environment:
• The value of servicing rights could increase as actual and forecasted prepayments go down. Although these assets are carried at the lower of cost or market, accounting rules allow for the reversal of previously provided reserves for impairment. At December 31, 2004, such reserves aggregated $65.6 million. Servicing hedge values would go down, offsetting a portion of the reserverecovery.
• With reduced prepayments, servicing revenues would improve.
• The Company could elect to take a portion of existing excess liquidity and liquidity freed up by the reduced loan production volume and invest in additional interest-earning assets at the, then, higher interest rates.
Material Pending Litigation. As discussed in note 19 of the notes to the consolidated financialstatements included in this report, the Company is involved in litigation with three insurance companies who are sureties on some of NetBank, FSB’s commercial lease portfolios. NetBank, FSB has filed a claim for payments that are currently past due. During 2004, in response to settlements between the sureties and other holders of CMC leases, NetBank recorded an additional $29.0 million in allowance for credit losses and wrote its carrying value on the CMC leases down by $50.2 million resulting in a remaining balance of $31.5 million. The entire portfolio is on non-accrual status. The discovery stage of the lawsuits against the sureties is now essentially complete. Although the Company believes that its case against the insurance companies is strong, there is no assurance that the suit will ultimately be decided in NetBank, FSB’s favor nor is there any assurance as to the length of time it may take the Company to prevail. The following summarizes the material impact some of the possible outcomes could have on the results of the Company’s operations for 2005 and beyond:
• A victory in the action or favorable settlement could result in the Company being able to recover a portion of its CMC lease receivables charged off in 2004;
• A loss in the litigation or adverse settlement could result in the Company recording additional provisions for loss on these assets and the continuation of non-accrual status;

47
• Prolonged litigation could result in the continuation of non-accrual status, continued payment of large legal fees, and the potential for recording additional provisions for losses on these assets in the future.
Acquisitions. As described in note 2 of the notes to the consolidated financial statements included in this report, during 2004 NetBank expanded its ATM and merchant processing business by acquiring smaller processors or service contracts; expanded its retail mortgage origination operations by acquiring 19 branches of Guaranty Residential Lending, Inc.; and acquired the operating assets of Beacon Credit Services, LLC. The Company does not expect to acquire a business that would be considered material (i.e.20% of pre-tax income, total assets or total shareholders’ equity) in the near future; however, NetBank will continue to pursue strategic acquisitions such as these which fit into its long-term strategy of diversifying itsearnings by expanding its less cyclical revenue generating operations.
Financial Condition
General. NetBank’s assets totaled $4,622,181 at December 31, 2004, a decrease of $112,624 or 2% from December 31, 2003. This decrease is primarily due to the following factors. First, as a result of a higher interest rate environment, loans produced for sale by the Financial Intermediary segment wentdown. This resulted in a reduction in loans held for sale of $777,334 when comparing the balances at December 31, 2004 and 2003. This reduction was offset by an increase in loan and lease receivables and anincrease in investment securities available for sale. Investment securities available for sale increased as a result of purchases of U. S. Government agency securities related to an economic hedge of the Company’s investment in mortgage servicing rights.
Liabilities shrank by $96,756 related primarily to a reduction in unsettled trades year over year. The increase in deposits of $100,014 was offset by a reduction in other borrowed funds of $109,531.
Investment Securities. In 2004, the Company began a program of hedging on the balance sheet, from an economic standpoint, a portion of the prepayment risk associated with its mortgage servicing rights. That program involves acquiring mortgage-backed securities by entering into TBA trades and subsequently taking delivery of the resulting securities on respective agency settlement dates. The increase in investment securities from December 31, 2003 to December 31, 2004, relates primarily to U. S. Government agency mortgage-backed securities acquired pursuant to this hedging strategy.
The following tables set forth certain information relating to the Company’s available for sale securities:
As of December 31, 2004Amortized
cost Unrealized
gains Unrealized
losses Estimated fair value
U.S. government agencies—MBS . . . . . $574,495 $ — $3,205 $571,290Collateralized mortgage obligations . . . 31,572 108 87 31,593U.S. treasuries . . . . . . . . . . . . . . . . . . . . . . 53,177 865 87 53,955Corporate bonds . . . . . . . . . . . . . . . . . . . . 39,150 609 218 39,541Habitat bonds and other . . . . . . . . . . . . . 3,733 183 — 3,916Total . . . . . . . . . . . . . . . . . . . . . . . . . . . . . . $702,127 $1,765 $3,597 $700,295

48
As of December 31, 2003Amortized
cost Unrealized
gains Unrealized
losses Estimated fair value
U.S. government agencies—MBS . . . . $191,492 $1,243 $114 $192,621Collateralized mortgage obligations . . 1,356 108 — 1,464 U.S. government agencies—bonds . . . 224,435 2,743 — 227,178 Corporate bonds . . . . . . . . . . . . . . . . . . . 29,094 411 187 29,318Habitat bonds and other . . . . . . . . . . . . 3,595 172 — 3,767Total . . . . . . . . . . . . . . . . . . . . . . . . . . . . . $449,972 $ 4,677 $ 301 $454,348
As of December 31, 2002Amortized
cost Unrealized
gains Unrealized
losses Estimated fair value
U.S. government agencies—MBS . . . . $121,868 $ 3,222 $ — $125,090Collateralized mortgage obligations . . 8,774 159 9 8,924 U.S. government agencies—bonds . . . 493,159 15,079 — 508,238 Corporate bonds . . . . . . . . . . . . . . . . . . . 9,679 — 971 8,708Habitat bonds and other . . . . . . . . . . . . 3,511 248 — 3,759Total . . . . . . . . . . . . . . . . . . . . . . . . . . . . . $636,991 $ 18,708 $ 980 $654,719
No individual security has had an unrealized loss that has persisted for more than 12 continuous months. Management has reviewed the investment security portfolio and has determined that no security with an unrealized loss is other than temporarily impaired.
Reference is made to note 4 of the notes to the consolidated financial statements within this report for additional details regarding the maturity, duration of unrealized losses and weighted average interest rate of the Company’s investment securities available for sale portfolio.
Loans Held for Sale. For the year ended December 31, 2004, loans held for sale, which consist primarily of mortgage loans, declined by $777,334 to $1,173,779 compared to $1,951,113 as of December 31, 2003. This large decline is the result of declining production volumes during 2004. Industry-wide production of mortgages decreased during 2004 primarily as a result of an increase in long-term mortgage interest rates and generally softer demand following record mortgage production levels in 2003.
Loan and Lease Receivables For the year ended December 31, 2004, the loan and lease receivables portfolio increased $334,460 million or 19%. Loan and lease receivables increased as a result of selectively retaining originated loans and leases. During 2004, NetBank retained $750,342 of internally originated mortgage loans (primarily adjustable rate mortgages), $87,637 of HELOCs, $384,523 of internally originated auto loans and $175,669 of originated business finance loans and leases. The retention of these internally originated assets was offset, in part, by the sale of $346,039 of mortgage loans and normal principal reductions and prepayments.

49
The following is a summary of NetBank’s loan and lease receivables as of December 31:
2004 2003 2002 2001 2000Amount % Amount % Amount % Amount % Amount %
First mortgages . . . . . . . . $ 1,081,676 51.0 % $ 1,186,565 65.8% $ 318,584 34.1% $ 381,853 25.2% $ 489,351 35.5%Second mortgages. . . . . . 170,993 8.1 % 123,124 6.7% 226,536 24.2% 595,915 39.5% 373,989 27.2%Leases . . . . . . . . . . . . . . . 356,016 16.8 % 349,952 19.4% 305,276 32.7% 150,918 10.0% 104,743 7.6%Auto . . . . . . . . . . . . . . . . 391,934 18.5 % 92,724 5.2% 9 0.0% 211 0.0% 1,018 0.1%Home equity lines . . . . . . 115,068 5.4 % 50,816 2.8% 82,051 8.8% 140,806 9.3% 243,657 17.7%Consumer . . . . . . . . . . . . 4,607 0.2 % 1,880 0.1% 2,025 0.2% 10,747 0.7% 2,404 0.2%Construction . . . . . . . . . . — 0.0 % — 0.0% 188 0.0% 197 0.0% 1,533 0.1%Commercial mortgages. . — 0.0 % — 0.0% — 0.0% 231,739 15.3 % 160,510 11.6%Total . . . . . . . . . . . . . . . . 2,120,294 100.0 % 1,805,061 100.0% 934,669 100.0% 1,512,386 100.0% 1,377,205 100.0%Less allowance for credit
losses . . . . . . . . . . . . . . (24,462) (43,689) (42,576) (22,865) (13,421)Total . . . . . . . . . . . . . . . . $ 2,095,832 $ 1,761,372 $ 892,093 $ 1,489,521 $ 1,363,784
The following table sets forth certain information regarding the contractual maturity of NetBank’s loan and lease receivables portfolio. Loans or leases having no stated schedule of repayments and no stated maturity are reported as due in one year or less. The table include prepayment assumptions based on current market conditions.
Due 1 year or less
Due 1-5 years
Due after
5 years Total First mortgages . . . . . . . . . . . . . . . . . $414,537 $563,343 $ 103,796 $1,081,676Second mortgages. . . . . . . . . . . . . . . 36,566 77,863 56,564 170,993Leases . . . . . . . . . . . . . . . . . . . . . . . . . 76,220 279,796 — 356,016Auto . . . . . . . . . . . . . . . . . . . . . . . . . . 129,323 262,611 — 391,934Home equity lines. . . . . . . . . . . . . . . 39,869 63,215 11,984 115,068Consumer. . . . . . . . . . . . . . . . . . . . . . 4,607 — — 4,607Total . . . . . . . . . . . . . . . . . . . . . . . . . . $143,554 $434,330 $1,542,410 $2,120,294
The following table segregates the Company’s loan and lease receivables by fixed and floating interest rates as of December 31, 2004:
Fixed rate Floating rate TotalFirst mortgages . . . . . . . . . . . . . . . . . . . . . . . . . . . . . . . . . . . . . . . . . . . . . $ 20,572 $1,061,104 $1,081,676Second mortgages . . . . . . . . . . . . . . . . . . . . . . . . . . . . . . . . . . . . . . . . . . . 169,078 1,915 170,993Leases . . . . . . . . . . . . . . . . . . . . . . . . . . . . . . . . . . . . . . . . . . . . . . . . . . . . . 356,016 — 356,016Auto. . . . . . . . . . . . . . . . . . . . . . . . . . . . . . . . . . . . . . . . . . . . . . . . . . . . . . . 391,934 — 391,934Home equity lines . . . . . . . . . . . . . . . . . . . . . . . . . . . . . . . . . . . . . . . . . . . — 115,068 115,068Consumer . . . . . . . . . . . . . . . . . . . . . . . . . . . . . . . . . . . . . . . . . . . . . . . . . . 429 4,178 4,607Total . . . . . . . . . . . . . . . . . . . . . . . . . . . . . . . . . . . . . . . . . . . . . . . . . . . . . . $938,029 $1,182,265 $2,120,294

50
The following is a summary of the allocation of the allowance for credit losses for the years ended December 31:
2004 2003 2002 2001 2000 Amount % Amount % Amount % Amount % Amount %
First mortgages . . . $ 3,842 15.7 % $ 3,801 8.7% $ 1,177 2.8% $ 2,583 11.3 % $ 1,913 14.2%Second mortgages . 4,451 18.2 % 6,286 14.4% 9,287 21.8% 11,880 52.0 % 5,553 41.4%Leases . . . . . . . . . . 13,146 53.7 % 31,657 72.5% 30,237 71.0% 3,331 14.6 % 1,359 10.1%Auto . . . . . . . . . . . . 1,593 6.5 % 1,054 2.4% — 0.0% 16 0.1 % 21 0.2%Home equity lines . 1,334 5.5 % 829 1.9% 1,659 3.9% 1,714 7.5 % 2,703 20.1%Consumer . . . . . . . 96 0.4 % 62 0.1% 216 0.5% 50 0.1 % 118 0.9%Commercial
mortgages. . . . . . — 0.0% — 0.0% — 0.0% 3,291 14.4 % 1,754 13.1%Total. . . . . . . . . . . . $24,462 100.0 % $ 43,689 100.0% $ 42,576 100.0% $ 22,865 100.0 % $ 13,421 100.0%
The following table details NetBank’s non-accrual and troubled debt restructurings:
As of December 31, 2004 2003 2002 2001 2000
Loan and lease receivables(1). . . . . . . . . . . . . . . . . . . . . . . $37,045 $87,228 $87,025 $3,195 $979Loans held for sale(1). . . . . . . . . . . . . . . . . . . . . . . . . . . . . . $36,633 $46,409 $39,351 $ — $ —Troubled debt restructurings(2) . . . . . . . . . . . . . . . . . . . . . $ 210 $ 5,309 $ — $ — $ —
(1) As more fully described in note 3 of the notes to the consolidated financial statements included in this report, all loans and leases over 90 days contractually past due are placed on non-accrual status.
(2) Includes only those troubled debt restructurings which were less than 90 days past due as of the periods reported. Troubled debt restructurings over 90 days past due have been included in the non-accrual categories.

51
The following is a summary of the allowance for credit losses for the years ended December 31:
2004 2003 2002 2001 2000Beginning balance . . . . . . . . . . . . $ 43,689 $ 42,576 $ 22,865 $ 13,421 $ 7,597 Allowance recorded in
connection with the purchaseof loan pools . . . . . . . . . . . . . . . — — 7,257 11,456 7,270
Provision for credit losses . . . . . . 34,777 7,008 22,417 585 393 Allowance acquired in
connection with acquisition of Resource . . . . . . . . . . . . . . . . . . — — 1,828 — —
Allowance transferred to held for sale . . . . . . . . . . . . . . . . . . . . — — (3,270) — —
Charge-offs:First mortgages . . . . . . . . . . . . . (26) — (1) — — Second mortgages . . . . . . . . . . (734) (1,486) (6,125) (1,384) (1,237 ) Leases. . . . . . . . . . . . . . . . . . . . . (54,019) (5,775) (3,190) (15) (3 ) Home equity lines. . . . . . . . . . . (469) (557) (555) (1,307) (551 ) Consumer . . . . . . . . . . . . . . . . . (101) (236) (270) (69) (132 ) Auto . . . . . . . . . . . . . . . . . . . . . . (2,744) (124) (116) (62) (82 )
Total charge-offs . . . . . . . . . (58,093) (8,178) (10,257) (2,837) (2,005 ) Recoveries:
First mortgages . . . . . . . . . . . . . — — — — — Second mortgages . . . . . . . . . . 385 165 65 148 91 Leases. . . . . . . . . . . . . . . . . . . . . 2,305 1,909 1,387 — — Home equity lines. . . . . . . . . . . 190 162 258 90 49 Consumer . . . . . . . . . . . . . . . . . — 3 25 — 26 Auto . . . . . . . . . . . . . . . . . . . . . . 1,209 44 1 2 —
Total recoveries . . . . . . . . . . 4,089 2,283 1,736 240 166 Total charge-offs, net. . . . . . (54,004) (5,895) (8,521) (2,597) (1,839 )
Ending balance . . . . . . . . . . . . . . . $ 24,462 $ 43,689 $ 42,576 $ 22,865 $ 13,421Allowance for credit losses as a
percentage of average loanand lease receivables . . . . . . . . 1.17% 3.43% 3.26% 1.65 % 1.18 %
The tables above include a provision of $20,102 in 2002 related to the CMC lease portfolio which was placed on non-accrual status during the second quarter of 2002. The Company provisioned an additional $29,000 and wrote off $50,230 of its investment in the CMC lease portfolio during the fourth quarter of 2004 resulting in a remaining investment of $31,527 million. The remaining investment will continue onnon-accrual status until resolution of the associated litigation. See Item 3. “Legal Proceedings,” and notes 5, 6 and 19 of the notes to the consolidated financial statements included in this report for additional details regarding the Company’s loan and lease receivables; including its investment in the CMC lease portfolio, the associated litigation and the associated allowance for credit losses.
The non-CMC leases are originated by the Company’s NetBank Business Finance division. Theseleases consist primarily of equipment leases to small businesses. The Company provides an allowance for credit losses on such leases based upon life of lease loss estimates resulting from static loss analysis by vintage year of production. The increase in the non-CMC related reserves relates to the retention of leases by the Company over time.
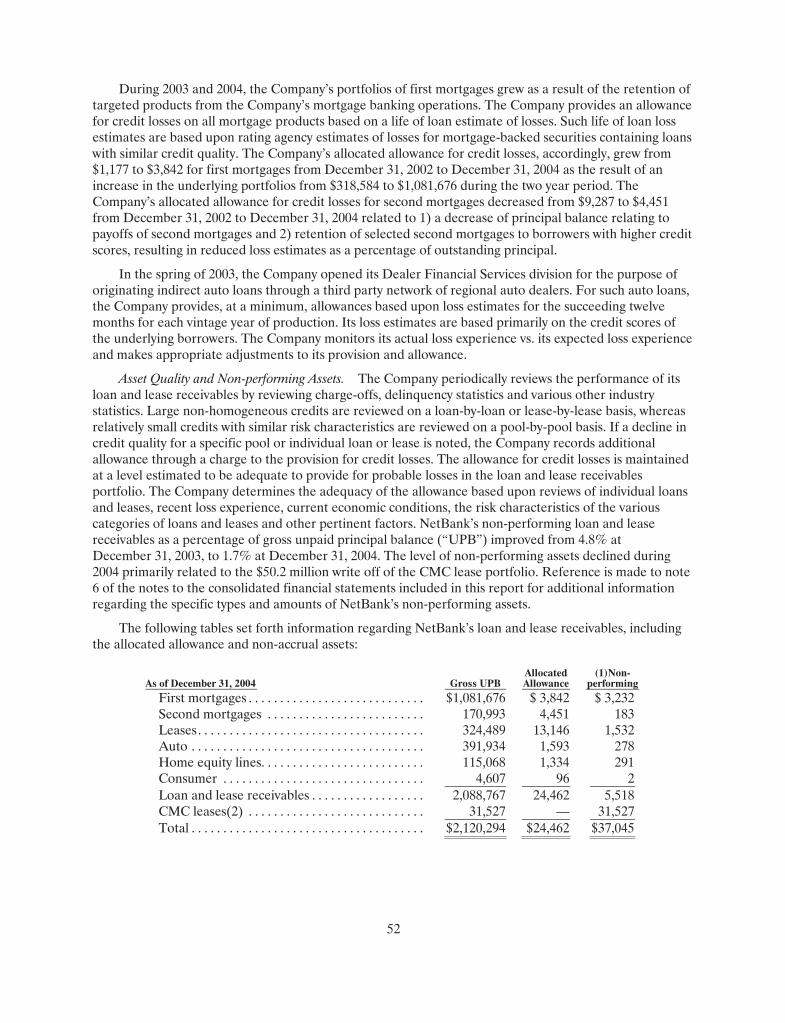
52
During 2003 and 2004, the Company’s portfolios of first mortgages grew as a result of the retention of targeted products from the Company’s mortgage banking operations. The Company provides an allowance for credit losses on all mortgage products based on a life of loan estimate of losses. Such life of loan lossestimates are based upon rating agency estimates of losses for mortgage-backed securities containing loans with similar credit quality. The Company’s allocated allowance for credit losses, accordingly, grew from $1,177 to $3,842 for first mortgages from December 31, 2002 to December 31, 2004 as the result of an increase in the underlying portfolios from $318,584 to $1,081,676 during the two year period. The Company’s allocated allowance for credit losses for second mortgages decreased from $9,287 to $4,451from December 31, 2002 to December 31, 2004 related to 1) a decrease of principal balance relating to payoffs of second mortgages and 2) retention of selected second mortgages to borrowers with higher credit scores, resulting in reduced loss estimates as a percentage of outstanding principal.
In the spring of 2003, the Company opened its Dealer Financial Services division for the purpose of originating indirect auto loans through a third party network of regional auto dealers. For such auto loans,the Company provides, at a minimum, allowances based upon loss estimates for the succeeding twelvemonths for each vintage year of production. Its loss estimates are based primarily on the credit scores of the underlying borrowers. The Company monitors its actual loss experience vs. its expected loss experience and makes appropriate adjustments to its provision and allowance.
Asset Quality and Non-performing Assets. The Company periodically reviews the performance of its loan and lease receivables by reviewing charge-offs, delinquency statistics and various other industry statistics. Large non-homogeneous credits are reviewed on a loan-by-loan or lease-by-lease basis, whereas relatively small credits with similar risk characteristics are reviewed on a pool-by-pool basis. If a decline in credit quality for a specific pool or individual loan or lease is noted, the Company records additional allowance through a charge to the provision for credit losses. The allowance for credit losses is maintained at a level estimated to be adequate to provide for probable losses in the loan and lease receivables portfolio. The Company determines the adequacy of the allowance based upon reviews of individual loans and leases, recent loss experience, current economic conditions, the risk characteristics of the various categories of loans and leases and other pertinent factors. NetBank’s non-performing loan and leasereceivables as a percentage of gross unpaid principal balance (“UPB”) improved from 4.8% at December 31, 2003, to 1.7% at December 31, 2004. The level of non-performing assets declined during2004 primarily related to the $50.2 million write off of the CMC lease portfolio. Reference is made to note 6 of the notes to the consolidated financial statements included in this report for additional information regarding the specific types and amounts of NetBank’s non-performing assets.
The following tables set forth information regarding NetBank’s loan and lease receivables, including the allocated allowance and non-accrual assets:
As of December 31, 2004 Gross UPBAllocatedAllowance
(1)Non- performing
First mortgages . . . . . . . . . . . . . . . . . . . . . . . . . . . . $1,081,676 $ 3,842 $ 3,232Second mortgages . . . . . . . . . . . . . . . . . . . . . . . . . 170,993 4,451 183Leases. . . . . . . . . . . . . . . . . . . . . . . . . . . . . . . . . . . . 324,489 13,146 1,532Auto . . . . . . . . . . . . . . . . . . . . . . . . . . . . . . . . . . . . . 391,934 1,593 278Home equity lines. . . . . . . . . . . . . . . . . . . . . . . . . . 115,068 1,334 291Consumer . . . . . . . . . . . . . . . . . . . . . . . . . . . . . . . . 4,607 96 2Loan and lease receivables . . . . . . . . . . . . . . . . . . 2,088,767 24,462 5,518CMC leases(2) . . . . . . . . . . . . . . . . . . . . . . . . . . . . 31,527 — 31,527Total . . . . . . . . . . . . . . . . . . . . . . . . . . . . . . . . . . . . . $2,120,294 $24,462 $37,045

53
As of December 31, 2003 Gross UPBAllocatedAllowance
(1)Non- performing
First mortgages . . . . . . . . . . . . . . . . . . . . . . . . . . $1,186,565 $ 3,935 $ 1,843Second mortgages. . . . . . . . . . . . . . . . . . . . . . . . 123,124 6,152 593Leases . . . . . . . . . . . . . . . . . . . . . . . . . . . . . . . . . . 266,957 10,427 1,430Auto . . . . . . . . . . . . . . . . . . . . . . . . . . . . . . . . . . . 92,724 1,054 27Home equity lines. . . . . . . . . . . . . . . . . . . . . . . . 50,816 829 339Consumer. . . . . . . . . . . . . . . . . . . . . . . . . . . . . . . 1,880 62 1Loan and lease receivables . . . . . . . . . . . . . . . . 1,722,066 22,459 4,233CMC leases(2) . . . . . . . . . . . . . . . . . . . . . . . . . . 82,995 21,230 82,995Total . . . . . . . . . . . . . . . . . . . . . . . . . . . . . . . . . . . $1,805,061 $43,689 $87,228
(1) Non-performing includes all loans that are 90 days or more contractually past due including loans which have been restructured. The Company also held $210 and $5,309 of performing restructuredloans as of December 31, 2004 and 2003, respectively.
(2) Reference is made to note 5 of the notes to the consolidated financial statements included in this report for additional details regarding the CMC lease portfolio.
As more fully described in note 3 of the notes to the consolidated financial statements included in this report, NetBank’s loans held for sale are carried at the aggregate of the lower of cost or market until being sold, typically 30 to 90 days after origination or purchase. The majority of NetBank’s non-performing loans held for sale consist of loans which the Company has been required to repurchase under representations and warranties provided to purchasers of NetBank’s loans. Once a loan has been repurchased, it isgenerally resold at a loss. Upon repurchase, the Company transfers reserves from its liability for representations and warranties to a valuation reserve for repurchased loans to record such loans at estimated net realizable value. At December 31, 2004 and 2003 the aggregate market value of loans held for sale exceeded the aggregate cost. The following tables set forth information regarding NetBank’s loans held for sale:
As of December 31, 2004 Gross UPBNon-
performing Reserve Conforming mortgages . . . . . . . . . . . . . . . . . . . . . $ 821,422 $23,488 $ 4,179Non-conforming mortgages . . . . . . . . . . . . . . . . . 300,406 12,810 5,293Construction . . . . . . . . . . . . . . . . . . . . . . . . . . . . . . 54,564 335 140Commercial mortgages . . . . . . . . . . . . . . . . . . . . . 7,893 — 894Total held for sale assets . . . . . . . . . . . . . . . . . . . . $1,184,285 $36,633 $10,506
As of December 31, 2003 Gross UPBNon-
performing Reserve Conforming mortgages . . . . . . . . . . . . . . . . . . . . . $1,477,616 $25,422 $ 9,602Non-conforming mortgages . . . . . . . . . . . . . . . . . 435,188 20,566 7,821Construction . . . . . . . . . . . . . . . . . . . . . . . . . . . . . . 44,377 421 63Commercial mortgages . . . . . . . . . . . . . . . . . . . . . 12,912 — 1,494Total held for sale assets . . . . . . . . . . . . . . . . . . . . $1,970,093 $46,409 $18,980
Mortgage Servicing Rights. The Company intends to grow the size of its mortgage servicing rights (“MSRs”) portfolio in order to achieve the necessary critical mass the transaction processing segment requires to sustain operational profitably. During 2004, execution of conforming conventional loans intothe secondary market in whole loan, servicing released sales was frequently more profitable than creatingmortgage-backed securities and retaining the servicing rights. Accordingly, growth in the servicing portfolio was slower during 2004 when compared with 2003. For the year ended December 31, 2004, the

54
value of NetBank’s MSRs increased $7,605 or 5%. The $7,605 increase in value was driven by the $350,149or 3% increase in the portfolio of mortgage loans underlying its MSRs coupled with a 2 basis pointincrease in carrying value as a percent of unpaid principal balance. For the years ended December 31, 2004and 2003, the Company capitalized $59,821 and $211,273 in MSRs. In addition, for the years ended December 31, 2004, 2003 and 2002 the Company incurred amortization expense of $39,299, $28,655 and $12,516, respectively, related to its MSRs.
Liabilities. Total liabilities for the year ended December 31, 2004 decreased $96,756. This decrease was due primarily to a decrease of $109,531 in borrowed funds and a decrease of $81,164 in unsettled trades. These decreases were offset, in part, by an increase in deposits of $100,014. The increase in deposits relates primarily to an increase in servicing related deposits and small business deposits during 2004. Borrowed funds decreased as a result of the overall $112,624 decrease in total assets primarily related to the decrease in loans held for sale.
Deposits. Deposits were $2,639,441 at December 31, 2004, a 4% increase year-over-year compared to deposits of $2,539,427 at December 31, 2003. As of December 31, 2004, deposits represented 67% of total interest-bearing liabilities (including deposits, other borrowed funds and subordinated debt) outstanding.FHLB advances, warehouse lines of credit and repurchase agreements represented approximately 33%, and subordinated debt represented less than 1%. Checking accounts increased primarily related to the growth in servicing related deposits and small business accounts. Money market accounts decreased year over year related primarily to the Company pricing less aggressively than it did in prior periods relative to its competition. Certificates of deposit increased by $185,035 as the Company saw the opportunity to lock in rates in certain maturities in a rising rate environment. The following table summarizes NetBank’s deposits:
As of December 31, 2004 As of December 31, 2003 As of December 31, 2002
Amount %
Weightedaverage
interest rate Amount %
Weightedaverage
interest rate Amount %
Weightedaverage
interest rateNon-interest bearing
checking accounts $ 285,218 10.8 % N/A $ 198,884 7.8% N/A $ 227,490 11.1 % N/A Interest bearing:
Checking accounts 261,588 9.9 % 1.0% 228,178 9.0% 1.4% 163,938 8.0 % 1.6% Money market . . . 1,158,529 43.9 % 1.9% 1,363,294 53.7% 1.9% 811,873 39.7 % 2.3% Certificate of
deposit under$100 . . . . . . . . . 830,996 31.5 % 2.9% 632,602 24.9% 2.8% 720,399 35.2 % 3.4%
Certificate of deposit over $100 103,110 3.9 % 3.3% 116,469 4.6% 2.8% 121,222 6.0 % 3.4%
Total deposits . . . . . $2,639,441 100.0 % $ 2,539,427 100.0% $ 2,044,922 100.0 %
Reference is made to the detailed deposit information in note 10 of the notes to the consolidated financial statements included in this report.
Shareholders’ Equity. Total shareholders’ equity decreased $16,323 for the year ended December 31, 2004. The decrease is primarily due to a $12,413 increase in treasury stock and a decrease in accumulated other comprehensive income of $3,878. Net income was $4,220, and dividends paid aggregated $3,748 for the year ended December 31, 2004. Accumulated other comprehensive income (OCI) decreased $3,878 as a result of the change in fair value of available for sale investment securities of $983 and the realization of $4,861 in gains due to the sale of certain investment securities. Treasury stock increased $12,413 due to the repurchase of 1,456,336 shares of common stock at a weighted average cost of $11.28 per share offset, inpart, by the reissuance of 205,575 shares under the employee stock purchase plan and exercise of employee stock options and the issuance of 194,217 shares of common stock associated with the purchase of Beacon. NetBank will continue to repurchase shares periodically in the public market or through private transactions. At December 31, 2004, 663,964 shares remained available for repurchase under current Board authority.
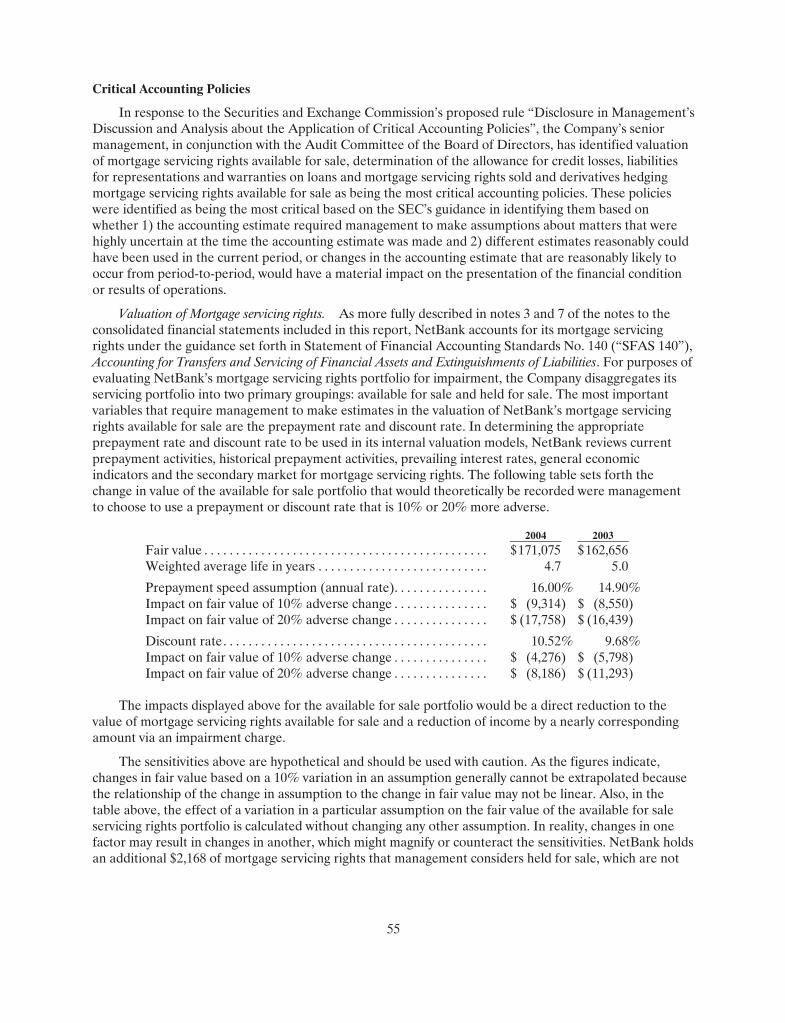
55
Critical Accounting Policies
In response to the Securities and Exchange Commission’s proposed rule “Disclosure in Management’s Discussion and Analysis about the Application of Critical Accounting Policies”, the Company’s seniormanagement, in conjunction with the Audit Committee of the Board of Directors, has identified valuation of mortgage servicing rights available for sale, determination of the allowance for credit losses, liabilities for representations and warranties on loans and mortgage servicing rights sold and derivatives hedging mortgage servicing rights available for sale as being the most critical accounting policies. These policies were identified as being the most critical based on the SEC’s guidance in identifying them based onwhether 1) the accounting estimate required management to make assumptions about matters that were highly uncertain at the time the accounting estimate was made and 2) different estimates reasonably could have been used in the current period, or changes in the accounting estimate that are reasonably likely to occur from period-to-period, would have a material impact on the presentation of the financial condition or results of operations.
Valuation of Mortgage servicing rights. As more fully described in notes 3 and 7 of the notes to the consolidated financial statements included in this report, NetBank accounts for its mortgage servicing rights under the guidance set forth in Statement of Financial Accounting Standards No. 140 (“SFAS 140”), Accounting for Transfers and Servicing of Financial Assets and Extinguishments of Liabilities. For purposes of evaluating NetBank’s mortgage servicing rights portfolio for impairment, the Company disaggregates its servicing portfolio into two primary groupings: available for sale and held for sale. The most important variables that require management to make estimates in the valuation of NetBank’s mortgage servicing rights available for sale are the prepayment rate and discount rate. In determining the appropriate prepayment rate and discount rate to be used in its internal valuation models, NetBank reviews current prepayment activities, historical prepayment activities, prevailing interest rates, general economic indicators and the secondary market for mortgage servicing rights. The following table sets forth the change in value of the available for sale portfolio that would theoretically be recorded were management to choose to use a prepayment or discount rate that is 10% or 20% more adverse.
2004 2003Fair value . . . . . . . . . . . . . . . . . . . . . . . . . . . . . . . . . . . . . . . . . . . . . $171,075 $162,656Weighted average life in years . . . . . . . . . . . . . . . . . . . . . . . . . . . 4.7 5.0
Prepayment speed assumption (annual rate). . . . . . . . . . . . . . . 16.00% 14.90%Impact on fair value of 10% adverse change . . . . . . . . . . . . . . . $ (9,314) $ (8,550)Impact on fair value of 20% adverse change . . . . . . . . . . . . . . . $ (17,758) $ (16,439)
Discount rate. . . . . . . . . . . . . . . . . . . . . . . . . . . . . . . . . . . . . . . . . . 10.52 % 9.68 %Impact on fair value of 10% adverse change . . . . . . . . . . . . . . . $ (4,276) $ (5,798)Impact on fair value of 20% adverse change . . . . . . . . . . . . . . . $ (8,186) $ (11,293)
The impacts displayed above for the available for sale portfolio would be a direct reduction to thevalue of mortgage servicing rights available for sale and a reduction of income by a nearly correspondingamount via an impairment charge.
The sensitivities above are hypothetical and should be used with caution. As the figures indicate, changes in fair value based on a 10% variation in an assumption generally cannot be extrapolated because the relationship of the change in assumption to the change in fair value may not be linear. Also, in the table above, the effect of a variation in a particular assumption on the fair value of the available for sale servicing rights portfolio is calculated without changing any other assumption. In reality, changes in one factor may result in changes in another, which might magnify or counteract the sensitivities. NetBank holds an additional $2,168 of mortgage servicing rights that management considers held for sale, which are not

56
included in the preceding table. The held for sale portfolio’s value is based on its forward committed prices and therefore would not be subject to the types of value changes referred to in the discussion above.
Allowance for credit losses. In determining the appropriate amount of allowance for credit losses management is required to make estimates regarding the credit quality of borrowers, general economic conditions and various other factors that would impact the probability of loans or leases being repaid in full. Accordingly, management uses both internally developed and external metrics and considers economic indicators as well as other factors to determine the appropriate range level at which the allowance should be maintained.
At December 31, 2004, NetBank had $2.1 billion of loan and lease receivables and $24,462 of allowance for credit losses, a coverage ratio of 1.15%, and incurred $34,777 of provision expense related to maintaining the allowance within the appropriate range. NetBank recorded net charge-offs of $54,004during 2004. The provision for credit losses for the year ended December 31, 2004 included a provisionrelated to leases originated by CMC which the Company is litigating to recover. In November 2004, twosettlements in other CMC related cases were announced that were considered significant. Americana Bancorp and Lakeland Bancorp both announced settlements with American Motorist Insurance Company and Royal Indemnity, respectively. Based upon a review of publicly available information, these settlements appear to represent between 42% and 46% of the recorded receivable before allocated reserves. Although the case against the sureties is still believed to be very strong, NetBank recorded a provision of $29,000 and charged off $50,230, which resulted in a remaining balance of $31,527. Excluding this provision and chargeoff for CMC, the provision expense was $5,777 and net chargeoffs were $3,774.
At December 31, 2003, the Company had $1.8 billion of loan and lease receivables and $43,689 of allowance, a coverage ratio of 2.42%. The Company incurred $7,008 of provision expense related to maintaining the allowance within the appropriate range during 2003. NetBank recorded net charge-offs of $5,895, which was less than 1% of the average loan and lease receivables balance during 2002. The allowance for credit losses at December 31, 2003 contained $21,230 specifically allocated to the CMC lease portfolio.
Liability for representations and warranties. In the ordinary course of business, the Company isexposed to liability, and potential losses, under representations and warranties made to purchasers and insurers of mortgage loans and the purchasers of servicing rights. Under certain circumstances, the Company may be required to repurchase mortgage loans or indemnify the purchasers of loans or servicing rights for losses if there has been a breach of representations or warranties.
Estimation of a liability for such representations and warranties is difficult for two reasons. First, since NetBank is not the primary servicer for many of the loans or loans underlying the mortgage servicing rights it has sold in the past, it has no knowledge as to the current status of previously sold loans and mortgage servicing rights and the extent of the “pipeline” of unasserted repurchase requests. Second, as new mortgage products are introduced that may have documentation or underwriting criteria substantiallydifferent from products historically originated and sold, the Company has no historic information withrespect to the expected frequency of repurchase requests or of the expected loss severity for these new products.
The Company estimates its liability for representations and warranties using the best information ithas in the circumstances. For loan products where the Company has a history of past repurchase frequency and loss severity, the Company uses that historical vintage loss data to project its future liability. However, since the Company is not the servicer and has no information of the current status of such loans, suchhistoric repurchase frequency and loss severity may not be the best indicator of future repurchase losses as the result of changes in the levels of prepayments (which affect repurchase frequency). Likewise, changes in general economic conditions such as unemployment levels and housing values can affect the frequency and loss severity of future repurchases under representations and warranties. For new products that are

57
substantially different in underwriting criteria and documentation standards than that of historic productofferings, the Company initially estimates repurchase frequency from initial quality control tests and uses loss severity from other similar products. As these new products season, the Company adjusts its process to include the historical frequency and loss severity trends for the product. The Company’s reserve for its estimated losses for its liability for representations and warranties was $22.7 million and $17.9 million as ofDecember 31, 2004 and 2003, respectively. Changes to frequency or severity would cause linear changes to the reserve requirements. The Company repurchased approximately $99.0 million and $61.5 million of unpaid principal balances during 2004 and 2003, respectively.
Derivative Financial Instruments. The Company uses derivative financial instruments as part of its risk management activities to protect the value of certain assets and liabilities against adverse price or interest rate movements. All of the Company’s derivative instruments are carried at fair value on the balance sheet. The valuation of these derivatives is critical because carrying assets and liabilities at fair value inherently results in more financial statement volatility. The valuation of the Company’s derivatives is based on third party mid-market quotes from a cross-section of Wall Street dealers or from a model utilizing Wall Street accepted valuation methodologies; and is therefore, generally calibrated to third party mid-market quotes.
Because the majority of the derivative instruments on the Company’s balance sheet are used to protect the value of other assets and liabilities in its balance sheet, changes in the value of the derivativeinstruments are typically offset by changes in the value of the assets and liabilities being hedged. Income statement volatility can occur if the Company makes the decision to not fully hedge the attendant risk, the costs related to hedging reduce the net benefit related to hedging the attendant risk or the derivative instruments are not effective in hedging changes in the value of those assets and liabilities.
Contractual Obligations and Off-Balance Sheet Arrangements
The Company, in the normal course of business, had contractual obligations to make scheduled payments for its operating leases; its liability to repurchase loans under representations and warranties provided to purchasers of its mortgage loans and MSRs; and its obligation to make scheduled principal and interest payments on borrowed funds. The Company is not a party to any off-balance sheet financing arrangements nor does it hold unconsolidated interests in any variable interest entities that could rise to future contractual obligations.
The following table summarizes the Company’s obligations under these arrangements by type and scheduled payment:
Contractual obligations Less than
1 year 1-3
years 4-5
years After 5 years Total
Borrowed funds(1) . . . . . . . . . . . . . . $706,403 $299,358 $231,979 $229,456 $1,467,196Unsettled trades . . . . . . . . . . . . . . . . 50,543 — — — 50,543Operating leases(2) . . . . . . . . . . . . . 11,061 12,657 5,228 195 29,141Repurchase liabilities(3) . . . . . . . . . 75,600 35,797 4,188 — 115,585
$843,607 $347,812 $241,395 $229,651 $1,662,465
(1) Includes contractually due principal and interest. Reference is made to note 11 of the notes to the consolidated financial statements included in this report for additional information regarding the Company’s borrowings.
(2) Reference is made to note 12 of the notes to the consolidated financial statements included in this report regarding details of the Company’s operating leases.

58
(3) A detailed discussion regarding the Company’s liabilities under representations and warranties provided to purchasers of its mortgage loans and mortgage servicing rights can be found in note 19 of the notes to the consolidated financial statements included in this report or under the heading “Critical Accounting Policies” above. As discussed in note 19 of the notes to the consolidated financial statements included in this report and under the heading “Critical Accounting Policies” above, theCompany cannot accurately predict the volume or timing of when, or if, mortgage loans or mortgage servicing rights will be presented for repurchase.
Results of Operations—Year ended December 31, 2004, compared to the year ended December 31, 2003
General. Net income for the year ended December 31, 2004 was $4,220 or $0.09 per share, compared to net income of $50,514 or $1.04 per share, for 2003. NetBank’s management capitalized on the favorable interest rate environment in 2003 to post strong revenues from its financial intermediary segment. Incontrast, rising interest rates and interest rate volatility during 2004 adversely impacted the results reported from the financial intermediary segment. Mortgage production within the financial intermediary segment dropped from $18.9 billion to $13.6 billion, while sales of mortgages dropped from $18.3 billion to$14.1 billion comparing 2003 to 2004, respectively. NetBank also experienced pressure on its margins in the financial intermediary segment from increasing competition, especially in the correspondent channel. The financial intermediary segment’s pre-tax income was down by $135 million as a result. This was offset, in part, by improved results in the retail bank segment which posted a pre-tax loss of $11.1 million during2004 compared with a pre-tax loss of $61.0 million during 2003. Included in the retail bank segment loss in 2004 was an additional provision for credit losses on the CMC leases of $29.0 million. In the absence of that provision, the retail bank would have reported pre-tax earnings of $17.9 million an improvement of $78.9 million over the prior year.
Interest Income. NetBank’s interest income for the year ended December 31, 2004 was $232,163compared to $210,630 in 2003. As detailed in the following rate volume variance table, NetBank lowered the average balance of its loans held for sale by $248,503 and increased the average balance of investmentsecurities available for sale and loan and lease receivables by $52,238 and $822,158, respectively. This repositioning resulted in a positive volume variance of $29,116 due to the increase in average interest-earning assets. This was partially offset by a $7,583 negative variance due to lower yields. The increase in loan and lease receivables is principally the result of the bank retaining originated loans and leases. During 2004, NetBank retained $750,342 of internally originated mortgage loans (primarilyadjustable rate mortgages), $87,637 of HELOCs, $384,523 of internally originated auto loans and $175,669of originated business finance loans and leases. Interest income was impacted for the years ended December 31, 2004 and 2003 by approximately $5.6 million and $6.8 million, respectively, due to the non-accrual status of loans and leases
Interest Expense. Total interest expense for the year ended December 31, 2004 was $92,617compared to $85,386 for 2003. The $7,231 increase is due to an increase of $604,511 in interest-bearingliabilities, offset, in part, by the impact of a 19 basis-point reduction in the average cost of funds. For the year ended December 31, 2004 there was $47,044 of interest expense on deposits (including checking,money market and certificates of deposits) as compared to $49,784 for the year ended December 31, 2003. The $2,740 net decrease in interest expense on deposits was the result of a 22 basis-point decline in the average rate paid on deposits resulting in a positive $3,551 rate variance, offset in part by a volumevariance of $811 due to an increase in average interest-bearing deposit balances of $113,359. For the year ended December 31, 2004 interest expense on other borrowed funds (including short-term debt, FHLB advances, and convertible subordinated debt) was $45,573 compared to $35,602 for 2003. The $9,971increase in interest expense related to other borrowed funds is the result of an increase of $491,152 in the average outstanding balance, offset, in part, by a 22 basis-point decline in the average cost of funds. The 22

59
basis-point reduction in the average cost of other borrowed funds is primarily due to higher fixed-rate term FHLB advances being prepaid during the second half of 2003.
Net Interest Income. Net interest income is determined by interest rate spread, which is the difference between the yields earned on interest-earning assets and the rates paid on interest-bearingliabilities, and the relative amounts of interest-earning assets and interest-bearing liabilities. Net interest income was $139,546, or 2.92% of average interest-earning assets for the year ended December 31, 2004, compared to $125,244, or 3.30%, of average interest-earning assets for the year ended December 31, 2003.
The following table details the relative interest rates and average balances of NetBank’s interest-earning assets and interest-bearing liabilities for the years ended December 31, 2004, and 2003:
Average Yield Variance Average Balance / Rate Interest attributable to 2004 2003 2004 2003 2004 2003 Variance Rate Volume(3)
Interest-earning assets:$ 80,728 $ 29,833 1.32% 1.14 % Short-term investments $ 1,065 $ 340 $ 725 $ 54 $ 671
538,756 486,518 3.87 % 4.00 % Investment securities(1) 20,838 19,445 1,393 (632) 2,025 1,758,372 2,006,875 5.97 % 6.30 % Loans held for sale(2) 104,936 126,503 (21,567) (6,623) (14,944)2,096,615 1,274,457 5.02 % 5.05 % Loan and lease receivables(2) 105,324 64,342 40,982 (382) 41,3644,474,471 3,797,683 5.19 % 5.55 % Total interest-earning assets 232,163 210,630 21,533 (7,583) 29,116
Interest-bearing liabilities:234,574 187,962 1.20 % 1.49 % Checking accounts 2,812 2,809 3 (545) 548
1,277,853 1,131,461 1.70 % 2.06 % Money market 21,712 23,350 (1,638) (4,073) 2,435 809,259 888,904 2.78 % 2.66 % Certificates of deposit 22,520 23,625 (1,105) 1,067 (2,172)954,468 791,664 2.05 % 1.86 % Short-term debt 19,555 14,759 4,796 1,504 3,292 785,275 446,845 3.24 % 4.39 % FHLB advances 25,440 19,621 5,819 (5,139) 10,95811,857 7,667 4.87 % 5.07 % Subordinated debt 578 389 189 (15) 204
— 14,272 0.00 % 5.84 % Convertible subordinated debt — 833 (833) (833) —
4,073,286 3,468,775 2.27 % 2.46 % Total interest-bearing
liabilities 92,617 85,386 7,231 (8,034) 15,265
— — 2.92 % 3.09 % Net interest margin 139,546 125,244 14,302 451 13,851401,185 328,908 0.20 % 0.21 % Interest free sources — — — — —
$ 4,474,471 $ 3,797,683 3.12 % 3.30 % Net interest income to interest-
earning assets $ 139,546 $ 125,244 $ 14,302 $ 451 $ 13,851
(1) Based on amortized cost; changes in fair value are not considered.
(2) No separate treatment has been made for non-accrual loans.
(3) Variances attributable to the rate and volume mix are included in the volume variances.
Provision for Credit Losses. The provision for credit losses was $34,777 for the year endedDecember 31, 2004, compared to $7,008 for 2003. The increase in provision relates to recording a $29,000provision during the fourth quarter for the Company’s aforementioned investment in leases originated by CMC. In November 2004, two settlements in other CMC related cases were announced that wereconsidered significant. Ameriana Bancorp and Lakeland Bancorp both announced settlements withAmerican Motorist Insurance Company and Royal Indemnity, respectively. Based upon a review of publicly available information, these settlements appear to represent between 42% and 46% of therecorded receivable before allocated reserves. NetBank believes its case against the sureties is still very strong. Excluding this provision for CMC, the provision expense was $5,777 for the year ended December 31, 2004 compared with $7,008 for the year ended December 31, 2003. The reduction inprovision expense, excluding the CMC provision, relates to a slowdown in the growth of loan and lease receivables. During 2004, loan and lease receivables grew by $334,460 compared with growth in 2003 of $864,867.

60
Reference is made to the heading “Financial Condition—Asset Quality and Non-performing Assets” above for additional detail concerning the determination of provision expense related to maintaining the proper level of allowance for credit losses.
Non-interest Income. Non-interest income declined by $103,193 for the year ended December 31, 2004 compared to the same period of 2003. This decline was primarily driven by the $116,455 decline ingain on sales of loans due to the $3.8 billion or 22% decline in sales of mortgage loans. The decline in sales was compounded by the decline in margins on sales due to increased competitive pressures. Service charges and fees increased $16,695 as a result of 1) an increase in the average number of loans serviced in2004 compared with 2003 and 2) inclusion of a full year of operating results of NPS during 2004, which was acquired on December 1, 2003. Gain on sales of securities declined by $3,614 and gains on derivatives increased by $7,000 during the year ended December 31, 2004 compared with the same period in 2003. During 2003, the Company was re-balancing the durations of its asset liability mix, offsetting fees for prepayment of higher rate term debt with gains on the sale of selected securities available for sale. During2004, the Company did not prepay any FHLB advances. In 2004, the Company began a program of hedging on the balance sheet, from an economic standpoint, a portion of the prepayment risk associatedwith its mortgage servicing rights. That program involves acquiring mortgage backed securities by enteringinto TBA trades and subsequently taking delivery of the resulting securities on respective agency settlement dates. The TBA trades prior to settlement are free-standing derivatives that are marked to market. In 2004, this gave rise to the gains on derivatives. Likewise, the Company monetized a portion of its gain on some of the resulting mortgage backed securities available for sale giving rise to a total of $7.8 million of gains on sale of securities. Other income declined by $6,819 primarily due to lower hedge results driven by generally increasing mortgage interest rates and interest rate volatility compared to the same period of 2003.
Non-interest Expense. Non-interest expense includes all operating expenses such as salaries and benefits, marketing and general and administrative expenses. Non-interest expense decreased $42,937, or 12%, for the year ended December 31, 2004 compared to the same period of 2003. This decline was primarily driven by the $25,876 decline in impairment and amortization of mortgage servicing rights due to the reduction in actual and projected prepayments, reduced salaries and benefits expense of $6,803 related primarily to reduced production volume in the financial intermediary segment, $16,193 reduced prepayment fees on the early extinguishment of debt related to the extinguishment of term FHLB borrowings in 2003, and a reduction in prepaid lost interest on curtailments of $4,670 related to reduced actual prepayments on loans serviced in 2004 compared with 2003. These decreases were offset, in part, by depreciation and amortization, occupancy and other expense categories that were generally higher as the Company’s operations expanded period-over-period with the additions of NetBank Dealer Financial Services and NPS.

61
Retail Banking Segment.
The table below provides an overview of the results of operations for the retail banking segment:
2004 2003 change Net interest income. . . . . . . . . . . . . . . . . . . . . . . . . . . . . . . . . . $ 81,176 $ 53,236 $ 27,940Provision for credit losses . . . . . . . . . . . . . . . . . . . . . . . . . . . . 34,745 6,989 27,756
Net interest income after provision . . . . . . . . . . . . . . . . . . 46,431 46,247 184Gain on sale of loans . . . . . . . . . . . . . . . . . . . . . . . . . . . . . . . . 3,160 71 3,089Fees, charges and other income . . . . . . . . . . . . . . . . . . . . . . . 12,749 11,552 1,197
Total revenues . . . . . . . . . . . . . . . . . . . . . . . . . . . . . . . . . . . . 62,340 57,870 4,470Total expenses . . . . . . . . . . . . . . . . . . . . . . . . . . . . . . . . . . . . 68,275 61,918 6,357Pre-tax income before gains on securities, debt and net
servicing results . . . . . . . . . . . . . . . . . . . . . . . . . . . . . . . . . (5,935) (4,048 ) (1,887) Net gain on securities and prepaid debt . . . . . . . . . . . . . . . . 7,780 (4,799) 12,579Net servicing results . . . . . . . . . . . . . . . . . . . . . . . . . . . . . . . . . (12,921) (52,171) 39,250
Pre-tax income (loss) . . . . . . . . . . . . . . . . . . . . . . . . . . . . . . $ (11,076) $ (61,018) $ 49,942
Earning assets . . . . . . . . . . . . . . . . . . . . . . . . . . . . . . . . . . . . . . $ 4,368,068 $ 3,744,553 $ 623,515Average UPB underlying MSRs . . . . . . . . . . . . . . . . . . . . . . . $12,766,699 $10,146,432 $3,489,653
Efficiencies to earning assets Net interest income. . . . . . . . . . . . . . . . . . . . . . . . . . . . . . . . . . 1.86% 1.42% 0.44%Provision . . . . . . . . . . . . . . . . . . . . . . . . . . . . . . . . . . . . . . . . . . . 0.80% 0.19% 0.61%Net interest income after provision . . . . . . . . . . . . . . . . . . . . 1.06% 1.23% (0.17)%Gain on sale, fees, charges and other income . . . . . . . . . . . 0.36% 0.31% 0.05%Banking revenues . . . . . . . . . . . . . . . . . . . . . . . . . . . . . . . . . . . 1.42% 1.54% (0.12)%Total expenses . . . . . . . . . . . . . . . . . . . . . . . . . . . . . . . . . . . . . . 1.56% 1.65% (0.09)%
Pre-tax income before net gains on securities, debt and net servicing results . . . . . . . . . . . . . . . . . . . . . . . . . . . . . (0.14)% (0.11)% (0.03)%
Net servicing results to UPB underlying MSRs . . . . . . . . . . (0.10)% (0.51)% 0.46%
Pre-tax loss improved by $49,942 to $11,076 for the year ended December 31, 2004, compared with a pre-tax loss of $61,018 for the same period in 2003. This is in spite of recording an additional provision for credit losses related to the Company’s investment in CMC leases. In the absence of that charge, the improvement would have been $78,942.
Improvements in net interest income of $27,940, improvements in net servicing results of $39,250, improvement in net gain on securities and prepayment of debt of $12,579, and increases in fees, charges and other income of $1,197 resulted in the improvement year-over-year. Net interest income improved primarily because of the retention over the past two years of originated assets including mortgages, leases and auto loans. Likewise, during 2003, the retail banking segment prepaid a large number of higher-priced term FHLB advances and, through pricing, moved the mix of deposits from higher cost certificates of deposit to lower cost money market and checking accounts. These asset-liability strategies have improved net interest income as a percentage of earning assets by 0.44% to 1.86% for the year ended December 31, 2004 compared with 1.42% for the same period in 2003. Net servicing results improved as a result of lower actual and projected prepayments in 2004 compared with 2003. The increase in the provision for credit losses relates to the aforementioned provision for losses on the Company’s investment in leases acquired from CMC. The improvement in fees, charges and other income relates to the increase in transactional accounts (i.e. checking and money market) year-over-year.

62
These improvements in earnings were offset, in part, by increases in operating expenses of $6,357. The increase in operating expenses relates primarily to the growth in the Company’s auto lending operation.
Financial Intermediary Segment.
The following table highlights the financial intermediary segment production and sales activities:
2004 2003 change Net interest income . . . . . . . . . . . . . . . . . $ 57,129 $ 73,416 $ (16,287) Gain on sales of loans . . . . . . . . . . . . . . . 113,963 236,209 (122,246)Other income . . . . . . . . . . . . . . . . . . . . . . 4,878 4,676 202Net Beacon Credit Services results . . . . (159) — (159)Net MG Reinsurance results . . . . . . . . . 2,301 1,919 382
Total revenues . . . . . . . . . . . . . . . . . . . 178,112 316,220 (138,108)Salary and employee benefits . . . . . . . . . 92,122 105,315 (13,193) Occupancy & depreciation expense . . . 28,279 23,203 5,076Other expenses . . . . . . . . . . . . . . . . . . . . . 34,470 29,623 4,847
Total expenses. . . . . . . . . . . . . . . . . . . . 154,871 158,141 (3,270)Pre-tax income . . . . . . . . . . . . . . . . . . . $ 23,241 $ 158,079 $ (134,838)
Production . . . . . . . . . . . . . . . . . . . . . . . . . $13,632,944 $18,921,756 $(5,288,812)Sales . . . . . . . . . . . . . . . . . . . . . . . . . . . . . . $14,146,029 $18,315,651 $(4,169,622)
Total revenues to sales. . . . . . . . . . . . . . . 1.26% 1.73% (0.47)%Total expenses to production . . . . . . . . . 1.14% 0.84% 0.30%
Pre-tax margin. . . . . . . . . . . . . . . . . . . . 0.12% 0.89% (0.77)%
Note: The ratio of revenues to sales is based on mortgage banking sales, which includes inter-segment sales to the retail banking segment.
The interest rate environment during the year ended December 31, 2003 was much more favorable to mortgage production than the environment during 2004. In 2003, mortgage rates were hitting historic lows. The loan pipelines of originators throughout the mortgage banking industry were filled, resulting in less pressure on margins. During the latter part of 2003 and continuing into 2004, mortgage rates rose, and competitive pressures heated up as pipeline volumes decreased. This margin pressure was especially true inthe correspondent channel. This resulted in a decrease in mortgage production of $5.3 billion and a decrease in sales of $4.2 billion. The competitive pressures reduced revenue margins from 173 bps for the year ended December 31, 2003 to 126 bps for the year ended December 31, 2004. As a result, revenues decreased $138,108. Expenses decreased $3,270. Expenses in terms of basis points of production increased from 84 bps to 114 bps comparing the year ended December 31, 2003 to the year ended December 31, 2004. This was the result of less leverage of fixed expenses during 2004.
Transaction Processing Segment.
The transaction processing segment provides ATM and merchant processing services; subservices loans for the retail banking segment, financial intermediary segment and for third party customers; and sells various insurance products using an Internet-based platform.
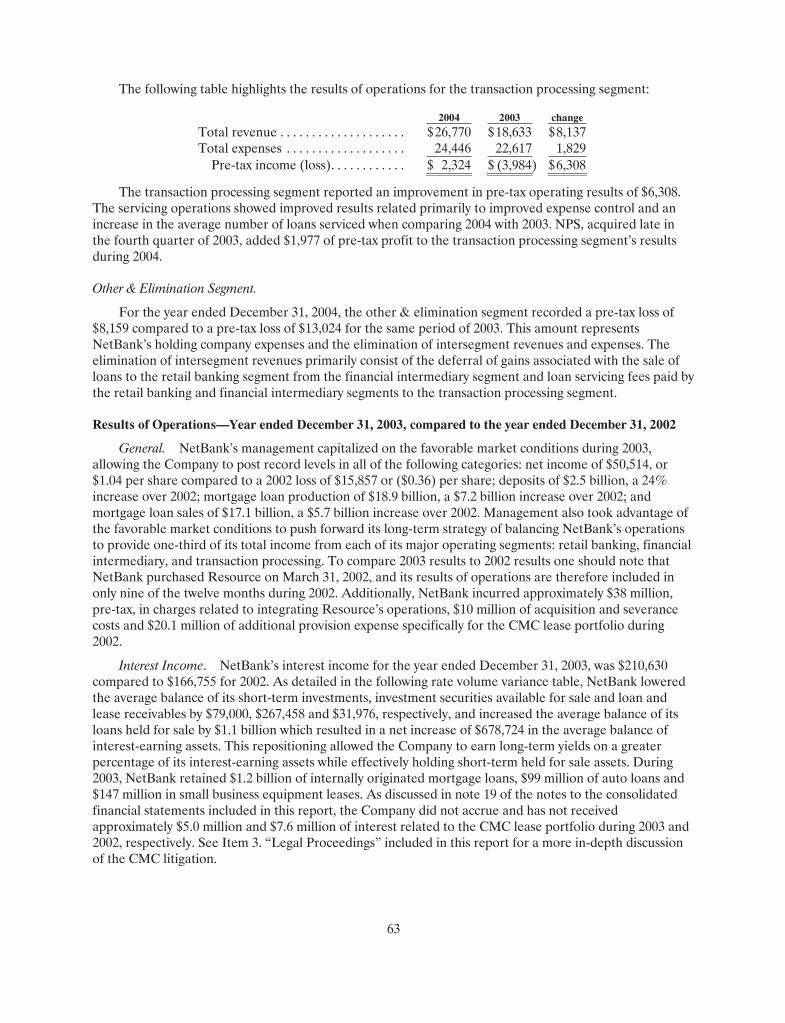
63
The following table highlights the results of operations for the transaction processing segment:
2004 2003 change Total revenue . . . . . . . . . . . . . . . . . . . . $26,770 $ 18,633 $ 8,137Total expenses . . . . . . . . . . . . . . . . . . . 24,446 22,617 1,829
Pre-tax income (loss). . . . . . . . . . . . $ 2,324 $ (3,984) $6,308
The transaction processing segment reported an improvement in pre-tax operating results of $6,308. The servicing operations showed improved results related primarily to improved expense control and an increase in the average number of loans serviced when comparing 2004 with 2003. NPS, acquired late inthe fourth quarter of 2003, added $1,977 of pre-tax profit to the transaction processing segment’s results during 2004.
Other & Elimination Segment.
For the year ended December 31, 2004, the other & elimination segment recorded a pre-tax loss of $8,159 compared to a pre-tax loss of $13,024 for the same period of 2003. This amount represents NetBank’s holding company expenses and the elimination of intersegment revenues and expenses. The elimination of intersegment revenues primarily consist of the deferral of gains associated with the sale of loans to the retail banking segment from the financial intermediary segment and loan servicing fees paid by the retail banking and financial intermediary segments to the transaction processing segment.
Results of Operations—Year ended December 31, 2003, compared to the year ended December 31, 2002
General. NetBank’s management capitalized on the favorable market conditions during 2003, allowing the Company to post record levels in all of the following categories: net income of $50,514, or $1.04 per share compared to a 2002 loss of $15,857 or ($0.36) per share; deposits of $2.5 billion, a 24% increase over 2002; mortgage loan production of $18.9 billion, a $7.2 billion increase over 2002; and mortgage loan sales of $17.1 billion, a $5.7 billion increase over 2002. Management also took advantage of the favorable market conditions to push forward its long-term strategy of balancing NetBank’s operationsto provide one-third of its total income from each of its major operating segments: retail banking, financial intermediary, and transaction processing. To compare 2003 results to 2002 results one should note that NetBank purchased Resource on March 31, 2002, and its results of operations are therefore included inonly nine of the twelve months during 2002. Additionally, NetBank incurred approximately $38 million, pre-tax, in charges related to integrating Resource’s operations, $10 million of acquisition and severance costs and $20.1 million of additional provision expense specifically for the CMC lease portfolio during 2002.
Interest Income. NetBank’s interest income for the year ended December 31, 2003, was $210,630 compared to $166,755 for 2002. As detailed in the following rate volume variance table, NetBank lowered the average balance of its short-term investments, investment securities available for sale and loan andlease receivables by $79,000, $267,458 and $31,976, respectively, and increased the average balance of its loans held for sale by $1.1 billion which resulted in a net increase of $678,724 in the average balance of interest-earning assets. This repositioning allowed the Company to earn long-term yields on a greater percentage of its interest-earning assets while effectively holding short-term held for sale assets. During 2003, NetBank retained $1.2 billion of internally originated mortgage loans, $99 million of auto loans and $147 million in small business equipment leases. As discussed in note 19 of the notes to the consolidated financial statements included in this report, the Company did not accrue and has not receivedapproximately $5.0 million and $7.6 million of interest related to the CMC lease portfolio during 2003 and 2002, respectively. See Item 3. “Legal Proceedings” included in this report for a more in-depth discussion of the CMC litigation.
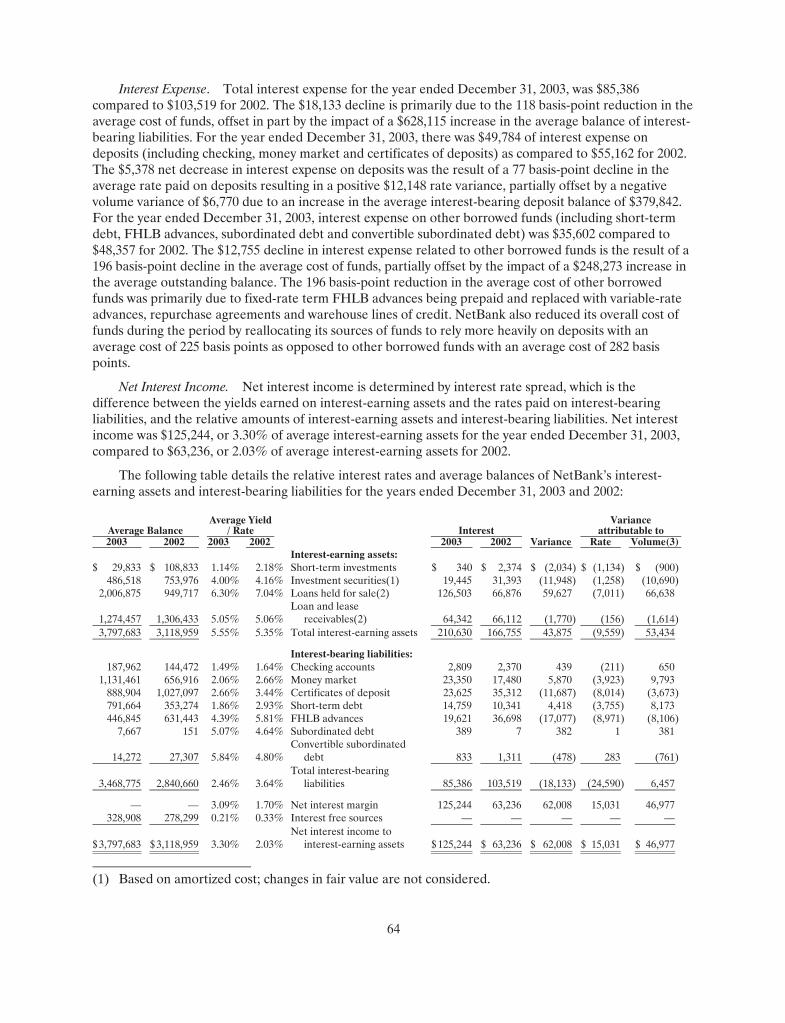
64
Interest Expense. Total interest expense for the year ended December 31, 2003, was $85,386compared to $103,519 for 2002. The $18,133 decline is primarily due to the 118 basis-point reduction in the average cost of funds, offset in part by the impact of a $628,115 increase in the average balance of interest-bearing liabilities. For the year ended December 31, 2003, there was $49,784 of interest expense ondeposits (including checking, money market and certificates of deposits) as compared to $55,162 for 2002. The $5,378 net decrease in interest expense on deposits was the result of a 77 basis-point decline in the average rate paid on deposits resulting in a positive $12,148 rate variance, partially offset by a negativevolume variance of $6,770 due to an increase in the average interest-bearing deposit balance of $379,842. For the year ended December 31, 2003, interest expense on other borrowed funds (including short-term debt, FHLB advances, subordinated debt and convertible subordinated debt) was $35,602 compared to $48,357 for 2002. The $12,755 decline in interest expense related to other borrowed funds is the result of a196 basis-point decline in the average cost of funds, partially offset by the impact of a $248,273 increase inthe average outstanding balance. The 196 basis-point reduction in the average cost of other borrowed funds was primarily due to fixed-rate term FHLB advances being prepaid and replaced with variable-rate advances, repurchase agreements and warehouse lines of credit. NetBank also reduced its overall cost of funds during the period by reallocating its sources of funds to rely more heavily on deposits with anaverage cost of 225 basis points as opposed to other borrowed funds with an average cost of 282 basis points.
Net Interest Income. Net interest income is determined by interest rate spread, which is the difference between the yields earned on interest-earning assets and the rates paid on interest-bearingliabilities, and the relative amounts of interest-earning assets and interest-bearing liabilities. Net interest income was $125,244, or 3.30% of average interest-earning assets for the year ended December 31, 2003, compared to $63,236, or 2.03% of average interest-earning assets for 2002.
The following table details the relative interest rates and average balances of NetBank’s interest-earning assets and interest-bearing liabilities for the years ended December 31, 2003 and 2002:
Average BalanceAverage Yield
/ Rate Interest Variance
attributable to 2003 2002 2003 2002 2003 2002 Variance Rate Volume(3)
Interest-earning assets: $ 29,833 $ 108,833 1.14 % 2.18 % Short-term investments $ 340 $ 2,374 $ (2,034) $ (1,134) $ (900)
486,518 753,976 4.00 % 4.16 % Investment securities(1) 19,445 31,393 (11,948) (1,258) (10,690)2,006,875 949,717 6.30 % 7.04 % Loans held for sale(2) 126,503 66,876 59,627 (7,011) 66,638
1,274,457 1,306,433 5.05 % 5.06 % Loan and lease
receivables(2) 64,342 66,112 (1,770) (156) (1,614)3,797,683 3,118,959 5.55 % 5.35 % Total interest-earning assets 210,630 166,755 43,875 (9,559) 53,434
Interest-bearing liabilities: 187,962 144,472 1.49 % 1.64 % Checking accounts 2,809 2,370 439 (211) 650
1,131,461 656,916 2.06 % 2.66 % Money market 23,350 17,480 5,870 (3,923) 9,793 888,904 1,027,097 2.66 % 3.44 % Certificates of deposit 23,625 35,312 (11,687) (8,014) (3,673)791,664 353,274 1.86 % 2.93 % Short-term debt 14,759 10,341 4,418 (3,755) 8,173 446,845 631,443 4.39 % 5.81 % FHLB advances 19,621 36,698 (17,077) (8,971) (8,106)
7,667 151 5.07 % 4.64 % Subordinated debt 389 7 382 1 381
14,272 27,307 5.84 % 4.80 % Convertible subordinated
debt 833 1,311 (478 ) 283 (761)
3,468,775 2,840,660 2.46 % 3.64 % Total interest-bearing
liabilities 85,386 103,519 (18,133 ) (24,590 ) 6,457
— — 3.09 % 1.70 % Net interest margin 125,244 63,236 62,008 15,031 46,977328,908 278,299 0.21 % 0.33 % Interest free sources — — — — —
$3,797,683 $3,118,959 3.30 % 2.03 % Net interest income to
interest-earning assets $ 125,244 $ 63,236 $ 62,008 $ 15,031 $ 46,977
(1) Based on amortized cost; changes in fair value are not considered.
65
(2) No separate treatment has been made for non-accrual loans.
(3) Variances attributable to the rate and volume mix are included in the volume variances.
Provision for Credit Losses. The provision for credit losses was $7,008 for the year ended December 31, 2003, compared to $22,417 for 2002. The 2002 figure contained $20.1 million of provisionspecifically for the CMC lease portfolio. See Part I. Item 3. Legal Proceedings included in this report for a more in-depth discussion of the CMC litigation. The increase in provision expense, excluding the $20.1 million CMC provision in 2002, is primarily related to the $869 million increase in loan and lease receivables during the period. Reference is made to the heading “Financial Condition—Asset Quality and Non-performing Assets” above for additional detail concerning the determination of provision expenserelated to maintaining the proper level of allowance for credit losses.
Non-interest Income. Non-interest income increased $133,383 to $310,544 for the year ended December 31, 2003, compared to $177,161 for 2002. Of this increase, gain on sales of mortgage loans and mortgage servicing rights accounted for $107,134. This large increase was primarily attributable to the strong performance in the financial intermediary segment and Resource’s mortgage subsidiaries not being included in the first three months of 2002. The mortgage subsidiaries’ improved results were attributable to a generally lower interest rate environment resulting in higher production and more favorable pricing conditions. Service charges and fees increased by $14,367 to $51,888 for the year ended December 31, 2003, from $37,521 in 2002. Of this increase, $7,835 is attributable to the addition of Resource’s mortgage servicing operation. The Company realized $12,188 of gains on sales of investment securities available for sale as certain investment securities were sold during 2003, compared to $5,781 during 2002. Realized gains during 2003 of $12,188 were offset in part by impairment charges of $794 on two variable, long-term corporate bonds. The bonds had traded under book value for an extended period of time due to wideningcredit spreads. Both bonds carry a Standard & Poor’s “A-” rating. Other income was $15,233 for the year ended December 31, 2003, compared to $8,897 for 2002. Of this increase, $2,561 was attributable to the inclusion of Resource’s operations for only a partial year during 2002. Other income consisted of $4,950 of gains associated with fair value adjustments on derivatives hedging NetBank’s servicing portfolio, $2,044 of revenues from MG Reinsurance, $1,999 of revenues from Republic Leasing, $1,333 of management fees and $4,907 of ancillary fees and income.
Non-interest Expense. Non-interest expense includes all operating expenses such as salaries and benefits, marketing and general and administrative expenses. Non-interest expense increased by $104,710to $348,727 for the year ended December 31, 2003, from $244,017 for 2002. Resource’s non-interest expenses during the first quarter of 2003 were approximately $43,984. However, since Resource was notacquired until March 31, 2002, its non-interest expenses for the first quarter of 2002 are not included in the 2002 non-interest expense total. The $244,017 of non-interest expense for 2002 included $10,085 of acquisition and severance costs and $18,259 of other costs associated with integrating Resource’s operations during 2002. Additionally, during 2003, the Company incurred $16,193 of prepayment fees on the early extinguishments of certain fixed-rate FHLB advances, compared to $9,944 of prepayment fees during 2002. Excluding these items, non-interest expense increased $72,877 for the year ended December 31, 2003, compared to 2002. The majority of the increase, on a comparable basis, is due to the $36,122 increase in impairment and amortization of mortgage servicing rights and the $21,347 increase insalaries and wages. The high level of refinance activity during 2003, associated with the low interest rate environment, drove the increase in amortization and impairment of mortgage servicing rights. The increase in salaries and wages was primarily driven by the $2.8 billion, on a comparable basis, increase in production during 2003 compared to 2002. Additionally, professional fees increased $5,806, on a comparable basis,due primarily to the $3.2 million of legal expenses associated with the CMC litigation. These increases were partially offset by declines in loan servicing expenses of $3,509, which should continue to decline as NetBank replaces externally serviced loans with internally originated and serviced loans, and customer

66
service expenses of $2,122 related to the consolidation of back-office processes and lower cash-item losses due to more aggressive fraud prevention efforts.
Retail Banking Segment.
The table below provides an overview of the results of operations for the retail banking segment:
2003 2002 change Net interest income . . . . . . . . . . . . . . . . . $ 53,236 $ 24,169 $ 29,067Provision for credit losses . . . . . . . . . . . . 6,989 22,394 (15,405)
Net interest income after provision. . 46,247 1,775 44,472Gain on sale of loans . . . . . . . . . . . . . . . . 71 880 (809)Fees, charges and other income. . . . . . . 11,552 14,643 (3,091)
Total revenues . . . . . . . . . . . . . . . . . . . 57,870 17,298 40,572Total expenses. . . . . . . . . . . . . . . . . . . . 61,918 67,151 (5,233)Pre-tax loss before gains on securities,
debt and net servicing results . . . . . (4,048) (49,853) 45,805Net loss on securities and prepaid
debt . . . . . . . . . . . . . . . . . . . . . . . . . . . . . (4,799) (4,163) (636 ) Net servicing results . . . . . . . . . . . . . . . . . (52,171) (3,122) (49,049)
Pre-tax loss . . . . . . . . . . . . . . . . . . . . . . $ (61,018) $ (57,138) $ (3,880)
Average earning assets . . . . . . . . . . . . . . $ 3,744,553 $3,022,136 $ 722,417Average UPB underlying MSRs . . . . . . $10,146,432 $4,765,262 $5,381,170
Operations to average earning assetsNet interest income . . . . . . . . . . . . . . . . . 1.42% 0.80% 0.62%Provision . . . . . . . . . . . . . . . . . . . . . . . . . . 0.19% 0.74% (0.55)%Net interest income after provision. . . . 1.23% 0.06% 1.17%Fees, charges and other income. . . . . . . 0.31% 0.51% (0.20)%Banking revenues . . . . . . . . . . . . . . . . . . . 1.54% 0.57% 0.97%Total expenses. . . . . . . . . . . . . . . . . . . . . . 1.65% 2.22% (0.57)%Pre-tax income before net gains on
securities, debt and net servicing results . . . . . . . . . . . . . . . . . . . . . . . . . . . (0.11)% (1.65)% 1.54 %
Net servicing results to UPB underlying MSRs . . . . . . . . . . . . . . . . . . . . . . . . . . . (0.51)% (0.07)% (0.44)%
Net interest income increased $29,067 during 2003, or 62 basis points, compared to 2002. This increase is primarily due to a decline in the cost of funds during 2003 compared with 2002 and the inclusion of premium impairment charges of approximately $12.5 million in 2002. The decline in the cost of funds was achieved through increased deposits, its lowest rate source of funds, and prepaying $364 million of fixed rate FHLB advances, its highest cost source of funds. Provision for credit losses declined by $15,405 primarily due to $20.1 million of provision specifically for the CMC lease portfolio recorded during 2002. See Item 3. “Legal Proceedings” included in this report for a more in depth discussion of the CMC litigation. Adjusted for the $20.1 million and for NetBank Business Financing,which was only included in nine months of 2002, provision expense increased by $10,287 due to the retention of $1.2 billion of internally originated mortgage loans, auto loans and leases during 2003. Service charges and fees declined $3,091 during 2003 compared to 2002, primarily due to tighter underwriting guidelines curtailing overdrawn deposit fees. The decline in fee income is somewhat offset by a decline in cash item losses, which is included in total expenses. Despite a 24% increase in deposits, the retail bank

67
managed to reduce its total expenses by $5,233. Total expenses in 2003 include a full year of Republic Leasing compared to only nine months during 2002, a difference of $1,760. Total expenses for 2002 included $7,494 of charges associated with the acquisition and integration of Resource. Excluding the period-over-period changes, total expenses declined primarily due to a decrease of $4,551 in external loanservicing fees and a decline of $2,177 in customer service expenses, which includes cash item losses. These declines were offset in part by increases of $1,804 in salaries and benefits, $1,899 in data processing and $1,645 in professional fees. The retail banking segment’s 2003 earnings were lower than expected due to the $16,193 of prepayment fees on FHLB advances and the retail bank lending a large portion of its funds to the financial intermediary segment to support its record $18.9 billion of production. The retail banking segment finances the mortgage operations in the financial intermediary segment at warehouse rates, which are generally lower than what the retail banking segment would earn by directly investing in longer-term assets.
Financial Intermediary Segment.
The following table highlights the financial intermediary segment’s production and sales activities:
2003 2002 change Net interest income . . . . . . . . . . . . . . . . . $ 73,416 $ 40,045 $ 33,371Gain on sales of loans . . . . . . . . . . . . . . . 236,209 124,503 111,706Other income . . . . . . . . . . . . . . . . . . . . . . 4,676 (716) 5,392Net MG Reinsurance results . . . . . . . . . 1,919 1,729 190
Total revenues . . . . . . . . . . . . . . . . . . . 316,220 165,561 150,659Salary and employee benefits. . . . . . . . . 105,315 71,799 33,516Occupancy & Depreciation . . . . . . . . . . 23,203 17,488 5,715Other expenses . . . . . . . . . . . . . . . . . . . . . 29,623 23,567 6,056
Total expenses . . . . . . . . . . . . . . . . . . . 158,141 112,854 45,287Pre-tax income . . . . . . . . . . . . . . . . . . . $ 158,079 $ 52,707 $ 105,372
Production. . . . . . . . . . . . . . . . . . . . . . . . . $18,921,756 $11,731,439 $7,190,317Sales(1) . . . . . . . . . . . . . . . . . . . . . . . . . . . $18,315,651 $11,411,954 $6,903,697
Total revenues to sales . . . . . . . . . . . . . . 1.73% 1.45% 0.28% Total expenses to production . . . . . . . . . 0.84% 0.96% (0.12)%
Pre-tax margin . . . . . . . . . . . . . . . . . . . 0.89% 0.49% 0.40%
(1) 2003 includes $1,183,221 of intercompany sales to the retail bank segment.
For the year ended December 31, 2003, the financial intermediary segment had record pre-tax income of $158,079, compared to $52,707 for 2002. The $105,372 increase was driven primarily by increases of$7.2 billion in production and $6.9 billion in sales due the addition of Resource’s mortgage operations on March 31, 2002, which would only be included in nine of the twelve months during the 2002 period, coupled with an increase of 40 basis points in the pre-tax margin due to industry pipelines approaching capacity during the first nine months of 2003 causing pricing pressures to ease.
68
Transaction Processing Segment.
The following table highlights the results of operations for the transaction processing segment:
2003 2002 change Total revenue . . . . . . . . . . . . . . . . . . . . . . . . . . . . . . . . . . . $18,633 $ 6,616 $ 12,017Total expenses. . . . . . . . . . . . . . . . . . . . . . . . . . . . . . . . . . . 22,617 15,111 7,506
Pre-tax loss . . . . . . . . . . . . . . . . . . . . . . . . . . . . . . . . . . . $ (3,984) $ (8,495) $ 4,511
During 2003 and 2002, the transaction processing segment primarily consisted of the servicing division. NPS, the ATM and merchant processing division, was not purchased until December 1, 2003 and therefore its results of operations are only included from that date forward. The improved pre-tax loss of $4,511 during 2003 compared to 2002 was primarily related to the increase in loans serviced by thetransaction processing segment on behalf of the retail bank and financial intermediary segments. The increase in loans serviced enabled the servicing division to take advantage of greater economies of scale.
Other & Elimination Segment.
For the year ended December 31, 2003, the other & elimination segment recorded a pre-tax loss of $13,024 compared to a pre-tax loss of $13,111 for the same period of 2002. This amount represents NetBank’s holding company expenses and the elimination of intersegment revenues and expenses. The elimination of intersegment revenues primarily consist of the deferral of gains associated with the sale of loans to the retail banking segment from the financial intermediary segment and loan servicing fees paid by the retail banking and financial intermediary segments to the transaction processing segment.
Liquidity and Capital Resources
Liquidity. NetBank’s liquidity, represented by cash and cash equivalents, is a product of its operating, investing, and financing activities. NetBank’s primary sources of funds are deposits, borrowings, prepayments and maturities of outstanding loans, sales of loans, sales or maturities of investment securities and other short-term investments, and funds provided from operations. While scheduled loan payments and maturing investment securities and short-term investments are relatively predictable sources of funds, deposit flows and loan prepayments are greatly influenced by general interest rates, economic conditions, and competition. NetBank can use cash generated through the retail deposit market, its traditional funding source, to offset the cash utilized in investing activities. NetBank’s available for sale securities and short-term interest-earning assets can also be used to provide liquidity for lending and other operational requirements. Net cash inflow for 2004 was $116,675 compared to a net cash outflow of $77,938 for 2003. The increase in net cash flow for 2004 was primarily due to sales of loans held for sale outpacing originations by $889 million. This cash inflow was offset, in part, by originations of loan and lease receivables of $1.4 billion outpacing sales, repayments and maturities of $1.0 billion, and purchases of investment securities of $874 million outpacing sales, repayments and maturities of $638 million.
As an additional source of funds, NetBank had available under existing lines of credit agreements$1.1 billion at December 31, 2004 (see note 11 of the notes to the consolidated financial statementsincluded in this report for additional details of the available lines of credit).
The Company uses deposits as its principal source of funds. During 2004 compared to 2003, deposits increased by $100 million to $2.6 billion from $2.5 billion as of December 31, 2003. NetBank’s deposit products include checking, money market and certificates of deposit accounts. Deposit account terms vary, with the principal differences being the minimum balance required, the time periods the funds must remain on deposit and the interest rate. NetBank is competitive in the types of accounts, services and ranges of interest rates offered on deposit products. Although market demand generally dictates which
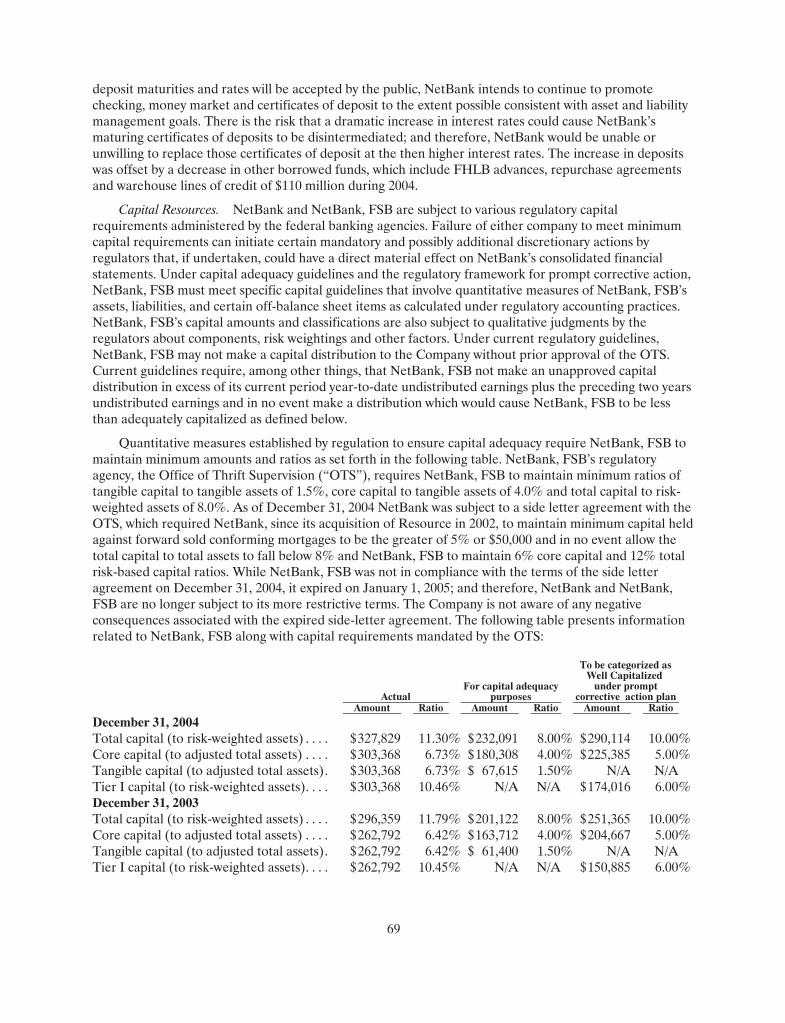
69
deposit maturities and rates will be accepted by the public, NetBank intends to continue to promote checking, money market and certificates of deposit to the extent possible consistent with asset and liability management goals. There is the risk that a dramatic increase in interest rates could cause NetBank’s maturing certificates of deposits to be disintermediated; and therefore, NetBank would be unable or unwilling to replace those certificates of deposit at the then higher interest rates. The increase in deposits was offset by a decrease in other borrowed funds, which include FHLB advances, repurchase agreements and warehouse lines of credit of $110 million during 2004.
Capital Resources. NetBank and NetBank, FSB are subject to various regulatory capital requirements administered by the federal banking agencies. Failure of either company to meet minimum capital requirements can initiate certain mandatory and possibly additional discretionary actions by regulators that, if undertaken, could have a direct material effect on NetBank’s consolidated financial statements. Under capital adequacy guidelines and the regulatory framework for prompt corrective action, NetBank, FSB must meet specific capital guidelines that involve quantitative measures of NetBank, FSB’s assets, liabilities, and certain off-balance sheet items as calculated under regulatory accounting practices. NetBank, FSB’s capital amounts and classifications are also subject to qualitative judgments by the regulators about components, risk weightings and other factors. Under current regulatory guidelines, NetBank, FSB may not make a capital distribution to the Company without prior approval of the OTS. Current guidelines require, among other things, that NetBank, FSB not make an unapproved capital distribution in excess of its current period year-to-date undistributed earnings plus the preceding two years undistributed earnings and in no event make a distribution which would cause NetBank, FSB to be less than adequately capitalized as defined below.
Quantitative measures established by regulation to ensure capital adequacy require NetBank, FSB to maintain minimum amounts and ratios as set forth in the following table. NetBank, FSB’s regulatory agency, the Office of Thrift Supervision (“OTS”), requires NetBank, FSB to maintain minimum ratios of tangible capital to tangible assets of 1.5%, core capital to tangible assets of 4.0% and total capital to risk-weighted assets of 8.0%. As of December 31, 2004 NetBank was subject to a side letter agreement with the OTS, which required NetBank, since its acquisition of Resource in 2002, to maintain minimum capital held against forward sold conforming mortgages to be the greater of 5% or $50,000 and in no event allow the total capital to total assets to fall below 8% and NetBank, FSB to maintain 6% core capital and 12% total risk-based capital ratios. While NetBank, FSB was not in compliance with the terms of the side letter agreement on December 31, 2004, it expired on January 1, 2005; and therefore, NetBank and NetBank, FSB are no longer subject to its more restrictive terms. The Company is not aware of any negative consequences associated with the expired side-letter agreement. The following table presents informationrelated to NetBank, FSB along with capital requirements mandated by the OTS:
ActualFor capital adequacy
purposes
To be categorized asWell Capitalized
under promptcorrective action plan
Amount Ratio Amount Ratio Amount RatioDecember 31, 2004Total capital (to risk-weighted assets) . . . . $327,829 11.30% $232,091 8.00% $290,114 10.00%Core capital (to adjusted total assets) . . . . $303,368 6.73% $180,308 4.00% $225,385 5.00%Tangible capital (to adjusted total assets). $ 303,368 6.73% $ 67,615 1.50% N/A N/A Tier I capital (to risk-weighted assets). . . . $303,368 10.46% N/A N/A $ 174,016 6.00%December 31, 2003Total capital (to risk-weighted assets) . . . . $296,359 11.79% $201,122 8.00% $251,365 10.00%Core capital (to adjusted total assets) . . . . $262,792 6.42% $163,712 4.00% $204,667 5.00%Tangible capital (to adjusted total assets). $ 262,792 6.42% $ 61,400 1.50% N/A N/A Tier I capital (to risk-weighted assets). . . . $262,792 10.45% N/A N/A $ 150,885 6.00%

70
In addition, NetBank’s subsidiaries engaged in mortgage banking must adhere to various HUD regulatory guidelines including required minimum net worth to maintain their FHA approved lending status. Failure to comply with the HUD guidelines could result in withdrawal of this certification. As ofDecember 31, 2004, Market Street and Meritage were in compliance with HUD guidelines. NetBank and its subsidiaries are subject to various other capital requirements by secondary market investors and states. None of these capital requirements are more stringent than the OTS capital requirements. Failure to comply with these restrictions could have a material adverse impact on the Company’s results of operations. Other than the side letter deficiency as previously described, all of the capital requirements placed upon NetBank and its subsidiaries were met as of December 31, 2004.
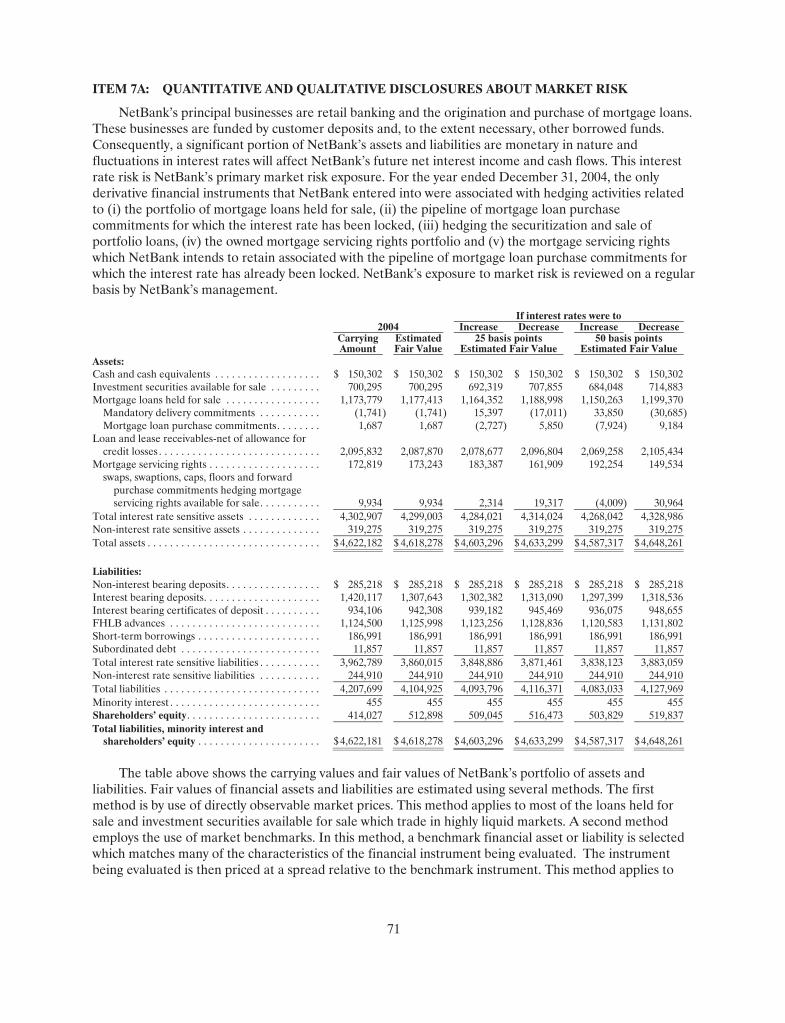
71
ITEM 7A: QUANTITATIVE AND QUALITATIVE DISCLOSURES ABOUT MARKET RISK
NetBank’s principal businesses are retail banking and the origination and purchase of mortgage loans. These businesses are funded by customer deposits and, to the extent necessary, other borrowed funds. Consequently, a significant portion of NetBank’s assets and liabilities are monetary in nature and fluctuations in interest rates will affect NetBank’s future net interest income and cash flows. This interest rate risk is NetBank’s primary market risk exposure. For the year ended December 31, 2004, the only derivative financial instruments that NetBank entered into were associated with hedging activities related to (i) the portfolio of mortgage loans held for sale, (ii) the pipeline of mortgage loan purchase commitments for which the interest rate has been locked, (iii) hedging the securitization and sale of portfolio loans, (iv) the owned mortgage servicing rights portfolio and (v) the mortgage servicing rights which NetBank intends to retain associated with the pipeline of mortgage loan purchase commitments for which the interest rate has already been locked. NetBank’s exposure to market risk is reviewed on a regular basis by NetBank’s management.
If interest rates were to 2004 Increase Decrease Increase Decrease
CarryingAmount
EstimatedFair Value
25 basis pointsEstimated Fair Value
50 basis pointsEstimated Fair Value
Assets: Cash and cash equivalents . . . . . . . . . . . . . . . . . . . $ 150,302 $ 150,302 $ 150,302 $ 150,302 $ 150,302 $ 150,302Investment securities available for sale . . . . . . . . . 700,295 700,295 692,319 707,855 684,048 714,883Mortgage loans held for sale . . . . . . . . . . . . . . . . . 1,173,779 1,177,413 1,164,352 1,188,998 1,150,263 1,199,370
Mandatory delivery commitments . . . . . . . . . . . (1,741) (1,741) 15,397 (17,011) 33,850 (30,685)Mortgage loan purchase commitments. . . . . . . . 1,687 1,687 (2,727) 5,850 (7,924) 9,184
Loan and lease receivables-net of allowance for credit losses . . . . . . . . . . . . . . . . . . . . . . . . . . . . . 2,095,832 2,087,870 2,078,677 2,096,804 2,069,258 2,105,434
Mortgage servicing rights . . . . . . . . . . . . . . . . . . . . 172,819 173,243 183,387 161,909 192,254 149,534swaps, swaptions, caps, floors and forward
purchase commitments hedging mortgage servicing rights available for sale. . . . . . . . . . . 9,934 9,934 2,314 19,317 (4,009) 30,964
Total interest rate sensitive assets . . . . . . . . . . . . . 4,302,907 4,299,003 4,284,021 4,314,024 4,268,042 4,328,986Non-interest rate sensitive assets . . . . . . . . . . . . . . 319,275 319,275 319,275 319,275 319,275 319,275Total assets . . . . . . . . . . . . . . . . . . . . . . . . . . . . . . . $ 4,622,182 $ 4,618,278 $ 4,603,296 $ 4,633,299 $ 4,587,317 $ 4,648,261
Liabilities: Non-interest bearing deposits. . . . . . . . . . . . . . . . . $ 285,218 $ 285,218 $ 285,218 $ 285,218 $ 285,218 $ 285,218Interest bearing deposits. . . . . . . . . . . . . . . . . . . . . 1,420,117 1,307,643 1,302,382 1,313,090 1,297,399 1,318,536Interest bearing certificates of deposit . . . . . . . . . . 934,106 942,308 939,182 945,469 936,075 948,655FHLB advances . . . . . . . . . . . . . . . . . . . . . . . . . . . 1,124,500 1,125,998 1,123,256 1,128,836 1,120,583 1,131,802Short-term borrowings . . . . . . . . . . . . . . . . . . . . . . 186,991 186,991 186,991 186,991 186,991 186,991Subordinated debt . . . . . . . . . . . . . . . . . . . . . . . . . 11,857 11,857 11,857 11,857 11,857 11,857Total interest rate sensitive liabilities . . . . . . . . . . . 3,962,789 3,860,015 3,848,886 3,871,461 3,838,123 3,883,059Non-interest rate sensitive liabilities . . . . . . . . . . . 244,910 244,910 244,910 244,910 244,910 244,910Total liabilities . . . . . . . . . . . . . . . . . . . . . . . . . . . . 4,207,699 4,104,925 4,093,796 4,116,371 4,083,033 4,127,969Minority interest . . . . . . . . . . . . . . . . . . . . . . . . . . . 455 455 455 455 455 455Shareholders’ equity. . . . . . . . . . . . . . . . . . . . . . . . 414,027 512,898 509,045 516,473 503,829 519,837 Total liabilities, minority interest and
shareholders’ equity . . . . . . . . . . . . . . . . . . . . . . $ 4,622,181 $ 4,618,278 $ 4,603,296 $ 4,633,299 $ 4,587,317 $ 4,648,261
The table above shows the carrying values and fair values of NetBank’s portfolio of assets and liabilities. Fair values of financial assets and liabilities are estimated using several methods. The first method is by use of directly observable market prices. This method applies to most of the loans held for sale and investment securities available for sale which trade in highly liquid markets. A second method employs the use of market benchmarks. In this method, a benchmark financial asset or liability is selectedwhich matches many of the characteristics of the financial instrument being evaluated. The instrumentbeing evaluated is then priced at a spread relative to the benchmark instrument. This method applies to

72
many loan and lease receivables. A third method used to estimate the fair value of an instrument employs approximating a spread over a readily available market index or yield curve. This method is used where nodirectly observable market exists and no suitable benchmark instrument can be found. Many depositaccounts are evaluated in this manner. Based on these fair value estimates, the data indicates that the net value of assets and liabilities exceeds that of their associated carry value. Most of this excess value is derived from the origination of interest bearing deposits. Additionally, the table shows the exposure of the portfolio to theoretical instantaneous and parallel changes in market interest rates of 25 and 50 basis points. These simulated values are created using complex financial models which incorporate manyassumptions. Prudent balance sheet management dictates that changes in value for one instrument should be offset to some extent by another balance sheet instrument. For example, the largest single component of market exposure is loan and lease receivables. This category declines in theoretical value by $9.2 millionfor a 25 basis point increase in rates. This exposure is mitigated by the duration of interest bearing deposits having offsetting exposure of $5.3 million, and interest bearing certificates of deposit with offsetting exposure of $3.1 million. While most of the risk is balanced out in this manner, the data suggests that the Company benefits in a decline in market interest rates, versus a rise in interest rates. This is commonly referred to as a liability sensitive position. Management carefully manages the exposure to these scenario simulations and many others, which are intended to be broadly representative of the likely future path of interest rates. In examining the table presented above, one point that is worth consideration, as a simplifying assumption, this analysis assumes that risk exposure is passively rather than actively managed, in other words, management does not attempt to alter the balance sheet position to changing market levels. In practice, management closely monitors market exposure levels and actively manages the position.
Reference is made to note 22 of the notes to the consolidated financial statements included in this report for additional details regarding the valuation of NetBank’s market and interest rate sensitive assets and liabilities.
One of the ways NetBank, FSB, like other savings banks, measures interest rate risk is based on a Net Portfolio Value (“NPV”) analysis. NPV equals the present value of expected net cash flows from existing assets minus the present value of expected net cash flows from existing liabilities. An NPV ratio is determined by dividing NPV by the present value of assets. The following table sets forth the estimated NetBank, FSB NPV ratios as of December 31, 2004 and December 31, 2003 assuming rate shocks of +300to -100 basis points:
Limits and current NPV ratios for NetBank, FSB
Rate shock (in basis points)
As ofDecember 31,
2004
As ofDecember 31,
2003
Minimum as ofDecember 31,
2004+300 7.75% 6.54% 4.00 % +200 8.03% 7.37% 6.00 % +100 8.63% 8.17% 6.00 % Flat 8.96% 8.66% 6.00 % -100 9.19% 9.07% 6.00 %
Minimum ratios for NPV risk are established by the Board of Directors as prudent levels for the respective interest rate scenarios. Lower NPV ratios denote more market rate sensitivity for a given rate scenario. As of December 31, 2004 the analysis indicates sensitivity to rising market interest rates. This isconsistent with the fair value analysis presented above and incorporates many of the same assumptions used in the fair value analysis. This sensitivity is, however, well within the board approved limits for these scenarios. Computation of prospective effects of hypothetical rate changes is based on many assumptions,including relative levels of market interest rates, loan prepayments and deposit decay. They should not be relied upon as indicative of actual results. Further, the computations do not contemplate certain actions management could undertake in response to changes in interest rates.

73
ITEM 8. FINANCIAL STATEMENTS AND SUPPLEMENTATARY DATA
Consolidated Financial StatementsNetBank, Inc.
Years ended December 31, 2004, 2003 and 2002with Report of Independent Registered Public Accounting Firm
Index to Consolidated Financial Statements
Item Report of Independent Registered Public Accounting Firm. . . . . . . . . . . . . . . . . . . . . . . . . . . . . . . . . . 74
Consolidated Balance Sheets . . . . . . . . . . . . . . . . . . . . . . . . . . . . . . . . . . . . . . . . . . . . . . . . . . . . . . . . . . . . 75
Consolidated Statements of Operations . . . . . . . . . . . . . . . . . . . . . . . . . . . . . . . . . . . . . . . . . . . . . . . . . . . 76
Consolidated Statements of Shareholders’ Equity . . . . . . . . . . . . . . . . . . . . . . . . . . . . . . . . . . . . . . . . . . 77
Consolidated Statements of Cash Flows . . . . . . . . . . . . . . . . . . . . . . . . . . . . . . . . . . . . . . . . . . . . . . . . . . . 78
Notes to Consolidated Financial Statements . . . . . . . . . . . . . . . . . . . . . . . . . . . . . . . . . . . . . . . . . . . . . . . 79

74
Report of Independent Registered Public Accounting Firm
The Board of Directors and Shareholders of NetBank, Inc.
We have audited the accompanying consolidated balance sheets of NetBank, Inc. as of December 31, 2004 and 2003, and the related consolidated statements of operations, shareholders’ equity, and cash flows for each of the three years in the period ended December 31, 2004. These financial statements are the responsibility of NetBank, Inc.’s management. Our responsibility is to express an opinion on these financial statements based on our audits.
We conducted our audits in accordance with the standards of the Public Company Accounting Oversight Board (United States). Those standards require that we plan and perform the audit to obtainreasonable assurance about whether the financial statements are free of material misstatement. An audit includes examining, on a test basis, evidence supporting the amounts and disclosures in the financial statements. An audit also includes assessing the accounting principles used and significant estimates made by management, as well as evaluating the overall financial statement presentation. We believe that our audits provide a reasonable basis for our opinion.
In our opinion, the financial statements referred to above present fairly, in all material respects, the consolidated financial position of NetBank, Inc. at December 31, 2004 and 2003, and the consolidated results of its operations and its cash flows for each of the three years in the period ended December 31, 2004, in conformity with U.S. generally accepted accounting principles.
We also have audited, in accordance with the standards of the Public Company Accounting Oversight Board (United States), the effectiveness of NetBank, Inc.’s internal control over financial reporting as of December 31, 2004, based on criteria established in Internal Control-Integrated Framework issued by the Committee of Sponsoring Organizations of the Treadway Commission and our report dated March 11, 2005 expressed an unqualified opinion on management’s assessment of the effectiveness of internal control over financial reporting and an adverse opinion on the effectiveness of internal control over financial reporting.
/s/ Ernst & Young LLP
Atlanta, Georgia March 11, 2005
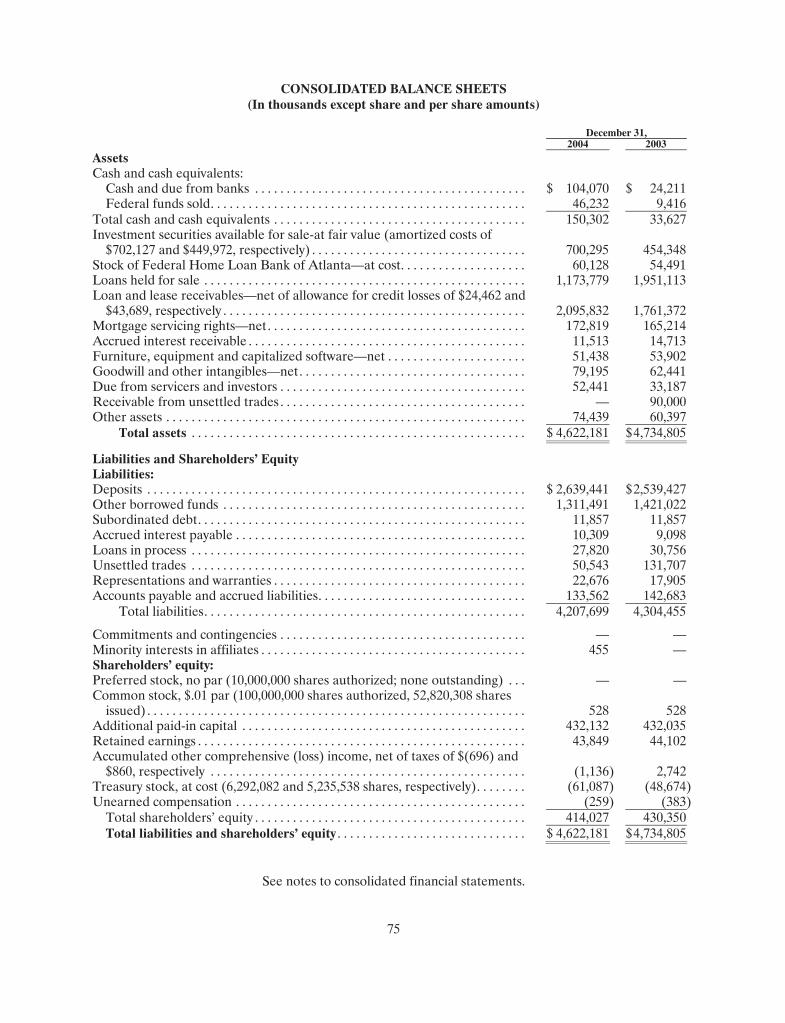
See notes to consolidated financial statements.
75
CONSOLIDATED BALANCE SHEETS(In thousands except share and per share amounts)
December 31, 2004 2003
Assets Cash and cash equivalents:
Cash and due from banks . . . . . . . . . . . . . . . . . . . . . . . . . . . . . . . . . . . . . . . . . . . $ 104,070 $ 24,211Federal funds sold. . . . . . . . . . . . . . . . . . . . . . . . . . . . . . . . . . . . . . . . . . . . . . . . . . 46,232 9,416
Total cash and cash equivalents . . . . . . . . . . . . . . . . . . . . . . . . . . . . . . . . . . . . . . . . 150,302 33,627Investment securities available for sale-at fair value (amortized costs of
$702,127 and $449,972, respectively) . . . . . . . . . . . . . . . . . . . . . . . . . . . . . . . . . . 700,295 454,348Stock of Federal Home Loan Bank of Atlanta—at cost. . . . . . . . . . . . . . . . . . . . 60,128 54,491Loans held for sale . . . . . . . . . . . . . . . . . . . . . . . . . . . . . . . . . . . . . . . . . . . . . . . . . . . 1,173,779 1,951,113Loan and lease receivables—net of allowance for credit losses of $24,462 and
$43,689, respectively . . . . . . . . . . . . . . . . . . . . . . . . . . . . . . . . . . . . . . . . . . . . . . . . 2,095,832 1,761,372Mortgage servicing rights—net. . . . . . . . . . . . . . . . . . . . . . . . . . . . . . . . . . . . . . . . . 172,819 165,214Accrued interest receivable . . . . . . . . . . . . . . . . . . . . . . . . . . . . . . . . . . . . . . . . . . . . 11,513 14,713Furniture, equipment and capitalized software—net . . . . . . . . . . . . . . . . . . . . . . 51,438 53,902Goodwill and other intangibles—net. . . . . . . . . . . . . . . . . . . . . . . . . . . . . . . . . . . . 79,195 62,441Due from servicers and investors . . . . . . . . . . . . . . . . . . . . . . . . . . . . . . . . . . . . . . . 52,441 33,187Receivable from unsettled trades . . . . . . . . . . . . . . . . . . . . . . . . . . . . . . . . . . . . . . . — 90,000Other assets . . . . . . . . . . . . . . . . . . . . . . . . . . . . . . . . . . . . . . . . . . . . . . . . . . . . . . . . . 74,439 60,397
Total assets . . . . . . . . . . . . . . . . . . . . . . . . . . . . . . . . . . . . . . . . . . . . . . . . . . . . . $ 4,622,181 $4,734,805
Liabilities and Shareholders’ Equity Liabilities: Deposits . . . . . . . . . . . . . . . . . . . . . . . . . . . . . . . . . . . . . . . . . . . . . . . . . . . . . . . . . . . . $ 2,639,441 $2,539,427Other borrowed funds . . . . . . . . . . . . . . . . . . . . . . . . . . . . . . . . . . . . . . . . . . . . . . . . 1,311,491 1,421,022Subordinated debt. . . . . . . . . . . . . . . . . . . . . . . . . . . . . . . . . . . . . . . . . . . . . . . . . . . . 11,857 11,857Accrued interest payable . . . . . . . . . . . . . . . . . . . . . . . . . . . . . . . . . . . . . . . . . . . . . . 10,309 9,098Loans in process . . . . . . . . . . . . . . . . . . . . . . . . . . . . . . . . . . . . . . . . . . . . . . . . . . . . . 27,820 30,756Unsettled trades . . . . . . . . . . . . . . . . . . . . . . . . . . . . . . . . . . . . . . . . . . . . . . . . . . . . . 50,543 131,707Representations and warranties . . . . . . . . . . . . . . . . . . . . . . . . . . . . . . . . . . . . . . . . 22,676 17,905Accounts payable and accrued liabilities. . . . . . . . . . . . . . . . . . . . . . . . . . . . . . . . . 133,562 142,683
Total liabilities. . . . . . . . . . . . . . . . . . . . . . . . . . . . . . . . . . . . . . . . . . . . . . . . . . . 4,207,699 4,304,455
Commitments and contingencies . . . . . . . . . . . . . . . . . . . . . . . . . . . . . . . . . . . . . . . — —Minority interests in affiliates . . . . . . . . . . . . . . . . . . . . . . . . . . . . . . . . . . . . . . . . . . 455 —Shareholders’ equity: Preferred stock, no par (10,000,000 shares authorized; none outstanding) . . . — —Common stock, $.01 par (100,000,000 shares authorized, 52,820,308 shares
issued) . . . . . . . . . . . . . . . . . . . . . . . . . . . . . . . . . . . . . . . . . . . . . . . . . . . . . . . . . . . . 528 528Additional paid-in capital . . . . . . . . . . . . . . . . . . . . . . . . . . . . . . . . . . . . . . . . . . . . . 432,132 432,035Retained earnings . . . . . . . . . . . . . . . . . . . . . . . . . . . . . . . . . . . . . . . . . . . . . . . . . . . . 43,849 44,102Accumulated other comprehensive (loss) income, net of taxes of $(696) and
$860, respectively . . . . . . . . . . . . . . . . . . . . . . . . . . . . . . . . . . . . . . . . . . . . . . . . . . (1,136 ) 2,742Treasury stock, at cost (6,292,082 and 5,235,538 shares, respectively). . . . . . . . (61,087) (48,674)Unearned compensation . . . . . . . . . . . . . . . . . . . . . . . . . . . . . . . . . . . . . . . . . . . . . . (259) (383)
Total shareholders’ equity . . . . . . . . . . . . . . . . . . . . . . . . . . . . . . . . . . . . . . . . . . . 414,027 430,350Total liabilities and shareholders’ equity . . . . . . . . . . . . . . . . . . . . . . . . . . . . . . $ 4,622,181 $4,734,805

See notes to the consolidated financial statements.
76
CONSOLIDATED STATEMENTS OF OPERATIONS(In thousands except share and per share amounts)
For the years ended December 31, 2004 2003 2002
Interest income: Loans and leases . . . . . . . . . . . . . . . . . . . . . . . . . . . . . . . . . . . . . . . . . . . . $210,260 $190,845 $132,988Investment securities . . . . . . . . . . . . . . . . . . . . . . . . . . . . . . . . . . . . . . . . 20,838 19,445 31,393Short-term investments . . . . . . . . . . . . . . . . . . . . . . . . . . . . . . . . . . . . . . 1,065 340 2,374Total interest income . . . . . . . . . . . . . . . . . . . . . . . . . . . . . . . . . . . . . . . . 232,163 210,630 166,755
Interest expense:Deposits . . . . . . . . . . . . . . . . . . . . . . . . . . . . . . . . . . . . . . . . . . . . . . . . . . . 47,044 49,784 55,162Other borrowed funds . . . . . . . . . . . . . . . . . . . . . . . . . . . . . . . . . . . . . . . 45,573 35,602 48,357Total interest expense . . . . . . . . . . . . . . . . . . . . . . . . . . . . . . . . . . . . . . . 92,617 85,386 103,519
Net interest income. . . . . . . . . . . . . . . . . . . . . . . . . . . . . . . . . . . . . . . . . . . . 139,546 125,244 63,236Provision for credit losses . . . . . . . . . . . . . . . . . . . . . . . . . . . . . . . . . . . . . . 34,777 7,008 22,417Net interest income after provision for credit losses. . . . . . . . . . . . . . . . 104,769 118,236 40,819Non-interest income:
Service charges and fees . . . . . . . . . . . . . . . . . . . . . . . . . . . . . . . . . . . . . 68,583 51,888 37,521Gains on sales of loans and mortgage servicing rights, net of
provision for estimated losses on repurchases . . . . . . . . . . . . . . . . . 115,574 232,029 124,895Gains on the early extinguishment of debt . . . . . . . . . . . . . . . . . . . . . . — — 67Gains on sales of securities, net . . . . . . . . . . . . . . . . . . . . . . . . . . . . . . . 7,780 11,394 5,781Other income. . . . . . . . . . . . . . . . . . . . . . . . . . . . . . . . . . . . . . . . . . . . . . . 8,414 15,233 8,897Gains on derivatives, net . . . . . . . . . . . . . . . . . . . . . . . . . . . . . . . . . . . . . 7,000 — —Total non-interest income . . . . . . . . . . . . . . . . . . . . . . . . . . . . . . . . . . . . 207,351 310,544 177,161
Non-interest expense:Salaries and benefits. . . . . . . . . . . . . . . . . . . . . . . . . . . . . . . . . . . . . . . . . 125,864 132,667 93,925Customer service. . . . . . . . . . . . . . . . . . . . . . . . . . . . . . . . . . . . . . . . . . . . 12,530 10,964 13,501Loan servicing . . . . . . . . . . . . . . . . . . . . . . . . . . . . . . . . . . . . . . . . . . . . . . 2,542 2,140 5,649Marketing. . . . . . . . . . . . . . . . . . . . . . . . . . . . . . . . . . . . . . . . . . . . . . . . . . 9,255 8,495 6,636Data processing . . . . . . . . . . . . . . . . . . . . . . . . . . . . . . . . . . . . . . . . . . . . . 18,705 16,092 12,722Depreciation and amortization. . . . . . . . . . . . . . . . . . . . . . . . . . . . . . . . 20,024 15,801 15,312Impairment and amortization of mortgage servicing rights. . . . . . . . 46,603 72,479 26,945Office expenses . . . . . . . . . . . . . . . . . . . . . . . . . . . . . . . . . . . . . . . . . . . . . 11,331 10,495 9,020Occupancy . . . . . . . . . . . . . . . . . . . . . . . . . . . . . . . . . . . . . . . . . . . . . . . . . 21,896 19,298 15,474Travel and entertainment . . . . . . . . . . . . . . . . . . . . . . . . . . . . . . . . . . . . 5,245 4,484 3,096Professional services. . . . . . . . . . . . . . . . . . . . . . . . . . . . . . . . . . . . . . . . . 16,370 17,390 9,719Prepaid lost interest from curtailments. . . . . . . . . . . . . . . . . . . . . . . . . 5,356 10,026 4,285Other expenses . . . . . . . . . . . . . . . . . . . . . . . . . . . . . . . . . . . . . . . . . . . . . 9,239 12,203 7,704Prepayment fees on the early extinguishment of debt . . . . . . . . . . . . — 16,193 9,944Non-recurring acquisition and severance . . . . . . . . . . . . . . . . . . . . . . . — — 10,085Minority interests in net earnings of consolidated affiliates . . . . . . . 830 — —Total non-interest expense . . . . . . . . . . . . . . . . . . . . . . . . . . . . . . . . . . . 305,790 348,727 244,017
Income (loss) before income taxes. . . . . . . . . . . . . . . . . . . . . . . . . . . . . . . 6,330 80,053 (26,037)Income tax (expense) benefit . . . . . . . . . . . . . . . . . . . . . . . . . . . . . . . . . . . (2,110) (29,539) 10,180Net income (loss) . . . . . . . . . . . . . . . . . . . . . . . . . . . . . . . . . . . . . . . . . . . . . $ 4,220 $ 50,514 $ (15,857)Net income (loss) per share outstanding:
Basic . . . . . . . . . . . . . . . . . . . . . . . . . . . . . . . . . . . . . . . . . . . . . . . . . . . . . . $ 0.09 $ 1.05 $ (0.36)Diluted . . . . . . . . . . . . . . . . . . . . . . . . . . . . . . . . . . . . . . . . . . . . . . . . . . . . $ 0.09 $ 1.04 $ (0.36)
Weighted average shares outstanding:Basic . . . . . . . . . . . . . . . . . . . . . . . . . . . . . . . . . . . . . . . . . . . . . . . . . . . . . . 46,862 47,963 44,407Diluted . . . . . . . . . . . . . . . . . . . . . . . . . . . . . . . . . . . . . . . . . . . . . . . . . . . . 47,214 48,645 44,407
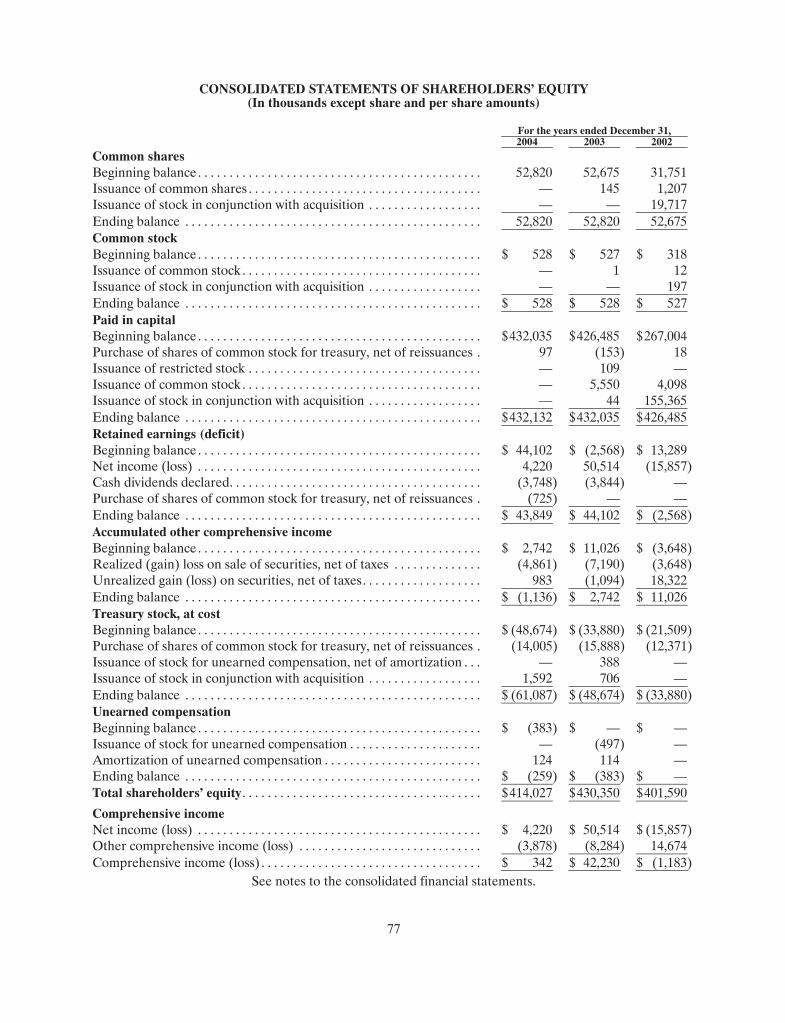
See notes to the consolidated financial statements.
77
CONSOLIDATED STATEMENTS OF SHAREHOLDERS’ EQUITY (In thousands except share and per share amounts)
For the years ended December 31, 2004 2003 2002
Common shares Beginning balance . . . . . . . . . . . . . . . . . . . . . . . . . . . . . . . . . . . . . . . . . . . . . 52,820 52,675 31,751Issuance of common shares . . . . . . . . . . . . . . . . . . . . . . . . . . . . . . . . . . . . . — 145 1,207Issuance of stock in conjunction with acquisition . . . . . . . . . . . . . . . . . . — — 19,717Ending balance . . . . . . . . . . . . . . . . . . . . . . . . . . . . . . . . . . . . . . . . . . . . . . . 52,820 52,820 52,675Common stock Beginning balance . . . . . . . . . . . . . . . . . . . . . . . . . . . . . . . . . . . . . . . . . . . . . $ 528 $ 527 $ 318Issuance of common stock . . . . . . . . . . . . . . . . . . . . . . . . . . . . . . . . . . . . . . — 1 12Issuance of stock in conjunction with acquisition . . . . . . . . . . . . . . . . . . — — 197Ending balance . . . . . . . . . . . . . . . . . . . . . . . . . . . . . . . . . . . . . . . . . . . . . . . $ 528 $ 528 $ 527Paid in capital Beginning balance . . . . . . . . . . . . . . . . . . . . . . . . . . . . . . . . . . . . . . . . . . . . . $432,035 $426,485 $267,004Purchase of shares of common stock for treasury, net of reissuances . 97 (153 ) 18Issuance of restricted stock . . . . . . . . . . . . . . . . . . . . . . . . . . . . . . . . . . . . . — 109 —Issuance of common stock . . . . . . . . . . . . . . . . . . . . . . . . . . . . . . . . . . . . . . — 5,550 4,098Issuance of stock in conjunction with acquisition . . . . . . . . . . . . . . . . . . — 44 155,365Ending balance . . . . . . . . . . . . . . . . . . . . . . . . . . . . . . . . . . . . . . . . . . . . . . . $432,132 $432,035 $426,485Retained earnings (deficit) Beginning balance . . . . . . . . . . . . . . . . . . . . . . . . . . . . . . . . . . . . . . . . . . . . . $ 44,102 $ (2,568) $ 13,289Net income (loss) . . . . . . . . . . . . . . . . . . . . . . . . . . . . . . . . . . . . . . . . . . . . . 4,220 50,514 (15,857)Cash dividends declared. . . . . . . . . . . . . . . . . . . . . . . . . . . . . . . . . . . . . . . . (3,748) (3,844) —Purchase of shares of common stock for treasury, net of reissuances . (725) — —Ending balance . . . . . . . . . . . . . . . . . . . . . . . . . . . . . . . . . . . . . . . . . . . . . . . $ 43,849 $ 44,102 $ (2,568)Accumulated other comprehensive income Beginning balance . . . . . . . . . . . . . . . . . . . . . . . . . . . . . . . . . . . . . . . . . . . . . $ 2,742 $ 11,026 $ (3,648)Realized (gain) loss on sale of securities, net of taxes . . . . . . . . . . . . . . (4,861) (7,190) (3,648)Unrealized gain (loss) on securities, net of taxes. . . . . . . . . . . . . . . . . . . 983 (1,094) 18,322Ending balance . . . . . . . . . . . . . . . . . . . . . . . . . . . . . . . . . . . . . . . . . . . . . . . $ (1,136) $ 2,742 $ 11,026Treasury stock, at costBeginning balance . . . . . . . . . . . . . . . . . . . . . . . . . . . . . . . . . . . . . . . . . . . . . $ (48,674) $ (33,880) $ (21,509)Purchase of shares of common stock for treasury, net of reissuances . (14,005) (15,888 ) (12,371)Issuance of stock for unearned compensation, net of amortization . . . — 388 —Issuance of stock in conjunction with acquisition . . . . . . . . . . . . . . . . . . 1,592 706 —Ending balance . . . . . . . . . . . . . . . . . . . . . . . . . . . . . . . . . . . . . . . . . . . . . . . $ (61,087) $ (48,674) $ (33,880)Unearned compensationBeginning balance . . . . . . . . . . . . . . . . . . . . . . . . . . . . . . . . . . . . . . . . . . . . . $ (383) $ — $ —Issuance of stock for unearned compensation . . . . . . . . . . . . . . . . . . . . . — (497) —Amortization of unearned compensation . . . . . . . . . . . . . . . . . . . . . . . . . 124 114 —Ending balance . . . . . . . . . . . . . . . . . . . . . . . . . . . . . . . . . . . . . . . . . . . . . . . $ (259) $ (383) $ —Total shareholders’ equity . . . . . . . . . . . . . . . . . . . . . . . . . . . . . . . . . . . . . . $414,027 $430,350 $401,590
Comprehensive incomeNet income (loss) . . . . . . . . . . . . . . . . . . . . . . . . . . . . . . . . . . . . . . . . . . . . . $ 4,220 $ 50,514 $ (15,857)Other comprehensive income (loss) . . . . . . . . . . . . . . . . . . . . . . . . . . . . . (3,878) (8,284) 14,674Comprehensive income (loss) . . . . . . . . . . . . . . . . . . . . . . . . . . . . . . . . . . . $ 342 $ 42,230 $ (1,183)

See notes to the consolidated financial statements
78
CONSOLIDATED STATEMENTS OF CASH FLOWS
For the years ended December 31, 2004 2003 2002
(In thousands) Operating activities:Net income (loss) . . . . . . . . . . . . . . . . . . . . . . . . . . . . . . . . . . . . . . . . . . . . . . . . . . . . . . . . $ 4,220 $ 50,514 $ (15,857)Adjustments to reconcile net income (loss) to net cash used in operating activities:
Depreciation and amortization . . . . . . . . . . . . . . . . . . . . . . . . . . . . . . . . . . . . . . . . . . . 20,024 15,801 15,312Amortization of premiums on investment securities, loan and lease receivables and
debt . . . . . . . . . . . . . . . . . . . . . . . . . . . . . . . . . . . . . . . . . . . . . . . . . . . . . . . . . . . . . . 14,728 14,609 38,786Gain on sale of furniture, fixtures and equipment. . . . . . . . . . . . . . . . . . . . . . . . . . . . . — — (2,800)Origination of loans held for sale. . . . . . . . . . . . . . . . . . . . . . . . . . . . . . . . . . . . . . . . . . (12,794,753) (18,921,756) (11,731,320)Repurchase of previously sold mortgages . . . . . . . . . . . . . . . . . . . . . . . . . . . . . . . . . . . (99,007) (61,520) (42,994)Proceeds from sales of loans held for sale . . . . . . . . . . . . . . . . . . . . . . . . . . . . . . . . . . . 13,782,621 18,693,517 11,491,755Net gain on sales of mortgage loans and servicing rights. . . . . . . . . . . . . . . . . . . . . . . . (115,574) (232,029 ) (124,895)Capitalization of mortgage servicing rights . . . . . . . . . . . . . . . . . . . . . . . . . . . . . . . . . . (59,821) (211,273 ) (141,222)Proceeds from sales of mortgage servicing rights . . . . . . . . . . . . . . . . . . . . . . . . . . . . . 5,307 62,726 163,298Impairment and amortization of mortgage servicing rights. . . . . . . . . . . . . . . . . . . . . . 46,603 72,479 26,945Gain on the early extinguishment of debt . . . . . . . . . . . . . . . . . . . . . . . . . . . . . . . . . . . — — (67)Provision for credit losses . . . . . . . . . . . . . . . . . . . . . . . . . . . . . . . . . . . . . . . . . . . . . . . 34,777 7,008 22,417Gain on sales of investment securities . . . . . . . . . . . . . . . . . . . . . . . . . . . . . . . . . . . . . . (7,780) (11,394) (5,781)Amortization of unearned compensation . . . . . . . . . . . . . . . . . . . . . . . . . . . . . . . . . . . 124 (383 ) —Changes in assets and liabilities which provide (use) cash:
Decrease (increase) in accrued interest receivable . . . . . . . . . . . . . . . . . . . . . . . . . . 3,200 (1,874 ) 157(Increase) decrease in due from servicers and other assets . . . . . . . . . . . . . . . . . . . (33,296) 29,722 71,128Increase (decrease) in accrued interest payable . . . . . . . . . . . . . . . . . . . . . . . . . . . . 1,211 (4,168 ) (4,637)(Decrease) increase in loans in process. . . . . . . . . . . . . . . . . . . . . . . . . . . . . . . . . . . (2,936) (14,978) 12,102(Decrease) increase in accounts payable and accrued liabilities. . . . . . . . . . . . . . . . (9,121) 31,556 (32,735)
Net cash provided by (used in) operating activities . . . . . . . . . . . . . . . . . . . . . . . 790,527 (481,443 ) (260,408)Investing activities:Purchases of available for sale securities . . . . . . . . . . . . . . . . . . . . . . . . . . . . . . . . . . . . . . (873,895) (183,917 ) (1,758,939)Principal repayments on available for sale securities . . . . . . . . . . . . . . . . . . . . . . . . . . . . . 38,369 103,955 230,683Sales and maturities of available for sale securities . . . . . . . . . . . . . . . . . . . . . . . . . . . . . . 599,262 318,304 1,741,670(Purchase) sale of Federal Home Loan Bank Stock . . . . . . . . . . . . . . . . . . . . . . . . . . . . . (5,637) (17,891) 18,939Origination of loan and lease receivables. . . . . . . . . . . . . . . . . . . . . . . . . . . . . . . . . . . . . . (1,398,383) (1,521,091 ) (422,420)Principal repayments on loan and lease receivables. . . . . . . . . . . . . . . . . . . . . . . . . . . . . . 680,535 744,444 698,885Proceeds from sales of loan and lease receivables . . . . . . . . . . . . . . . . . . . . . . . . . . . . . . . 346,062 — 226,056Purchases of furniture, equipment and capitalization of software, net of disposals. . . . . . (15,444) (21,280) (13,931)Acquisitions, net of cash acquired . . . . . . . . . . . . . . . . . . . . . . . . . . . . . . . . . . . . . . . . . . . (17,278) (18,796) 29,762Other investing activities . . . . . . . . . . . . . . . . . . . . . . . . . . . . . . . . . . . . . . . . . . . . . . . . . . 455 — —
Net cash (used in) provided by investing activities . . . . . . . . . . . . . . . . . . . . . . . . (645,954) (596,272 ) 750,705Financing activities:Increase in deposits . . . . . . . . . . . . . . . . . . . . . . . . . . . . . . . . . . . . . . . . . . . . . . . . . . . . . . 100,014 494,505 551,102Proceeds from other borrowed funds . . . . . . . . . . . . . . . . . . . . . . . . . . . . . . . . . . . . . . . . . 14,514,027 14,246,000 7,485,802Repayments of other borrowed funds . . . . . . . . . . . . . . . . . . . . . . . . . . . . . . . . . . . . . . . . (14,623,558) (13,708,758) (8,433,199)Net proceeds from issuance of subordinated notes . . . . . . . . . . . . . . . . . . . . . . . . . . . . . . — 7,475 4,382Repurchase of convertible subordinated notes . . . . . . . . . . . . . . . . . . . . . . . . . . . . . . . . . — (26,358) (923)Issuances of common stock. . . . . . . . . . . . . . . . . . . . . . . . . . . . . . . . . . . . . . . . . . . . . . . . . — 5,551 4,110Net purchase of treasury stock . . . . . . . . . . . . . . . . . . . . . . . . . . . . . . . . . . . . . . . . . . . . . . (14,633) (14,794) (12,353)Dividend payments on common stock . . . . . . . . . . . . . . . . . . . . . . . . . . . . . . . . . . . . . . . . (3,748) (3,844 ) —
Net cash (used in) provided by financing activities . . . . . . . . . . . . . . . . . . . . . . . (27,898) 999,777 (401,079)Net increase (decrease) in cash and cash equivalents . . . . . . . . . . . . . . . . . . . . . . . . . . . . 116,675 (77,938) 89,218Cash and cash equivalents:Cash, beginning of period. . . . . . . . . . . . . . . . . . . . . . . . . . . . . . . . . . . . . . . . . . . . . . . . . . 33,627 111,565 22,347Cash, end of period. . . . . . . . . . . . . . . . . . . . . . . . . . . . . . . . . . . . . . . . . . . . . . . . . . . . . . . $ 150,302 $ 33,627 $ 111,565
Supplemental disclosure of cash flow information: Cash paid during the period for interest. . . . . . . . . . . . . . . . . . . . . . . . . . . . . . . . . . . . . . . $ 91,406 $ 89,554 $ 109,378Cash paid during the period for income taxes . . . . . . . . . . . . . . . . . . . . . . . . . . . . . . . . . . $ (8,610) $ 1,821 $ 928Non-cash investing and financing activities: Fair value of assets acquired. . . . . . . . . . . . . . . . . . . . . . . . . . . . . . . . . . . . . . . . . . . . . . . . $ 815 $ 11,727 $ 1,057,830Amortizable intangibles . . . . . . . . . . . . . . . . . . . . . . . . . . . . . . . . . . . . . . . . . . . . . . . . . . . 6,487 — — Goodwill . . . . . . . . . . . . . . . . . . . . . . . . . . . . . . . . . . . . . . . . . . . . . . . . . . . . . . . . . . . . . . . 14,261 14,107 17,662Liabilities assumed . . . . . . . . . . . . . . . . . . . . . . . . . . . . . . . . . . . . . . . . . . . . . . . . . . . . . . . (94) (5,875 ) (919,930)Stock issued in transaction . . . . . . . . . . . . . . . . . . . . . . . . . . . . . . . . . . . . . . . . . . . . . . . . . (1,592) (750 ) (155,562)Cash paid for business . . . . . . . . . . . . . . . . . . . . . . . . . . . . . . . . . . . . . . . . . . . . . . . . . . . . $ 19,877 $ 19,209 $ —

NETBANK, INC.
NOTES TO CONSOLIDATED FINANCIAL STATEMENTS
FOR THE YEAR ENDED 2004
79
1. ORGANIZATION AND BASIS OF PRESENTATION
NetBank, Inc. is a financial holding company engaged primarily in retail banking; mortgage banking;business finance; and providing ATM, merchant processing and other transaction processing services. NetBank, Inc. wholly owns the outstanding stock of NetBank (“NetBank, FSB” or “the Bank”), a federal savings bank; MG Reinsurance Company (“MG Reinsurance”), a captive reinsurance company; NetInsurance, Inc. (“NetInsurance”), a licensed insurance agency; and NB Partners, Inc., a corporation formed to be involved in strategic partnering opportunities. NB Partners, Inc. owns all of the outstanding stock of Financial Technologies, Inc., a corporation formed in 2004 to market transaction processingservices to other financial services companies. NetBank, FSB owns all of the outstanding stock of Market Street Mortgage Corporation (“Market Street”), a retail mortgage company, NetBank Payment Systems, Inc. (“NPS”), a provider of ATM and merchant processing services for retail and other non-bankbusinesses, and Meritage Mortgage Corporation (“Meritage”), a wholesale non-conforming mortgage provider. The consolidated company is referred to herein as “NetBank” or “the Company”.
During the third quarter of 2004, Resource Bancshares Mortgage Group, Inc. (“Resource”) and Republic Leasing Company, Inc., both of which had been subsidiaries of NetBank, FSB, were legally consolidated into NetBank, FSB and ceased to exist as separate corporations. Republic Leasing Company, Inc. now operates as the NetBank Business Finance division of NetBank, FSB. In addition, during the fourth quarter of 2004, RBMG, Inc., formerly a subsidiary of NetBank, FSB, was legally consolidated into NetBank, FSB and ceased to exist as a separate corporation. RBMG, Inc. now operates as the NetBank Funding division of NetBank, FSB. NetBank Funding is engaged primarily in conformingmortgage lending through a nationwide network of correspondent and wholesale lenders.
All dollar figures are presented in thousands (000s), except per share data, unless otherwise noted.Net income per share is presented on a diluted basis. All of NetBank’s operations and assets are located within the United States.
2. ACQUISITIONS
In December 2004, the Company, through its Market Street subsidiary, acquired 19 retail branch offices and certain associated assets of Guaranty Residential Lending, Inc., a mortgage banking business, pursuant to an Asset Purchase and Assignment Agreement. The consideration paid, including transactioncosts, was approximately $1.9 million. The acquisition was accounted for as a purchase, and, accordingly, all assets and liabilities were recorded at fair value. As such, $1.6 million in goodwill, including transactioncosts, was recorded. The Company is obligated to pay additional consideration up to $1.6 million over the next two years based on specific production goals as specified in the Asset Purchase Agreement. The results of operations for the acquired branches have been included from the date of acquisition.
On July 1, 2004, the Company acquired the principal operating assets of Beacon Credit Services, LLC (“Beacon”), a privately held provider of recreational vehicle, boat and aircraft financing. The consideration paid consisted of 194,217 shares of NetBank common stock and cash of $5.0 million. The acquisition was accounted for as a purchase, and, accordingly, all assets and liabilities were recorded at fair value resulting in $6.4 million of goodwill. Beacon Credit Services, LLC’s results of operations have beenincluded from the date of acquisition.

NETBANK, INC.
NOTES TO CONSOLIDATED FINANCIAL STATEMENTS (Continued)
FOR THE YEAR ENDED 2004
80
During the year ended December 31, 2004, NPS acquired certain assets or processing contracts of various smaller ATM and merchant processing businesses. The acquisitions were accounted for aspurchases, and, as such, $6.3 million of goodwill and $6.5 million of amortizable intangibles were recorded. Consideration for the processing contracts and related businesses totaled $13.0 million. The results of operations for the various acquisitions have been included from their respective dates of acquisition.
On December 1, 2003, NetBank, Inc. acquired all of the outstanding stock of Financial Technologies, Inc., subsequently renamed NetBank Payment Systems, Inc., pursuant to an agreement dated October 5, 2003. The consideration paid consisted of 77,674 shares of NetBank common stock and cash of $16 million. The acquisition was accounted for as a purchase, and accordingly, all assets were recorded at fair value. The Company recorded $12.6 million of goodwill and $4.8 million of contract intangibles associated with the purchase. Goodwill was decreased during 2004 by $1.0 million related to adjustments to the valuation of NPS’s inventory of ATMs and ATM parts. The Company may pay additional consideration if NPS reaches specific financial goals over the next five years. NPS’s results of operations have been included from the date of acquisition.
On April 30, 2003, the Company acquired certain assets of Memorial Park Mortgage, LTD, a mortgage banking business, pursuant to an Asset Purchase and Assignment Agreement. The considerationpaid, including transaction costs, was $3.2 million. The acquisition was accounted for as a purchase, and accordingly, all assets and liabilities were recorded at fair value. As such, $2.0 million in goodwill, including transaction costs, was recorded. Its results of operations have been included from the date of acquisition.
On March 31, 2002, NetBank consummated its acquisition of Resource pursuant to an Agreement and Plan of Merger dated November 18, 2001. In the merger, NetBank issued 1.1382 shares of NetBank common stock in exchange for each outstanding share of Resource common stock, equivalent to approximately 19.7 million shares of common stock plus cash in lieu of fractional shares. The transaction was accounted for as a purchase, and a total of $20.6 million of goodwill was recorded. Goodwill was decreased during 2004 by $1.1 million related to tax adjustments associated with the acquisition.
3. ACCOUNTING POLICIES
The accounting and reporting policies of NetBank conform with accounting principles generally accepted in the United States of America (“GAAP”) and general practices within the banking and mortgage banking industries. Certain amounts from prior years have been reclassified to conform to current period presentation. The following is a summary of the Company’s more significant accounting policies:
Consolidation. The consolidated financial statements include the accounts of the Company and its wholly owned subsidiaries. All significant intercompany accounts and transactions have been eliminated.
Significant Estimates. The preparation of the consolidated financial statements in conformity withGAAP requires management to make estimates and assumptions that affect the amounts reported in the consolidated financial statements and accompanying notes. Such estimates relate to the Company’s allowance for credit losses; the fair values of loans held for sale, loan and lease receivables, mortgage servicing rights, servicing hedges and the Company’s other hedging instruments; and reserves for losses onrepresentations and warranties provided to purchasers of loans or mortgage servicing rights. Because of the inherent uncertainties associated with any estimation process and due to possible future changes in

NETBANK, INC.
NOTES TO CONSOLIDATED FINANCIAL STATEMENTS (Continued)
FOR THE YEAR ENDED 2004
81
market and economic conditions that will affect fair values, it is possible that actual future results in realization of the underlying assets and liabilities could differ significantly from the amounts reflected as of the balance sheet date.
Cash and Cash Equivalents. For purposes of reporting cash flows, cash and cash equivalents includes cash on hand, demand deposits due from banks, and federal funds sold to banks. NetBank is required to maintain a cash reserve with the Federal Reserve based on a graduated percentage of transaction deposit accounts, which is also included in cash and cash equivalents. The reserve was $1,159 and $2,003 at December 31, 2004 and 2003, respectively.
Investment Securities Available for Sale. Investment securities classified as available for sale are carried at fair value. Unrealized holding gains or losses, net of tax, on available for sale securities are reported as a net amount in other comprehensive income in the statement of shareholders’ equity. Gains and losses from dispositions are based on the net proceeds and the adjusted carrying amounts of the securities sold using the specific identification method. Any decreases in investment value determined to be other than temporary declines are recognized in current period results. Premiums and discounts are recognized in interest income over the period to maturity.
Loans Held for Sale. Loans held for sale are carried at the lower of aggregate cost or market (“LOCOM”). Loan origination fees and costs related to loans originated for sale are capitalized and are recognized as a component of the gain or loss upon sale of the related principal balance. Derivatives used to hedge the fair value of mortgage loans held for sale are carried in the Company’s balance sheet as assets or liabilities at fair market value. The Company has elected and its current instruments qualify for special hedge accounting for these derivatives under Statement of Financial Accounting Standards No. 133 (“SFAS 133”), Accounting for Derivative Instruments and Hedging Activities, as amended by Statement of Financial Accounting Standards No 149. (“SFAS 149”), Amendment of Statement 133 on Derivative Instruments and Hedging Activities. Accordingly, changes in the value of derivatives used to hedge changes in the fair value of loans held for sale are recorded as cost basis adjustments to loans held for sale.
On occasion the Company has to repurchase certain non-performing loans. Upon repurchase of a loan, the Company initially capitalizes the current unpaid principal balance (“UPB”) and related advances. Any other related costs are immediately charged against the reserve. The Company then marks the repurchased loan portfolio to the LOCOM with any estimated losses charged against the reserve.
Loan and Lease Receivables. Loan and lease receivables are stated at amortized cost, net of allowances for credit losses. Origination fees and certain direct origination costs associated with the Company’s loan and lease receivables are capitalized and recognized as a yield adjustment. Premiums on loans purchased from third parties are capitalized and recognized as a yield adjustment. Such premiumsare classified with the loan balance to which they relate for financial reporting purposes.
Lease receivables consist of direct finance equipment leases, which are carried at amortized cost, net of allowances for credit losses. Interest income is recognized monthly based on the net lease outstanding balance. Residuals are recognized monthly based on the estimated end-of-lease value and are included as an adjustment to interest income.
Allowance for Credit Losses. The allowance for credit losses is maintained at a level estimated to be adequate to provide for probable losses in the loan and lease receivables portfolio. For loans and leases
NETBANK, INC.
NOTES TO CONSOLIDATED FINANCIAL STATEMENTS (Continued)
FOR THE YEAR ENDED 2004
82
originated by NetBank for investment, allowances are established through a charge to current period earnings. Management determines the adequacy of the allowance based upon reviews of individual and pools of loans, recent loss experience, current economic conditions, the risk characteristics of the various categories of loans and leases and other pertinent factors. Loans and leases deemed uncollectible are charged off against the allowance. Provisions for credit losses, net of recoveries on loans previouslycharged off, are added to the allowance.
Mortgage Servicing Rights. The Company accounts for its mortgage servicing rights under the guidance set forth in Statement of Financial Accounting Standards No. 140 (“SFAS 140”), Accounting for Transfers and Servicing of Financial Assets and Extinguishments of Liabilities. As such, the Company allocates the total cost of a whole mortgage loan originated or purchased to the mortgage servicing rights and the loan (without servicing rights) based on relative fair values. The market value of servicing rights acquired in bulk transactions, rather than as by-products of the Company’s loan production activities, isinitially capitalized at the lower of cost or the estimated present value of future expected net servicing income. Amounts capitalized as mortgage servicing rights are amortized over the period of, and in proportion to, estimated future net servicing income.
The Company accounts for its mortgage servicing rights based on the lower of cost or market on anaggregate basis. The Company assesses its capitalized mortgage servicing rights for impairment (on a stratified basis) based on the estimated market values of those rights. Impairments are recognized as a valuation reserve for each impaired stratum. When values go down, the impact is recorded through the income statement. When values go up, the increase may be recorded in earnings only to the extent of impairment reserves established by previous write downs of servicing. The Company’s analysis values suchrights in consideration of current forward committed delivery prices, if applicable, and prevailing interest, prepayment and default rates, and other relevant factors as appropriate or allocable to each valuationstratum.
The Company uses various derivatives to manage its interest rate and prepayment risk on its servicing portfolio. Under SFAS 133, as amended, the Company may elect, at its option, hedge accountingtreatment for its servicing rights. If changes in the value of the servicing rights and the hedges meet certainhedge effectiveness criteria, changes in the fair value of the servicing rights may be offset in the income statement by changes in the fair value of the hedging instrument. Under SFAS 133, as amended, the hedges are marked-to-market through the income statement as other income. The election for special hedge accounting treatment must be made at the beginning of the accounting period, in accordance withSFAS 133, as amended.
Fees for servicing loans and leases are recognized monthly on an accrual basis based upon the terms of the underlying agreement. Generally, such agreements provide for fees based upon a percentage of the outstanding balance.
Gains and losses on sales of mortgage servicing rights are recognized at the sale date, which is the date the sales contract is closed and substantially all risks and rewards of ownership pass to the buyer.
As a servicer of mortgage loans, the Company will incur certain losses in the event it becomes necessary to carry out foreclosure actions on loans serviced. Substantially all serviced agency-eligible loans are fully guaranteed against such losses by the securitizing government sponsored enterprise. Losses for

NETBANK, INC.
NOTES TO CONSOLIDATED FINANCIAL STATEMENTS (Continued)
FOR THE YEAR ENDED 2004
83
foreclosure activities are included as part of the Company’s analysis of the present value of future cashflows on its mortgage servicing rights.
Furniture, Equipment and Capitalized Software. Furniture and equipment are stated at cost less accumulated depreciation. Depreciation is computed using the straight-line method over the estimated useful life of each asset. NetBank evaluates the estimated useful lives of assets on a periodic basis to determine whether events or circumstances warrant revised estimated useful lives or whether any impairment exists as required by Statement of Financial Accounting Standards No. 144 (“SFAS 144”), Accounting for the Impairment or Disposal of Long-Lived Assets. Management believes no impairmentexisted at December 31, 2004.
Certain costs incurred to develop internal use computer software are capitalized in accordance with Statement of Position (“SOP”) 98-1, Accounting for the Costs of Computer Software Developed or Obtained for Internal Use. Such costs include external direct costs of materials and services consumed in developing internal use software and direct payroll and payroll-related costs for employees who devote time to the internal use software project. Once the capitalization criteria of the SOP have been met, such costs are classified as capitalized software and are amortized on a straight-line basis over three to five years beginning when the software is put into use.
Goodwill and Other Intangible Assets. The Company tests goodwill and other intangible assets for impairment on at least an annual basis as prescribed in Statement of Financial Accounting Standards No 142 (“SFAS 142”), Goodwill and Other Intangible Assets. The goodwill impairment test is based on expected future cash flows and as a multiple of expected future earnings. Contract intangibles are amortized over the estimated lives of the contracts and core-deposit intangibles are amortized on a straight-line basis over the remaining useful life. Reference is made to note 9 within these notes to the consolidated financial statements for additional details regarding goodwill and other intangibles.
Other Real Estate Owned. Other real estate owned (“REO”) is carried at the lower of the original carrying amount or fair value less costs to sell.
Mortgage Loan Purchase/Funding Commitments. In connection with its mortgage banking activities, NetBank enters into mortgage loan purchase/funding commitments (“rate locks”) to fund residential mortgages at specified interest rates and within specified periods of time, generally up to 90 days from the time the interest rate is locked. Rate locks whose underlying originated loan will be held for sale uponfunding is a derivative instrument under SFAS 133, as amended. As such, it is recognized at fair value inother assets with changes in its value recorded as an adjustment to gain on sale of loans.
Consistent with the concepts embodied in SEC Staff Accounting Bulletin No. 105 (“SAB 105”), Application of Accounting Principles to Loan Commitments, NetBank records no value for rate locks at inception. Subsequent to the inception date, the Company measures the value of the rate locks as the change in secondary marketing value from inception date to measurement date (balance sheet date).
Derivatives and Derivatives Designated as Hedges. NetBank maintains a portfolio of derivatives to economically hedge certain assets or liabilities, primarily loans held for sale, rate locks, mortgage servicing rights and future mortgage servicing rights associated with mortgage loans held for sale and rate locks. Derivatives hedging the potential value of future mortgage servicing rights may be designated as cash flow hedges. Accordingly, as set forth in the guidance of SFAS 133, as amended, the change in fair value is

NETBANK, INC.
NOTES TO CONSOLIDATED FINANCIAL STATEMENTS (Continued)
FOR THE YEAR ENDED 2004
84
recorded in other assets and as an adjustment to other comprehensive income. There were no derivatives designated as cash flow hedges as of December 31, 2004 or 2003.
NetBank’s portfolio of derivatives which are designated and qualify as hedges are accounted for per the guidance set forth in SFAS 133, as amended. As such, the Company tests the fair value hedges related to its mortgage loans held for sale and mortgage servicing rights at inception and on an ongoing basis to determine that the derivatives are highly effective in offsetting changes in fair values or cash flows of the respective hedged items. Gains and losses on derivatives hedging servicing assets are included in other income, and gains and losses on derivatives hedging mortgage loans held for sale are included in gains onsales of loans and mortgage servicing rights.
If a derivative fails to meet hedge effectiveness tests, if hedge designation for a derivative isdiscontinued, or if the asset or liability being hedged is disposed of, the derivative is marked-to-market through the statement of operations and included in other income. The Company did not have a material amount of derivatives fail to meet hedge effectiveness tests during 2004 and 2003. Derivatives not designated as either fair value or cash flow hedges are marked-to-market through the statement of operations and included in gain (loss) on derivatives with the offsetting entry to other assets.
Liabilities for Representations and Warranties. The Company establishes reserves for its liabilities under representations and warranties provided to purchasers of its mortgage loans and mortgage servicing rights. The Company follows the guidance set forth in FASB Interpretation No 45 (“FIN 45”), Guarantors Accounting and Disclosure Requirements for Guarantees, Including Indirect Guarantees of Indebtedness of Others, to calculate the estimated loss on future repurchases of loans. The reserve is provided through acurrent period reduction of gain on sale of loans and mortgage servicing rights. Such provision is based on historical repurchase frequency, loss severity by vintage production year and such other information as isappropriate in the circumstances.
Interest Income on Loans. Interest on loans is generally recorded over the term of the loan based onthe unpaid principal balance (“UPB”). Accrual of interest is discontinued when either principal or interest becomes 90 days past due or when, in management’s opinion, collectibility of such interest is doubtful. Inaddition, any previously accrued interest is reversed when the loan becomes 90 days contractually past due. Until a loan is returned to accrual status, which is once all contractually past due amounts are received by the Company and management has determined that receipt of all future payments is probable, any partial payments are applied directly to principal.
Gains on Sales of Loans. Gains or losses on the sale or securitization of loans are determined at sale date and are measured by the difference between the net proceeds and the net carrying amount of the underlying loans.
Advertising. NetBank expenses the cost of advertising as incurred.
Income Taxes. Provisions for income taxes are based upon amounts reported in the statements of operations and include deferred taxes for net operating loss carryforwards generated prior to the year ended December 31, 2004 and temporary differences between financial statement and tax bases of assets and liabilities using enacted tax rates for the year in which the temporary differences are expected to reverse. NetBank records a valuation allowance when management believes it is more likely than not that deferred tax assets will not be realized.

NETBANK, INC.
NOTES TO CONSOLIDATED FINANCIAL STATEMENTS (Continued)
FOR THE YEAR ENDED 2004
85
Net Income Per Share. NetBank computes basic net income per common share based on the weighted average number of common and common equivalent shares outstanding during the year. Diluted net income per common and common equivalent share is computed based on the weighted average number of common and potentially dilutive common shares outstanding during the year.
Stock Options. The Company has a stock incentive plan, the 1996 Stock Incentive Plan (the “Plan”), which is described more fully in note 16. The Company accounted for the Plan under the recognition and measurement principles of Accounting Principles Board 25 (“APB 25”), Accounting for Stock Issued to Employees, and related Interpretations. As such, no stock option-based employee compensation cost is reflected in the statement of operations, as all options granted under those plans had an exercise price equal to the market value of the underlying common stock on the date of grant. The following table illustrates the pro forma effect on net income and net income per share had the Company applied the fair value recognition provisions of Financial Statement of Accounting Standards No. 123 (“SFAS 123”), Accounting for Stock-Based Compensation, to stock option based employee compensation.
For the year ended 2004 2003 2002
Net income (loss), as reported . . . . . . . . . . . . . . . . . . . . . . . . . . . . . . $ 4,220 $50,514 $(15,857)Deduct: Total stock option based employee compensation expense
determined under fair value based method for all awards, net of related tax effects . . . . . . . . . . . . . . . . . . . . . . . . . . . . . . . . . . . . . (3,413) (2,784) (2,549)
Pro forma net income (loss) . . . . . . . . . . . . . . . . . . . . . . . . . . . . . . . . $ 807 $47,730 $(18,406)Earnings (loss) per share:
Basic—as reported . . . . . . . . . . . . . . . . . . . . . . . . . . . . . . . . . . . . . . $ 0.09 $ 1.05 $ (0.36)Basic—pro forma . . . . . . . . . . . . . . . . . . . . . . . . . . . . . . . . . . . . . . . $ 0.02 $ 1.00 $ (0.41)
Diluted—as reported . . . . . . . . . . . . . . . . . . . . . . . . . . . . . . . . . . . . $ 0.09 $ 1.04 $ (0.36)Diluted—pro forma . . . . . . . . . . . . . . . . . . . . . . . . . . . . . . . . . . . . . $ 0.02 $ 0.98 $ (0.41)
Compensation expense of $124 and $114 related to restricted stock awards was recognized and included in the statement of operations for the years ended December 31, 2004 and 2003, respectively. Restricted stock awards are recognized on a straight-line basis over the vesting period. Reference is made to the following discussion regarding the Company’s intention to adopt the fair value recognition principles of Statement of Financial Accounting Standards No. 123 (revised 2004), Share-Based Payment, in 2005.
New Accounting Pronouncements. On March 9, 2004, the SEC issued Staff Accounting Bulletin No. 105, Application of Accounting
Principles to Loan Commitments, which provides guidance regarding loan commitments that are accounted for as derivatives instruments. In the bulletin, the SEC determined that a loan commitment for which the interest rate has been locked should be valued at zero at inception. The adoption of SAB 105 prospectively on April 1, 2004, did not have a material impact on the Company’s balance sheet or statement of operations.
In March 2004, the FASB’s Emerging Issues Task Force (“EITF”) supplemented EITF 03-1, The Meaning of Other-Than-Temporary Impairment and Its Application to Certain Investments. EITF 03-1

NETBANK, INC.
NOTES TO CONSOLIDATED FINANCIAL STATEMENTS (Continued)
FOR THE YEAR ENDED 2004
86
provides guidance for evaluating whether an investment is other-than-temporarily impaired and requires disclosures about unrealized losses on available for sale debt and equity securities. In September 2004, the FASB issued FASB Staff Position (“FSP”) EITF Issue 03-1-1, Effective Date of Paragraphs 10-20 of EITF Issue 03-1, which deferred the effective date of the recognition and measurement provisions of the consensus until further guidance is issued. A separate proposed FSP was issued in September 2004 to address EITF 03-1 implementation issues. Comments on this proposal were due on October 29, 2004. The additional annual disclosures required by the March 2004 consensus are effective for the fiscal year endingDecember 31, 2004. The amount of any other-than-temporary impairment that may need to be recognized upon full implementation of EITF 03-1 will depend on market conditions and other factors and will not beknown until the guidance is finalized. NetBank is currently evaluating the impact implementation of this guidance could have on its consolidated financial position or results of operations.
On December 16, 2004, the Financial Accounting Standards Board issued Statement of Financial Accounting Standards No. 123 (revised 2004) (“SFAS 123r”), Share-Based Payment, which is a revision ofSFAS 123. SFAS 123r supersedes APB 25 and amends Statement of Financial Accounting Standards No. 95, Statement of Cash flows. Generally, the approach to accounting for share-based payments in SFAS 123r is similar to the approach described in SFAS 123, except that SFAS 123r requires all share-based payments to employees, including grants of stock options, to be recognized in the financial statements based on their fair values. SFAS 123r is effective for NetBank at the beginning of the first interim period beginning after June 15, 2005; early adoption is encouraged. NetBank intends to adopt SFAS 123r using the Modified-Prospective Transition provisions of SFAS 123r, which will require financialstatement recognition of the fair value of all share-based payments that vest subsequent to adoption. Proforma disclosure will be required for all prior periods presented. Based on NetBank’s current outstanding stock options, NetBank estimates it will be required to record approximately $1.5 million of additional compensation expense during the last six months of 2005. However, management is currently reviewing implementation alternatives and the impact may be significantly less than $1.5 million. Adoption of SFAS 123r is not expected to have a material impact on NetBank’s financial condition or cash flows.
4. INVESTMENT SECURITIES
The following tables set forth the amortized cost, estimated fair value and gross unrealized gains and losses of the Company’s investment securities, all of which as of December 31, 2004 and 2003, were classified as available for sale:
As of December 31, 2004 Amortized cost Unrealized gainsUnrealized
losses Estimated fair
value U.S. government agencies—MBS . . . $ 574,495 $ — $3,205 $ 571,290 Collateralized mortgage obligations . 31,572 108 87 31,593 U.S. treasury securities. . . . . . . . . . . . . 53,177 865 87 53,955 Corporate bonds . . . . . . . . . . . . . . . . . . 39,150 609 218 39,541 Habitat bonds and other . . . . . . . . . . . 3,733 183 — 3,916
Total . . . . . . . . . . . . . . . . . . . . . . . . . . $ 702,127 $1,765 $3,597 $ 700,295

NETBANK, INC.
NOTES TO CONSOLIDATED FINANCIAL STATEMENTS (Continued)
FOR THE YEAR ENDED 2004
87
As of December 31, 2003 Amortized cost Unrealized gainsUnrealized
losses Estimated fair
value U.S. government agencies—MBS . . . . $191,492 $1,243 $114 $ 192,621 Collateralized mortgage obligations . . 1,356 108 — 1,464 U.S. government agencies—bonds. . . . 224,435 2,743 — 227,178 Corporate bonds . . . . . . . . . . . . . . . . . . . 29,094 411 187 29,318Habitat bonds and other . . . . . . . . . . . . 3,595 172 — 3,767
Total . . . . . . . . . . . . . . . . . . . . . . . . . . . $449,972 $ 4,677 $ 301 $ 454,348
The following tables set forth certain information regarding the estimated fair value and amortized cost of investment securities, which mature during each of the periods indicated, and the weighted average yields for each range of maturities at December 31, 2004. The actual maturities of the investment securities may differ from contractual maturities as certain of the investment securities are subject to call provisions, which allow the issuer to accelerate the maturity date of the security:
Contractually maturing Greater
Less Weighted Weighted Weighted than Weightedthan average 1-5 average 5-10 average 10 average
As of December 31, 2004 1 year yield years yield years yield years yield U.S. government agencies—
MBS. . . . . . . . . . . . . . . . . . . . $ 101,933 4.64% $ 254,134 4.64% $ 119,063 4.64% $ 96,160 4.64%Collateralized mortgage
obligations . . . . . . . . . . . . . . 7,229 4.98% 14,174 4.98% 6,910 4.98 % 3,280 4.98%U.S. treasury securities. . . . . . — — — — — — 53,955 5.02%Corporate bonds . . . . . . . . . . . — — — — — — 39,541 3.89%Habitat bonds and other . . . . — — — — — — 3,916 3.75%
Total . . . . . . . . . . . . . . . . . . . $ 109,162 4.66% $ 268,308 4.66% $ 125,973 4.66% $196,852 4.58%
As of December 31, 2004Amortized
Cost Estimated Fair value
Due in less than one year. . . . . . . . . . . . . . . . . . . . . . . . . . . . . . $ 109,447 $ 109,162 Due in more than one year but less than five years. . . . . . . . 269,010 268,308 Due in more than five year but less than ten years . . . . . . . . 126,303 125,973 Due after ten years . . . . . . . . . . . . . . . . . . . . . . . . . . . . . . . . . . . 197,367 196,852
Total . . . . . . . . . . . . . . . . . . . . . . . . . . . . . . . . . . . . . . . . . . . $ 702,127 $ 700,295
The investment securities included in the tables above which are not due at a single maturity date have been allocated over the respective periods.

NETBANK, INC.
NOTES TO CONSOLIDATED FINANCIAL STATEMENTS (Continued)
FOR THE YEAR ENDED 2004
88
Using the specific identification method, the Company realized $7,789, $12,188 and $7,524 of gains and $9, $0 and $1,743 of losses from securities that were sold during 2004, 2003 and 2002, respectively. Additionally, during 2003 the Company recorded impairment charges of $794 on two variable rate corporate bonds that had traded under book value for an extended period of time.
As of December 31, 2004
Unrealizedlosses < 1 year
Unrealizedlosses > 1 year
Number of
securities U.S. government agencies—MBS . . . . . . $3,205 $— 33Collateralized mortgage obligations . . . . 87 — 3U.S. treasury securities . . . . . . . . . . . . . . . 87 — 1Corporate bonds. . . . . . . . . . . . . . . . . . . . . 218 — 3Habitat bonds and other . . . . . . . . . . . . . . — — —
Total . . . . . . . . . . . . . . . . . . . . . . . . . . . $ 3,597 $ — 40
NetBank has reviewed its securities with unrealized losses and determined that none of the securities are other than temporarily impaired.
5. LOAN AND LEASE RECEIVABLES
NetBank’s portfolio of loan and lease receivables consist primarily of internally originated 1-4 family first and second mortgage loans, home equity loans, automobile loans and business equipment financing loans and leases.
At December 31, 2004 and 2003, the Company had net premiums on its loan and lease receivables of $33,765 and $25,199, respectively. At December 31, 2004 and 2003, $1,128 and $3,891, respectively, of the Company’s net premiums were associated with purchased as opposed to originated loans. At December 31, 2004, 18%, 11%, 8%, 6% and 6% of NetBank’s loan and lease receivables were with customers residing in Florida, California, Georgia, Colorado and Minnesota, respectively.
The following is a summary of NetBank’s loan and lease receivables as of December 31:
2004 2003 Amount % Amount %
First mortgages . . . . . . . . . . . . . . . . . . . . $ 1,081,676 51.0% $ 1,186,565 65.7%Second mortgages . . . . . . . . . . . . . . . . . . 170,993 8.1% 123,124 6.8%Leases . . . . . . . . . . . . . . . . . . . . . . . . . . . . 356,016 16.8% 349,952 19.5%Auto. . . . . . . . . . . . . . . . . . . . . . . . . . . . . . 391,934 18.5% 92,724 5.1 %Home equity lines . . . . . . . . . . . . . . . . . . 115,068 5.4% 50,816 2.8%Consumer . . . . . . . . . . . . . . . . . . . . . . . . . 4,607 0.2% 1,880 0.1%Total . . . . . . . . . . . . . . . . . . . . . . . . . . . . . 2,120,294 100.0% 1,805,061 100.0%Less allowance for credit losses . . . . . . (24,462) (43,689)Total . . . . . . . . . . . . . . . . . . . . . . . . . . . . . $2,095,832 $1,761,372
NetBank’s lease receivables consist primarily of business equipment leases originated and serviced by its NetBank Business Finance division. In addition to its originated lease receivables, NetBank, FSB owns

NETBANK, INC.
NOTES TO CONSOLIDATED FINANCIAL STATEMENTS (Continued)
FOR THE YEAR ENDED 2004
89
a portfolio of purchased lease receivables originated by Commercial Money Center, Inc. (“CMC”). NetBank, FSB is involved in litigation with three insurance companies who are sureties on the purchased leases. Since the second quarter of 2002, the entire portfolio has been on non-accrual status pendingoutcome of the litigation. NetBank, FSB has filed a claim for all principal and interest payments that are currently past due, approximately $96 million. The Company charged off $50,230 of the unpaid principalbalance during 2004 resulting in a remaining balance of $31,527.
The following disclosures relate only to that portion of NetBank’s lease receivables not subject to the aforementioned litigation:
2004 2003Minimum Lease payments due from lessees. . . . . . . . . . $371,670 $304,250Estimated residuals . . . . . . . . . . . . . . . . . . . . . . . . . . . . . . . 3,208 2,882Initial direct costs, net. . . . . . . . . . . . . . . . . . . . . . . . . . . . . 13,951 11,904Total. . . . . . . . . . . . . . . . . . . . . . . . . . . . . . . . . . . . . . . . . . . . 388,829 319,036Unearned income . . . . . . . . . . . . . . . . . . . . . . . . . . . . . . . . (64,340) (52,281)Net book value . . . . . . . . . . . . . . . . . . . . . . . . . . . . . . . . . . . $324,489 $266,755
The maturities of minimum lease receivables, including lease residuals, are as follows:
20042005 . . . . . . . . . . . . . . . . . . . . . . . . . . . . . . . . . . . . . $123,9682006 . . . . . . . . . . . . . . . . . . . . . . . . . . . . . . . . . . . . . 100,5982007 . . . . . . . . . . . . . . . . . . . . . . . . . . . . . . . . . . . . . 74,1932008 . . . . . . . . . . . . . . . . . . . . . . . . . . . . . . . . . . . . . 47,2532009 . . . . . . . . . . . . . . . . . . . . . . . . . . . . . . . . . . . . . 21,1852010 and thereafter . . . . . . . . . . . . . . . . . . . . . . . . 7,681Total . . . . . . . . . . . . . . . . . . . . . . . . . . . . . . . . . . . . . $374,878
At December 31, 2004 and 2003, the average lease size was approximately $37 and $31, respectively. At December 31, 2004, 20%, 8%, 7%, 7%, and 4% were located in the states of California, Texas, Florida, New York, and Georgia, respectively. At December 31, 2004, 16% of lease receivables were collateralized by restaurant equipment, 13% by medical equipment, 7% by rental equipment and 7% by hair salonequipment. In most instances, the Company requires a security deposit equal to one monthly payment and personal guarantees. At December 31, 2004 and 2003, NetBank held security deposits and sales and property taxes for the benefit of lessees of $11.7 million and $9.8 million, respectively.
6. ALLOWANCE FOR CREDIT LOSSES AND NON-PERFORMING ASSETS
NetBank considers a loan or lease receivable to be impaired when it is probable that it will be unable to collect all amounts due according to the original terms of the loan or lease agreement. NetBank measures impairment of a loan or lease on a loan-by-loan or lease-by-lease basis. Amounts of impaired loans or leases that are not probable of collection are charged off immediately.

NETBANK, INC.
NOTES TO CONSOLIDATED FINANCIAL STATEMENTS (Continued)
FOR THE YEAR ENDED 2004
90
The following is a summary of the allowance for credit losses for the years ended December 31:
2004 2003 2002Beginning balance. . . . . . . . . . . . . . . . . . . . . . . . . . . . . . . . . . . . . . . . . . . . . . $ 43,689 $ 42,576 $ 22,865
Allowance recorded in connection with the purchase of loan pools . — — 7,257Provision for credit losses . . . . . . . . . . . . . . . . . . . . . . . . . . . . . . . . . . . 34,777 7,008 22,417
Allowance acquired in connection with acquisition of Resource . . . . — — 1,828Allowance transferred to held for sale . . . . . . . . . . . . . . . . . . . . . . . . . . — — (3,270)Charge-offs:
First mortgages . . . . . . . . . . . . . . . . . . . . . . . . . . . . . . . . . . . . . . . . . . . . (26 ) — (1)Second mortgages . . . . . . . . . . . . . . . . . . . . . . . . . . . . . . . . . . . . . . . . . . (734 ) (1,486 ) (6,125)Leases . . . . . . . . . . . . . . . . . . . . . . . . . . . . . . . . . . . . . . . . . . . . . . . . . . . . (54,019 ) (5,775 ) (3,190)Home equity lines . . . . . . . . . . . . . . . . . . . . . . . . . . . . . . . . . . . . . . . . . . (469) (557) (555)Consumer. . . . . . . . . . . . . . . . . . . . . . . . . . . . . . . . . . . . . . . . . . . . . . . . . (101 ) (236 ) (270)Auto . . . . . . . . . . . . . . . . . . . . . . . . . . . . . . . . . . . . . . . . . . . . . . . . . . . . . (2,744 ) (124 ) (116)Total charge-offs . . . . . . . . . . . . . . . . . . . . . . . . . . . . . . . . . . . . . . . . . . . (58,093 ) (8,178 ) (10,257)
Recoveries: First mortgages . . . . . . . . . . . . . . . . . . . . . . . . . . . . . . . . . . . . . . . . . . . . — — —Second mortgages . . . . . . . . . . . . . . . . . . . . . . . . . . . . . . . . . . . . . . . . . . 385 165 65Leases . . . . . . . . . . . . . . . . . . . . . . . . . . . . . . . . . . . . . . . . . . . . . . . . . . . . 2,305 1,909 1,387Home equity lines . . . . . . . . . . . . . . . . . . . . . . . . . . . . . . . . . . . . . . . . . . 190 162 258Consumer. . . . . . . . . . . . . . . . . . . . . . . . . . . . . . . . . . . . . . . . . . . . . . . . . — 3 25Auto . . . . . . . . . . . . . . . . . . . . . . . . . . . . . . . . . . . . . . . . . . . . . . . . . . . . . 1,209 44 1Total recoveries. . . . . . . . . . . . . . . . . . . . . . . . . . . . . . . . . . . . . . . . . . . . 4,089 2,283 1,736Total charge-offs, net . . . . . . . . . . . . . . . . . . . . . . . . . . . . . . . . . . . . . . . (54,004 ) (5,895 ) (8,521)
Ending balance . . . . . . . . . . . . . . . . . . . . . . . . . . . . . . . . . . . . . . . . . . . . . . . . $ 24,462 $ 43,689 $ 42,576
Allowance for credit losses as a percentage of average loan and lease receivables . . . . . . . . . . . . . . . . . . . . . . . . . . . . . . . . . . . . . . . . . . . . . . . . . . 1.17 % 3.43 % 3.26%
The following table details NetBank’s non-accrual and troubled debt restructurings:
2004 2003Loan and lease receivables(1). . . . . . . . . . . . . . . . . . . $37,045 $87,228Loans held for sale(1) . . . . . . . . . . . . . . . . . . . . . . . . . $36,633 $46,409Troubled debt restructurings(2) . . . . . . . . . . . . . . . . . $ 210 $ 5,309
(1) As more fully described in note 3, all loans and leases over 90 days contractually past due are placed on non-accrual status.
(2) Includes only those troubled debt restructurings which were less than 90 days past due as of the periods reported. Troubled debt restructurings over 90 days past due have been included in the non-accrual categories.

NETBANK, INC.
NOTES TO CONSOLIDATED FINANCIAL STATEMENTS (Continued)
FOR THE YEAR ENDED 2004
91
On average NetBank held approximately $108,341, $136,340 and $147,461 of restructured and non-accrual loans during 2004, 2003 and 2002, respectively. Foregone interest for the years ended December 31, 2004, 2003 and 2002 was approximately $5.6 million, $6.8 million and $8.9 million, respectively. NetBank had $5,799 and $3,765 in other real estate owned resulting primarily from residential mortgage loan foreclosures at December 31, 2004, and 2003, respectively.
7. FAIR VALUE AND IMPAIRMENT OF MORTGAGE SERVICING RIGHTS
As more fully discussed in note 3, NetBank accounts for all of its mortgage servicing rights at the aggregate of LOCOM. For purposes of evaluating NetBank’s mortgage servicing rights portfolio for impairment, the Company disaggregates its servicing portfolio into two primary groupings: available for sale and held for sale.
The segment of the portfolio designated as available for sale is composed of servicing rights that were retained out of production pursuant to individual portfolio retention decisions or purchased in bulk transactions. The available for sale portfolio is disaggregated for purposes of measuring potential impairments according to defined risk tranches. The Company has defined these risk tranches based uponinterest rate band and product type. With respect to each such risk tranche, the fair value thereof, which is based upon an internal analysis that considers current market conditions, prevailing interest rates, prepayment speeds, default rates and other relevant factors, is compared to amortized carrying values of the mortgage servicing rights for purposes of measuring potential impairment.
The segment of the portfolio designated as held for sale is composed of recently produced servicing rights that are scheduled for sale and have been allocated to specific forward servicing sales contracts. The held for sale portfolio is disaggregated for purposes of measuring possible impairments according to the specific forward sales contracts to which allocated, which the Company has determined to be the appropriate approach to disaggregation by predominant risk characteristic for this portfolio segment. For each such risk tranche, the fair value is based upon the allocated forward committed delivery price, which is compared to amortized carrying value for purposes of measuring potential impairment.
The following amounts relate to the Company’s servicing rights portfolio:
Available for sale Held for sale 2004 2003 2004 2003
UPB . . . . . . . . . . . . . . . . . . . . . . . . . $12,699,935 $12,293,325 $193,877 $250,338Carrying Value . . . . . . . . . . . . . . . . $ 170,651 $ 162,030 $ 2,168 $ 3,184Carrying Value / UPB . . . . . . . . . . 1.34% 1.32% 1.12% 1.27%Estimated fair value . . . . . . . . . . . . $ 171,075 $ 162,656 $ 2,168 $ 3,184Estimated fair value / UPB . . . . . . 1.35% 1.32% 1.12% 1.27%Weighted average note rate . . . . . 5.95% 6.09% 6.32% 5.82%Weighted average service fee . . . . 0.33% 0.33% 0.33% 0.32%Net Basis as multiple . . . . . . . . . . . 4.13 3.99 3.36 3.91

NETBANK, INC.
NOTES TO CONSOLIDATED FINANCIAL STATEMENTS (Continued)
FOR THE YEAR ENDED 2004
92
Key economic assumptions and the sensitivity of the current fair value of the available for sale servicing cash flows to immediate 10% and 20% adverse changes in those assumptions are as follows:
2004 2003Fair value . . . . . . . . . . . . . . . . . . . . . . . . . . . . . . . . . . . . $171,075 $162,656Weighted average life in years . . . . . . . . . . . . . . . . . . 4.7 5.0
Prepayment speed assumption (annual rate) . . . . . . 16.00% 14.90%Impact on fair value of 10% adverse change . . . . . . $ (9,314) $ (8,550)Impact on fair value of 20% adverse change . . . . . . $ (17,758) $ (16,439)
Discount rate . . . . . . . . . . . . . . . . . . . . . . . . . . . . . . . . . 10.52% 9.68%Impact on fair value of 10% adverse change . . . . . . $ (4,276) $ (5,798)Impact on fair value of 20% adverse change . . . . . . $ (8,186) $ (11,293)
The sensitivities above are hypothetical and should be used with caution. As the figures indicate, changes in fair value based on a 10% variation in assumptions generally cannot be extrapolated because the relationship of the change in assumption to the change in fair value may not be linear. Also, in the table above, the effect of a variation in a particular assumption on the fair value of the available for sale servicing rights is calculated without changing any other assumption; in reality, changes in one factor may result in changes in another, which might magnify or counteract the sensitivities. The analysis above excludes the impact of the Company’s hedging activities related to the available for sale servicing rights.
For the years ended December 31, 2004, and 2003, the Company capitalized $59,821 and $211,273 inmortgage servicing rights. In addition, for the years ended December 31, 2004, 2003 and 2002 the Company incurred amortization expense of $39,299, $28,655 and $12,516, respectively, related to its mortgage servicing rights.
The following table summarizes changes in the mortgage servicing rights available for sale impairmentreserve for the years ended December 31, 2004, and 2003:
2004 2003 2002Balance as of January 1,. . . . . . . . . . . . . . . . . . $58,253 $14,429 $ — Servicing valuation impairment . . . . . . . . . . . 7,304 43,824 14,429Balance as of December 31, . . . . . . . . . . . . . . $65,557 $58,253 $ 14,429

NETBANK, INC.
NOTES TO CONSOLIDATED FINANCIAL STATEMENTS (Continued)
FOR THE YEAR ENDED 2004
93
8. FURNITURE, EQUIPMENT AND CAPITALIZED SOFTWARE
Furniture, equipment and capitalized software as of December 31, 2004 and 2003 are summarized as follows:
Estimated Useful Lives 2004 2003
Furniture and fixtures . . . . . . . . . . . . . . . . . . . . . . . . . . . . 7 years $ 30,352 $ 23,568Equipment . . . . . . . . . . . . . . . . . . . . . . . . . . . . . . . . . . . . . 5 - 7 years 10,544 10,931Software . . . . . . . . . . . . . . . . . . . . . . . . . . . . . . . . . . . . . . . 3 - 5 years 52,753 43,001Land. . . . . . . . . . . . . . . . . . . . . . . . . . . . . . . . . . . . . . . . . . . 1,647 2,983Total. . . . . . . . . . . . . . . . . . . . . . . . . . . . . . . . . . . . . . . . . . . 95,296 80,483Less accumulated depreciation and amortization . . . . 43,858 26,581Furniture, equipment and capitalized software, net . . $ 51,438 $ 53,902
During the years ended December 31, 2004, 2003 and 2002 the Company recognized $10.3 million, $7.5 million and $6.8 million, respectively, of amortization expense related to capitalized software. During the years ended December 31, 2004, 2003 and 2002 the Company recognized $7.6 million, $6.8 million and $5.3 million, respectively, of depreciation expense related to furniture and equipment.
9. GOODWILL AND OTHER INTANGIBLES
Goodwill consists primarily of $265 of goodwill related to the acquisition of Premier Bank in 1997,$19.7 million of goodwill related to the acquisition of Market Street in 2001, $19.5 million of goodwill related to the acquisition of Resource in 2002, $2.0 million of goodwill related to Market Street’s acquisition of Memorial Park Mortgage in 2003, $11.6 million of goodwill related to the acquisition of NPS in 2003, $6.3 million of goodwill related to subsequent NPS acquisitions in 2004, $6.4 million of goodwill related to the acquisition of Beacon in 2004 and $1.6 million of goodwill related to Market Street’s acquisition of Guaranty Residential Lending in 2004. As required by SFAS 142, the Company ceased amortization of goodwill on January 1, 2002.
NetBank has $1.9 million of core-deposit intangibles related to the acquisition of certain deposit accounts from CompuBank in 2001. The core-deposit intangibles are being amortized on a straight-line basis over a remaining useful life of 3 years. NetBank has $9.9 million of contract intangibles related to the acquisition of NPS in 2003 and to subsequent acquisitions by NPS during 2004. Each contract purchased byNPS during 2004 is being amortized based on the estimated useful life of the contracts. Collectively, the contracts purchased during 2004 have a weighted average useful life of 114 months.
As of December 31, 2004 and 2003, accumulated amortization for amortizable intangible assets was $7,061 and $4,954. The Company’s periodic impairment analyses performed during 2004 and 2003 found that its goodwill, core-deposit intangibles and contract intangibles were not impaired. The 2002 analysis indicated that goodwill was not impaired but the core-deposit intangible was impaired by $2,469, which was recorded in the depreciation and amortization line in the statement of operations. The 2002 analysis indicated that the core-deposit intangible was impaired due to the underlying deposit accounts closing more quickly than originally estimated. The Company will continue to perform an impairment analysis at least annually and will record an impairment charge if goodwill or an intangible is found to be impaired.

NETBANK, INC.
NOTES TO CONSOLIDATED FINANCIAL STATEMENTS (Continued)
FOR THE YEAR ENDED 2004
94
The following table details changes in carrying amounts of NetBank’s goodwill and other intangibleassets by segment for the years ended December 31, 2004 and 2003:
RetailBanking
FinancialIntermediary
Transaction Processing Other Total
Balance as of January 1, 2003 . . . . . . . . . . . . . . . . $3,126 $37,456 $ — $1,114 $ 41,696Goodwill acquired. . . . . . . . . . . . . . . . . . . . . . . . . . — 1,954 12,567 — 14,521Intangible asset acquired . . . . . . . . . . . . . . . . . . . . — — 4,816 — 4,816Purchase accounting adjustments. . . . . . . . . . . . . — 2,938 — — 2,938Amortization . . . . . . . . . . . . . . . . . . . . . . . . . . . . . . (605) — (76) (849 ) (1,530)Balance as of January 1, 2004 . . . . . . . . . . . . . . . . 2,521 42,348 17,307 265 62,441Goodwill acquired. . . . . . . . . . . . . . . . . . . . . . . . . . — 7,963 6,298 — 14,261Intangible asset acquired . . . . . . . . . . . . . . . . . . . . — — 6,487 — 6,487Purchase accounting adjustments. . . . . . . . . . . . . — (1,095) (792) — (1,887)Amortization . . . . . . . . . . . . . . . . . . . . . . . . . . . . . . (605) — (1,502) — (2,107)Balance as of December 31, 2004. . . . . . . . . . . . . $1,916 $49,216 $27,798 $ 265 $ 79,195
In 2003, the Company recorded a $2,938 purchase accounting adjustment due to certain pre-acquisition contingencies related to representations and warranties on loans sold by Resource to third-party purchasers prior to its acquisition by the Company. It recorded an additional adjustment of $1,887during 2004 related to tax adjustments.
The expected tax deductibility of goodwill in future periods as of December 31, 2004 was $24.7 million. The expected amortization of intangibles over the next five years is summarized as follows:
2005. . . . . . . . . . . . . . . . . . . . . . . . . . . . . . . . . . . . . . . . . . . . . . . . . . . . . . . . . . . . $2,4322006. . . . . . . . . . . . . . . . . . . . . . . . . . . . . . . . . . . . . . . . . . . . . . . . . . . . . . . . . . . . $2,1992007. . . . . . . . . . . . . . . . . . . . . . . . . . . . . . . . . . . . . . . . . . . . . . . . . . . . . . . . . . . . $2,0032008. . . . . . . . . . . . . . . . . . . . . . . . . . . . . . . . . . . . . . . . . . . . . . . . . . . . . . . . . . . . $1,3272009. . . . . . . . . . . . . . . . . . . . . . . . . . . . . . . . . . . . . . . . . . . . . . . . . . . . . . . . . . . . $1,034

NETBANK, INC.
NOTES TO CONSOLIDATED FINANCIAL STATEMENTS (Continued)
FOR THE YEAR ENDED 2004
95
10. DEPOSITS
The following table sets forth the dollar amount of deposits and weighted average interest rates being paid as of the specified date in the various types of deposit programs offered by the Company:
As of December 31, 2004 As of December 31, 2003
Amount Percentage
Weightedaverage
interest rate Amount Percentage
Weightedaverage
interest rateNon-interest bearing
checking accounts . . . . . $ 285,218 10.8% — $ 198,884 7.8 % —Interest bearing:
Checking accounts . . . . 261,588 9.9% 1.0% 228,178 9.0% 1.4%Money market . . . . . . . . 1,158,529 43.9% 1.9% 1,363,294 53.7% 1.9%Certificate of deposit
under $100 . . . . . . . . . 830,996 31.5% 2.9% 632,602 24.9% 2.8%Certificate of deposit
over $100 . . . . . . . . . . 103,110 3.9% 3.3% 116,469 4.6% 2.8%Total deposits. . . . . . . . . . . $ 2,639,441 100.0% $ 2,539,427 100.0%
Accrued interest as of December 31, 2004 related to checking, money market and certificate of deposit accounts was $66, $607 and $5,426, respectively. Accrued interest as of December 31, 2003 related to checking, money market, and certificate of deposit accounts was $81, $801 and $5,686, respectively. At December 31, 2004 and 2003 $764 and $664 of overdrawn deposits were reclassified as loans, respectively. As of December 31, 2004 and 2003, NetBank’s deposits included approximately $288,301 and $199,718million, respectively, of escrow funds relating to its mortgage servicing activities.
At December 31, 2004, the scheduled maturities of certificates of deposit were as follows:
Certificate amounts
Average ratepaid on
certificates3 months or less . . . . . . . . . . . . . . . . . . . . . . . . . . . . . . . . . . . . . . . . . . . . . . . . . . . . . . . $362,030 2.3%3-6 months . . . . . . . . . . . . . . . . . . . . . . . . . . . . . . . . . . . . . . . . . . . . . . . . . . . . . . . . . . . 64,125 2.1%6-12 months . . . . . . . . . . . . . . . . . . . . . . . . . . . . . . . . . . . . . . . . . . . . . . . . . . . . . . . . . . 117,206 2.4%12 or more months . . . . . . . . . . . . . . . . . . . . . . . . . . . . . . . . . . . . . . . . . . . . . . . . . . . . 390,745 3.9%Total . . . . . . . . . . . . . . . . . . . . . . . . . . . . . . . . . . . . . . . . . . . . . . . . . . . . . . . . . . . . . . . . $934,106
At December 31, 2004, certificates of deposit with maturities occurring after December 31, 2005 were as follows:
Certificate amounts
2006 . . . . . . . . . . . . . . . . . . . . . . . . . . . . . . . . . . . . . . . . . . . . . . . . . . . . . . . . . . . . . . . . . . $ 79,5822007 . . . . . . . . . . . . . . . . . . . . . . . . . . . . . . . . . . . . . . . . . . . . . . . . . . . . . . . . . . . . . . . . . . 119,1162008 . . . . . . . . . . . . . . . . . . . . . . . . . . . . . . . . . . . . . . . . . . . . . . . . . . . . . . . . . . . . . . . . . . 109,3142009 and beyond . . . . . . . . . . . . . . . . . . . . . . . . . . . . . . . . . . . . . . . . . . . . . . . . . . . . . . . 82,733
$390,745

NETBANK, INC.
NOTES TO CONSOLIDATED FINANCIAL STATEMENTS (Continued)
FOR THE YEAR ENDED 2004
96
At December 31, 2004, the scheduled maturities of certificates of deposit over $100 were as follows:
Certificate amounts
Average ratepaid on
certificates3 months or less . . . . . . . . . . . . . . . . . . . . . . . . . . . . . . . . . . . . . . . . . . . . . . . . . . . . . . . $ 23,102 2.38%3-6 months . . . . . . . . . . . . . . . . . . . . . . . . . . . . . . . . . . . . . . . . . . . . . . . . . . . . . . . . . . . 9,065 2.34%6-12 months . . . . . . . . . . . . . . . . . . . . . . . . . . . . . . . . . . . . . . . . . . . . . . . . . . . . . . . . . . 18,965 2.59%12 or more months . . . . . . . . . . . . . . . . . . . . . . . . . . . . . . . . . . . . . . . . . . . . . . . . . . . . 51,978 4.06%Total . . . . . . . . . . . . . . . . . . . . . . . . . . . . . . . . . . . . . . . . . . . . . . . . . . . . . . . . . . . . . . . . $103,110
11. BORROWINGS
A summary of borrowings and available borrowings, grouped by year of maturity, as of December 31, 2004 follows:
Type of Borrowing Year ofmaturity
Range of statedinterest rates
Principal amountoutstanding
$0.5 million line of credit . . . . . . . . . . . . . . . . . . . . . . . . . . . 2005 Prime* $ —$25 million line of credit . . . . . . . . . . . . . . . . . . . . . . . . . . . 2005 Fed Funds* —$300 million warehouse line of credit . . . . . . . . . . . . . . . . 2005 3.27%, 3.77%* 69,728$625 million FHLB warehouse line ** . . . . . . . . . . . . . . . 2005 DRC + 0.50%* 27,000$200 million master repurchase facility . . . . . . . . . . . . . . . 2005 3.65% to 3.77% —FHLB advances . . . . . . . . . . . . . . . . . . . . . . . . . . . . . . . . . . . 2005 1.73% to 7.41% 474,500FHLB advances . . . . . . . . . . . . . . . . . . . . . . . . . . . . . . . . . . . 2006 2.04% to 5.63% 110,000FHLB advances . . . . . . . . . . . . . . . . . . . . . . . . . . . . . . . . . . . 2007 2.57% 40,000Notes payable. . . . . . . . . . . . . . . . . . . . . . . . . . . . . . . . . . . . . 2007 5.0%, 5.95% 231FHLB advances . . . . . . . . . . . . . . . . . . . . . . . . . . . . . . . . . . . 2008 1.90% to 1.92% 100,000Notes payable. . . . . . . . . . . . . . . . . . . . . . . . . . . . . . . . . . . . . 2008 5.95% 1,054FHLB advances . . . . . . . . . . . . . . . . . . . . . . . . . . . . . . . . . . . 2009 1.80% to 4.64% 215,000FHLB advances . . . . . . . . . . . . . . . . . . . . . . . . . . . . . . . . . . . 2014 1.79% to 2.93% 185,000Subordinated debt. . . . . . . . . . . . . . . . . . . . . . . . . . . . . . . . . 2032 LIBOR + 3.35%* 4,382Subordinated debt. . . . . . . . . . . . . . . . . . . . . . . . . . . . . . . . . 2033 LIBOR + 3.25%* 4,382Subordinated debt. . . . . . . . . . . . . . . . . . . . . . . . . . . . . . . . . 2034 LIBOR + 2.85%* 3,093Repurchase agreement. . . . . . . . . . . . . . . . . . . . . . . . . . . . . 2005 2.23%, 2.41% 88,978Total debt . . . . . . . . . . . . . . . . . . . . . . . . . . . . . . . . . . . . . . . . $1,323,348
* Indicates a variable rate.
** Line of credit can be extended up to 40% of NetBank, FSB’s total assets
Nine of the Federal Home Loan Bank (“FHLB”) advances totaling $326,000 are fixed rate. The remaining advances totaling $590,000 are also fixed, however, they may be converted at the FHLB’s optionto adjustable rate based on the three month floating LIBOR. The FHLB warehouse line is a $625,000adjustable line of credit (which can be extended at NetBank, FSB’s option up to 40% of NetBank, FSB’s total assets) with a floating rate based on the daily rate credit (“DRC”) plus 50 basis points which can be
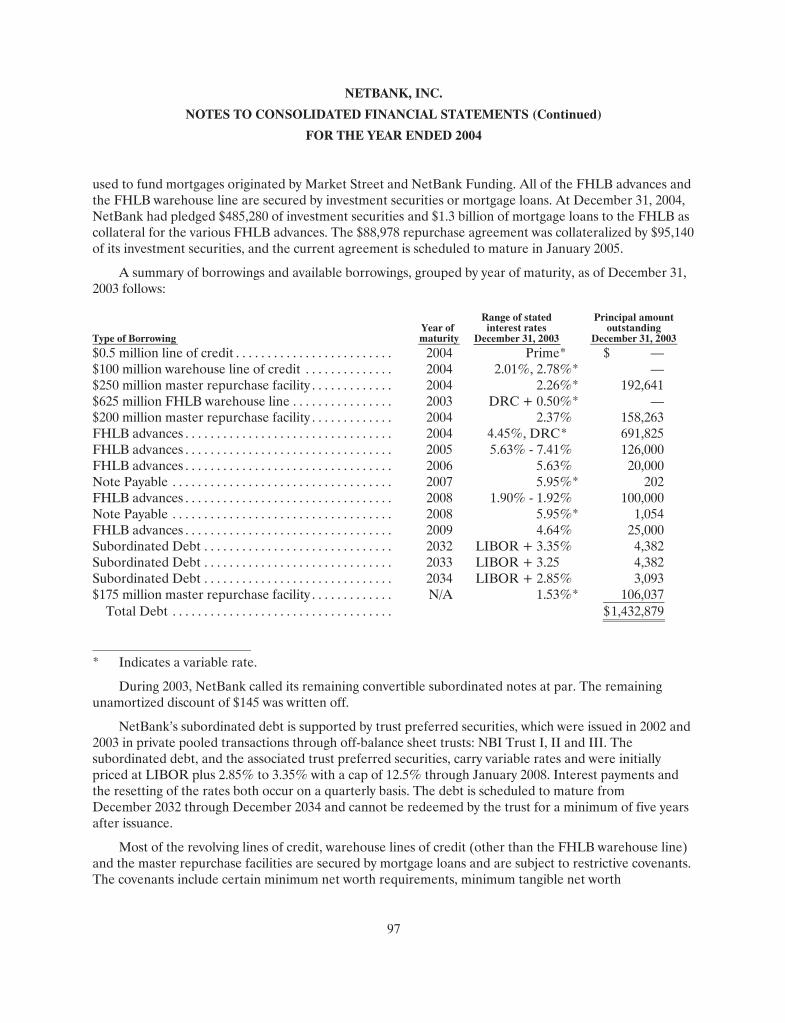
NETBANK, INC.
NOTES TO CONSOLIDATED FINANCIAL STATEMENTS (Continued)
FOR THE YEAR ENDED 2004
97
used to fund mortgages originated by Market Street and NetBank Funding. All of the FHLB advances and the FHLB warehouse line are secured by investment securities or mortgage loans. At December 31, 2004, NetBank had pledged $485,280 of investment securities and $1.3 billion of mortgage loans to the FHLB as collateral for the various FHLB advances. The $88,978 repurchase agreement was collateralized by $95,140 of its investment securities, and the current agreement is scheduled to mature in January 2005.
A summary of borrowings and available borrowings, grouped by year of maturity, as of December 31, 2003 follows:
Type of Borrowing Year ofmaturity
Range of statedinterest rates
December 31, 2003
Principal amountoutstanding
December 31, 2003$0.5 million line of credit . . . . . . . . . . . . . . . . . . . . . . . . . 2004 Prime* $ —$100 million warehouse line of credit . . . . . . . . . . . . . . 2004 2.01%, 2.78%* —$250 million master repurchase facility . . . . . . . . . . . . . 2004 2.26%* 192,641$625 million FHLB warehouse line . . . . . . . . . . . . . . . . 2003 DRC + 0.50%* —$200 million master repurchase facility . . . . . . . . . . . . . 2004 2.37% 158,263FHLB advances . . . . . . . . . . . . . . . . . . . . . . . . . . . . . . . . . 2004 4.45%, DRC* 691,825FHLB advances . . . . . . . . . . . . . . . . . . . . . . . . . . . . . . . . . 2005 5.63% - 7.41% 126,000FHLB advances . . . . . . . . . . . . . . . . . . . . . . . . . . . . . . . . . 2006 5.63% 20,000Note Payable . . . . . . . . . . . . . . . . . . . . . . . . . . . . . . . . . . . 2007 5.95%* 202FHLB advances . . . . . . . . . . . . . . . . . . . . . . . . . . . . . . . . . 2008 1.90% - 1.92% 100,000Note Payable . . . . . . . . . . . . . . . . . . . . . . . . . . . . . . . . . . . 2008 5.95%* 1,054FHLB advances . . . . . . . . . . . . . . . . . . . . . . . . . . . . . . . . . 2009 4.64% 25,000Subordinated Debt . . . . . . . . . . . . . . . . . . . . . . . . . . . . . . 2032 LIBOR + 3.35% 4,382Subordinated Debt . . . . . . . . . . . . . . . . . . . . . . . . . . . . . . 2033 LIBOR + 3.25 4,382Subordinated Debt . . . . . . . . . . . . . . . . . . . . . . . . . . . . . . 2034 LIBOR + 2.85% 3,093$175 million master repurchase facility . . . . . . . . . . . . . N/A 1.53%* 106,037
Total Debt . . . . . . . . . . . . . . . . . . . . . . . . . . . . . . . . . . . $1,432,879
* Indicates a variable rate.
During 2003, NetBank called its remaining convertible subordinated notes at par. The remaining unamortized discount of $145 was written off.
NetBank’s subordinated debt is supported by trust preferred securities, which were issued in 2002 and 2003 in private pooled transactions through off-balance sheet trusts: NBI Trust I, II and III. The subordinated debt, and the associated trust preferred securities, carry variable rates and were initially priced at LIBOR plus 2.85% to 3.35% with a cap of 12.5% through January 2008. Interest payments andthe resetting of the rates both occur on a quarterly basis. The debt is scheduled to mature fromDecember 2032 through December 2034 and cannot be redeemed by the trust for a minimum of five years after issuance.
Most of the revolving lines of credit, warehouse lines of credit (other than the FHLB warehouse line) and the master repurchase facilities are secured by mortgage loans and are subject to restrictive covenants. The covenants include certain minimum net worth requirements, minimum tangible net worth
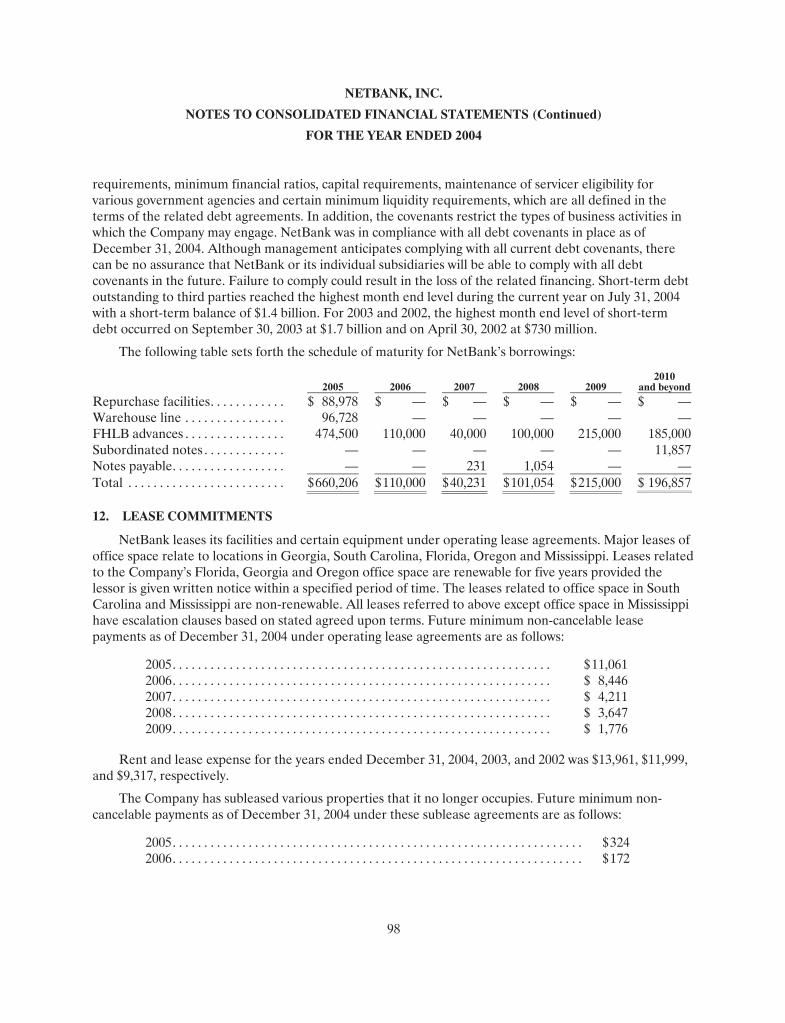
NETBANK, INC.
NOTES TO CONSOLIDATED FINANCIAL STATEMENTS (Continued)
FOR THE YEAR ENDED 2004
98
requirements, minimum financial ratios, capital requirements, maintenance of servicer eligibility for various government agencies and certain minimum liquidity requirements, which are all defined in the terms of the related debt agreements. In addition, the covenants restrict the types of business activities in which the Company may engage. NetBank was in compliance with all debt covenants in place as of December 31, 2004. Although management anticipates complying with all current debt covenants, therecan be no assurance that NetBank or its individual subsidiaries will be able to comply with all debtcovenants in the future. Failure to comply could result in the loss of the related financing. Short-term debt outstanding to third parties reached the highest month end level during the current year on July 31, 2004with a short-term balance of $1.4 billion. For 2003 and 2002, the highest month end level of short-term debt occurred on September 30, 2003 at $1.7 billion and on April 30, 2002 at $730 million.
The following table sets forth the schedule of maturity for NetBank’s borrowings:
2005 2006 2007 2008 20092010
and beyondRepurchase facilities. . . . . . . . . . . . $ 88,978 $ — $ — $ — $ — $ —Warehouse line . . . . . . . . . . . . . . . . 96,728 — — — — —FHLB advances . . . . . . . . . . . . . . . . 474,500 110,000 40,000 100,000 215,000 185,000Subordinated notes . . . . . . . . . . . . . — — — — — 11,857Notes payable. . . . . . . . . . . . . . . . . . — — 231 1,054 — —Total . . . . . . . . . . . . . . . . . . . . . . . . . $660,206 $110,000 $40,231 $101,054 $215,000 $ 196,857
12. LEASE COMMITMENTS
NetBank leases its facilities and certain equipment under operating lease agreements. Major leases of office space relate to locations in Georgia, South Carolina, Florida, Oregon and Mississippi. Leases related to the Company’s Florida, Georgia and Oregon office space are renewable for five years provided the lessor is given written notice within a specified period of time. The leases related to office space in South Carolina and Mississippi are non-renewable. All leases referred to above except office space in Mississippi have escalation clauses based on stated agreed upon terms. Future minimum non-cancelable leasepayments as of December 31, 2004 under operating lease agreements are as follows:
2005. . . . . . . . . . . . . . . . . . . . . . . . . . . . . . . . . . . . . . . . . . . . . . . . . . . . . . . . . . . . $11,0612006. . . . . . . . . . . . . . . . . . . . . . . . . . . . . . . . . . . . . . . . . . . . . . . . . . . . . . . . . . . . $ 8,4462007. . . . . . . . . . . . . . . . . . . . . . . . . . . . . . . . . . . . . . . . . . . . . . . . . . . . . . . . . . . . $ 4,2112008. . . . . . . . . . . . . . . . . . . . . . . . . . . . . . . . . . . . . . . . . . . . . . . . . . . . . . . . . . . . $ 3,6472009. . . . . . . . . . . . . . . . . . . . . . . . . . . . . . . . . . . . . . . . . . . . . . . . . . . . . . . . . . . . $ 1,776
Rent and lease expense for the years ended December 31, 2004, 2003, and 2002 was $13,961, $11,999,and $9,317, respectively.
The Company has subleased various properties that it no longer occupies. Future minimum non-cancelable payments as of December 31, 2004 under these sublease agreements are as follows:
2005. . . . . . . . . . . . . . . . . . . . . . . . . . . . . . . . . . . . . . . . . . . . . . . . . . . . . . . . . . . . . . . . . $3242006. . . . . . . . . . . . . . . . . . . . . . . . . . . . . . . . . . . . . . . . . . . . . . . . . . . . . . . . . . . . . . . . . $172
NETBANK, INC.
NOTES TO CONSOLIDATED FINANCIAL STATEMENTS (Continued)
FOR THE YEAR ENDED 2004
99
13. EMPLOYEE BENEFITS
During 2004, the Company maintained the NetBank, Inc. 401(k) Plan, (“the Plan”), which covers all eligible employees of the Company. Employees are eligible to participate in the Plan if they are at least 21 years of age and have completed six months of service. Plan participants may elect to have an unlimited percentage of their pre-tax earnings contributed to the Plan, and such contributions are generally tax-deferred. However, no participant could make annual contributions in excess of $13 for the year ended 2004, as provided by the Internal Revenue Service (“IRS”). Each year, in addition to the salary deferral, the Company may make contributions on the participants’ behalf through matching contributions, profitsharing contributions, and qualified non-elective contributions. Each of these contributions is madeannually at the discretion of the Board of Directors. During 2004, the Company matched 100% of the first three percent of participants’ contributions and 50% of the next three percent of participants’ contributions, limited to $4.5 per participant. In addition, the Company contributed an additional two percent of participants’ earnings, limited to $2 per participant, to the Plan. All participants vest in both matching and discretionary balances in their accounts at a rate of 25% per year for each year of service, except those participants who were hired before April 30, 2002, and are participating in the NetBank, Inc. Employees Retirement Plan. These employees vest at a rate of 34% after one year of service, 67% after two years, and 100% after three years. The NetBank, Inc. Employees Retirement Plan was maintained by NetBank until December 31, 2002, and covered eligible NetBank employees who were employed by NetBank prior its acquisition of Resource. This plan and the Resource Bancshares Mortgage Group, Inc. Retirement Savings Plan were merged into the Plan as of December 31, 2002. The Company expensed $4,907, $4,567 and $3,032 in 2004, 2003 and 2002, respectively, related to all 401(k) plans.
On July 1, 2002, the Company established the NetBank, Inc. Employee Stock Purchase Plan, (“the Stock Plan”), to allow participants to purchase stock in the Company through payroll deduction. The Stock Plan purchases shares of NetBank’s common stock from the Company on the last day of each quarter at 85% of the market value on the purchase date. Employees are eligible to enroll in the Stock Plan onJanuary 1, April 1, July 1 and October 1. There was no expense recognized during 2004, 2003 or 2002related to the Stock Plan.
Prior to its acquisition of Resource, the Company adopted an “Executive Supplemental Retirement Plan” and a “Director Supplemental Retirement Plan”, together referred to as the “BOLI Plan”, for key members of senior management and the Board of Directors. The BOLI Plan provides for an annual benefit payable at normal retirement, age 65, targeted at 40% of final compensation projected at anassumed 4% salary progression rate. Actual total benefits payable under the BOLI Plan are dependent onan indexed retirement benefit formula, which accrues benefits equal to the aggregate after-tax income of associated life insurance contracts less the Company’s tax-effected cost of funds for that plan year. While benefits are guaranteed until the respective participant’s projected mortality, the total lifetime benefit is indexed to the performance of the insurance contract. Therefore, benefits under the BOLI Plan are ultimately dependent on the performance of the insurance contracts and are not guaranteed by the Company.
In connection with the BOLI Plan, the Company has also entered into Life Insurance Endorsement Method Split Dollar Agreements (the “Agreements”) with the individuals covered under the BOLI Plan. Under the Agreements, the Company shares 80% of death benefits over and above the cash surrender value (the net at risk death benefit) with the designated beneficiaries of the BOLI Plan participants under

NETBANK, INC.
NOTES TO CONSOLIDATED FINANCIAL STATEMENTS (Continued)
FOR THE YEAR ENDED 2004
100
life insurance contracts referenced in the BOLI Plan. The Company, as owner of the policies, retains a 20% interest in the net at risk life proceeds and a 100% interest in the cash surrender value of the policies. The BOLI Plan also contains provisions for change of control of the Company, as defined, which allows the participants to retain benefits, subject to certain conditions, under the BOLI Plans in the event of a change in control. Because the BOLI Plan was designed to retain the future services of key executives, nobenefits are payable under the BOLI Plan until age 65, and the amount of those benefits will be determined based upon the individual participant’s vesting schedule. The Company’s total investment inthe BOLI Plans as of December 31, 2004 and 2003 was $16.5 and $15.9 million, respectively. The expense of this benefit to the Company was $1,259 and $578 for the years ended December 31, 2004 and 2003, respectively. The income from policy appreciation was $570 and $673 for the years ended December 31, 2004 and 2003, respectively. In April 2003, the Board closed the BOLI Plan to further participation. No current members of senior management are participants; however, seven of NetBank’s current directors are participants.
14. STOCK PLANS
NetBank has a 1996 Stock Incentive Plan (the “Stock Plan”), which provides that employees, officers, directors and consultants of NetBank may be granted nonqualified and incentive stock options to purchase shares of common stock of NetBank, derivative securities related to the value of the common stock, or cash awards. On April 29, 2004, the shareholders of NetBank voted to increase the number of shares reserved for the Plan to 9,500,000. Generally, the options expire ten years from the date of the grant.
A summary of the status of the Stock Plan and activity follows (shares in 000s and exercises in dollars):
Year endedDecember 31,
2004
WeightedAverageExercise
Price
Year endedDecember 31,
2003
WeightedAverageExercise
Price
Year ended December 31,
2002
WeightedAverageExercise
Price Outstanding at beginning of
year . . . . . . . . . . . . . . . . . . . . . . 4,322 $11.22 3,678 $10.65 3,030 $10.73Granted. . . . . . . . . . . . . . . . . . . 1,335 $11.26 1,245 $11.32 2,938 $10.70Exercised . . . . . . . . . . . . . . . . . (111) $ 7.05 (327) $ 6.04 (1,207) $ 3.51Forfeited. . . . . . . . . . . . . . . . . . (69) $12.45 (188) $ 9.87 (512) $18.43Cancelled . . . . . . . . . . . . . . . . . (223) $11.37 (86) $10.36 (571) $19.51
Outstanding at end of year . . . . 5,254 $11.27 4,322 $11.22 3,678 $10.65

NETBANK, INC.
NOTES TO CONSOLIDATED FINANCIAL STATEMENTS (Continued)
FOR THE YEAR ENDED 2004
101
The following table summarizes information about NetBank’s stock options outstanding (shares in000s and exercises in dollars):
Exercise Price
Options Outstanding atDecember 31,
2004
WeightedAverage
RemainingContractual
Life
Weighted Average
Exercise Priceof Options
Outstanding
Options Exercisable at December 31,
2004
Weighted Average
Exercise Price of Options Exercisable
$3.51-5.27 . . . . . . . . . . 338 4.6 $ 4.36 338 $ 4.36 $5.58-8.25 . . . . . . . . . . 391 6.1 $ 7.13 390 $ 7.13 $8.50-12.44. . . . . . . . . 3,395 8.1 $ 10.78 1,406 $ 10.58 $12.77-18.88. . . . . . . . 1,124 7.0 $ 16.05 703 $ 15.96 $22.50-53.33. . . . . . . . 6 4.3 $ 51.84 6 $ 51.84
5,254 7.5 $ 11.27 2,843 $ 10.79
As discussed in note 3, Accounting Policies, NetBank accounted for the Stock Plan under APB 25 and under SFAS 123 for disclosure purposes. For SFAS 123 purposes, the fair value of each option granted under the Stock Plan during the years ended December 31, 2004, 2003, and 2002 was estimated on the date of grant using the Black-Scholes option-pricing model with the following weighted average assumptions used:
Year Ended December 31, 2004 2003 2002
Fair value . . . . . . . . . . . . . . . . . . . . . . . . . . . . . . . . . . . . . . . . . $ 4.54 $ 4.75 $ 6.63 Expected life (years) . . . . . . . . . . . . . . . . . . . . . . . . . . . . . . . 5 5 5 Risk-free interest rate . . . . . . . . . . . . . . . . . . . . . . . . . . . . . . 3.21% 3.04% 4.03 %Dividend rate. . . . . . . . . . . . . . . . . . . . . . . . . . . . . . . . . . . . . . 0.70% 0.70% 0.00 %Expected volatility . . . . . . . . . . . . . . . . . . . . . . . . . . . . . . . . . 42.70% 44.50% 47.60 %
Reference is made to note 3, Accounting Policies, for information regarding the Company’s plan to adopt the fair value recognition principles of SFAS 123r during 2005.
On March 6, 2002, prior to the acquisition of Resource, a tender offer was made to certain NetBank employees to exchange any outstanding options with an exercise price greater than $14.00 per share for cash equal to the greater of the fair value of the underlying option determined by the Black-Scholes option pricing model or $2.00 per share. The offer expired at midnight on Tuesday, April 2, 2002. NetBank accepted the tender of 1,044,550 options, at a cost of $3.6 million.
In November 2003, the Company adopted the Mid-Term Incentive Plan (the “Mid-Term Plan”) under the Company’s 1996 Stock Incentive Plan. Effective January 1, 2004, the Compensation Committee granted incentive awards under the Mid-Term Plan to certain executives of the Company. The awards are payable only if the Company achieves specified levels of consolidated earnings per share and earnings per share of its three operating segments during the two- and three-year performance periods. Awards are denominated in cash but payable in shares of restricted stock under the 1996 Stock Incentive Plan, with 50 percent of the shares vesting immediately after the last day of the relevant performance period and 25 percent of the shares vesting at the end of each of the first and second years thereafter. In the case of a recipient’s death, disability, retirement, or termination of employment without cause, awards would vest in
NETBANK, INC.
NOTES TO CONSOLIDATED FINANCIAL STATEMENTS (Continued)
FOR THE YEAR ENDED 2004
102
full prior to the last day of the performance period, based on actual performance to the vesting date. Inaddition, if the recipient’s employment is constructively terminated in the 18-month period after a change of control event, Awards vest in full prior to the last day of the performance period, based on actual performance to the vesting date.
15. SHAREHOLDERS’ EQUITY (amounts not in 000s)
NetBank has authorized 100,000 shares of Series A Junior Participating Preferred Stock, without par value (“Series A Stock”). Each share of Series A Stock will be entitled to 1,000 votes on all matters submitted to a shareholder vote. The Series A Stock is not redeemable or convertible into any other security. Each share of Series A Stock will have a minimum cumulative preferred quarterly dividend rate equal to the greater of $1 per share or 1,000 times the aggregate per share amount of dividends declared on common stock in the related quarter. In the event of liquidation, shares of Series A Stock will beentitled to a preferential liquidation payment equal to the greater of $1,000 per share plus any accrued and unpaid dividends or 1,000 times the payment to be made per share of common stock. No shares of Series A Stock are presently outstanding, and no shares are expected to be issued except in connection with the shareholder rights plan referred to below.
Effective January 20, 2000, NetBank’s Board of Directors adopted a Shareholder Rights Plan pursuant to which all shareholders of record on February 4, 2000, received one right to purchase a fractional (1/1000th) share of a new series of preferred stock for each share of NetBank’s common stock owned on that date. These rights will only trade with NetBank’s common stock if certain events occur. Inthe event of merger of NetBank into another entity or an acquisition of 20% of NetBank’s common stock by any person or entity, these rights, unless previously redeemed by NetBank, will convert into a right to acquire at a discount price, either the stock of the acquiring entity or additional shares of NetBank’s common stock. These rights will be exercisable at $150 for each 1/1000th of a share of preferred stock and will expire on February 4, 2010. These rights are redeemable at $0.01 per right at the option of NetBank.
At December 31, 2004, the Company had 6,292,082 shares of treasury stock compared to 5,235,538 at December 31, 2003. The 1,056,544 increase in shares is primarily due to the repurchase of 1,456,336 shares of the Company’s common stock during the year ended December 31, 2004, offset in part by the issuance of 194,217 shares as part of the acquisition of Beacon and the issuance of 205,575 shares for the exercise of stock options and shares purchased by employees through the employee stock purchase plan.
For the years ended December 31, 2004 and 2003 the Company declared dividends of $0.08 per common share. NetBank did not pay a dividend during 2002. NetBank’s Board of Directors declared a dividend of $0.02 per common share outstanding to shareholders of record on February 15, 2005. The dividend will be paid on March 15, 2005.
16. NET INCOME (LOSS) PER COMMON AND COMMON EQUIVALENT SHARE
Basic and diluted net income (loss) per common and potential common share has been calculatedbased on the weighted average number of shares outstanding. The following schedule reconciles the numerator and denominator of the basic and diluted net income (loss) per common and potential common share for the years ended December 31, 2004, 2003 and 2002. For the year ended December 31, 2002, there is no difference in basic and diluted shares as the effect of options outstanding to purchase common

NETBANK, INC.
NOTES TO CONSOLIDATED FINANCIAL STATEMENTS (Continued)
FOR THE YEAR ENDED 2004
103
shares would be anti-dilutive to the net loss for that period. The effect of convertible debt securities outstanding has not been included in the year ended December 31, 2002 because the assumed conversionof such securities would be anti-dilutive to the net loss per share for that period. The Company paid dividends of $0.08 and $0.08 per common share outstanding during 2004 and 2003, respectively. The Company did not pay dividends in prior years.
Net income (loss)(numerator)
Shares(denominator)
Per shareamount
(Shares in 000s) Year ended December 31, 2004
Basic EPS . . . . . . . . . . . . . . . . . . . . . . . . . . . . . . . . . . . . . . . . . . . . . $ 4,220 46,862 $ 0.09Effect of dilutive securities—options to purchase common
shares . . . . . . . . . . . . . . . . . . . . . . . . . . . . . . . . . . . . . . . . . . . . . . — 352 —Diluted EPS . . . . . . . . . . . . . . . . . . . . . . . . . . . . . . . . . . . . . . . . . . . $ 4,220 47,214 $ 0.09Year ended December 31, 2003
Basic EPS . . . . . . . . . . . . . . . . . . . . . . . . . . . . . . . . . . . . . . . . . . . . . $ 50,514 47,963 $ 1.05Effect of dilutive securities—options to purchase common
shares . . . . . . . . . . . . . . . . . . . . . . . . . . . . . . . . . . . . . . . . . . . . . . — 682 (0.01)Diluted EPS . . . . . . . . . . . . . . . . . . . . . . . . . . . . . . . . . . . . . . . . . . . $ 50,514 48,645 $ 1.04Year ended December 31, 2002
Basic EPS . . . . . . . . . . . . . . . . . . . . . . . . . . . . . . . . . . . . . . . . . . . . . $(15,857) 44,407 $ (0.36)Effect of dilutive securities—options to purchase common
shares . . . . . . . . . . . . . . . . . . . . . . . . . . . . . . . . . . . . . . . . . . . . . . — — —Diluted EPS . . . . . . . . . . . . . . . . . . . . . . . . . . . . . . . . . . . . . . . . . . . $(15,857) 44,407 $ (0.36)
17. INCOME TAXES
NetBank’s income tax expense (benefit) consists of current and deferred income tax expense (benefit) as follows for the years ended:
2004 2003 2002Current. . . . . . . . . . . . . . . . . . . . . . . . . . . . . . . . . . . . . . . $ (18,401) $ 15,340 $ 3,806Deferred. . . . . . . . . . . . . . . . . . . . . . . . . . . . . . . . . . . . . . 20,511 14,199 (13,986)Income tax (benefit) expense . . . . . . . . . . . . . . . . . . . . $ 2,110 $29,539 $(10,180)
The effective tax rate varied from the statutory federal tax rate of 35% for the years ended December 31, 2004, 2003 and 2002 due to the following:
2004 2003 2002Income tax at statutory rate. . . . . . . . . . . . . . . . . $2,215 35.0% $28,019 35.0% $ (9,113) (35.0)%State tax, net of federal benefit. . . . . . . . . . . . . . (65) (1.0)% 1,662 2.1% (952) (3.7)%Other, net . . . . . . . . . . . . . . . . . . . . . . . . . . . . . . . . (40) (0.6)% (142) (0.2)% (115) (0.4)%Income tax (benefit) expense . . . . . . . . . . . . . . . $2,110 33.4% $29,539 36.9% $(10,180) (39.1)%

NETBANK, INC.
NOTES TO CONSOLIDATED FINANCIAL STATEMENTS (Continued)
FOR THE YEAR ENDED 2004
104
During 2002, the Company qualified for state tax credits of $414 reducing current state tax expense that otherwise would have been payable for that year.
NetBank had deferred tax assets and deferred tax liabilities as of December 31,:
2004 2003Net operating loss carryforwards . . . . . . . . . . . . . . . . . . . . . . . . . . . $ 10,012 $ 8,168Tax credit carryforwards . . . . . . . . . . . . . . . . . . . . . . . . . . . . . . . . . . 2,860 2,816Unrealized (gain) loss on available for sale securities . . . . . . . . . 696 (1,629)Allowance for loan and lease losses . . . . . . . . . . . . . . . . . . . . . . . . 22,933 26,055Total deferred tax assets . . . . . . . . . . . . . . . . . . . . . . . . . . . . . . . . . . 36,501 35,410Valuation allowance. . . . . . . . . . . . . . . . . . . . . . . . . . . . . . . . . . . . . . (3,058 ) (4,032 )Net deferred tax assets. . . . . . . . . . . . . . . . . . . . . . . . . . . . . . . . . . . . 33,443 31,378
Mortgage servicing rights . . . . . . . . . . . . . . . . . . . . . . . . . . . . . . . . . (56,369) (42,024)Deferred loan costs . . . . . . . . . . . . . . . . . . . . . . . . . . . . . . . . . . . . . . (1,410) (1,595)Depreciation and amortization . . . . . . . . . . . . . . . . . . . . . . . . . . . . (13,939 ) (12,859 )Mark-to-market . . . . . . . . . . . . . . . . . . . . . . . . . . . . . . . . . . . . . . . . . (11,242 ) (10,532 )Goodwill. . . . . . . . . . . . . . . . . . . . . . . . . . . . . . . . . . . . . . . . . . . . . . . . (1,961 ) (1,216 )Other, net. . . . . . . . . . . . . . . . . . . . . . . . . . . . . . . . . . . . . . . . . . . . . . . (615 ) 2,623Total deferred tax liabilities . . . . . . . . . . . . . . . . . . . . . . . . . . . . . . . (85,536) (65,603)Net deferred tax liabilities. . . . . . . . . . . . . . . . . . . . . . . . . . . . . . . . . $(52,093) $(34,225)
The Company has determined that it is more likely than not that the deferred tax assets will be realized through expected future taxable income that will exceed amounts necessary to fully utilize remaining deferred tax assets. The valuation allowance relates to certain state net operating loss carryforwards and state tax credits, which the Company has determined may expire before the Company can use them. The 2004 change in the valuation allowance relates to these state tax carryforwards, the benefit of which has not been recognized for financial statement purposes.
During 2004 and 2003, non-qualified stock options were exercised generating a tax benefit of $125 and $604, respectively. During 2004 and 2003, restricted stock was granted generating a tax benefit of $23 and $0, respectively. Both of these benefits are reflected in additional paid-in capital.
At December 31, 2004, the Company had Federal NOL carryforwards of $11,568, which expire in 2023. In addition, the Company had state NOL carryforwards of $156,988 that expire at various times from2008 to 2024.
18. BUSINESS SEGMENTS
During 2004, NetBank realigned its operating segments as described in the following paragraph. Prior period amounts have been restated in conformity with the current period presentation.
NetBank’s principal activities include retail banking, financial intermediary and transaction processing. The retail banking segment primarily consists of offering consumer banking products such as checking, money market, and certificates of deposit. Its investments primarily consist of 1-4 familymortgage loans originated by the financial intermediary segment, small business financing loans and leases

NETBANK, INC.
NOTES TO CONSOLIDATED FINANCIAL STATEMENTS (Continued)
FOR THE YEAR ENDED 2004
105
originated by its NetBank Business Finance division, auto loans originated by its Dealer Financial Services division, purchased securities for investment, mortgage servicing rights and various other purchased or retained loan products. The financial intermediary segment primarily originates mortgage loans via a network of retail branches or acquires mortgage loans from correspondents and/or brokers and packages pools of such loans either inclusive of or exclusive of servicing rights for sale to the retail banking segment or into the secondary market. The transaction processing segment provides ATM and merchant processingservices; subservices loans for the retail bank segment, financial intermediary segment and for third-party customers; and sells various insurance products using an Internet-based platform.
The accompanying segment data includes the results of Beacon commencing July 1, 2004, NPS commencing December 1, 2003 and Resource commencing April 1, 2002, reflecting the respective dates of acquisition. The 2002 table includes the effects of certain transactions related to the acquisition of Resource, including the effects of purchase accounting, restructuring of the investment portfolio and certain compensation charges related to changes in management as a result of the transactions.
The financial information for each business segment reflects specific identifiable transactions orallocated transactions based on an internal allocation method. The measurement of the performance of the business segments is based on the management structure of NetBank and is not necessarily comparable with similar information from any other financial institution. The information presented is also not necessarily indicative of the segments’ operations if they were independent entities. None of the Company’s segments have a significant exposure to any individual customer or vendor.
For the year ended December 31, 2004
Retail bankingFinancial
intermediaryTransactionprocessing
Other / Eliminations Consolidated
Interest income . . . . . . . . . . . . . . . . . $ 121,592 $108,155 $ 42 $ 2,374 $ 232,163Intersegment interest income . . . . . 50,496 3,010 — (53,506) —Total interest income . . . . . . . . . . . . 172,088 111,165 42 (51,132) 232,163Interest expense. . . . . . . . . . . . . . . . . 84,022 7,859 83 653 92,617Intersegment interest expense . . . . 7,215 46,071 — (53,286) —Total interest expense. . . . . . . . . . . . 91,237 53,930 83 (52,633) 92,617Net interest income. . . . . . . . . . . . . . 80,851 57,235 (41) 1,501 139,546Provision for credit losses . . . . . . . . 34,745 32 — — 34,777Intersegment- servicing /
processing fees. . . . . . . . . . . . . . . . — 1,925 14,326 (16,251 ) —Non-interest income . . . . . . . . . . . . . 72,034 121,019 17,622 (3,324) 207,351Non-interest expense . . . . . . . . . . . . 119,189 150,682 29,583 6,336 305,790Intersegment- servicing /
processing expenses . . . . . . . . . . . 10,027 6,224 — (16,251) —Pre-tax income (loss) . . . . . . . . . . . . $ (11,076) $ 23,241 $ 2,324 $ (8,159) $ 6,330
Total Assets . . . . . . . . . . . . . . . . . . . . $ 4,271,085 $ 530,428 $37,359 $ (216,691) $ 4,622,181

NETBANK, INC.
NOTES TO CONSOLIDATED FINANCIAL STATEMENTS (Continued)
FOR THE YEAR ENDED 2004
106
For the year ended December 31, 2003
Retail bankingFinancial
intermediaryTransactionprocessing
Other / Eliminations Consolidated
Interest income . . . . . . . . . . . . . . . . . $ 86,700 $123,813 $ — $ 117 $ 210,630Intersegment interest income . . . . . 43,505 189 — (43,694) —Total interest income . . . . . . . . . . . . 130,205 124,002 — (43,577) 210,630Interest expense. . . . . . . . . . . . . . . . . 76,092 7,995 8 1,291 85,386Intersegment interest expense . . . . 1,143 42,521 — (43,664) —Total interest expense. . . . . . . . . . . . 77,235 50,516 8 (42,373) 85,386Net interest income. . . . . . . . . . . . . . 52,970 73,486 (8) (1,204) 125,244Provision for credit losses . . . . . . . . 6,989 19 — — 7,008Intersegment- servicing /
processing fees. . . . . . . . . . . . . . . . — — 12,170 (12,170) —Non-interest income . . . . . . . . . . . . . 64,531 242,948 8,523 (5,458) 310,544Non-interest expense . . . . . . . . . . . . 161,116 156,580 24,669 6,362 348,727Intersegment- servicing /
processing expenses . . . . . . . . . . . 10,414 1,756 — (12,170) —Pre-tax income (loss) . . . . . . . . . . . . $ (61,018) $158,079 $ (3,984) $ (13,024) $ 80,053
Total Assets . . . . . . . . . . . . . . . . . . . . $ 4,209,334 $ 742,850 $23,596 $ (240,975) $ 4,734,805
For the year ended December 31, 2002
Retail bankingFinancial
intermediaryTransactionprocessing
Other / Eliminations Consolidated
Interest income . . . . . . . . . . . . . . . . $ 95,652 $ 68,760 $ — $ 2,343 $ 166,755Intersegment interest income . . . . 16,807 — — (16,807) —Total interest income . . . . . . . . . . . 112,459 68,760 — (14,464) 166,755Interest expense. . . . . . . . . . . . . . . . 88,722 11,802 — 2,995 103,519Intersegment interest expense . . . — 16,807 — (16,807) —Total interest expense. . . . . . . . . . . 88,722 28,609 — (13,812) 103,519Net interest income. . . . . . . . . . . . . 23,737 40,151 — (652) 63,236Provision for credit losses . . . . . . . 22,394 23 — — 22,417Intersegment- servicing /
processing fees. . . . . . . . . . . . . . . — — 1,180 (1,180) —Non-interest income . . . . . . . . . . . . 45,969 123,096 5,436 2,660 177,161Non-interest expense . . . . . . . . . . . 104,450 109,337 15,111 15,119 244,017Intersegment- servicing /
processing expenses . . . . . . . . . . — 1,180 — (1,180) —Pre-tax income (loss) . . . . . . . . . . . $ (57,138) $ 52,707 $ (8,495) $ (13,111) $ (26,037)
Total Assets . . . . . . . . . . . . . . . . . . . $ 3,347,939 $ 1,646,492 $ 939 $(1,467,818) $ 3,527,552

NETBANK, INC.
NOTES TO CONSOLIDATED FINANCIAL STATEMENTS (Continued)
FOR THE YEAR ENDED 2004
107
19. COMMITMENTS, CONTINGENCIES AND GUARANTEES
The Company was servicing or subservicing for the benefit of others 106,781, 105,395 and 79,274 of residential loans, with unpaid principal balances aggregating approximately $14.0 billion, $13.6 billion and$9.7 billion at December 31, 2004, 2003 and 2002, respectively. Mortgagor’s taxes and insurance escrow funds and investors principal and interest escrow funds totaled approximately $288 million and $199 million as of December 31, 2004 and 2003, respectively. Loans serviced for others and the related escrow funds are not owned by NetBank; however, the majority of the escrow funds are deposited in NetBank, FSB.
The Company has issued mortgage-backed securities under programs sponsored by Ginnie Mae, Freddie Mac and Fannie Mae. In connection with servicing mortgage-backed securities guaranteed by Ginnie Mae, Freddie Mac or Fannie Mae, the Company advances certain principal and interest payments to security holders prior to their collection from specific mortgagors. Additionally, the Company must remit certain payments of property taxes and insurance premiums in advance of collecting them from specific mortgagors and make certain payments of attorney’s fees and other costs related to loans in foreclosure. These amounts are included in servicing advances under the caption due from servicers andinvestors in the accompanying consolidated balance sheets. Likewise, during the month that a mortgagor pays off his/her mortgage, the Company must accept an interest payment from the borrower that is pro-rated to the date of payoff and pass through a full month’s interest to the security holder. The Company includes its projection of the cost of such advances and lost interest on mortgages that prepay, and the expense of unreimbursed attorney and other costs associated with foreclosure in its valuation of its mortgage servicing rights.
In the ordinary course of business, the Company is exposed to liability under representations and warranties made to purchasers and insurers of mortgage loans and the purchasers of mortgage servicing rights. Under certain circumstances, the Company may be required to repurchase mortgage loans or indemnify the purchasers of loans or mortgage servicing rights for losses if there has been a breach of representations or warranties. Repurchased loans are carried at the lower of cost or net realizable value. As of December 31, 2004 and 2003, loans held for sale included repurchased loans with a net carryingvalue of $48.9 million and $51.9 million, respectively.
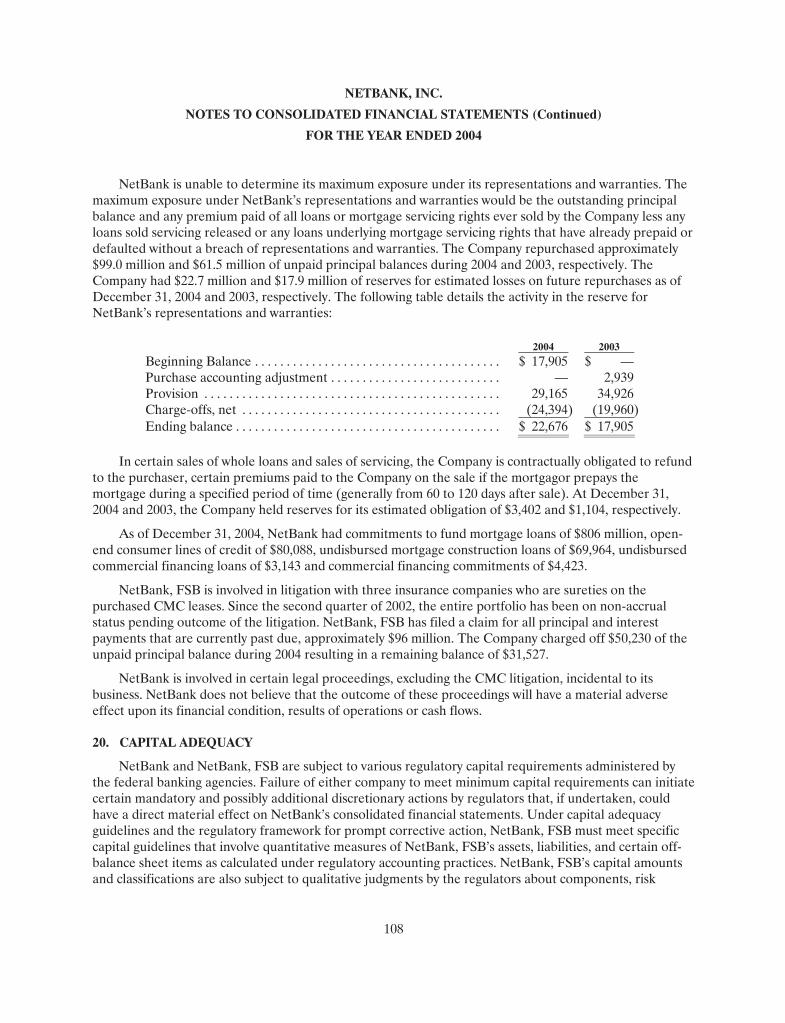
NETBANK, INC.
NOTES TO CONSOLIDATED FINANCIAL STATEMENTS (Continued)
FOR THE YEAR ENDED 2004
108
NetBank is unable to determine its maximum exposure under its representations and warranties. The maximum exposure under NetBank’s representations and warranties would be the outstanding principal balance and any premium paid of all loans or mortgage servicing rights ever sold by the Company less any loans sold servicing released or any loans underlying mortgage servicing rights that have already prepaid or defaulted without a breach of representations and warranties. The Company repurchased approximately $99.0 million and $61.5 million of unpaid principal balances during 2004 and 2003, respectively. The Company had $22.7 million and $17.9 million of reserves for estimated losses on future repurchases as ofDecember 31, 2004 and 2003, respectively. The following table details the activity in the reserve for NetBank’s representations and warranties:
2004 2003Beginning Balance . . . . . . . . . . . . . . . . . . . . . . . . . . . . . . . . . . . . . . . $ 17,905 $ —Purchase accounting adjustment . . . . . . . . . . . . . . . . . . . . . . . . . . . — 2,939Provision . . . . . . . . . . . . . . . . . . . . . . . . . . . . . . . . . . . . . . . . . . . . . . . 29,165 34,926Charge-offs, net . . . . . . . . . . . . . . . . . . . . . . . . . . . . . . . . . . . . . . . . . (24,394 ) (19,960 )Ending balance . . . . . . . . . . . . . . . . . . . . . . . . . . . . . . . . . . . . . . . . . . $ 22,676 $ 17,905
In certain sales of whole loans and sales of servicing, the Company is contractually obligated to refundto the purchaser, certain premiums paid to the Company on the sale if the mortgagor prepays the mortgage during a specified period of time (generally from 60 to 120 days after sale). At December 31, 2004 and 2003, the Company held reserves for its estimated obligation of $3,402 and $1,104, respectively.
As of December 31, 2004, NetBank had commitments to fund mortgage loans of $806 million, open-end consumer lines of credit of $80,088, undisbursed mortgage construction loans of $69,964, undisbursed commercial financing loans of $3,143 and commercial financing commitments of $4,423.
NetBank, FSB is involved in litigation with three insurance companies who are sureties on the purchased CMC leases. Since the second quarter of 2002, the entire portfolio has been on non-accrual status pending outcome of the litigation. NetBank, FSB has filed a claim for all principal and interest payments that are currently past due, approximately $96 million. The Company charged off $50,230 of the unpaid principal balance during 2004 resulting in a remaining balance of $31,527.
NetBank is involved in certain legal proceedings, excluding the CMC litigation, incidental to its business. NetBank does not believe that the outcome of these proceedings will have a material adverse effect upon its financial condition, results of operations or cash flows.
20. CAPITAL ADEQUACY
NetBank and NetBank, FSB are subject to various regulatory capital requirements administered by the federal banking agencies. Failure of either company to meet minimum capital requirements can initiate certain mandatory and possibly additional discretionary actions by regulators that, if undertaken, could have a direct material effect on NetBank’s consolidated financial statements. Under capital adequacy guidelines and the regulatory framework for prompt corrective action, NetBank, FSB must meet specific capital guidelines that involve quantitative measures of NetBank, FSB’s assets, liabilities, and certain off-balance sheet items as calculated under regulatory accounting practices. NetBank, FSB’s capital amounts and classifications are also subject to qualitative judgments by the regulators about components, risk
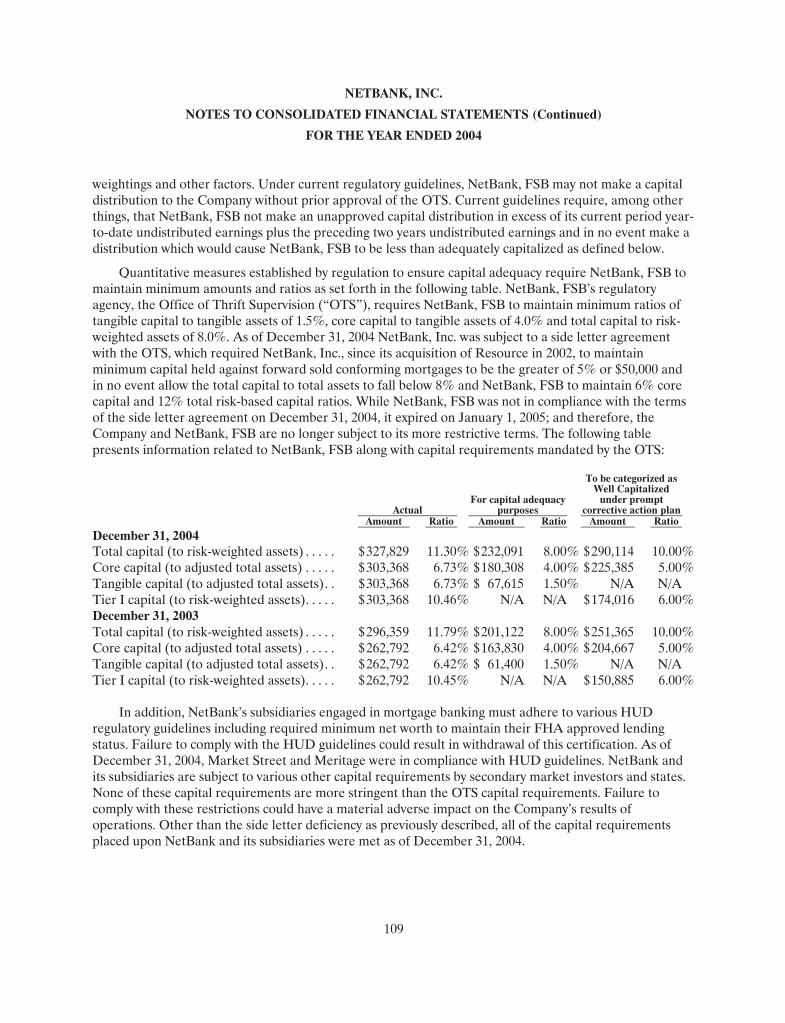
NETBANK, INC.
NOTES TO CONSOLIDATED FINANCIAL STATEMENTS (Continued)
FOR THE YEAR ENDED 2004
109
weightings and other factors. Under current regulatory guidelines, NetBank, FSB may not make a capital distribution to the Company without prior approval of the OTS. Current guidelines require, among other things, that NetBank, FSB not make an unapproved capital distribution in excess of its current period year-to-date undistributed earnings plus the preceding two years undistributed earnings and in no event make a distribution which would cause NetBank, FSB to be less than adequately capitalized as defined below.
Quantitative measures established by regulation to ensure capital adequacy require NetBank, FSB to maintain minimum amounts and ratios as set forth in the following table. NetBank, FSB’s regulatory agency, the Office of Thrift Supervision (“OTS”), requires NetBank, FSB to maintain minimum ratios of tangible capital to tangible assets of 1.5%, core capital to tangible assets of 4.0% and total capital to risk-weighted assets of 8.0%. As of December 31, 2004 NetBank, Inc. was subject to a side letter agreement with the OTS, which required NetBank, Inc., since its acquisition of Resource in 2002, to maintain minimum capital held against forward sold conforming mortgages to be the greater of 5% or $50,000 and in no event allow the total capital to total assets to fall below 8% and NetBank, FSB to maintain 6% core capital and 12% total risk-based capital ratios. While NetBank, FSB was not in compliance with the terms of the side letter agreement on December 31, 2004, it expired on January 1, 2005; and therefore, the Company and NetBank, FSB are no longer subject to its more restrictive terms. The following table presents information related to NetBank, FSB along with capital requirements mandated by the OTS:
ActualFor capital adequacy
purposes
To be categorized asWell Capitalized
under promptcorrective action plan
Amount Ratio Amount Ratio Amount RatioDecember 31, 2004Total capital (to risk-weighted assets) . . . . . $327,829 11.30% $232,091 8.00% $290,114 10.00%Core capital (to adjusted total assets) . . . . . $303,368 6.73% $180,308 4.00% $225,385 5.00%Tangible capital (to adjusted total assets). . $ 303,368 6.73% $ 67,615 1.50% N/A N/A Tier I capital (to risk-weighted assets). . . . . $303,368 10.46% N/A N/A $ 174,016 6.00%December 31, 2003Total capital (to risk-weighted assets) . . . . . $296,359 11.79% $201,122 8.00% $251,365 10.00%Core capital (to adjusted total assets) . . . . . $262,792 6.42% $163,830 4.00% $204,667 5.00%Tangible capital (to adjusted total assets). . $ 262,792 6.42% $ 61,400 1.50% N/A N/A Tier I capital (to risk-weighted assets). . . . . $262,792 10.45% N/A N/A $ 150,885 6.00%
In addition, NetBank’s subsidiaries engaged in mortgage banking must adhere to various HUD regulatory guidelines including required minimum net worth to maintain their FHA approved lending status. Failure to comply with the HUD guidelines could result in withdrawal of this certification. As ofDecember 31, 2004, Market Street and Meritage were in compliance with HUD guidelines. NetBank and its subsidiaries are subject to various other capital requirements by secondary market investors and states. None of these capital requirements are more stringent than the OTS capital requirements. Failure to comply with these restrictions could have a material adverse impact on the Company’s results of operations. Other than the side letter deficiency as previously described, all of the capital requirements placed upon NetBank and its subsidiaries were met as of December 31, 2004.

NETBANK, INC.
NOTES TO CONSOLIDATED FINANCIAL STATEMENTS (Continued)
FOR THE YEAR ENDED 2004
110
21. FINANCIAL INSTRUMENTS AND RISK MANAGEMENT
The Company is a party to various derivative financial instruments and financial instruments that theCompany enters into in the normal course of business to meet the financing needs of its customers and to reduce its own exposure to risks related to fluctuating interest rates. These financial instruments include mortgage loan funding/purchase commitments, mandatory delivery commitments, put and call optioncontracts, swaps, futures contracts, interest rate cap contracts, interest rate floor contracts and forward servicing sales contracts. The Company uses these financial instruments exclusively for purposes of managing its resale pricing and interest rate risks.
The Company’s mortgage loans held for sale are originated directly with borrowers or acquired through a network of correspondents and wholesale brokers. In connection therewith, the Company routinely enters into optional mortgage purchase commitments to acquire or originate specific in-process mortgage loans when and if closed by the counterparty, at the option of the mortgagor. Mortgage purchase commitments obligate the Company to fund or acquire mortgage loans on a delayed delivery basis, whichmay extend for a period of 30 to 90 days, at a price which is fixed as of the date of the contract.
The Company is subject to the risk that the market value of its on-balance sheet mortgage loans held for sale and the mortgage loans it is obligated to fund or purchase under its mortgage purchase commitments may change significantly prior to resale (“secondary market value”). In order to limit its resale price exposure for mortgage loans, the Company enters into mandatory delivery commitments, which are contracts for delayed delivery of mortgage loans or mortgage-backed securities to third parties. Mandatory delivery commitments obligate the Company to sell mortgage loans on a delayed delivery basis at a price which is fixed as of the date of the contract. Since mandatory delivery commitments enable the Company to fix its resale prices for both mortgage loans held for sale (for which a fixed price has alreadybeen paid) and for anticipated loan closures subject to mortgage purchase/funding commitments (which fix the delayed purchase or funding price for the resultant mortgage loans), these instruments can effectively limit the Company’s resale price exposures. The Company uses these same instruments to cross hedge loans held for sale which the Company intends to deliver via a whole loan sale, which exposes the Company to basis risk. Basis risk is the risk that the market demand for certain products does not move in correlation to movements in prevailing interest rates.
The percentages of anticipated agency-eligible loan closures under mortgage purchase or fundingcommitments that are covered by mandatory delivery commitments not allocated to mortgages held for sale are monitored continuously. The Company’s resultant expected exposure to resale pricing risk is continuously adjusted to consider changing expectations regarding anticipated loan closure percentages and other market conditions.
Purchased call option contracts enable the Company, at its option, to acquire an underlying financial security from a third party at a specified price for a fixed period of time. Purchased put option contracts enable the Company, at its discretion, to sell an underlying financial security to a third party at a specified price and for a fixed period of time. Since these financial instruments essentially enable the Company to fix the purchase or sale price on financial instruments whose changes in value have historically correlated closely with changes in value of mortgage loans, these instruments can be used effectively to adjust the Company’s overall exposure to resale pricing risks. In addition, these instruments have the advantages of

NETBANK, INC.
NOTES TO CONSOLIDATED FINANCIAL STATEMENTS (Continued)
FOR THE YEAR ENDED 2004
111
being available in smaller denominations than are typical of the Company’s mandatory delivery commitments and of being traded in a highly liquid and efficient secondary market.
In addition to mandatory delivery commitments, the Company may periodically buy or sell futures contracts as part of its hedging activities for its mortgage loans held for sale and mortgage funding/purchase commitments. Generally, futures positions are outstanding for short periods of time and are used to hedge against price movements of another financial instrument while execution of thatinstrument is bid among brokers. Futures contracts also may be similarly used to hedge against price movements when another financial instrument is illiquid due to temporary market conditions. Because the changes in value of futures contracts and the hedged items can be based on different indices, there is a risk that the changes in value may not correlate. There were no open futures positions as of December 31, 2004 or 2003.
As discussed in note 7, the Company sells a portion of its produced residential mortgage servicing rights between 90 and 180 days after origination or purchase of the related loan pursuant to committed prices under forward sales contracts. These forward sales contracts commit the Company to deliver mortgage servicing rights backed by contractual levels of unpaid principal balances. Outstanding mandatory commitments to deliver mortgage servicing rights totaled $0 and $40 million at December 31, 2004 and 2003, respectively.
The Company’s pipeline of commitments to fund or purchase agency-eligible mortgage loans and its inventory of agency-eligible loans held for sale, in addition to secondary marketing value, also have values and risks associated with the embedded servicing right (“servicing pipeline value”). The Company also maintains a portfolio of residential mortgage servicing rights that are not currently scheduled for sale pursuant to the Company’s forward sales contracts. As more fully described in note 7, the Company refers to this portfolio as being available for sale. In connection with the servicing pipeline value and the servicing rights available for sale, the Company is subject to the risk that the economic value of such mortgage servicing rights or potential servicing values may decline in the event of a significant decline in long-term interest rates. A significant decline in interest rates generally causes an increase in actual and expected mortgage loan prepayments (for example, increased refinancing), which in turn tends to reduce the future expected cash flows (and economic value) of associated mortgage servicing rights.
The Company hedges the interest rate risk associated with its servicing rights available for sale and servicing value in inventory and pipeline with a variety of derivative instruments. Interest rate floor contracts provide for the Company to receive an interest rate differential on a notional amount of outstanding principal to the extent that interest rates decline below a specified rate which is fixed as of the date of the contract. Accordingly, the value of an interest rate floor contract increases while the value of a mortgage servicing right decreases in a declining interest rate environment. As such, interest rate floor contracts can potentially mitigate the Company’s exposure to declines in the economic value of its servicing rights in a declining interest rate environment. Interest rate swap contracts provide the Company with the ability to receive a fixed rate of interest on a notional principal amount and pay a floating rate of interest (generally 3-month LIBOR) on the same notional amount. As such, interest rate swap contracts can potentially mitigate the Company’s exposure to declines in the economic value of its servicing rights in a declining rate environment. The Company also enters into contracts that give it the option to enter into aninterest rate swap (swaptions). Swaptions provide the Company with better protection for smaller rate movements than floors. Interest rate cap contracts provide for the Company to receive a floating rate of

NETBANK, INC.
NOTES TO CONSOLIDATED FINANCIAL STATEMENTS (Continued)
FOR THE YEAR ENDED 2004
112
interest on a notional principal amount in exchange for a one-time upfront premium on the same notional amount. The Company uses interest rate caps to adjust and fine-tune its hedge coverage position inresponse to changes in interest rates and the size of its pipeline position of future servicing rights. Inaddition to floors, swaps and caps, the Company uses forward purchase contracts on mortgage backed securities (“MBS TBA”) to protect itself against interest rate and prepayment risk on its available for sale portfolio and servicing pipeline value from time to time.
The financial instruments described above involve, to varying degrees, elements of credit and interest rate risk. The Company believes that these instruments do not represent a significant exposure to credit loss since the amounts subject to credit risks are controlled through collateral requirements, master nettingagreements, credit approvals, limits and monitoring procedures. The Company does not have a significant exposure to any individual customer, correspondent or counterparty in connection with these financial instruments. Except for mortgage purchase commitments, the Company generally does not require collateral or other security to support the financial instruments with credit risk whose contract or notional amounts are summarized as follows:
Notional contract amount atDecember 31,
2004 2003Financial instruments whose contract amounts represent
credit risk: Mortgage loan purchase/funding commitments . . . . . . . . . $ 754,876 $ 966,943
Financial instruments whose contract amounts exceed theamount of credit risk: Mandatory delivery commitments used to hedge loans in
process . . . . . . . . . . . . . . . . . . . . . . . . . . . . . . . . . . . . . . . . . . 365,905 685,687Mandatory delivery commitments used to hedge loans in
inventory . . . . . . . . . . . . . . . . . . . . . . . . . . . . . . . . . . . . . . . . 694,003 953,349MBS TBA purchase contracts . . . . . . . . . . . . . . . . . . . . . . . . 150,000 —Forward servicing sales contracts . . . . . . . . . . . . . . . . . . . . . — 80,000Interest rate swap contracts . . . . . . . . . . . . . . . . . . . . . . . . . . 102,500 268,500Interest rate swaption contracts. . . . . . . . . . . . . . . . . . . . . . . 200,000 140,000Interest rate floor contracts . . . . . . . . . . . . . . . . . . . . . . . . . . 7,255,000 7,132,000Interest rate cap contracts . . . . . . . . . . . . . . . . . . . . . . . . . . . 175,000 298,000Purchased option contracts. . . . . . . . . . . . . . . . . . . . . . . . . . . — 50,000
Mortgage loan purchase/funding commitments expose the Company to credit loss in the event the purchase commitments are funded as mortgage loans and the Company’s counterparties default prior to resale. The maximum credit loss to which the Company is exposed is the notional amount of the commitments. However, the Company does not believe the commitments represent a significant exposure to credit loss because the related loans are secured by 1-4 family homes; most of loans are insured or guaranteed through private mortgage insurance or government approval programs, which subjects the loans to underwriting standards specified by government agencies or private mortgage insurance companies. The estimated credit exposure on financial instruments whose contract amounts exceed the amount of credit risk is the increase in market value of the instrument.

NETBANK, INC.
NOTES TO CONSOLIDATED FINANCIAL STATEMENTS (Continued)
FOR THE YEAR ENDED 2004
113
The Company generally does not charge a premium to its correspondents in connection with issuance of its mortgage purchase commitments nor is a premium charged to the Company in connection with its acquisition of mandatory delivery or forward servicing sales contracts. Fees are charged to retail customers in connection with processing and funding mortgage loans.
All derivative instruments are reported in the Company’s balance sheet at fair value (see note 3 for further details). The following is a summary of derivative instruments reported in other assets at December 31, 2004 and 2003:
December 31, 2004 2003
Derivatives used to hedge mortgage servicing rights . . . . . . . . . . . $ 9,934 $ 14,252Derivatives used to hedge servicing value of loans in inventory
and loans in pipeline . . . . . . . . . . . . . . . . . . . . . . . . . . . . . . . . . . . . — 526 Mortgage loan purchase/funding commitments . . . . . . . . . . . . . . . 1,687 3,104 Mandatory delivery commitments used to hedge the secondary
marketing value of loans in process. . . . . . . . . . . . . . . . . . . . . . . . (707) (2,803 )Mandatory delivery commitments used to hedge the secondary
marketing value of loans in inventory . . . . . . . . . . . . . . . . . . . . . . (1,034 ) (6,420 )Purchased option contracts. . . . . . . . . . . . . . . . . . . . . . . . . . . . . . . . . — 134
$ 9,880 $ 8,793

NETBANK, INC.
NOTES TO CONSOLIDATED FINANCIAL STATEMENTS (Continued)
FOR THE YEAR ENDED 2004
114
22. FAIR VALUE OF FINANCIAL INSTRUMENTS:
The estimated fair value amounts have been determined by NetBank using available market information and appropriate valuation methodologies. However, considerable judgment is required to interpret market data to develop the estimates of fair value. Accordingly, the estimates presented hereinare not necessarily indicative of the amounts NetBank could realize in a current market exchange. The use of different market assumptions and/or estimation methodologies may have a material effect on the estimated fair value amounts presented in the following table:
2004 2003Carrying Amount
EstimatedFair Value
Carrying Amount
EstimatedFair Value
Assets:Cash and cash equivalents . . . . . . . . . . . . . . . . . . . $ 150,302 $ 150,302 $ 33,627 $ 33,627Investment securities available for sale . . . . . . . . 700,295 700,295 454,348 454,348Mortgage loans held for sale. . . . . . . . . . . . . . . . . 1,173,779 1,177,413 1,933,208 1,943,183
Mandatory delivery commitments . . . . . . . . . . (1,741) (1,741) (9,223 ) (9,223)Mortgage loan purchase commitments . . . . . . 1,687 1,687 3,104 3,104Purchased option contracts . . . . . . . . . . . . . . . . — — 134 134
Loan and lease receivables-net of allowance for credit losses . . . . . . . . . . . . . . . . . . . . . . . . . . . . . 2,095,832 2,087,870 1,756,960 1,775,163
Mortgage servicing rights. . . . . . . . . . . . . . . . . . . . 172,819 173,243 165,214 165,840Swaps, swaptions, caps, floors, corridors
and forward purchase commitments hedging mortgage servicing rights available for sale . . . . . . . . . . . . . . . . . . . . . . . 9,934 9,934 14,778 14,778
Liabilities: Non-interest bearing deposits . . . . . . . . . . . . . . . . $ 285,218 $ 285,218 $ 198,884 $ 198,884Interest bearing deposits . . . . . . . . . . . . . . . . . . . . 1,420,117 1,307,643 1,591,472 1,499,074Interest bearing certificates of deposit . . . . . . . . 934,106 942,308 749,071 762,730FHLB advances . . . . . . . . . . . . . . . . . . . . . . . . . . . . 1,124,500 1,125,998 962,825 979,872Short-term borrowings . . . . . . . . . . . . . . . . . . . . . . 186,991 186,991 458,197 458,197Subordinated debt. . . . . . . . . . . . . . . . . . . . . . . . . . 11,857 11,857 11,857 11,857
Cash and cash equivalents are short-term in nature. Accordingly, they are valued at their carrying amounts, which are a reasonable estimation of fair value.
Investment securities available for sale are carried at fair value based on quoted market prices.
Loan and Lease receivables are valued by management for each homogeneous category of loan andlease by discounting future expected cash flows and quoted market prices.
Loans held for sale are valued by reference to quoted market prices, generally for mortgage-backedsecurities, after appropriate adjustments thereto. For purposes of developing the estimated fair value, the portfolio has been segregated by product type, term and interest rate.

NETBANK, INC.
NOTES TO CONSOLIDATED FINANCIAL STATEMENTS (Continued)
FOR THE YEAR ENDED 2004
115
Mortgage servicing rights are valued using a sophisticated valuation model supported by an industry-accepted software vendor. Mortgage servicing rights are carried at the LOCOM and are adjusted for changes in value of the mortgage servicing rights with offsetting changes in the value of the underlyinghedges, designated as fair value hedges, in accordance with SFAS No. 133.
Mortgage loan purchase/funding commitments are valued based upon the change in quoted mandatory delivery commitment prices (which are used by the Company to price its mortgage purchase/fundingcommitments) from the date the commitment is given to the measurement date.
Mandatory delivery commitments are valued based upon quoted market prices for such commitments.
Purchased option contracts are valued based upon quoted prices for such option contracts.
Interest rate floor contracts are valued based upon an internal option adjusted spread model that iscalibrated to third party market pricing.
Interest rate swaps are valued based upon the present value of future cash flows based on the interest rate spread between the fixed and floating rate.
Interest rate swaptions are valued based upon an internal option adjusted spread model that is calibrated to third party market pricing.
Non-interest bearing deposits are valued at carrying value. No additional value has been ascribed to core deposits, which generally bear a low rate or no rate of interest and do not fluctuate in response to changes in interest rates.
Interest bearing deposits and certificates of deposit are valued based upon the present value of future cash flows using market discount rates together with estimates of deposit intangible values.
Federal Home Loan Bank advances are valued based upon the present value of future cash flows using market discount rates.
Short-term borrowings are tied to short-term variable rate indices. Accordingly, they are valued at their carrying amounts, which are a reasonable estimation of fair values.
Subordinated debt is tied to short-term variable rate indices. Accordingly, it is valued at its carrying amount, which is a reasonable estimation of fair value.
23. RELATED PARTY TRANSACTIONS
Some of our directors, officers, principal shareholders and their associates were customers of, or had transactions with, the Company or the Bank in the ordinary course of business during 2004 and 2003. Some of our directors are directors, officers, trustees or principal securities holders of corporations or other organizations that also were customers of, or had transactions with, the Company or the Bank in the ordinary course of business during 2004 and 2003.
All outstanding loans and other transactions with our directors, officers and principal shareholders were made in the ordinary course of business on substantially the same terms, including interest rates and collateral, as those prevailing at the time for comparable transactions with other persons and, when made, did not involve more than the normal risk of collectability or present other unfavorable features.

NETBANK, INC.
NOTES TO CONSOLIDATED FINANCIAL STATEMENTS (Continued)
FOR THE YEAR ENDED 2004
116
On April 23, 2002, NetBank, FSB entered into an Account Relationship and Processing Agreement (as amended, the “Processing Agreement”) with Directo, Inc., providing for the processing of certaindeposit accounts established for clients of Directo. The employees that participate in the Directo program maintain deposit accounts at NetBank, FSB that are accessible only through debit card transactions. In2004 and 2003, fees from the participant employees in the amount of $1.4 million and $1.1 million, respectively, were collected by NetBank, FSB on behalf of Directo were paid to Directo, after deduction of $56,963 and $58,640, respectively, in fees due to NetBank, FSB. Messrs, T.S. Johnson and Robin Keltonare members of both NetBank and Directo’s Boards of Directors. Mr. Johnson also owns 6.8% of Directo. In April 2004, NetBank, FSB gave Directo notice of termination of the Processing Agreement, which notice of termination was subsequently extended several times in order for Directo to secure a replacement bank. On February 15, 2005, the Processing Agreement officially terminated and all the deposit accounts that were part of this relationship were transferred to a third-party bank. The escrow account that had been funded by Directo was replaced by the joint and several guaranty of Messrs. T.S. Johnson and Kelton, as provided in the Processing Agreement, which guaranty covers any potential transactional losses by NetBank, FSB with respect to the program.
24. CONDENSED FINANCIAL STATEMENTS OF NETBANK, INC. (PARENT ONLY)
CONDENSED BALANCE SHEET
2004 2003Assets:
Cash and due from banks . . . . . . . . . . . . . . . . . . . . . . . . . . . . . . . . . . . . . . . . . . . . . . . $ — $ —Federal funds sold. . . . . . . . . . . . . . . . . . . . . . . . . . . . . . . . . . . . . . . . . . . . . . . . . . . . . . 1,739 243
Total cash and cash equivalents . . . . . . . . . . . . . . . . . . . . . . . . . . . . . . . . . . . . . . . . 1,739 243Investment in subsidiaries . . . . . . . . . . . . . . . . . . . . . . . . . . . . . . . . . . . . . . . . . . . . . . . 407,942 425,308Loans held for sale . . . . . . . . . . . . . . . . . . . . . . . . . . . . . . . . . . . . . . . . . . . . . . . . . . . . . 447 —Due from subsidiaries . . . . . . . . . . . . . . . . . . . . . . . . . . . . . . . . . . . . . . . . . . . . . . . . . . 14,337 15,774Intangible assets . . . . . . . . . . . . . . . . . . . . . . . . . . . . . . . . . . . . . . . . . . . . . . . . . . . . . . . 265 265Furniture, fixtures and equipment . . . . . . . . . . . . . . . . . . . . . . . . . . . . . . . . . . . . . . . . 2,173 3,047Other assets . . . . . . . . . . . . . . . . . . . . . . . . . . . . . . . . . . . . . . . . . . . . . . . . . . . . . . . . . . . 3,111 1,487
Total assets. . . . . . . . . . . . . . . . . . . . . . . . . . . . . . . . . . . . . . . . . . . . . . . . . . . . . . . . . . $430,014 $446,124Liabilities and Shareholders’ equity:
Subordinated debt. . . . . . . . . . . . . . . . . . . . . . . . . . . . . . . . . . . . . . . . . . . . . . . . . . . . . . $ 11,857 $ 11,857Accrued interest payable . . . . . . . . . . . . . . . . . . . . . . . . . . . . . . . . . . . . . . . . . . . . . . . . 127 89Other liabilities . . . . . . . . . . . . . . . . . . . . . . . . . . . . . . . . . . . . . . . . . . . . . . . . . . . . . . . . 4,003 3,828
Total liabilities. . . . . . . . . . . . . . . . . . . . . . . . . . . . . . . . . . . . . . . . . . . . . . . . . . . . . . . 15,987 15,774Shareholders’ equity:
Preferred stock, no par, (10,000,000 shares authorized; none outstanding) . . . . . — —Common stock, $.01 par (100,000,000 shares authorized; 52,820,308 and
52,820,308 shares issued, respectively) . . . . . . . . . . . . . . . . . . . . . . . . . . . . . . . . . . 528 528Additional paid-in capital . . . . . . . . . . . . . . . . . . . . . . . . . . . . . . . . . . . . . . . . . . . . . . . 432,132 432,035Retained earnings (deficit) . . . . . . . . . . . . . . . . . . . . . . . . . . . . . . . . . . . . . . . . . . . . . . 43,849 44,102Accumulated other comprehensive income, net of tax. . . . . . . . . . . . . . . . . . . . . . . (1,136) 2,742Treasury stock, at cost (6,292,082 and 5,235,538 shares, respectively). . . . . . . . . . (61,087) (48,674)Unearned compensation . . . . . . . . . . . . . . . . . . . . . . . . . . . . . . . . . . . . . . . . . . . . . . . . (259) (383)
Total shareholders’ equity . . . . . . . . . . . . . . . . . . . . . . . . . . . . . . . . . . . . . . . . . . . . . . . . . 414,027 430,350Total liabilities and shareholders’ equity. . . . . . . . . . . . . . . . . . . . . . . . . . . . . . . . . . . . . $430,014 $446,124

NETBANK, INC.
NOTES TO CONSOLIDATED FINANCIAL STATEMENTS (Continued)
FOR THE YEAR ENDED 2004
117
The condensed statements of operations and comprehensive income (loss) and cash flows for the years ended December 31, 2004, 2003 and 2002, follow:
CONDENSED STATEMENTS OF OPERATIONS AND COMPREHENSIVE INCOME (LOSS)
2004 2003 2002Net interest (loss) income . . . . . . . . . . . . . . . . . . . . . . . . . . . . . . . . . . . . . . . . . $ 1,250 $ (219) $ 268Other income (loss) . . . . . . . . . . . . . . . . . . . . . . . . . . . . . . . . . . . . . . . . . . . . . . (3,224) 21 3,009Expenses . . . . . . . . . . . . . . . . . . . . . . . . . . . . . . . . . . . . . . . . . . . . . . . . . . . . . . . . 1,453 3,056 9,686(Loss) income before equity in undistributed net income (loss) of
subsidiaries. . . . . . . . . . . . . . . . . . . . . . . . . . . . . . . . . . . . . . . . . . . . . . . . . . . . (3,427) (3,254) (6,409)Equity in undistributed income (loss) of subsidiaries . . . . . . . . . . . . . . . . . . 7,647 53,768 (9,448)Net income (loss) . . . . . . . . . . . . . . . . . . . . . . . . . . . . . . . . . . . . . . . . . . . . . . . . $ 4,220 $50,514 $(15,587)

NETBANK, INC.
NOTES TO CONSOLIDATED FINANCIAL STATEMENTS (Continued)
FOR THE YEAR ENDED 2004
118
CONDENSED STATEMENTS OF CASH FLOWS 2004 2003 2002
Operating activities:Net income (loss) . . . . . . . . . . . . . . . . . . . . . . . . . . . . . . . . . . . . . . . . . $ 4,220 $ 50,514 $ (15,857)
Adjustments to reconcile net income (loss) to net cashprovided by operating activities:Equity in undistributed net (income) loss of subsidiaries . . . (7,647) (53,768 ) 9,448Depreciation and amortization . . . . . . . . . . . . . . . . . . . . . . . . . 206 792 122Accretion of debt discount . . . . . . . . . . . . . . . . . . . . . . . . . . . . . — 377 385Purchase of loans held for sale . . . . . . . . . . . . . . . . . . . . . . . . . . (315,576) — —Proceeds from sale of loans held for sale . . . . . . . . . . . . . . . . . 311,905 — —Loss on loans held for sale . . . . . . . . . . . . . . . . . . . . . . . . . . . . . 4,656Gains on sales of furniture, fixtures and equipment. . . . . . . . — — (2,848)Gain on the early extinguishment of debt. . . . . . . . . . . . . . . . . — — (67)Changes in assets and liabilities:
Decrease in due from subsidiaries. . . . . . . . . . . . . . . . . . . . . 976 22,535 7,485Decrease (increase) in other assets and liabilities . . . . . . . (2,420) 2,824 (2,742)(Decrease) increase in accrued interest payable . . . . . . . . . 38 (26) (17)Net cash provided by (used in) operating activities . . . . . . (3,642) 23,248 (4,091)
Investing activities: Dividend from subsidiary. . . . . . . . . . . . . . . . . . . . . . . . . . . . . . . . . 22,727 6,596 989Purchases of furniture, fixtures and equipment. . . . . . . . . . . . . . — (249) —Proceeds from disposal of furniture, fixtures and equipment . . 668 — 9,013
Net cash provided by investing activities . . . . . . . . . . . . . . . 23,395 6,347 10,002Financing activities:
Net proceeds from issuance of subordinated notes . . . . . . . . . . — 7,475 4,382Repurchase of convertible subordinated notes . . . . . . . . . . . . . . — (26,358) (923)Net proceeds from issuance of common stock. . . . . . . . . . . . . . . — 5,551 4,110Net purchase of treasury stock . . . . . . . . . . . . . . . . . . . . . . . . . . . . (14,633) (14,794) (12,353)Dividend payments on common stock. . . . . . . . . . . . . . . . . . . . . . (3,748) (3,844) —Change in unearned compensation . . . . . . . . . . . . . . . . . . . . . . . . 124 (383) —
Net cash used in financing activities . . . . . . . . . . . . . . . . . . . (18,257) (32,353) (4,784)(Decrease) increase in cash and cash equivalents . . . . . . . . . . . . . . . . 1,496 (2,758) 1,127Cash:
Beginning of year . . . . . . . . . . . . . . . . . . . . . . . . . . . . . . . . . . . . . . . 243 3,001 1,874End of year. . . . . . . . . . . . . . . . . . . . . . . . . . . . . . . . . . . . . . . . . . . . . $ 1,739 $ 243 $ 3,001
Supplemental disclosure of cash flow information: Cash paid during the year for:
Interest . . . . . . . . . . . . . . . . . . . . . . . . . . . . . . . . . . . . . . . . . . . . . . . . $ 1,192 $ 1,317 $ 1,445Income taxes . . . . . . . . . . . . . . . . . . . . . . . . . . . . . . . . . . . . . . . . . . . 1,554 — —
Non-cash investing and financing activities: Fair value of assets acquired . . . . . . . . . . . . . . . . . . . . . . . . . . . . . . $ 815 $ 11,727 $1,057,830Goodwill . . . . . . . . . . . . . . . . . . . . . . . . . . . . . . . . . . . . . . . . . . . . . . . 14,261 14,107 17,662Amortizable intangibles. . . . . . . . . . . . . . . . . . . . . . . . . . . . . . . . . . 6,487 — —Liabilities assumed . . . . . . . . . . . . . . . . . . . . . . . . . . . . . . . . . . . . . . (94) (5,875) (919,930)Stock issued in transaction . . . . . . . . . . . . . . . . . . . . . . . . . . . . . . . (1,592) (750) (155,562)Cash paid for business . . . . . . . . . . . . . . . . . . . . . . . . . . . . . . . . . . . $ 19,877 $ 19,209 $ —

NETBANK, INC.
NOTES TO CONSOLIDATED FINANCIAL STATEMENTS (Continued)
FOR THE YEAR ENDED 2004
119
25. QUARTERLY FINANCIAL DATA (UNAUDITED)
Quarterly financial data for the years ended December 31, 2004, 2003, and 2002 is summarized as follows:
FirstQuarter
Second Quarter
Third Quarter
FourthQuarter
2004(1) Interest income. . . . . . . . . . . . . . . . . . . . . . . . . . . . . . . . . . . . . . . . . . . . . . . . . . . . . . . . . . $ 52,185 $ 58,677 $ 63,492 $ 57,809Interest expense . . . . . . . . . . . . . . . . . . . . . . . . . . . . . . . . . . . . . . . . . . . . . . . . . . . . . . . . . 20,436 22,178 25,375 24,628Net interest income . . . . . . . . . . . . . . . . . . . . . . . . . . . . . . . . . . . . . . . . . . . . . . . . . . . . . . 31,749 36,499 38,117 33,181Provision for credit losses . . . . . . . . . . . . . . . . . . . . . . . . . . . . . . . . . . . . . . . . . . . . . . . . . . 1,847 1,666 469 30,795Net interest income after provision for credit losses . . . . . . . . . . . . . . . . . . . . . . . . . . . . . 29,902 34,833 37,648 2,386Non-interest income . . . . . . . . . . . . . . . . . . . . . . . . . . . . . . . . . . . . . . . . . . . . . . . . . . . . . . 53,522 50,620 55,671 39,758Gains on sales of securities . . . . . . . . . . . . . . . . . . . . . . . . . . . . . . . . . . . . . . . . . . . . . . . . . 3,169 — 2,248 2,363Non-interest expense . . . . . . . . . . . . . . . . . . . . . . . . . . . . . . . . . . . . . . . . . . . . . . . . . . . . . 71,561 72,010 89,066 73,153Income before income taxes . . . . . . . . . . . . . . . . . . . . . . . . . . . . . . . . . . . . . . . . . . . . . . . . 15,032 13,443 6,501 (28,646)Income tax expense. . . . . . . . . . . . . . . . . . . . . . . . . . . . . . . . . . . . . . . . . . . . . . . . . . . . . . . (5,638) (4,976) (2,486) 10,990Net income . . . . . . . . . . . . . . . . . . . . . . . . . . . . . . . . . . . . . . . . . . . . . . . . . . . . . . . . . . . . . $ 9,394 $ 8,467 $ 4,015 $(17,656)Basic income per share outstanding . . . . . . . . . . . . . . . . . . . . . . . . . . . . . . . . . . . . . . . . . . $ 0.20 $ 0.18 $ 0.09 $ (0.38)Diluted income per share outstanding . . . . . . . . . . . . . . . . . . . . . . . . . . . . . . . . . . . . . . . . $ 0.20 $ 0.18 $ 0.09 $ (0.38)
2003Interest income. . . . . . . . . . . . . . . . . . . . . . . . . . . . . . . . . . . . . . . . . . . . . . . . . . . . . . . . . . $ 45,002 $ 50,341 $ 58,919 $ 56,368Interest expense . . . . . . . . . . . . . . . . . . . . . . . . . . . . . . . . . . . . . . . . . . . . . . . . . . . . . . . . . 21,499 21,633 21,959 20,295Net interest income . . . . . . . . . . . . . . . . . . . . . . . . . . . . . . . . . . . . . . . . . . . . . . . . . . . . . . 23,503 28,708 36,960 36,073Provision for credit losses . . . . . . . . . . . . . . . . . . . . . . . . . . . . . . . . . . . . . . . . . . . . . . . . . . 868 894 2,537 2,709Net interest income after provision for credit losses . . . . . . . . . . . . . . . . . . . . . . . . . . . . . 22,635 27,814 34,423 33,364Non-interest income . . . . . . . . . . . . . . . . . . . . . . . . . . . . . . . . . . . . . . . . . . . . . . . . . . . . . . 62,812 75,492 96,648 64,198Gains on sales of securities . . . . . . . . . . . . . . . . . . . . . . . . . . . . . . . . . . . . . . . . . . . . . . . . . 6,332 5,062 — —Non-interest expense . . . . . . . . . . . . . . . . . . . . . . . . . . . . . . . . . . . . . . . . . . . . . . . . . . . . . 74,808 85,933 106,278 81,708Income before income taxes . . . . . . . . . . . . . . . . . . . . . . . . . . . . . . . . . . . . . . . . . . . . . . . . 16,971 22,435 24,793 15,854Income tax expense. . . . . . . . . . . . . . . . . . . . . . . . . . . . . . . . . . . . . . . . . . . . . . . . . . . . . . . (6,269) (8,222) (9,204) (5,844)Net income . . . . . . . . . . . . . . . . . . . . . . . . . . . . . . . . . . . . . . . . . . . . . . . . . . . . . . . . . . . . . $ 10,702 $ 14,213 $ 15,589 $ 10,010Basic income per share outstanding . . . . . . . . . . . . . . . . . . . . . . . . . . . . . . . . . . . . . . . . . . $ 0.22 $ 0.30 $ 0.33 $ 0.21Diluted income per share outstanding . . . . . . . . . . . . . . . . . . . . . . . . . . . . . . . . . . . . . . . . $ 0.22 $ 0.29 $ 0.32 $ 0.21
2002(2) Interest income. . . . . . . . . . . . . . . . . . . . . . . . . . . . . . . . . . . . . . . . . . . . . . . . . . . . . . . . . . $ 36,778 $ 36,239 $ 47,967 $ 45,771Interest expense . . . . . . . . . . . . . . . . . . . . . . . . . . . . . . . . . . . . . . . . . . . . . . . . . . . . . . . . . 24,435 30,427 25,153 23,504Net interest income . . . . . . . . . . . . . . . . . . . . . . . . . . . . . . . . . . . . . . . . . . . . . . . . . . . . . . 12,343 5,812 22,814 22,267Provision for credit losses . . . . . . . . . . . . . . . . . . . . . . . . . . . . . . . . . . . . . . . . . . . . . . . . . . 104 26,422 (95) (4,014)Net interest income (loss) after provision for credit losses . . . . . . . . . . . . . . . . . . . . . . . . 12,239 (20,610) 22,909 26,281Non-interest income . . . . . . . . . . . . . . . . . . . . . . . . . . . . . . . . . . . . . . . . . . . . . . . . . . . . . . 9,058 42,467 57,195 62,660(Losses) gains on sales of securities . . . . . . . . . . . . . . . . . . . . . . . . . . . . . . . . . . . . . . . . . . (85) (1,772) 7,638 —Non-interest expense . . . . . . . . . . . . . . . . . . . . . . . . . . . . . . . . . . . . . . . . . . . . . . . . . . . . . 29,695 70,429 74,044 69,849(Loss) income before income taxes . . . . . . . . . . . . . . . . . . . . . . . . . . . . . . . . . . . . . . . . . . (8,483) (50,344) 13,698 19,092Income tax benefit (expense) . . . . . . . . . . . . . . . . . . . . . . . . . . . . . . . . . . . . . . . . . . . . . . . 2,845 19,057 (5,181) (6,541)Net (loss) income . . . . . . . . . . . . . . . . . . . . . . . . . . . . . . . . . . . . . . . . . . . . . . . . . . . . . . . . $ (5,638) $(31,287) $ 8,517 $ 12,551Basic (loss) income per share outstanding . . . . . . . . . . . . . . . . . . . . . . . . . . . . . . . . . . . . . $ (0.19) $ (0.64) $ 0.17 $ 0.26Diluted (loss) income per share outstanding . . . . . . . . . . . . . . . . . . . . . . . . . . . . . . . . . . . $ (0.19) $ (0.64) $ 0.17 $ 0.25
(1) During the fourth quarter of 2004 the Company recorded an additional $29.0 million for potential losses on the purchased CMC lease portfolio. Reference is made notes 5 and 6 for additional details regarding the charge.
(2) On March 31, 2002 NetBank acquired Resource Bancshares Mortgage Group, Inc.. The Company incurred $10,085 of acquisition and severance charges during the second quarter of 2002 related to the acquisition.
The Company also recorded and additional $20.1 million of additional provision expense related to the purchased CMC lease portfolio during the second quarter of 2002.
120
ITEM 9. CHANGES IN AND DISAGREEMENTS WITH ACCOUNTANTS ON ACCOUNTING AND FINANACIAL DISCLOSURES
There have been no disagreements with accountants on accounting and financial disclosure matters that require disclosure pursuant to Item 304 of Regulation S-K.
ITEM 9A. CONTROLS AND PROCEDURES
Management’s Conclusion on the Effectiveness of Disclosure Controls and Procedures
The Company’s Chief Executive Officer and Chief Financial Officer, along with other management of the Company, reviewed and evaluated the Company’s disclosure controls and procedures (as defined in rule 13a-15(e) under the Securities Exchange Act of 1934, as amended (the “Exchange Act”)) as of December 31, 2004. Based on that evaluation, the Chief Executive Officer and Chief Financial Officer ofthe Company concluded that, as of December 31, 2004, the disclosure controls and procedures in place at the Company were not effective due to a material weakness in its internal control over financial reportingrelated to the estimation of the change in fair value of the Company’s portfolio of mortgage loan funding commitments for which the interest rate is locked (“rate locks”) which constitute derivative financial instruments as defined by Statement of Financial Accounting Standards No. 133 (“SFAS 133”), Accounting for Derivative Instruments and Hedging Activities, as amended by Statement of Financial AccountingStandards No. 149 (“SFAS 149”), Amendment of Statement 133 on Derivative Instruments and Hedging Activities. The error would have resulted in an overstatement of the mark-to-market of the derivatives which is included in the gain on sale line item. The material weakness is more fully described below under the heading “Management’s Annual Report on Internal Control over Financial Reporting.”
Due to this material weakness, the Company, in preparing its financial statements at and for the year ended December 31, 2004, performed and implemented the additional procedures discussed below under the heading “Other Control Matters” to strengthen its controls and procedures over the process. Due to the nature of the material weakness and the additional procedures implemented, management believes the circumstances which resulted in the error will not recur.
Management’s Annual Report on Internal Control over Financial Reporting
The management of NetBank is responsible for establishing and maintaining adequate internal control over financial reporting (as defined in Rule 13a-15(f) under the Exchange Act). NetBank’s internal control system is designed to provide reasonable assurance to the Company’s management and Board of Directors regarding the preparation and fair presentation of published financial statements. However, all internal control systems, no matter how well designed, have inherent limitations. Therefore, even those systems determined to be effective can provide only reasonable assurance with respect to financial statement preparation and presentation.
An internal control material weakness is a significant deficiency, or aggregation of deficiencies, thatdoes not reduce to a relatively low level the risk that material misstatements in financial statements will be prevented or detected on a timely basis by employees in the normal course of their work. An internal control significant deficiency, or aggregation of deficiencies, is one that could result in a misstatement of the financial statements that is more than inconsequential.
The management of NetBank assessed the effectiveness of the Company’s internal control over financial reporting as of December 31, 2004, and this assessment identified a material weakness in the Company’s internal control over financial reporting related to its controls over the determination and estimation of the change in fair value of the Company’s portfolio of mortgage loan funding commitments where the interest rate has been locked and related financial derivatives. Changes in such fair value are recorded to gain on sales of loans and to other assets or other liabilities. As a result of this material
121
weakness, the Company had overstated its gain on sales of loans and recorded an adjustment in the December 31, 2004 financial statements to correct this error.
In making its assessment of internal control over financial reporting management used the criteria issued by the Committee of Sponsoring Organizations of the Treadway Commission (COSO) in Internal Control—Integrated Framework. Because of the material weakness described in the preceding paragraph,management believes that, as of December 31, 2004, the Company’s internal control over financialreporting was not effective based on those criteria.
NetBank’s independent registered public accounting firm has audited and issued their report on management’s assessment of NetBank’s internal control over financial reporting, which appears below.
Report of Independent Registered Public Accounting Firm on Internal Control over Financial Reporting
The Board of Directors and Shareholders of NetBank, Inc.
We have audited management’s assessment, included in the accompanying Management’s Annual Report on Internal Control over Financial Reporting, that NetBank, Inc. did not maintain effective internal control over financial reporting as of December 31, 2004, because of the effect of a material error that was not identified by NetBank, Inc.’s internal control over financial reporting, based on criteria established in Internal Control—Integrated Framework issued by the Committee of Sponsoring Organizations of the Treadway Commission (the COSO criteria). NetBank, Inc.’s management is responsible for maintaining effective internal control over financial reporting and for its assessment of the effectiveness of internal control over financial reporting. Our responsibility is to express an opinion onmanagement’s assessment and an opinion on the effectiveness of NetBank, Inc.’s internal control over financial reporting based on our audit.
We conducted our audit in accordance with the standards of the Public Company Accounting Oversight Board (United States). Those standards require that we plan and perform the audit to obtainreasonable assurance about whether effective internal control over financial reporting was maintained inall material respects. Our audit included obtaining an understanding of internal control over financial reporting, evaluating management’s assessment, testing and evaluating the design and operating effectiveness of internal control, and performing such other procedures as we considered necessary in the circumstances. We believe that our audit provides a reasonable basis for our opinion.
A company’s internal control over financial reporting is a process designed to provide reasonable assurance regarding the reliability of financial reporting and the preparation of financial statements for external purposes in accordance with generally accepted accounting principles.
A company’s internal control over financial reporting includes those policies and procedures that (1) pertain to the maintenance of records that, in reasonable detail, accurately and fairly reflect the transactions and dispositions of the assets of the company; (2) provide reasonable assurance that transactions are recorded as necessary to permit preparation of financial statements in accordance with generally accepted accounting principles, and that receipts and expenditures of the company are being made only in accordance with authorizations of management and directors of the company; and (3) provide reasonable assurance regarding prevention or timely detection of unauthorized acquisition, use, or disposition of the company’s assets that could have a material effect on the financial statements.
Because of its inherent limitations, internal control over financial reporting may not prevent or detectmisstatements. Also, projections of any evaluation of effectiveness to future periods are subject to the risk that controls may become inadequate because of changes in conditions, or that the degree of compliance with the policies or procedures may deteriorate.

122
A material weakness is a control deficiency, or combination of control deficiencies, that results inmore than a remote likelihood that a material misstatement of the annual or interim financial statementswill not be prevented or detected. The following material weakness has been identified and included inmanagement’s assessment. There were insufficient controls over the determination and estimation of the change in fair value of the Company’s portfolio of mortgage loan funding commitments where the interest rate has been locked and the related financial derivatives. As a result of this material weakness in internal control, NetBank, Inc. concluded that the amount of gain on sales of loans was overstated and recorded an adjustment to correct this error. This material weakness was considered in determining the nature, timing, and extent of audit tests applied in our audit of the 2004 financial statements, and this report does not affect our report dated March 11, 2005 on those financial statements.
In our opinion, management’s assessment that NetBank, Inc. did not maintain effective internal control over financial reporting as of December 31, 2004 is fairly stated, in all material respects, based onthe COSO control criteria. Also, in our opinion, because of the effect of the material weakness described above on the achievement of the objectives of the control criteria, NetBank, Inc. has not maintained effective internal control over financial reporting as of December 31, 2004 based on the COSO control criteria.
We also have audited, in accordance with the standards of the Public Company Accounting Oversight Board (United States), the consolidated balance sheets of NetBank, Inc. as of December 31, 2004 and 2003, and the related consolidated statements of operations, shareholders’ equity, and cash flows for each of the three years in the period ended December 31, 2004 and our report dated March 11, 2005 expressed an unqualified opinion thereon.
/s/ ERNST & YOUNG LLP Atlanta, Georgia March 11, 2005
Other Control Matters
In response to the material control weakness discussed above in Management’s Annual Report on Internal Control over Financial Reporting, management has taken the following steps to remediate the control weakness:
• The necessary data and information for estimating the initial and ending fair values are now accumulated within a single department;
• Analytics are now being prepared which compare the changes in fair value to changes in the fair value of offsetting hedges and general changes in interest rates to ensure results are reasonable;
• The Company’s corporate controller is now required to review the process and associated analysis.
Management will continue to closely monitor the changes implemented to ensure their effectiveness. Except for the changes discussed above, there were no other changes in the Company’s internal control over financial reporting that have materially effected, or are reasonably likely to materially effect, its internal control over financial reporting.
ITEM 9B. OTHER INFORMATION
None.

123
PART III
ITEM 10. DIRECTORS AND EXECUTIVE OFFICERS OF THE REGISTRANT
The information required by this Item is included in NetBank, Inc.’s Proxy Statement for the Annual Meeting of Shareholders to be held on April 28, 2005 under the headings “Election of Directors,” “Executive Officers” and “Section 16(a) Beneficial Ownership Reporting Compliance” and is incorporated herein by reference.
The Company has adopted a Code of Ethics that applies to its Chief Executive Officer, Chief Financial Executive, Comptroller and other personnel. A copy of the Code of Ethics is available for reviewon the Company’s website at www.NetBankinc.com.
ITEM 11. EXECUTIVE COMPENSATION
The information required by this Item is included in NetBank, Inc.’s Proxy Statement for the Annual Meeting of Shareholders to be held on April 28, 2005 under the headings “Compensation of Executive Officers,” “Compensation Committee Report” and “Performance Graph” and is incorporated herein by reference.
ITEM 12. SECURITY OWNERSHIP OF CERTAIN BENEFICIAL OWNERS AND MANAGEMENT AND RELATED STOCKHOLDER MATTERS
The information required by this Item is included in NetBank, Inc.’s Proxy Statement for the Annual Meeting of Shareholders to be held on April 28, 2005 under the headings “Security Ownership of Principal Shareholders and Management” and is incorporated herein by reference.
ITEM 13. CERTAIN RELATIONSHIPS AND RELATED TRANSACTIONS
The information required by this Item is included in NetBank, Inc.’s Proxy Statement for the Annual Meeting of Shareholders to be held on April 28, 2005 under the heading “Certain Transactions” and is incorporated herein by reference.
ITEM 14. PRINCIPAL ACCOUNTANT FEES AND SERVICES
The information required by this Item is included in NetBank, Inc.’s Proxy Statement for the Annual Meeting of Shareholders to be held on April 28, 2005 under the heading “Ratification of Appointment of Independent Auditors” and is incorporated herein by reference.
ITEM 15. EXHIBITS AND FINANCIAL STATEMENT SCHEDULES
1. Consolidated Financial Statements
The consolidated financial statements of the Company and its subsidiaries are listed on the Index to Consolidated Financial Statements located on page 65 in Item 8. “Financial Statements and Supplementary Data” of this report.
2. Financial Statements Schedules
The financial statement schedules referred to in the applicable accounting regulations of the Securities and Exchange Commission are omitted from this Item because they are not applicable, the amounts are not significant or the required information is shown in the consolidated financial statements and the notes thereto included in this report.
3. Exhibits
The exhibits listed in the accompanying index to exhibits are filed or incorporated by reference as part of this report.

124
SIGNATURES
Pursuant to the requirements of Section 13 of the Securities Exchange Act of 1934, the registrant has duly caused this report to be signed on its behalf by the undersigned, thereunto duly authorized onMarch 16, 2005.
NETBANK, INC.
By: /s/ DOUGLAS K. FREEMAN
Douglas K. FreemanChairman and Chief Executive Officer
Pursuant to the requirements of the Securities Exchange Act of 1934, this report has been signed below by the following persons on behalf of the registrant and in the capacities indicated on March 16, 2005.
Signature Title
/s/ T. STEPHEN JOHNSON Chairman Emeritus T. Stephen Johnson
/s/ STEVEN F. HERBERT Chief Financial ExecutiveSteven F. Herbert
/s/ STUART M. CABLE Director Stuart M. Cable
/s/ JOEL A. SMITH, III Director Joel A. Smith, III
/s/ EULA L. ADAMS Director Eula L. Adams
/s/ TAMARA L. ADLER Director Tamara L. Adler
/s/ J. STEPHEN HEARD Director J. Stephen Heard
/s/ ROBIN C. KELTON Director Robin C. Kelton
/s/ THOMAS H. MULLER, JR. Director Thomas H. Muller, Jr.
/s/ CATHERINE A. GHIGLIERI Director Catherine A. Ghiglieri
/s/ DAVID W. JOHNSON Director David W. Johnson

125
INDEX TO EXHIBITS
Incorporated by Reference Exhibit Number Exhibit Description Form File Number Exhibit Filing Date
Filed Herewith
3.1(a) Amended and Restated Articles of Incorporation dated November 25, 1996
S-1 333-23717 3.1 3/21/97
(b) Articles of Amendment of Articles of Incorporation dated January 20, 2000
8-A 000-22361 99.2 1/28/00
(c) Articles of Amendment of Articles of Incorporation dated April 27, 2000
10-Q 000-22361 3.1 5/15/00
3.2(a) Bylaws S-1 333-23717 3.2 3/21/97
(b) Amendments to the Bylaws adopted April 22, 1997
S-1/A 333-23717 3.3 4/25/97
(c) Amendment to the Bylaws adopted as of March 31, 2002
S-4 333-75298 App. D 12/17/01
10.1(a) Lease Agreement dated as of March 17, 1999 between NetBank and Opus South Corporation (the“Lease”)
10-K 000-22361 10.2 3/31/99
(b) First Amendment to the Lease dated May 25, 1999, Second Amendment to the Lease dated September 15, 1999 and Third Amendment to the Lease dated October 26, 1999
10-K 000-22361 10.2 3/30/00
(c) Fourth Amendement to the Lease dated June 1, 2001
10-K 000-22361 10.2 3/31/03
10.2(a) * 1996 Stock Incentive Plan (the“Incentive Plan”)
S-1 333-23717 10.3 3/21/97
(b) *First Amendment to the Incentive Plan dated as of March 19, 1998
10-K 000-22361 10.3 3/30/98
(c) *Second Amendment to the Incentive Plan dated as of March 23, 1999
10-K 000-22361 10.3 3/31/99
(d) *Third Amendment to the Incentive Plan dated as of December 14, 2001
S-4 333-75298 10.5 12/17/01
(e) *Fourth Amendment to the Incentive Plan dated as of March 18, 2004
Schedule 14A 000-22361 D 3/25/04

126
(f) * Form of Director Non-qualified Stock Option Award Pursuant to the Incentive Plan
�
(g) *Form of employee Incentive Stock Option Award Pursuant to the Incentive Plan (for award granted electronically)
�
(h) *Form of employee Incentive Stock Option Award Pursuant to the Incentive Plan (for award granted in paper)
�
(i) * Form of Restricted Stock Award Agreement Pursuant to the Incentive Plan
�
(j) * NetBank, Inc. Mid-term Incentive Plan under the NetBank, Inc. 1996 Stock Incentive Plan (the “Mid-Term Incentive Plan”)
�
(k) * Form of Mid-term Incentive Plan Award Agreement for reporting persons
�
(l) * Form of Mid-term Incentive Plan Award Agreement for employees other than reporting persons
�
10.3 * NetBank, Inc. Employee Stock Purchase Plan
S-8 333-51574 99.1 12/08/00
10.4(a) *Employment Agreement dated as of November 18, 2001 betweenNetBank, Inc. and Douglas K. Freeman (the “FreemanAgreement”)
S-4 333-75298 10.1 12/17/01
(b) *Amendment No. 2 to the FreemanAgreement dated as of April 30, 2004
10-Q 000-22361 10 8/9/04
10.5(a) *Employment Agreement dated as of April 1, 2002 betweenNetBank, Inc. and Steven F. Herbert (the “Herbert Agreement”)
10-Q 000-22361 10.3 8/14/02
(b) *First Amendment to the Herbert Agreement dated as of March 1,2004
�
10.6(a) * Employment Agreement dated as 10-Q 000-22361 10.5 8/14/02

127
of April 1, 2002 betweenNetBank, Inc. and Charles E. Mapson (the “Mapson Agreement”)
(b) *First Amendment to the MapsonAgreement dated as of March 1,2004
�
10.7(a) *Employment Agreement dated as of April 1, 2002 betweenNetBank, Inc. and Jerald W. McCoy (the “McCoy Agreement”)
10-Q 000-22361 10.2 8/14/02
(b) *First Amendment to the McCoy Agreement dated as of March 1,2004
�
10.8(a) *Employment Agreement dated as of April 1, 2002 betweenNetBank, Inc. and R. Theodore Brauch (the “Brauch Agreement”)
10-Q 000-22361 10.1 8/14/02
(b) *First Amendment to the BrauchAgreement dated as of March 1,2004.
�
10.9(a) *Employment Agreement dated as of April 1, 2002 betweenNetBank, Inc. and William M. Ross (the “Ross Agreement”)
10-Q 000-22361 10.4 8/14/02
(b) *First Amendment to the Ross Agreement dated as of March 1,2004
�
10.10(a) * Form of Director SupplementalRetirement Agreement (the“SERP Agreement”)
�
(b) * Form of Amendment No. 1 to the SERP Agreement
�
10.11(a) * Form of Life InsuranceEndorsement Method Split Dollar Plan Agreement (the “Split Dollar Agreement”)
�
(b) * Form of Amendment No. 1 to the Split Dollar Agreement
�
10.12 * Form of Personalized PolicyDescription Under Supplemental Disability Insurance Plan
�
10.13 * Summary of Relocation �

128
Arrangement betweenNetBank, Inc. and Douglas K. Freeman
21.1 List of Significant Subidiaries �
23.1 Consent of Independent Registered Public Accounting Firm
�
31.1 Certification Pursuant toRules 13a-14(a) and 15d-14(a) under the Securities Exchange Act of 1934, as amended—Chief Executive Officer
�
31.2 Certification Pursuant toRules 13a-14(a) and 15d-14(a) under the Securities Exchange Act of 1934, as amended—Chief Financial Officer
�
32.1 Certification Pursuant to 18 U.S.C.Section 1350—Chief Executive Officer and Chief Financial Executive
�
* This exhibit is a management contract, compensatory plan or arrangement.

126
Exhibit 31.1
Certification Pursuant to Rules 13a-14(a) and 15d-14(a) under the Securities Exchange Act of 1934, as Amended
I, Douglas K. Freeman, certify that:
1. I have reviewed this annual report on Form 10-K of NetBank, Inc.;
2. Based on my knowledge, this report does not contain any untrue statement of a material fact or omit to state a material fact necessary to make the statements made, in light of the circumstances under which such statements were made, not misleading with respect to the period covered by this report;
3. Based on my knowledge, the financial statements, and other financial information included in this report, fairly present in all material respects the financial condition, results of operations and cashflows of the registrant as of, and for, the periods presented in this report;
4. The registrant’s other certifying officer(s) and I are responsible for establishing and maintaining disclosure controls and procedures (as defined in Exchange Act Rules 13a-15(e) and 15d-15(e)) and internal control over financial reporting (as defined in Exchange Act Rules 13a-15(f) and 15d-15(f)) for the registrant and have:
a. Designed such disclosure controls and procedures, or caused such disclosure controls and procedures to be designed under our supervision, to ensure that material information relating to the registrant, including its consolidated subsidiaries, is made known to us by others within those entities, particularly during the period in which this report is being prepared;
b. Designed such internal control over financial reporting, or caused such internal control over financial reporting to be designed under our supervision, to provide reasonable assurance regarding the reliability of financial reporting and the preparation of financial statements for external purposes in accordance with generally accepted accounting principles;
c. Evaluated the effectiveness of the registrant’s disclosure controls and procedures and presented in this report our conclusions about the effectiveness of the disclosure controls and procedures, as of the end of the period covered by this report based on such evaluation; and
d. Disclosed in this report any change in the registrant’s internal control over financial reporting that occurred during the registrant’s most recent fiscal quarter (the registrant’s fourth fiscal quarter in the case of an annual report) that has materially affected, or is reasonably likely to materially affect, the registrant’s internal control over financial reporting; and
5. The registrant’s other certifying officer(s) and I have disclosed, based on our most recent evaluation ofinternal control over financial reporting, to the registrant’s auditors and the audit committee of the registrant’s board of directors (or persons performing the equivalent functions):
a. All significant deficiencies and material weaknesses in the design or operation of internal control over financial reporting which are reasonably likely to adversely affect the registrant’s ability to record, process, summarize and report financial information; and
b. Any fraud, whether or not material, that involves management or other employees who have a significant role in the registrant’s internal control over financial reporting.
Date: March 16, 2005/s/ Douglas K. FreemanDouglas K. FreemanChairman and Chief Executive Officer

127
Exhibit 31.2
Certification Pursuant to Rules 13a-14(a) and 15d-14(a) under the Securities Exchange Act of 1934, as Amended
I, Steven F. Herbert, certify that:
6. I have reviewed this annual report on Form 10-K of NetBank, Inc.;
7. Based on my knowledge, this report does not contain any untrue statement of a material fact or omit to state a material fact necessary to make the statements made, in light of the circumstances under which such statements were made, not misleading with respect to the period covered by this report;
8. Based on my knowledge, the financial statements, and other financial information included in this report, fairly present in all material respects the financial condition, results of operations and cashflows of the registrant as of, and for, the periods presented in this report;
9. The registrant’s other certifying officer(s) and I are responsible for establishing and maintaining disclosure controls and procedures (as defined in Exchange Act Rules 13a-15(e) and 15d-15(e)) and internal control over financial reporting (as defined in Exchange Act Rules 13a-15(f) and 15d-15(f)) for the registrant and have:
a. Designed such disclosure controls and procedures, or caused such disclosure controls and procedures to be designed under our supervision, to ensure that material information relating to the registrant, including its consolidated subsidiaries, is made known to us by others within those entities, particularly during the period in which this report is being prepared;
b. Designed such internal control over financial reporting, or caused such internal control over financial reporting to be designed under our supervision, to provide reasonable assurance regarding the reliability of financial reporting and the preparation of financial statements for external purposes in accordance with generally accepted accounting principles;
c. Evaluated the effectiveness of the registrant’s disclosure controls and procedures and presented in this report our conclusions about the effectiveness of the disclosure controls and procedures, as of the end of the period covered by this report based on such evaluation; and
d. Disclosed in this report any change in the registrant’s internal control over financial reporting that occurred during the registrant’s most recent fiscal quarter (the registrant’s fourth fiscal quarter in the case of an annual report) that has materially affected, or is reasonably likely to materially affect, the registrant’s internal control over financial reporting; and
10. The registrant’s other certifying officer(s) and I have disclosed, based on our most recent evaluation ofinternal control over financial reporting, to the registrant’s auditors and the audit committee of the registrant’s board of directors (or persons performing the equivalent functions):
a. All significant deficiencies and material weaknesses in the design or operation of internal control over financial reporting which are reasonably likely to adversely affect the registrant’s ability to record, process, summarize and report financial information; and
b. Any fraud, whether or not material, that involves management or other employees who have a significant role in the registrant’s internal control over financial reporting.
Date: March 16, 2005 /s/ STEVEN F. HERBERT
Steven F. Herbert Chief Financial Executive

CORPORATE INFORMATION
Corporate HeadquartersNetBank, Inc.Royal Centre Three11475 Great Oaks WayAlpharetta, Georgia 30022Telephone: (770) 343-6006
Corporate and New Account InformationFor more information about NetBank, Inc. or to open an account with NetBank, visit our Web site at www.netbank.com.
Stock Listing and SymbolsThe company’s common stock is traded on the NASDAQ National Market under the symbol “NTBK.”
Independent AccountantsErnst & Young, LLP600 Peachtree Street, Suite 2800Atlanta, Georgia 30308
Annual MeetingThe Annual Meeting of NetBank, Inc. shareholders will be held at Embassy Suites Hotel, 5955 North Point Parkway, Alpharetta, Georgia, on Thursday, April 28, 2005, at 10 a.m.
Transfer Agent and RegistrarFor information relating to stock certifi cates, change of address, or transfer of ownership, contact:
SunTrust Bank58 Edgewood Avenue, Suite 225Atlanta, Georgia 30303Telephone: (404) 588-7815 or (800) 568-3476
Financial Information and Corporate ReportsAnalysts and investors seeking information about NetBank, Inc. may contact the chief fi nance executive. Annual reports, quarterly shareholder reports, quar-terly Form 10-Qs, and copies of NetBank, Inc.’s Annual Report on Form 10-K, excluding exhibits, as fi led with the Securities and Exchange Commission, are available on our Web site and upon written request without charge. Please direct your request to:
Matthew ShepherdNetBank, Inc.Royal Centre Three11475 Great Oaks WayAlpharetta, Georgia 30022Telephone: (678) 942-2683Fax: (678) 942-2689
Corporate CommunicationsMatthew ShepherdTelephone: (678) 942-2683
Analysts Following NetBank, Inc.
FIG PartnersChris Marinac
Friedman Billings Ramsey & CompanyPaul Miller
JMP SecuritiesJim Fowler
Keefe Bruyette & WoodsDavid Honold
Midwest ResearchPeyton Green
Raymond James & AssociatesMike Vinciquerra
Sandler O’Neill & PartnersRich Repetto
Stanford Group CompanyKevin Reynolds
SunTrust Robinson HumphreyJennifer Demba
des
ign
ed a
nd
pro
du
ced
by
see
see
eye

NetB
ank, In
c._ An
nu
al Re
po
rt 20
04
_Bran
ch O
ut
Royal Centre Three, 11475 Great Oaks Way, Alpharetta, Georgia 30022