Net zer o: deca r bonis ing the city
50
Net zero: decarbonising the city Valentine Quinio, Guilherme Rodrigues July 2021
Transcript of Net zer o: deca r bonis ing the city

Net zero: decarbonisingthe cityValentine Quinio, Guilherme RodriguesJuly 2021

About Centre for Cities
Centre for Cities is a research and policy institute dedicated to improving the economicsuccess of UK cities and large towns.
We are a charity that works with local authorities, business and Whitehall to develop andimplement policy that supports the performance of urban economies. We do this throughimpartial research and knowledge exchange.
For more information, please visit www.centreforcities.org/about
About the author
Valentine Quinio, Analyst [email protected]
Guilherme Rodrigues, Researcher [email protected]
Acknowledgements
The authors would like to thank Malcolm Morgan for his valuable insights on the report.The authors would also like to express gratitude to Simon Evans, Christopher Jones, ZoeAvison and Louise Marix Evans for their help.
About our partner
HSBC UK serves around 14.5 million customers across the UK, supported by 32,000colleagues. HSBC UK offers a complete range of retail banking and wealth managementto personal and private banking customers, as well as commercial banking for small tomedium businesses and large corporates. HSBC UK is a wholly owned subsidiary of HSBCHoldings plc.

Centre for Cities • Net zero: decarbonising the city • July 2021
3
00Executive summary
Large urban areas are often perceived as being bad for the environment, and this is truefor air pollution. But when it comes to tackling climate change and reaching theGovernment’s goal of net zero emissions by 2050, cities and large towns are greenerthan the countryside.
This is because of the specific nature of the challenge ahead. So far, the UK has madegood progress on reducing carbon emissions, which have halved in the last 30 yearsmostly thanks to a shift away from coal and carbon-intensive industries. But furtherreductions are likely to be tougher to achieve, because they will involve bearing down onemissions in two sectors where cuts have been much less impressive in recent years:transport and housing. And on these two counts, cities and large towns will need to playan outsized role.
Density, something that is inherently unique to an urban area, tends to encouragelifestyles that are less carbon-intensive. In dense urban environments, journeys – whetherfor work or for leisure – require less energy. They are often shorter, facilitating activetravel like walking or cycling, and are more likely to be made on public transport than incars. And as cities and large towns tend to have a higher proportion of flats, which aresmaller in size and more energy efficient than typical detached, single-family housing,domestic emissions tend to be lower too. All this meant that, in 2018, the carbon footprintof an average city resident was about four tonnes of carbon a year, compared to morethan six tonnes for people living outside cities.
In fact, because density underpins public transport usage and domestic emissions, thefight to reduce transport emissions should not just focus on transport policy. It needs tofocus on the way we plan, build and manage cities and large towns around the country.
The challenge is that, compared to their international counterparts, UK cities and largetowns are not very dense. New residential developments often tend to be on poorlyconnected greenfield land on the outskirts of urban areas rather than on brownfield landand in existing built-up areas, which results in higher levels of car dependency. City centreresidents own on average 0.2 cars per person, while the figure is twice as high for

Centre for Cities • Net zero: decarbonising the city • July 2021
4
residents of suburban areas, and higher again in rural areas. And, as the location of newresidential development is closely tied to the types of homes that are being built, thesepatterns have also negatively affected domestic emissions: despite the fact that new flatsemit 67 per cent less carbon that new houses, the latter account for an increasing shareof new-build completions.
This report argues that cities and large towns – and their density – are central to the UKmeeting its net zero objective, and that this should be a key consideration as wecontemplate the role of urban areas post-pandemic. For net zero to be within reach, citieswill need to survive and thrive. To do this:
This has important implications in terms of policy. Net zero is a national pledge: muchaction to achieve it will happen ‘to’ cities, rather than being driven by them, such aschanges in electricity generation. But in the areas of transport and domestic emissions,alongside government intervention (such as the phasing out of petrol and diesel cars),cities and large towns have the potential to bring about change. So, as many are alreadyconsidering, they will need to play their part. They already have levers to pull, throughtheir approach to planning or by discouraging car use for instance, but their room formanoeuvre is often hampered by a lack of powers and resources, a disorganised localgovernment structure, and a dysfunctional planning system.
To address this, national government should:
The UK’s approach to development needs to change to work with net zerogoals, rather than against them. Both transport and housing emissions can beaddressed through spatial planning policies, for instance to allow more homes tobe built on brownfield land near existing public transport networks and in existingbuilt-up areas.
•
On transport, the priority is to move away from car dependency andincentivise the take-up of low-carbon alternatives.
•
On housing, the challenge is twofold – to retrofit existing houses and toprioritise the development of compact, more energy efficient housingstock.
•
Devolve more powers at the local level to ensure transport and housing planningare integrated as part of a single, coordinated strategy. In mayoral combinedauthorities this entails moving powers down from Whitehall and up from localauthorities, so that all mayors have the same statutory spatial planning powers asthe Mayor of London.
•
Reform planning by introducing a flexible zoning system that will facilitate andaccelerate the densification of existing built-up areas at scale.
•
Deliver on the pledge to phase out petrol and diesel cars by 2030, and set anintermediate milestone to reach by 2025.
•

Centre for Cities • Net zero: decarbonising the city • July 2021
5
Local governments running cities and large towns should:
Reintroduce, extend and better fund the Green Homes Grant to subsidise retrofitmeasures, associated with tax incentives like a ‘green offset’ on property taxadjusted to the energy performance certificate of the property.
•
Use their existing powers to disincentivise car usage, by adopting schemes likeClean Air Zones, Workplace Parking Levies or Park and Ride.
•
Invest in public transport and active travel infrastructure. This may include makingpermanent some of the measures put in place temporarily as a result of thepandemic, such as pedestrianisation of central areas or pop-up cycle lanes.
•
Use building regulations and trading standards to impose higher standards ofenergy efficiency and carbon emissions and make use of the £500 million GreenHomes Grant Local Authority Delivery scheme to improve the energy efficiency ofhomes of low-income households.
•

Centre for Cities • Net zero: decarbonising the city • July 2021
6
01Introduction
In June 2019, the UK passed a law setting an ambitious target: net zero greenhouse gasemissions by 2050. This, and measures such as the recently adopted Sixth CarbonBudget, is necessary to keep global warming well under 2°C and avoid irreversibledamage to the planet.
As this is an international issue, much of the intervention needed will need to be led bynational governments. And much of the intervention will be ‘place blind’ – changing theway we generate electricity, for example, will not have a particular place angle to it. Buttwo sources of emissions – transport and domestic – vary across the country because ofthe way that the built environment affects our lifestyles. On these two sources ofemissions, place will be an important factor in bringing them down.
This report looks at the role that different places will have to play to help the UK achieveits net zero goal. It looks at how far cities and large towns are from net zero, how it variesbetween places and the scale and effort required to get there. With a focus on transportand housing, two activities that need to be decarbonised, this research sets out whatneeds to change if urban areas are to lead the way in decarbonising the UK’s economy,without leaving people and places behind.
What is net zero?
Net zero does not mean zero emissions; in sectors like agriculture, cutting emissionsdown to zero will hardly be achievable. Instead it means reaching a balance betweenemissions going into, and being removed from, the atmosphere: any emissions that areproduced are fully offset through ‘carbon sinks’, either natural (like trees) or artificial(such as carbon capture and storage technologies).
Carbon capture will only cover a small amount of the emissions produced in the UK.Given this, achieving net zero will require large cuts in overall emissions, even if this doesnot mean that emissions will be zero.
1

Centre for Cities • Net zero: decarbonising the city • July 2021
7
Box 1: Methodology
Definition of a city
Centre for Cities research focuses on the UK’s 63 largest towns and cities. Unlessotherwise stated, here cities refer to Primary Urban Areas (PUAs), using a measureof the built-up area of a large city or town, rather than administrative boundarieslike local authorities or combined authority geographies. Often used in Centre forCities’ research to provide a consistent measure of the concentration of economicactivity across the UK, PUAs’ geographies can help analyse the role cities play inthe wider decarbonisation agenda as dense, contiguous built environment tends tohave an impact on the carbon footprint of a given area and its residents.
Data used for this research
This paper uses a number of publicly available datasets. These include the UK localauthority and regional carbon dioxide emission statistics, published by theDepartment for Business, Energy & Industrial Strategy (BEIS), which are availablefor the years 2005 to 2018. These statistics show emissions allocated on an ‘end-user’ basis (they are distributed according to the point of energy consumption, oremission if not energy related). Emissions from the production of goods areassigned to where production takes place, so those generated from imports are notincluded.
Other sources include the National Travel Survey, the Driver and Vehicle LicensingAgency, Census 2011 data, as well as the EPC Domestic Register.
Although the decarbonisation agenda and UK’s net zero target cover all greenhousegases, including methane and nitrous oxide, this research focuses primarily on CO .This is largely because it is the only component included in the local authoritydataset. CO contributes the most to global warming, accounting for more than 80per cent of all UK greenhouse gas emissions.
2
2

Centre for Cities • Net zero: decarbonising the city • July 2021
8
02Why cities will need to play a
central role in the net zeroagenda
The UK needs to make progress on transport and domesticemissions to meet its net zero goals
The UK has made considerable progress in cutting its emissions since the turn of thecentury. Greenhouse gas emissions have already halved compared with 1990 levels(Figure 1).
Figure 1: UK greenhouse gas emissions have halved since 1990
Source: BEIS, 2020; Climate Change Committee, 2020.
2

Centre for Cities • Net zero: decarbonising the city • July 2021
9
Over the past three decades, the main driver has been a reduction in industrial andcommercial emissions (Figure 1). The phasing out of coal, gradual uptake of renewableenergy and structural shift away from carbon-intensive manufacturing account for nearly70 per cent of the progress made in the past 20 years. However, much less progress hasbeen made in transport and the domestic sector, which now account for more than 64 percent of all carbon emissions (Figure 1). Transport emissions have fallen by just 3 per centsince 1990, while those from the residential sector have decreased by only 13 per cent,and have remained largely flat since 2013.
The next half of the challenge is likely to be more difficult. Relying on improvements in theindustrial and energy supply sector alone will not be enough: the share of coal in the‘electricity mix’ is now very limited, so the marginal room for improvement is smaller.Government projections show that if no additional measures are taken, emissions arelikely to flatten out (Figure 1). If the UK wants to meet the net zero target by 2050, thepace of change needs to accelerate in other sectors like transport and housing. And onthese two counts, cities and large towns have a particular role to play.
Further reductions in transport and domestic emissions will bemore easily delivered in cities
Reducing emissions from transport and domestic heating will require a change in the waypeople go about their daily lives. Their ability to do this will be influenced by the builtenvironment.
Despite perceptions that cities are bad for the environment, the opposite is true whenconsidering climate change. The 63 largest cities and towns in the UK generate 45 percent of all emissions, with London accounting for 10 per cent. But cities and large townsare home to 54 per cent of the population, so emissions per capita are much lower than inmore rural areas, and the average Londoner produces less carbon than someone livingoutside a city or large town. On average, cities and large towns produce about fourtonnes of CO per capita, compared with more than six tonnes elsewhere in the UK (seeFigure 2). Only four have per capita emissions above the non-urban average.
There are two reasons for this. Firstly, with the exception of a few , high-emitting industrialactivities tend to be located outside of cities, and this is likely to continue as theyincreasingly specialise in knowledge-intensive industries. Secondly, density influences thedecisions people make about how they live, and it tends to encourage greener lifestyles.
3
2

Centre for Cities • Net zero: decarbonising the city • July 2021
10
Figure 2: Cities have a lower carbon footprint across all three sectors
Sources: BEIS, 2020.
The gap is particularly visible for transport emissions, with the average city residentemitting around 1.4 tonnes a year (Figure 2), compared with 2.5 for people living outsidecities. Dense, well-connected, urban developments tend to have a smaller carbonfootprint as journeys are often shorter, so require less energy. Data from the NationalTravel Survey shows that in areas classified as ‘urban conurbation’, the average distancetravelled by car is 2,000 miles a year, but this rises to 4,700 miles for areas classified as‘rural town and fringes’.
The distance travelled is not the only important metric. The mode of transport also affectsthe carbon footprint of a place (Box 2). This is in part influenced by density, whichfacilitates the development of and demand for public transport; it also explains whyemissions vary between places. In London, for instance, an average commute is around12 kilometres, similar to places like Stoke or Slough. But transport emissions per head inthe capital are respectively 40 per cent lower than in Stoke and 24 per cent lower than inSlough because London’s higher density facilitates better-quality public transportnetwork.
The important role played by density suggests the dispersion of a place’s populationmatters more than its actual size. Telford and Oxford have similar populations, butTelford’s built-up area is 61 per cent larger (see Figure 4), and its transport emissions perhead are twice as high as in Oxford (1.8 tonnes of CO against 0.9 tonnes).Internationally, a common comparison is Barcelona and Atlanta. They both havepopulations of about five million, but Barcelona’s dense urban form results in a muchlower carbon footprint per capita.
4
25
6

Centre for Cities • Net zero: decarbonising the city • July 2021
11
Box 2: What are the main drivers of transport emissions?
Averaged across all cities, transport accounts for exactly one third of all carbonemissions, and is the largest source in 29 cities. Road travel (emissions from roadvehicles powered by fossil fuels) is the greatest contributor, with petrol and dieselcars emitting the most, especially on a per passenger/per km basis (see Figure 3).In 2018, private cars were responsible for about 60 per cent of all transportemissions, a share that has remained fairly stable since 1990, and about 13 percent of all greenhouse gas emissions. Vehicle improvements (such as greater fuelefficiency and more people choosing to drive electric) were offset by increases inroad traffic, especially from sport utility vehicles (SUVs) and vans. Between 2009and 2019, the number of registered vehicles rose from 33 million to 38 million, a 17per cent increase that is well above the population growth rate.
Figure 3: Private cars emit three times more carbon than shared modes oftransport
Source: Department for Transport (DfT), 2020.
7

Centre for Cities • Net zero: decarbonising the city • July 2021
12
Figure 4: Telford’s built-up area is 61 per cent larger than Oxford’s
Source: ONS, 2011.
Density impacts emissions from buildings too. This is because cities tend to have a higherproportion of flats, which generate fewer carbon emissions (Box 3). It has been estimatedthat the average emissions of a flat in a building with five or more dwellings is one tonneof carbon a year, compared to two for the average house.
Much of that gap can be explained by the fact that flats tend to be smaller – in itself afunction of density – as smaller dwellings emit less carbon. But size is not the only factor.
Data analysis suggests that emissions per square metre are 6 per cent lower in flats thanin houses. This is because they are more heat efficient than detached homes (Box 3).They have fewer external walls, tend to share more heat with adjoining properties, andlose less through the floor and ceilings.
There are also gains that are yet to be realised from higher densities. For example,shared technologies like district heating, which can decarbonise multiple homes at oncethrough economies of scale and supply, are only viable in dense urban environment withsufficient demand for heat.
Combined, these elements explain why domestic emissions per capita are lower in denserurban environments. That said, the gap between cities and rural areas is narrower thanfor transport emissions (Figure 2). This is because the quality of housing is important –many cities and large towns still have old, energy inefficient housing that is carbonhungry.
8
9

Centre for Cities • Net zero: decarbonising the city • July 2021
13
Box 3: What are the main drivers of domestic emissions?
Averaged across all cities, domestic emissions account for 31 per cent of the totalgenerated (the largest source of emissions in 16 cities and large towns). Most arethe result of gas and electricity consumption in and around homes. The quantity ofemissions is influenced by a number of factors including the types of fuel used (theburning of fossil fuels for heating being the main source of emissions); the age, type(Figure 5), quality and condition of the property (especially its size and insulation);and other household characteristics.
Figure 5: Detached houses emit more than twice as much carbon than flats
Source: English Housing Survey, 2012.
Centre for Cities • Net zero: decarbonising the city • July 2021
14
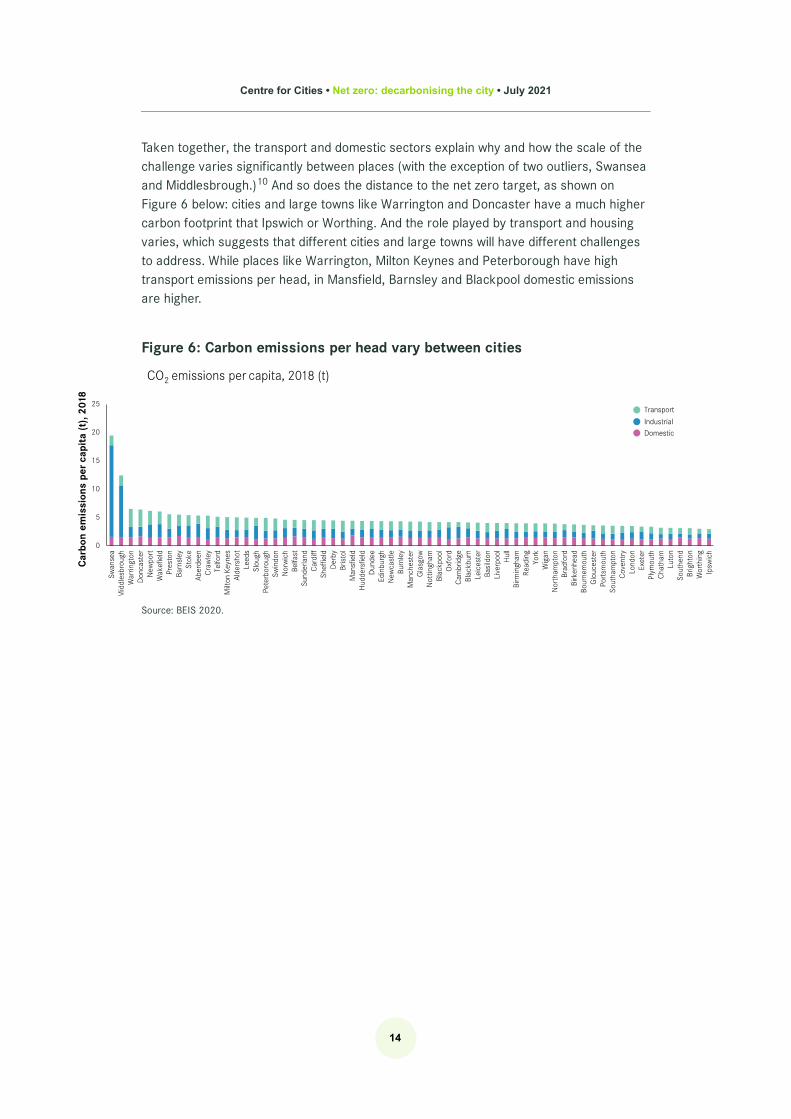
Taken together, the transport and domestic sectors explain why and how the scale of thechallenge varies significantly between places (with the exception of two outliers, Swanseaand Middlesbrough.) And so does the distance to the net zero target, as shown onFigure 6 below: cities and large towns like Warrington and Doncaster have a much highercarbon footprint that Ipswich or Worthing. And the role played by transport and housingvaries, which suggests that different cities and large towns will have different challengesto address. While places like Warrington, Milton Keynes and Peterborough have hightransport emissions per head, in Mansfield, Barnsley and Blackpool domestic emissionsare higher.
Figure 6: Carbon emissions per head vary between cities
Source: BEIS 2020.
10
Centre for Cities • Net zero: decarbonising the city • July 2021
15
03Cities need to become denser
to achieve net zero
Cities are likely to keep playing a disproportionate role in helping the UK hit its net-zerotarget, as their density means that they are places in which greater progress can bemade in cutting transport and domestic emissions. But it will mean that cities and largetowns will need to become denser to make this happen.
UK cities are not very dense by international standards
The UK is often thought of as one of the most densely populated places in Europe. Whenusing a traditional definition of population density (total population relative to total landarea), at 280 people per square kilometre, the UK is third in Europe behind theNetherlands (508) and Belgium (382).
But this hides significant variation between and within cities, especially when usingalternative measures of density, such as those where only the size of the built-up area istaken into account. Sometimes called ‘lived-density’, this better reflects the compactnature of an urban area.
UK cities, especially those outside London, are not particularly dense by internationalstandards. Figure 7 shows the distribution of square kilometre units of land with apopulation of more than 10,000 for a selection of European countries. In the UK, 86 percent of these areas have between 10,000 and 15,000 inhabitants, with no area havingmore than 25,000 per square kilometre. This contrasts strongly with places like Spain,Belgium and France. Even the UK capital ranks below a number of European cities – itsmost populated square kilometre, in Maida Vale, has just over 20,000 inhabitants,compared with more than 50,000 in cities like Barcelona and Paris.
11

Centre for Cities • Net zero: decarbonising the city • July 2021
16
Figure 7: Compared to other European countries, the UK is not very dense
Source: Eurostat, 2011.
London is also less dense than cities like Geneva, Bilbao or Naples; and many UK largecities such as Manchester or Sheffield rank below a number of European cities of similarsize, particularly French and Spanish ones (Figure 8).
Figure 8: UK cities are not as dense as many of their Europeancounterparts
Source: Eurostat, 2011.
Much development has run counter to achieving net zero
A lot of this has to do with the location, over many decades, of new residentialdevelopments in the UK, as they tend to be on greenfield land on the outskirts of citiesrather than on brownfield land or in existing built-up areas. Such development increasescar dependency.
This has historically been explained by the considerable expansion of the automobileindustry in the 1960s, which slashed transportation costs and contributed to urban sprawl

Centre for Cities • Net zero: decarbonising the city • July 2021
17
by increasing demand for housing in suburban areas. It has been widely documented inthe United States, and holds true in the UK. This was most clearly characterised by newtowns such as Milton Keynes, Telford and Warrington, which were designed as low-density, car-dependent urban developments.
These patterns have continued more recently, despite the UK’s net zero goals. Work bythe Foundation for Integrated Transport explored the characteristics of a selection of new-built developments across the country, including in cities like Peterborough, Leeds,Newcastle, Warrington and Swindon. It showed that, with a few exceptions, most werecar-dependent, located away from jobs and public transport networks, and built at verylow-density levels.
This critique also holds for commercial space. The many Enterprise Zones and businessparks that have been built in recent decades have encouraged car commutes becausethey are more difficult to serve by public transport (Box 4).
12
13
14
15

Centre for Cities • Net zero: decarbonising the city • July 2021
18
Box 4: A example of out-of-town business park development: NewburnRiverside
The Newburn Riverside Business Park is located on the outskirts of Newcastle, bythe River Tyne. It is now home to the Waterfront Estate, which combines industrialfacilities and offices. When it was built in 2003, it was presented as a landmarkexample of a sustainable development, on a large decontaminated brownfield siteusing sustainable design and materials.
But the carbon footprint of this new development is not as good as these greenerfeatures may suggest. This is in large part because of its out-of-town location, morethan three miles away from Newcastle city centre. The site is adjacent to the A1(M)motorway, and has very low public transport accessibility. This is likely to haveencouraged car-based commuting: in 2011, around 85 per cent of workers used acar to get there, compared to an average of 58 per cent in Newcastle City Councilarea.
These patterns have in part been shaped by the economics. Greenfield land on theoutskirts of cities tends to be cheaper and less risky for developers to build on, while anout-of-town location is a better fit for some businesses than a more central one.
That said, policy has had a role to play in further encouraging these patterns. The currentplanning system has encouraged the existing pattern of house building, as Box 5explains. And successive subsidies for out-of-town employment space, such asEnterprise Zones, science parks and other public sector-led developments haveencouraged low density, car-dependent development in fringe locations.
16
17
18

Centre for Cities • Net zero: decarbonising the city • July 2021
19
Box 5: The role of the planning system
In its current form, the planning system does not produce the most effective resultsin terms of the quantity of houses being built or the location of new developments.
It is a ‘plan-led’ system, where landowners come forward with areas fordevelopment as part of a ‘call for sites’ process. The land must then be assessedand accepted by the local planning authority, first to be part of the local plan andthen to be given planning permission.
The land is rarely in existing built-up areas, mostly because development is easierwhere homeownership is simpler. Given that built-up suburbs tend to have highlevels of homeownership, where plans for densification can be met by a lot ofresistance, it is politically less risky to build on the outskirts of cities, for instance onfarmland.
It is easier for developers too. Densifying existing built-up areas, usually on landthat has not been allocated for development in the local plan (‘windfall sites’),presents more upfront costs and risks. It often requires developers to purchase andassemble small lots, which is a lengthy process and there is no certainty over theoutcome, as the plan can be rejected on a case-by-case basis. This is a majorbarrier to scaling suburban densification.

Centre for Cities • Net zero: decarbonising the city • July 2021
20
This has shaped transport choices in cities
In low-density cities and large towns like Huddersfield and Telford, transport emissions perhead are far higher than in cities such as Oxford, London and Brighton (Figure 9). In thelatter group, more than half of the population commutes by walking, cycling or publictransport.
Figure 9: Higher density leads to higher active travel usage, resulting inlower transport emissions
Source: BEIS, 2020. Census 2011. Centre for Cities’ own calculations. The bubble size here refers to the take up ofpublic transport and active travel.
This relationship between density levels and transport emissions is clear: modelling byCentre for Cities shows that a 20 per cent increase in density would lead to a 10.4 percent fall in transport emissions, based on current behaviours – and much of this would beexplained by changes in public transport usage. In absolute terms, this reduction wouldbe equivalent to four times Newcastle’s current total transport emissions. If densityincreased by 50 per cent, emissions would go down by 21.7 per cent, a reductionequivalent to the size of London’s current emissions.
It means that a household moving from an area with Telford’s density levels (around 30people per hectare) to somewhere as dense as Brighton (60 people per hectare), wouldexpect to cut their transport emissions per head by 33 per cent on average – movingfrom 1.8 tonnes of CO to 1.2 tonnes of CO .
This relationship between density and transport emissions can be seen in cities and largetowns too. Research from abroad has shown that transport emissions per capita arelower in city centres than in suburbs. And although there is no sub-local authority
19
20
2 2
21
Centre for Cities • Net zero: decarbonising the city • July 2021
21
emissions data in the UK, data on car ownership points to lower ownership (and so feweremissions) in denser neighbourhoods.
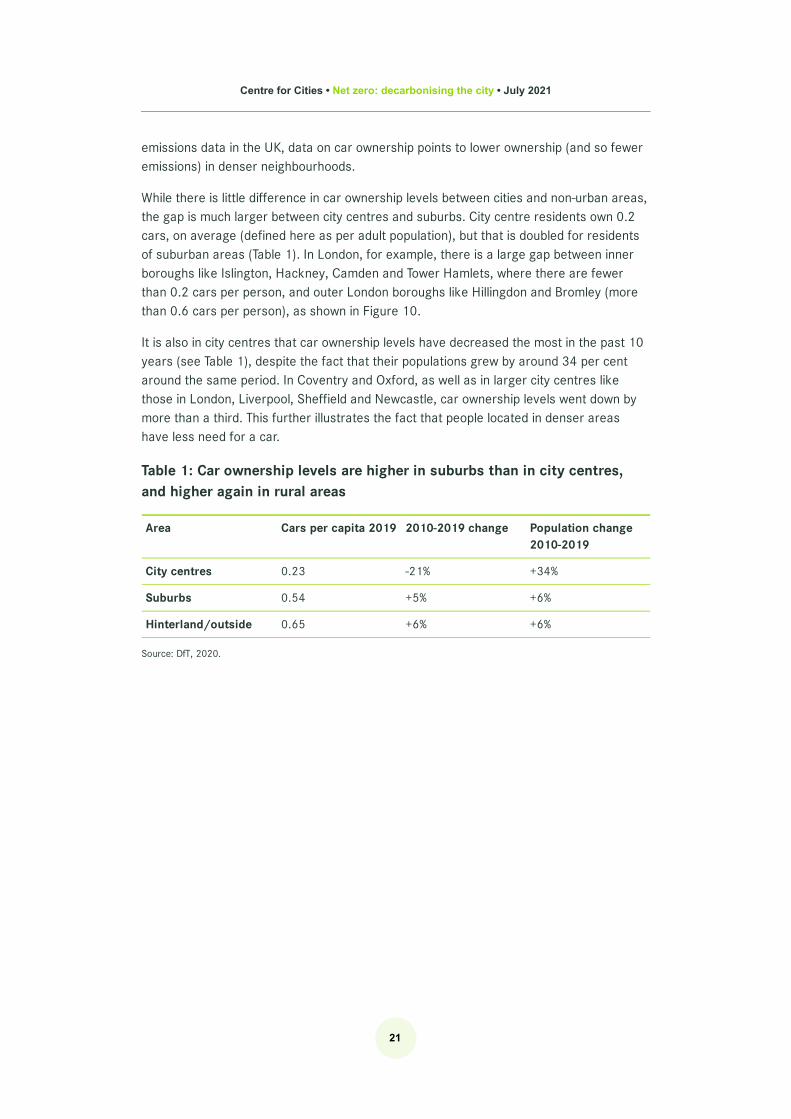
While there is little difference in car ownership levels between cities and non-urban areas,the gap is much larger between city centres and suburbs. City centre residents own 0.2cars, on average (defined here as per adult population), but that is doubled for residentsof suburban areas (Table 1). In London, for example, there is a large gap between innerboroughs like Islington, Hackney, Camden and Tower Hamlets, where there are fewerthan 0.2 cars per person, and outer London boroughs like Hillingdon and Bromley (morethan 0.6 cars per person), as shown in Figure 10.
It is also in city centres that car ownership levels have decreased the most in the past 10years (see Table 1), despite the fact that their populations grew by around 34 per centaround the same period. In Coventry and Oxford, as well as in larger city centres likethose in London, Liverpool, Sheffield and Newcastle, car ownership levels went down bymore than a third. This further illustrates the fact that people located in denser areashave less need for a car.
Table 1: Car ownership levels are higher in suburbs than in city centres,and higher again in rural areas
Area Cars per capita 2019 2010-2019 change Population change2010-2019
City centres 0.23 -21% +34%
Suburbs 0.54 +5% +6%
Hinterland/outside 0.65 +6% +6%
Source: DfT, 2020.

Centre for Cities • Net zero: decarbonising the city • July 2021
22
Figure 10: Car ownership levels are much higher in outer London
Source: DfT, 2020
It has shaped domestic emissions too
In recent years, suburban sprawl and the construction of single-family, detached housinghas negatively affected domestic emissions. Energy Performance Certificate (EPC) datashows new apartments emit 67 per cent less than new houses – flats built (or converted)in 2019 emitted 0.9 tonnes of carbon annually, while houses constructed in the sameyear were responsible for 1.5 tonnes. This gap has widened in recent years – between2013 and 2019, emissions from new flats went down by 18 per cent, on average,compared with 11 per cent for new houses (Table 2).
Despite this, houses account for an increasing share of all new builds – in 2019, nearly80 per cent were houses, up 12 percentage points since 2013 (Table 2). Additional datafrom the National House Building Council (NHBC) confirms that most new builds are large,detached houses that tend to have a higher carbon footprint. In 2019, this type of homeaccounted for 30 per cent of all new dwellings, compared with 22 per cent in 2013.
22
23

Centre for Cities • Net zero: decarbonising the city • July 2021
23
Table 2: New houses emit 65 per cent more emissions than new flats
2013 2019
CO emissions(tonnes/year)
Share of all new buildcompletions (%)
CO emissions(tonnes/year)
Share of all new buildcompletions (%)
Newflats
1.1 33 0.9 22
Newhouses
1.7 67 1.5 78
Source: EPC domestic register, 2019.
2 2

Centre for Cities • Net zero: decarbonising the city • July 2021
24
04How a changing approach to
development can help achievenet zero
The UK needs to change its approach to planning and development to achieve net zero.This section sets out modelling on the impact that this change of approach could have onnet zero, in conjunction with the take-up of electric vehicles (EVs) the retrofitting ofexisting houses and the building of more energy efficient new homes.
Modelling the impact of a modal shift on transport emissions
Cutting transport-related emissions often relies on projections showing a significantuptake of EVs and Battery Electric Vehicles (BEVs), in particular. But relying on a shift tocleaner vehicles must not be considered as the only solution (Box 6). Wider benefits canbe reaped through modal shift, with an increase in public transport and active travelusage.
Figure 11 is based on modelling by Centre for Cities. It focuses on emissions fromcommuter journeys and estimates the potential reduction in carbon emissions if carsaccounted for only a third of these journeys (as they currently do in London), againstmore than 60 per cent today. It uses modal share data, population projections for allcities, average distance to work and estimates of car emissions per kilometre/passengerby 2035.
On the last metric, three scenarios have been considered:
24
25
No change, where there is no significant uptake in the number and share of EVsand BEVs by 2035.
1.
An optimistic scenario where, in 2035, BEVs account for two-thirds of the fleet(which is in line with the Government’s expected phase out of petrol and dieselcars by 2030).
2.
A ‘middle ground’ scenario where, by 2035, BEVs account for a third of the fleet.3.

Centre for Cities • Net zero: decarbonising the city • July 2021
25
Figure 11 shows a worst-case scenario where neither the composition of the fleet normodal share changes. In this case, transport emissions are expected to rise as a result ofprojected population growth, and subsequent increases in traffic levels.
It also shows the extent to which a change in modal share can get cities closer to net zeroemissions in the transport sector, regardless of the composition of the fleet. Even in ascenario where there is no significant uptake of EVs, the impact of a change in modalshare is clear: car-related emissions would more than halve.
In the best-case scenario, where EVs make up two-thirds of the fleet and cars account foronly a third of all journeys, emissions from these journeys would be cut by 87 per centcompared with today’s levels. While gains from modal shift are reduced, they still play animportant role.
Figure 11: Emissions could halve by 2035 if cars only account for a thirdof all journeys
Source: DfT, 2020; Census, 2011. Centre for Cities’ own calculations.
The impact of each scenario varies from place to place. In the absence of change, citiesand large towns like Coventry or Bristol would see their emissions go up by 20 per centand 12 per cent respectively, mostly driven by population growth. And, conversely, modalshift would have the biggest impact in cities like Aldershot, Blackburn or Burnley.Emissions in these cities are 60 per cent higher today than they would be if car usage wasat London levels.

Centre for Cities • Net zero: decarbonising the city • July 2021
26
Box 6: EVs are an important part of the solution, but they should notbe seen as the only way to achieve a greener future
The Government recently announced that the sales ban for petrol and dieselengines, initially planned for 2040, would be brought forward to 2030. This iswelcome news, as it is expected to cut CO and nitrogen dioxide (NO ) emissions,especially given the underlying assumption that there will be significant uptake ofzero emission vehicles in the run up to 2030. While a transition to EVs would have anumber of benefits, they are not the panacea, especially in cities.
First, while they have no exhausts, they still emit harmful fine particulate matter(PM ) through brakes and tyre wear, and this is the cause of more than 14,000deaths a year in cities alone.
Second, EVs would put a strong burden on local grids, and a lot of electricity cablesand power stations would be required.
Third, they still take up a considerable – and valuable – amount of space (the sameas for a petrol or diesel car). Data for London shows the average car is parked atleast 95 per cent of the time, and 43 per cent are parked on the street. Atransition to EVs would not free up space for public transport and active travel, buslanes or segregated cycling infrastructure.
Cities need fewer cars, not just cleaner cars. In the densest urban areas,investment must be targeted towards disincentivising driving. The focus for EVsmust be on residual journeys outside dense urban areas where there are no (orfew) alternatives.
2 2
2.526
27

Centre for Cities • Net zero: decarbonising the city • July 2021
27
Box 7: Is remote working the solution to cutting carbon emissions?
It has often been suggested that working from home provides a solution, both interms of improving air quality and reducing carbon emissions. In particular, thishas been argued during the Covid-19 pandemic, which triggered a surge in remote-working patterns.
While it might reduce transport emissions from commutable journeys and, in somecases, cut overall emissions, it is important to nuance this argument. Commutesonly represent 14 per cent of car trips, so are not the largest contributor toemissions. Density still matters because it determines the average distance of otherjourneys (such as grocery shopping or leisure), and therefore the likelihood ofpeople walking or using public transport.
This is particularly true where a household moves further away from a city centre toa less dense area because they do not need to go to the office every day. Providedthey did not use public transport for their commute, they might save carbon on thatjourney. However, they may end up using a car more for other purposes. As aresult, their total carbon footprint would either remain unchanged or increase,especially if they moved to a larger home that uses more energy.
Such a shift from cars to public transport can be achieved through a number of policyinterventions, such as disincentivising car usage by making driving more expensive orinvesting in public transport infrastructure. But, to be the most impactful and reach apotential transport emission cuts of up to 87 per cent as shown above, many of thesepolicies will need to be underpinned by changes in density. An associated increase indemand that arises in denser environments would, for instance, support the developmentof new public transport routes or make existing ones more viable, and facilitate thetransition away from cars.
This has important implications in terms of housebuilding policies and spatial planningmore generally. If the UK is to increase its provision of homes by 2.3 million in the nextdecade, then it is crucial to build them in the right locations. Densifying existing built-upareas will reduce the carbon footprint of both new and existing residents, especially inlarge cities like Manchester, Birmingham, Leeds or Sheffield, which are currently waybelow London’s density levels. If 10 per cent of Manchester’s built-up area matched thelevels of west London’s densest neighbourhood, it could accommodate an extra 963,000people, resulting in a 40 per cent increase in density.
This does not necessarily mean building skyscrapers, as examples from London show(Box 8). ‘Gentle’ density can be achieved, for instance, by constructing four- to six-storeybuildings on empty brownfield land within city boundaries.
28
29

Centre for Cities • Net zero: decarbonising the city • July 2021
28
While in many of these cities there is potential for infill development in city centres, itshould not be only the immediate city centre that accommodates extra density. As placesof production and consumption, they need to balance residential and commercial space,and inner city, well-connected suburban areas will need to densify.
Box 8: Increase in density and car use – examples from London
In recent years, many areas in London have experienced an increase in densitylevels well above 20 and even 50 per cent. Some places in Stratford, in the LondonBorough of Newham, are often used as examples of mid- to high-density living.Census data for 2001 and 2011, at the lower super output area level, shows theneighbourhood by Stratford station saw density increase significantly when the areawas chosen to host the London 2012 Olympics. Over that decade, its populationnearly doubled. Public transport use rose significantly, from 58 per cent in 2001 to79 per cent in 2011. This was driven by an increase in density, and investments inpublic transport links (such as Stratford International station and the expansion ofthe Docklands Light Railway), with the latter underpinned, in part, by the former. Thelocation of jobs matter too: between these two dates, the proportion of peoplecommuting from Newham to central London has increased by four percentagepoints.
Croydon is another example. In the neighbourhood that surrounds Wandle Park, thepopulation nearly doubled between 2001 and 2011 too. And, given the area just afew hundred metres south did not experience any significant increase, the gap inpublic transport use is striking. In 2001 both areas had similar modal shares, witharound 36 per cent of residents using public transport. However, it rose by 20percentage points in the former, but barely changed in the latter.
In Stratford and Croydon, higher density levels were achieved through theconstruction of mid-to-high rise buildings (see Figure 12).
Figure 12: Typical new development in Stratford (left) and Croydon (right)
Source: Google Maps, 2021
Centre for Cities • Net zero: decarbonising the city • July 2021
29
Further emissions reductions could be achieved if cities retrofittheir housing stock
The Climate Change Committee has made it clear that the UK is unlikely to meet itstargets for emissions reductions without retrofitting large sections of the existing housingstock (Box 9). This is because the large majority of the buildings that will be there in2050 have already been built, hence the importance of focusing on existing dwellings.
Energy inefficient housing is disproportionately located in urban areas. Of the total 11.2million homes that are currently below EPC band C in England and Wales, 6.3 million arelocated in cities and large towns – some 56 per cent of the total.
Averaged across all cities, only 38 per cent of housing is rated A to C (the three mostefficient bands). This is largely down to the nature of the stock, which tends to be quiteold and inefficient and has been upgraded at a very slow pace in recent years. However,the age of the properties is not the only factor: in 2019, less than 1.5 per cent of all newhomes were rated A, which reflects a lack of ambitious regulations in terms of buildingperformance standards.
30
31
32
Centre for Cities • Net zero: decarbonising the city • July 2021
30
Box 9: Retrofitting the housing stock – the scale of the challenge
Shifting to low-carbon alternatives will be key to decarbonising the domestic sector(e.g. through electrification), but improving the energy efficiency of homes is likelyto play an important role, too. With more than a third of UK housing stock builtbefore the Second World War, homes have poor energy efficiency compared withhomes in other countries.
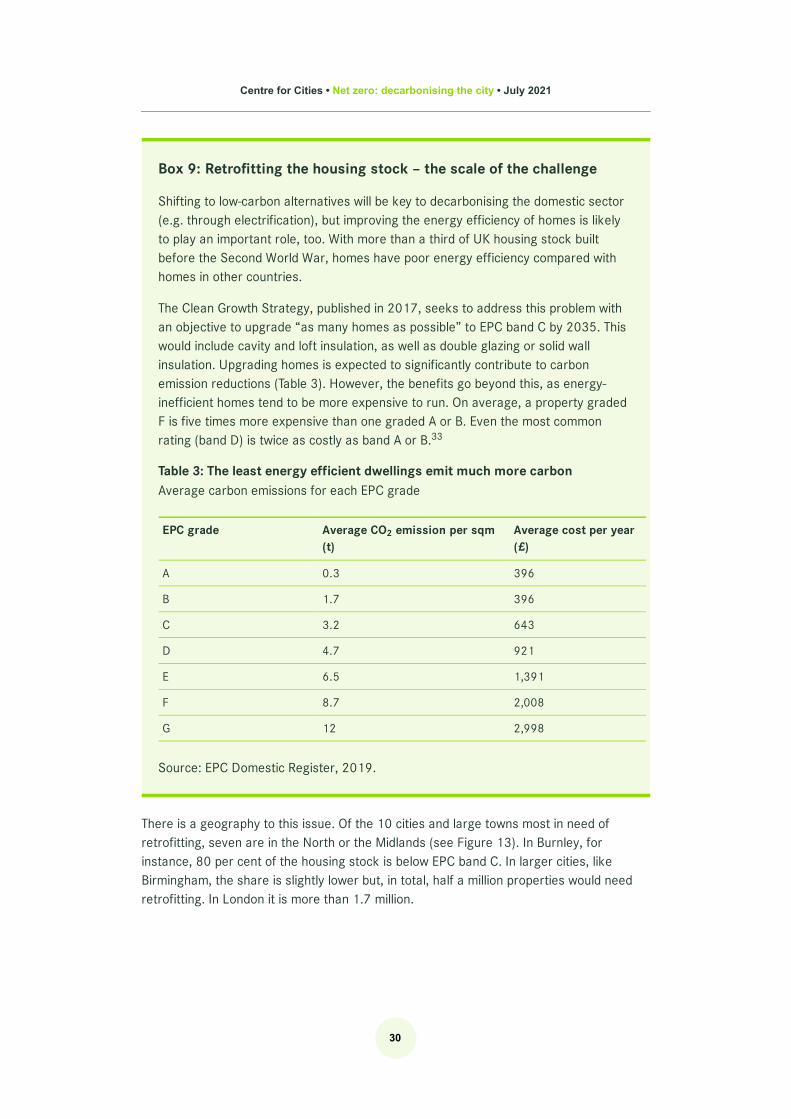
The Clean Growth Strategy, published in 2017, seeks to address this problem withan objective to upgrade “as many homes as possible” to EPC band C by 2035. Thiswould include cavity and loft insulation, as well as double glazing or solid wallinsulation. Upgrading homes is expected to significantly contribute to carbonemission reductions (Table 3). However, the benefits go beyond this, as energy-inefficient homes tend to be more expensive to run. On average, a property gradedF is five times more expensive than one graded A or B. Even the most commonrating (band D) is twice as costly as band A or B.
Table 3: The least energy efficient dwellings emit much more carbonAverage carbon emissions for each EPC grade
EPC grade Average CO emission per sqm(t)
Average cost per year(£)
A 0.3 396
B 1.7 396
C 3.2 643
D 4.7 921
E 6.5 1,391
F 8.7 2,008
G 12 2,998
Source: EPC Domestic Register, 2019.
There is a geography to this issue. Of the 10 cities and large towns most in need ofretrofitting, seven are in the North or the Midlands (see Figure 13). In Burnley, forinstance, 80 per cent of the housing stock is below EPC band C. In larger cities, likeBirmingham, the share is slightly lower but, in total, half a million properties would needretrofitting. In London it is more than 1.7 million.
33
2

Centre for Cities • Net zero: decarbonising the city • July 2021
31
Figure 13: In some cities, more than 70 per cent of the housing stockneeds retrofitting
Source: EPC Domestic Register, 2019.
Modelling that takes into account the current stock of homes that need upgrading,average emissions from each EPC band, household projections and an ‘ideal’ scenario inwhich all new builds are rated B from 2022, suggests that retrofitting would help cutdomestic emissions by nearly 40 per cent in places like Burnley, Luton and Bradford(Table 4). Even in cities and large towns with a low proportion of homes in need ofretrofitting, such as Telford, Crawley and Swindon, domestic emissions could be reducedby nearly 25 per cent compared with current levels.

Centre for Cities • Net zero: decarbonising the city • July 2021
32
Table 4: Retrofitting the housing stock could save up to 40 per cent incarbon emissions
City Potential reduction indomestic emissions –top 10
City Potential reduction indomestic emissions –bottom 10
Burnley 39% Coventry 26%
Luton 38% Wakefield 26%
Bradford 38% Slough 26%
Swansea 37% Exeter 26%
Blackburn 36% Peterborough 25%
Oxford 35% Basildon 25%
Blackpool 35% Milton Keynes 24%
Birkenhead 35% Swindon 22%
Derby 35% Crawley 22%
Ipswich 34% Telford 21%
Source: EPC Domestic Register, 2019. Centre for Cities’ own calculations. Note: this is a scenario where all new buildsuntil 2035 are in EPC band B.
Modelling the impact of retrofitting on domestic emissions
Further cuts in domestic emissions can be achieved if the right types of homes are built inthe right locations. This reflects the benefits associated with building in a more compactway, as blocks of flats tend to have a much lower carbon footprint than houses,particularly those that are detached.
Centre for Cities’ modelling shows that if density levels increased by 20 per centeverywhere, domestic emissions would fall by 5.7 per cent on average. This reductionin emissions would be equivalent to more than twice the size of Newcastle’s currentdomestic emissions.
34 35

Centre for Cities • Net zero: decarbonising the city • July 2021
33
05Progress against the UK’s
carbon budgets: how much willcities contribute?
The changes discussed in the previous section of this report, whether they aim todisincentivise car use or upgrade currently energy inefficient housing stock are likely toachieve significant cuts in carbon emissions in the transport and domestic sector,respectively. This section looks at the combined impact of these changes when setagainst the UK’s overall carbon emissions reductions target.
The UK recently enshrined into law its Sixth Carbon Budget for 2035, which includes acommitment to reach a 78 per cent reduction in greenhouse gas emissions compared to1990. This corresponds to a 63 per cent cut compared to current levels. Translating thisobjective into annual budgets shows the scale of the challenge: by 2035, the UK’s totalemissions need to be below 200Mt, compared to more than 500Mt today.
Data analysis suggests that if, by 2035, cars only account for a third of all journeys, andall houses currently graded below EPC band C have been upgraded, then about 26 percent of the total cuts needed to be in line with a net zero trajectory can be achieved.
It is clear that these changes alone will not be enough to reach net zero. More action willbe required in the industry, waste, aviation or shipping sectors, for example. But in termsof the sectors local authorities have some level of control over, such as housing andtransport, this analysis confirms that cities and large towns have the potential todisproportionately help the UK meet its emissions target. This is shown in Figure 14:because of their density, cities and large towns will account for 57 per cent of the totalcuts achieved, against 43 per cent in the rest of the UK.

Centre for Cities • Net zero: decarbonising the city • July 2021
34
Figure 14: Cities can help achieve a disproportionate share of emissionscuts needed
Source: BEIS, 2020. Centre for Cities’ own calculations.
Not all places will need to cut emissions at the same pace – nor do they have the potentialto do so. Figure 15 below is based on a calculation of local carbon budgets (Box 10) whichare then translated into an annual target for 2035. It looks at the impact of the changesdiscussed in transport and housing, against the overall cuts needed in each city or largetown.
Figure 15: Not all cities have the same potential to reach emission cuts
Source: BEIS, 2020. Centre for Cities’ own calculations.
In Ipswich and Worthing, these changes in housing and transport could account for abouthalf of the total objective, while in Middlesbrough and Swansea, it is less than 10 per centdue to the current composition of emission sources.
These calculations also confirm which policy levers cities and large towns should prioritise:while London, Cambridge or Bradford will have to put the emphasis on reducing domesticemissions, in Milton Keynes, Aldershot and Northampton (where housing stock is newerbecause of their post-war creation or expansion), tackling transport emissions will becrucial.
36

Centre for Cities • Net zero: decarbonising the city • July 2021
35
Box 10: How are carbon budgets calculated?
Since cumulative emissions from human activity are the main driver of an increasein global average temperatures, the imperative for the decades to come is tocontrol and reduce the amount of carbon emitted into the atmosphere. TheIntergovernmental Panel on Climate Change has estimated that the global totalamount of carbon that can be deposited into the atmosphere between now and2100, with a “likely” chance of staying well below two degrees, in line with the 2015Paris Agreement, is 900 GtCO . This is a carbon budget, which is a measure of thetotal amount of carbon dioxide that can be emitted into the atmosphere by a givendate.
At the national scale, there is not a single carbon budget, as a number of institutionshave calculated their own value for the UK based on a wide range of differentscenarios- such as the likelihood of limiting global warming to 1.5°C, or the relianceon carbon removal technologies. Researchers at the Tyndall Centre for ClimateChange Research have recently developed a local carbon budget tool, using amethod called ‘grandfathering’ which downscales the global carbon budget to a UKbudget and then to local areas based on their respective recent shares in global andnational emissions.
Applying the same method at the scale of the Primary Urban Area can therefore beused to calculate the remaining amount and share of carbon that can be emittedfrom the UK’s 63 largest cities and towns, in line with the Paris Agreementobjectives. The total size of the carbon budget varies from place to place: given itsshare in national emissions, London’s budget is the largest: the capital must staywithin a maximum cumulative budget of 230 MtCO , while in other places likeCambridge and Worthing the total budget is much smaller (less than 5Mt).
This calculation confirms that to remain below their respective budget and help theUK achieve its net zero target, the pace of change needs to accelerate significantly.On their current trajectories, most cities and large towns are set to expend theirtotal budget in fewer than seven years from now.
2
37 38
2

Centre for Cities • Net zero: decarbonising the city • July 2021
36
06How to achieve a fair transition
The transition to a net zero economy presents a number of opportunities. A key tenet ofthe Green Industrial Revolution, now dubbed the ‘Green Recovery’ in the context of theCovid-19 economic crisis, is that up to 250,000 green jobs could be created throughinvestment in a low-carbon future, whether in transport, housing or industry. The retrofitchallenge is a good example. It would help create construction jobs in places that need itmost, and that have been most impacted by the economic shock- cities like Burnley,Blackpool or Bradford (Figure 16).
But successfully shifting towards net zero will require managing and mitigating the risks,especially in carbon-intensive sectors where jobs will either be lost or disrupted. Many ofthese nationally driven policies, whether on the phasing-out of fossil fuels or the furthercleaning of industry are unlikely to affect all places evenly. Looking at the distribution ofjobs in high-emitting sectors such as mining, manufacturing or transportation shows twothings.
While they represent a higher proportion of all jobs in rural areas (16 per cent versus 12per cent in urban areas), most (54 per cent) of these jobs are in cities and large towns,especially in the energy supply and transportation sector.
Second, there are stark differences between cities and large towns, too, and some will bemore impacted than others. With the exception of Crawley, where a third of all jobs are inhigh-emitting industries (with 24,000 jobs in the transportation and storage industry), the10 cities or large towns with the highest proportion of jobs at risk of being lost ordisrupted are in the North and the Midlands (see Figure 16). Some cities with specificindustries are likely to be particularly affected. For example, 36 per cent of all jobs(around 19,000) in mining and quarrying are located in Aberdeen, where a large part ofthe local economy is dependent on the oil and gas extraction industry.
This confirms that not all places have the potential to reach net zero emissions at thesame time. It might take longer in Aberdeen, Burnley and Crawley to cut down emissions,compared to Cambridge or Oxford, and the latter group of places should therefore beexpected to reach net zero emissions sooner.
39

Centre for Cities • Net zero: decarbonising the city • July 2021
37
There are important implications for policy: in the most vulnerable cities and large townswhere a higher share of the local labour market is at risk, moving away from a reliance onfossil fuels and carbon-intensive industries will require appropriate interventions, andsubstantial investment in skills, to help absorb the economic shock. This may involve, inthe short term, providing targeted job support; and in the short to medium term, reskillingand upskilling workers, with a focus on workers whose skills are not immediatelytransferable, to provide them with the necessary tools to find employment in a greenereconomy.
Figure 16: High-emitting industries are not evenly distributed across thecountry
Source: BEIS, 2020; ONS, 2020. Note: the industries defined here as “High-emitting industries” are mining andquarrying, energy production, manufacturing and transportation. Together they account for 57 per cent of carbonemissions.
40
Centre for Cities • Net zero: decarbonising the city • July 2021
38
07Case studies
Whether on the transport or housing front, a number of cities have already implementedinnovative solutions to tap into the benefits of density and reduce their carbon footprint.This section features four case studies from the UK and abroad to help cities tackle theirown net zero challenge.
Case study 1: Climate Innovation District, Leeds
Situated on a former brownfield site on the banks of the River Aire, the Leeds ClimateInnovation District is a good example of a new low-carbon residential development. It hasaround 520 homes that are built with insulated timber panels made in an on-sitemanufacturing plant, to reduce the emissions of each property during construction andwhen occupied. They need far less heating than traditional homes, as they require no gascentral heating system. Electricity is provided by solar panels on the roof, andsupplemented by 100 per cent renewable energy.
The location of the development encourages low-carbon lifestyles. Built at ‘gentle’ densitylevels (with three- or four-storey buildings), it is within walking or cycling distance from thecentre of Leeds. Less than a seven-minute cycle to the station, it is near amenities suchas schools and office space. The development features car-free streets, with only a fewunderground parking spaces provided at an extra cost. This is likely to reduce transportemissions generated by residents.
Researchers from the University of Leeds have designed a tool that assesses the activetravel provision and potential of a range of new residential developments in the UK. Itshows that, while most other developments are still very much car dependent, the highestbus use is within the Climate Innovation District. Around 39 per cent of commutes aremade by walking, cycling or public transport (walking accounts for 37 per cent) andresearchers estimate this could rise to 47 per cent (based on existing travel patterns andworkplace locations).
41

Centre for Cities • Net zero: decarbonising the city • July 2021
39
Image source: Citu, OpenStreetMap
Case study 2: A model from abroad – Freiburg, Germany
Freiburg is a city in southern Germany that is home to just over 230,000 people. It haslong attracted positive press for its sustainable development model.
In the 1970s, when local ‘green’ politics crystallised in opposition to the construction of anuclear power station nearby, Freiburg pedestrianised its city centre and expandedlocal cycling and light rail networks. Throughout the 1980s and 1990s, the city pushedthis sustainable agenda, as the development of local public transport infrastructureintensified and new housing and planning projects began.
Reducing dependence on cars and building on the benefits of density have been central toFreiburg’s approach. This was achieved through a combination of land-use policiesrestricting new development along public transport corridors on land immediatelyadjacent to built-up areas (preventing excessive sprawl) on the one hand, andinterventionist public transport policies on the other. Whereas 39 per cent of all journeyscompleted by residents were in cars in 1982, cars account for only 21 per cent of suchjourneys today. Despite a booming local economy and growing population, average carmileage in the city fell by 7 per cent across all roads and 13 per cent on residentialstreets between 1990 and 2006, and per capita transport-related CO emissionsconcurrently fell by 13 per cent. The city is now known for its extensive public transportsystem – around 70 per cent of the population lives within 500m of a tram stop.
Central to Freiburg’s sustainable image is the Vauban neighbourhood, which wasconstructed in the late 1990s, three kilometres away from the centre of Freiburg and ishome to around 5,500 people. Built on brownfield land using sustainable techniques(such as innovative passive heating, photovoltaics and wastewater management), thedevelopment is made of three- or four-storey buildings, achieving ‘gentle’ density levels.Car ownership is discouraged. Though access for pedestrians and cyclists is protected,roads are discontinuous and parking is limited. In Vauban, car ownership is furtherdiscouraged by low speed limits and parking arrangements that are both inconvenient andexpensive. Consequently, the rate of car ownership is below that of Freiburg as a whole;only 48 per cent of Vauban residents, for example, have access to a car, and many ofthem rely on car-sharing networks. As a result, Vauban’s residents’ carbon footprint is
42
43
244
45
46
47
48
Centre for Cities • Net zero: decarbonising the city • July 2021
40
much lower than elsewhere in the country: on average, residents emit 0.5 tonnes of COannually – a figure far below the German average of 9.4 tonnes.
Case study 3: District heating: using the benefits of density todecarbonise homes
Individual gas boilers are the most popular heating system in the UK today, but districtheating schemes (sometimes called heat networks) are an alternative solution. Boilers arereplaced by a centralised energy supply that redistributes heat to residential andcommercial buildings through insulated pipes underground.
District heating is often seen as the most cost-effective way of cutting emissions frombuildings (it is estimated to reduce primary energy demand in heating and cooling by 50per cent). Economies of scale make it more efficient at generating heat, and it has thepotential to switch to fully renewable energy sources.
It is particularly suited to dense urban environments, as it needs a certain level of demandto be economically viable. If the heat source is low carbon, district heating bringsconsiderable benefits, as it effectively decarbonises multiple homes at once.
A number of UK cities, including Nottingham, Sheffield and Southampton, have alreadyadopted schemes. London recently announced innovative plans for the Bunhill Heat andPower Network, providing heat for more than 1,300 homes using power from the LondonUnderground.
Compared with other countries, the take-up of district heating is quite low in the UK. Only2 per cent of homes are connected to a heat network, unlike in Denmark where it is morethan 60 per cent. In Copenhagen, for instance, more than 95 per cent of heat is providedthrough low-carbon district energy networks, and it emits 40 per cent fewer carbonemissions than individual boilers.
If the UK is to achieve its climate target, take-up of these schemes will need to rise. TheClimate Change Committee recently stated that a fifth of homes would need to beconnected to low-carbon heat networks by 2050, alongside other options like heatpumps.
249

Centre for Cities • Net zero: decarbonising the city • July 2021
41
08What needs to change?
Progress on carbon emissions targets is unlikely to be ‘place blind’. If the UK is to meet itstarget of net zero emissions, then it is likely that cities and large towns will drive thistransition in the next period as they have greater potential for doing this than other areas.Some cities could even be carbon negative, offsetting the emissions that cannot be cutelsewhere. This has important implications in terms of policy.
For the years to come, the priority will be to phase out carbon-intensive activities, toincentivise the take-up of low-carbon solutions and to improve energy efficiency. A largepart of this will be driven by national government interventions: net zero is a nationalpledge, so it is up to the national government to develop plans and deliver the necessarytools and funding to meet that objective. As such, much action on climate change willhappen ‘to’ cities (such as changes in electricity generation) rather than being directlydriven by them.
But in the areas of transport and domestic emissions, there is more direct action to betaken. Alongside national government intervention, local policy-makers have the power tobring about change directly to their local area, through their approach to planning anddiscouraging car usage, for example. But this is currently hampered by a lack of powersand resources, a local government structure that prevents the integration of transportand spatial planning strategy, and a dysfunctional planning system.
The rest of this section summarises what needs to change in cities and large towns if theUK is to achieve net zero emissions by the middle of the century.
1. Spatial planning: devolve more powers at the local level andachieve greater benefits by integrating transport and housingplans
Local governments currently have a number of planning powers that can be used to cutcarbon emissions. They can encourage walking and cycling by pedestrianising roads andrepurposing space that is currently allocated for cars – for instance on-street parking.Publicly owned car parks in cities could be demolished and replaced with residential
Centre for Cities • Net zero: decarbonising the city • July 2021
42
development (either built by the local council or sold to developers) – to disincentivisedrivers and cut carbon through increased density.
But this will not be enough. To fully realise the benefits of density, more structuralchanges need to happen:
a. Changes to governance structures
The current structure of local government does not give mayors and local leaders theinstitutional capacity to deliver the changes needed in transport, housing and spatialplanning policy. This is in part because the powers they have are often fragmented: forexample, the current two-tier system is highly inefficient, as district councils are the localplanning authority and county councils are the local transport authority. This makes itdifficult to coordinate and plan at scale.
This local government fragmentation and the current state of devolution of powers meanthat cities and large towns often have too few levers to pull. They often lack statutorypowers to act. On transport, for instance, cities and large towns today have low levels ofcontrol over the infrastructure, services and funding for public transport. A large majorityof cities have few or no powers over public transport journeys and the revenues it cangenerate. In cities like Birmingham, transport authorities control less than a 10th of allpublic transport commutes, as infrastructure outside the light rail transit system is notcovered by their remit. This in turn has implications on how cities are spatially planned:only the Mayor of London has powers to create a statutory spatial plan that integratestransport and spatial planning. This allows, for instance, the creation of a tool called PublicTransport Accessibility Level, used to optimise residential density according to publictransport provision.
This needs to change. If cities and large towns are to reduce our carbon footprint byplanning more intelligently, powers and resources must be sit with a single authority thatcovers transport and housing so it can plan new developments alongside the existingpublic transport network, and vice-versa. This would involve:
50
In mayoral combined authorities, making organisational changes to move powersdown from Whitehall and up from local authorities, so all mayors have the samestatutory spatial planning powers as the Mayor of London.
1.
Outside of unitary authorities, replacing the two-tier local government system witha single-tier system where powers over transport and planning are joined.
2.

Centre for Cities • Net zero: decarbonising the city • July 2021
43
b. Changes to the UK’s approach to development
Reform of the planning system
In its current state, the discretionary planning system prevents efficient land useoutcomes by making it harder, riskier and therefore costlier for developers to identifyopportunities in existing built-up areas and on brownfield land. Densifying existing built-upareas, often on land that has not been allocated for development in the local plan(‘windfall sites’) is a lengthy and costly process that requires developers to purchase andassemble small plots of land, with no guarantee of planning permission. The result is thatin many cities and large towns, most new residential development occurs where land ischeaper and land ownership is simpler, on the outskirts of cities – often ‘leapfrogging’green areas into car-dependent estates.
Many of these issues could be avoided by a shift towards a flexible zoning system: notonly would it shorten the process and accelerate the construction of new homes (thattend to have a lower carbon footprint because they are more energy efficient), it wouldalso incentivise suburban densification by reducing risk for developers and allowing themto capture value uplift in land closer to city centres. Land would be allocated much moreefficiently as a result. It would be up to local planning authorities to use the zoning systemto locate ‘medium to high’ residential developments near train stations for instance, andprioritise development on inner city brownfield land.
Direct incentives to build on brownfield land
In addition to changes to the planning system, other mechanisms have the potential toincentivise the development on brownfield land. The Brownfield Land Release Fundannounced last December is a welcome initiative, as it allocates £100 million funding tocouncils (and an additional £67 million for the West Midlands and Greater Manchestercombined authorities as part of the Brownfield Fund) to prioritise housing development onpreviously-used land. It should be extended, to allow a maximum number of local councilsto successfully bid for funding to help make brownfield development relatively moreattractive compared to greenfield development.
2. Transport: Move away from car dependency and incentivise thetake up of low-carbon solutions
Emissions from road transport, and cars in particular, are a good example of a negativeexternality: the cost of driving and parking a polluting car is too low compared with theenvironmental costs that are then passed on to society. Drivers lack incentives to switchto cleaner vehicles and other transport modes, and the clean alternatives such as zero-emissions vehicles remain too expensive.
This will involve a number of nationally driven interventions: the Government must deliveron its pledge to phase out petrol and diesel cars by 2030. The upcoming TransportDecarbonisation Plan, delayed until summer 2021, must set out an intermediatemilestone for 2025, as there is a risk that most of the remaining carbon budget that can

Centre for Cities • Net zero: decarbonising the city • July 2021
44
be allocated to car emissions will be used before the ban kicks in. The recent commitmentto £1.3 billion funding for EV charging infrastructure is welcome news, but more must beallocated to help people become less dependent on cars.
Alongside national government intervention, cities should use the powers they have tosupport active travel, encourage public transport use and disincentivise car use. This canbe done by:
Adopting schemes like Clean Air Zones (CAZs) which charge the most pollutingvehicles in the central zone of a city. These are expected to be particularlyeffective at addressing the residual, short car journeys that could easily beswitched to other modes. In London, the CAZ-style scheme introduced twoyears ago, set to be expanded in October 2021, has brought about significant airpollution and carbon emissions reductions. Other schemes like WorkplaceParking Levies and Park and Ride must also be considered.
•
51
52
Using the 2017 Bus Act powers to introduce bus franchising, as GreaterManchester intends to do. This would give city leaders powers to control busroutes, make them more reliable, bring down costs for passengers through asimpler ticketing and fare system, and clean up the fleet. The Government shouldalso extend these powers to other areas outside mayoral combined authorities.
•
Investing in active travel alternatives. This includes making the measures thatwere put in place during the pandemic permanent (such as the pedestrianisationof central areas or pop-up cycle lanes) where they have had a positive impact.
•
Encouraging people to return to public transport and restore confidence inmass transit which may have been eroded by the pandemic, for instance via alarge public awareness campaign.
•
Investing in public transport infrastructure to expand the network. All citiesmust improve the efficiency of their public transport systems, but additionalinfrastructure is needed in particular in already strong and growing city centreswhere systems are already at capacity and journey times are slow, for example inManchester, Birmingham and Leeds. The Transforming Cities Fund goes is awelcome initiative, but in many places further investment will be required. TheNational Infrastructure Commission recommended a £31 billion investment fornew transport infrastructure in cities outside London up to 2040. This should beallocated in priority to large cities like Manchester and Birmingham. This,combined with policies that increase the cost of driving, is likely to reducecongestion, increase the passenger capacity and make journeys faster and morereliable.
•

Centre for Cities • Net zero: decarbonising the city • July 2021
45
3. Existing homes: accelerate the retrofit agenda
A significant proportion of all carbon emissions comes from homes. This means the netzero target is unlikely to be met until most of the 11.3 million inefficient properties areupgraded to EPC band C or above – a challenge that is predominantly in cities.
This will require significant investment from the Government and should include:
Local authorities will also have a role to play: the £500 million Green Homes Grant LocalAuthority Delivery has not been scrapped, and must be used to install low-carbon heatingand retrofit homes with an EPC below E for low-income households. Local planningauthorities can also use building regulations and trading standards to impose higherstandards on energy efficiency and carbon emissions- either at the building design stagebefore homes are granted planning permission, or for properties that are under theirdirect control, such as public buildings and council housing.
Reintroducing the Green Homes Grant scheme, a £2 billion programme whichoffered households grants up to £5,000 (£10,000 for low-income households) toinstall energy efficiency measures in order to cut both energy bills and domesticcarbon emissions. The scheme was scrapped in March 2021, just six monthsafter it was launched, and only about 49,000 efficiency measures have beeninstalled. The main issue was the way the scheme was designed. Short timescales(the budget was meant to be entirely spent between September 2020 and March2021) meant that the industry was not ready to deliver at scale nor willing toinvest given the absence of policy certainty in the long run. The upcoming Heatand Building Strategy needs to establish a clear strategy to decarbonise homes,and address the shortcomings of the Green Homes Grant scheme, by providing along-term, more stable framework.
•
Reforming residential taxes by adjusting property tax to the EPC of the dwellingto reflect its energy consumption. This is because subsidies alone will not beenough to incentivise homeowners to retrofit, as in most cases they will not coverthe full installation costs of the measures needed. Such a ‘green offset’ could alsoprovide more systematic incentives for homeowners to retrofit their property.Other tax measures, including VAT cut on renovation and low-carbon installations,should also be considered.
•
53
Bringing forward the Future Homes Standards regulation (now delayed to2025), in order to ensure new homes are compliant with stricter energy efficiencystandards and will not have to be retrofitted in the future.
•

Centre for Cities • Net zero: decarbonising the city • July 2021
46
Endnotes
In 2018, less than 2 per cent of the UK’s overall emissions were naturally removedfrom the atmosphere. Recent changes to the methodology in the Greenhouse GasInventory including higher estimates of peatland emissions show that the land-use andforestry sector is moving from a net sink to a net source of emissions.
1
At least in terms of a production-based footprint. This does not include emissions fromconsumption of goods or services that have been imported from elsewhere.
2
In 2019, coal accounted for just 2 per cent of UK electricity generation (Source:Carbon Brief, 2020).
3
DfT, 2019.4
Oxford’s low transport emissions are aided by the city’s culture of cycling. This thoughwould be much harder to maintain if Oxford had the same footprint as Telford.
5
See for instance The New Climate Economy Report (2014). Better Growth, BetterClimate.
6
DfT, 2020.7
Centre for Sustainable Systems, 2020.8
Averaged across all cities, 62 per cent of the total housing stock is below EPC band C.This is explored further in the next section of the report.
9
The presence of steel and chemical industries affects Swansea and Middlesbrough’sproduction-based carbon footprint, but it is likely that the scale would be different on aconsumption-based footprint, if, for instance, goods and materials produced inSwansea but consumed in London were included in the latter’s total footprint.
10
UN World Population Prospects, 2019.https://statisticstimes.com/demographics/countries-by-population-density.php
11
See, for instance, Glaeser, E., Kahn, M. (2003), Sprawl and urban growth, NationalBureau of Economic Research.
12
Campaign for Better Transport (2014), car dependency scorecard.13
This is the case in London. Research published in 2020 by the Centre for London hasshown that recent housing developments have increased car dependency instead ofreducing it. They are more likely than pre-existing housing to feature car parking, andas a result the new residents are more likely to use their car on a daily basis. Inaddition to ‘pro-car’ principles, such as minimum parking requirements, part of theproblem is the length and arbitrary nature of the planning system, and the fact thatmany development decisions do not take into account residents’ future travel choices.An example of that is the Battersea Power Station development, which was givenpermission in 2013 with higher car parking requirements than recommended, despitebeing located near the future extension of the Northern line. See: Centre for London(2020). Building for a new urban mobility.
14

Centre for Cities • Net zero: decarbonising the city • July 2021
47
See Swinney,P. and Sivaev,D. (2013) Beyond the High Street. Why our city centresreally matter, London: Centre for Cities.
15
Census, 2011.16
Serwicka I and Swinney P (2016): Trading places: Why firms locate where they do,London: Centre for Cities
17
See Breach, A (2019), Sleepy Suburbs, London: Centre for Cities.18
The modelling uses density (defined as the ratio between population and size of thebuilt-up area) and transport emissions, controlled by the following variables: citycentre density, average distance to work and public transport accessibility.
19
This is echoed in a number of existing research. In a US study, Glaeser and Kahn(2003) have found that “holding family income and size constant, gas consumptionper family per year declines by 106 gallons as the number of residents per squaremile doubles” (Glaeser, E. and Kahn,M (2003). Sprawl and Urban Growth. Handbookof Regional and Urban Economics).
20
For instance, Glaeser (2003) found that in metropolitan areas like New York, theaverage urban family consumes more than 300 fewer gallons of gas per year thantheir suburban counterparts. Glaeser, E. and Kahn,M (2003). Sprawl and UrbanGrowth. Handbook of Regional and Urban Economics
21
CO emissions estimates are based on standardised assumptions about dwellingoccupancy and energy use.
22 2
NHBC (2021), New Home Statistics Review.23
Averaged across all cities, 63 per cent of people commute by car – this ranges from34 per cent in cities like London and Cambridge to 76 per cent in Telford andSwansea. In the latter group of cities, average distances to work are also longer(Source: Census, 2011). The patterns are unlikely to have changed drastically inrecent years, according to bus ridership data and traffic levels in cities.
24
In order to estimate the potential cuts in emissions from all car-journeys, the valueshave been extrapolated based on the share that commutes and business tripsrepresent out of all car journeys, around 35 per cent (DfT, 2020).
25
Enenkel, K. and Quinio, V., 2019, Cities Outlook, London: Centre for Cities.26
Centre for London (2020), Reclaim the kerb, The future of parking and kerbmanagement.
27
See for instance RTPI (2021), Net Zero Transport, The role of spatial planning andplace-based solutions. See also www.globalactionplan.org.uk/news/remote-working-vital-post-lockdown-to-keep-air-pollution-lowwith-87of-workers-wanting-to-continue-to-do-so
28
Barton C. and Garton-Grimwood G. (2018) Housing targets: Can we predict futureneed? House of Commons Library Analysis, 2 October 2018.
29

Centre for Cities • Net zero: decarbonising the city • July 2021
48
Climate Change Committee (2019). UK housing fit for the future.30
Despite being the best available data on housing energy-efficiency, EPCs are animperfect measure. As not all properties have an EPC, this is likely to be an under-estimate of the total number of dwellings that need retrofitting.
31
EPC Domestic Register, 2019.32
The problem is that the cost of investment for retrofit measures is often too high to beoffset by savings on energy bills. This will need to be addressed.
33
This is echoed in a number of US-based research, where benefits of density are evenmore pronounced. For instance, Glaeser shows: “The average single-family detachedhome consumes 88 per cent more electricity than the average apartment in a five-or-more-units building. The average suburban household consumes 27 per cent lesselectricity than the average urban household”. The difference in scale may beexplained by the fact that many UK dense, central urban areas have older, poorly-efficient housing which tends to distort the impact of density. See Glaeser, E., Kahn,M. (2003). Sprawl and urban growth. National Bureau of Economic Research.
34
The model used is the following: Domestic CO = BUA density + dwelling area percapita + % of dwellings below C
35 2
In Swansea and Middlesbrough, industry accounts for a respective share of 83 percent and 74 per cent of carbon emissions.
36
Following the methodology used in the Carbon Budget Tool, the total carbon budgetfor the UK used here is 2,239 Mt CO .
37
2
See https://carbonbudget.manchester.ac.uk/38
See for instance IPPR (2020), Net Zero North Sea: a managed transition for oil andgas in Scotland and the UK after Covid-19.
39
This is the focus of the North Sea Transition Deal which aims at helping the oil and gasindustry decarbonise while protecting jobs and supporting the green transition in theindustry, for instance towards hydrogen production or Carbon Capture and Storage.
40
See more at https://actdev.cyipt.bike/lcid/buildings,jts/#13.05/53.7942/-1.5417841
Talmage, C., et al. (2018), ‘Measuring Neighborhood Quality of Life: Placed-BasedSustainability Indicators in Freiburg, Germany’, Urban Science, 2/4, p. 5.
42
Buehler and Pucher, ‘Sustainable Transport in Freiburg’, p. 52. When it was created,the pedestrianised zone was the largest in Germany.
43
Buehler, R. and Pucher, J. (2011), Sustainable Transport in Freiburg: Lessons fromGermany’s Environmental Capital, International Journal of Sustainable Transportation,5/1, p. 51.
44
Talmage, Measuring Neighborhood Quality of Life, p. 6.45
Friends of the Earth (2019), Planning for less car use.The density of the Vaubanneighbourhood is some 95 dwellings per hectare – far above even the most densely
46

Centre for Cities • Net zero: decarbonising the city • July 2021
49
populated London boroughs.
Hamiduddin, I. (2015), Social sustainability, residential design and demographicbalance: neighbourhood planning strategies in Freiburg, Germany, Town PlanningReview, 86/1, p. 41.
47
Ibid., p. 42.48
Ritchie, H. and Roser, M. (2020), CO and Greenhouse Gas Emissions, Our World inData.
49 2
Jeffrey, S. and Enenkel, K. (2019), Getting moving, London, Centre for Cities.50
In England, a quarter of all car journeys are under one mile, with an extra 18 per centbetween one and two miles (DfT, 2020).
51
Evaluation of the Ultra-Low-Emission-Zone (ULEZ) in London shows that in just twoyears, nitrogen dioxide levels fell by 37 per cent and carbon emissions by 6 per centcompared to a scenario where there was no ULEZ.
52
As recently suggested in their report- see Cheshire, P. and Hilber, C. (2021),HomeTruths. Options for reforming residential property taxes in England.
53

© Centre for Cities 2021
Centre for Cities9 Holyrood StreetSecond FloorLondon SE1 2EL
www.centreforcities.org
Centre for Cities is a registered charity (No 1119841) and a companylimited by guarantee registered in England (No 6215397)