Photosynthesis Lab Patterns and Net Primary Production in ...
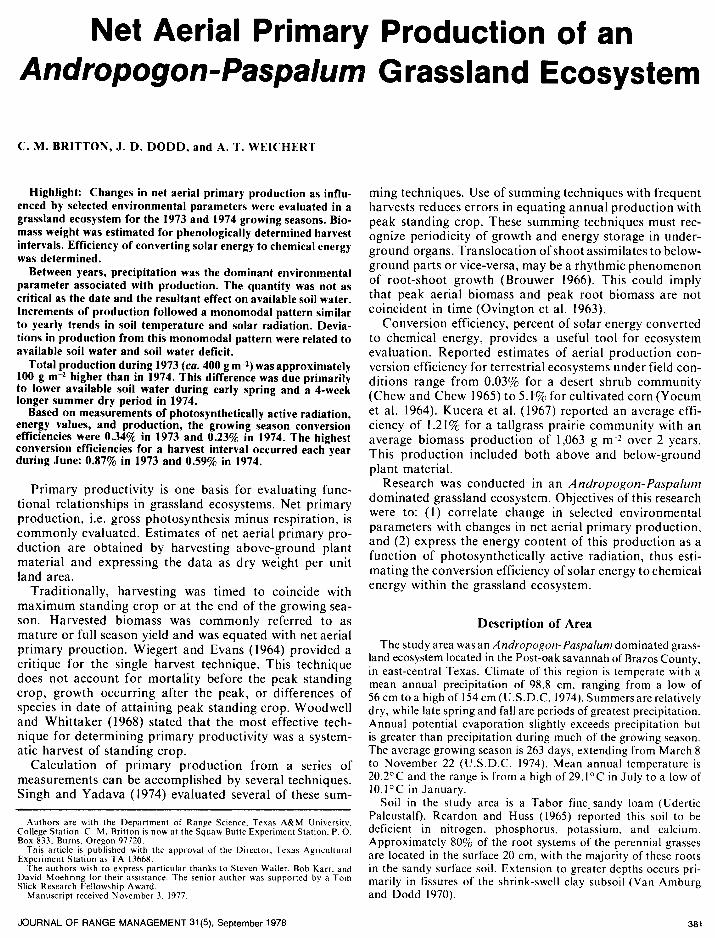
Net Aerial Primary Production of an Andropogon-Paspalum Grassland Ecosystem
C. M. BRITTON, J. D. DODD, and A. T. WEICHERT
Highlight: Changes in net aerial primary production as influ- enced by selected environmental parameters were evaluated in a grassland ecosystem for the 1973 and 1974 growing seasons. Bio- mass weight was estimated for phenologically determined harvest intervals. Efficiency of converting solar energy to chemical energy was determined.
Between years, precipitation was the dominant environmental parameter associated with production. The quantity was not as critical as the date and the resultant effect on available soil water. Increments of production followed a monomodal pattern similar to yearly trends in soil temperature and solar radiation. Devia- tions in production from this monomodal pattern were related to available soil water and soil water deficit.
Total production during 1973 (ca. 400 g m-2) was approximately 100 g m-2 higher than in 1974. This difference was due primarily to lower available soil water during early spring and a 4-week longer summer dry period in 1974.
Based on measurements of photosynthetically active radiation, energy values, and production, the growing season conversion efficiencies were 0.34% in 1973 and 0.23% in 1974. The highest conversion efficiencies for a harvest interval occurred each year during June: 0.87% in 1973 and 0.59% in 1974.
Primary productivity is one basis for evaluating func- tional relationships in grassland ecosystems. Net primary production, i.e. gross photosynthesis minus respiration, is commonly evaluated. Estimates of net aerial primary pro- duction are obtained by harvesting above-ground plant material and expressing the data as dry weight per unit land area.
Traditionally, harvesting was timed to coincide with maximum standing crop or at the end of the growing sea- son. Harvested biomass was commonly referred to as mature or full season yield and was equated with net aerial primary prouction. Wiegert and Evans (1964) provided a critique for the single harvest technique. This technique does not account for mortality before the peak standing crop, growth occurring after the peak, or differences of species in date of attaining peak standing crop. Woodwell and Whittaker (1968) stated that the most effective tech- nique for determining primary productivity was a system- atic harvest of standing crop.
Calculation of primary production from a series of measurements can be accomplished by several techniques. Singh and Yadava (1974) evaluated several of these sum-
Authors are with the Department of Range Science. Texas A&M University, College Station. C. M. Britton is now at the Squaw Butte Experiment Station, P. 0. Box 833. Burns. Oregon 97720.
This article is published with the approval of the Director, Texas Agricultural Experiment Station as TA 13668.
The authors wish to express particular thanks to Steven Wailer. Bob Karr. and David Moehring for their assistance. The senior author was supported by a Tom Slick Research Fellowship Award.
Manuscript received November 3. 1977.
ming techniques. Use of summing techniques with frequent harvests reduces errors in equating annual production with peak standing crop. These summing techniques must rec- ognize periodicity of growth and energy storage in under- ground organs. Translocation of shoot assimilates to below- ground parts or vice-versa, may be a rhythmic phenomenon of root-shoot growth (Brouwer 1966). This could imply that peak aerial biomass and peak root biomass are not coincident in time (Ovington et al. 1963).
Conversion efficiency, percent of solar energy converted to chemical energy, provides a useful tool for ecosystem evaluation. Reported estimates of aerial production con- version efficiency for terrestrial ecosystems under field con- ditions range from 0.03% for a desert shrub community (Chew and Chew 1965) to 5.1% for cultivated corn (Yocum et al. 1964). Kucera et al. (1967) reported an average effi- ciency of 1.21% for a tallgrass prairie community with an average biomass production of 1,063 g m-2 over 2 years. This production included both above and below-ground plant material.
Research was conducted in an Andropogon- Paspalum dominated grassland ecosystem. Objectives of this research were to: (1) correlate change in selected environmental parameters with changes in net aerial primary production, and (2) express the energy content of this production as a function of photosynthetically active radiation, thus esti- mating the conversion efficiency of solar energy to chemical energy within the grassland ecosystem.
Description of Area
The study area was an Andropogon- Paspalum dominated grass- land ecosystem located in the Post-oak Savannah of Brazes County,
in east-central Texas. Climate of this region is temperate with a mean annual precipitation of 98.8 cm, ranging from a low of 56 cm to a high of 154 cm (U.S.D.C. 1974). Summersare relatively dry, while late spring and fall are periods of greatest precipitation. Annual potential evaporation slightly exceeds precipitation but is greater than precipitation during much of the growing season. The average growing season is 263 days, extending from March 8 to November 22 (U.S.D.C. 1974). Mean annual temperature is 20.2”C and the range is from a high of 29. I “C in July to a low of 10.1 “C in January.
Soil in the study area is a Tabor fine. sandy loam (Udertic Paleustalf). Reardon and Huss (1965) reported this soil to be deficient in nitrogen, phosphorus, potassium, and calcium. Approximately 80% of the root systems of the perennial grasses are located in the surface 20 cm, with the majority of these roots in the sandy surface soil. Extension to greater depths occurs pri- marily in fissures of the shrink-swell clay subsoil (Van Amburg and Dodd 1970).
JOURNAL OF RANGE MANAGEMENT 81(s), September 1978 381
The area has not been grazed by domestic livestock for over 20 years. Thus, herbivore utilization has been confined to inter- mittent insect, rodent, and deer grazing. Vegetation is dominated by perennial grasses. Little bluestem (Andropogon scoparius Michx.) has a basal cover of 2.5%, splitbeard bluestem (’ Andro- pogon ternarius Michx.) 1.9%, and brownseed paspalum (Pas- pa/urn plicatulum Michx.) 1.0%. Other species appear in trace quantities. Interstitial grasses are usually annuals and consist pri- marily of species of Aristida and Panicum. Forbs (primarily Liatrus mucronata DC., Liatrus squarrosa L., and Boltonia difl
,fusa Ell.) and sedges (Carex spp.) are important during certain portions of the year.
Methods and Materials
Correlation of net aerial primary production with selected environmental parameters was evaluated by measuring changes in dry weight of aerial biomass. Continuous monitoring of selected environmental parameters was utilized in the Andropogon- Paspalum dominated grassland ecosystem. The study area, ap- proximately 1 ha in size, was divided into 102 marked, 3 m x 6 m plots with access alleys between plots.
Harvest of aerial biomass (green biomass and standing litter) and ground litter coincided with equivalent phenological events between years. Harvests were made seven times during 1973 and six times during 1974. Based on selected phenological events, the growing season of 1973 was initiated during the last week of March and terminated the first week of December. In contrast, the growing season started during the second week of March and ended during the last week of November in 1974.
Harvests of plant biomass consisted of clipping vegetation from ten, 0.5 m* rectangular quadrats in each of 3 randomly selected plots at each harvest date. Vegetation was clipped approx- imately 1 cm above the soil surface. Green biomass was separated by species and species groups. The separations were: (1) split- beard bluestem, (2) little bluestem, (3) brownseed paspalum, (4) panicums, (5) interstitial grasses, (6) forbs, and (7) sedges. Dead vegetation was separated into standing litter and ground litter. All vegetation samples were dried at 80°C for 48 hours and weighed to the nearest 0.1 g. Biomass weight was expressed as g m:*.
Selected environmental parameters were measured from March 28, 1973, to November 30, 1974. Measured parameters included precipitation, soil moisture, evaporation, wind movement, air temperature, relative humidity, soil temperature, shortwave irradi- ante (SI), and photosynthetically active radiation (PAR) (Britton 1975). Available soil water (15-bar) and soil moisture deficit were calculated from a modified computer program (Zahner and Stage 1966). All parameters were measured on a continuous basis except soil moisture which was measured gravimetrically every 7 days at 6 depths to 75 cm. Also, evaporation was not measured when temperatures were below freezing.
Mean values for all environmental parameters were calculated for each harvest interval through both growing seasons. These mean values were used in correlation and regression analyses with measured values of green biomass and calculated values of net aerial production and net aerial production rate for coinciding harvest intervals. Stepwise regression techniques were used to develop descriptive equations for green biomass and net aerial production (Draper and Smith 1966). Calculated net aerial pro- duction was estimated by evaluating biomass weight changes of the green biomass, standing litter, and ground litter by a method similar to that described by Wiegert and Evans (1964). Conver- sion efficiency was calculated from measurements of solar energy and energy value of plant materials making up the net aerial pro- duction (Britton et al. 1976). Conversion efficiencies were calcu- lated for each harvest interval and both growing seasons and expressed as a percent of the shortwave irradiance and photo- synthetically active radiation received in the specified time interval.
Results
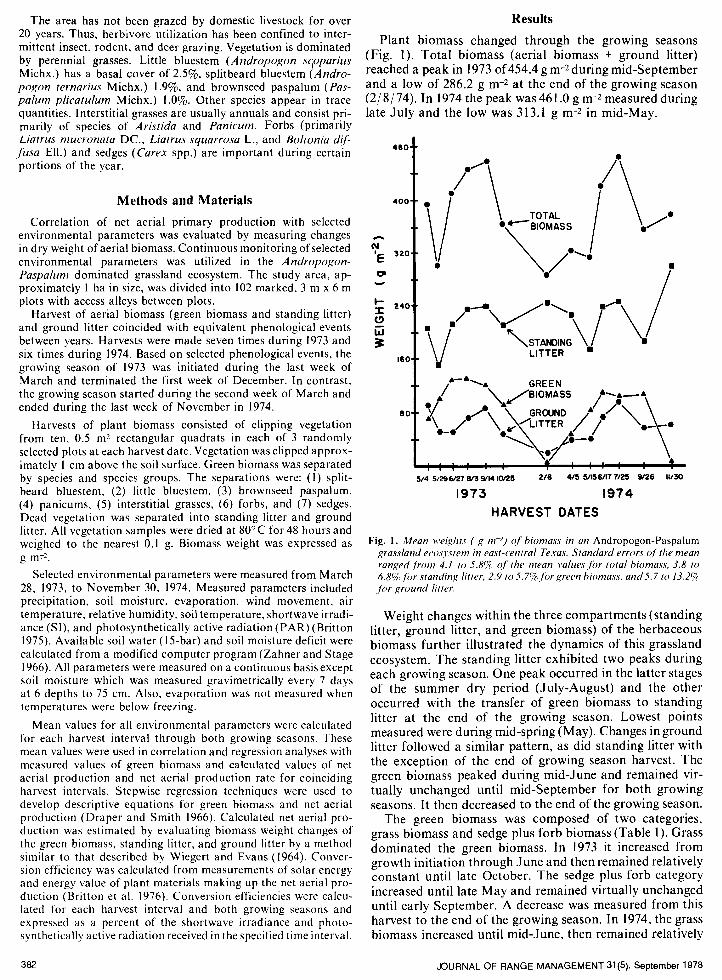
Plant biomass changed through the growing seasons (Fig. 1). Total biomass (aerial biomass + ground litter) reached a peak in 1973 of 454.4 g m-2during mid-September and a low of 286.2 g m-2 at the end of the growing season (2/ 8/ 74). In 1974 the peak was 461 .O g m-2 measured during late July and the low was 313.1 g m-2 in mid-May.
; 240..
a
i3 n
,,m+m\m/m’m l ‘m
3
:: \I
\ \I \I STANDING l l
160 LITTER
60:: :$;;:+;679
a.,. . . A 1.11 1 4 II,. - 8
s/4 926 6n7 #3 604 IO/25 2/6 4/6 M166A77/25 926 II/30
1973 1974
HARVEST DATES
Fig. 1. Mean M’eigl1t.F ( g m-2) of biomass in an Andropogon-Paspalum passland ecws!‘stem in east-central Texas. Standard errors of’ the mean ranged,fkm 4.1 to 5.8Y~ of the mean values.fi)r total biomass, 3.8 to 6.8yc,fbr standing litter, 2.9 to .5.7Yc,forgreen biomass, and-Y.7 to 13.2g .fbr ground litter.
Weight changes within the three compartments (standing litter, ground litter, and green biomass) of the herbaceous biomass further illustrated the dynamics of this grassland ecosystem. The standing litter exhibited two peaks during each growing season. One peak occurred in the latter stages of the summer dry period (July-August) and the other occurred with the transfer of green biomass to standing litter at the end of the growing season. Lowest points measured were during mid-spring (May). Changes in ground litter followed a similar pattern, as did standing litter with the exception of the end of growing season harvest. The green biomass peaked during mid-June and remained vir- tually unchanged until mid-September for both growing seasons. It then decreased to the end of the growing season.
The green biomass was composed of two categories, grass biomass and sedge plus forb biomass (Table 1). Grass dominated the green biomass. In 1973 it increased from growth initiation through June and then remained relatively constant until late October. The sedge plus forb category increased until late May and remained virtually unchanged until early September. A decrease was measured from this harvest to the end of the growing season. In 1974, the grass biomass increased until mid-June, then remained relatively
382 JOURNAL OF RANGE MANAGEMENT 31(S), September 1978

Table 1. Composition of green biomass by weight (g m *) with standard error of mean (SE) for grass biomass and sedge plus forb biomass in an A ndropogon-Paspalum grassland ecosystem in east-central Texas for the growing seasons of 1973 and 1974.
Harvest dates
Grass biomass SE
Sedge plus forb biomass SE
514173 54.9 2.4 16.2 2.0 5129173 59.7 2.5 38.6 4.1 6127173 97.4 3.8 32.3 2.7 g/3/73 93.3 5.3 36.8 2.1 s/14/73 99.8 5.4 19.5 1.7 10/25/73 90.9 4.3 9.6 2.5 2/8/74a 235.1 12.5 10.0 2.9 415174 33.6 1.9 12.6 1.1 s/15/74 59.5 3.8 21.2 2.2 6/ 17174 78.4 3.6 30.6 2.4 7125174 72.5 4.6 30.3 2.8 9126174 88.9 4.0 16.0 1.8 11/30/74a 190.9 10.4 8.1 1.5
aEnd of growing season harvest which included all standing biomass.
constant until a peak in late September. The sedge plus forb biomass followed the same trend as in 1973. However, quantities were less and the peak was reached later than in 1973.
Separation of the green biomass into species and species groups permitted evaluation of the contribution of each to the total green biomass by harvest dates (Table 2). Over both growing seasons, brownseed paspalum contributed more to the green biomass (34.5%) than any other species or species group. Other dominant grasses, such as little bluestem (18.2%) and splitbeard bluestem (15.0%) con- tributed lesser amounts. In other categories, forbs (15.0%) were the most important component, with panicum (6.6%) and sedges (6.1%) of about equal importance. Interstitial grasses (4.6%) contributed the least. The highest contri- bution at any harvest date was brownseed paspalum (44.7%) during mid-September 1973, and the lowest was sedges (0.7%) during late October 1973.
Changes in green biomass weight followed the same trend during both growing seasons (Fig. 1). Green biomass increased during spring to a maximum in summer followed by a decline during fall. This monomodal pattern within a growing season was also apparent in environmental param eters especially soil temperature, air temperature, irradi-
Table 2. Percent composition by weight of species and species group? ecosystem in east-central Texas during 1973 and 1974.
ance, and evaporation. Therefore, changes in green biomass were highly related and in phase with these cyclic environ- mental parameters. The highest correlation (r = 0.92) was with the mean maximum daily soil temperature measured at a 15 cm depth. Changes in green biomass weight were poorly correlated with precipitation (r = -0.16) and mod- erately correlated with mean soil water deficit (r = 0.53).
The best one variable equation relating environment to changes in green biomass was maximum soil temperatures measured at 15 cm (Table 3). This parameter accounted for 85% of the variation in green biomass. When soil water deficit was included, the equation accounted for 96% of the variation.
Table 3. Equations relating changes in green biomass (GB) in g m * with environmental parameters for the growing seasons of 1973 and 1974 (end of growing season harvests excluded) in east-central Texas.
Relationship RJ Prob>F SD
GB = -18.43 + 4.43 STMAa 0.85 0.0002 10.19 GB q -56.47 + 6.41 STMA ~ 2.15 SWDb 0.96 o.oocn 5.94
aSTMA q Maximum soil temperature (“C). bSWD q Soil water deficit (cm).
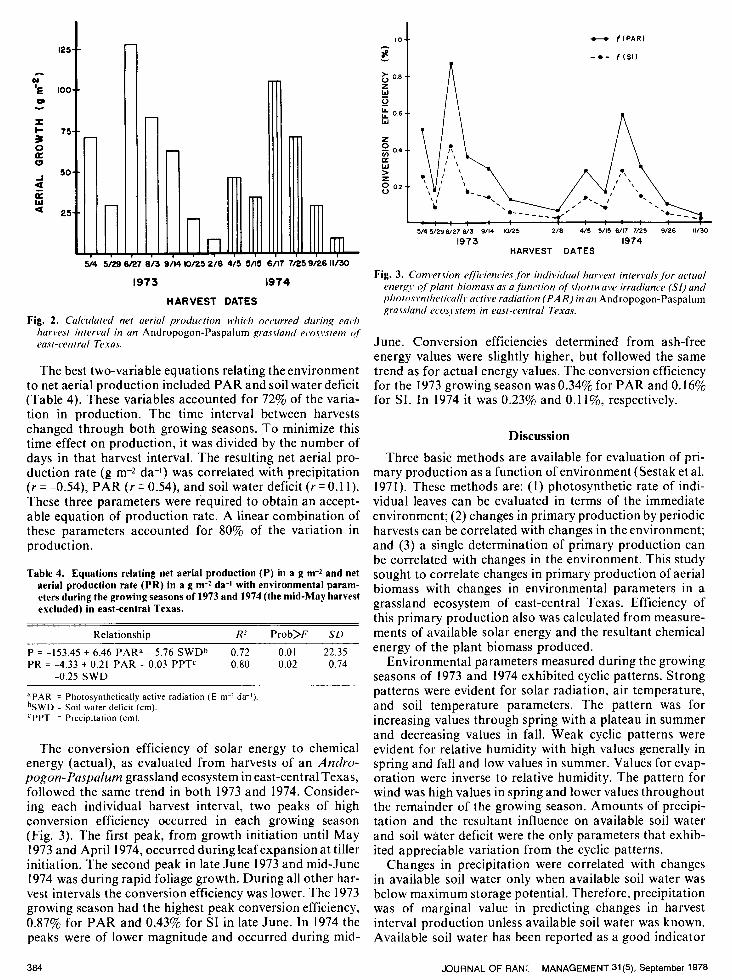
Net aerial production (g m-2) was calculated by evaluat- ing weight changes and transfers (green biomass to standing litter to ground litter) in the aerial biomass (Fig. 2). In 1973, maximum production for a harvest interval was 127.8 g m-2 measured in late June, while in 1974 peak pro- duction occurred in mid-June with 105.2 g m-2. The mid- to late May production showed a decrease from the earlier harvest. This decrease was followed by an increase to the peak and decreases to the end of the season. Total net aerial production from the 1973 season was 403.4 g m-2, while in 1974 it was 295.2 g m-2.
Changes in net aerial production were correlated with PAR (Y = 0.67), available soil water (Y = 0.5 l), and precipi- tation (Y q -0.57). The mid-May or late May harvest of each growing season produced a distinct departure from the trend in weight changes of production (Fig. 2). Changes in production of aerial biomass could not be related to the environment, and this harvest in each year was not used in the regression analyses.
i contributing to the green biomass of an Andropogon-Paspalum grassland
Harvest Splitbeard Little Brownseed bluestem bluestem paspalum
5/4/73 17.9 23.3 20.6 5129173 17.5 11.5 24.2 6127173 13.4 12.7 39.0 g/3/73 9.7 II.0 41.8 s/14/73 6.5 24.1 44.7 10/25/73 23.3 23.5 33.4 2/8/74a 21.3 21.3 44.7
Mean 15.7 18.2 35.5 415174 14.7 14.2 32.3 5/ 15174 16.1 25.6 16.8 6117174 7.7 13.0 39.1 7125174 6.2 15.8 37.1 9126174 13.3 20.1 33.0 11/30/74a 26.6 21 .o 42.4
Mean 14.1 18.3 33.4 Mean Overall 15.0 18.2 34.5
“End of growing season harvest which included all standing biomass.
Panicum
11.3 5.4 7.7 4.8 5.3 5.5 4.4 6.3 5.1
12.2 7.9 4.9 7.7 3.4 6.9 6.6
Interstitial grasses
4.1 2.2 2.6 4.3 3.1 4.8 4.2 3.6 6.4 3.2 4.2 6.5 10.6 3.9 5.8
4.6
Forbs Sedges
16.8 6.0 27.6 Il.6 16.4 8.2 21.8 6.6 14.1 2.2 8.8 0.7 3.2 0.9
15.5 5.2 13.6 13.7 15.6 10.5 22. I 6.0 23.3 6.2
9.6 5.7 1.8 0.9
14.3 7.2 15.0 6.1
JOURNAL OF RANGE MANAGEMENT 31(S), September 1978 383
125
i 50
% 25
- f(PAR)
LP- 5/4 5/2S 6/27 0/3 S/14 IO/25 2/0 4/5 5/15 6/17 7/25 S/26 IV30
1973 1974
HARVEST DATES
Fig. 2. Calculated net aerial production which occurred during each harvest interval in an Andropogon-Paspalum grassland eco.~.\~stem of east-central Texas.
The best two-variable equations relating the environment to net aerial production included PAR and soil water deficit (Table 4). These variables accounted for 72% of the varia- tion in production. The time interval between harvests changed through both growing seasons. To minimize this time effect on production, it was divided by the number of days in that harvest interval. The resulting net aerial pro- duction rate (g m-2 da-i) was correlated with precipitation (r = -0.54), PAR (Y = 0.54), and soil water deficit (r = 0.11). These three parameters were required to obtain an accept- able equation of production rate. A linear combination of these parameters accounted for 80% of the variation in production.
Table 4. Equations relating net aerial production (P) in a g m-2 and net aerial production rate (PR) in a g m-2 da-1 with environmental param- eters during the growing seasons of 1973 and 1974 (the mid-May harvest excluded) in east-central Texas.
Relationship R’ Prob>F SD
P = -153.45 + 6.46 PARa - 5.76 SWDb 0.72 0.01 22.35 PR = -4.33 + 0.21 PAR - 0.03 PPTc 0.80 0.02 0.74
-0.25 SWD
“PAR = Photosynthetically active radiation (E m-2 da-l). bSWD = Soil water deficit (cm). ’ PPT q Precipitation (cm).
The conversion efficiency of solar energy to chemical energy (actual), as evaluated from harvests of an Andro- pogon- Paspalum grassland ecosystem in east-central Texas, followed the same trend in both 1973 and 1974. Consider- ing each individual harvest interval, two peaks of high conversion efficiency occurred in each growing season (Fig. 3). The first peak, from growth initiation until May 1973 and April 1974, occurred during leaf expansion at tiller initiation. The second peak in late June 1973 and mid-June 1974 was during rapid foliage growth. During all other har- vest intervals the conversion efficiency was lower. The 1973 growing season had the highest peak conversion efficiency, 0.87% for PAR and 0.43% for SI in late June. In 1974 the peaks were of lower magnitude and occurred during mid-
514 5/29 6/27 8/3 9114 lW25 210 4/5 5/15 6117 7125 9/26 IV30
1973 1974 HARVEST DATES
Fig. 3. Conversion qfficiencies ,fur individual harvest intervals.fbr actual energy qf’plant biomass as a.firnction qf’shorrcrvave irradiance (Si) and photos,~ntheti~al~~, active radiation (PAR) in an Andropogon-Paspalum grassland ecosj’stem in east-central Texas.
June. Conversion efficiencies determined from ash-free energy values were slightly higher, but followed the same trend as for actual energy values. The conversion efficiency for the 1973 growing season was 0.34% for PAR and 0.16% for SI. In 1974 it was 0.23% and 0.1 l%, respectively.
Discussion
Three basic methods are available for evaluation of pri- mary production as a function of environment (Sestak et al. 1971). These methods are: (1) photosynthetic rate of indi- vidual leaves can be evaluated in terms of the immediate environment; (2) changes in primary production by periodic harvests can be correlated with changes in the environment; and (3) a single determination of primary production can be correlated with changes in the environment. This study sought to correlate changes in primary production of aerial biomass with changes in environmental parameters in a grassland ecosystem of east-central Texas. Efficiency of this primary production also was calculated from measure- ments of available solar energy and the resultant chemical energy of the plant biomass produced.
Environmental parameters measured during the growing seasons of 1973 and 1974 exhibited cyclic patterns. Strong patterns were evident for solar radiation, air temperature, and soil temperature parameters. The pattern was for increasing values through spring with a plateau in summer and decreasing values in fall. Weak cyclic patterns were evident for relative humidity with high values generally in spring and fall and low values in summer. Values for evap- oration were inverse to relative humidity. The pattern for wind was high values in spring and lower values throughout the remainder of the growing season. Amounts of precipi- tation and the resultant influence on available soil water and soil water deficit were the only parameters that exhib- ited appreciable variation from the cyclic patterns.
Changes in precipitation were correlated with changes in available soil water only when available soil water was below maximum storage potential. Therefore, precipitation was of marginal value in predicting changes in harvest interval production unless available soil water was known. Available soil water has been reported as a good indicator
384 JOURNAL OF RANC MANAGEMENT 31(S), September 1978

of primary production (Dahl 1963; Baier and Robertson 1968).
Patterns of total biomass (aerial biomass and ground litter) were similar for both growing seasons. Although available soil water from growth initiation to peak total biomass was lower in 1974, a slightly higher peak occurred than in 1973. This higher peak probably resulted from a lower transfer rate of standing litter to ground litter and ground litter to soil organic matter. Transfer rates appeared more rapid with increased precipitation. Precipitation mechanically transfers standing litter to ground litter and also improves the environment for detritus breakdown (McCalla 1944; Wiegert and Evans 1964).
Green biomass weight attained and maintained a higher peak during 1973 than 1974. This was related to the higher available soil water and lower soil water deficit from April to mid-June. Changes in green biomass weight were closely correlated with cyclic changes in soil temperature. In con- trast, a linear combination of monthly temperature, relative humidity, and solar radiation accounted for over 77% of the variation in green biomass, expressed as kcal m-2, in a tropical grassland (Singh and Yadava 1974). Relative changes in green biomass were similar to those reported by Wiegert and Evans (1964) in an old-field ecosystem and Singh and Yadava (1974) in a tropical grassland.
Percent composition by weight of species and species groups in the green biomass illustrated seasonal changes. Contribution of dominant grasses, such as splitbeard blue- stem, little bluestem, and brownseed paspalum, alternated within a growing season. Contributions by little bluestem and splitbeard bluestem were largest early and late in the growing seasons. Brownseed paspalum made the largest contribution during the middle. In contrast, panicums and sedges occurred early in the growing seasons, while forbs were important during the middle. Interstitial grasses con- tributed about the same quantity throughout the growing seasons.
Net aerial production followed similar trends in both seasons. Phenological events used to determine harvest dates occurred approximately 3 weeks earlier in 1974 than in 1973. In both years production from initiation to July 1 accounted for over 60% of the total. During this period in 1974, cumulative soil water deficit was 3-fold higher than in 1973 and production decreased approximately 40 g m-2. The longer summer dry period (1974) resulted in two little bluestem phenological events (soft dough and seed shatter) to occur so rapidly that only one harvest could be made. Production during the 1973 summer dry period was slightly higher than in 1974, probably due to more available soil water.
In 1974, cumulative soil water deficit was high during the early growing season, resulting in summer dormancy of some plants. Summer dormancy was not apparent during 1973, and growth was continuous throughout the season. Fall production was approximately 3-fold greater in 1973 than 1974. This difference was due primarily to continued growth of brownseed paspalum and forbs in 1973. In con- trast, fall growth in 1974 was limited primarily to tiller initiation by splitbeard bluestem and interstitial grass seedling establishment. Production appeared to be gov- erned, directly and indirectly, by duration of soil water deficit. It may have been directly affected by reduction of photosynthetic rate (Levitt 1972). An indirect effect may have been that carbohydrate reserves were depleted during
the longer summer drought of 1974. Therefore, in fall 1974 carbohydrate storage might have taken priority over aerial biomass production. This trend has been noted in other grass species by McCarty (1935).
Equations- relating the environment to net aerial pro- duction indicated that some cyclic parameter, such as PAR, must be included to account for the monomodal pattern of production. Deviations from this pattern were related to soil water deficit: as it increased, production decreased. Net aerial production was negatively related to available soil water, indicating that it was utilized for growth. Pro- duction during mid-May appeared to be diminished by photosynthate transfer to underground organs. Smith (1969) documented this transfer by little bluestem in east- central Texas.
Production and production rate reacted similarly to the environment. The mean daily rate in 1973 was approxi- mately 1.5 g m-2 da-i while in 1974 it was 1.1 g m-2 da-i. This was comparable to 1.8 g m-2 da-i observed by Kelly et al. (1969) for an Andropogon ecosystem in Tennessee. How- ever, it was considerably below the 6.0 g m-* da-i measured in a tropical grassland (Singh and Yadava 1974).
The 1973 conversion efficiency (0.34%) was approxi- mately 1.5 fold greater than the 1974 (0.2370). This differ- ence between the two growing seasons was greater than the 1.3 fold difference observed in net aerial production and was due primarily to the greater amount of solar energy available during 1974. These conversion efficiencies were low when compared to a tropical grassland, 1.13% (Singh and Yadava 1974) and an old-field, 1.10% (Golley 1960).
Conversion efficiencies for individual harvest intervals indicated the complex plant-environment relationship. From growth initiation to full leaf expansion of dominant grasses, conversion efficiencies were high and probably more related to utilization of carbohydrate reserves than the environment. This was followed by a period (mid- to late May) of low conversion efficiency, reflecting photo- synthate transfer to below-ground organs. Evidence for this transfer was: (1) changes in green biomass and incre- ments of production were small, indicating that photo- synthates were either not produced or were transferred to below-grou nd organs; and (2) energy val ues of green bio- mass were low when compared to those of other ha rvest intervals.
Vegetation response was greatest in the time interval between completion of spring growth and the summer dry period. During this period, conversion in 1973 (0.87%) was 1.5-fold greater than in 1974 (0.59%). This difference was related to the greater soil water deficit in 1974. During a comparable period, Singh and Yadava (1974) reported a conversion efficiency of 2.0970 in a tropical grassland. The remainder of both growing seasons were characterized by decreasing conversion efficiencies.
Literature Cited
Baier, W., and C. W. Robertson. 1968. The performance of soil moisture estimates as compared with the direct use of climatological data for estimating crop yields. Agr. Meteorol. 5: 17-3 1.
Britton, C. M. 1975. Correlation of net aerial primary production with selected environmental parameters in an Andropogon-Pu.yx~/um grass- land ecosystem. PhD Diss. Texas A&M University, College Station. 118 p.
Britton, C. M., J. D. Dodd, and A. T. Weichert. 1976. Energy values of plant species and litter of an Andropogon-Puspalum grassland J. Biogeog. 3:389-395.
JcIURNAL OF RANGE MANAGEMENT 31(5), September 1978 385

Brouwer, R. 1966. Root growth of grasses and cereals, p. 153-166. /n: The growth of cereals and grasses. R. L. Milthorpe and J. D. Ivins (ed.). Butterworths, London.
Chew, R. M., and A. E. Chew. 1965. The primary productivity of a desert shrub (Larrea tridentata) community. Ecol. Monogr. 35355375.
Dahl, B. E. 1963. Soil moisture as a predictive index to forage yield for the sandhills range type. J. Range Manage. 16:128-132.
Draper, N. R., and H. Smith. 1966. Applied Regression Analysis. John Wiley and Sons, Inc. New York. 407 p.
Galley, F. B. 1960. Energy dynamics of a food chain of an old-field com- munity. Ecol. Monogr. 30: 187-206.
Kelly, J. M., P. A. Opstrup, J. S. Olson, S. I. Auerbach, and G. M. Van Dyne. 1969. Models of a seasonal primary productivity in eastern Tennessee Festuca and Andropogon ecosystems. Oak Ridge National Laboratory.
Kucera, C. L., R. C. Dahlman, and M. R. Koelling. 1967. Total net pro- ductivity and turnover on an energy basis for tall grass prairie. Ecology 48:536-541.
Levitt, J. 1972. Responses of Plants to Environmental Stresses. Academic Press, New York. 697 p.
McCalla, T. M. 1944. Changes in the physical properties of straw during the early stages of decomposition. Soil Sci. Sot. Amer. Proc. 8:258-262.
McCarty, E. C. 1935. Seasonal march of carbohydrates in E[rmus ambiguus and Muhelenbergia gracilis and their reaction under mod- erate grazing use. Plant Physiol. 10:727-738.
Ovington, J. D., D. Heitkamp, and D. B. Lawrence. 1963. Plant biomass and productivity of prairie, savanna, oakwood, and maize field eco- systems in central Minnesota. Ecology 44:52-63.
Reardon, P. O., and D. L. Huss. 1965. Effects of fertilization on a little bluestem community. J. Range Manage. 18:238-241.
Sestak, Z., J. Catsky, and P. G. Jarvis. 1971. Plant Photosynthetic Pro- duction: Manual of Methods. Dr. W. Junk N. V. Publishers, Hague. 818 p.
Singh, J. S., and P. S. Yadava. 1974. Seasonal variation in composition, plant biomass, and primary productivity of a tropical grassland at Kurukshetra, India. Ecol. Mongr. 44:35 l-376.
Smith, A. E., Jr. 1969. Relationship of carbohydrate trend to the mor- phological development of Schizachyrium scoparium (Michx.) Nash. tillers. PhD Diss. Texas A&M University, College Station. 89 p.
U.S. Department of Commerce. National Oceanic and Atmospheric Administration. 1974. Climatological Data, Texas. Vol. 78.
Van Amburg, G. L., and J. D. Dodd. 1970. Soil characteristics and plant rooting habits of contrasting soil types in east-central Texas. Southwest. Natur. 14:377-387.
Wiegert, R. G., and F. C. Evans. 1964. Primary production and the dis- appearance of dead vegetation on an old-field in southeastern Michigan. Ecology 45:49-63.
Woodwell, G. M., and R. H. Whittaker. 1968. Primary production in terrestrial ecosystems. Amer. Zool. 8: 19-30.
Yocum, C. S., L. H. Allen, and E. R. Lemon. 1964. Photosynthesis under field conditions. VI. Solar radiation balance and photosynthetic efficiency. Agron. J. 56:249-253.
Zahner, R., and A. R. Stage. 1966. A procedure for calculating daily moisture stress and its utility in regressions of tree growth on weather. Ecology 47:64-74.