Neste Oil Annual Report 2008 - appspot.com
154
Annual Report 2008 Annual Report 2008 We share a common concern. That is why we act.
Transcript of Neste Oil Annual Report 2008 - appspot.com

Annual Report 2008
Annual R
eport 2008W
e share a comm
on concern. That is why w
e act.

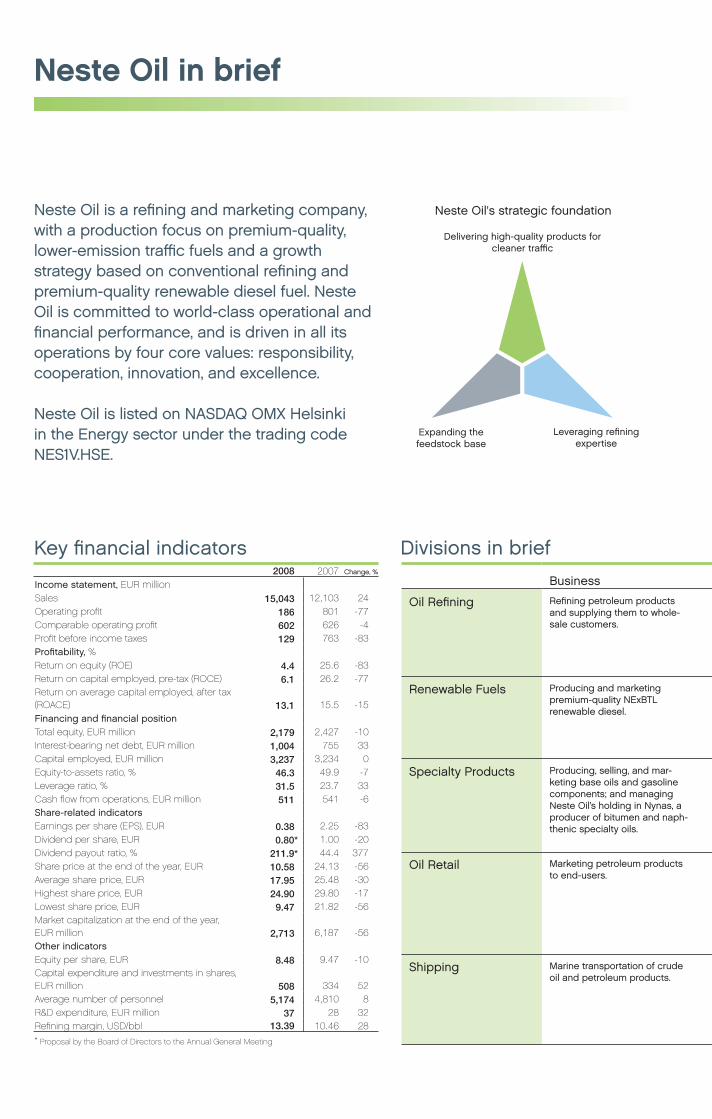
Divisions in brief
Neste Oil in brief
Key fi nancial indicators2008 2007
Income statement, EUR millionSales 15,043 12,103 24Operating profi t 186 801 -77Comparable operating profi t 602 626 -4Profi t before income taxes 129 763 -83Profi tability, %Return on equity (ROE) 4.4 25.6 -83Return on capital employed, pre-tax (ROCE) 6.1 26.2 -77Return on average capital employed, after tax (ROACE) 13.1 15.5 -15Financing and fi nancial positionTotal equity, EUR million 2,179 2,427 -10Interest-bearing net debt, EUR million 1,004 755 33Capital employed, EUR million 3,237 3,234 0Equity-to-assets ratio, % 46.3 49.9 -7Leverage ratio, % 31.5 23.7 33Cash fl ow from operations, EUR million 511 541 -6Share-related indicatorsEarnings per share (EPS), EUR 0.38 2.25 -83Dividend per share, EUR 0.80* 1.00 -20Dividend payout ratio, % 211.9* 44.4 377Share price at the end of the year, EUR 10.58 24.13 -56Average share price, EUR 17.95 25.48 -30Highest share price, EUR 24.90 29.80 -17Lowest share price, EUR 9.47 21.82 -56Market capitalization at the end of the year, EUR million 2,713 6,187 -56Other indicatorsEquity per share, EUR 8.48 9.47 -10Capital expenditure and investments in shares, EUR million 508 334 52Average number of personnel 5,174 4,810 8R&D expenditure, EUR million 37 28 32Refi ning margin, USD/bbl 13.39 10.46 28* Proposal by the Board of Directors to the Annual General Meeting
Neste Oil is a refi ning and marketing company, with a production focus on premium-quality, lower-emission traffi c fuels and a growth strategy based on conventional refi ning and premium-quality renewable diesel fuel. Neste Oil is committed to world-class operational and fi nancial performance, and is driven in all its operations by four core values: responsibility, cooperation, innovation, and excellence.
Neste Oil is listed on NASDAQ OMX Helsinki in the Energy sector under the trading code NES1V.HSE.
Neste Oil's strategic foundation
Delivering high-quality products for cleaner traffi c
Expanding the feedstock base
Leveraging refi ning expertise
Change, %
Business
Oil Refi ning Refi ning petroleum products and supplying them to whole-sale customers.
Renewable Fuels Producing and marketing premium-quality NExBTL renewable diesel.
Specialty Products Producing, selling, and mar-keting base oils and gasoline components; and managing Neste Oil’s holding in Nynas, a producer of bitumen and naph-thenic specialty oils.
Oil Retail Marketing petroleum products to end-users.
Shipping Marine transportation of crude oil and petroleum products.

Main markets Capacity Strategic role Strengths Market position
Europe and North America. Crude oil distilling capacity 260,000 bbl/d, refi ning capacity approx. 15 million t/a.
Growth business. Complex refi neries, high-quality, lower-emission traffi c fuels, ability to use Russian crude and other feedstocks.
Leading producer of lower-emission traffi c fuels in Northern Europe.
Europe. Production capacity 170,000 t/a. New projects under way will result in approx. 2 million t/a of capacity by 2011.
Growth business. Cutting-edge technology and product, growing capacity, and industry-leading opera-tions based on sustainable raw materials procurement.
NExBTL is the lowest-emission renewable dieselon the market.
Europe and North America. Production capacity 250,000 t/a of VHVI base oil, 60,000 t/a of polyalphaolefi ns, 260,000 t/a of iso-octane, and 160,000 t/a of ETBE.
Complementary busi-ness.
Technological and produc-tion expertise, broad product approval portfolio and part-ner network, and customer-focused operations.
Among the three leading suppliers worldwide in its segment.
Finland and the Baltic Rim. Outlets: 887 in Finland, 286 in Russia, the Baltic countries, and Poland.
Support business. High-quality traffi c fuels, strong brand and market position, extensive network, and competitive unit costs.
Market leader in Finland, second-largest player in Estonia, Latvia, and the St. Petersburg region, third-largest in Lithuania.
The Baltic and the North Sea. Gasoline shipments to North America.
Fleet: 5 crude tankers and 24 product tankers.
Support business. A safe and environmentally aware shipper, an expert in severe winter conditions, and a modern fl eet.
One of the three leading tanker fl eets in the Baltic.
0
2,000
6,000
4,000
8,000
10,000
12,000
16,000
14,000
Sales
EUR million
05 06 07 080
200
400
600
800
Comparable operating profi t
EUR million
05 06 07 08
0
3,000
4,000
5,000
6,000
Personnel (average)
05 06 07 08
2,000
1,000
0
200
400
600
1,000
Operating profi t
EUR million
05 06 07 08
800
Sales by product (in-house production)%
Sales by region (in-house production)%
● Finland 52%● Rest of Europe 20%● Other Nordic
countries 14%
● US and Canada 13%● Other countries 1%
● Diesel fuel 38%● Motor gasoline 28%● Other products 10%● Heavy fuel oil 7%● Jet fuel 5%● Heating oil 5%
● Gasoline components 2%
● LPG 2%● Base oils 2%● NExBTL diesel 1%

The world’s average temperature is expected to rise by 1.1-6.4 °C during the current century, a change that could be as large as that seen during the last ice age.* The need for energy in traffic and transportation is growing all the time, and mobility of people and goods will continue to be important. This is why we need to develop lower-emission fuels, if we are to slow the pace of climate change.
That is why we act.Contents
The biggest challenges facing renewable fuels are linked to the raw mate-rial chain. Read about our unique system for tracing the origins of the palm oil we use on Page
40
22Read about the sustain-ability principles behind biofuels on Page
1. Neste Oil Corporation The year in brief . . . . . . . . . . . . . . . . . . . . . . . . . 2Financial overview . . . . . . . . . . . . . . . . . . . . . . . 3CEO’s review . . . . . . . . . . . . . . . . . . . . . . . . . . . . 4Strategy . . . . . . . . . . . . . . . . . . . . . . . . . . . . . . . . . 6Industry overview . . . . . . . . . . . . . . . . . . . . . . . . 8
2. Divisions 12New business areas . . . . . . . . . . . . . . . . . . . . . 14Oil Refining. . . . . . . . . . . . . . . . . . . . . . . . . . . . . . 16Renewable Fuels . . . . . . . . . . . . . . . . . . . . . . . 20Specialty Products . . . . . . . . . . . . . . . . . . . . . 24Oil Retail . . . . . . . . . . . . . . . . . . . . . . . . . . . . . . . 26Shipping . . . . . . . . . . . . . . . . . . . . . . . . . . . . . . . 28
3. Responsibilities 30Our approach to responsibility . . . . . . . . . . 32Financial responsibility . . . . . . . . . . . . . . . . . . 34Environmental responsibility . . . . . . . . . . . . 36 Research and technology . . . . . . . . . . 44Social responsibility . . . . . . . . . . . . . . . . . . . . 46 Human resources . . . . . . . . . . . . . . . . . 48 Safety . . . . . . . . . . . . . . . . . . . . . . . . . . . . . . 51
4. Governance & Shares and shareholders 52Governance principles . . . . . . . . . . . . . . . . . 54Board of Directors . . . . . . . . . . . . . . . . . . . . . . 60Neste Executive Board . . . . . . . . . . . . . . . . . 62Shares and shareholders . . . . . . . . . . . . . . . 64Risk management . . . . . . . . . . . . . . . . . . . . . . 66
5. Financial Statements 68Review by the Board of Directors . . . . . . . . 69 Key financial indicators . . . . . . . . . . . . . . 76 Calculation of key financial indicators . 77Consolidated income statement . . . . . . . . 78Consolidated balance sheet . . . . . . . . . . . . 79Consolidated cash flow statement . . . . . . 80Consolidated statement of changes in equity . . . . . . . . . . . . . . . . . . . . . . . 81Notes to the consolidated financial statements . . . . . . . . . . . . . . . . . . . . 82Parent Company income statement . . . . .128Parent Company balance sheet . . . . . . . .129Parent Company cash flow statement . . .130Notes to the Parent Company financial statements . . . . . . . . . . . . . . . . . . . . . . . . . . . . . 131Board of Directors’ proposal for the distribution of earnings and the Board’s signature of the Review and Financial Statements . . . . . . . . . . . . . . . . . . .142Auditors’ Report . . . . . . . . . . . . . . . . . . . . . . . .143Statement by the Supervisory Board . . . .144Quarterly segment information . . . . . . . . . .145
6. Additional informationInformation for shareholders . . . . . . . . . . . .146Glossary of terms . . . . . . . . . . . . . . . . . . . . . .148
* IPCC 2001, 2007 1Neste Oil Corporation | Contents
Neste Oil 2008
The year in brief
MarchThe AGM decided to approve a dividend of EUR 1.00 per share. Finland’s Supreme Court imposed a fine of EUR 500,000 on Neste Oil for damage to the environment caused by an oil leak in 2001. Previous judgements by the Turku Court of Appeal and the District Court of Turunseutu had rejected the prosecution's call for a fine.
SeptemberNeste Oil was selected for inclusion in the Dow Jones Sustainability World Index for the second time. The index acknowledges the companies that are most committed to the principles of sustainable development. The Board of Directors appointed Matti Lievonen as President & CEO with effect from 1 December 2008. Risto Rinne retired on 30 September 2008.
AprilNeste Oil published its first-quarter results, which showed a comparable operating profit of EUR 119 million. The Biodiesel Divi-sion was renamed Renewable Fuels. A trial started in Greater Helsinki using 100% NEx-BTL renewable diesel in city buses. A fire took place on the new diesel line at Porvoo.
MayA new biofuel, Neste Green diesel, was launched. Suitable for use with all diesel engines, Neste Green diesel contains a minimum of 10% NExBTL renewable diesel.
OctoberNeste Oil announced a comparable operat-ing profit of EUR 199 million for the third quarter.
NovemberNeste Oil won Hart Energy’s 2008 Global Energy and Environmental Excellence Award in Alternative Fuels. Ilkka Salonen was appointed CFO.
JanuaryNeste Jacobs acquired the engineering company, Rintekno. Neste celebrated its 60 years of operation and was reselected for inclusion in The Global 100, a list of the world’s 100 most-responsible companies.
FebruaryNeste Oil published its financial statements for 2007 and announced a comparable op-erating profit of EUR 626 million for the year, an increase of 5% on 2006. The Mt Stena Arctica was transferred to the Finnish flag.
JuneNeste Oil announced a series of major investments. An isomerization plant will be built at the Porvoo refinery; a NExBTL renewable diesel plant in Rotterdam; and a plant producing premium-quality base oil in Bahrain to be 45%-owned by Neste Oil. It was announced that coking problems had emerged with the new diesel line at Porvoo as a result of the rapid shutdown following the fire in April, and that they had resulted in operational difficulties.
Q1 Q2 Q3
Q4
All of Neste Oil’s stock exchange releases and press releases for 2008 can be found at www.nesteoil.com.
JulyNeste Oil announced a second-quarter comparable operating profit of EUR 181 million.
1.1
2 Neste Oil Corporation | The year in brief

Financial overview
Although the rapid pace of developments in the global economy impacted demand for Neste Oil’s petroleum products, the company’s financial position remained stable, and Neste Oil is committed to moving ahead with its major investment program. Close to EUR 1.5 billion is to be spent on increasing NExBTL renewable diesel capacity.
Achievements and targetsChallenges in 2008 Achievements in 2008 Targets for 2009
The fire in April on the diesel production line 4 at Porvoo and the subsequent shutdown of the line. The line was out of action for longer than expected because of subsequent coking problems.
The diesel line was re-started successfully at the beginning of October. Despite unscheduled and extended outages, the line made a positive contribu- tion to increasing Neste Oil’s refining margin.
Trouble-free operations on the diesel production line 4 at Porvoo. Ensure that the investment delivers a good return.
Finalizing strategic invest-ment decisions and imple-menting capital projects.
Decisions were taken in June to build a NExBTL plant in Rotterdam and a base oil plant in Bahrain.Construction work on projects already under way progressed as planned.
Ensure that capital projects progress as planned.Make the most benefit of lower investment costs.
Promoting European legis-lation on renewable fuels and acceptance of the sustainably produced raw materials to produce them.
Neste Oil’s pioneering work and views were presented to a wide range of Europe-an politicians, officials, and nongovernmental organi-zations.
Ensure that new legislation is fully taken account of in operations and reporting.Secure Neste Oil’s conti-nued lead in responsible operations and advanced technology.
Sales at the Neste Oil Group totaled EUR 15,043 million in 2008, compared to EUR 12,103 million in 2007.
The Group’s comparable operating profit was EUR 602 million compared to EUR 626 million in 2007. The comparable operat-ing profit was supported by a strong total refining margin and good profitability at Shipping, but was offset by the unfavorable USD/EUR exchange rate and weaker profits at Oil Retail and the joint venture company Nynas AB. Additional negative impact came in the form of exceptional costs, which totaled around EUR 55 million.
Operating profit under IFRS was EUR 186 million in 2008. The major decline from the EUR 801 million booked in 2007 is associat-ed with inventory losses that accumulated in the second half of 2008 as oil prices softened rapidly.
Solid financial positionInvestments totaled EUR 508 million in 2008 (334 million). Neste Oil's balance sheet remained healthy. The year-end equity-to-assets ratio was 46.3% (31 Dec 2007: 49.9%), the leverage ratio 31.5% (23.7%), and the gearing ratio 46.1% (31.1%).
The Group's liquidity remained strong. Cash and cash equivalents and commit-ted, unutilized credit facilities amounted to EUR 1,536 million at the end of December (1,492 million). The company sees no major refinancing needs until 2012. Short-term financing needs will continue to be met by syndicated credits and overdraft facilities. There are no financial covenants in existing loan agreements.
For details on the sensitivity analyses used by Neste Oil, see Page 66.
Financial targets 2008 2007Return on average capital employed after tax (ROACE) of at least 15% annually 13.1% 15.5%
Leverage ratio, 25–50% 31.5% 23.7%
Dividend equivalent to at least a third of underlying profits* 51% 53%
*Calculated on the basis of the comparable operating profit for the year
3Neste Oil Corporation | Financial overview
Neste Oil 2008

to the AGM, which reflects our confidence in the company and its future.
The oil market saw some dramatic devel-opments during the year. Crude oil prices in US dollars have never risen as high as they did in July, and never have we seen such a rapid and sharp drop in them as we did after the summer. Prices fell from a peak of USD 147 a barrel to under USD 40 a barrel. It took two years and two months to reach those peak prices and only five months for them to drop back so dramatically.
A similar trend has been seen in petro-leum product prices, although fuel taxes reduced the extent of this in most coun-tries. The downturn also made itself felt in raw material and product prices in the renewable fuels area, although demand for these fuels is continuing to rise. The drop in the price of crude and crude-based products reduced the relative competitive-
Dear shareholders,
Early 2009 has been dominated by the challenging situation that continues to face the world economy. Companies’ ability to act responsibly – financially, socially, and environmentally – and to change where needed is put to the test in times like these.
A marketplace subject to increasingly strong swings and an operating environment in which changes are increasingly difficult to foresee are very much a feature of the situation today. We need to be able to adapt and react rapidly in times like these, and an-ticipate what could lie ahead where possible.
Anticipating the future calls for question-ing existing ways of working and organiza-tional structures, and replacing old solu-tions if they do not meet current needs, are holding back progress, or are an unneces-sarily expensive way of operating. In line with this, we announced in February 2009 that we would revamp our organization. The new structure will come into force on 1 April 2009 and is presented on Page 14.
The reorganization is intended to en-hance our potential to implement our strat-egy, cut costs, and secure our long-term profitability. We will also give greater em-
phasis to a customer focus and common practices and procedures in the future. I believe that the new organization and the approach it embodies are essential, given the increasingly international nature of our business.
A challenging year2008 was a challenging year in many respects. The year began with an ongoing upswing and ended in the beginnings of a recession. Neste Oil performed relatively well in these circumstances, and our com-parable operating profit for 2008 remained at virtually the same level recorded in 2007. We did not achieve all our financial targets, however. While our leverage ratio was on-target, our return on average capital employed after tax of 13.1% was below-target. The Board of Directors will propose a dividend of EUR 0,80 per share for the year
Return on average capital employed after tax (ROACE)
05 06 07 080
15
20
10
5
Target: minimum of 15% annually
%
0
10
20
30
40
Leverage ratio
05 06 07 08
%
Target: 25-50%
0
1
2
3
4
Earnings per share and dividend per share*EUR
Earnings per share Dividend per share
05 06 07 08
Target: payout ratio of at least one third of underlying profits
*Pro
pos
al b
y th
e B
oard
of D
irect
ors
to th
e An
nual
Gen
eral
Mee
ting
1.2
4 Neste Oil Corporation | CEO’s review
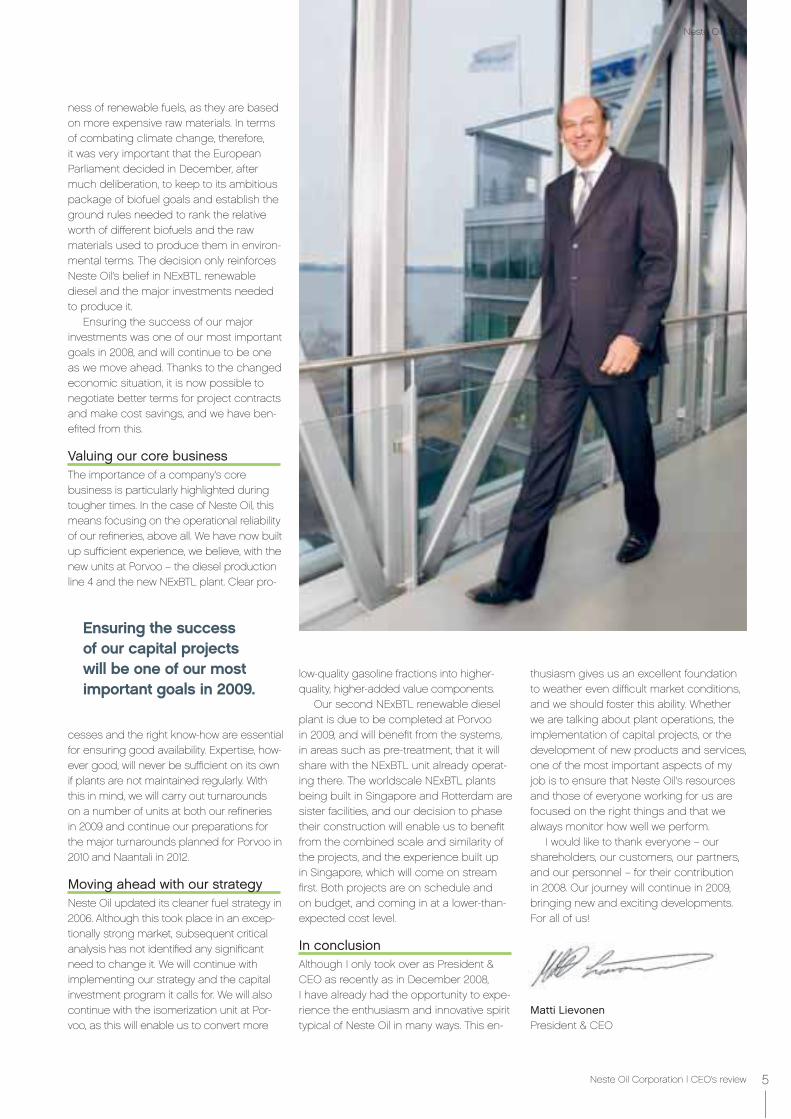
thusiasm gives us an excellent foundation to weather even difficult market conditions, and we should foster this ability. Whether we are talking about plant operations, the implementation of capital projects, or the development of new products and services, one of the most important aspects of my job is to ensure that Neste Oil’s resources and those of everyone working for us are focused on the right things and that we always monitor how well we perform.
I would like to thank everyone – our shareholders, our customers, our partners, and our personnel – for their contribution in 2008. Our journey will continue in 2009, bringing new and exciting developments. For all of us!
Matti LievonenPresident & CEO
low-quality gasoline fractions into higher-quality, higher-added value components.
Our second NExBTL renewable diesel plant is due to be completed at Porvoo in 2009, and will benefit from the systems, in areas such as pre-treatment, that it will share with the NExBTL unit already operat-ing there. The worldscale NExBTL plants being built in Singapore and Rotterdam are sister facilities, and our decision to phase their construction will enable us to benefit from the combined scale and similarity of the projects, and the experience built up in Singapore, which will come on stream first. Both projects are on schedule and on budget, and coming in at a lower-than-expected cost level.
In conclusionAlthough I only took over as President & CEO as recently as in December 2008, I have already had the opportunity to expe-rience the enthusiasm and innovative spirit typical of Neste Oil in many ways. This en-
ness of renewable fuels, as they are based on more expensive raw materials. In terms of combating climate change, therefore, it was very important that the European Parliament decided in December, after much deliberation, to keep to its ambitious package of biofuel goals and establish the ground rules needed to rank the relative worth of different biofuels and the raw materials used to produce them in environ-mental terms. The decision only reinforces Neste Oil’s belief in NExBTL renewable diesel and the major investments needed to produce it.
Ensuring the success of our major investments was one of our most important goals in 2008, and will continue to be one as we move ahead. Thanks to the changed economic situation, it is now possible to negotiate better terms for project contracts and make cost savings, and we have ben-efited from this.
Valuing our core businessThe importance of a company’s core business is particularly highlighted during tougher times. In the case of Neste Oil, this means focusing on the operational reliability of our refineries, above all. We have now built up sufficient experience, we believe, with the new units at Porvoo – the diesel production line 4 and the new NExBTL plant. Clear pro-
cesses and the right know-how are essential for ensuring good availability. Expertise, how-ever good, will never be sufficient on its own if plants are not maintained regularly. With this in mind, we will carry out turnarounds on a number of units at both our refineries in 2009 and continue our preparations for the major turnarounds planned for Porvoo in 2010 and Naantali in 2012.
Moving ahead with our strategyNeste Oil updated its cleaner fuel strategy in 2006. Although this took place in an excep-tionally strong market, subsequent critical analysis has not identified any significant need to change it. We will continue with implementing our strategy and the capital investment program it calls for. We will also continue with the isomerization unit at Por-voo, as this will enable us to convert more
Ensuring the success of our capital projects will be one of our most important goals in 2009.
5Neste Oil Corporation | CEO’s review
Neste Oil 2008

able diesel plant in Rotterdam; and follows a decision to build a similar-sized plant in Singapore. The company is also continuing with investments designed to further devel-op the capabilities of its existing refineries. The go-ahead for a new isomerization unit at Porvoo was given in June 2008. Neste Oil is also aiming to grow its base oil business, and a decision to build a new base oil plant in Bahrain was taken in June.
Against the background of an interna-tional economy that became significantly
more turbulent in the latter half of 2008 and investment costs that continued to remain high, Neste Oil concluded that the conditions were not right for build-ing a new refining unit at Naantali. Basic engineering on the project ended in September.
Progress is continuing as planned on capital projects already under way. The focus over the next few years will be on securing at least the rate of return specified for projects when they were given the go-ahead.
Strategy
Neste Oil’s vision is to be the world’s leading supplier of lower-emission traffic fuels. Specialization and cutting-edge expertise are seen as central to the success of a small oil company like Neste Oil in the competitive international marketplace. The company continued to move ahead with implementing its strategy and investment program in 2008.
Neste Oil’s strategy is based on its ability to use its unique refining expertise to produce premium-quality, lower-emission traffic fuels from a broad range of low-cost feedstocks. This strategy is seen as the best way of increasing shareholder value.
Growing by investingNeste Oil continued to move ahead with im-plementation of its cleaner fuel strategy in 2008. A decision was taken in June to build a world-scale 800,000 t/a NExBTL renew-
0
200
400
600
800
Investments
05 06 07 08
EUR million
DepreciationTotal capital expenditure
Growth projects
RenewableRenewableFuelsFuels
Oil ProductsOil Products Oil RetailOil Retail
Refining the future
1.3
6 Neste Oil Corporation | Strategy
fuel and other biodiesels currently on the market. Vegetable oils and animal fat can be used to produce it. NExBTL renewable diesel can also be used at up to 100% content in all modern diesel engines, and is compatible with existing distribution and logistics systems.
Neste Oil’s first NExBTL plant came on stream at Porvoo in 2007, and a second
plant will be completed there in 2009. Large new NExBTL plants are being built in Singa-pore and Rotterdam and are scheduled to begin production early in the next decade.
Future feedstocks and technologiesNExBTL renewable diesel is already the world’s cleanest diesel fuel, and Neste Oil wants to continue to be a pioneer in future technologies. Continuous develop-ment work is under way on areas such as extending the feedstock base for renew-able diesel and new types of process technologies. This work involves both Neste Oil’s own experts and people from
Better products from heavier fractionsRecent years have seen Neste Oil investing in capacity designed to refine advanced, lower-emission traffic fuels from heavy crude fractions. This has enabled the com-pany to benefit from the strong demand on the world market for middle distillates, such as diesel fuel.
Using its very extensive range of refining expertise and the advanced technology of its refineries, Neste Oil is able to produce high value-added products from lower-cost feedstocks. Middle distillate margins re-mained strong during 2008, despite larger-than-normal swings on the petroleum products market, which was also character-ized by an oversupply of heavy fuel oil.
Becoming a leading biofuels supplierThe demand for biofuels capable of reducing greenhouse gas emissions and promoting sustainable development is growing rapidly around the world. A mix of statutory requirements and tax incen-tives is encouraging use of these fuels. The growing amount of energy required by traffic and transportation, and the need to combat climate change, represent major challenges – and ones that Neste Oil has responded to by investing heavily in R&D on NExBTL renewable diesel and the capacity to produce it.
The result of a long-term R&D effort, NExBTL renewable diesel is a higher-quality product than both crude oil-based diesel
The demand for biofuels to reduce greenhouse gas emissions and promote sustainable development is growing worldwide.
leading universities and research com-munities around the world.
More efficiency to the strategy implementationNeste Oil is to reorganize its operations as of 1 April 2009 around three business areas and seven common functions. The new structure and organization are presented on Page 14.
The new matrix organization will enable the company to leverage the best practices and know-how of different business areas and functions for the benefit of the entire company.
The new business areas, which will also be the company's reporting segments, will be Oil Products, Renewable Fuels and Oil Retail.
The change is intended to give a more cost-efficient and customer-driven operat-ing model, and one that will be better ca-pable of implementing Neste Oil's strategy. The new model will also be better suited to an international operating environment and enable the company to ensure that new international units, such as the NExBTL renewable diesel plants under construc-tion in Singapore and Rotterdam can be integrated into Neste Oil’s operations and reporting effectively.
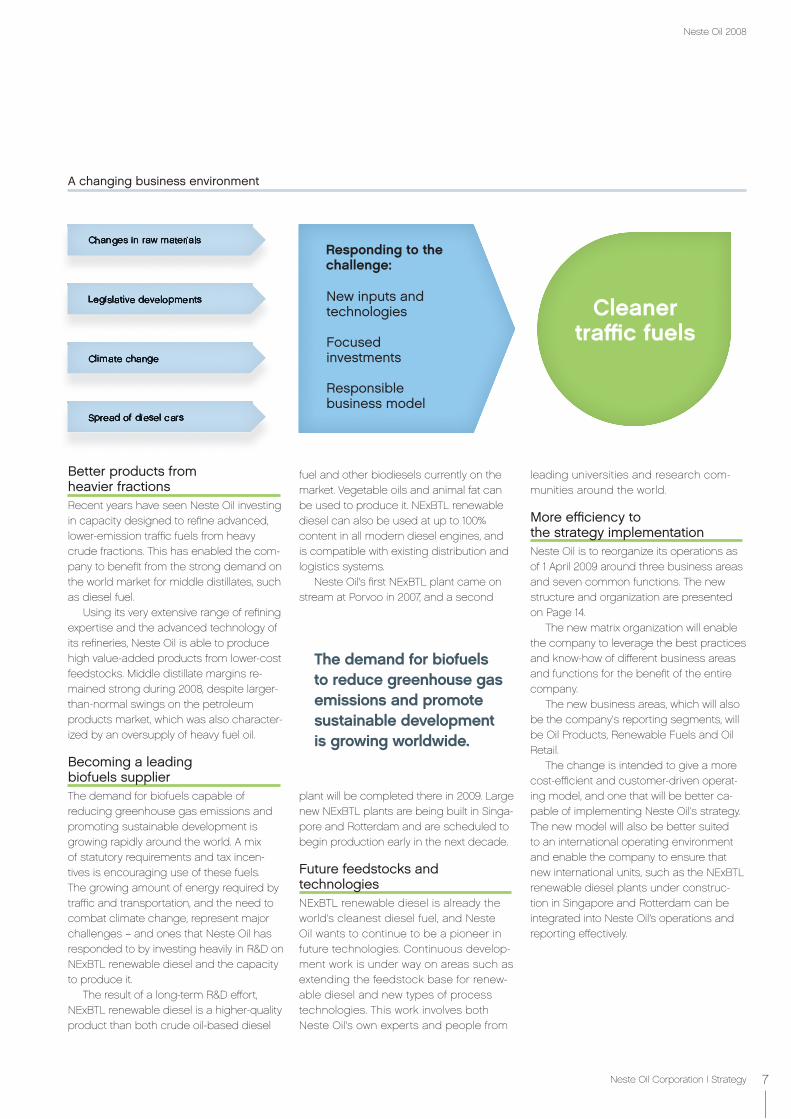
A changing business environment
Responding to the challenge:
New inputs and technologies
Focused investments
Responsible business model
Cleaner traffic fuels
7Neste Oil Corporation | Strategy
Neste Oil 2008

Industry overview
Swings in crude prices were exceptionally strong during 2008. Global demand for petroleum products slowed, and shifts in the world economy impacted the oil market. Demand for diesel fuel continued to grow in Europe, and diesel margins remained strong.
The price of crude rose to a record high during the summer, but dropped back during the fall by as much as 75%. Swings as large as USD 20/bbl in a single day were seen. Despite the drop in prices in the fall, the average crude price for the year as a whole marked a new high.
Demand for diesel fuel continued to in-crease more than that for other petroleum products. Gasoline consumption in the US fell back, while the use of corn-based ethanol increased, and saw the country’s long-term gasoline shortfall decline. As the US accounts for as much as 40% of the global gasoline market, developments there have global repercussions. The use of etha-nol in traffic fuel has increased the gasoline surplus typical of European refineries.
The global demand for petroleum prod-ucts declined in 2008 by 0.3% compared to 2007 (+1.2%) according to the Interna-tional Energy Agency (IAE) and totaled 85.8 million bbl/d (86.0 million bbl/d). Demand rose most in Southeast Asia, India, and the Middle East, and fell back in OECD countries. Growth was concentrated in countries with highly regulated or subsi-dized prices. The role of these measures was reduced towards the end of the year as a result of falling world market prices. The IEA estimated in January 2009 that demand during 2009 is likely to decline by 0.6%, resulting in a probable demand of 85.3 million bbl/d.
New pressures on refining marginsThe demand for traffic fuels has been rising for some time. Refinery investments have largely been concentrated on meeting new quality requirements, however, rather than on increasing output, which has resulted in a shortage of capacity. Margins have remained strong for the last five years, although gasoline margins have fluctuated extensively.
The rise in demand leveled off in the second half of 2008, however, as the impact of the financial crisis spread around the world from its epicenter in the US. 2008 was the first year in the last five to see more new refining capacity come on stream than called for by increased demand. A signifi-cant quantity of additional new capacity
Neste Oil is able to benefit from this differential, as it can process an increasing amount of Russian crude.
A weak dollar in comparison to the euro reduces the company’s revenue, as Neste Oil reports its figures in euros.
The refining margin reflects the difference between the price paid for feedstocks and the revenue received from products.
Refining margin
Neste Oil’s refining margin
IEA Brent Cracking reference margin
USD/bbl
Price differential between Urals and Brent crude
Brent Dated Urals Rotterdam
0
8
2
10
4
12
6
14
16
04 05 06 07 08 04 05 06 07 08
-4
-7
-2
-6
-1
-5
0
-3
USD/bbl
1.4
1.1
1.5
1.2
1.6
1.3
1.7
USD/EUR exchange rate
1.004 05 06 07 08
1.4
8 Neste Oil Corporation | Industry overview

is also under construction, most of which should be completed by the end of 2010. As demand is not expected to grow, this will result in excess new capacity. The high cost of investments and the tough financial situation, together with the sharp drop in new demand, is likely to see the postpone-ment of a number of projects planned for upcoming years that have yet to start construction.
Softer demand was reflected in the low prices quoted for gasoline and naphtha compared to crude towards the end of the year in particular. Heavy fuel oil prices moved higher from the low level typical of the late summer. Actual refining margins recorded during the latter part of the year were very dependent on refiners’ product yields. Refineries producing large volumes of gasoline achieved generally weak mar-gins, while those primarily focused on mid-dle distillates performed significantly better.
Higher crude pricesDespite the major drop in crude prices typical of final months of 2008, Brent traded at an average of USD 96.99/bbl in 2008, or 35% above 2007. The value of the dollar has strengthened as the price of crude has declined.
The price differential between different types of crude has narrowed somewhat from previous peak levels. Complex refiner-ies have been able to benefit from their ability to use heavier, sourer crude, such as Russian Urals, which is typically cheaper than Brent from the North Sea.
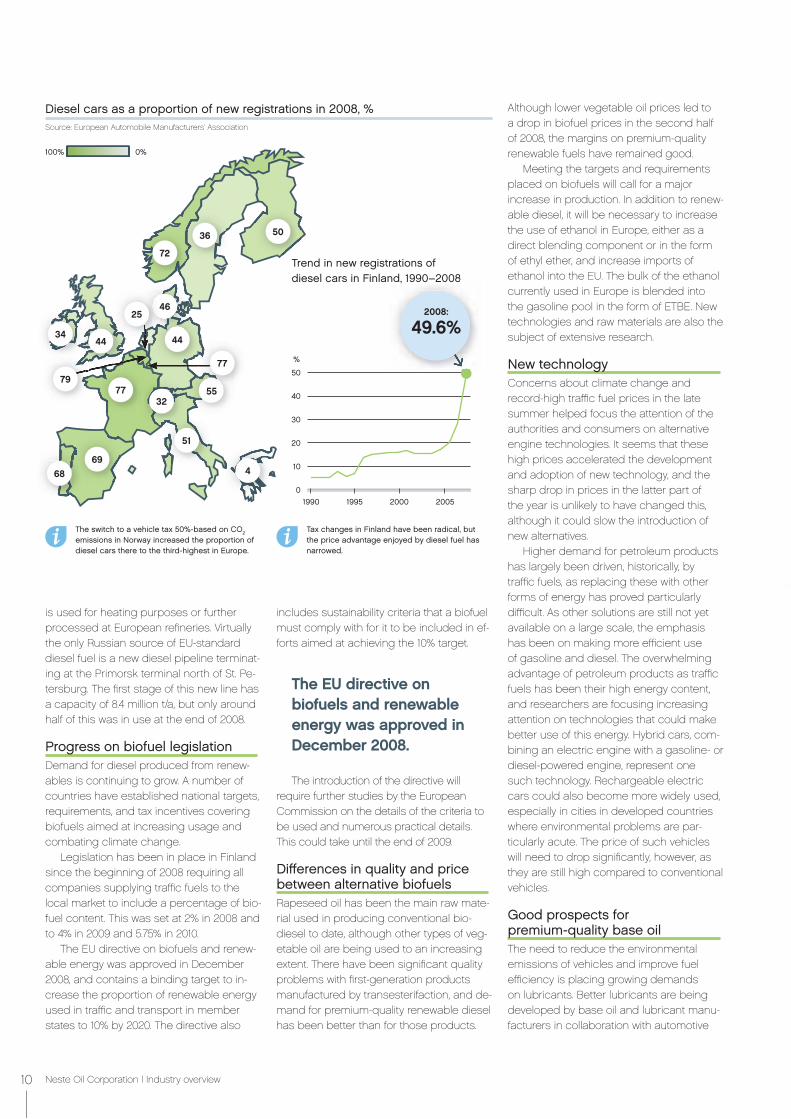
Diesel growing in EuropeDemand for diesel fuel in Europe has grown rapidly in recent years, and this trend is expected to continue. As diesel cars already account for over 70% of new reg-istrations in some countries, the potential for further growth is beginning to narrow, however. Consumption by commercial road traffic is likely to vary in line with local economic development.
The proportion of diesel cars in the Nordic countries has been relatively low historically, but tax changes in Sweden, Norway, and more recently in Finland have increased their popularity rapidly. Diesel cars accounted for 49.6% (20.3%) of new car registrations in Finland in 2008, following
a tax change that came into force at the beginning of the year. The relative price advantage of diesel fuel compared to gasoline has narrowed, however, in Finland as elsewhere. In countries that tax fuels equally, such as Estonia, the retail price of diesel fuel is higher than that of gasoline.
Europe’s shortage of middles distil-lates is typically covered through imports of diesel from Russia and jet fuel from the Middle East. The sulfur content of heating oil, another middle distillate, was reduced to 0.1% in the EU as of the beginning of 2008. As a major proportion of Russian diesel does not meet this requirement and only a small proportion of middle distillate imports meet the EU diesel standard, the remainder
Growth in global demand for petroleum products, 2007–2009
North America
South America Africa
Asia
Former Soviet Union
Middle East
Europe
1,000 bbl/d
2007 2008 2009 Source: IEA (January 2009)
9Neste Oil Corporation | Industry overview
Neste Oil 2008
is used for heating purposes or further processed at European refineries. Virtually the only Russian source of EU-standard diesel fuel is a new diesel pipeline terminat-ing at the Primorsk terminal north of St. Pe-tersburg. The first stage of this new line has a capacity of 8.4 million t/a, but only around half of this was in use at the end of 2008.
Progress on biofuel legislation Demand for diesel produced from renew-ables is continuing to grow. A number of countries have established national targets, requirements, and tax incentives covering biofuels aimed at increasing usage and combating climate change.
Legislation has been in place in Finland since the beginning of 2008 requiring all companies supplying traffic fuels to the local market to include a percentage of bio-fuel content. This was set at 2% in 2008 and to 4% in 2009 and 5.75% in 2010.
The EU directive on biofuels and renew-able energy was approved in December 2008, and contains a binding target to in-crease the proportion of renewable energy used in traffic and transport in member states to 10% by 2020. The directive also
includes sustainability criteria that a biofuel must comply with for it to be included in ef-forts aimed at achieving the 10% target.
The introduction of the directive will require further studies by the European Commission on the details of the criteria to be used and numerous practical details. This could take until the end of 2009.
Differences in quality and price between alternative biofuelsRapeseed oil has been the main raw mate-rial used in producing conventional bio-diesel to date, although other types of veg-etable oil are being used to an increasing extent. There have been significant quality problems with first-generation products manufactured by transesterifaction, and de-mand for premium-quality renewable diesel has been better than for those products.
Although lower vegetable oil prices led to a drop in biofuel prices in the second half of 2008, the margins on premium-quality renewable fuels have remained good.
Meeting the targets and requirements placed on biofuels will call for a major increase in production. In addition to renew-able diesel, it will be necessary to increase the use of ethanol in Europe, either as a direct blending component or in the form of ethyl ether, and increase imports of ethanol into the EU. The bulk of the ethanol currently used in Europe is blended into the gasoline pool in the form of ETBE. New technologies and raw materials are also the subject of extensive research.
New technologyConcerns about climate change and record-high traffic fuel prices in the late summer helped focus the attention of the authorities and consumers on alternative engine technologies. It seems that these high prices accelerated the development and adoption of new technology, and the sharp drop in prices in the latter part of the year is unlikely to have changed this, although it could slow the introduction of new alternatives.
Higher demand for petroleum products has largely been driven, historically, by traffic fuels, as replacing these with other forms of energy has proved particularly difficult. As other solutions are still not yet available on a large scale, the emphasis has been on making more efficient use of gasoline and diesel. The overwhelming advantage of petroleum products as traffic fuels has been their high energy content, and researchers are focusing increasing attention on technologies that could make better use of this energy. Hybrid cars, com-bining an electric engine with a gasoline- or diesel-powered engine, represent one such technology. Rechargeable electric cars could also become more widely used, especially in cities in developed countries where environmental problems are par-ticularly acute. The price of such vehicles will need to drop significantly, however, as they are still high compared to conventional vehicles.
Good prospects for premium-quality base oilThe need to reduce the environmental emissions of vehicles and improve fuel efficiency is placing growing demands on lubricants. Better lubricants are being developed by base oil and lubricant manu-facturers in collaboration with automotive
Diesel cars as a proportion of new registrations in 2008, %
The EU directive on biofuels and renewable energy was approved in December 2008.
The switch to a vehicle tax 50%-based on CO2 emissions in Norway increased the proportion of diesel cars there to the third-highest in Europe.
Tax changes in Finland have been radical, but the price advantage enjoyed by diesel fuel has narrowed.
Trend in new registrations of diesel cars in Finland, 1990–2008
1990 1995 2000 20050
10
20
30
40
50
%
nd, 1990 2008
2008:
49.6%
Source: European Automobile Manufacturers' Association
5036
77
44
72
469
51
68
32
34
46
44
55
77
425
79
100% 0%
10 Neste Oil Corporation | Industry overview
New engine technology on the way
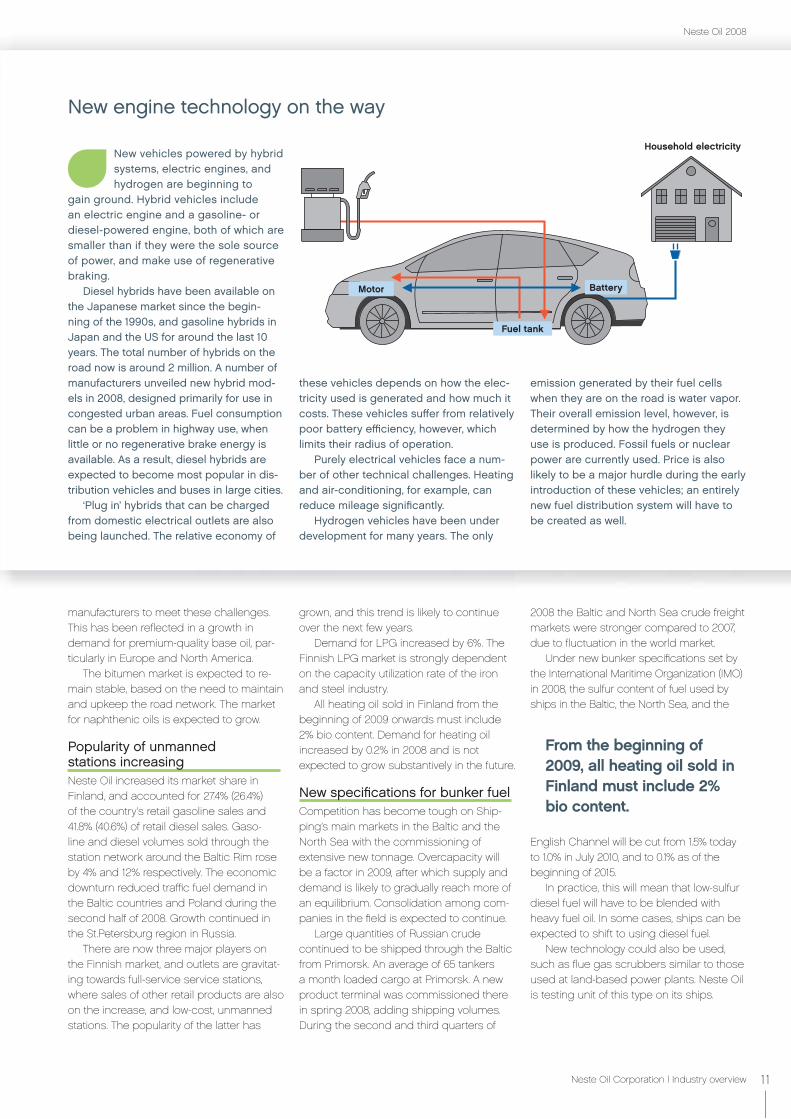
New vehicles powered by hybrid systems, electric engines, and hydrogen are beginning to
gain ground. Hybrid vehicles include an electric engine and a gasoline- or diesel-powered engine, both of which are smaller than if they were the sole source of power, and make use of regenerative braking.
Diesel hybrids have been available on the Japanese market since the begin-ning of the 1990s, and gasoline hybrids in Japan and the US for around the last 10 years. The total number of hybrids on the road now is around 2 million. A number of manufacturers unveiled new hybrid mod-els in 2008, designed primarily for use in congested urban areas. Fuel consumption can be a problem in highway use, when little or no regenerative brake energy is available. As a result, diesel hybrids are expected to become most popular in dis-tribution vehicles and buses in large cities.
‘Plug in’ hybrids that can be charged from domestic electrical outlets are also being launched. The relative economy of
these vehicles depends on how the elec-tricity used is generated and how much it costs. These vehicles suffer from relatively poor battery efficiency, however, which limits their radius of operation.
Purely electrical vehicles face a num-ber of other technical challenges. Heating and air-conditioning, for example, can reduce mileage significantly.
Hydrogen vehicles have been under development for many years. The only
manufacturers to meet these challenges. This has been reflected in a growth in demand for premium-quality base oil, par-ticularly in Europe and North America.
The bitumen market is expected to re-main stable, based on the need to maintain and upkeep the road network. The market for naphthenic oils is expected to grow.
Popularity of unmanned stations increasingNeste Oil increased its market share in Finland, and accounted for 27.4% (26.4%) of the country's retail gasoline sales and 41.8% (40.6%) of retail diesel sales. Gaso-line and diesel volumes sold through the station network around the Baltic Rim rose by 4% and 12% respectively. The economic downturn reduced traffic fuel demand in the Baltic countries and Poland during the second half of 2008. Growth continued in the St.Petersburg region in Russia.
There are now three major players on the Finnish market, and outlets are gravitat-ing towards full-service service stations, where sales of other retail products are also on the increase, and low-cost, unmanned stations. The popularity of the latter has
grown, and this trend is likely to continue over the next few years.
Demand for LPG increased by 6%. The Finnish LPG market is strongly dependent on the capacity utilization rate of the iron and steel industry.
All heating oil sold in Finland from the beginning of 2009 onwards must include 2% bio content. Demand for heating oil increased by 0.2% in 2008 and is not expected to grow substantively in the future.
New specifications for bunker fuelCompetition has become tough on Ship-ping’s main markets in the Baltic and the North Sea with the commissioning of extensive new tonnage. Overcapacity will be a factor in 2009, after which supply and demand is likely to gradually reach more of an equilibrium. Consolidation among com-panies in the field is expected to continue.
Large quantities of Russian crude continued to be shipped through the Baltic from Primorsk. An average of 65 tankers a month loaded cargo at Primorsk. A new product terminal was commissioned there in spring 2008, adding shipping volumes. During the second and third quarters of
emission generated by their fuel cells when they are on the road is water vapor. Their overall emission level, however, is determined by how the hydrogen they use is produced. Fossil fuels or nuclear power are currently used. Price is also likely to be a major hurdle during the early introduction of these vehicles; an entirely new fuel distribution system will have to be created as well.
2008 the Baltic and North Sea crude freight markets were stronger compared to 2007, due to fluctuation in the world market.
Under new bunker specifications set by the International Maritime Organization (IMO) in 2008, the sulfur content of fuel used by ships in the Baltic, the North Sea, and the
English Channel will be cut from 1.5% today to 1.0% in July 2010, and to 0.1% as of the beginning of 2015.
In practice, this will mean that low-sulfur diesel fuel will have to be blended with heavy fuel oil. In some cases, ships can be expected to shift to using diesel fuel.
New technology could also be used, such as flue gas scrubbers similar to those used at land-based power plants. Neste Oil is testing unit of this type on its ships.
From the beginning of 2009, all heating oil sold in Finland must include 2% bio content.
Motor
Fuel tank
Household electricity
Battery
11Neste Oil Corporation | Industry overview
Neste Oil 2008
The world’s energy consumption is estimated to grow by 50% by 2030. Source: IEA
12 Divisions

Neste Oil operated through five divisions in 2008. In line with corporate strategy, renewable fuels act as the company's growth driver. The Neste Oil organization will be restructured around three business areas at the beginning of April 2009.
Divisions
New business areas 14Oil Refining 16Renewable Fuels 20Specialty Products 24Oil Retail 26Shipping 28
SalesEUR million (excluding internal sales)Total: 15,043
Oil Refining 67%Oil Retail 27%Specialty Products 4%
Shipping 1%Renewable Fuels 1%
Each division has represented its own reporting segment since the beginning of 2008.
13Divisions
Neste Oil 2008

New business areas
The Neste Oil organization was based on five divisions in 2008 – Oil Refining, Renewable Fuels, Specialty Products, Oil Retail, and Shipping – which also formed the company’s reporting segments. This structure will change in April 2009.
Neste Oil’s operations are to be reorganized into three business areas and seven com-mon functions, and a new organizational structure reflecting this will be introduced as of 1 April 2009.
The change is intended to give a more cost-efficient and customer-driven operating model, and one that will be more capable of implementing the company’s strategy and international expansion. The new model is a matrix organization and de-signed to leverage the best practices and know-how of business areas and functions for the benefit of the entire company.
Business areas and reporting segmentsThe new business areas will act as profit centers and will be responsible for their
customers, products, and business devel-opment. The new business areas are as follows: Oil Products, Renewable Fuels, and Oil Retail. Activities outside these business areas will be grouped under Others.
Neste Oil’s financial reporting will be based on these business areas from 28 April 2009 onwards when the Q1/2009 fig-ures are announced. Comparative figures for 2008 will be published ahead of this.
The Specialty Products Division will be consolidated into the Oil Products business area. Shipping operations will be reported in connection with the business areas that use them, and the Shipping business incorporat-ed into the Production & Logistics function.
Common functionsNeste Oil’s new common functions will
New organization as of 1 April 2009
be responsible for the production opera-tions and processes required by business areas, and for ensuring their efficiency. They will also be responsible for the cost efficiency, transparency, and harmonization of procedures across the company, and for overseeing the use and sufficiency of Neste Oil’s resources.
The new common functions will be: Production & Logistics, Finance, Human Resources, HSE, Technology & Strategy, Communications, and Legal Affairs.
Senior managementThe Neste Executive Board, under the Presi-dent & CEO, will be responsible for overall management and for the implementation of the company’s strategy and ensuring that operational targets are met.
The Neste Executive Management Board will comprise the President & CEO, business area executive vice presidents, the CFO, and the Senior Vice President, Production & Logistics, and will be responsible for leading and setting operational business targets and monitoring progress on achieving them.
FinanceFinance
*Secretary to the Neste Executive Board, not a member
Common functions
2.1
14 Divisions | New business areas

Targets and achievements in 2008
Targets for 2008 Actions and achievements 2008
Oil Refining Further enhance the safety of personnel and refining processesRetain a strong position on the wholesale market in Finland and neighboring countriesTake decisions on new investmentsHigh capacity utilization on the new diesel line
Audits of process safety and the launch of development measuresWholesale market share maintained at a good level in FinlandApproval given for a new isomerization unit at PorvooCompletion of basic engineering on a new hydrocracking unit at Naantali
Renewable Fuels
Start construction of the Singapore plant and continue work on the second NExBTL plant at Porvoo as plannedExpand the R&D effort on new feedstocksLaunch certified palm oilAchieve good progress on the construction of a third-generation pilot plant at VarkausMove ahead on new capital projects
Progress as planned on construction of the Singapore NExBTL plant and the second plant at PorvooBroad-based progress on R&D into new raw materialsContract agreed for certified palm oilGood progress achieved on construction of the new pilot plant at VarkausDecision taken to build a NExBTL plant in Rotterdam
Specialty Products
Take a decision on a new base oil plantExploit the opportunities offered by seasonal demand for gasoline componentsBuild on existing strong performance in occupational safety
Go-ahead given for a base oil project in Bahrain and the start of constructionOperational efficiency enhanced in response to a weaker gasoline market in the USExcellent safety performance at all plants
Oil Retail Continue growing outside FinlandSecure safety during the revamp of the station network and in logistics operationsRoll out the new brand identity at outletsLaunch NExBTL renewable diesel on the retail market
15 new stations opened outside Finland in 2008Achieved a TRIF (Total Recordable Incident Frequency) figure of 4.4 (3.5)Revamped a total of 260 outlets Launch of Neste Green diesel
Shipping Improve operational efficiencyBetter profit performanceStrong safety performance across all aspects of operations
Very high fleet utilization rateImproved safety performanceGood result thanks to internal efficiency, and better than the market average
15Divisions | Targets and achievements
Neste Oil 2008

Oil Refining
Neste Oil has defined Oil Refining as one of the key growth businesses in its strategy, alongside Renewable Fuels. Investments at existing refineries will drive the growth, which will be reinforced by a program of continuous operational improvement.
The oil refining’s success is based on its expert refining capabilities, a proactive approach to introducing new technologies, and the ability to make use of a broad range of different types of crude oil and other feedstocks in developing and producing new, high-quality lower-emission traffic fuels.
The most important market factors affecting Oil Refining’s performance are the differential between petroleum product and feedstock prices, the differential between light Brent crude from the North Sea and heavy Russian crude, and the USD/EUR exchange rate. Fluctuations in crude prices largely impact performance in the form of inventory gains and losses. Neste Oil monitors the impact of product/feedstock price differentials using the international IEA Brent Cracking reference refining margin.
Higher usage of Russian crudeNeste Oil imported a total of 15.7 million tons of crude oil and other feedstocks into Finland in 2008 (15.1 million tons). Some 81% (76%) of this was sourced from Russia and other countries of the former Soviet Union, and the remainder primarily from the North Sea. Other feedstocks mainly comprised
Oil Refining is Neste Oil’s largest division, and produces and sells a comprehensive range of petroleum products, with a particular focus on low-emission traffic fuels. Neste Oil’s two refineries, at Porvoo and Naantali, account for over 20% of the Nordic region’s total crude oil refining capacity. The company is also one of the region’s largest wholesale suppliers of petroleum products.
middle distillates, gas oil, fuel oil, gasoline components, and LPG. The majority of im-ported volumes were delivered by sea, 86% (87%), and the remainder by rail, 14% (13%).
Neste Oil refined a total of 15.2 million tons (14.6 million tons) of crude and other feed-stock in 2008, of which 12.4 million tons (11.8 million tons) were processed at Porvoo and 2.8 million tons (2.8 million tons) at Naantali.
Some 65% (60%) of output consisted of sulfur-free or low-sulfur traffic fuels. Crude distilla-tion capacity utilization at the Porvoo refinery stood at 91.7% (94.6%) and 96.8% (96.5%) at the Naantali refinery.
Both refineries processed a record level of feedstock in 2008, and combined input exceeded 15 million tons for the first time ever. The Porvoo refinery has a crude oil
t
h
Although Neste Oil’s new diesel line at Porvoo encountered a number of problems in 2008, the year proved one of the best yet for the refinery and for the Naantali refinery.
Demand for petroleum products has declined. With the additional refining capacity scheduled to come on stream in the industry in
2009 and 2010, this is expected to be reflected in slightly weaker mar-gins. Diesel margins will probably remain reasonably strong, however. Neste Oil is well-placed in this re-spect, as our production palette is focused on diesel and other middle distillates.
Diesel demand expected to remain strong
Divisional overview
2.2
16 Divisions | Oil Refining

Key figures2008 2007
Sales, EUR million 12,030 9,348Operating profit, EUR million 123 640Comparable operating profit, EUR million 510 484Net assets, EUR million 1,972 2,165Comparable return on nets assets (RONA), EUR million 21.7 22.7Capital expenditure, EUR million 132 193Total refining margin, USD/bbl 13.39 10.46
The Porvoo refinery is one of the most advanced in Europe and produces around 12 million tons of petroleum products a year.
refining capacity of 206,000 bbl/d, and the Naantali refinery a capacity of 57,900 bbl/d.
Russian Export Blend accounted for 57% (51%) of feedstock input at Neste Oil’s refineries in 2008.
Exports to Europe and North AmericaNeste Oil delivered a total of 7.5 million tons (8.1 million tons) of petroleum prod-ucts to the Finnish market in 2008, giving the company an 89% (87%) share of the wholesale market.
Sales to other countries totaled 7.1 million tons (6.3 million tons), of which gasoline ac-counted for 2.4 million tons (2.4 million tons) and diesel fuel 2.9 million tons (2.1 million tons). North America, Sweden, and Germa-
We act.The new diesel line at
Porvoo has a capacity of over 1 million t/a.
Porvoo refinery
Commissioned in 1965One of Europe’s most advanced and versatile refineriesFocused on producing premium-quality, low-emission traffic fuelsCrude oil refining capacity of approx. 206,000 bbl/d, equivalent to some 12 million t/a7 million m3 of crude oil and petroleum product storage capacity Finland’s largest port, as measured in terms of volume of cargo through-put. Between 16 and 19 million tons of crude oil and petroleum products are discharged and loaded annuallyEmploys approx. 1,200 people
Naantali refinery
Commissioned in 1957Primarily produces traffic fuels and specialty products, such as bitumen, solvents, and small engine gasolineThanks to its specialty product focus, Naantali’s refining margin is higher than that of other refineries of similar size and complexityCrude oil refining capacity of an average of 58,000 bbl/d, equivalent to approx. 3 million t/aOver 1 million m3 of crude oil and pe-troleum product storage capacityRuns on heavy, sour crude inputEmploys approx. 400 people
17Divisions | Oil Refining
Neste Oil 2008
menced in 2008. The next major turnaround at Naantali is scheduled for 2012.
Sales and trading operations transferred to GenevaNeste Oil decided to transfer sales and trading activities to Geneva, where a new dedicated company has been established and began operations at the beginning of 2009. This will be mainly responsible for the bulk of sales outside the Finnish and Swed-ish markets.
For the price differential between Urals and Brent and USD/EUR exchange rates, see Page 8.
refinery to produce a higher proportion of high-octane, low vapor pressure gasoline. Construction will begin in 2009 and the unit is scheduled to come on stream at the be-ginning of 2011. Feedstock will be provided by both refineries.
A feasibility study on building additional conversion capacity at Naantali was com-pleted. Given the uncertainty of the interna-tional economy and the high cost of capital investments, the company decided that the conditions were not right for an investment of this type, however.
Major maintenance turnarounds every five to six years are one of the most impor-tant means of maintaining the operational reliability of Neste Oil’s refineries. The next of these is planned for Porvoo in 2010, and planning and engineering for this com-
ny were the company’s biggest markets for gasoline exports, with the US and Canada accounting for 68% (57%). Sweden and Po-land were the most important markets for diesel exports, and accounted for 71% (66%) of total diesel exports.
New isomerization unit for premium-quality gasolineOil Refining’s growth-related investments have continued to focus on developing the company’s existing refineries, both of which have the potential for further capac-ity to produce additional quantities of low-emission traffic fuels from heavy crude fractions.
A decision was taken in June to build a new, approximately EUR 80 million, 600,000 t/a isomerization unit at Porvoo, to enable the
Light products, e.g. gasoline and
diesel fuel
Heavy products, e.g. vacuum gas oil and heavy fuel oil
Crude refining
Downstream refiningCracking
Value-added gasoline and diesel fuel
Investments in conversion capacity
Heavy refining fractions are converted into value-added, low-emission traffic fuels.
Total refining margin
USD/bbl
04 05 06 07 08
Neste Oil’s refining margin
Reference margin (IEA Brent Cracking)
0
8
10
12
16
Crude oil and feedstock sources by region
1,000 t
04 05 06 07 08
14
6
4
2
RussiaOther countries of the former Soviet UnionBritainNorway
DenmarkOthersRussia and other countries of the former Soviet Union, 2004
Price trends for key petroleum products compared to crude oil
GasolineDiesel fuel
Heavy fuel oilBrent crude
The price differential between different products favors investments in conversion capacity.
USD/bbl
04 05 06 07 08
Neste Oil’s refining margin exceeded IEA Brent Cracking significantly.
0
80
100
140
Crude oil price
USD/bbl
04 05 06 07 08
60
40
20
120
Crude prices fluctuated exceptionally dramatically in 2008.
Brent Dated
-40
10
-20
20
-10
30
0
40
-30
0
8
10
14
6
4
2
12
18 Divisions | Oil Refining

New diesel line up and running for part of the year
2008 proved a disappointment in respect of the new diesel line commissioned at the Porvoo re-
finery in summer 2007, as it was on stream for only part of the year. Despite this, the line contributed to both enhanced output and profitability at the site, and helped
Neste Oil record a record-high total refin-ing margin of USD 13.39/bbl (10.46/bbl).
A fire at the beginning of April was a major factor in these problems, as it delayed the line’s maintenance outage, which had been planned to start the same month, until the end of May. The line
was restarted during the last week of the month. Coking problems resulting from the fire in April emerged, however, and the line was forced to operate at reduced capacity with a lighter-than-planned input. It proved impossible to remove the coke from the line while it was running and it was shut down for maintenance in August and September.
The new line has increased Neste Oil’s overall diesel production capacity by over 1 million t/a. Capable of producing premium-quality sulfur-free diesel from heavy fuel oil, the line gives the refinery the potential to switch entirely to using heavier crude oil.
Production Line 4Commissioned in summer 2007Refines high-quality sulfur-free diesel from heavy fuel oilCapable of producing over 1 million t/aCapital costs totaled some EUR 750 millionWill increase Neste Oil’s refining margin by over USD 2/bbl*
The refining process at the Porvoo refinery
Rock cavern storage
Feed tanks
Reforming
Sulfur recovery
Alkylation
ETBE
TAEE
VHVI Base oil
Diesel fuel
Diesel fuel
Fuel gasSulfur
Liquid gas
Heavy fuel oil
Distillation column
Heating oil
Jet fuel
Motor gasoline
Naphtha
80% of crude oil is vaporized at this point
Fractions are taken off from the column at a number of points
Crude oil is heated to 355-370°C prior to distillation
Gasoline desulfurization
Gas oil desulfurization
Gas recovery
Jet fuel unit
Fluid catalytic cracking
Hydrogen sulfide recovery
Mercaptane oxidation
DesulfurizationHydrocracking
Desalting
Vacuum distillation
Hydrogen units
Residue hydrocracking unit
Distillation columns
Light fractions(gasolines)Middle distillates(kerosene, heating oil, diesel fuel)Heavy fractions(heavy fuel oil, bitumen, bottom oil)
Crude oil
Gas
* calculated on the basis of the company’s annual total
capacity of approx. 100 million barrels.
19Divisions | Oil Refining
Neste Oil 2008
Renewable Fuels
Renewable fuels is Neste Oil’s fastest-growing business, and produces and sells premium-quality NExBTL renewable diesel based on the company’s proprietary technology. A number of new NExBTL plants are currently under construction, and the company is continuing an active program of R&D on biofuels and raw materials suitable for biofuel usage.
The demand for biofuels is growing rapidly. Neste Oil is the first oil company to produce and market truly premium-quality renew-able diesel fuel. Based on its own R&D, NExBTL renewable diesel is the cleanest diesel available. Neste Oil has set itself the target of becoming the world’s leading producer of renewable diesel.
Production capacity set to increaseWorldwide demand for diesel fuel is ex-pected to reach 750 million tons a year by 2015. Traffic biofuels currently account for approximately 1% of total global fuel produc-tion according to the International Energy Agency. Production capacity of convention-al biodiesel and higher-quality renewable diesel in Europe totaled around 16 million tons in 2008. Consumption is projected to reach 13 million t/a in Europe by 2010.
Neste Oil has responded to this demand challenge by launching a major expansion of its own capacity. A plant commissioned at the Porvoo refinery in 2007 already pro-duces around 170,000 t/a of NExBTL renew-able diesel, and a second plant of equal size is due to be completed there in 2009.
Neste Oil decided to build an 800,000 t/a NExBTL plant in Singapore in November 2007; and followed this up in June 2008 with a decision to build a similar-sized plant in Rotterdam. Both plants are currently under construction and are due to come on stream in 2010 and 2011 respectively. These will be the world’s largest renewable diesel facilities.
A technological pioneerNeste Oil’s NExBTL is a major Finnish inno-vation that has been extensively tested and in commercial production since 2007.
NExBTL renewable diesel offers a major reduction in both greenhouse gas and oth-er harmful emissions. Measured over the product’s entire life cycle, its greenhouse gas emissions are between 40% and 60% lower than those of fossil diesel, depend-ing on the raw material used. Blended with conventional diesel, NExBTL reduces overall emission levels in line with the proportion blended.
NExBTL diesel’s properties have been studied extensively with cars, trucks, and buses, and the results have all been very positive. In addition to lower greenhouse gas emissions, the fuel offers significantly lower particulate emissions than conven-tional diesel, as well as lower NOx emis-sions than conventional biodiesel. A clear reduction in tailpipe aldehyde emissions confirms that NExBTL renewable diesel burns cleanly.
Neste Oil took part in an extensive test on diesel fuels produced from renewables in Alberta, Canada in 2008. The test was
-
d
m e
Neste Oil has a unique technology that is clearly ahead of anything else at the moment, and NExBTL renew-able diesel is a tried and tested solu-tion for meeting the biofuel legisla-tion in place in many countries.
Very large volumes of renew-able fuels will be called for in the
next few years, and no one raw material or technology can meet this challenge alone. All current ap-proaches will be needed, together with a number of new ones as well – which is why Neste Oil is working hard on finding and introducing new raw materials and new solutions.
A year of building future growth
Divisional overview
2.3
20 Divisions | Renewable Fuels

to measure and reduce greenhouse emis-sions across the entire product life cycle is used as an important criterion in raw material procurement. The final decision is also affected by reliability, availability, and price. Neste Oil has actively promoted the adoption of an international certification system for palm oil production through the Roundtable on Sustainable Palm Oil (RSPO).
Suitable for all diesel enginesNeste Oil’s NExBTL renewable diesel offers significantly better performance than tradi-tional, first-generation biodiesel, and even better than that of the best fossil diesels.
NExBTL is both sulfur- and aromatics-free. Thanks to a high cetane number, it combusts efficiently, keeping engines clean. Its excellent cold weather perform-
Key figures2008 2007
Sales, EUR million 116 40Operating profit, EUR million 2 –12Comparable operating profit, EUR million 2 –13 Net assets, EUR million 371 142Comparable return on net assets (RONA), % 0.9 –12.3Capital expenditure, EUR million 249 69
The palm oil used by Neste Oil is produced in plantations in Malaysia like the one seen here. Cultivation and production abides by the principles of sustainable development.
designed to evaluate the performance of these fuels in cold weather. The project was primarily sponsored by the Canadian fed-eral government, the provincial authorities in Alberta, and Shell Canada. The project included laboratory and field studies, and NExBTL renewable diesel performed ex-ceptionally well in all the tests, confirming its excellent range of properties.
Using sustainably produced raw materialsNeste Oil has defined responsible and sustainable operations as its number-one priority in raw material procurement, together with ensuring that its suppliers commit to continuous development in their operations. Neste Oil knows the origin of the palm oil it uses in detail, and the ability
NExBTL renewable diesel in brief
Produced from renewable raw ma-terials using Neste Oil’s proprietary technologyCan be based on a mix of vegetable oil and animal fatSuitable for all modern engines, no need to replace existing vehiclesCan be used as such or as a blending component in conventional dieselPerformance and ease of use equal to that of fossil dieselReduces tailpipe and greenhouse gas emissionsCan be produced in large volumes on an industrial scale
We act.Our premium-quality
NExBTL renewable diesel capacity will total close to
2 million t/a in 2011.
21Divisions | Renewable Fuels
Neste Oil 2008

ance means that it can be used year-around even in cold climates, and its storage qualities are excellent.
NExBTL renewable diesel is compat-ible with all current diesel vehicles and logistics systems, keeping switching costs to a minimum. It can be used as such or blended with conventional diesel. Blending improves the technical properties of fuel and reduces emissions.
Leading the way in responsibilityA total of some 40 million tons of palm oil were produced worldwide in 2008, of which Neste Oil used approximately 0.3%. Although a small user, the company knows the exact origin of the palm oil it uses. A thorough understanding of the product’s entire life cycle and environmental impact is seen as the foundation of Neste Oil's renewable diesel operations.
Working with its palm oil suppliers, Neste Oil has developed a monitoring system to enable the origin of all the palm oil it uses to be traced and to understand the entire chain from plantation and cultivation through pressing and transportation all the
way to a NExBTL plant. Neste Oil and its external auditors continuously monitor and report the efficacy of the system.
Neste Oil expects to receive its first batches of palm oil certified in line with the RSPO’s certification system during 2009, and has committed itself to increas-ing the level of certified palm oil used as it becomes available.
Neste Oil is carrying out active research with over 20 international universities and research groups to develop and introduce new raw materials for biofuels. Raw materi-als studied include algae, microbes, and forest harvesting waste. The company aims to switch to fully non-food raw materials.
Greater responsibility through better regulationLegislation work is under way in the EU to create a set of common ground rules for biofuel production. The goal is to establish sustainability criteria for production, as well as to define how much a product’s greenhouse gas emissions over its entire life cycle need to be reduced for it to be classified as contributing to combating climate change.
A directive on biofuels and renewable energy was approved in December 2008, containing a binding target to increase the proportion of renewable energy in traffic and transport in member states to 10% by 2020. The directive also includes sustain-ability criteria that a biofuel must comply with for it to be included in efforts aimed at achieving the 10% target.
The introduction of the directive will re-quire further studies by the European Com-mission on details of the criteria to be used, as well as numerous practical aspects. This could take until the end of 2009.
The negative aspects of biofuel produc-tion were debated extensively in 2008. On the other hand, production was seen as having positive effects in areas such as lo-cal economies. In line with its commitment to responsible business practices, Neste Oil has campaigned strongly for a common set of ground rules in the field to which all parties – governments, the international community, and other companies – should commit. Neste Oil has called for an end to all irresponsible land use. In addition to new legislation, strict monitoring proc-esses need to be introduced. Neste Oil will continue to work through the RSPO and in cooperation with decision-makers, non-governmental organizations, and others to promote sustainable development.
Read more about responsibility on Pages 30–51.
Producing biofuels in accordance with the principles of sustainable development
We know the life cycle and origin of the raw materials we use.We select our suppliers carefully and prioritize good health, safety, environ-mental, and social issues management on the part of our suppliers.We require our suppliers to aim for sustainable operations, and include this requirement in our supply contracts.We are committed to sourcing only sustainably produced raw materials.We carry out and commission audits and monitor our entire supply chain.We work with our suppliers to help them improve their operations.We are committed to certification systems and regulations designed to improve the sustainable production of the raw materials we use.
Raw material suppliers
Our suppliers must always comply with all relevant national laws and statutes. In ad-dition, Neste Oil requires its suppliers:
To support sustainability and be com-mitted to the continuous improvement of the health, safety, and environmental (HSE) aspects of their operationsTo develop their HSE performance and sustainability regulations and stan-dards, together with government and other organizationsTo respect human rights and proactive-ly promote occupational safety, andTo act in accordance with good busi-ness ethics.
Production
We use efficient production methods that comply with ISO and OHSAS en-vironmental, health, safety, and quality standards.We continually improve the safety of our production operations.We develop our production technolo-gies to enable the use of novel raw materials.
End-products
We develop and market quality prod-ucts that reduce harmful emissions and can be used with existing engines. We strive to improve the greenhouse gas and energy balance of our produc-tion chain to reduce the impact we have on the environment.We offer our customers and partners products and technologies that are compatible with current and future regulations.
0
1 500
2 000
Growth in NExBTL renewable diesel production, 2007–20111,000 t
07 08 09 10 11
1 000
500
Neste Oil has set itself the target of becoming the world’s leading producer of renewable diesel.
22 Divisions | Renewable Fuels

A number of public transport buses operated by Helsinki City Transport in Greater Helsinki
switched to using 100% NExBTL renew-able diesel in April 2008 as part of a joint initiative between VTT, the Helsinki Metro-politan Area Council, HKL, Proventia, and Neste Oil launched in 2007. The aim of the project is to improve air quality as well as to reasearch the use of advanced biofu-els in urban areas. The trial was preceded by use of a NExBTL/fossil diesel blend.
The introduction of 100% NExBTL die-sel has taken place in close cooperation with automotive manufacturer, Scania. The emissions reduction and long-term ef-fects on bus engines of using NExBTL will be studied in detail to ensure that all the benefits of premium-quality renewable diesel are taken advantage of to benefit urban air quality.
Using NExBTL renewable diesel has a significant positive impact on emis-sions, as the fuel generates substantially less particulate and NOx emissions than conventional diesel fuel. Test results show that NOx emissions are cut by around 10% and particulate emissions by around 30%
compared to fossil diesel. Greenhouse gas emissions as measured over the entire life cycle of the fuel are 40-60% lower than those of fossil diesel when the raw materials used to produce NExBTL diesel are themselves produced in accor-dance with sustainability principles. VTT Technical Research Centre of Finland is responsible for carrying out the extensive emission measurement program.
The three-year trial includes around 300 buses using a blend of approximately 30% NExBTL renewable diesel and 70% fossil diesel, and a small number of buses using 100% NExBTL diesel. The Finnish Ministry of Finance has granted a tax break on the NExBTL renewable diesel used in the trial until the end of 2010.
Better by bus – A unique public transport initiative
NExBTL production plantsLocation Capacity Completed Investment StatusPorvoo 170,000 t/a 2007 EUR 100 millon OperationalPorvoo 170,000 t/a 2009 Over EUR 100 million Under constructionSingapore 800,000 t/a 2010 EUR 550 millon Under constructionRotterdam 800,000 t/a 2011 EUR 670 millon Under construction
Emission reductions offered by NExBTL renewable diesel*
40-60% less greenhouse gas emissions10% less NOx
28% less fine particlesSignificantly lower levels of other pollutantsEasier cold starts and less tailpipe soot
* Compared to fossil diesel
Sources: MAN, SAE
Differences between NExBTL and conventional biodiesel
NExBTL renewable dieselCan be blended up to 100% contentComplies with the strictest quality standardsReduces tailpipe emissionsOffers excellent storabilityDoes not require any engine modifications
Conventional biodieselCan only be used up to 5-7% content*Biofuel usage requirements cannot be met without compromising fuel quality specificationsIncreases NOx emissionsMust be used before a specific ‘best before’ dateCan cause engine problems
* Maximum allowed under the European diesel standard
23Divisions | Renewable Fuels
Neste Oil 2008

Specialty Products
The base oils produced by Neste Oil are mainly used in the manufacture of high-quality motor lubricants. Tougher vehicle emissions legislation is increasing the demand for premium-quality base oils, as these are used to optimize lubricant performance, enabling the use of better catalytic converters and filters and reduc-ing fuel consumption. Europe is currently Neste Oil’s main market for base oils, but as production capacity increases it will be possible to grow the business in other key markets, such as North America and Asia.
A strong position on the base oil marketNeste Oil is one of the leading suppliers of premium-quality base oils in Europe and growing in importance globally. The company had an over 40% share of the wholesale market for VHVI base oils in Europe in 2008, and a close to 20% share of the global market. In addition to growing demand, the company’s broad customer base and strong partnership network with additives producers and automotive manu-facturers offer good growth opportunities for Neste Oil’s base oil business. Neste Oil's products have been extensively approved by automotive manufacturers.
Demand for VHVI base oils rose in line with expectations in 2008 and production ran at full capacity; demand for PAO was stable. Although financial performance var-ied in line with swings in feedstock prices, the year was a successful one overall.
Growth through joint venturesThe capacity of the PAO plant at Beringen in Belgium was increased by 20% at the end of 2008, to 60,000 t/a. Neste Oil signed a joint venture agreement with the Bahrain Petro-leum Company (BaPCo) and Bahrain’s Oil and Gas Holding Company (OGHC) in June 2008; and the joint venture has started construc-tion of a 400,000 t/a VHVI plant in Bahrain, scheduled to come on stream in 2011.
Neste Oil is also investigating other alternatives for increasing production.
Specialty Products produces and sells premium-quality base oils and traffic fuel components, and manages Neste Oil’s interests in Nynas AB, a producer of naphthenic oils and bitumen. Neste Oil has targeted growth in premium-quality base oils, and is focusing on continuous development of its gasoline component business.
Negotiations are under way on building a 500,000 t/a VHVI plant in Abu Dhabi with the Abu Dhabi Oil Refining Company.
Components for lower- emission traffic fuelsNeste Oil produces traffic fuel components for use in its own products and for sale to other oil companies. Low vapor pressure iso-octane, for example, is used as a high-oc-tane hydrocarbon component for blending ethanol with gasoline and offers very good environmental performance. Neste Oil pro-duces iso-octane at a plant in Edmonton in Canada, output from which goes to refiners on the US West Coast and Canada.
Biocomponents for EuropeEthanol is often blended into gasoline in the form of ethyl tert-butyl ether (ETBE). Recent research indicates that this process can reduce a refinery’s CO2 emissions.
s
Environmental and performance-related requirements are getting tougher all the time, which is seeing a growth in the market for premium-quality base oil. Neste Oil is currently building additional capacity in this area, and planning further major investment.
The market for gasoline compo-nents is a challenging one at the moment, and Neste Oil aims to en-
sure its competitiveness by making changes in areas such as feedstock sourcing.
In the case of Nynas, Neste Oil is committed to increasing the com-pany’s shareholder value, and ex-pects Nynas to be able to continue to leverage its leading position as a bitumen producer and on the grow-ing market for naphthenic base oil.
Tougher quality requirements are increasing base oil demand
Divisional overview
2.4
24 Divisions | Specialty Products

Key figures2008 2007
Sales, EUR million 591 649Operating profit, EUR million 19 122Comparable operating profit, EUR million 50 109Net assets, EUR million 327 324Comparable return on net assets (RONA), % 13.9 32.9Capital expenditure, EUR million 30 5
The premium-quality base oil produced at the Porvoo refinery is used in products such as high-quality motor lubricants.
Neste Oil 2008
Specialty Products' capacity
Base oils250,000 t/a of capacity at Porvoo60,000 t/a of capacity at Beringen in Belgium400,000 t/a of capacity in Bahrain beginning in 2011 (Neste Oil’s holding: 45%)Planned project: 500,000 t/a of capacity in Abu Dhabi (Neste Oil’s holding: 20%)
Gasoline components260,000 t/a of iso-octane capacity at Edmonton in Canada50,000 t/a of ETBE capacity at Sines in Portugal
Nynas (50%-owned by Neste Oil)Three refineries in Sweden and Britain and holdings in other refineriesGlobal market leader in naphthenic oilMarket leader in bitumen in the Nordic countries and Britain, and the third-largest in Western Europe.
Neste Oil was one of the first refiners in Eu-rope to begin ETBE production at its Porvoo refinery in spring 2004. Europe is the main market for Neste Oil’s ETBE, and demand has been growing. ETBE’s benefits include low vapor pressure and a high octane rat-ing; it is also sulfur- and aromatics-free.
Naphthenic oil and bitumen from NynasNynas is the European market leader in premium-quality naphthenic specialty oils, and one of Europe’s leading bitumen pro-ducers. Tire manufacturers represent one of the company’s major customer segments, and Nynas is working to produce increas-ingly environmentally benign products to meet their stricter requirements. Neste Oil owns 50% of Nynas. For further information, see www.nynas.com.
We act.The CO2 emissions reduction achieved by the lubricants
produced from our premium-quality base oil is equivalent to the emissions released
by 1 million cars.
Demand for premium-quality base oil is growing rapidly.
2
3
4
5
Demand for VHVI base oil
1
Estimate of future demand
Million t/a
06 07 08 09 10
Source: Lube / The European Lubricants Industry Magazine, Dec. 2008
25Divisions | Specialty Products

Oil Retail
Neste Oil increased its market share of the Finnish oil retail market in 2008, and accounted for 27.4% (26.4%) of the coun-try’s retail gasoline sales and 41.8% (40.6%) of retail diesel sales. Gasoline and diesel volumes sold through the station network around the Baltic Rim rose by 4% and 12% respectively.
Write-downs against receivables from one of the division’s partners totaling EUR 15 million had a negative impact on the result. The division’s total sales of traffic fuels decreased by 4% on the figure for 2007, and stood at 4.4 million m3. Sales of diesel fuel fell by 2% on 2007, and gasoline sales fell by 1%.
LPG sales increased by 6% on 2007. Sales of heating oil rose by 0.2%.
A slowdown in salesNeste Oil had a network of 887 stations in Finland as of the end of 2008. A business development and efficiency enhancement program ran throughout the year aimed at ensuring the continued competitiveness of the network in an increasingly tough market environment.
The company opened 15 new out-lets outside Finland in 2008. Growth in these markets has slowed in line with the depressed prospects affecting the world economy; the economic downturn was most pronounced in Estonia and Latvia, and less so in Lithuania and Poland. Growth continued in Russia, however. As of the end of the year, Neste Oil had 286 stations outside Finland.
Launch of Neste Green dieselNeste Oil launched a new biofuel on the Finnish market in May. Suitable for all diesel engines, Neste Green diesel is a premium-quality product that complies with the EN 590 standard. Offering cleaner combustion than conventional diesel, the fuel results in less carbon build-up. It also has a higher cetane number than conventional diesel, giving better cold start performance and generating lower emissions. For drivers, the fuel can be used exactly like regular diesel.
Neste Green diesel contains a minimum of 10% of NExBTL renewable diesel, which means that its particulate, carbon monox-ide, and NOx emissions are all lower than
those of conventional diesel – giving a clear benefit in terms of air quality, particularly in urban areas. Its greenhouse gas emissions are also at least 5% lower than those of conventional diesel. The fuel has been well-received and sales performance has been encouraging.
New forecourt technologyThe revamp of Neste Oil’s station network continued in 2008 and is based around three station concepts: Neste Oil service stations, unmanned Neste Oil Express out-lets, and Neste Oil Truck stations.
Forecourt pumps are also being mod-ernized, with payment terminals integrated
Oil Retail markets a comprehensive range of petroleum products through its own service station network and direct sales to companies and individuals. The division acts as Neste Oil’s channel for bringing new, cleaner products to market.
t
Neste Oil has a leading position on the Finnish market, and retaining this into the future will be important. This strength in the marketplace, together with the new operating models being introduced, will benefit the company as the economic downturn or swings in crude oil prices result in changes in demand. Growth will probably
continue in Neste Oil’s developing markets when economic prospects there improve.
Keeping costs in check and operations efficient will be important. Particular attention will be given to ensuring that costs per liter of prod-uct sold are reduced.
Operational efficiency is important
Divisional overview
2.5
26 Divisions | Oil Retail

Key figures2008 2007
Sales, EUR million 4,073 3,435Operating profit, EUR million 25 60Comparable operating profit, EUR million 22 59Net assets, EUR million 351 381Comparable return on net assets (RONA), % 6.0 17.1Capital expenditure, EUR million 63 51Total sales, 1,000 m3 4,353 4,519
into pumps. Neste Oil has been one of the first to introduce terminals capable of accepting chip-based cards. The latter will make payments more secure, as fake cards are rejected. A total of 260 outlets were revamped in 2008, and the entire net-work will have been revamped by 2011.
The new Neste Oil Express outlets have proved particularly successful, and sales at these sites have increased. An increasing proportion of payments for fuel at manned stations are also now being made using pumpside terminals.
A more competitive lubricants businessProduction of Neste Oil lubricants and au-tomotive chemicals at Laajasalo in Helsinki, Finland ended in 2008, and lubricants are now produced by Ashland Valvoline in the Netherlands. Neste Oil has signed three new partnership agreements to secure the future competitiveness of its lubricants and automotive chemicals business covering the packaging, transport, and storage of the two product families.
The new technology being introduced at forecourts is both safer and more user-friendly.
Gasoline Diesel fuel Heavy vehiclesUnmanned stations
Service stations
Breakdown of Neste Oil's fuel sales
Million liters
05 06 07 080
200
400
600
800
Unmanned stations are becoming increasingly popular.
We act.We sell Neste Oil’s
low-emission traffic fuels through a network of
almost 900 outlets across Finland.
1.4
1.6
04 05 06 07 08
Average retail prices for gasoline and diesel fuel in Finland EUR/l
0.8
1.0
1.2
0.6
27Divisions | Oil Retail
Neste Oil 2008

Shipping
Shipping’s flexible marine transportation, and its ability to adapt to changing market needs, provides an important element of support for Neste Oil’s overall strategy. Reli-able, on-time deliveries ensure that custom-ers receive their feedstocks and products precisely when they expect and need them.
Shipping’s main area of operation is Northwest Europe. Crude oil shipments are focused on the Baltic and the North Sea, while product and chemical cargoes mainly go to ports in Northwest Europe and along the Finnish coast. Fuels, primarily gasoline, go to the US and Canada. Freight rates for crude oil and products, the fleet’s capacity utilization, and the price of bunker fuel play an important part in determining Shipping’s financial performance.
An exceptionally good yearShipping’s profitability clearly improved in 2008. A high fleet utilization rate of 96.3% and unusually high freight rates contributed to this. Greater use was made of capacity on return voyages, with outward shipments of gasoline to the US, for example, bal-anced by return shipments of diesel fuel.
Fuel consumption and CO2 emissions were both reduced through the adoption of a lower basic speed of 13.5 knots and by issuing more detailed instructions on bunker usage. Both measures cut costs and benefited the environment.
A challenging market situationCrude oil freight rates in the North Sea averaged 179 Aframax Worldscale points in 2008. Competitive pressure in the Baltic has increased as a result of the additional tonnage now operational there. Shipping’s strong experience-driven reputation, good customer relationships, and ability to adapt to and operate in a wide variety of situations and environments all help to reinforce com-petitiveness on a challenging market.
Oil flows from Russia’s Primorsk terminal totaled an average of 74 million tons in 2008. A new product terminal was opened at Primorsk in spring 2008, and product shipments totaled 1.5 million tons during the year. An average of 65 ships a month were loaded at the terminal in 2008.
A dynamic fleetThe Mt Stena Arctica was transferred to the Finnish register in February 2008, be-coming the largest ship to fly the Finnish flag. Through measures like this, Shipping is helping to support the skill base of Finn-ish mariners and strengthen the competi-tiveness of the Finnish merchant marine.
The Neste Oil fleet comprised a total of 29 tankers as of the end of 2008. The aver-age age of the company’s own vessels was around 3 years, and that of time-chartered vessels around 6 years – giving an overall average age of around 5 years. All of Ship-ping’s vessels feature a double hull and are registered under the highest ice classes in the Finnish-Swedish classification system.
Shipping carries over 40 million tons of crude oil, petroleum products, and chemicals a year. Operations are mainly concen-trated in the Baltic, the North Sea, and the North Atlantic. The fleet recorded a capacity utilization factor of 96.3% in 2008.
Shipping in brief in 2008
5 crude oil tankers24 product tankers3 tugs2 push barges3,741 port callsOver 43 million tons of freight carried1.2 million dwt of tonnage
d
2008 was a successful year for Shipping, and saw the highest freight rates ever during the summer. Neste Oil’s excellent fleet utilization rate was also an important factor in mak-ing the year a profitable one.
The shipping market will continue to be a challenging one, however,
as a result of overcapacity. Further ice-strengthened capacity is due to come on to the market in 2009, and consolidation in the sector is ex-pected to continue. Over the longer term, supply and demand are likely to become better balanced.
Good fleet utilization ensured a good result
Divisional overview
2.6
28 Divisions | Shipping

Shipping’s Arctic expertise goes all the way back to 1948.
Key figures2008 2007
Sales, EUR million 437 394Operating profit, EUR million 54 30Comparable operating profit, EUR million 55 28Net assets, EUR million 272 297Comparable return on net assets (RONA), % 19.2 9.3Capital expenditure, EUR million 3 2Total cargo carried, million t 43.1 40.6Fleet utilization rate, % 96.3 94.1
Safety a key prioritySafety is a key priority in all aspects of Ship-ping’s operations. All tankers displacing over 40,000 dwt are accompanied in and out of port at Porvoo and Naantali by escort tugs. Simulator and other specialist training is provided on an ongoing basis to crew mem-bers to maintain a high level of onboard skills. Expertise in navigating in harsh winter conditions and use of the appropriate ton-nage are essential for ensuring reliable and safe operations in Northern waters.
Shipping has regularly received recogni-tion for its exemplary safety performance in surveys carried out by Port State Control (Paris Mou), and Finnish vessels always rank high in their safety statistics.
0
10
20
40
Structure of the Neste Oil fleet
Vessels
04 05 06 07 08
30
Time-chartered (leased vessel and crew)Bareboat (leased ves-sel, own crew)
Own vessel (Neste Oil vessel and crew)Joint ownership (vessel owned with a partner)
Time chartering offers fleet flexibility.
0
20
40
80
Freight rate trends in the North Sea and shipments leaving PrimorskMillion t
04 05 06 07 08
60
75
150
225
300
0
Daily spot rates
Crude oil freight rates in the North Sea (Aframax Worldscale points)
Shipments leaving Primorsk
We act.All of our 30 tankers
are ice-strengthened and feature a double hull.
29Divisions | Shipping
Neste Oil 2008

The concentration of CO2 in the atmosphere is the highest in 650,000 years. Source: IPCC
30 Responsibility

Responsibility is an important part of Neste Oil’s clean fuels-based strategy. In line with our commitment to helping people travel and transport goods with less impact on the environment – today and into the future – we observe the principles of sustainable development in all aspects of our worldwide operations.
Our approach to responsibility 32Financial responsibility 34Environmental responsibility 36 Research and technology 44Social responsibility 46 Human resources 48 Safety 51
Responsibility
0
10
20
30
40
50
Neste Oil's HSE costs and investments
EUR million
HSE investments HSE costs
05 06 07 08
HSE = Health, safety, and the environment
31Responsibility
Neste Oil 2008

Our approach to responsibility
Stakeholder Interaction Evaluation
Customers Daily interaction, customer support, customer events and seminars, fairs and other events, cus-tomer feedback, stakeholder magazine, website, extranets
Customer satisfaction studies, brand research
Personnel Quarterly results meetings and other internal information meetings, performance reviews, em-ployee committees, corporate Intranet, employee magazine, initiative system, remuneration system, training
Employee satisfaction studies, initiative system, systems designed to encourage employees to develop their skills and expertise, brand research
Owners and investors
Meetings with investors and analysts, daily interaction, capital market days, fairs and events, AGM, press conferences, Annual Report, stock exchange and press releases, website
Brand research
IR communications stud-ies and benchmarking
Suppliers of products and services
Daily interaction, supplier meetings and events, purchasing systems, trade fairs and events, stake-holder magazine, website, extranets
Audits, supplier reviews
Society Cooperation with the authorities and official reporting at international, national, and local level, open door days, refinery visits, refinery publica-tions, website, press releases
Brand research, local studies, direct feedback
Organizations Memberships, working groups, other forms of cooperation, regular contacts, reports, website
Direct feedback
Universities and research institutions
Joint R&D projects, participation in projects, sponsorship and other support, internships and diploma thesis opportunities for students, website
Direct feedback
Media Regular contacts, stock exchange and press releases, Annual Report, background briefings, interviews, visits, website, image bank
Brand research, commu-nications studies, media monitoring, reporting benchmarking, direct feedback
Students and job applicants
Recruitment fairs, recruitment section at www.nesteoil.com, student events, refinery visits, visits to schools and universities, cooperation with Finland’s Youth Academy
Employer profile studies
Stakeholders and stakeholder interaction
Neste Oil’s sustainability policy
We are socially responsible, environmen-tally sound, and economically viable.All our actions are safe for us, our neigh-bors, contractors, customers, and the environment.We act responsibly in society and res-pect human rights wherever we operate.We provide our customers with products that help tackle sustainability issues such as global climate change and improving local air quality.We are committed to engaging with our stakeholders and participating in multi-stakeholder initiatives to help develop more sustainable solutions.We use natural resources responsibly and are actively working towards a more sustainable supply chain.
Neste Oil observes the OECD’s recommen-dations for multinational companies and its recommendations on good corporate gov-ernance; and operates in accordance with the UN Charter on Human Rights and the ILO Declaration on Fundamental Principles and Rights at Work.
Responsibility is a key issue in Neste Oil’s management system and one of the company’s four core values. We strive for stable and responsible operations, whether in terms of smooth-running processes, high standards of occupational safety, or minimizing environmental impact.
Reporting principles
We develop our responsibility-related reporting in line with
accounting legislation and other developments. While we
monitor the reporting guidelines published by the Global
Reporting Initiative (GRI), we do not implement the GRI ap-
proach systematically. Our goal is to present the fundamen-
tal factors, targets, and risks associated with our operations
and our products as they affect our stakeholders.
Our reporting covers all operations over which Neste Oil
has immediate control.
We observe IFRS accounting practice in our financial
reporting. While the sustainability indicators published
to complement our financial statements have not been
audited or confirmed by a third party, we have reviewed
the quality and extent of the environmental information
we provide with an outside consultant. The environmental
costs and responsibilities presented are based on Finnish
accounting legislation. We have used internal means to
confirm the quality and reliability of the information given.
3.1
32 Responsibility | Our approach to responsibility

Targets for 2008 Actions and achievements Targets for 2009
Environmental responsibility
Compliance with all official HSE-related permits and requirements
Compliance with permits and requirements followed systematically, no major deviations
Compliance with all official HSE-related permits and requirements
Smaller number of uncontained major spills than in 2007
Unchanged from 2007. Neste Executive Team reviewed the divisional targets and actions
Smaller number of uncontained major spills than in 2008
Evaluate all Neste Oil’s biofeedstock suppliers against the company’s supplier selection criteria
Achieved Evaluate all Neste Oil’s biofeedstock suppliers against the company’s supplier selection criteria
Audit program covering the company’s biofeedstock suppliers
Achieved Continue the audit program that gives particular emphasis to reviewing corrective actions
Achieve a reduction of 320,000 tons of greenhouse gases through the use of NExBTL renewable diesel compared to those generated by high-quality conventional diesel
Greenhouse gas emissions reduced by 160,000 tons
Achieve a reduction of 320,000 tons of greenhouse gases through the use of NExBTL renewable diesel compared to those generated by high-quality conventional diesel
Social responsibility
Achieve a total recordable incident frequency (TRIF) of under 5 per million hours worked
5.2 Achieve a total recordable incident frequency (TRIF) of under 4 per million hours worked
Achieve a lost work incident frequency (LWIF) of under 3 per million hours worked
3.2 Achieve a lost work incident frequency (LWIF) of under 2 per million hours worked
Promote a strategy- and value-driven leadership development model
436 people took part in the “Leading for the future” leadership and management skills programAverage feedback from training was 4.09 on a scale of 1 to 5
Develop management training programs further and ensure that they are implemented successfully
Develop a gender-neutral working environment in accordance with an annually updated plan
Equality of pay was promoted through separate equality payments and by working to keep pay grades up-to-dateIn addition to a Group-level plan, divisions have drawn up and implemented their own equality plans
Ensure that equality of pay continues to be prioritized, and work to increase the number of women in different positions and among interns and diploma students
Improve employees’ wellbeing at work Well-being development projectMore effective sick leave reportingComprehensive work-related well-being examinationsSick leave: 3.74%Satisfaction index 65.0
Communicate the results of the well-being development project and launch new measures and courses on the basis of its results
Strengthen the image of the chemical industry and Neste Oil as employers
Cooperation with Finland’s Youth AcademyDecision to support a school chemistry class A recruitment section launched at www.nesteoil.comSummer internships offered to around 300 young peopleTraining and diploma thesis places offered to around 100 students
Strengthen Neste Oil’s profile as an employer in Finland and other countries, and promote the general perception of the chemical industry
Financial responsibility
Return on average capital employed after tax (ROACE) of at least 15%
13.1% Return on average capital employed after tax (ROACE) of at least 15%
Leverage ratio of 25-50% 31.5% Leverage ratio of 25–50%
Distribute a dividend equivalent to at least one third of underlying profits*
51% Distribute a dividend equivalent to at least one third of underlying profits*
Responsible corporate citizen
Retain Neste Oil’s position in three corporate responsibility studies
Achieved - Neste Oil reached 73% in the Dow Jones Sustainability Index
Retain Neste Oil’s position in four corporate responsibility studies and improve the company’s performance in the Dow Jones Sustainability Index
Results of responsibility-related initiatives
* Based on the comparable operating profit for the year.
33Responsibility | Our approach to responsibility
Neste Oil 2008

performance-related pay, bonuses, and vacation pay.
Social benefits paid totaled EUR 64 mil-lion (46 million) and included pension and social insurance and unemployment and disability payments. Salaries and wages, other remuneration, and social benefits totaled EUR 315 million (256 million).
Neste Oil observes the requirements of local employment legislation and employ-ment contracts in all the countries in which it operates. Salaries are set on the basis of people’s responsibilities and training in the light of local pay scales. Although legisla-tion and other regulations set minimum pay levels, actual salaries and wages are typically higher. The ultimate sum paid is determined by local conditions, the nature of a person’s responsibilities, their capabili-ties, and their performance. Around 84% of employees come within the scope of a bonus or incentive scheme.
An attractive dividend for shareholdersNeste Oil had 66,859 shareholders as of the end of 2008. Shareholders benefit from their holdings through dividends and possible increases in the share price. The Finnish State owned 50.1% of shares, international shareholders 20.6%, Finnish institutions 19.5%, and individual Finnish shareholders 9.8%.
Financial responsibility
A financially responsible company contributes to the overall prosperity of society. A competitive and profitable business benefits a company’s shareholders, its employees and partners, and society as a whole.
Neste Oil is committed to profitable growth and increasing shareholder value. Provid-ing good conditions and competitive pay for employees, supplying customers with quality products and services, and working effectively with stakeholders are all essential to achieve this. Neste Oil believes in the im-portance of acting responsibly in all areas of its business.
Neste Oil’s operations make a valuable contribution to the economy of the areas, regions, and countries in which it operates.
Cleaner traffic fuelsNeste Oil creates added value for its cus-tomers by supplying a range of products and services that meet their needs and their expectations. To ensure that it can continue to serve them in the best possible way into the future, Neste Oil carries out long-term R&D and makes major invest-ments in its business. Neste Oil’s direct customers include other oil companies, companies, and consumers. Revenue from customers in 2008 totaled EUR 15,043
million (12,103 million). Sales per employee totaled EUR 2.91 million (2.52 million).
Neste Oil offers a solid source of busi-ness to numerous suppliers and subcon-tractors. The company paid EUR 14,376 million (10,916 million) to suppliers of goods and services in 2008, equivalent to 96.0% of its revenues. Payments related to the purchase of crude oil and other feedstocks accounted for the single largest item: EUR 13,519 million (10,352 million).
The bulk of feedstocks used came from Russia (72%); smaller volumes were sourced e.g. from other countries of the former Soviet Union, Britain, Norway, Denmark, and Malaysia.
Rewarding people for a job well doneNeste Oil employed an average of 5,174 (4,810) personnel in 14 countries in 2008. Total salaries, wages, and remunerations, excluding social benefits, amounted to EUR 251 million (210 million), equivalent to 1.67% (1.74%) of net sales. This figure includes
0
3,000
6,000
15,000
Products, materials, and services purchasedEUR million
05 06 07 08
9,000
12,000
0
50
100
150
250
Income tax
EUR million
05 06 07 08
200
0
50
100
150
300
Salaries and wages
EUR million
05 06 07 08
200
250
3.2
34 Responsibility | Financial responsibility

Neste Oil’s policy is to distribute a minimum of one third of its underlying profit in the form of an annual dividend. The com-pany paid a dividend of EUR 1.00 per share on its 2007 result in spring 2008, equivalent to EUR 256 million. The Board of Directors
proposes that a dividend of EUR 0.80 per share be paid for 2008, or a total of EUR 205 million. Neste Oil’s share on the NASDAQ OMX Helsinki fell by 52% during 2008, and the company’s market capitalization as of the end of the year stood at EUR 2.7 billion, or 56% less than at the end of 2007.
EUR million 2008 2007Suppliers of products and services
Purchases of crude oil and other refinery feedstocks 13,519 10,352
Other 857 564
Personnel
Salaries and wages 251 210
Social benefits 64 46
Owners and financial community
Dividends 205* 256
Interest and financing costs 70 40
Public sector and society
Income tax 28 183
Fuel taxes and security of supply fees 1,857 1,664
Environmental taxes and fees 9 8
Charity and sponsorship 1 1
A competitive, profitable business is essential for financially responsible operations.
Generating financial added value for stakeholders
Neste Oil
Tax revenue for societyCorporate taxes represent an important source of income to government. Neste Oil paid a total of EUR 28 million of tax on its result in 2008 (183 million). Central and local government also benefit from the income tax personnel pay on their salaries and wages. Environmental taxes and fees, such as oil pollution fees and oil waste duties, amounted to EUR 9 million (8 million). As a fuel wholesaler, Neste Oil collected a total of EUR 1,857 million in fuel taxes and security of supply fees paid for by end-users in fuel prices (1,664 million).
Neste Oil received EUR 12 million (8 million) in financial support from the public sector in 2008, mainly in the form of funds for R&D projects.
0
1,000
1,500
2,500
Capital structure
2,000
Cash and cash equivalentsShareholder equityShort-term interest-bearing debt
Long-term interest-bearing debtTotal interest-bearing debt
500
EUR million
05 06 07 08
CustomersNet sales in 2008 EUR 15,043 million (12,103 million).
State supportEUR 12 million (8 million)
Other revenueEUR 32 million (19 million)
* Proposal by the Board of Directors to the Annual General Meeting
35Responsibility | Financial responsibility
Neste Oil 2008

Environmental responsibility
Our strategy underpins our approach to environmental responsibility. We have been a pioneer of lower-emission traffic fuels for many years, and environmental issues are prioritized throughout product development work. A growing proportion of production is based on renewable feedstocks and new technologies.
The oil industry has a major impact on shaping the world’s biodiversity, throughout the product chain, from crude production through logistics and product manufacture to end-product use.
A large proportion of the impact Neste Oil’s own operations have on the environ-ment is concentrated in refining and end-product use, and is linked to the energy and natural resources the company uses and the emissions it generates.
Innovations for combating climate changeNExBTL renewable diesel is Neste Oil’s most important contribution to efforts to combat climate change. Produced using Neste Oil proprietary technology, NExBTL is the world’s cleanest diesel fuel and can be used in all modern diesel engines.
The greenhouse gas emissions of NExBTL renewable diesel produced from sustainable raw materials, as measured
over the fuel’s entire life cycle, are 40-60% less than those of fossil diesel. The main challenge associated with the fuel is the availability of responsibly produced raw material inputs – which is why Neste Oil is working to identify and develop new alternatives that do not compete with food production and do not require the use of additional farming land (see Page 45).
Neste Oil’s base oil, used in lubricants, also makes a valuable contribution to the environment. Being able to increase oil change intervals from 5,000 kilometers to 50,000 kilometers is a definite advantage in terms of sustainable development – and is made possible using the premium-quality base oil produced by Neste Oil.
High-octane, low vapor pressure gaso-line components, such as Neste Oil’s iso-octane, enable ethanol to be blended into
The majority of the greenhouse gas emissions generated by renewable fuels are released during cultivation and refining of the raw materials used in producing them. While usage of these fuels generates CO2 emissions, this does
not add fossil carbon to the CO2 in the atmosphere, which is why emissions from renewable fuels are not included in the balance figures for the production chain.
The majority of the emissions generated by fossil diesel refined from crude oil are generated during usage, when the carbon contained in the crude is released into the atmosphere in the form of CO2.
Greenhouse gas emissions generated during the product chain NExBTL renewable diesel compared to fossil diesel
* EU directive on promoting the use of energy from renewable sources 17.12.2008.
0 10 20 30 40 50 60 70 80 90
Source: Nikander (2008)
Fossil fuel*
NExBTL (rapeseed oil)
NExBTL (palm oil)
NExBTL (animal fat)
UsageRaw materialsRaw material deliveries Refining
Product deliveries
Greenhouse gas emissions (g CO2eq/MJ)
3.3
36 Responsibility | Environmental responsibility

gasoline, and make their own contribution to combating climate change. These com-ponents also promote efficient combustion and reduce tailpipe emissions.
Neste Oil also offers a range of ad-vanced technologies for producing lower-emission products to other companies.
Environmental impact of raw materialsIn terms of the raw materials it uses, Neste Oil’s potential to make a positive environ-mental contribution differs significantly between crude oil and renewables.
Monitoring crude oil production is challengingThe international trade in crude is con-centrated in a few major centers without any direct contact with the areas where it is produced. Buyers typically know only
the country of origin when buying crude in Rotterdam, for example, and its technical properties. Establishing the ori-gin of the Russian Export Blend crude that Neste Oil uses in large quantities is equally challenging. The oil loaded at the Primorsk terminal arrives from various areas across Russia via a pipeline network stretching thousands of kilometers. The situation is slightly clearer in respect of the feedstocks that Neste Oil imports by rail, as we generally know the areas from which this originates.
Sources of renewables are well-knownAs part of its strategy, Neste Oil is com-mitted to extending its feedstock base. Although palm oil and other types of vegetable oil, together with animal fat, cur-rently provide a good basis for producing renewable fuels, they will be joined by new alternatives in the future. Neste Oil currently uses the bulk of its R&D funds on develop-ing new feedstocks, and is working with over 20 universities and research insti-tutes internationally on a range of different alternatives. Neste Oil has already tested jatropha, a non-food oil plant, and is devel-oping techniques for making use of forest harvesting waste and algae.
We know significantly more about the origin of the renewable raw materials we use than we do about our crude oil – thanks in large part to the unique monitor-ing system that we have developed that enables us to trace the origin of our palm
oil all the way back to the plantation. The use of segregated handling and transport guarantees that we are not supplied with material that does not meet sustainability criteria. The effectiveness of the system was confirmed by a third-party audit in 2008.
The animal fat that we use comes from two Finnish plants that both have a well-monitored procurement chain. Our rape-seed oil comes from a Finnish supplier.
Neste Oil is involved in promoting the sustainable production of renewable raw materials through organizations such as the Roundtable on Sustainable Palm Oil (RSPO) and the Roundtable on Responsible Soy.
Protecting biodiversityNeste Oil is committed to efforts aimed at halting the destruction of rainforest and the reduction of biodiversity, and irresponsible land use. The company has been an active promoter of common ground rules cover-ing the raw materials used in producing biofuels that governments, the international community, and all those in the industry can abide by.
Loading oil palm fruit onto a truck before sending it to be pressed.
Recycling CO2
The carbon dioxide generated by the hydrogen plant supplying the new diesel line and other units at the Porvoo refinery is recovered and fed to a storage facility operated by AGA, which supplies the gas to industrial customers. Over 100,000 t/a of CO2 are recovered in this way. There is some uncertainly over how the European emissions trading system will treat this gas, however, and a large proportion of it could require an official allowance, even though it is not released into the atmosphere.
We act.We are working with over 20
research institutes worldwide to identify and develop new renewable raw materials.
37Responsibility | Environmental responsibility
Neste Oil 2008

Neste Oil joined an International Sustain-ability and Carbon Certification (ISCC) trial in Germany in 2008 aimed at establishing the sustainability of segregated palm oil, improving the accuracy of greenhouse gas calculations, and defining product chain ownership. The project uses a German–based international certification system and will end in 2009.
Greater price turbulence has developed on the international food market recently, and has largely resulted from increased consumption, changes in what people eat, higher energy prices, poor harvests in major producer countries, speculators moving into the food market – and, to a lesser extent, by the use of materials in the food chain as energy. While committed to increasing its output of renewable fuels, Neste Oil aims to exit the food chain.
For more on future raw materials, see Page 45.For more on NExBTL renewable diesel, see Page 20-23. For more on palm oil certification, see www.rspo.org.
Production-related environmental impactEnvironmental emissions at Neste Oil’s production plants in 2008 were largely at the low levels seen in previous years. Emissions remained within environmental permit limits for the major part. Extensive work has been done at all sites to prevent pollution of the soil, groundwater, and waterways; and sys-tematic cleanups have been carried out to eliminate past problems. Environmental per-formance is monitored on a regular basis.
Energy and natural resource usageNeste Oil’s Porvoo refinery is a major user of energy and natural resources. Electricity, steam, and heat are generated at the site in a modern combined cycle power plant fired on natural gas and fuel oil. Electricity is supplied to the majority of the companies in the Kilpilahti industrial area.
In contrast to the majority of European refiners, which continue to use more pollut-ing liquid fuels, Neste Oil fires only gaseous fuels in its refinery furnaces.
Neste Oil used 7.9 million m3 of water in its processes in 2008 and 1,172 million m3 of cooling water.
Wastewater is processed in highly-effi-cient treatment plants featuring mechanical, chemical, and biological treatment proc-esses. Activated carbon filtering is used with certain effluent streams, particularly those coming from petrochemical production.
CO2eq
How we combat climate change
13.5 million tons less in CO2 emissions
1 2
2
3 45 6
6 66
Application areas for premium-quality base oils1 Engine oil2 Driveline fluids3 Power steering fluid4 Shock absorber fluid5 Gear oil (manual, automatic, direct-shift gearbox)6 Greases
Lubricants produced from premium-quality base oil offer a number of benefits, including reducing the friction between engine and trans-mission components and friction-related wear. This can result in fuel savings of 1-2% compared to poorer-quality lubricants. Motor oils produced from premium-quality base oil also offer a sig-nificantly longer oil change interval.
If all the investments currently planned are implemented, Neste Oil will produce 1.2 million t/a of premium-quality base oil in the future. This will generate, in theory, a reduction of 13.5 mil-lion t/a in CO2 emissions, when taking mileage, average lubricant consumption, and the fuel savings resulting from the use of Neste Oil’s base oil into account.
It is theoretically possible for Neste Oil’s current base oil output (250,000 t/a) to achieve a reduction in CO2 emissions equivalent to the mileage driven by around 1 million cars annually.
* In co-operation with
automotive manufactures
38 Responsibility | Environmental responsibility

Neste Oil and Stora Enso are working together to develop a new generation of biofuel pro-
duction technology based on using wood-based biomass to help reduce the use of fossil fuels and reduce greenhouse gas emissions. A joint venture pilot plant has been designed and is being built at Stora Enso’s mill in Varkaus as the first stage of the project. Biowax produced by the process can be refined into commercial fuel at Neste Oil’s Porvoo refinery.
Neste Oil’s and Stora Enso’s pilot plant will process a range of forest harvest-ing waste and mill by-products, such as branches, stumps, bark, sawdust, and cut-ter chips. The advantage of the cellulose-based process lies in the fact that it does not add to the CO2 burden put on the climate as it makes use of the natural cycle that binds carbon to wood.
Clean diesel fuel from harvesting waste
Improving the way natural resources are usedUsing natural resources efficiently is an in-tegral part of environmental responsibility. In the case of Neste Oil, this means things like:
continually improving energy efficiency, using the Solomon Associates’ Energy Intensity Index (EII)sourcing inputs responsibly and working through organizations such as the Roundtable on Sustainable Palm Oil (RSPO), the Roundtable on Responsible Soy (RTRS), and the Roundtable on Sustainable Biofuels (RSB)participating in research and benchmarking carried out by the Conservation of Clean Air and Water in Europe organization (CONCAWE)developing better products and processes with a lower level of climate impact, and using responsibly produced services and utilities; in Finland, for example, Neste Oil only buys carbon-free ‘Norppa’ electricity.
Low level of airborne emissionsNeste Oil’s airborne emissions in 2008 remained at the levels seen in recent years. Details on the company’s material balance can be found on Page 43 and on refinery emissions on Page 42.
CO2 emissions have increased at the Porvoo refinery following the completion of the hydrogenation plant that forms part of the new diesel line there. The plant’s overall impact has been neutral, however, as the hydrogen content of crude-based end-products has risen and their relative carbon content dropped.
The overall sustainability of the pro-cess is further reinforced by its efficiency. The energy generated by the process can be used in the form of electricity and as steam and district heat by the adjacent paper mill and the local municipality.
Stora Enso will be responsible for sup-plying the biomass, which must be dried before gasification. The resulting syngas will then be processed via a synthesis to produce biowax. The latter will be trans-ported to Porvoo for refining into premi-um-grade renewable diesel fuel.
The plant’s gasifier is already op-erational, and the second stage of the project, a synthesis plant, will be commis-sioned in 2009.
0
40
60
100
The Porvoo refinery’s sulfur balance compared to the Western European refinery average Ultimate destination of the sulfur in crude inputs, %
80
Recovered sulfurBitumen productsFuels
Refinery emissionsUnknown
* More recent European data is not yet available
Sources: CONCAWE and Neste Oil
Waterborne emissionsWastewater treatment systems at both re-fineries operated excellently throughout the year. Oil emissions, at 0.1 grams per ton of crude input, were less than 3.5% of the 3 g/t target set by the Baltic Marine Environmen-tal Protection Commission.
The Porvoo and Naantali refineries have had a voluntary groundwater monitoring program in place since 1995, and its work is continuing. Soil contaminants have not been found off-site.
20
Neste Oil, Porvoo 2007
Western Europe 2002*
0
8
12
20
Major spills
04 05 06 07 08
16
In-house incidents Incidents involving Neste Oil’s transport companies
4
Number of spills
A total of three cases involving Neste Oil occurred in 2008 in which over 500 liters or kilos of environmentally hazardous substances leaked into the environment. One of these took place during transportation and affected a transportation company employed by Neste Oil. All spilled material was cleaned up and no contamination remained in the soil or water. No damage resulted to the environment.
39Responsibility | Environmental responsibility
Neste Oil 2008

Sustainably produced palm oilNeste Oil has studied and tested a wide variety of renewable raw materials, and the flexibility of its renewable diesel technol-ogy means that it can produce consistent premium-quality fuel from a mix of inputs. Responsible production methods, avail-ability, and price are given priority when procuring raw materials for renewable diesel usage. Sustainably produced palm oil has proved a good raw material in terms of all three criteria, and has an excellent green-house gas emissions balance compared to many other raw materials.
Neste Oil has worked hard to ensure that the palm oil it uses is produced responsibly and to develop common ground rules for all those in the industry.
In 2005Neste Oil applied for membership of the Roundtable on Sustainable Palm Oil
In 2006Neste Oil was the first oil company to join the RSPOcreated a set of responsible terms and conditions for negotiations with potential suppliersorganized internal training on sustainability issuesinitiated public discussion via the company’s stakeholder magazine on sustainability issues related to palm oilcarried out its first inspections of plantations and oil mills
In 2007Neste Oil confirmed its sustainability development principles covering biofuels
Ensuring that palm oil is a truly sustainable raw material
SaplingsOil palm saplings are grown in nurseries alongside plantations.
Neste Oil knows the origin and history of the palm oil that it uses in great detail. Working with its suppliers, Neste Oil has developed a monitoring system that can trace its palm oil from the plantation and the cultivation methods used there, through pressing and transportation, all the way to a NExBTL plant. The system and its reports are regularly audited by third-party experts. Cultivation
Saplings are planted when they are around one year old. The cultiva-tion methods used ensure healthy growth and that palms can be harvested for around 25 years.
PlantationsPlantations follow the sustainable development principles estab-lished by the RSPO. Palm oil des-tined for Neste Oil is segregated to ensure that it can be fully traced throughout the supply chain.
Continuous monitoringNeste Oil has monitored its impact on the environment for over 20 years, and the data from this work confirms that a major reduc-tion has taken place and provides a solid base of information for understanding the nature of the impact involved. The envi-ronmental performance of the company’s production sites is excellent today.
Monitoring takes places on a continuous basis:
air quality is monitored by measuring ambient concentrations of sulfur dioxide, reduced sulfur compounds, NOx, and ozone the impact of airborne emissions are monitored using bioindicators to analyze how pollutants affect the incidence and nature of lichen on the bark of pine trees in the areaseawater quality and sediment compo-sition are monitored, together with local fisheries groundwater and surface water quality at refineries is monitored regularlyplant noise is measured regularly at loca-tions most subject to this type of impact
Broad-based environmental monitoring around Neste Oil’s refineries has been carried out since the 1970s. Emissions have fallen steadily, and the quality of the environ-ment around the Porvoo site, for example, is well on the way to returning to the condi-tions that existed prior to the building of the site – as reflected in the growing incidence of sensitive plants such as lichens in the surrounding forest.
consolidated criteria used for selecting raw material supplierscommissioned a third-party expert audit of its suppliers’ production chainstarted up its first NExBTL plant at Porvootook part in the annual meeting of the RSPO that approved the organization’s criteria and principles covering sustainable cultivation methodscommitted the company to using solely RSPO-certified palm oil immediately sufficient volumes become availablejoined the Roundtable on Sustainable Biofuelsdeveloped and introduced a unique system for tracing its palm oil supply chain, the first of its type anywhere in the energy sector
In 2008Neste Oil produced an assessment of the greenhouse gas and energy intensity of its product chain and a new type of modular life cycle analysis method for biofuelscommitted the company to an international alliance calling for a ban on the felling of rainforesttook an active part in national and international debate on biofuels and communicated information on NExBTL technology to the EU as part of the latter’s legislative work in the fieldplanned a number of projects in Southeast Asia designed to promote local biodiversity and protect local rainforestscommissioned an impartial third-party audit of the traceability of its raw material supply chaintook an active part in further developing the palm oil certification system.
40 Responsibility | Environmental responsibility

RefiningPalm oil is refined in a dedicated plant at the Porvoo refinery into premium-quality NExBTL renew-able diesel.
HarvestingDuring harvesting, the bunches of ripe fruit are cut and trans-ported to a pressing plant. Fruit are segregated to ensure traceability.
TransportationNeste Oil’s palm oil is shipped by sea in sealed tanks to Europe.
PressingThe fruit are removed and pressed mechanically to release the oil they contain. This is piped to tanks to await transport. Waste is recycled as fertilizer.
Recognizing environmental risksNeste Oil has reviewed the health, safety, and environmental impact of its opera-tions in detail and the risks associated with potential major accidents – and used this data to create an action program that is updated annually. Together with other companies based in the Kilpilahti area at Porvoo, Neste Oil has also commissioned a separate analysis of how the risks as-sociated with major accidents should be prepared for, and its results were used in zoning new areas in 2008, for example.
Exercises covering crisis management and communications during major acci-dents are carried out at least once annually.
Neste Oil produces an annual review of the environmental risks and liabilities associ-ated with its operations, assesses the provi-sions required under accounting standards, and makes its liabilities public.
Major incidents in 2008The following incidents were reported in 2008:
4 fires3 oil leaks54 lost workday injuries
None of these resulted in environmental pollution. The fire in April on the new diesel line at Porvoo and the shutdown that followed did impact the company’s result for 2008, however.
In addition to the cases mentioned above, a number of smaller incidents also occurred. All incidents, however small, are reported, and the reasons behind them
0
1
2
3
4
Neste Oil's CO2 emissions and emission allowancesMillion tons of CO2 annually
CO2 emissionsEmission allowances
Estimated CO2 emissions
09 10 11 12
3.5
1.5
2.5
0.5
05 06 07 08
The company will acquire emissions allowances between 2008 and 2012 to match the level of its emissions.
What if?
1. Energy usage at Neste Oil’s refineries would be reduced by 5%
2. The energy efficiency in the use of Neste Oil’s fuels would be improved by 1%
3. The energy efficiency in the use of Neste Oil’s fuels would be improved by 5%
Calculatory reduction in greenhouse gas emissions when
4. The base oil produced by Neste Oil today reduces average fuel consumption by 1%
5. The combined output of Neste Oil’s NExBTL renewable diesel plants at Porvoo, Singapore, and Rotterdam, when they are all fully operational, will replace fossil diesel and generate emission reductions over the product life cycle
6. Base oil from the new plant being built by Neste Oil and its partners in Bahrain will reduce average vehicle fuel consumption by 1%
Ways to cut greenhouse gas emissions
Reduction in CO2 emissions (million t/a)
1.50.50 1 2 2.5 3 3.5 4 4.5 5
RedRed1
2
3
44
5
6
investigated and corrective measures taken immediately where appropriate.
Information on incidents is communi-cated in writing to people living nearby, the authorities, contractors, and the media.
Oil leak at Naantali in 2001 results in a fineFinland’s Supreme Court fined Neste Oil EUR 500,000 in March 2008 for environ-mental damage related to the leak of an estimated 300 m3 of oil at the Naantali refinery in December 2001. The majority of the oil remained within the site’s protective basins, although some three cubic meters spilled over and soaked through the ground into the sea.
41Responsibility | Environmental responsibility
Neste Oil 2008

Nynas has implemented the audit findings into its operational and investment plans for 2009-2011. Environmental audits were also carried out at two storage facilities leased for trading purposes, and a set of leasing guidelines produced.
Progress on Responsible CareNeste Oil is committed to the international chemical industry’s Responsible Care (RC) program, aimed at improving health, safety, and environmental performance. The com-pany reports its emissions, accidents, and progress as part of national RC reporting annually. Neste Oil is the first Finnish com-pany to have committed to the RC Global Charter, which underlines the importance of responsibility and accountability in the initial stages of the product chain and in technology transfer.
During 2008, Neste Oil concentrated its RC-related work on employee and process safety and developing its product liability and transport safety capabilities. All the drivers used by the company’s contract transport companies received additional training.
Environmental impact of logisticsRoad-based deliveries of Neste Oil’s petro-leum products are handled by a fleet of 150 tanker trucks owned by private companies and painted in Neste Oil colors. These carry over 3 million tons of products annually. Par-ticular attention has been given to safe driv-ing practices that anticipate road and traffic conditions, and 400 drivers have received training in this area. This has resulted in an approximately 2 l/100 km reduction in fuel consumption and an equivalent reduction in CO2 emissions.
Distribution routes and cargo volumes are carefully optimized to be as efficient as possible. Vehicles are kept up-to-date and feature the latest Euro 3 and Euro 4 engines.
Shipping carries tens of millions of tons of crude, petroleum products, and
Neste Oil was involved in the following joint initiatives in 2008
Responsible CareResponsible Care Global CharterRoundtable on Sustainable Palm OilRoundtable on Responsible BiofuelsRoundtable on Responsible Soy
Previous judgments by the Turku Court of Appeal and the District Court of Turunseutu had rejected the prosecution’s call for a fine.
Tougher permit limitsEnvironmental (IPPC) permits are required for the operations of Neste Oil’s refineries. The permit granted to the Naantali refinery in November 2007 sets tough requirements in respect of the volume of permitted emis-sions, environmental measures, and official reporting. In December 2008, the Vaasa Administrative Court issued its findings on the environmental permit issued to the Porvoo refinery in 2006. Neste Oil decided to appeal the verdict to the Supreme Ad-ministrative Court.
Both refineries took the necessary ac-tions in 2008 required under the terms of European emissions trading regulations.
The new measures called for under Europe’s Registration, Evaluation and Au-thorization of Chemicals (REACH) regulatory framework, which came into force in June 2007, were introduced by Neste Oil’s REACH team in respect of registering chemicals imported and produced by the company. Preregistration was completed by the end of November 2008.
Neste Oil’s refinery emissions, feedstocks, and products Porvoo refinery Naantali refinery
2008 2007 2006 2008 2007 2006
Emissions to air
CO2 (t/a) 2,985,657 2,763,950 2,496,213 417,042 411,044 324,616
VOC (t/a) 2,669 2,970 2,319 920 921 1,490
NOX (t/a) 3,508 3,725 3,540 343 290 267
SO2 (t/a) 5,302 5,345 4,540 1,424 1,625 1,319
Emissions to water
Oil (t/a) 1.06 1.56 2.02 0.50 0.34 0,67Chemical oxygen demand, COD (t/a) 259 359 476 138 82.4 290.2
Waste
Ordinary waste (t/a) 13,534 20,180 6,888 1,114 1,195 2,348
Hazardous waste (t/a) 20,499* 15,154* 9,291* 3,150* 5,853* 8,685*
Feedstocks
Crude oil (t/a) 9,410,000 9,350,000 9,632,000 2,771,453 2,761,366 2,210,012
Other feedstocks (t/a) 2,990,000 2,066,000 2,514,000 910 3,290 43,259
Products
LPG (t/a) 400,400 357,000 379,000 27,167 27,184 15,015
Gasoline (t/a) 3,767,000 3,891,000 4,132,000 657,988 681,167 588,085Diesel fuel and heating oil (t/a) 6,133,400 5,713,000 5,610,000 1,066,998 1,070,306 817,421
Heavy fuel oil (t/a) 866,000 755,000 1,260,000 312,799 308,441 245,421
Bitumen (t/a) 386,000 324,000 58,900 331,410 292,425 217,487
Sulfur (t/a) 143,500 84,000 63,000 15,743 14,051 8,898
Solvents (t/a) 216,295 225,310 188,170* Includes contaminated soil
Third-party auditsNeste Oil’s operations are covered by a comprehensive management system that also extends to the requirements contained in environmental, health, safety, and quality standards. In-house audits are carried out to check the effectiveness of this system, together with annual impartial third-party audits. Separate internal HSE audits contin-ued in 2008.
An environmental and safety audit of Neste Oil’s joint venture, Nynas AB, was carried out in 2008 as part of the com-pany’s continuous improvement efforts. The environmental section of the audit covered all of Nynas’ operations, including its four refineries, five affiliate refineries, and 18 terminals. The section of the audit focus-ing on process safety and fire protection concentrated on the four main refineries.
Neste Oil has monitored the environmental impact of its operations systematically for over 20 years.
42 Responsibility | Environmental responsibility

chemicals by sea annually. All ships are ice-strengthened and double-hulled, and escort tugs are used to accompany large tankers in and out of harbor. The bulk of the crude oil used at the company’s refineries comes from Russia and is delivered by sea.
The adoption of a new basic speed of 13.5 knots and the issuing of detailed guidelines on bunker fuels resulted in a reduction in fuel consumption and CO2 and other emissions, together with cost savings. Neste Oil is also testing flue gas scrubber technology to reduce SO2 emissions.
Shipments of feedstocks and products by sea can result in the spread of non-indigenous marine species, through things such as bilge water. Shipping has worked with the authorities to study and clarify the implications of this problem.
Environmental impact of end-use Neste Oil makes its biggest contribution to combating climate change through its products. The latter generate more than 10 times the emissions released during refining and transportation, which makes the potential for reductions much greater. The more energy-efficient product usage is, the lower the level of greenhouse gas emis-sions will be. Savings can bring a relative CO2 reduction running into millions of tons.
Acting to reduce local and global emissionsEmissions released through the usage of petroleum products impact air quality and contribute to a reduction in biodiversity. This is particularly true of nitrogen and sulfur oxides. Improving product quality and thereby promoting the introduction of new and better engine technology can
help improve air quality, particularly in urban areas, and reduce health and environmen-tal problems. While it has proved possible to reduce the growth in traffic emissions in many European countries in recent years, traffic remains a central negative factor in terms of air quality.
Neste Oil refines an increasing volume of higher-quality traffic fuels from crude oil, and modern engines need less of these fuels to travel further. Lower usage benefits drivers, air quality, and the environment generally, as the bulk of a fuel’s emissions over its entire life cycle are released when it is used.
Neste Green diesel, launched in 2008, contains a minimum of 10% NExBTL renew-able diesel and cuts tailpipe emissions
and enhances urban air quality. Combating climate change calls for rapid action and more sustainable products like this that make a positive contribution.
New bio heating oil in FinlandNeste Oil launched a new heating oil containing 2% NExBTL in Finland in January 2009. Suitable for use in all modern oil-fired heating systems, it offers excellent efficien-cy and lower emissions.
Adding a renewable component to heating oil is yet another way of responding to the climate challenge. The 2% biocom-ponent content of the new fuel could reduce consumption of conventional oil on a national scale by the equivalent of the oil used by 10,000 family homes.
0
16
20
SO2 concentrations around the Porvoo refinery
83 84 85 86 87 88 89
SO2 emissions from the refinery SO2 concentrations at the Mustajoki measurement station, around five kilometers from the refinery
SO2 concentration, g/m3 (annual average)
8
12
4
01 02 03 04 05 06 07 0890 91 92 93 94 95 96 97 98 99 000
18,000
30,000
8,000
12,000
4,000
SO2 emissions from the refinery, t/a
Neste Oil’s material balance, 2008
1 ) Raw materials include primary and secondary raw materials 2) Waste figures do not include waste generated by the service station network 3) Refinery effluent contained 1.6 tons of oil
The limit value for SO2 to protect the ecosystem has been set at 20 g/m3 (VnA 711/2001).
43Responsibility | Environmental responsibility
Neste Oil 2008

Research & Technology
Neste Oil’s Research & Technology Unit develops products and product-related services, refining processes, and catalysts – and ensures that fuels perform as expected.
High quality and environmental expertise have been a feature of the products and technologies developed by Neste Oil for many years. Research is primarily focused on developing lower-emission traffic fuels and the process technologies and feed-stocks needed to produce them.
An increasingly important roleThe role of R&D projects has grown sig-nificantly in recent years. This has been reflected in the number of personnel in the Research & Technology Unit, which rose by around 12% in 2008; the unit has also strengthened its expertise in key areas of expertise and its focus on the company’s growth businesses. R&D expenditure in 2008 totaled EUR 37.1 million, an increase of a third on 2007 (28.4 million). The role of R&D is expected to continue growing over the next few years.
Key areas covered by R&D projects in 2008 included:
technical support and ongoing process development for the new diesel line at Porvoonew renewable raw materialsNExBTL technologybiomass-to-liquid (BLT) technology for producing fuels from wood-based biomass.
New feedstocks and technologiesAround 75% of total expenditure on R&D projects is currently devoted to developing new renewable raw materials and refin-ing technologies that can process them. Expenditure in this area rose by over 50% in 2008, and totaled EUR 18 million (11.5 million).
Neste Oil is working increasingly closely with leading research institutes in a variety of fields. In the case of renewable raw materials, this involves partners at over 20 universities and institutes worldwide.
Neste Oil has developed a number of industry-leading technologies, including NExBTL, for producing renewable diesel, NExOCTANE, for producing iso-octane, and NExETHERS, for producing ethers such as TAME and ETBE.
High-quality engineering resources are essential for implementing the capital projects typical of the oil and chemicals industries and developing the new technologies they use. Neste Jacobs is the leading provider of these services for oil, chemicals, and biotechnology companies in the Nordic region today – and extended its operations in 2008 with the acquisitions of Rintekno, a Finnish engineering consultancy.
Neste Jacobs offers engineering ser-vices both to Neste Oil and other oil, gas, and chemical companies, and has close to 50 years of experience in a wide range of projects in Europe, North America, and the Middle East. Neste Oil owns 60% of the company and Jacobs Engineering Group, Inc of the US, 40%. The company currently employs around 800 people.
Quality engineering services for the chemicals and biotechnology industries from Neste Jacobs
Less competition with the food chain
Raw material today and in the future
NExBTL and BTL
NExBTL
NExBTL
Now In the future
NExBTL
NExBTLNExBTL
Now
Next-generation bio-oils and waste biomass
Nonfood vegetable oil and nonfood animal fat
Edible vegetable oil and nonfood animal fat
Lower levels of greenhouse gas emissions
3.4
44 Responsibility | Research & Technology

Algae Microalgae produce sugars, lipids, and proteins from CO2, water, and nutrients using photosynthesis. Tens of thousands of
different species exist, and can be found wherever water and light is available. Although these unicellular organisms can divide as often as several times a day, they normally double their biomass in one to three days.
Microalgae are seen as the origin of the world’s crude oil, and most species produce intracellular lipids. Under favor-able conditions, microalgae can produce lipids year-round, and offer a dramati-cally higher production potential than oil plants.
Microalgae can be grown in seawater and on land unsuitable for cultivation, and can make use of the nutrients contained in wastewater, for example. As they also bind CO2, they offer a number of exciting possibilities in helping us meet tomor-row’s energy needs.
R&D progressing on new raw materials
Other microbesAs heterotrophic organisms, microbes are unable to synthe-size organic com-pounds themselves and need to feed
on organic material, such as sugars, to multiply. Especially interesting examples in this category for Neste Oil are bacteria, yeasts, and fungi.
These types of microbes are capable of storing large quantities of lipids in their cells, typically over 50% of their mass. They produce lipids and multiply very rapidly, typically achieving maturity in a couple of days to a week.
Oil-producing microbes can be grown in conventional bioreactors of the type used in the brewing and biotechnology in-dustries. Researchers are looking for suit-able sustainable nutrients that are both cost-effective and available in sufficiently large volumes to maintain industrial-scale production. Agricultural and industrial byproducts represent a possibility here.
JatrophaThe jatropha family includes around 150 plants, shrubs, and trees, all of which contain seeds with a high oil content.
Most jatropha plants are toxic to man and unsuitable for food use.
Jatropha typically grows on poor land, including sandy soil, and in areas that are unsuitable for normal cultivation or are classified as wasteland. Jatropha is used to prevent erosion and desertification, for example, and needs a minimal amount of fertilizer or care. As the plant is also normally free of disease, pesticides are not required either.
Oil typically accounts for around a third of the weight of jatropha seeds. A hectare of jatropha can yield two to five tons of oil and four tons of pressing waste. The latter can be used as fuel or fertilizer. Plants begin producing seeds during the second year after planting and can live around 50 years.
Neste Oil-developed technologies are used worldwide
Mont Belvieu, Texas, US
Corpus Christi, Texas, US
Carson, California, US
Edmonton, Canada
Sohar, OmanSitra, Bahrain
Huelva, Spain
Szezhalombatta, Hungary
Schwedt, Germany
Sarroch, ItalySines, Portugal
Stenungsund, Sweden
Beringen, Belgium
Algae and other microbes can already be produced on a laboratory scale. The real challenge is to increase production to an industrial level, to millions of tonnes per year. There are many unresolved issues, which is why much research is focused on this.
45Responsibility | Research & Technology
Neste Oil 2008

Social responsibility
Neste Oil abides by the principles of sustainable development everywhere it operates. The company is committed to developing better supply chain management and to offering its personnel an interesting, challenging, and safe workplace.
Neste Oil employs around 5,200 people and provides indirect employment to many more working for its suppliers in Finland and elsewhere. A responsible approach to business means that all of Neste Oil’s own employees, together with those in its supply chain, need to be committed to the principles of sustainable development. It also requires open and positive coopera-tion with other stakeholders as well.
Human and labor rights Neste Oil promotes the principles con-tained in the central articles of the United Nations’ Declaration of Human Rights and the policies of the International Labour Organization (ILO). These international agreements form the foundation for the company’s principles and practices in respect of human and labor rights.
Neste Oil offers its personnel a healthy and safe environment to develop their skills and capabilities. All forms of harassment and discrimination, together with child labor, forced labor, and other forms of ex-ploitation are strictly forbidden. Employees are allowed to organize among themselves and belong to associations. All forms of punishment are forbidden.
Human and labor rights are also linked to Neste Oil’s raw material procurement. We recognize the economic and cultural needs of native populations, their traditional way of life, and their legal entitlement to their land.
Neste Oil’s human and labor rights prin-ciples also cover the company’s raw materi-als suppliers and are part of the minimum requirements that suppliers are expected to comply with.
CooperationEmployees are represented in many of Neste Oil’s organizational bodies, both at Group and unit level; and an open dialogue between management and employee representatives is encouraged.
Three employee representatives attend meetings of the Supervisory Board, one from each of the company’s main em-ployee groups. The Management-Employee Group reviews topical issues affecting all personnel. Group-level work in this area is aimed at promoting positive cooperation between employees and management. Divisional-level activities are shaped by divisional and local needs. Typical subjects that can come up for discussion include major changes in responsibilities or prac-tices affecting personnel.
Neste Oil’s internal Communications Committee provides support for internal communications and is designed to act as a forum for discussing communications principles and how communications can be developed. Employees elect seven of the committee’s representatives, and man-agement three. Quarterly briefings on Neste Oil’s performance and operations are held at Group level for all personnel. Numerous other communications channels are used to keep people up-to-date. The Employee Profit-Sharing Fund is managed by person-nel; and employee representatives also sit on the Boards of the Pension Fund and the Insurance Fund.
Management systemNeste Oil updated its management system in 2008. The system’s policies, principles,
and guidelines cover a wide range of day-to-day operations and are designed to encourage everyone to contribute to the company’s success.
The management system covers Neste Oil’s key management principles, process-es, and practices. The company’s mission, vision, strategy, and values are an integral part of Neste Oil’s management philosophy and approach to practical management issues. The key procedures and tools needed by managers in their day-to-day work are included in the system, as are leaders' competence areas and manage-ment development programs.
A responsible supply chainThe service providers, suppliers, and contractors used by Neste Oil play a major role in determining how successfully the company’s sustainable development prin-ciples are implemented in practice. Neste Oil provides regular training for its partners and actively emphasizes the importance of a responsible mindset.
Responsible operations are a central criterion when selecting new partners. Compliance with the following minimum requirements is essential:Environmental responsibility
comprehensive environmental manage-ment covering all aspects of operations
Employee rightsa ban on racial, sexual, and other forms of discriminationa ban on the use of forced and slave labora ban on the use of child labora ban on the use of punishmentthe freedom to organize
3.5
46 Responsibility | Social responsibility
Malesiasta/Singapore
effective work-related health and safety managementclear guidelines on working hoursclear guidelines on subcontracting.
Neste Oil uses internal and impartial third-party audits to ensure that its suppliers meet these minimum requirements on a systematic basis.
Preventing financial misconductNeste Oil has principles in place to prevent and deal with cases of financial mis-conduct. These cover misuse of assets, systems, or a person‘s position within the company aimed at benefiting one or more people either directly or indirectly. Regula-tions cover areas including:
fraudulent financial reportingunauthorized use of company assetsincome or assets acquired fraudulently or illegallyevading costs or responsibilities fraudu-lently or illegallygenerating unnecessary costs in a frau-dulent or illegal way
Regulations also include principles covering how supply, purchase, and service contracts should be negotiated and the company’s
policy on receiving gifts. Guidelines are similarly provided for managing and deal-ing with abuse and misconduct.
The prime focus is on preventing abuse and misconduct occurring. Identifying and evaluating risks in this area is an ongoing part of operations. No cases of financial misconduct appeared in 2008.
If Neste Oil employees notice a case of misconduct or suspect misconduct is taking place, they are required to inform the company immediately.
Stakeholder cooperationNeste Oil has defined its key stakeholder groups in accordance with the needs and nature of its businesses. A major part of activities in this area is currently linked to renewable fuels, and Neste Oil has been an active participant in national and interna-tional debate on the subject.
Neste Oil is committed to positive and open cooperation with all its stakeholders, including those at local level, which can in-clude local government, employees’ families, neighbors, schools, colleges, the media, and local organizations. Thousands of people visit the company’s refineries annually.
An extensive brand study is carried out annually to review stakeholders’ percep-
tions, together with numerous smaller studies. Feedback is received from a variety of other sources, including the company’s Web site and via customer service and communications personnel.
Working for a better societyNeste Oil supported equipment purchases by the Children’s Department of Jorvi Hospital in Espoo through the Association of Friends of University Children’s Hospitals in 2008. Work with Finland’s Youth Academy concentrated on supporting school-based and leisure activities.
Recipients of donations included the Finnish Mental Health Association for work with children and young people, and Non-Fighting Generation to help prevent violence among young people.
Neste Oil’s involvement with the WWF’s Operation Mermaid has been aimed at helping improve the state of the Baltic and promote protection of habitats and endangered species in and around the sea. Neste Oil has equipped and trained volunteer oil spill cleanup teams.
We act.Neste Oil was reselected
in 2008 and 2009 for The Global 100, a list of
the world’s 100 most sustainable
companies.
47Responsibility | Social responsibility
Neste Oil 2008

performance in this area during the year. People’s awareness of the responsibilities associated with specific jobs has been promoted to help ensure fairer remunera-tion for everyone.
Supporting performance-based management Management resulting in profitable per-formance is a priority at Neste Oil. Perfor-mance discussions between managers and their team members are a key part of performance-based management across Neste Oil, and support day-to-day work and help people achieve goals and develop in their careers.
Every employee is responsible for his or her performance, development, and career; and every manager for supporting their team members to perform at their best and develop their capabilities. A systematic approach is used to review the skills and development of the company’s staff and ensure that the company has access to the key know-how and resources it needs.
Human resources
Successful international expansion calls for expertise, common ways of working, and developing a dynamic organization culture. All of Neste Oil’s activities are grounded in the company’s core values of responsibility, cooperation, innovation, and excellence.
Neste Oil’s human resource planning is based on developing the company’s lead-ership and management skills, expertise, and overall capabilities to promote the success of its strategy. Long-term planning is designed to provide all of the company’s businesses with the competencies and re-sources they need, through a mix of recruit-ment, career planning, manager role and responsibility development, and on -going training for managers and personnel.
A more international workplaceAs Neste Oil expands internationally, greater emphasis will need to be placed on un-derstanding and respecting a wider range of different cultural backgrounds, and establishing new ways of working. Growth projects will also offer personnel new op-portunities for developing their business skills. A growing international presence will impact virtually everyone’s responsibilities and workplaces. An average of 5,174 people were employed in 2008, of which 77% were based in Finland. At the end of the year 57 people were on overseas assignments.
Training for a more international and more multicultural Neste Oil was organized in 2008, and HR management processes and capabilities developed to meet the growing needs of the company’s opera-
tions. New international recruitment tools have also been developed to ensure ac-cess to the best resources on the interna-tional labor market.
Good progress on equal opportunitiesNeste Oil is committed to offering its employees comprehensive equality of opportunity, and makes use of an annually updated equal opportunities plan to make this happen. Neste Oil believes in paying people the same for the same or com-parable work, regardless of gender. The company is aiming to increase the number of positions employing men and women equally from 11% to 20% by 2010. The practi-cal measures linked to the targets set out in the equal opportunities plan are monitored closely.
A review of differences in men’s and women’s salaries and wages in 2008 showed that a good level of equality has been achieved. Some equality supple-ments were added to salaries to improve
Personnel by segment, as of 31 December 2008 Total: 5,174
Oil Refining 36%Oil Retail 27%Neste Jacobs 14%Shipping 10%Corporate functions 5%
Personnel by country, as of 31 December 2008Total: 5,174
0
Personnel
05 06 07 08
As of the end of the year
Average Finland 77%Russia 16%Latvia 1%Estonia 1%Belgium 1%
Sweden 1%Lithuania 1%Poland 1%Other 1%
Research & Technology 5%Specialty Products 2%Renewable Fuels 1%
Key figures2008 2007
Average age 42.6 43.0Average length of time with the company 14.3 15.0Training expenditure, EUR 3,980,000 3,559,730
1,000
2,000
3,000
4,000
6,000
5,000
48 Responsibility | Human resources

Particular attention has been given to developing managerial and leadership skills over the last couple of years. The ‘Leading for the future’ program has been designed to promote implementation of the company’s strategy, strengthen Neste Oil’s corporate culture and the adoption of best practices, and give managers a broader range of capabilities to succeed in their jobs. A total of 436 people took part in management training in 2008.
Encouraging personal developmentA strong competence base is one of Neste Oil’s key success factors, and the company is very much committed to promoting and developing people’s ability to learn by doing. Job rotation, project work, acting as internal training coordinators, and helping familiarize new employees with their jobs are all examples of ways in which people can develop themselves. Personnel are
encouraged to extend their capabilities and share their knowledge with their colleagues. A total of 450 job rotations took place in the company during 2008.
Neste Oil offers a wide range of train-ing for all personnel. Personnel are also encouraged to participate in training offered by outside organizations and self-study. Employees at production sites have the op-portunity to improve their skills by studying for professional qualifications or by taking courses in a range of areas.
Job rotation and new opportunitiesPersonnel at Neste Oil are encouraged to benefit from the challenges that project work
and job rotation can offer. Elina Harlin, for example, is currently working on refining processes, but her expertise goes much wider, thanks to job rotation.
Elina joined the company as a trainee during her studies for an M.Sc. in Engi-neering, and she spent her first summer running trials at the Technology Center. She became a full-time researcher in 1990.
The development projects she is now working on are focused on new types of processes and improving the operations of existing ones. The biggest of these are linked to the new diesel line at Porvoo and NExBTL production. She acts as proj-ect manager on one project, a research associate on two others, and a specialist on a couple of others. Previously, she has
also worked as a production engineer.“I remember saying I was interested
in job rotation at one of my performance discussions, and I got a call some time later about an opening. Over the years since then, I’ve had the chance to de-velop my skills both in my core work and through what job rotation has brought. My responsibilities have become increasingly challenging over the years, and I’ve had the chance to take part in some very dif-ferent types of projects.”
Elina has also taken the opportunity to continue her studies, and took leave to be a researcher at the Helsinki University of Technology for a time, returning to continue and complete her Ph.D. studies at Neste Oil in 2001.
“My project work offers me variety and new areas of interest, and I like the atmo-sphere at Neste Oil.”
Educational background of permanent employees as of 31 December 2008
Technical and natural sciences 50%Commercial and law 14%
Social sciences and humanities 6%Logistics and transport 5%Other 25%
Educational level of permanent employees as of 31 December 2008
College degree 32%Vocational qualification 30%University degree 23%
Compulsory education 17%Doctorate 1%
Breakdown by age of permanent employees as of 31 December 2008Average 42.6 years
Under 30 19%30–39 23%40–49 25%
50–59 26%Over 60 8%
49Responsibility | Human resources
Neste Oil 2008
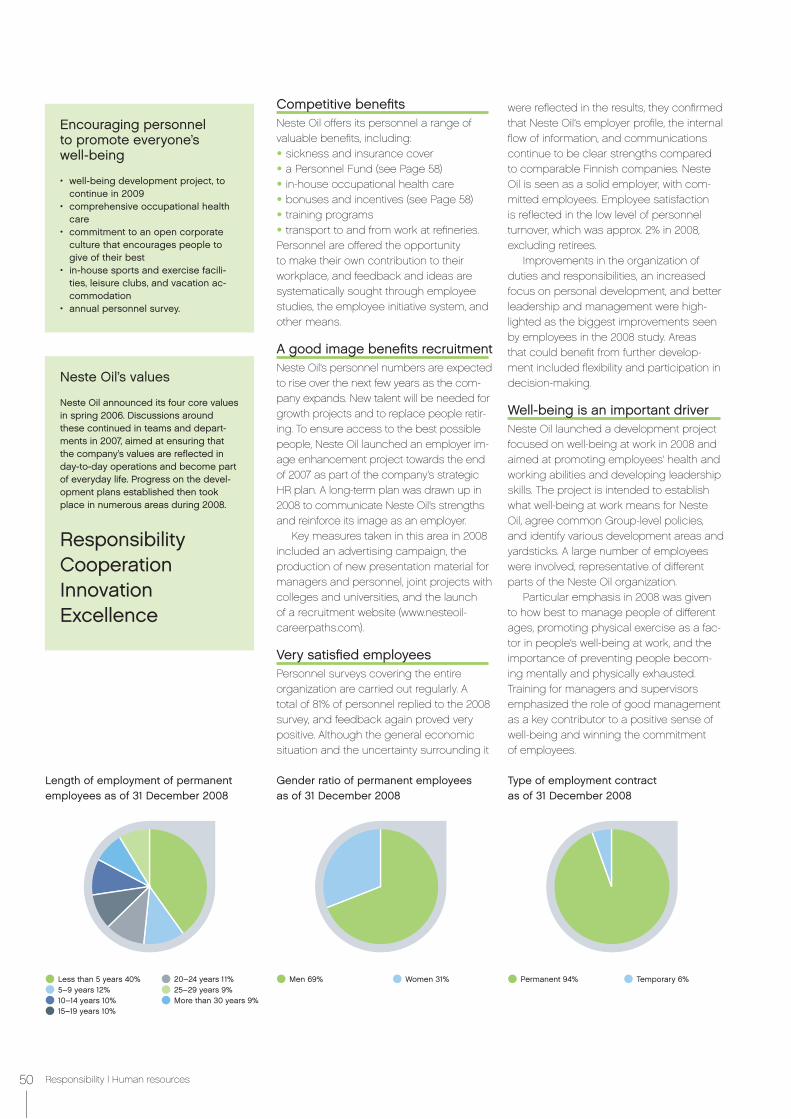
Encouraging personnel to promote everyone’s well-being
well-being development project, to continue in 2009comprehensive occupational health carecommitment to an open corporate culture that encourages people to give of their bestin-house sports and exercise facili-ties, leisure clubs, and vacation ac-commodationannual personnel survey.
Neste Oil’s values
Neste Oil announced its four core values in spring 2006. Discussions around these continued in teams and depart-ments in 2007, aimed at ensuring that the company’s values are reflected in day-to-day operations and become part of everyday life. Progress on the devel-opment plans established then took place in numerous areas during 2008.
ResponsibilityCooperationInnovationExcellence
Competitive benefitsNeste Oil offers its personnel a range of valuable benefits, including:
sickness and insurance covera Personnel Fund (see Page 58)in-house occupational health carebonuses and incentives (see Page 58)training programstransport to and from work at refineries.
Personnel are offered the opportunity to make their own contribution to their workplace, and feedback and ideas are systematically sought through employee studies, the employee initiative system, and other means.
A good image benefits recruitmentNeste Oil’s personnel numbers are expected to rise over the next few years as the com-pany expands. New talent will be needed for growth projects and to replace people retir-ing. To ensure access to the best possible people, Neste Oil launched an employer im-age enhancement project towards the end of 2007 as part of the company’s strategic HR plan. A long-term plan was drawn up in 2008 to communicate Neste Oil’s strengths and reinforce its image as an employer.
Key measures taken in this area in 2008 included an advertising campaign, the production of new presentation material for managers and personnel, joint projects with colleges and universities, and the launch of a recruitment website (www.nesteoil-careerpaths.com).
Very satisfied employeesPersonnel surveys covering the entire organization are carried out regularly. A total of 81% of personnel replied to the 2008 survey, and feedback again proved very positive. Although the general economic situation and the uncertainty surrounding it
Length of employment of permanent employees as of 31 December 2008
Less than 5 years 40%5–9 years 12%10–14 years 10%15–19 years 10%
20–24 years 11%25–29 years 9%More than 30 years 9%
Gender ratio of permanent employees as of 31 December 2008
Men 69% Women 31%
Type of employment contract as of 31 December 2008
Permanent 94% Temporary 6%
were reflected in the results, they confirmed that Neste Oil’s employer profile, the internal flow of information, and communications continue to be clear strengths compared to comparable Finnish companies. Neste Oil is seen as a solid employer, with com-mitted employees. Employee satisfaction is reflected in the low level of personnel turnover, which was approx. 2% in 2008, excluding retirees.
Improvements in the organization of duties and responsibilities, an increased focus on personal development, and better leadership and management were high-lighted as the biggest improvements seen by employees in the 2008 study. Areas that could benefit from further develop-ment included flexibility and participation in decision-making.
Well-being is an important driverNeste Oil launched a development project focused on well-being at work in 2008 and aimed at promoting employees’ health and working abilities and developing leadership skills. The project is intended to establish what well-being at work means for Neste Oil, agree common Group-level policies, and identify various development areas and yardsticks. A large number of employees were involved, representative of different parts of the Neste Oil organization.
Particular emphasis in 2008 was given to how best to manage people of different ages, promoting physical exercise as a fac-tor in people’s well-being at work, and the importance of preventing people becom-ing mentally and physically exhausted. Training for managers and supervisors emphasized the role of good management as a key contributor to a positive sense of well-being and winning the commitment of employees.
50 Responsibility | Human resources

0
4
6
10
Lost Workday Injury Frequency (LWIF)
per million hours worked
05 06 07 08
8
2
0
5
10
20
Total Recordable Incident Frequency (TRIF) per million hours worked
05 06 07 08
15
The LWIF for the Finnish chemical industry as a whole was 18.1 in 2007.
0
10 000
40 000
Observation tours
05 06 07 08
20 000
Managers and supervisors discuss safety issues with field personnel regularly during observation tours.
Neste Oil employs a safety management system embracing all divisions and corpo-rate functions to monitor and develop safe-ty-related issues. Systematically improving safety attitudes and safe behavior involves both the company’s own personnel and those of service providers and contractors. Neste Oil is working to further enhance the safety of its production processes and reduce operational incidents.
A number of major safety training programs have been developed to en-hance performance, and safety training
is an integral part of the induction of new employees and manager responsibilities. HSEQ (Health, Safety, Environment, Quality) training is a requirement for all contractor personnel. Refresher courses are arranged where necessary.
Site inspection circuits, near miss reporting, and learning from past inci-dents also play a part in safety work. The risks associated with upcoming work are always reviewed in advance, and all inci-dents, however small, are logged.
Safety
Continuously working to enhance safety is an important part of manage-ment at Neste Oil. The company is committed to zero accidents. Poor safety performance impacts financial performance, either in the form of additional expenses or lost revenue, while good safety performance contributes to better employee well-being and competitiveness.
Occupational safety is highlighted at all sites, including this one in Singapore.
Neste Oil recorded a total of 3.2 lost workday injuries per million hours worked in 2008, compared to an average of 18.1 in the Finnish chemical industry in 2007.
Using audits to monitor performanceNeste Oil had an OFIR (Occupational Illness Frequency Rate) of 0.64 in 2008, equivalent to 0.64 cases per million hours worked. This compares to an average of 2.7 in Finn-ish industry in 2005. A total of six cases of work-related disease were approved for compensation in 2008.
Regular audits are carried out to pro-mote better occupational health and safety.
Group-level audits since 1992Division-level auditsUnit-level audits covering 100% of employees.
Corporate security is importantThe Corporate Security Unit is respon-sible for helping ensure the uninterrupted operations of Neste Oil’s businesses and enabling the company to recover rapidly in the event of a problem situation. The unit monitors the international security situation constantly and works with the authorities and security companies to protect person-nel and the company’s assets.
30 000
51Responsibility | Safety
Neste Oil 2008

We are always committed to responsible operations.
52 Governance & Shares and shareholders

We believe in implementing best practices and promoting performance-driven management, and abiding by the law and the principles embodied in our management system. We are committed to high standards of corporate governance and responsibility in all of our operations worldwide.
Governance & Shares and shareholders
Governance principles 54Board of Directors 60Neste Executive Board 62Shares and shareholders 64Risk management 66
Earnings per share, dividend*, and dividend yieldEUR
Earnings per shareDividend per share
Dividend yield
%
At least one third of underlying profits are distributed in the form of dividends.
0
1
2
3
4
5
6
7
8
0
1
2
3
4
5
6
7
8
05 06 07 08
* As proposed by the Board of Directors
53Governance & Shares and shareholders
Neste Oil 2008

Annual General MeetingUnder the Finnish Companies Act, share-holders exercise their decision-making power in Company matters at General Meetings of Shareholders, and attend meetings in person or through an autho-rized representative. Each share entitles the holder to one vote.
Shareholders at the Annual General Meeting take decisions on matters such as:
the adoption of the Financial Statementsthe distribution of profit for the year detai-led in the Balance Sheetdischarging the members of the Super-visory Board, the Board of Directors, and the President & CEO from liabilitythe election and remuneration of the members of the Supervisory Board, the Board of Directors, and the auditor.
The Annual General Meeting is held annu-ally before the end of June. An Extraordinary General Meeting addressing specific mat-ters shall be held, when considered neces-sary, by the Board of Directors, or when requested in writing by a Company auditor or by shareholders representing at least one-tenth of all shares of the company.
Under the Articles of Association, an invitation to the Annual General Meeting
We abide by responsible principles and good corporate governance.
Neste Oil is listed on NASDAQ OMX Helsinki and is headquartered in Espoo, Finland. The company complies with the principles of good corporate governance laid out e.g. in the Finnish Companies Act and the company’s Articles of Association.
Governance principles
Neste Oil abides by the principles of good corporate governance within the framework of Finland’s Companies Act, its own Articles of Association, and the Governance Code covering listed companies in Finland, as it is introduced. Neste Oil diverges from the rec-ommendations of the latter in that the pro-posals covering the members of the Board of Directors and the remuneration paid to the Board presented to the Annual General Meeting are drafted by the AGM Nomination Committee rather than a Board committee.
Neste Oil issues financial statement bulletins and interim reports on its financial performance in accordance with Finnish legislation, in Finnish and English. The com-pany adopted the International Financial Reporting Standards in spring 2005 when it became a listed company.
Governance bodiesThe control and management of the Company is divided between the Annual General Meeting of Shareholders (AGM), the Supervisory Board, the Board of Directors and its two Committees, and the President & Chief Executive Officer.
The Neste Executive Team (NET) assists the President & CEO in the management and coordination of the implementation of the Company’s strategic and operational goals. Each of the Company’s operational divisions has its own management team.
Matters material to the Company as a whole are submitted to the President & CEO or the Board of Directors for decision. Neste Oil has one official auditor, chosen by shareholders at the AGM.
shall be delivered to shareholders no earlier than two months and no later than 17 days prior to the meeting. The invitation must be announced in at least two newspapers that are published regularly as decided by the Board of Directors, or in another verifiable manner.
The 2008 AGM
The 2008 Annual General Meeting was held on Friday, 14 March. At the meeting, the income statements and balance sheets of the Parent Company and the Group for 2007 were adopted, and the Supervisory Board, the Board of Directors, and the Presi-dent & CEO were discharged from liability for 2007. The Board of Directors’ proposal on the distribution of profits for 2007 by pay-ing a dividend of EUR 1.00 per share was approved. Shareholders registered in the register of shareholders maintained by the Finnish Central Securities Depository Ltd. on the record date for dividend payment (19.3.2008) were entitled to a dividend. In ad-dition, decisions were made regarding the members of the Board of Directors and the Supervisory Board and their remuneration, and an auditor was elected.
Nomination CommitteeThe AGM appointed a Nomination Commit-tee comprising the Chairman of the Board as an expert member, and representatives of the Company’s three largest sharehold-ers holding the largest number of votes associated with all the Company's shares on the first day of November preceding the AGM. The Chairman of the Board of Direc-
4.1
54 Governance & Shares and shareholders | Governance principles

or at another specified location. With the Chairman’s consent, meetings may also be held as teleconferences. A secretary ap-pointed by the Supervisory Board shall take the minutes of the meeting.
Duties
overseeing the administration of the Company by the Board of Directors and the President & CEOsubmitting a statement on the Financial Statements, Review by the Board of Direc-tors, and the Auditors’ Report to the AGM.
Meetings in 2008
The Supervisory Board convened five times in 2008, and the average attendance rate was 85%. Meetings covered subjects such as the Company’s interim reports and financial statements and business plans.
Board of DirectorsUnder the Company’s Articles of Associa-tion, the Board of Directors consists of five to eight members elected at the Annual General Meeting for a term ending at the following AGM. A person who has reached the age of 68 cannot be elected. All mem-bers are required to deal at arm’s length with the Company and its subsidiaries and to disclose all circumstances that might constitute a conflict of interest. Board mem-bers are not covered by the Company’s incentive or pensions schemes.
Members were elected for a new term on 14 March 2008. The Board consists of eight members, all of who are independent, with the exception of Markku Tapio, who represents the Company’s majority share-holder. To be considered independent, a Board member may not have any mate-rial relationship with the Company other than Board membership and may not be dependent on any of the company’s major shareholders.
Area of responsibilityThe Board shall meet as frequently as necessary, with approximately six to eight
tors was responsible for convening the committee, and the committee for electing its chairman.
Duties
The Nomination Committee was respon-sible for drafting proposals for the following AGM on the following:
the number of members of the Board of Directorsthe members of the Boardthe remuneration to be paid to the Chair-man, Vice Chairman, and members of the Board.
The Nomination Committee was required to present its proposal to the Board of Direc-tors by February 1 prior to the next AGM at the latest.
Membership in 2008
The Nomination Committee comprised Jarmo Väisänen of the Prime Minister’s Of-fice, Timo Ritakallio of the Ilmarinen Mutual Pension Insurance Company, and Risto Murto of the Varma Mutual Pension Insur-ance Company. Timo Peltola, Chairman of Neste Oil’s Board of Directors, acted as the Committee’s expert member. The Nomina-tion Committee met twice and made its proposal concerning Board members and the remuneration payable to them on 30 January 2009.
Supervisory BoardThe Supervisory Board is required to have between six and 12 members, each ap-pointed by the Annual General Meeting for a one-year term ending with the next AGM. It is also expected that labor unions representing Neste Oil's employees will appoint a maximum of three employee
representatives, who shall be entitled to attend Supervisory Board meetings but are not its members.
MembersThe members of the Supervisory Board, whose term began on 14 March 2008 and will end at the Annual General Meeting to be held in the first half of 2009, are as follows: Heidi Hautala, (Chairman), born 1955, Mem-ber of the Finnish ParliamentHannes Manninen, (Vice Chairman), born 1946, Member of the Finnish ParliamentEsko Ahonen, born 1955, Member of the Finnish ParliamentMikael Forss, born 1954, Director, Social Insurance Institution of FinlandTimo Heinonen, born 1975, Member of the Finnish Parliament Markus Mustajärvi, born 1963, Member of the Finnish ParliamentJutta Urpilainen, born 1975, Member of the Finnish ParliamentAnne-Mari Virolainen, born 1965, Member of the Finnish Parliament
Anne-Mari Virolainen owned 125 Neste Oil shares as of 31 December 2008. No other members of the Supervisory Board owned Neste Oil shares as of the end of the year. Members of the Supervisory Board are not included in Neste Oil’s incentive or pension schemes.
Area of responsibilityThe Supervisory Board meets as frequently as necessary, and is convened by the Chairman or by the Vice Chairman in his absence. The Supervisory Board plans a schedule for its regular meetings. Meetings shall be held at the Company’s Head Office
Supervisory Board remuneration, EUR/month2008 2007
Chairman 1,000 1,000
Vice Chairman 600 600
Members 500 500
Attendance fee/meeting 200 200
55Governance & Shares and shareholders | Governance principles
Neste Oil 2008

regular meetings annually, all scheduled in advance. In addition, extraordinary meet-ings, if requested by a Board member or the President & CEO, shall be convened by the Chairman, or, if the Chairman is prevent-ed from attending, by the Vice Chairman, or if deemed necessary by the Chairman. The Board constitutes a quorum if more than half of its members are present. The Board is responsible for preparing an operating plan for itself for the period between Annual General Meetings, to include a timetable of meetings and the most important matters to be addressed at each meeting. The Board evaluates its performance annually to determine whether it is functioning effec-tively, and shall discuss its review after the end of each fiscal year at the latest.
Duties
The Board of Directors:is responsible for the administration and appropriate organization of the operations of the Neste Oil Group in compliance with the relevant legislation and regulations, the Company’s Articles of Association, and instructions provided by the Annual General Meeting and the Supervisory Board is responsible for the strategic develop-ment of Neste Oil and for supervising and steering its business.decides on Neste Oil’s key operating principlesconfirms the annual business planapproves the annual financial statements and interim reportsdecides on major investments and divest-mentsconfirms Neste Oil’s values and most important policies and oversees their implementationappoints the President & CEO and his or her immediate subordinates and decides on their remunerationconfirms the Neste Executive Team’s and Neste Oil’s organizational and operational structure at senior management leveldetermines the Company’s dividend poli-cy to be followed when making proposal regarding dividends to the AGM.
The roles and responsibilities of the Board are defined in more detail in the Charter approved by the Board. The main content of the Charter can be consulted at www.nesteoil.com.
Meetings in 2008
The Board convened 11 times in 2008, and the attendance rate at meetings was 100%
on average. Details on Board’s members can be found on Pages 60-61.
Board CommitteesThe Board has established an Audit Com-mittee and a Personnel and Remuneration Committee, both of which have four mem-bers. A quorum exists when more than two members, including the Chair, are present. All members are elected from amongst the members of the Board for a one-year term. The tasks and responsibilities of each Com-mittee are defined in their Charters, which are approved by the Board. The schedule and frequency of Committee meetings is
determined by the Chair and the members of the Committees. Committees meet at least twice a year. Each Committee reports regularly on its meetings to the Board and submits the minutes of its meetings to the Board. Reports include a summary of the matters addressed and the measures undertaken. Each Committee conducts an annual self-evaluation of its performance and submits a report to the Board.
Audit CommitteeUnder its Charter, the Committee shall con-sist of a minimum of three Board members who are independent of and not affiliated with the Company or any of its subsidiaries, and have sufficient knowledge of account-ing practices and the preparation of finan-cial statements and other qualifications the Board deems necessary. The Audit Committee is permitted to use external consultants and experts when deemed necessary.
Duties in 2008
The Audit Committee:oversees the Company’s finances, financial reporting, risk management, and internal auditingassists the Board’s monitoring of the finan-cial position and reporting of the Compa-ny and the Board’s control functionprepares the election of the Auditor, maintains contacts with the Auditor, and reviews all material reports from the Auditor regarding the Company or its subsidiaries, and
evaluates the Company’s compliance with laws and regulations.
Meetings in 2008
The Audit Committee comprised Nina Linander (Chair), Antti Tanskanen, Markku Tapio (as of 14 March 2008), Maarit Toivanen-Koivisto, as well as Pekka Timonen, whose membership of the Board and the Audit Committee ended on 14 March 2008. The Committee convened four times, and the average attendance rate was 100%. In addition to its normal duties in 2008, the Committee focused on monitoring risk management and the development of the risk management function.
Personnel and Remuneration CommitteeThe Personnel and Remuneration Commit-tee consists of the Chairman of the Board and at least two non-executive members of the Board.
Duties
The Personnel and Remuneration Committee:prepares the appointments of key execu-tive personnel and makes proposals to the Board on compensation and incenti-ve systems for key personnelprepares and proposes to the Board the appointments of the President & CEO and the members of the Neste Executive Team, and the terms and conditions of their employment, and monitors and evaluates the performance of the President & CEO and the members of the Neste Executive Team.
Meetings in 2008
The Personnel and Remuneration Com-mittee comprised Timo Peltola (Chair), Michiel Boersma, Mikael von Frenckell, and Ainomaija Haarla. The Committee convened five times, and the average attendance rate was 100%. The Committee’s main focus was on selecting a new President & CEO and Chief Financial Officer and other appoint-ments, and on establishing and developing guidelines for the remuneration of senior executives.
President & CEOThe President & CEO manages the Com-pany’s business operations in accordance with the Finnish Companies Act and in-structions issued by the Board of Directors.
A competitive and profitable business benefits society as a whole.
56 Governance & Shares and shareholders | Governance principles

Board of Directors, 31 December 2008
Born Member since Position Independent
Personnel and Remuneration
CommitteeAudit
Committee
Attendance at meetings
Board Comittees
Timo Peltola 1946 2005 Chairman 100% 100%
Mikael von Frenckell 1947 2005 Vice Chairman 100% 100%
Michiel Boersma 1947 2007 Member 100% 100%
Ainomaija Haarla 1953 2005 Member 100% 100%
Nina Linander 1959 2005 Member 100% 100%
Antti Tanskanen 1946 2007 Member 100% 100%
Markku Tapio* 1948 2008 Member 100% 100%
Maarit Toivanen-Koivisto 1954 2005 Member 100% 100%
* Board member since 14 March 2008, when Pekka Timonen left Neste Oil's Board of Directors.
Shareholdings and remuneration of the Board of Directors as of 31 December 2008 Shareholdings
as of 31 December Annual remuneration, EUR2008 2007 Change 2008 2007
Timo Peltola 6,250 1,250 +5,000 66,000 55,000
Mikael von Frenckell 100,000 100,000 - 49,200 42,000
Michiel Boersma 2,500 - +2,500 35,400 30,000
Ainomaija Haarla 2,200 1,700 +500 35,400 30,000
Nina Linander 1,100 1,100 - 35,400 30,000
Antti Tanskanen - - - 35,400 30,000
Markku Tapio - - - 35,400 -
Maarit Toivanen-Koivisto 6,032 2,500 3,532 35,400 30,000
Information on shareholdings cover Neste Oil shares held directly, through organizations in which those concerned have a controlling interest, and in their capacity as trustees.
A payment of EUR 600 per meeting is made for attendance and for committee meetings attended by a Board member. It is paid in double for the members living outside Finland.
Regularly updated data can be consulted at www.nesteoil.com/investors.
Remuneration paid to the President & CEO and NET members, EUR
2008 2007
Salaries and benefits Performance bonuses Total Total
President and CEO 515,873.28 96,741.41 612,614.69 774,154.18
Other NET members 1,500,345.78 262,251.12 1,762,596.90 1,856,208.93
Shareholdings and share incentives of the Neste Executive Team as of 31 December 2008
Shares as of 31 December
Share participa-icipa-tions from the closed share arrangement
Name Born PositionNET
member since 2008 2007 Change 2008
Matti Lievonen 1958 President and CEO 2008 - - - -
Jarmo Honkamaa 1956 Deputy CEO 2004 9,821 5,937 +3,884 25,520
Jorma Haavisto 1954 EVP, Oil Refining 2007 2,732 - +2,732 10,656
Kimmo Rahkamo 1962EVP, Specialty
Products 2004 6,494 4,000 +2,494 15,672
Sakari Toivola 1953 EVP, Oil Retail 2007 300 - +300 -
Risto Näsi 1957 EVP, Shipping 2004 3,506 - +3,506 16,022
Hannele Jakosuo-Jansson 1966 SVP, HR 2006 - - - 7,627
Osmo Kammonen 1959 SVP, Communications 2004 500 500 - 16,382
Juha-Pekka Kekäläinen 1962 SVP, Development 2004 3,047 900 +2,147 13,917
Information on shareholdings cover Neste Oil shares directly, through organizations in which those concerned have a controlling interest, and in their capacity as trustees.
* Refers to the total number of shares those concerned have been confirmed as being entitled to under the share programs that began in 2003, 2004, 2005 and 2006 under
the Management Performance Share Arrangement. The net number of shares received is projected to be 40–50% of the figures shown here following the payment of taxes and other
statutory fees. Shares covered by the 2003 program will be distributed in spring 2009, and those covered by the 2004, 2005 and 2006 programs in spring 2010.
Regularly updated data can be consulted at www.nesteoil.com/investors.
*
57Governance & Shares and shareholders | Governance principles
Neste Oil 2008

employment agreements that provide for a fixed severance pay equal to six or, in some cases, 12 months salary. The retire-ment age of NET members is 60-62 years.
Meetings in 2008
The Neste Executive Team comprised 10 members and met 12 times in 2008. Two members, the President & CEO and the CFO, changed during the year.
New organization as of 1 April 2009
Neste Oil's organization will change on 1 April 2009. Details of the new organization can be found on Page 14. Details on members of the new Neste Executive Board can be found on Pages 62-63.
Compensation and incentive programsThe Board makes decisions on compen-sation and incentive systems for Group management and key personnel based on a proposal by the Personnel and Remu-neration Committee.
Short-term incentive bonuses The Company may pay annual short-term incentive bonuses to senior executives and other personnel in addition to their salary and fringe benefits. The criteria for any short-term incentive bonuses shall be based on people’s success in reaching their personal goals and on the Company’s financial per-formance and success in reaching its goals. The bonus paid to senior managers may not exceed 40% of their annual salary.
Bonus payments in 2008
The average performance bonus paid to personnel in 2008 for 2007 was 8,1% of em-ployees’ annual average salary, and totaled EUR 11.6 million.
Management performance share arrangementNeste Oil has a Management Performance Share Arrangement for senior manag-
ers and other key personnel. This aims to increase the commitment and loyalty of participants to the Company and to align the interests of the Company’s sharehold-ers and key executives to increase the value of the Company.
The Board of Directors established a new scheme in 2006 that was launched at the beginning of 2007 and includes some 50 key personnel. This has two three-year earning periods, starting in 2007 and 2010. Payments shall be made in 2010 and 2013, partly in the form of Company shares and partly in cash. If the maximum targets are reached during the first earning period, the maximum reward for key personnel shall equal the value of 360,000 Neste Oil shares. The maximum reward for the President & CEO that took over on 1 December 2008 in respect of the first earning period shall equal the value of 13,300 shares. In addition, the previous President & CEO is entitled to a maximum of 26,667 shares in respect of the first earning period.
The reward for the three-year earning period shall not exceed a person’s total fixed gross annual salary over three years. The share paid out in cash will cover any relevant taxes and other similar payments payable.
The criteria for the incentive system include the development of Neste Oil’s comparable operating profit and the Company's share price development as benchmarked against the international oil industry share index (FTSE Global Energy Total Return Index).
The scheme entails a non-transfer requirement for shares for one year from the end of the earning period. In other words, the duration of the scheme for both sets of shares is four years. Following this, the Com-pany’s senior executives are still required hold shares with a value equal to their gross annual salary. This ownership requirement covers shares received as part of the Man-agement Performance Share Arrangement and is effective for the duration of senior executives’ employment with Neste Oil.
Neste Oil’s Personnel FundNeste Oil’s Personnel Fund was set up in spring 2005 and covers the Group’s per-sonnel in Finland. Those participating in the Group’s share-based incentive system can-not be members. The Board of Directors determines the criteria for the profit-sharing bonus paid into the Fund annually.
Personnel employed under both perma-nent and fixed-term employment contracts are members of the Personnel Fund. Membership begins after an uninterrupted
The President & CEO is appointed by the Board of Directors, which evaluates the performance of the President & CEO annu-ally and approves his remuneration on the basis of a proposal by the Personnel and Remuneration Committee.
In addition to a monthly salary and fringe benefits, the President & CEO is eligible for an annual performance-based bonus (see Incentive Programs). In the event that the Company decides to give notice of termination, the President & CEO is entitled to his or her salary during his or her period of notice and a severance payment equaling 12 months’ salary. The retirement age of the President & CEO is 60 years, and the pension paid is 60% of retirement salary.
Changes in 2008
Neste Oil Corporation’s Board of Directors appointed Matti Lievonen as the Compa-ny’s new President & CEO on 3 Septem-ber 2008, and he took up the position on 1 December 2008. The previous President & CEO, Risto Rinne, retired for health reasons on 1 October 2008. More details on the President & CEO can be found on Pages 62–63.
Neste Executive Team (NET)The Neste Executive Team (NET) as-sists the President & CEO in Company management and in the deployment of the Company’s strategic and operational goals. Members are appointed by the Board of Directors. In 2008 NET consisted of the President & CEO, five divisional executive vice presidents, and the heads of Communications, Corporate Develop-ment, and Human Resources, and the CFO. The NET meets regularly, on average once a month. Members receive a base salary and are eligible for an annual performance-based bonus. In addition, all members are entitled to fringe benefits. Their typical period of notice is six months. Several NET members have signed
Share allocations made to the President & CEO and NET members, 2007–2009 earning periodPresident & CEO 33,330
Other NET members 104,500
Total 137,830
A new long-term management performance share arrangement includes the maximum sums listed in the table above for
the 2007–2009 earning period. The number of shares are the maximum payable and will be paid in full if the maximum targets
that they are associated with are achieved.
58 Governance & Shares and shareholders | Governance principles

period of six months of employment, and ends once a member has received his or her share of the Fund in full.
The profit-sharing bonuses paid into the Fund are distributed equally between mem-bers. Each employee’s share is divided into a tied amount and an amount available for withdrawal. When an employee has been a member of the Fund for five years, he or she can transfer an amount equivalent to no more than 15% of the capital from the tied amount for withdrawal.
The amount available for withdrawal will be determined annually and paid to mem-bers who wish to exercise their withdrawal rights. Members can choose whether they want to receive the amount available for withdrawal in cash, or in Neste Oil shares acquired through the Personnel Fund.
Payments in 2008
Neste Oil paid a total of EUR 2,1 million in profit-sharing earnings for 2007 into the Fund in 2008.
Pension schemesNeste Oil companies in Finland have ar-ranged statutory pension cover under the Finnish TYEL pension system through the Neste Oil Pension Fund. The pensions of seamen are insured in the Seamen’s Pen-sion Fund. Retirement age is 63 to 68 years.
The Neste Oil Pension Fund provides additional pension benefits, in addition to the statutory pension, to people who joined the company before 1994. The most impor-tant additional benefit is the opportunity to retire at the age of 60, and covers women and men who select a reduced pension.
AuditorThe Annual General Meeting elects an auditor annually, which must be an auditing company approved by the Finnish Central Chamber of Commerce. The auditor’s term of office ends at the end of the next AGM following the election.
Ernst & Young Oy was elected as Neste Oil’s auditor in 2007, with Anna-Maija Simola, certified public accountant, as main re-sponsible auditor.
Internal auditThe Internal Audit Unit is an independent cor-porate function and its operations are based on international professional standards cov-ering internal audits and rules of ethics.
Duties
The Internal Audit Unit:provides objective assurance and con-
sultation services designed to add value and improve the Company’s operationsassists the organization in evaluating and improving the effectiveness of risk mana-gement, financial control, and governance processesaudits the operations of Neste Oil’s refi-neries, subsidiaries, and other units on a regular basis, andcarries out assignments requested by management or the Board of Directors’
Audit Committee.The roles, responsibilities, and authorities of Internal Audit are covered in the Internal Audit Charter. Together with an annual operating plan, it is approved by the Board of Directors’ Audit Committee.
Internal Audit reports to the Board’s Audit Committee and administratively to the President & CEO. Internal Audit is a staff function without any direct authority over the activities it reviews.
Insider guidelinesNeste Oil complies with the Insider Guidelines of the Helsinki exchanges established on 2 June 2008. The Company has also ap-proved its own Guidelines for Insiders, which are stricter in some areas. The Company’s closed window (see below), for example, exceeds minimum NASDAQ OMX Helsinki requirements.
The Company’s Guidelines for Insiders are updated regularly and are available to all personnel. The Company arranges train-ing on insider guidelines for personnel and expects that its guidelines are followed. The Company supervises compliance with insider guidelines by checking disclosed insider information with those concerned annually. The Company’s General Counsel is respon-sible for the coordination and supervision of
insider matters. The head of each function or division is responsible for supervising insider matters within his or her organization.
The members of the Board of Directors and the Supervisory Board, the President & CEO, the Company’s main responsible audi-tor, and the members of the Neste Execu-tive Team and its secretary have all been classified as insiders subject to a declaration requirement. The holdings of Company se-curities of such insiders are filed in the public Insider Register, which can be consulted at the Company’s web site. A public register is maintained in the insider register system of
Euroclear Finland Oy P.O. Box 1110, FI-00101 Helsinki and Urho Kekkosen katu 5 C, Helsinki. Telephone: +358 (0)20 770 6000, fax: +358 (0)20 770 6658, e-mail: [email protected], www.ncsd.eu.
The Company has also designated certain other executives, as well as certain individu-als responsible for the Company’s finances, financial reporting, and communications, who receive inside information on a regular basis due to their position or duties, as permanent Company-specific insiders. Permanent insiders may not trade in any Company securities during the period from the closing date of an interim or annual accounting period to the date of publica-tion of the interim or annual report for that period. The minimum period concerned is always 28 days prior to the publication of an interim or annual report (‘closed window’). The publication dates of interim and annual reports are shown in the financial calendar at www.nesteoil.com.
Individuals who participate in the devel-opment and preparation of projects that involve inside information, such as mergers and acquisitions, are considered project-specific insiders. Such people are included in a separate register of Project-Specific Insiders maintained by the Company’s Legal Department.
Fees charged by the statutory auditor EUR 1,0002008 2007
Audit fees 786 560
Other 1,022 75
Total 1,808 635
Our values are responsibility, cooperation, innovation, and excellence.
59Governance & Shares and shareholders | Governance principles
Neste Oil 2008

Board of Directors as of 31 December 2008
Mikael von Frenckell, Timo Peltola, Ainomaija Haarla,
and Michiel Boersma.
Timo Peltola M.Sc. (Econ.), Hon. Ph.D (Econ.). Chairman of the Board. Independent member. Born in 1946. Former Chief Executive Officer of Huhtamäki Corporation, Vice Chairman of the Board of Nordea AB (publ.), Chairman of the Board of AW-Energy, member of the Boards of Telia-Sonera AB and SAS AB, and an adviser to CVC Capital Partners, Sveafastigheter, and CapMan Public Market Fund. Chairman of Neste Oil’s Personnel and Remuneration Committee.
Mikael von Frenckell M.Sc. (Soc.). Vice Chairman of the Board. Independent member.Born in 1947. Partner at Sponsor Capital Oy. Chairman of the Boards of Sponsor Capital Oy and Tamfelt Corp, and a member of the Board of Tamro Plc. Member of Neste Oil’s Personnel and Remuneration Committee.
Michiel Boersma Ph.D (Chem. Techn.). Independent member. Born in 1947. Chief Executive Officer of Dutch energy company, Essent NV since July 2003. Served for many years in the Shell Group, most recently as President, Shell Global Solutions and Executive Vice President of the Shell Oil Products Executive Committee between 2000 and 2003. Member of Neste Oil’s Personnel and Remuneration Committee.
Ainomaija Haarla D.Sc. (Tech.), MBA. Independent member. Born in 1953. President and Chief Executive Officer, Technology Academy Foundation. Chairman of the Board of Korona Invest Oy, and a member of the Boards of Altia Oyj and TKK Executive School of Business Oy. Former Managing Director of ProConsilium Ltd, Vice President, Strategic Development at UPM-Kymmene Corporation and Vice President, Corporate Marketing, Metso Corporation. Member of Neste Oil’s Personnel and Remuneration Committee.
4.2
60 Governance & Shares and shareholders | Board of Directors

Nina Linander, Markku Tapio, Maarit Toivanen-Koivisto, and Antti Tanskanen.
Nina Linander M.Sc. (Econ.), MBA. Independent member. Born in 1959. Partner and member of the Board of Stanton Chase International AB. Member of the Boards of Opcon AB and Specialfastigheter AB. Former Group Treasurer of AB Electrolux and former Director, Product Area Electricity, at Vattenfall AB. Chairs Neste Oil’s Audit Committee.
Antti Tanskanen Ph.D (Econ). Independent member. Born 1946. Former Chairman and Chief Executive Officer of the OKO Bank Group and former President of the Academy of Finland. Chairman of the Board of the Finnish Institute of International Affairs (FIIA) and a member of the Board of Directors of M-real Corporation. Member of Neste Oil’s Audit Committee.
Markku TapioM.Sc. (Econ.). Non-independent member. Born 1948. Senior Financial Counselor at the Prime Minister’s Office, Ownership Steering Department. Member of the Board of Directors of VR-Group Ltd. Member of Neste Oil’s Audit Committee.
Maarit Toivanen-Koivisto M.Sc. (Econ.).Independent member. Born in 1954. Chief Executive Officer and Chairman of the Board of Onvest Oy and Chairman of the Boards of Are Group and Onninen Group. Member of the Boards of Itella Oyj and Tulikivi Oyj. Member of Neste Oil’s Audit Committee.
61Governance & Shares and shareholders | Board of Directors
Neste Oil 2008

Members of Neste Executive Board as of 1 April 2009
Matti Hautakangas
Jarmo Honkamaa
Osmo KammonenSakari Toivola Simo Honkanen Hannele Jakosuo-Jansson
Matti LehmusMatti Lievonen
Ilkka Salonen
Lars Peter Lindfors
Ilkka Poranen
4.3
62 Governance & Shares and shareholders | Neste Executive Board

Matti LievonenPresident & CEO, Chairman of the Neste Executive BoardBorn 1958. B.Sc. (Eng.). Joined the company on 1 December 2008. Served as President of the Fine and Speciality Papers Division at UPM-Kymmene Corporation, and in a number of other senior positions at UPM, between 1986 and 2008, and was with ABB earlier. Member of UPM-Kymmene’s Executive Board between 2002 and 2008. Vice Chairman of CEPIFINE and a member of the Supervisory Board of Ilmarinen Mutual Pension Insurance Company.
Jarmo Honkamaa Deputy CEO, Executive Vice President, Renewable Fuels Born in 1956. M.Sc. (Eng.), M.Sc. (Laws). Joined the company in 1987. Currently responsible for renewable diesel production, market-ing, and sales. Served as Executive Vice President, Oil Refining (2005–2007), Vice President, Wholesale and Supply (2000–2004), and Vice President, MTBE Business Unit (1996–2000). Member of the Board of Directors of the Finnish Oil and Gas Federation.
Matti LehmusExecutive Vice President, Oil ProductsBorn 1974. M.Sc. (Eng.) and MBA. Joined the company in 1997. Cur-rently responsible for the Base Oils business in Specialty Products Division since 2007. Previously served as Vice President in the Oil Refining Business Development (2007) and Gasoline Exports and Trading Manager (2004–2007) in the Oil Refining Division.
Sakari Toivola Executive Vice President, Oil Retail Born in 1953. M.Sc. (Eng.). Joined the company in 2007. Currently re-sponsible for oil retailing in Finland and the Baltic Rim, direct sales, and LPG. Served previously as Managing Director (2002–2007) and Retail Sales Director (2001–2002) of oy Esso ab (Finland). Member of the Board of Directors of Luottokunta Oy and a member of the Board of Directors of the Finnish Oil and Gas Federation.
Simo HonkanenSenior Vice President, HSEBorn 1958. M.Sc. (Econ.). Joined the company in 2006. Currently responsible for marketing and stakeholder relations in the Renewable Fuels Division (2008–). Served previously as Vice President, New Ventures in the Components Division (2006–2007) and prior to that as Strategy Director in Shell Finland, Marketing Director Retail in Shell Benelux and France, and in several other managerial positions in Shell Sweden and Shell Finland (1985–2005).
Hannele Jakosuo-Jansson Senior Vice President, Human Resources Born in 1966. M.Sc. (Eng.). Joined the company in 1990. Currently responsible for the Group’s human resources function. Served as Laboratory and Research Manager at the Technology Center (1998–2004) and Vice President, Human Resources at Oil Refining (2004–2005).
Osmo Kammonen Senior Vice President, Communications Born in 1959. M.Sc. (Laws). Joined the company in 2004. Currently responsible for the Group’s internal and external communications, and corporate image. Served as senior vice president, corporate communications and investor relations and communications manager in various companies in the electronics, engineering, construction materials, and forest products industries. Member of the Board of Directors of Finnfacts.
Lars Peter LindforsSenior Vice President, Technology and StrategyBorn 1964. D.Sc. (Chemical Engineering) and MBA. Joined the com-pany in 2007. Currently responsible for the company's Research and Technology Unit. Served previously as Executive Vice President, Renewal and Development at Perstorp (2004–2007), Executive Vice President, R&T&D at Perstorp (2001–2004) and prior to that at Neste (1989–2001) as e.g. R&D Manager.
Ilkka PoranenSenior Vice President, Production and LogisticsBorn 1960. M.Sc. (Eng.). Joined the company in 1985. Currently responsible for the Corporate Safety function since 2007. Previously served as Vice President, Base Oils (1997–2007) and as Plant Man-ager at the Porvoo Refinery (1986–1997).
Ilkka SalonenChief Financial Officer Born in 1965. M.Sc. (Econ.). Joined the company in 2009. Currently responsible for the Group’s financial management and for investor relations, risk management, corporate IT, and coordinating procure-ment. Served as Chief Financial Officer at Pohjola Bank and the OKO Group.
Matti Hautakangas*General Counsel and Secretary to the Neste Executive Board and the Board of Directors and the Supervisory Board. Born in 1963. M.Sc. (Laws). Joined the company in 2003. Currently responsible for the Group’s legal affairs. Served previously as Legal Counsel, Oil Refining (2003–2004) and an attorney-at-law at Procopé & Hornborg Law Offices Ltd. (1994–2003). * Not a member of the Neste Executive Board.
At the end of 2008, the members of Neste Executive Team were Matti Lievonen, Jarmo Honkamaa, Jorma Haavisto, Kimmo Rahkamo, Sakari Toivola, Risto Näsi, Hannele Jakosuo-Jansson, Osmo Kammonen, and Juha-Pekka Kekäläinen.
63Governance & Shares and shareholders | Neste Executive Board
Neste Oil 2008
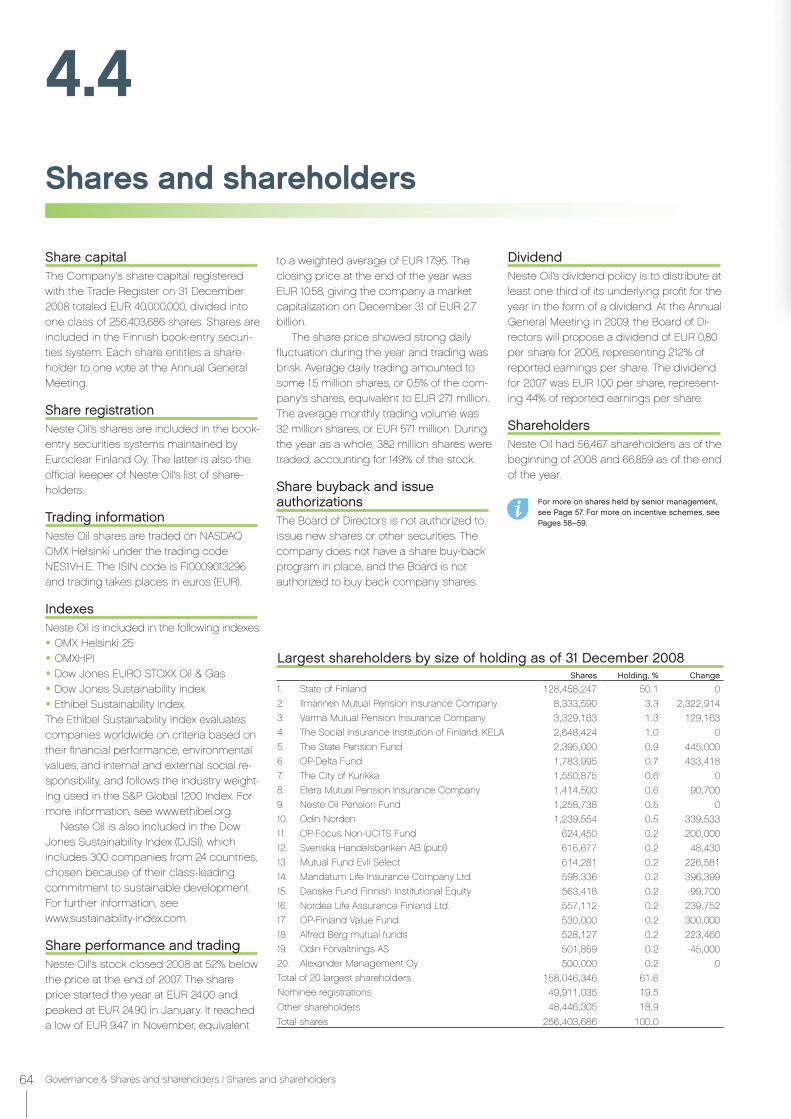
Shares and shareholders
DividendNeste Oil’s dividend policy is to distribute at least one third of its underlying profit for the year in the form of a dividend. At the Annual General Meeting in 2009, the Board of Di-rectors will propose a dividend of EUR 0,80 per share for 2008, representing 212% of reported earnings per share. The dividend for 2007 was EUR 1.00 per share, represent-ing 44% of reported earnings per share.
ShareholdersNeste Oil had 56,467 shareholders as of the beginning of 2008 and 66,859 as of the end of the year.
For more on shares held by senior management, see Page 57. For more on incentive schemes, see Pages 58–59.
Share capitalThe Company’s share capital registered with the Trade Register on 31 December 2008 totaled EUR 40,000,000, divided into one class of 256,403,686 shares. Shares are included in the Finnish book-entry securi-ties system. Each share entitles a share-holder to one vote at the Annual General Meeting.
Share registrationNeste Oil’s shares are included in the book-entry securities systems maintained by Euroclear Finland Oy. The latter is also the official keeper of Neste Oil’s list of share-holders.
Trading informationNeste Oil shares are traded on NASDAQ OMX Helsinki under the trading code NES1VH.E. The ISIN code is FI0009013296 and trading takes places in euros (EUR).
IndexesNeste Oil is included in the following indexes:
OMX Helsinki 25OMXHPIDow Jones EURO STOXX Oil & GasDow Jones Sustainability IndexEthibel Sustainability Index.
The Ethibel Sustainability Index evaluates companies worldwide on criteria based on their financial performance, environmental values, and internal and external social re-sponsibility, and follows the industry weight-ing used in the S&P Global 1200 Index. For more information, see www.ethibel.org.
Neste Oil is also included in the Dow Jones Sustainability Index (DJSI), which includes 300 companies from 24 countries, chosen because of their class-leading commitment to sustainable development. For further information, see www.sustainability-index.com.
Share performance and tradingNeste Oil’s stock closed 2008 at 52% below the price at the end of 2007. The share price started the year at EUR 24.00 and peaked at EUR 24.90 in January. It reached a low of EUR 9.47 in November, equivalent
to a weighted average of EUR 17.95. The closing price at the end of the year was EUR 10.58, giving the company a market capitalization on December 31 of EUR 2.7 billion.
The share price showed strong daily fluctuation during the year and trading was brisk. Average daily trading amounted to some 1.5 million shares, or 0.5% of the com-pany’s shares, equivalent to EUR 27.1 million. The average monthly trading volume was 32 million shares, or EUR 571 million. During the year as a whole, 382 million shares were traded, accounting for 149% of the stock.
Share buyback and issue authorizationsThe Board of Directors is not authorized to issue new shares or other securities. The company does not have a share buy-back program in place, and the Board is not authorized to buy back company shares.
Largest shareholders by size of holding as of 31 December 2008Shares Holding, % Change
1. State of Finland 128,458,247 50.1 0
2. Ilmarinen Mutual Pension Insurance Company 8,333,590 3.3 2,322,914
3. Varma Mutual Pension Insurance Company 3,329,163 1.3 129,163
4. The Social Insurance Institution of Finland, KELA 2,648,424 1.0 0
5. The State Pension Fund 2,395,000 0.9 445,000
6. OP-Delta Fund 1,783,995 0.7 433,418
7. The City of Kurikka 1,550,875 0.6 0
8. Etera Mutual Pension Insurance Company 1,414,500 0.6 90,700
9. Neste Oil Pension Fund 1,258,738 0.5 0
10. Odin Norden 1,239,554 0.5 339,533
11. OP-Focus Non-UCITS Fund 624,450 0.2 200,000
12. Svenska Handelsbanken AB (publ) 616,677 0.2 48,430
13. Mutual Fund Evli Select 614,281 0.2 226,581
14. Mandatum Life Insurance Company Ltd. 598,336 0.2 396,399
15. Danske Fund Finnish Institutional Equity 563,418 0.2 -99,700
16. Nordea Life Assurance Finland Ltd. 557,112 0.2 239,752
17. OP-Finland Value Fund 530,000 0.2 300,000
18. Alfred Berg mutual funds 528,127 0.2 223,460
19. Odin Förvaltnings AS 501,859 0.2 -45,000
20. Alexander Management Oy 500,000 0.2 0
Total of 20 largest shareholders 158,046,346 61.6
Nominee registrations 49,911,035 19.5
Other shareholders 48,446,305 18.9
Total shares 256,403,686 100.0
4.4
64 Governance & Shares and shareholders | Shares and shareholders
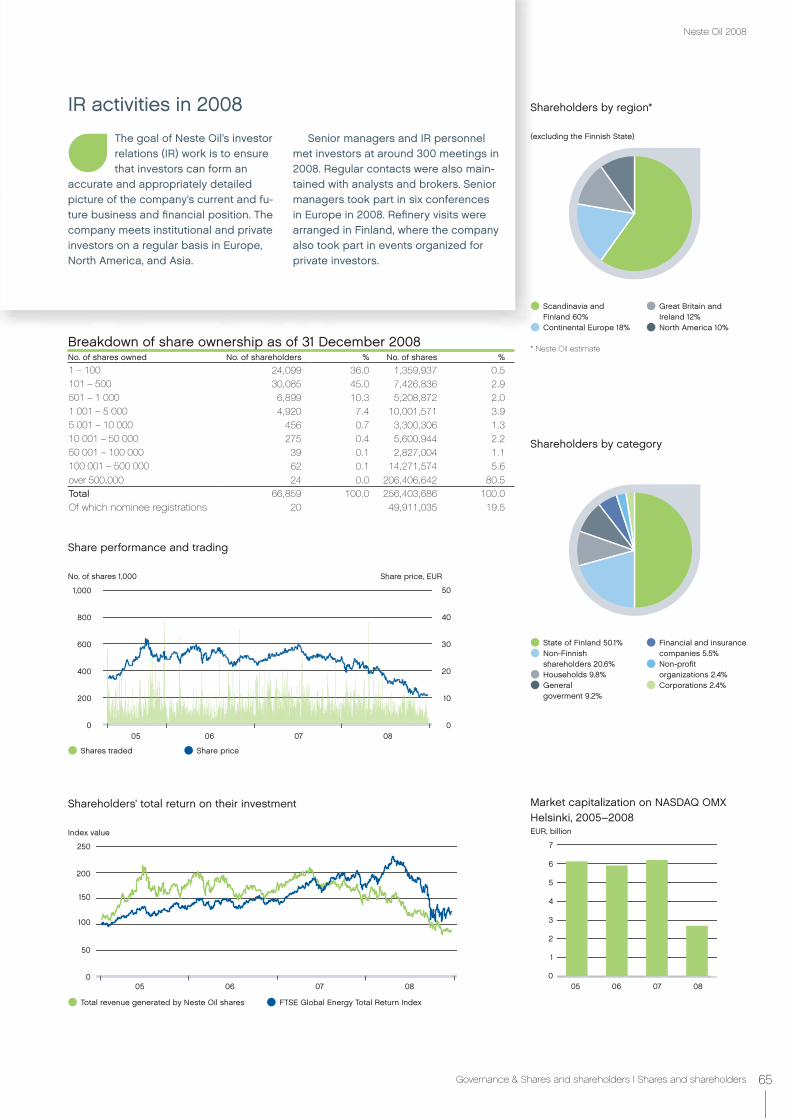
Breakdown of share ownership as of 31 December 2008No. of shares owned No. of shareholders % No. of shares %
1 – 100 24,099 36.0 1,359,937 0.5 101 – 500 30,085 45.0 7,426,836 2.9 501 – 1 000 6,899 10.3 5,208,872 2.0 1 001 – 5 000 4,920 7.4 10,001,571 3.9 5 001 – 10 000 456 0.7 3,300,306 1.3 10 001 – 50 000 275 0.4 5,600,944 2.2 50 001 – 100 000 39 0.1 2,827,004 1.1 100 001 – 500 000 62 0.1 14,271,574 5.6
over 500,000 24 0.0 206,406,642 80.5 Total 66,859 100.0 256,403,686 100.0 Of which nominee registrations 20 49,911,035 19.5
IR activities in 2008
The goal of Neste Oil’s investor relations (IR) work is to ensure that investors can form an
accurate and appropriately detailed picture of the company’s current and fu-ture business and financial position. The company meets institutional and private investors on a regular basis in Europe, North America, and Asia.
Senior managers and IR personnel met investors at around 300 meetings in 2008. Regular contacts were also main-tained with analysts and brokers. Senior managers took part in six conferences in Europe in 2008. Refinery visits were arranged in Finland, where the company also took part in events organized for private investors.
Share performance and trading
Share price, EUR
Shareholders by category
State of Finland 50.1%Non-Finnish shareholders 20.6%Households 9.8%General goverment 9.2%
Financial and insurance companies 5.5%Non-profit organizations 2.4%Corporations 2.4%
Shareholders by region*
(excluding the Finnish State)
Scandinavia and Finland 60%Continental Europe 18%
Great Britain and Ireland 12%North America 10%
* Neste Oil estimate
0
100
150
200
50
250
Shareholders’ total return on their investment
Total revenue generated by Neste Oil shares FTSE Global Energy Total Return Index
Index value
05 06 07 080
4
5
6
2
7
Market capitalization on NASDAQ OMX Helsinki, 2005–2008
05 06 07 08
EUR, billion
1
3
No. of shares 1,000
0
200
600
1,000
Shares traded Share price
0
10
20
30
50
800
400
40
06 07 0805
65Governance & Shares and shareholders | Shares and shareholders
Neste Oil 2008

Risk management
Risk management is a central part of Neste Oil’s management system, and its impor-tance will only grow as the company moves ahead with its major projects and as turbu-lence continues in the global economy.
Neste Oil’s risk management policyWe emphasize the importance of being aware of risks, assessing them, and ma-naging them proactivelyOur objective is to increase our ability to take risks within predefined accepted limitsWe prioritize effective risk management, particularly in respect of corporate repu-tation, investments, market volatility, safety, and the environmentRisk management is integrated into nor-mal routines and management practices, and is covered by a defined structure of roles and responsibilities.
Role and goal of risk managementNeste Oil's enterprise risk management process aims to recognize and evaluate the risks affecting the company’s strate-gic and business goals and operational targets systematically, and report on them appropriately. Risks are defined in terms of the relative probability of an event occur-ring that could affect the company's goals, and are measured and monitored on the basis of their impact and probability. The main means to be used for managing risks are also defined. Monitoring the impact
of changes in the company's markets, businesses, and other factors on earnings potential is intended to support the organi-zation achieve its targets.
Managing financial risks focuses on reducing exposure to volatility affecting earnings, the balance sheet, and cash flow – while securing effective and competitive financing. Risk management in the area
of strategic and operational management aims at recognizing risks on a rolling basis, assessing and prioritizing them on a consis-tent basis, and managing them proactively.
Neste Oil encounters numerous risks as part of its business operations, linked to the state of the world economy, develop-ments in the oil industry, and changes in the company's overall operating environment. How well we manage the risks related to our strategic actions impacts how successful we are in main-taining our corporate reputation. A comprehensive enterprise risk management process is used to manage these risks.
Sensitivity analysisImpact of the following changes on operating profit in 2009, excluding hedges10% change in the EUR/USD exchange rate +/- EUR 100–120 millionChange of USD 1.00/bbl in total refining margin +/- USD 110 millionChange of USD 1.00/bbl in crude oil prices +/- USD 10 millionChange of 10 Worldscale points in crude freight rates +/- USD 10 million
The impact of key price exposure is indicated in US dollars, as this is the currency used in the international oil business. These calculations are based on assumptions related to normal market and business conditions and do not take account of the impact of hedging.
As our strategy is mainly implemented through capital projects, ensuring their suc-cess calls for effective risk management from start to finish. Capital project-related risk management is aimed at helping se-cure a good business result and reducing and managing risks during the execution of projects.
Risk management strategiesNeste Oil aims to limit the impact of risks on its operations through a range of risk management strategies. The Corporate Risk Management Policy and Principles ap-proved by the Board of Directors define the risk management principles to be used for managing the risks associated with the stra-tegic and operational targets of the Group as a whole and its divisions and functions.
Information on general Group-wide risks and risk management-related measures is contained in a risk database. Corporate policy and principles also include detailed
The success of major capital projects calls for very effective risk management from start to finish.
4.5
66 Governance & Shares and shareholders | Risk management
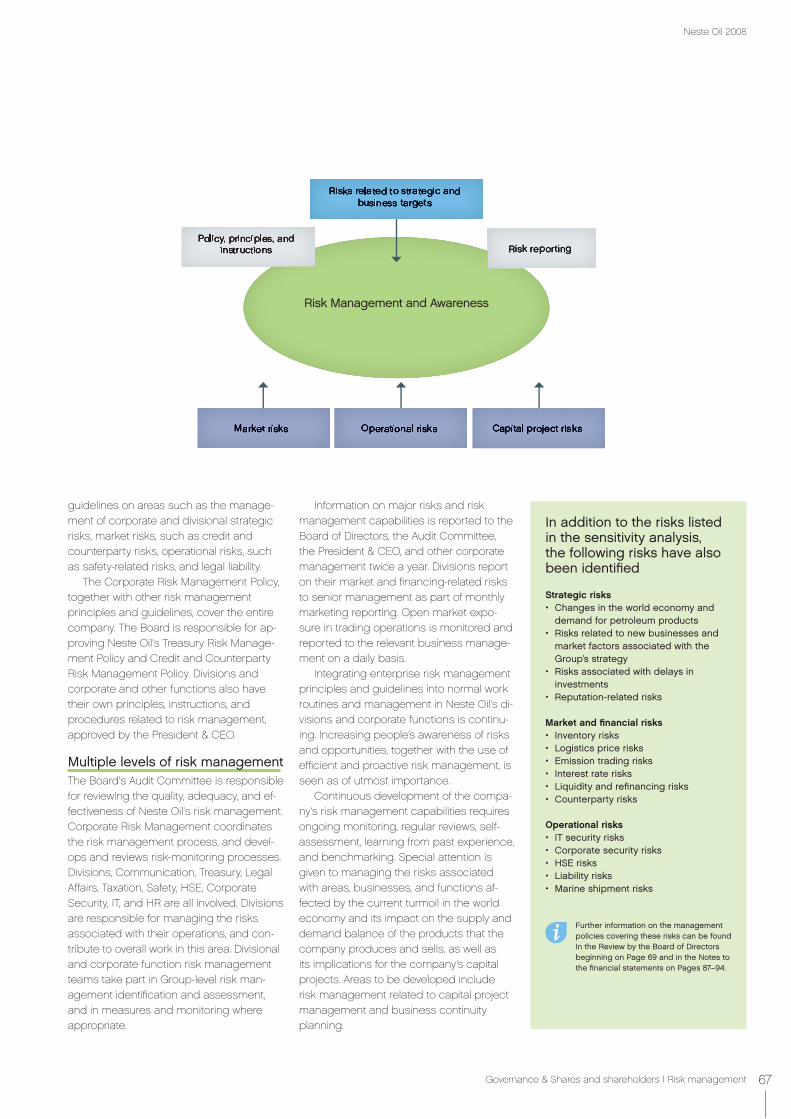
guidelines on areas such as the manage-ment of corporate and divisional strategic risks, market risks, such as credit and counterparty risks, operational risks, such as safety-related risks, and legal liability.
The Corporate Risk Management Policy, together with other risk management principles and guidelines, cover the entire company. The Board is responsible for ap-proving Neste Oil's Treasury Risk Manage-ment Policy and Credit and Counterparty Risk Management Policy. Divisions and corporate and other functions also have their own principles, instructions, and procedures related to risk management, approved by the President & CEO.
Multiple levels of risk managementThe Board's Audit Committee is responsible for reviewing the quality, adequacy, and ef-fectiveness of Neste Oil's risk management. Corporate Risk Management coordinates the risk management process, and devel-ops and reviews risk-monitoring processes. Divisions, Communication, Treasury, Legal Affairs, Taxation, Safety, HSE, Corporate Security, IT, and HR are all involved. Divisions are responsible for managing the risks associated with their operations, and con-tribute to overall work in this area. Divisional and corporate function risk management teams take part in Group-level risk man-agement identification and assessment, and in measures and monitoring where appropriate.
Information on major risks and risk management capabilities is reported to the Board of Directors, the Audit Committee, the President & CEO, and other corporate management twice a year. Divisions report on their market and financing-related risks to senior management as part of monthly marketing reporting. Open market expo-sure in trading operations is monitored and reported to the relevant business manage-ment on a daily basis.
Integrating enterprise risk management principles and guidelines into normal work routines and management in Neste Oil's di-visions and corporate functions is continu-ing. Increasing people’s awareness of risks and opportunities, together with the use of efficient and proactive risk management, is seen as of utmost importance.
Continuous development of the compa-ny's risk management capabilities requires ongoing monitoring, regular reviews, self-assessment, learning from past experience, and benchmarking. Special attention is given to managing the risks associated with areas, businesses, and functions af-fected by the current turmoil in the world economy and its impact on the supply and demand balance of the products that the company produces and sells, as well as its implications for the company’s capital projects. Areas to be developed include risk management related to capital project management and business continuity planning.
Risk Management and Awareness
In addition to the risks listed in the sensitivity analysis, the following risks have also been identified
Strategic risksChanges in the world economy and demand for petroleum productsRisks related to new businesses and market factors associated with the Group’s strategyRisks associated with delays in investmentsReputation-related risks
Market and financial risksInventory risksLogistics price risksEmission trading risksInterest rate risksLiquidity and refinancing risksCounterparty risks
Operational risksIT security risksCorporate security risksHSE risksLiability risksMarine shipment risks
Further information on the management policies covering these risks can be found In the Review by the Board of Directors beginning on Page 69 and in the Notes to the financial statements on Pages 87–94.
67Governance & Shares and shareholders | Risk management
Neste Oil 2008

68 Financial Statements
Review by the Board of Directors . . . . . . . . . . . . . . . . . . . . . . . . . . 69Key financial indicators . . . . . . . . . . . . . . . . . . . . . . . . . . . . . . . . . . . . . 76Calculation of key financial indicators. . . . . . . . . . . . . . . . . . . . . . . . 77
Consolidated income statement . . . . . . . . . . . . . . . . . . . . . . . . . . . .78Consolidated balance sheet . . . . . . . . . . . . . . . . . . . . . . . . . . . . . . .79Consolidated cash flow statement . . . . . . . . . . . . . . . . . . . . . . . . . 80Consolidated statement of changes in equity . . . . . . . . . . . . . . . . 8 1 Notes to the consolidated financial statements . . . . . . . . . . . . . .82
1. General information . . . . . . . . . . . . . . . . . . . . . . . . . . . . . . . . . . . . . 822. Summary of significant accounting policies . . . . . . . . . . . . . . 823. Financial risk management . . . . . . . . . . . . . . . . . . . . . . . . . . . . . 874. Segment information . . . . . . . . . . . . . . . . . . . . . . . . . . . . . . . . . . . 955. Acquisitions and disposals of subsidiaries . . . . . . . . . . . . . . . 996. Analysis of sales by category . . . . . . . . . . . . . . . . . . . . . . . . . . . 1007. Other income . . . . . . . . . . . . . . . . . . . . . . . . . . . . . . . . . . . . . . . . . 1008. Materials and services . . . . . . . . . . . . . . . . . . . . . . . . . . . . . . . . . 1009. Employee benefit costs . . . . . . . . . . . . . . . . . . . . . . . . . . . . . . . . .1 0 110. Depreciation, amortization and impairment charges . . . . . .1 0 111. Other expenses . . . . . . . . . . . . . . . . . . . . . . . . . . . . . . . . . . . . . . . .1 0 112. Financial income and expenses . . . . . . . . . . . . . . . . . . . . . . . . .10213. Income tax expense . . . . . . . . . . . . . . . . . . . . . . . . . . . . . . . . . . . 10314. Earnings per share . . . . . . . . . . . . . . . . . . . . . . . . . . . . . . . . . . . . 10315. Dividend per share . . . . . . . . . . . . . . . . . . . . . . . . . . . . . . . . . . . . 10316. Property, plant and equipment . . . . . . . . . . . . . . . . . . . . . . . . . .10417. Intangible assets . . . . . . . . . . . . . . . . . . . . . . . . . . . . . . . . . . . . . . .10518. Investments in associates and joint ventures . . . . . . . . . . . . .10719. Carrying amounts of financial assets and liabilities by measurement categories . . . . . . . . . . . . . . . . . . . .109
20. Non-current receivables and available-for-sale financial assets . . . . . . . . . . . . . . . . . . . . . . . . 1102 1. Inventories . . . . . . . . . . . . . . . . . . . . . . . . . . . . . . . . . . . . . . . . . . . . . 11022. Current trade and other receivables . . . . . . . . . . . . . . . . . . . . . 11023. Cash and cash equivalents . . . . . . . . . . . . . . . . . . . . . . . . . . . . . 11024. Derivative financial instruments . . . . . . . . . . . . . . . . . . . . . . . . . . 1 1 125. Equity . . . . . . . . . . . . . . . . . . . . . . . . . . . . . . . . . . . . . . . . . . . . . . . . . . 11326. Non-current and current liabilities . . . . . . . . . . . . . . . . . . . . . . . 11427. Deferred income taxes . . . . . . . . . . . . . . . . . . . . . . . . . . . . . . . . . . 11528. Provisions . . . . . . . . . . . . . . . . . . . . . . . . . . . . . . . . . . . . . . . . . . . . . . 11729. Retirement benefit obligations . . . . . . . . . . . . . . . . . . . . . . . . . . . 11730. Share-based payments . . . . . . . . . . . . . . . . . . . . . . . . . . . . . . . . . 11931. Related party transactions . . . . . . . . . . . . . . . . . . . . . . . . . . . . . .12332. Group companies on 31 December 2008 . . . . . . . . . . . . . . . . 12433. Contingencies and commitments . . . . . . . . . . . . . . . . . . . . . . .12634. Disputes and potential litigations . . . . . . . . . . . . . . . . . . . . . . . .12735. Events after the balance sheet date . . . . . . . . . . . . . . . . . . . . .127
Parent company income statement . . . . . . . . . . . . . . . . . . . . . . . . 128Parent company balance sheet . . . . . . . . . . . . . . . . . . . . . . . . . . . 129Parent company cash flow statement . . . . . . . . . . . . . . . . . . . . . . 130Notes to the parent company financial statements . . . . . . . . . . 1 31Proposal for the distribution of earnings and signing of the Review by the Board of Directors and the Financial Statements . . . . . . . . . . . . . . . . . . . . 142Auditor's Report . . . . . . . . . . . . . . . . . . . . . . . . . . . . . . . . . . . . . . . . . 143Statement by the Supervisory Board . . . . . . . . . . . . . . . . . . . . . . . 144Quarterly segment information . . . . . . . . . . . . . . . . . . . . . . . . . . . . 145
Consolidated financial statements in accordance with International Financial Reporting Standards
Parent company financial statements in accordance with Finnish Gaap
For the period 1 January to 31 December 2008
Index
5.
Financial Statements

69Review by the Board of Directors
Neste Oil’s comparable operating profit was EUR 602 million in 2008, compared to EUR 626 million in 2007. The company’s IFRS operating profit and other IFRS numbers were weaker compared to the previous year as a result of inventory losses during the sec-ond half of the year. The Board of Directors proposes a dividend of EUR 0.80, totaling EUR 205 million.
Figures in parentheses refer to the full-year financial statements for 2007, unless otherwise stated.
The Group's full-year resultsSales at the Neste Oil Group totaled EUR 15,043 million in 2008, compared to EUR 12,103 million in 2007.
The comparable operating profit of EUR 602 million was sup-ported by a stronger total refining margin and good profitability at Shipping, but this was offset by unfavorable US dollar hedging and weaker profits at Oil Retail and the joint venture company Nynas. Additional negative impact came in the form of exceptional costs, which totaled around EUR 55 million.
Oil Refining’s full-year comparable operating profit was EUR 510 million (484 million), Renewable Fuels’ EUR 2 million (-13 million), Specialty Products’ EUR 50 million (109 million), Oil Retail’s EUR 22 million (59 million), and Shipping’s EUR 55 million (28 million).
Profits from associated companies and joint ventures totaled EUR 13 million (39 million).
Operating profit under IFRS was EUR 186 million in 2008. The major decline from the EUR 801 million booked in 2007 is associ-ated with inventory losses that cumulated in the second half of 2008 as oil prices softened rapidly. Under IFRS, inventories are accounted under the first-in, first-out (FIFO) principle and valued at the lower of cost or net realizable value. Inventory gains and losses are excluded in the comparable operating profit, which is a better way to asses the company’s operating results in a volatile oil price environment. Inventory losses totaled EUR 453 million in 2008, com-pared to a profit of 174 million in 2007.
The full-year profit before taxes was EUR 129 million (763 million) and effective tax rate was 21.8% (24.0%). Profit for 2008 totaled EUR 101 million (580 million), and earnings per share were EUR 0.38 (2.25).
Given the capital-intensive nature of its business, Neste Oil uses return on average capital employed after tax (ROACE) as its pri-mary financial target. ROACE calculation is based on comparable operating profit. At the end of December, the rolling twelve-month ROACE was 13.1% (2007 financial year: 15.5%).
Review by the Board of Directors
Group key figures, MEUR2008 2007
Comparable operating profit 602 626
- inventory gains/losses -453 174
- changes in the fair value of open oil derivatives 24 -5
- capital gains/losses 13 6
Operating profit 186 801
Sales 2008 2007
Oil Refining 12,030 9,348
Renewable Fuels 116 40
Specialty Products 591 649
Oil Retail 4,073 3,435
Shipping 437 394
Others 143 93
Eliminations -2,347 -1,856
Total 15,043 12,103
Operating profit 2008 2007
Oil Refining 123 640
Renewable Fuels 2 -12
Specialty Products 19 122
Oil Retail 25 60
Shipping 54 30
Others -42 -37
Eliminations 5 -2
Total 186 801
Comparable operating profit 2008 2007
Oil Refining 510 484
Renewable Fuels 2 -13
Specialty Products 50 109
Oil Retail 22 59
Shipping 55 28
Others -42 -39
Eliminations 5 -2
Total 602 626
Capital expenditure and financingInvestments totaled EUR 508 million in 2008 compared to EUR 334 million in 2007. Oil Refining’s capital spending was EUR 132 million (193 million), Renewable Fuels’ EUR 249 million (69 million), Specialty Products’ EUR 30 million (5 million), Oil Retail’s EUR 63 million (51 mil-lion), and Shipping’s EUR 3 million (2 million). Investments in the Other segment totaled EUR 31 million (14 million). Depreciation in 2008 was EUR 223 million (195 million).
The Group's interest-bearing net debt was EUR 1,004 million at the end of the year (31 Dec 2007: EUR 755). Net financial expenses between January and December were EUR 57 million (38 million). The average interest rate of borrowings at the end of 2008 was 4.0%, and the average maturity 4.4 years.
Neste Oil 2008

70 Review by the Board of Directors
Net cash from operating activities between January and De-cember was EUR 512 million (541 million). Neste Oil's balance sheet remained healthy during 2008. The year-end equity-to-assets ratio was 46.3% (31 Dec 2007: 49.9%), the leverage ratio 31.5% (31 Dec 2007: 23.7%, and the gearing ratio 46.1% (31 Dec 2007: 31.1%).
The Group's liquidity remained strong. Cash and cash equiva-lents and committed, unutilized credit facilities amounted to EUR 1,536 million at the end of December (31 Dec 2007: 1,492 million). The company sees no major refinancing needs until 2012. Short-term financing will continue to be met by revolving credit and overdraft facilities. There are no financial covenants in existing loan agree-ments.
In accordance with its hedging policy, Neste Oil has hedged the majority of its net foreign currency exposure for the next 12 months, mainly using forward contracts and currency options. The most important hedged currency is the US dollar.
Main events during the reporting period
Strategy implementationNeste Oil continued to implement its clean fuel strategy in 2008. In line with this, the company’s current capital projects consist of new plants designed to increase production of renewable diesel and high-quality base oil. The company is also investing in an isomer-ization unit to improve gasoline quality.
Strategic projectsNeste Oil announced on 13 June that it will build an 800,000 t/a plant to produce NExBTL renewable diesel in Rotterdam in the Netherlands. Construction started immediately and the facil-ity is scheduled to be completed in 2011. The total cost of the investment was projected to be EUR 670 million. Construction of a similar-sized renewable diesel plant in Singapore proceeded according to the plan in 2008, scheduled to be in operation at the end of 2010. At the end of the year, Neste Oil and OMV decided to discontinue planning of a jointly owned NExBTL diesel plant in Austria.
On 16 June, Neste Oil and Bahrain's Oil & Gas Holding Com-pany (OGHC) and the Bahrain Petroleum Company (Bapco) announced that they will establish a joint venture known as the Bahrain Base Oil Company to build a high-quality lubricant base oil plant in Bahrain. The plant will have an annual capacity of 400,000 tons of VHVI (Very High Viscosity Index) base oil for use in blend-ing top-tier lubricants. Completion is scheduled for the end of 2011. Neste Oil’s share of the JV is 45% and an estimated share of the investment cost is EUR 115–135 million.
Neste Oil announced on 4 June that it would build a new isomerization unit, costing approximately EUR 80 million, at its Por-voo refinery. The new unit will be capable of processing 600,000 t/a of lower-value gasoline fractions into higher-value, premium-quality gasoline, and will increase the refinery’s total gasoline output by 200,000 t/a. Construction of the new unit will begin in 2009, and it is scheduled to come on stream in 2011.
Other eventsThe latest addition to the Porvoo refinery, Production Line 4, suf-fered from operational constraints between early April and early October. This resulted in lower-than-planned diesel output and a lower refining margin.
Neste Oil announced on 3 January 2008 that its subsidiary, Neste Jacobs, would acquire the engineering company, Rintekno. Follow-ing the acquisition, Neste Jacobs became the leading provider of engineering services for the chemical and biotechnology industries in the Nordic region, employing a total of some 800 people.
Neste Oil announced on 1 April 2008 that the disagreement relating to the final financial settlement for the mechanical instal-lation work on Production Line 4 at the Porvoo refinery had been put before the Court of Arbitration. Neste Oil's claims against YIT Industrial and Network Services initially amounted to around EUR 36 million and mainly comprise damages based on the delay to the contract. In September, Neste Oil clarified its claims as total-ing some EUR 107 million. YIT has lodged counter claims against Neste Oil for an amount of around EUR 25 million. Both parties contest each other’s claims.
Neste Oil commercially launched a new renewable diesel, Neste Green diesel, in Finland at the beginning of May. Neste Green diesel contains at least 10% renewable fuel in the form of the company’s unique NExBTL component. Distribution of the new fuel has initially been concentrated in Greater Helsinki.
Market overviewCrude oil prices were very volatile in 2008. Prices continued to rise in the first half of the year and Brent Dated recorded an all-time high of USD 144/bbl in July. Good demand, especially in China and India, and concerns about the long-term supply-demand balance drove the market up. As the global financial crisis escalated, how-ever, prices started to decline sharply. Simultaneously, concerns about a recession resulted in reduced demand forecasts. Al-though OPEC announced production cuts to support the market, crude prices kept falling until finally stabilizing in December, when Brent Dated leveled at around USD 40/bbl. Brent Dated averaged USD 97/bbl (73) during the year as a whole.
The price differential between heavy and light crude was also volatile, widening during the first few months of 2008 but narrowing as crude oil prices fell. Demand for heavier crude improved due to new conversion capacity and good marine bunker demand. The average differential between Urals and Brent Dated in 2008 was USD -2.95 /bbl (-3.10).
Refining margins were slightly lower compared to 2007, and were mainly driven by middle distillates, as gasoline demand suf-fered from high prices. Margins peaked in September, when hur-ricanes forced refineries to shut down in the US Gulf. The interna-tional reference refining margin for complex refineries in Northwest Europe, IEA Brent Cracking, averaged USD 4.74 /bbl (5.09) in 2008.
Gasoline margins collapsed compared to 2007. Record high pump prices and increasing ethanol blending eroded demand significantly in the US, resulting in growing inventories. Low de-mand continued through the US driving season, and margins were even negative in July. After the hurricanes in September, invento-ries fell considerably and margins improved, but as the economic

71Review by the Board of Directors
situation worsened, the outlook for gasoline remained very nega-tive and margins fell again, virtually to zero.
Boosted by increasing demand, middle distillate margins, which were already strong, improved further in 2008, especially during the second quarter. High prices and the worsening economic outlook did not affect demand, which even improved when supply was dis-rupted by refinery outages. At the end of the year, after holding up so long, demand for middle distillates eventually started to show signs of suffering from the economic recession and margins decreased.
Fuel oil margins remained negative throughout 2008, but im-proved in the second half as crude oil prices declined. High-sulfur fuel oil was temporarily strong due to low Russian exports and very good bunker demand.
The European Union’s Renewable Energy Directive was ap-proved in December 2008. The directive includes a binding renewable fuel target of 10% in traffic and transportation usage in member states by 2010, together with sustainability criteria for biofuels. Implementation of the directive still requires consultation, which is estimated to last until the second half of 2009.
Demand for gasoline fell on the Finnish retail market by ap-proximately 5% in 2008. Diesel demand increased, but growth decreased to approximately 2% as the economical situation worsened. The downturn in the Baltic economies was reflected in reduced demand for transportation fuels; in the St. Petersburg region, demand still grew but at a slower rate.
Unlike expected, Shipping freight rates were higher in 2008 than in 2007. North Sea crude freight rates increased by 32% and in the Baltic rates by 22%.
Key drivers
2008 2007
IEA Brent cracking margin, USD/bbl 4.74 5.09
Total refining margin, USD/bbl 13.39 10.46
Urals-Brent price differential, USD/bbl -2.95 -3.10
Brent dated crude oil, USD/bbl 96.99 72.52
USD/EUR exchange rate 1.47 1.37
Crude freights, Aframax WS points 179 136
Production and salesSeveral records were broken at Neste Oil's refineries in 2008, including total annual production and total input at both refiner-ies, which exceeded 15 million tons for the first time. Diesel output reached an all-time high, although the new diesel line operated at only approximately 60% of its annual nameplate capacity. Neste Oil refined a total of 15.2 million tons (14.6 million) of crude oil and feedstocks in 2008, of which 12.4 million tons (11.8 million) at Porvoo. The Naantali refinery processed 2.8 million tons (2.8 million).
The Naantali refinery operated at virtually full crude distillation capacity in 2008 and reached a utilization rate of 97% (97%). At Porvoo, utilization rate was lower at 92% (95%) due to problems with the new diesel line.
The proportion of Russian Export Blend (REB) in Neste Oil’s total refinery input rose to 57% (51%).
The proportion of diesel in Neste Oil’s sales structure in 2008 increased to nearly 40%, while gasoline and heavy fuel oil declined. The additional diesel volumes were mostly sold in Europe, resulting in 25% higher sales volumes there. Growth was also seen in sales to North America.
Neste Oil's sales from in-house production, by product category (1,000 t)
2008 % 2007 %
Motor gasolines 4,056 28 4,384 31
Gasoline components 253 2 357 2
Diesel fuel 5,583 38 5,137 36
Jet fuel 658 5 729 5
Base oils 278 2 304 2
Heating oil 763 5 764 5
Heavy fuel oil 981 7 1,097 8
LPG 340 2 317 2
NExBTL renewable diesel 94 1 28 0
Other products 1,565 11 1,215 8
Total 14,571 100 14,332 100
Neste Oil's sales from in-house production, by market area (1,000 t)
2008 % 2007 %
Finland 7,537 52 8,053 56
Other Nordic countries 2,056 14 2,059 14
Other Europe 3,028 20 2,399 16
USA & Canada 1,857 13 1,703 12
Other countries 94 1 118 1
Total 14,571 100 14,332 100
Segment reviewsIn 2008, Neste Oil's businesses were grouped into six reporting segments: Oil Refining, Renewable Fuels, Specialty Products, Oil Retail, Shipping, and Other. The former Biodiesel division was renamed Renewable Fuels in April 2008.
Oil Refining
Key figures
2008 2007
Sales, MEUR 12,030 9,348
Operating profit, MEUR 123 640
Comparable operating profit, MEUR 510 484
Capital expenditure, MEUR 132 193
Total refining margin USD/bbl 13.39 10.46
Oil Refining's full-year comparable operating profit was EUR 510 million (484 million). Neste Oil's total refining margin increased to USD 13.39 /bbl in 2008, compared to USD 10.46 /bbl in 2007. The total refining margin was boosted by strong diesel and middle distillates margins. The US dollar, write-downs and unscheduled maintenance costs had a negative impact.
Neste Oil 2008

72 Review by the Board of Directors
Oil Refining’s operating profit according to IFRS was EUR 123 million (640 million). Full-year inventory losses totaled EUR 422 mil-lion, compared to an inventory profit of EUR 161 million in 2007.
Oil Refining's comparable return on net assets was 21.7% (22.7%) in 2008.
Renewable Fuels
Key figures
2008 2007
Sales, MEUR 116 40
Operating profit, MEUR 2 -12
Comparable operating profit, MEUR 2 -13
Capital expenditure, MEUR 249 69
Renewable Fuels’ full-year comparable operating profit was EUR 2 million (-13 million), thanks to the first NExBTL plant being opera-tional at Porvoo for part of the year. Higher costs were related to growth projects and R&D.
The full-year comparable return on net assets of Renewable Fuels was 0.9% (-12.3%).
Specialty Products
Key figures
2008 2007
Sales, MEUR 591 649
Operating profit, MEUR 19 122
Comparable operating profit, MEUR 50 109
Capital expenditure, MEUR 30 5
The full-year comparable operating profit of Specialty Products stood at EUR 50 million (109 million). Weaker profit performance resulted from lower profits at Neste Oil’s joint venture, Nynas AB, volatile base oil mar-gins, and continued weak demand for gasoline components.
Specialty Products’ full-year comparable return on net assets was 13.9% (32.9%).
Oil Retail
Key figures
2008 2007
Sales, MEUR 4,073 3,435
Operating profit, MEUR 25 60
Comparable operating profit, MEUR 22 59
Capital expenditure, MEUR 63 51
Total sales volume*, 1,000 m3 4,353 4,519
- gasoline station sales, 1,000 m3 1,479 1,457
- diesel station sales, 1,000 m3 1,406 1,329
- heating oil, 1,000 m3 759 763
- heavy fuel oil, 1,000 m3 356 473
*includes both station and terminal sales
Oil Retail’s comparable operating profit declined to EUR 22 million in 2008 (59 million). The majority of this resulted from a EUR 15 mil-lion write-down on receivables as well as EUR 10 million inventory losses.
Sales volumes of gasoline fell in the Finnish market, while diesel sales volume increased by approximately 5%. The company’s mar-ket share in both products increased. Margins were as tight as in 2007. Oil Retail continued implementation of the project designed to enhance its profitability and position in the Finnish market. The planned decrease in the number of personnel in Finland is 35% during the period 2008-2011. This target is intended to be met with-out terminations. Revamping of the Finnish station network pro-ceeded according to plan in 2008 and will be completed in 2011.
Volume growth in the Baltic Rim network totaled 7%, thanks to increasing sales at unmanned stations. Margins in the Baltic Rim were roughly unchanged year-on-year with some modest strength-ening being seen in the last quarter. The downturn in the econom-ic situation towards the end of the year had a negative impact on demand for, and volumes of, lubricants and LPG.
As of the end of 2008, Neste Oil had 887 (899) stations in Finland and 286 (271) in the Baltic Rim.
Oil Retail's comparable return on net assets was 6.0% (17.1%) in 2008.
Shipping
Key figures
2008 2007
Sales, MEUR 437 394
Operating profit, MEUR 54 30
Comparable operating profit, MEUR 55 28
Capital expenditure, MEUR 3 2
Fleet utilization rate, % 96 94
Shipping's comparable operating profit totaled EUR 55 million in 2008 (28 million). Average freight rates were significantly higher in 2008 than in 2007. Shipping’s operations ran smoothly throughout 2008, which is seen in the very high fleet utilization rate.
Shipping's comparable return on net assets was 19.2% (9.3%) in 2008.
Shares, share trading, and ownershipNeste Oil’s share price closed 2008 at EUR 10.58, which is 52% lower compared to the end of 2007, and roughly in line with the European refining sector in general. At its highest during 2008, the share price reached EUR 24.90, while at its lowest the price stood at EUR 9.47, with the weighted average for the year coming in at EUR 17.95. Mar-ket capitalization was EUR 2.7 billion as of 31 December 2008.
An average total of 1.5 million shares were traded daily. This represents 0.5% of the Company’s shares. An average of 32 million shares was traded monthly. During the year as a whole, 382 million shares, or 149% of the total number of shares, were traded.
Neste Oil’s share capital registered with the Company Regis-ter as of 31 December 2008 totaled EUR 40 million, and the total
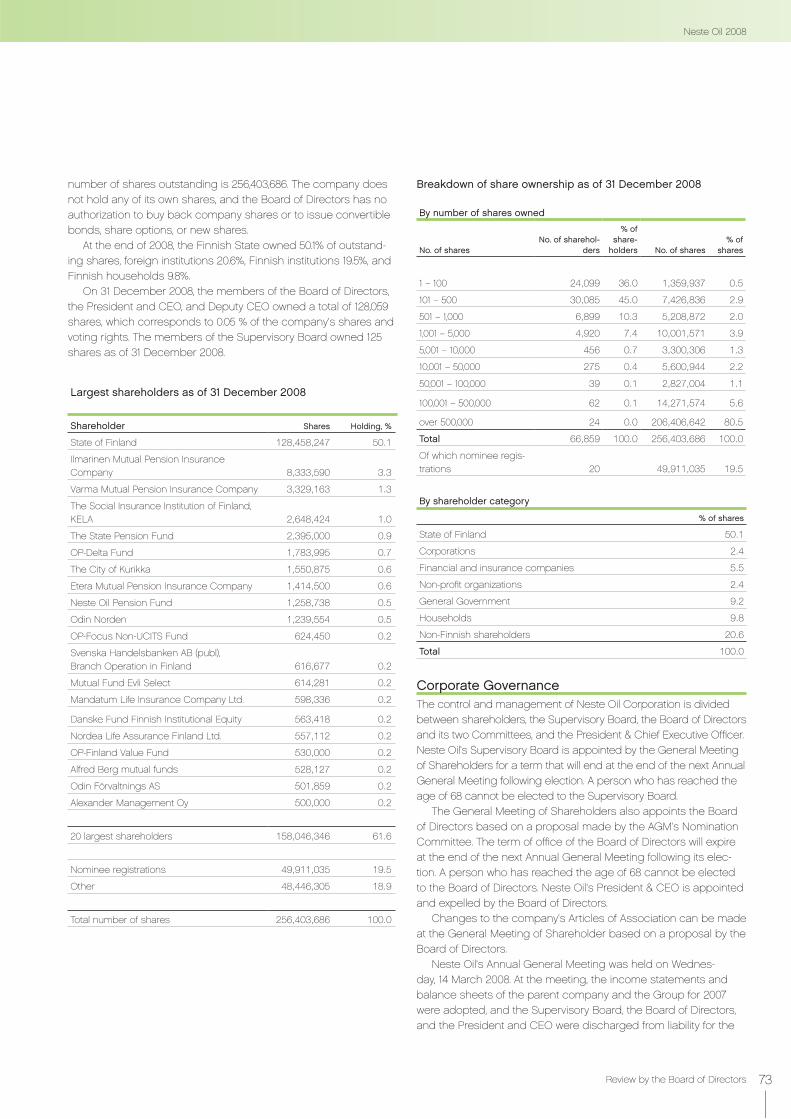
73Review by the Board of Directors
number of shares outstanding is 256,403,686. The company does not hold any of its own shares, and the Board of Directors has no authorization to buy back company shares or to issue convertible bonds, share options, or new shares.
At the end of 2008, the Finnish State owned 50.1% of outstand-ing shares, foreign institutions 20.6%, Finnish institutions 19.5%, and Finnish households 9.8%.
On 31 December 2008, the members of the Board of Directors, the President and CEO, and Deputy CEO owned a total of 128,059 shares, which corresponds to 0.05 % of the company's shares and voting rights. The members of the Supervisory Board owned 125 shares as of 31 December 2008.
Largest shareholders as of 31 December 2008
Shareholder Shares Holding, %
State of Finland 128,458,247 50.1
Ilmarinen Mutual Pension Insurance Company 8,333,590 3.3
Varma Mutual Pension Insurance Company 3,329,163 1.3
The Social Insurance Institution of Finland, KELA 2,648,424 1.0
The State Pension Fund 2,395,000 0.9
OP-Delta Fund 1,783,995 0.7
The City of Kurikka 1,550,875 0.6
Etera Mutual Pension Insurance Company 1,414,500 0.6
Neste Oil Pension Fund 1,258,738 0.5
Odin Norden 1,239,554 0.5
OP-Focus Non-UCITS Fund 624,450 0.2
Svenska Handelsbanken AB (publ), Branch Operation in Finland 616,677 0.2
Mutual Fund Evli Select 614,281 0.2
Mandatum Life Insurance Company Ltd. 598,336 0.2
Danske Fund Finnish Institutional Equity 563,418 0.2
Nordea Life Assurance Finland Ltd. 557,112 0.2
OP-Finland Value Fund 530,000 0.2
Alfred Berg mutual funds 528,127 0.2
Odin Förvaltnings AS 501,859 0.2
Alexander Management Oy 500,000 0.2
20 largest shareholders 158,046,346 61.6
Nominee registrations 49,911,035 19.5
Other 48,446,305 18.9
Total number of shares 256,403,686 100.0
Corporate GovernanceThe control and management of Neste Oil Corporation is divided between shareholders, the Supervisory Board, the Board of Directors and its two Committees, and the President & Chief Executive Officer. Neste Oil's Supervisory Board is appointed by the General Meeting of Shareholders for a term that will end at the end of the next Annual General Meeting following election. A person who has reached the age of 68 cannot be elected to the Supervisory Board.
The General Meeting of Shareholders also appoints the Board of Directors based on a proposal made by the AGM's Nomination Committee. The term of office of the Board of Directors will expire at the end of the next Annual General Meeting following its elec-tion. A person who has reached the age of 68 cannot be elected to the Board of Directors. Neste Oil's President & CEO is appointed and expelled by the Board of Directors.
Changes to the company's Articles of Association can be made at the General Meeting of Shareholder based on a proposal by the Board of Directors.
Neste Oil's Annual General Meeting was held on Wednes-day, 14 March 2008. At the meeting, the income statements and balance sheets of the parent company and the Group for 2007 were adopted, and the Supervisory Board, the Board of Directors, and the President and CEO were discharged from liability for the
Breakdown of share ownership as of 31 December 2008
By number of shares owned
No. of sharesNo. of sharehol-
ders
% of share-
holders No. of shares% of
shares
1 – 100 24,099 36.0 1,359,937 0.5
101 – 500 30,085 45.0 7,426,836 2.9
501 – 1,000 6,899 10.3 5,208,872 2.0
1,001 – 5,000 4,920 7.4 10,001,571 3.9
5,001 – 10,000 456 0.7 3,300,306 1.3
10,001 – 50,000 275 0.4 5,600,944 2.2
50,001 – 100,000 39 0.1 2,827,004 1.1
100,001 – 500,000 62 0.1 14,271,574 5.6
over 500,000 24 0.0 206,406,642 80.5
Total 66,859 100.0 256,403,686 100.0
Of which nominee regis-trations 20 49,911,035 19.5
By shareholder category
% of shares
State of Finland 50.1
Corporations 2.4
Financial and insurance companies 5.5
Non-profit organizations 2.4
General Government 9.2
Households 9.8
Non-Finnish shareholders 20.6
Total 100.0
Neste Oil 2008

74 Review by the Board of Directors
2007 financial year. The Board of Directors’ proposal regarding the distribution of profits for 2007 by paying a dividend of EUR 1.00 per share was approved.
In accordance with the proposal made by the AGM Nomina-tion Committee, the AGM decided that the Board of Directors will comprise eight members, and the following were reelected: Mr. Timo Peltola as Chairman, Mr. Mikael von Frenckell as Vice Chair-man, and Mr. Michiel A.M. Boersma, Ms. Ainomaija Haarla, Ms. Nina Linander, Mr. Antti Tanskanen, and Ms. Maarit Toivanen-Koivisto as members. Mr. Markku Tapio was elected as a new member.
In 2008, the Supervisory Board comprised of Ms. Heidi Hautala (Chairman), Mr. Hannes Manninen (Vice Chairman), Mr. Esko Ahonen, Mr. Mikael Forss, Mr. Timo Heinonen, Mr. Markus Mustajärvi, Ms. Jutta Urpilainen, and Ms. Anne-Mari Virolainen. Members are all Finnish Members of Parliament, with the exception of Mr. Mikael Forss, who is a Director at the Social Insurance Institution of Finland.
Changes in senior managementPresident & CEO Risto Rinne retired as of 1 October 2008 after more than 30 years of service with the company. Mr. Matti Lievonen was appointed the new President & CEO and joined the company on 1 December.
The Chief Financial Officer, Petri Pentti, left Neste Oil at the end of September, and Mr. Ilkka Salonen was appointed CFO in November, joining Neste Oil in January 2009.
PersonnelNeste Oil employed an average of 5,174 (4,810) employees in 2008. At the end of December, the company had 5,262 employees (Dec 2007: 4,807). Wages and salaries paid by the company totaled EUR 251 million in 2008 (210 million).
Health, safety, and the environmentNo serious environmental accidents resulting in liability occurred at Neste Oil's refineries or other production facilities in 2008. The environmental emissions of Neste Oil operations remained low throughout the year. Wastewater treatment plants at the refineries operated very well. The oil content of waterborne emissions was 0.1 g/ton of crude oil processed. This is less than 3.5% of the 3 g/ton maximum emission recommendation by the Baltic Marine Environ-ment Protection Commission.
Finland’s Supreme Court fined Neste Oil EUR 500,000 for dam-age caused to the environment as a result of an oil leak in 2001. The Turku Court of Appeal and the Turunseutu District Court had previously rejected the prosecution’s call for a fine against the company.
The main indicator for safety performance used by Neste Oil – cumulative total recordable injury frequency (TRIF, number of cases per million hours worked) for all work done for the company, combining the company's own personnel and contractors – stood at 5.2 (5.8) at the end of December 2008. The target for 2008 was less than 5. The cumulative number of lost workday injuries was 54 at the end of December, resulting in a LWIF of 3.2 (2.9). The target is below 3.
Neste Oil has successfully fulfilled all the requirements related to carbon dioxide emissions in 2008. The verification of
emissions for 2008 is scheduled, and the company is able to report and surrender allowances equal to its total emissions in 2008. The company has received emission rights for 3.6 million tons of CO2 emissions a year between 2008 and 2012, and will need to acquire rights from the market to cover expected future emissions.
The REACH (Registration, Evaluation and Authorization of Chem-icals) regulation came into force in the EU on 1 June 2007. Neste Oil has contributed to joint work carried out under the framework of the European oil companies’ organization, Concawe, and the com-pany's project for meeting REACH requirements has progressed according to plan. The company successfully preregistered the substances it uses and produces in compliance with the deadline at end of November 2008.
Neste Oil retained its position in or was selected for inclusion in a number of sustainability indexes during 2008. It was again in-cluded in the Dow Jones Sustainability World Index, which features 320 companies from 24 countries that excel in their commitment to a more sustainable future. Neste Oil has been awarded ‘Best in Class’ recognition for its social accountability by the Norwegian banking group, Storebrand, included twice in Innovest’s Global 100 list of the world’s most responsible companies, and featured in the Ethibel Pioneer Investment Register.
Research and developmentResearch and development focusing on both crude oil-based and renewable fuels is crucial in implementing Neste Oil's strategy. Neste Oil's R&D expenditure increased by 32% compared to 2007 and totaled EUR 37 million (28 million). The main R&D projects were related to extending the raw material and technological base for renewable fuels.
Events after the reporting periodNeste Oil announced on 5 February 2009 that it will reorganize its operations around three business areas and seven common functions, and will introduce a new organization reflecting this on 1 April 2009. The new business areas will act as profit centers and will be responsible for their customers, products, and business development. The new business areas are as follows: Oil Products, Renewable Fuels, and Oil Retail. Activities outside these business areas will be grouped under Others. The new common functions will be: Production & Logistics, Finance, Human Resources, HSE, Technology & Strategy, Communications, and Legal Affairs.
The Specialty Products Division will be amalgamated into the Oil Products business area. Shipping operations will be reported in connection with the business areas that use them, and the Ship-ping business incorporated into Production & Logistics.
Neste Oil’s financial reporting will be based on these business areas from 28 April 2009 onwards when the Q1/2009 figures are announced. Comparative figures for 2008 will be published before that in April.
The new common functions will be: Production & Logistics, Finance, Human Resources, HSSE, Technology & Strategy, Com-munications, and Legal Affairs.
After these changes, the Neste Executive Board will comprise the following members: Matti Lievonen, President & CEO; Matti

75Review by the Board of Directors
Lehmus, Executive Vice President, Oil Products; Jarmo Honkamaa, Executive Vice President, Renewable Fuels, Deputy CEO; Sakari Toivola, Executive Vice President, Oil Retail; Ilkka Poranen, Senior Vice President, Production & Logistics; Ilkka Salonen, CFO; Hannele Jakosuo-Jansson, Senior Vice President, Human Resources, Simo Honkanen, Senior Vice President, HSE; Osmo Kammonen, Senior Vice President, Communications; Lars Peter Lindfors, Senior Vice President, Technology & Strategy; Matti Hautakangas*, General Counsel.*Secretary to the Neste Executive Board, not a member
The Neste Executive Management Board will comprise the President & CEO, business area executive vice presidents, the CFO, and the Senior Vice President, Production & Logistics.
Potential short-term and long-term risks The oil market has been very volatile. Oil refiners are exposed to a variety of political and economic trends and events, as well as natural phenomena that affect the short- and long-term supply of and demand for the products that they produce and sell.
The largest uncertainty in the foreseeable future relates to the continued slowdown of the world economy, which is likely to reduce the demand for petroleum products and gasoline in partic-ular. The problems on the international financial market have also increased uncertainties. As a consequence, managing customer receivables risks has become even more important. Sudden and unplanned outages at Neste Oil's production units or facilities continue to represent a short-term risk.
Rapid and large changes in feedstock and product prices may lead to significant inventory gains or losses, or change in working capital. These may have a material impact on the company’s IFRS operating profit and net cash from operations.
Over the longer term, access to funding and rising capital costs, as well as challenges in procuring and developing new competitive and reasonably priced raw materials, may impact the company's growth plans.
The implementation of biofuel legislation in the EU and other key market areas may influence the speed at which the demand for these fuels develops.
The key market drivers of Neste Oil’s financial performance are international refining margins, the price differential between Russian Export Blend (REB) and Brent crude, and the USD/EUR exchange rate.
Risk managementRisk management is a central part of Neste Oil’s management sys-tem, and its importance will only grow as the company moves ahead with its major projects and as turbulence continues in the global economy. Neste Oil aims to limit the impact of risks on its operations through a range of risk management strategies. The Corporate Risk Management Policy and Principles approved by the Board of Direc-tors are the framework for managing the risks associated with the strategic and operational targets of the Group and its divisions and functions. In addition, divisions and corporate functions also have their own specific principles, instructions, and procedures related to risk management, approved by the President & CEO.
Risk management in the area of strategic and operational management aims at recognizing, assessing and prioritizing risks continuously, and managing them proactively.
For more detailed information on Neste Oil's risks and risk man-agement, please refer to the note 3 of Financial Statements for 2008 and Corporate Governance section of the company’s website.
Outlook for 2009The outlook for the global economy is depressed, and this is reflected in oil demand forecasts, which have been revised down. The International Energy Agency (IEA) estimated in January that global oil demand will continue to decrease in 2009. The decrease in OECD countries is expected to be 2.5%.
Demand for gasoline, together with gasoline margins, looks likely to be very weak throughout 2009. Diesel and other middle distillates are expected to be the strongest part of the barrel and practically the only positive contributors to refining margins. Contin-ued lower economical activity, however, is likely to put pressure on diesel margins as well.
Demand for base oils is likely to be weaker than in previous years, due to an anticipated decline in demand for lubricants.
Demand for all products is forecast to decrease in Oil Retail. Devaluation of local currencies may out pressure on Baltic Rim operations.
Operational performance at Neste Oil’s refineries, including the NExBTL plant, should be better than during 2008. A planned two-month maintenance and process improvement shutdown will be carried out on Production Line 4 during the second quarter to enhance the line’s productivity.
Shipping’s fleet utilization rate is expected to remain high and operations smooth.
The Group will address its fixed costs and maintenance expen-diture to secure cash flow.
The Group’s investments are estimated to be around EUR 950 million in 2009 (508 million in 2008), of which maintenance invest-ments will account for around EUR 180 million (218 million in 2008), productivity investments around EUR 60 million (14 million in 2008) and strategic investments around EUR 710 million (276 million in 2008).
Dividend distribution proposal The Board of Directors will propose to the Annual General Meeting that Neste Oil should pay a dividend of EUR 0.80 per share for 2008, totaling EUR 205 million.
Neste Oil 2008
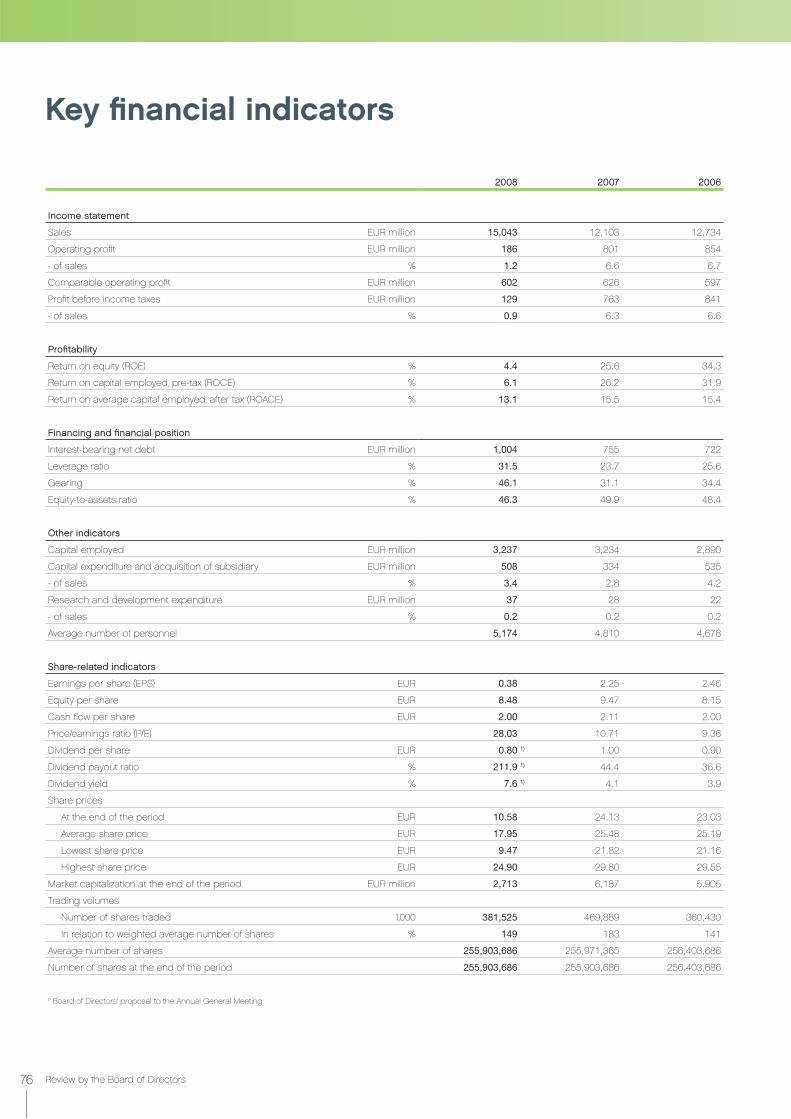
76 Review by the Board of Directors
Key financial indicators
2008 2007 2006
Income statement
Sales EUR million 15,043 12,103 12,734
Operating profit EUR million 186 801 854
- of sales % 1.2 6.6 6.7
Comparable operating profit EUR million 602 626 597
Profit before income taxes EUR million 129 763 841
- of sales % 0.9 6.3 6.6
Profitability
Return on equity (ROE) % 4.4 25.6 34.3
Return on capital employed, pre-tax (ROCE) % 6.1 26.2 31.9
Return on average capital employed, after tax (ROACE) % 13.1 15.5 15.4
Financing and financial position
Interest-bearing net debt EUR million 1,004 755 722
Leverage ratio % 31.5 23.7 25.6
Gearing % 46.1 31.1 34.4
Equity-to-assets ratio % 46.3 49.9 48.4
Other indicators
Capital employed EUR million 3,237 3,234 2,890
Capital expenditure and acquisition of subsidiary EUR million 508 334 535
- of sales % 3.4 2.8 4.2
Research and development expenditure EUR million 37 28 22
- of sales % 0.2 0.2 0.2
Average number of personnel 5,174 4,810 4,678
Share-related indicators
Earnings per share (EPS) EUR 0.38 2.25 2.46
Equity per share EUR 8.48 9.47 8.15
Cash flow per share EUR 2.00 2.11 2.00
Price/earnings ratio (P/E) 28.03 10.71 9.36
Dividend per share EUR 0.80 1) 1.00 0.90
Dividend payout ratio % 211.9 1) 44.4 36.6
Dividend yield % 7.6 1) 4.1 3.9
Share prices
At the end of the period EUR 10.58 24.13 23.03
Average share price EUR 17.95 25.48 25.19
Lowest share price EUR 9.47 21.82 21.16
Highest share price EUR 24.90 29.80 29.55
Market capitalization at the end of the period EUR million 2,713 6,187 5,905
Trading volumes
Number of shares traded 1,000 381,525 469,889 360,430
In relation to weighted average number of shares % 149 183 141
Average number of shares 255,903,686 255,971,365 256,403,686
Number of shares at the end of the period 255,903,686 255,903,686 256,403,686
1) Board of Directors’ proposal to the Annual General Meeting

77Review by the Board of Directors
Calculation of key financial indicators
Calculation of key financial indicators
Operating profit = Operating profit includes the revenue from the sale of goods and services, other income such as gain from sale of shares or non-financial assets, share of profit (loss) of associates and joint ventures, less losses from sale of shares or non-financial assets, as well as expenses related to production, marketing and selling activities, administration, depreciation, amortization, and impairment charges. Realized and unrealized gains or losses on oil and freight derivative contracts together with realized gains and losses from foreign currency and oil derivative contracts hedging cash flows of commercial sales and purchases that have been recycled in the income statement, are also included in operating profit.
Comparable operating profit = Operating profit -/+ inventory gains/losses -/+ gains/losses from sale of shares and non-financial assets - unreal-ized change in fair value of oil and freight derivative contracts
Return on equity, (ROE)% = 100 xProfit before taxes - taxes
Total equity average
Return on capital employed, pre-tax (ROCE) %
= 100 xProfit before taxes + interest and other financial expenses
Capital employed average
Return on average capital employed, after-tax (ROACE) %
= 100 x
Profit for the period (adjusted for inventory gains/losses, gains/losses from sale of shares and non-financial assets and unrealized gains/losses on oil and freight derivative contracts, net of tax) + minority interest + interest expenses and other financial expenses related to interest-bearing liabilities (net of tax)
Capital employed average
Capital employed = Total assets - interest-free liabilities - deferred tax liabilities - provisions
Interest-bearing net debt = Interest-bearing liabilities - cash and cash equivalents
Leverage ratio, %= 100 x
Interest-bearing net debt
Interest bearing net debt + total equity
Gearing, %= 100 x
Interest-bearing net debt
Total equity
Equity-to-assets ratio, %= 100 x
Total equity
Total assets - advances received
Return on net assets, %= 100 x
Segment operating profit
Average segment net assets
Comparable return on net assets, % = 100 xSegment comparable operating profit
Average segment net assets
Segment net assets = Property, plant and equipment, intangible assets, investment in associates and joint ventures, pension assets, inventories and interest-free receivables and liabilities allocated to the business segment, provisions and pension liabilities
Research and development expenditure= Research and development expenditure comprise of the expenses of the Research & Technology unit serving
all divisions of the Group, as well as research and technology expenses incurred in divisions, which are included in the consolidated income statement. Depreciation and amortization are included in the figure. The expenses are presented as gross, before deducting grants received.
Calculation of share-related indicators
Earnings per share (EPS) =Profit for the period attributable to the equity holders of the company
Adjusted average number of shares during the period
Equity per share =Shareholder’s equity attributable to the equity holders of the company
Adjusted average number of shares at the end of the period
Cash flow per share =Net cash generated from operating activities
Adjusted average number of shares during the period
Price / earnings ratio (P/E) =Share price at the end of the period
Earnings per share
Dividend payout ratio, % = 100 xDividend per share
Earnings per share
Dividend yield, % = 100 xDividend per share
Share price at the end of the period
Average share price =Amount traded in euros during the period
Number of shares traded during the period
Market capitalization at the end of the period = Number of shares at the end of the period x share price at the end of the period
Trading volume= Number of shares traded during the period, and in relation to the weighted average number of shares during
the period
Neste Oil 2008
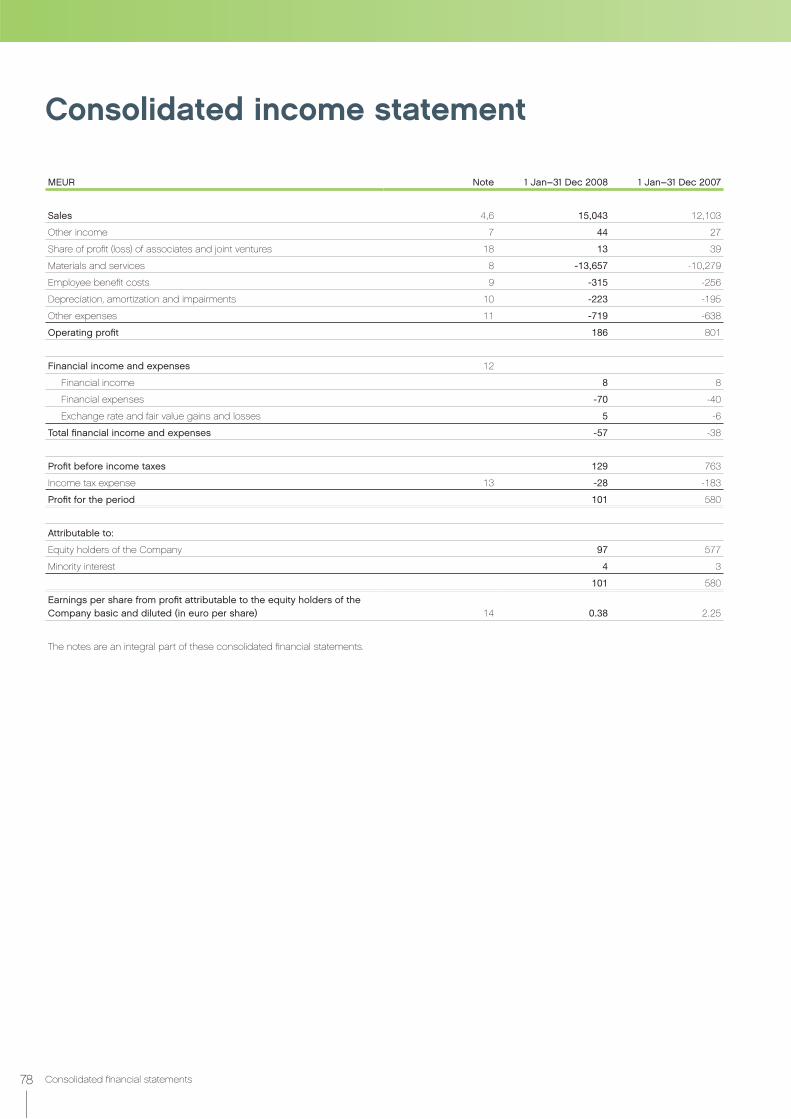
78 Consolidated financial statements
MEUR Note 1 Jan–31 Dec 2008 1 Jan–31 Dec 2007
Sales 4,6 15,043 12,103
Other income 7 44 27
Share of profit (loss) of associates and joint ventures 18 13 39
Materials and services 8 -13,657 -10,279
Employee benefit costs 9 -315 -256
Depreciation, amortization and impairments 10 -223 -195
Other expenses 11 -719 -638
Operating profit 186 801
Financial income and expenses 12
Financial income 8 8
Financial expenses -70 -40
Exchange rate and fair value gains and losses 5 -6
Total financial income and expenses -57 -38
Profit before income taxes 129 763
Income tax expense 13 -28 -183
Profit for the period 101 580
Attributable to:
Equity holders of the Company 97 577
Minority interest 4 3
101 580
Earnings per share from profit attributable to the equity holders of the Company basic and diluted (in euro per share) 14 0.38 2.25
The notes are an integral part of these consolidated financial statements.
Consolidated income statement

79Consolidated financial statements
Consolidated balance sheet
MEUR Note 31 Dec 2008 31 Dec 2007
ASSETS
Non-current assets
Intangible assets 17 51 41
Property, plant and equipment 16 2,675 2,436
Investments in associates and joint ventures 18 152 178
Non-current receivables 19,20 13 3
Pension assets 29 105 81
Deferred tax assets 27 16 7
Derivative financial instruments 19,24 16 22
Available-for-sale financial assets 19,20 1 2
Total non-current assets 3,029 2,770
Current assets
Inventories 21 637 968
Trade and other receivables 19,22 786 955
Derivative financial instruments 19,24 213 126
Cash and cash equivalents 23 55 52
Total current assets 1,691 2,101
Total assets 4,720 4,871
EQUITY
Capital and reserves attributable to equity holders of the company 25
Share capital 40 40
Other equity 2,131 2,383
Total 2,171 2,423
Minority interest 8 4
Total equity 2,179 2,427
LIABILITIES
Non-current liabilities
Interest-bearing liabilities 19,26 926 662
Deferred tax liabilities 27 297 289
Provisions 28 24 8
Pension liabilities 29 12 11
Derivative financial instruments 19,24 32 22
Other non-current liabilities 19,26 3 5
Total non-current liabilities 1,294 997
Current liabilities
Interest-bearing liabilities 19,26 133 145
Current tax liabilities 19,26 1 14
Derivative financial instruments 19,24 197 77
Trade and other payables 19,26 916 1,211
Total current liabilities 1,247 1,447
Total liabilities 2,541 2,444
Total equity and liabilities 4,720 4,871
The notes are an integral part of these consolidated financial statements.
Neste Oil 2008
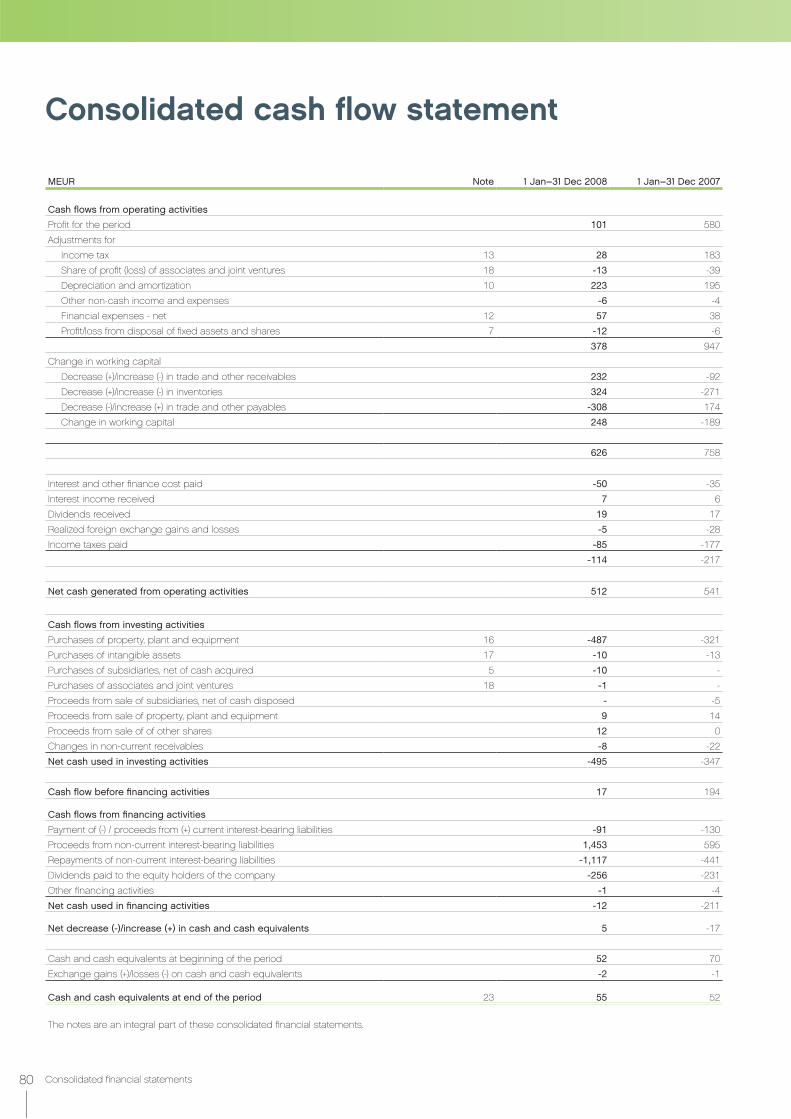
80 Consolidated financial statements
Consolidated cash flow statement
MEUR Note 1 Jan–31 Dec 2008 1 Jan–31 Dec 2007
Cash flows from operating activities
Profit for the period 101 580
Adjustments for
Income tax 13 28 183
Share of profit (loss) of associates and joint ventures 18 -13 -39
Depreciation and amortization 10 223 195
Other non-cash income and expenses -6 -4
Financial expenses - net 12 57 38
Profit/loss from disposal of fixed assets and shares 7 -12 -6
378 947
Change in working capital
Decrease (+)/increase (-) in trade and other receivables 232 -92
Decrease (+)/increase (-) in inventories 324 -271
Decrease (-)/increase (+) in trade and other payables -308 174
Change in working capital 248 -189
626 758
Interest and other finance cost paid -50 -35
Interest income received 7 6
Dividends received 19 17
Realized foreign exchange gains and losses -5 -28
Income taxes paid -85 -177
-114 -217
Net cash generated from operating activities 512 541
Cash flows from investing activities
Purchases of property, plant and equipment 16 -487 -321
Purchases of intangible assets 17 -10 -13
Purchases of subsidiaries, net of cash acquired 5 -10 -
Purchases of associates and joint ventures 18 -1 -
Proceeds from sale of subsidiaries, net of cash disposed - -5
Proceeds from sale of property, plant and equipment 9 14
Proceeds from sale of of other shares 12 0
Changes in non-current receivables -8 -22
Net cash used in investing activities -495 -347
Cash flow before financing activities 17 194
Cash flows from financing activities
Payment of (-) / proceeds from (+) current interest-bearing liabilities -91 -130
Proceeds from non-current interest-bearing liabilities 1,453 595
Repayments of non-current interest-bearing liabilities -1,117 -441
Dividends paid to the equity holders of the company -256 -231
Other financing activities -1 -4
Net cash used in financing activities -12 -211
Net decrease (-)/increase (+) in cash and cash equivalents 5 -17
Cash and cash equivalents at beginning of the period 52 70
Exchange gains (+)/losses (-) on cash and cash equivalents -2 -1
Cash and cash equivalents at end of the period 23 55 52
The notes are an integral part of these consolidated financial statements.

81Consolidated financial statements
Consolidated statement of changes in equity
Attributable to equity holders of the Company Minority Total
MEURShare
capitalReserve
fund
Fair value and other reserves
Translation differences
Retained earnings
interest equity
Note
Total equity at 1 January 2007 40 9 26 3 2,011 8 2,097
Dividend paid -231 -231
Treasury shares -12 -12
Income and expenses recognized directly in equity
Translation differences and other changes 1 -10 -3 -12
Cash flow hedges
recorded in equity, net of tax 56 56
transferred to income statement, net of tax -43 -43
Net investment hedges, net of tax -4 -4
Share-based compensation 2 2
Hedging reserves in associates and joint ventures 1 1
Change in minority -7 -7
Items recognized directly in equity - 1 16 -14 -3 -7 -7
Profit for the period 577 3 580
Total recognized income and expenses - 1 16 -14 574 -4 573
Total equity at 31 December 2007 25 40 10 42 -11 2,342 4 2,427
Total equity at 1 January 2008 40 10 42 -11 2,342 4 2,427
Dividend paid -256 -256
Income and expenses recognized directly in equity
Translation differences and other changes 0 -43 -1 -44
Cash flow hedges
recorded in equity, net of tax -23 -23
transferred to income statement, net of tax -25 -25
Net investment hedges, net of tax 0 0
Share-based compensation 0 0
Hedging reserves in associates and joint ventures -1 -1
Change in minority 0 0
Items recognized directly in equity - 0 -49 -43 -1 0 -93
Profit for the period 97 4 101
Total recognized income and expenses - 0 -49 -43 96 4 8
Total equity at 31 December 2008 25 40 10 -7 -54 2,182 8 2,179
The notes are an integral part of these consolidated financial statements.
Neste Oil 2008

82 Consolidated financial statements
1. General InformationNeste Oil Corporation (the Company) is a Finnish public limited liability company domiciled in Espoo, Finland. The Company is listed on the NASDAQ OMX Helsinki.
Neste Oil Corporation and its subsidiaries (together referred to as the Neste Oil Group) is a refining and marketing company focused on advanced, clean traffic fuels. The Group's refineries and other production facilities, together with its network of service stations and other retail outlets in Finland and the Baltic Rim area, supply both domestic and export markets with gasoline, diesel fuel, aviation fuel, marine fuel, heating oil, heavy fuel oil, base oil, lubricant, traffic fuel component, solvent, liquefied petroleum gas, bitumen and NExBTL renewable diesel based on Neste Oil's proprietary technology. Neste Oil's supply and distribution chain includes a tanker fleet for carrying crude oil and other feedstock imports and refined product exports. As an oil refiner, Neste Oil is a leading manufacturer of environmen-tally benign petroleum products.
The Board of Directors has approved these consolidated finan-cial statements for issue on 4 February 2009.
2. Summary of significant accounting policiesThese consolidated financial statements have been prepared in accordance with International Financial Reporting Standards (IFRS) as adopted by the EU. The consolidated financial statements have been prepared under the historic cost convention, as modified by the revaluation of financial assets and financial liabilities (including derivative financial instruments) at fair value through the income statement. The consolidated financial statements are presented in millions of euros unless otherwise stated.
The Group has adopted IFRS 8 Operating Segments as of 1 January 2008. The Group's reporting segments are the five busi-ness divisions Oil Refining, Renewable Fuels, Specialty Products, Oil Retail and Shipping as well as Other segment consisting of Group administration, shared service functions as well as Re-search and Technology and Neste Jacobs Group.
The following interpretations or amendments to existing stan-dards are mandatory for accounting periods beginning on or after 1 January 2008 but are not relevant to the Group's operations:
IFRIC 11 IFRS 2 - Group and Treasury SharesIFRIC 14 IAS 19 - The Limit on a Defined Benefit Asset, Minimum Funding Requirements and their InteractionAmendments to IAS 39 and IFRS 7: Reclassification of Financial Instruments.
The following amendments and interpretations to existing stan-dards have been published and are mandatory for the Group's accounting periods beginning on or after 1 January 2009:
IAS 1 Presentation of Financial Statements - Revised: The Group is investigating the impact of the revised standard on the pre-sentation of financial statements. The Group will apply the new standard from the financial period beginning 1 January 2009 onwards.IAS 23 Borrowing Costs - Revised: The Group does not expect to experience a major change in the amount of capitalized interest cost as a result of application of the revised standard. The Group will apply the new standard from the financial period beginning 1 January 2009 onwards.
Notes to the consolidated financial statements
Certain new interpretations or amendments to existing standard have been published and are mandatory for the Group's account-ing periods beginning on or after 1 January 2009. They are not expected to be relevant to the Group's operations:
IFRIC 13 Customer Loyalty Programs Amendment to IFRS 2 Share based payments: Vesting Condi-tions and CancellationsAnnual improvements.
Use of estimates The preparation of consolidated financial statements in conformity with IFRS requires management to make estimates and assump-tions that affect the reported amounts of assets and liabilities, the disclosure of contingent assets and liabilities at the dates of the consolidated financial statements, and the reported amounts of revenues and expenses during the reporting period. Such esti-mates include the expected useful lifetimes of tangible and intan-gible assets, the amount of income taxes recognized as expense and deferred tax assets or liabilities, actuarial assumptions applied in the calculation of defined benefit obligations, and assumptions made in the recognition of provisions or valuation of receivables. Actual results may differ from these estimates.
Consolidation Subsidiaries
The consolidated financial statements cover the parent company, Neste Oil Corporation, and all those companies in which Neste Oil Corporation has the power to govern financial and operating poli-cies and holds, directly or indirectly, more than 50% of voting rights. Subsidiaries are fully consolidated from the date on which control is transferred to the Group, and are no longer consolidated when that control ceases.
The Group uses the purchase method of accounting to account for the acquisition of subsidiaries. Identifiable assets acquired and liabilities and contingent liabilities assumed in a business combination are measured initially at their fair value at the date of acquisition, irrespective of the extent of any minority interest. The excess of the cost of acquisition over the fair value of the Group’s share of the identifiable net assets acquired is recorded as goodwill. If the cost of acquisition is less than the fair value of the net assets of the subsidiary acquired, the difference is recognized directly in the income statement.
Intercompany transactions, balances, and unrealized gains on transactions between Group companies are eliminated. Unrealized losses are also eliminated unless the transaction provides evi-dence of an impairment of the asset transferred. Where necessary, subsidiaries’ accounting policies have been modified to ensure consistency with Group policies.
Associates and joint ventures
Associated companies are entities over which the Group has significant influence but not control, and generally involve a share-holding of between 20% and 50% of voting rights. Joint ventures are entities over which the Group has contractually agreed to share the power to govern the financial and operating policies of that entity with another company or companies. The Group’s
Notes: 1 2 3 4 5 6 7 8 9 10 11 12 13 14 15 16 17
83Consolidated financial statements
interests in associates and joint ventures are accounted for by the equity method of accounting.
Identifiable assets acquired and liabilities and contingent liabili-ties assumed in the investment in associates and joint ventures are measured initially at their fair value at the date of acquisition. The excess of the cost of acquisition over the fair value of the Group’s share of the identifiable net assets acquired is recorded as goodwill. If the cost of acquisition is less than the fair value of the net assets of the joint venture acquired, the difference is rec-ognized directly in the income statement.
The Group’s share of the post-acquisition profits or losses after tax of its associates and joint ventures is recognized in the income statement, and its share of post-acquisition movements in reserves is recognized in reserves. The cumulative post-acquisition move-ments are adjusted against the carrying amount of the investment.
When the Group’s share of losses in an associate or joint ven-ture equals or exceeds its interest in the associate or joint venture, including any other unsecured receivables, the Group does not recognize further losses, unless it has incurred obligations or made payments on behalf of the associate or joint venture.
Unrealized gains on transactions between the Group and its associates or joint ventures are eliminated to the extent of the Group’s interest in the associates and joint ventures. Unrealized losses are also eliminated unless the transaction provides evi-dence of an impairment of the asset transferred.
Segment reporting The reportable segments of the Group are presented in line with the Company's internal organizational and reporting structure adopted as of 1 January 2008. These divisions also represent the reporting segments.
Non-current assets and disposal groups held for sale Non-current assets (or disposal groups) are classified as held for sale and stated at the lower of their carrying amount and fair value, less costs to sell, if their carrying amount is recovered principally through a sale transaction rather than through continuing use.
Foreign currency translation (a) Functional and presentation currency
Items included in the financial statements of each of the Group’s entities are measured using the currency of the primary economic environment in which the entity operates (‘the functional currency’) or the functional currency of the Group. The consolidated financial statements are presented in euros, which is the Company’s func-tional and presentation currency.
(b) Transactions and balances
Foreign currency transactions are translated into the functional currency using the exchange rates prevailing at the dates of the transactions. Foreign exchange gains and losses resulting from the settlement of such transactions, and from the translation of monetary assets and liabilities denominated in foreign curren-cies at year-end exchange rates, are recognized in the income statement, except when deferred in equity as qualifying cash flow hedges and qualifying net investment hedges.
(c) Group companies
The results and financial position of all Group entities (none of which uses a hyperinflationary economy currency) that have a functional currency different from the presentation currency are translated into the presentation currency as follows:
assets and liabilities are translated at the closing rate quoted on the relevant balance sheet date; income and expenses are translated at average exchange rates (unless this average is not a reasonable approximation of the cumulative effect of the rates prevailing on the transaction dates, in which case income and expenses are translated at the dates of the transactions);all resulting exchange differences are recognized as a separate component of equity.
On consolidation, exchange differences arising from the transla-tion of the net investment in foreign entities and currency instru-ments designated as hedges of such investments, are booked to shareholders’ equity. When a foreign operation is sold, exchange differences are recognized in the income statement as part of the gain or loss on the sale. Goodwill and fair value adjustments aris-ing on the acquisition of a foreign entity are treated as assets and liabilities of the entity in question and translated at the closing rate.
Revenue recognition Revenue from the sale of goods is recorded in the income state-ment when the significant risks and rewards related to the owner-ship of the goods have been transferred to the buyer. Revenue from services is recorded when services have been provided. Rev-enue is recorded for the exchange of goods only when dissimilar goods are exchanged.
Sales include sales revenues from actual operations and exchange rate differences on trade receivables, less discounts, indirect taxes such as value added tax and excise tax payable by the manufacturer, and statutory stockpiling fees. Where forward sale and purchase contracts for crude oil or oil products have been determined to be for trading purposes, the associated sales and purchases are reported net within sales whether or not physical delivery has occurred. Excise taxes included in the retail price of petroleum products according to prevailing legislation in some countries are included in product sales. The corresponding amount is included in the purchase price of petroleum products and included in 'Materials and services' in the income statement.
Government grantsGrants from the government are recognized at their fair value where there is a reasonable assurance that the grant will be re-ceived and that the Group will comply with all attached conditions. Government grants relating to costs are deferred and recognized in the income statement in 'Other income' over the period neces-sary to match them with the costs that they are intended to com-pensate. Government grants relating to the purchase of property, plant, and equipment are deducted from the acquisition cost of the asset and recognized as income by reducing the depreciation charge of the asset they relate to.
18 19 20 21 22 23 24 25 26 27 28 29 30 31 32 33 34 35
Note 2 continues
Neste Oil 2008

84 Consolidated financial statements
Borrowing costs Borrowing costs are recognized as expenses in the period in which they are incurred, except if they are directly attributable to the construction of an asset that meets the determined criteria, in which case they are capitalized as part of the cost of that asset. These criteria are that the borrowing costs incurred for the con-struction of a major initial investment, such as a new production facility or a new production line and that it will take more than 18 months to make the related asset operational.
Income taxes The Group's income tax expenses include taxes of Group com-panies calculated on the basis of the taxable profit for the period, with adjustments for previous periods, as well as the change in deferred income taxes. For items recognized directly in equity, the income tax effect is similarly recognized.
Deferred income taxes are stated using the balance sheet li-ability method, to reflect the net tax effect of temporary differences between the financial reporting and tax bases of assets and liabili-ties. The main temporary differences arise from the depreciation difference on property, plant and equipment, the fair valuation of derivative financial instruments, pension assets recognized in the balance sheet, provisions and tax losses carried forward. Deferred income tax assets are recognized to the extent that it is probable that future taxable profit will be available against which the tempo-rary differences can be utilized. Deferred income tax is determined using tax rates that are in force at the balance sheet date and are expected to apply when the related deferred income tax asset is realized or the deferred income tax liability is settled.
Research and developmentResearch expenditure is recognized as an expense as incurred and included in other operating expenses in the consolidated financial statements. Expenditure on development activities is capitalized only when it relates to new products that are technically and commercially feasible. The majority of the Group's develop-ment expenditure does not meet the criteria for capitalization and are recognized as expenses as incurred.
Property, plant and equipment Property, plant, and equipment mainly comprise oil refineries and other production plants and storage tanks, ships, and retail station network infrastructure and equipment. Property, plant, and equip-ment are stated at historical cost in the balance sheet, less depre-ciation and any accumulated impairment losses. Historical cost includes expenditure that is directly attributable to the acquisition of the items in question. Cost may also include transfers from equity of any gains/losses on qualifying cash flow hedges related to foreign currency purchases of property, plant, and equipment. Assets acquired through the acquisition of a new subsidiary are stated at their fair value at the date of acquisition.
Subsequent costs are included in the asset’s carrying amount or recognized as a separate asset, as appropriate, only when it is probable that future economic benefits associated with the item will flow to the Group and the cost of the item can be measured reliably. Costs for major periodic overhauls at oil refineries and
other production plants on a 3-5 year cycle are capitalized when they occur and then depreciated during the shutdown cycle, i.e. the time between shutdowns. The same principle is applied to the costs incurred for compulsory periodic docking of ships. All other repairs and maintenance are charged to the income statement during the financial period in which they are incurred.
Land areas are not depreciated. The bottom of crude oil rock inventory is included in other tangible assets and is depreciated ac-cording to possible usage of the crude oil. Depreciation on tangible assets is calculated using the straight-line method to allocate their cost to their residual values over their estimated useful lives, as follows:
Buildings and structures, including terminals 20–40 yearsProduction machinery and equipment 15–20 yearsMarine fleet 15–20 yearsRetail station network infrastructure and equipment 5–15 yearsOther equipment and vehicles 3–15 yearsOther tangible assets 20–40 years
The residual values and useful lives of assets are reviewed, and adjusted where appropriate, at each balance sheet date. The carrying amount of an asset is written down immediately to its recoverable amount if the former amount is greater than its estimated recoverable amount. Gains and losses on disposals are determined by compar-ing proceeds with carrying amounts. These are included in 'Other income' or 'Other expenses' in the consolidated income statement.
Intangible assets Intangible assets are stated at historical cost and amortized on a straight-line method over expected useful lives. Intangible assets comprise the following:
Computer software
Computer software licences are capitalized on the basis of the costs incurred to acquire and introduce the software in question. Costs are amortized over their estimated useful lives (three to five years). Costs associated with developing or maintaining computer software programs are recognized as an expense.
Trademarks and licences
Trademarks and licences have a definite useful life and are carried at cost less accumulated amortization. They are amortized over their estimated useful lives (three to ten years).
Goodwill
Goodwill represents the excess of the cost of an acquisition over the fair value of the Group’s share of the net identifiable assets of the acquired subsidiary, associate or joint venture at the date of acquisition. Goodwill on acquisition of subsidiaries is included in ‘intangible assets’. Goodwill on acquisitions of associates is included in ‘investments in associates’. Separately recognized goodwill is tested annually for impairment and carried at cost, less accumulated impairment losses. Impairment losses on goodwill are not reversed. Gains and losses on the disposal of an entity include the carrying amount of goodwill relating to the entity sold. Goodwill is allocated to cash-generating units for the purpose of
Notes: 1 2 3 4 5 6 7 8 9 10 11 12 13 14 15 16 17

85Consolidated financial statements
impairment testing, using those cash-generating units or groups of cash-generating units that are expected to benefit from the business combination in which the goodwill arose.
Emission allowances
Emission allowances purchased are accounted for as intangible assets and measured at cost, and emission allowances received free of charge are accounted for at nominal value, i.e. at zero. An impairment charge is recognized in the income statement if the fair value is lower than the carrying amount.
A provision is recognized to cover the obligation to return emis-sion allowances if emission allowances received free of charge do not cover actual emissions. The provision is measured at its probable settlement amount. The difference between emissions made and emission allowances received, as well as any change in the prob-able amount of the provision, are reflected in the operating profit..
Impairment of non-financial assets Assets that have an indefinite useful life are not subject to amortiza-tion and are tested annually for impairment. Assets that are subject to amortization are reviewed for impairment whenever events or changes in circumstances indicate that the carrying amount may not be recoverable. An impairment loss is recognized in the income statement to the extent that the asset’s carrying amount exceeds its recoverable amount. The recoverable amount is the higher of an asset’s fair value less costs to sell and value in use. Non-financial assets other than goodwill that suffered an impairment are reviewed for possible reversal of the impairment at each reporting date.
Financial assets The Group classifies financial assets in the following categories: financial assets at fair value through income statement, loans and receivables, and available-for-sale financial assets. The classifica-tion depends on the purpose for which the financial assets were acquired.
Purchases and sales of financial assets are recognized on the date on which the Group commits to purchase or sell the asset known as the trade date. Financial assets are initially recognized at fair value plus transaction costs for all financial assets not carried at fair value through income statement. Financial assets are derecognized when the rights to receive cash flows from the investments have expired or have been transferred and the Group has transferred substantially all risks and rewards of ownership.
Available-for-sale financial assets and financial assets at fair value through income statement are subsequently carried at fair value. Unlisted equity securities, for which fair value cannot be measured reliably, are recognized at cost less impairment. Loans and receivables are carried at amortized cost, using the effective interest method. Realized and unrealized gains and losses arising from changes in the fair value of assets in ‘financial assets at fair value through income statement’ category are included in the income statement in the period in which they arise. The Group assesses whether there is objective evidence that a financial asset or a group of financial assets is impaired at each balance sheet date.
Financial assets at fair value through income statement
The assets in this category are financial assets held for trading, and include derivative financial instruments, if they are held for trading or do not meet the criteria for hedge accounting as de-fined under IAS 39. Assets in this category are classified as current assets if they are held for trading or are expected to be realized within 12 months of the balance sheet date.
Loans and receivables
Loans and receivables are non-derivative financial assets with fixed or determinable payments that are not quoted in an active market. They are included in current assets, except for maturities greater than 12 months after the balance sheet date, which are classi-fied as non-current assets. Loans and receivables are included in 'Trade and other receivables' in the balance sheet.
Trade receivables are recognized initially at fair value and sub-sequently measured at amortized cost using the effective inter-est method, less provision for impairment. A provision for impair-ment of trade receivables is established when there is objective evidence that the Group will not be able to collect amounts due according to the original terms of the receivables. Significant finan-cial difficulties of the debtor, probability that the debtor will enter bankruptcy or financial reorganization, and default in payments are considered as indicators that a trade receivable is impaired. The amount of provision is the difference between the asset's carrying amount and the present value of estimated future cash flows, discounted the effective interest rate. The amount of the loss is recognized in the income statement within 'Other expenses'..
Available-for-sale financial assets
Available-for-sale financial assets are non-derivative financial assets that are either designated in this category or not classified in any other category. They are included in non-current assets unless man-agement intends to dispose of the asset within 12 months of the balance sheet date. Gains or losses on the sale of available-for-sale financial assets are included in 'Other income' or 'Other expenses'.
Leases Finance leases
Lease arrangements that transfer substantially all the risks and rewards related to a leased asset to the lessee are classified as finance lease. Finance leases are capitalized at the commence-ment of the lease term at the lower of the fair value of the leased property or the present value of the minimum lease payments, as determined at the inception of the lease. Lease payments are allocated between the liability and finance charges. The corre-sponding rental obligations, net of finance charges, are included in interest-bearing liabilities. The interest element of the finance cost is charged to the income statement over the lease period, so as to produce a constant periodic rate of interest on the remaining bal-ance of the liability for each period. Assets acquired under finance leases are depreciated over the useful life of the asset or the lease term, whichever is the shortest.
18 19 20 21 22 23 24 25 26 27 28 29 30 31 32 33 34 35
Note 2 continues
Neste Oil 2008

86 Consolidated financial statements
Operating leases
Leases in which a significant portion of the risks and rewards of ownership are retained by the lessor are classified as operating leases. Payments made under operating leases (net of any incen-tives received from the lessor) are charged to the income state-ment on a straight-line basis over the period of the lease.
Inventories Inventories are stated at either cost or net realizable value, whichever is the lowest. Cost is determined using the first-in, first-out (FIFO) method. The cost of finished goods and work in progress comprises raw materials, direct labor, other direct costs, and related production overheads (based on normal operating capacity). Net realizable value is the estimated selling price in the ordinary course of business, less applicable variable selling expenses. Inventories held for trading pur-poses are measured at fair value less selling expenses.
Cash and cash equivalents Cash and cash equivalents are carried in the balance sheet at cost. Cash and cash equivalents includes cash in hand, deposits held at call with banks, and other short-term, highly liquid invest-ments with original maturities of three months or less.
ProvisionsA provision is recognized in the balance sheet when the Group has a present legal or constructive obligation as a result of a past event, and it is probable that the obligation will result in payment, and the amount of payment can be estimated reliably. Provisions can arise from environmental risks, litigation, restructuring plans or onerous contracts. Environmental provisions are recorded based on current interpretations of environmental laws and regulations when the conditions referred to above are met.
Financial liabilities Financial liabilities are recognized initially as net proceeds less any transaction costs incurred, and subsequently at amortized cost. Any difference between net proceeds and redemption value is recognized as interest cost over the period of the borrowing, using the effective interest method. Bank overdrafts are shown in current liabilities on the balance sheet. Derivative financial instruments are categorized as held for trading and included in financial liabilities at fair value through income statement, unless they are designated as hedges as defined in IAS 39. Liabilities are included in non-cur-rent liabilities, except for items with maturities less than 12 months after the balance sheet date.
Employee benefitsPension obligations
Neste Oil has a number of pension plans in accordance with lo-cal practices in the countries where it operates. These plans are generally funded through the Group's pension funds or through insurance companies. The Group has both defined benefit and defined contribution plans.
The Group's contributions to defined contribution plans are charged to the income statement in the period when they fall due.
For defined benefit plans, pension costs are assessed using the projected unit credit method. The cost of providing pensions is charged to the income statement in order to spread the cost over the service lives of employees. The defined benefit obligation is measured as present value of the estimated future cash flows, us-ing interest rates of high-quality corporate bonds that have similar maturity terms to those of the related pension liability. The liability or asset recognized in the balance sheet is the defined benefit ob-ligation at the balance sheet date less the fair value of plan assets. Prepaid contributions are recognized as an asset to the extent that a cash refund or a reduction in the future payments is available.
Actuarial gains and losses exceeding 10% of total defined benefit obligations or the present value of plan assets, whichever is higher, are recorded in the income statement over the expected average remaining working lives of employees. Past-service costs are recognized immediately in the income statement. The interest cost is included in employee benefit expenses.
Share-based paymentsExpenses related to share-based payments are recorded in the income statement and a respective liability is recognized in the balance sheet for share-based payments settled in cash. The li-ability recognized in the balance sheet is measured at fair value at each reporting date. For transactions settled in equity, an increase corresponding to the expense in the income statement is entered in shareholders' equity.
Derivative financial instruments and hedging activitiesDerivative financial instruments are initially recognized at fair value on the date a contract is entered into and are subsequently re-measured at their fair value. The method of recognizing any resulting gain or loss depends on whether the derivative financial instrument is designated as a hedging instrument, and if so, the nature of the item being hedged. The Group designates certain derivative financial instruments as either: (1) hedges of highly prob-able forecast transactions (cash flow hedges); (2) hedges of the fair value of recognized assets or liabilities or a firm commitment (fair value hedge); or (3) hedges of net investments in foreign opera-tions. The Group documents at the inception of the transaction the relationship between hedging instruments and hedged items, as well as its risk management objective and strategy for undertak-ing various hedge transactions. The Group also documents its assessment, both at hedge inception and on an ongoing basis, of whether the derivatives that are used in hedging transactions are highly effective in offsetting changes in fair values or cash flows of hedged items. Hedge accounting for each type of hedge is described in more detail in Note 3.
The effective portion of changes in the fair value of derivative financial instruments that are designated and qualify as cash flow hedges are recognized in equity. Any gain or loss relating to the ineffective portion is recognized immediately in the income state-ment. Amounts accumulated in equity are recycled in the income statement in the periods when the hedged item affects the income statement, e.g. for example when a forecasted sale, that is being hedged, takes place. The gain or loss relating to the effective portion of the foreign exchange derivative contracts hedging of the future
Notes: 1 2 3 4 5 6 7 8 9 10 11 12 13 14 15 16 17
87Consolidated financial statements
USD-sales are recorded within sales. When the forecast transaction that is being hedged results in the recognition of a non-financial asset, for example property, plant and equipment, the gain or loss is included in the cost of the asset. The amounts are ultimately recog-nized in depreciation in the income statement. Interest element of interest rate swaps hedging variable rate interest-bearing liabilities is recognized in the income statement within 'financial expenses', and the change in fair value of the hedging instrument is accumu-lated in equity. When a forecast transaction is no longer expected to occur, the cumulative gain or loss that was reported in equity is immediately transferred to the income statement.
Changes in the fair value of derivative financial instruments that are designated and qualify as fair value hedges are recorded in the income statement in 'financial income and expenses', together with any changes in the fair value of the hedged asset or liability that are attributable to the hedged risk. If derivative financial instru-ments do not qualify for hedge accounting, any movement in fair value is recognized in the income statement.
Derivative financial instruments that do not qualify for hedge accounting
Some oil and freight derivative contracts do not qualify for hedge accounting, although these instruments are largely held for eco-nomic hedging purposes. Oil and freight derivative contracts are also held for trading purposes. Certain currency and interest rate derivative contracts also do not qualify for hedge accounting. For derivative financial instruments that do not qualify for hedge ac-counting, any movement in fair value is recognized in the income statement in operating profit for oil and freight derivative contracts and in 'financial income and expenses' concerning derivative financial instruments related to financing activities.
DefinitionsOperating profit
Operating profit includes the revenue from the sale of goods and services, other income such as gains on sale of shares or non-financial assets, less losses from the sale of shares or non-financial assets, as well as expenses related to production, marketing, and selling activities, administration, depreciation, amortization, and im-pairment charges. Realized and unrealized gains or losses on oil and freight derivative contracts together with realized gains and losses from foreign currency and oil derivative contracts hedging cash flows of commercial sales and purchases that have been recycled in the income statement, are also included in the operating profit.
Comparable operating profit
Comparable operating profit is calculated by excluding inventory gains/losses, gains/losses from sale of shares and non-financial assets, and unrealized changes in the fair value of oil and freight derivative contracts from the reported operating profit.
Segment net assets
Segment net assets include property, plant and equipment, intan-gible assets, investment in associates and joint ventures, pension as-sets, inventories and interest-free receivables and liabilities allocated to the business segment as well as provisions and pension liabilities.
Return on net assets, %
Return on net assets is calculated by dividing segment operating profit with average segment net assets.
Comparable return on net assets, %
Comparable return on net assets is calculated by dividing seg-ment comparable operating profit with average segment net assets.
18 19 20 21 22 23 24 25 26 27 28 29 30 31 32 33 34 35
3. Financial risk management
Risk management principlesA number of risk management strategies have been developed to address the impact of the risks related to Neste Oil's business activities. The Neste Oil Corporate Risk Management Policy, the updated umbrella policy document, with the related Corporate Risk Management Principles, approved by the Board of Directors, defines risk management principles for the risks threatening the strategic and operational targets of the Group and its divisions and functions. The policy and the principles also define risk man-agement structures, processes, and terminology for communicat-ing and reporting risks and risk management.
The documents define detailed principles covering the man-agement of corporate and divisional strategic risks, market risks, including counterparty risks, operational risks, including risks involving human safety, and legal liabilities. The Corporate Risk Management Policy and Principles complement Neste Oil's other risk management principles and instructions. The Treasury Risk Management Policy and the Credit and Counterparty Risk Man-agement Principles are also approved by the Board of Directors. Operational divisions, together with corporate and other functions, have their own principles and procedures related to risk manage-ment, approved by the President & Chief Executive Officer. The Board of Directors' Audit Committee regularly reviews and monitors financial risk management principles, policies, risk limits, and other risk management activities.
The management of financially related risks aims to reduce the volatility in earnings, the balance sheet, and cash flow, while secur-ing effective and competitive financing for the Group.
Risk management organizationRisks are generally managed at source, within the Group's divi-sions. Corporate Risk Management is responsible for managing and coordinating the enterprise risk management process.
Neste Oil's Group Treasury is responsible for managing foreign exchange, interest rate, liquidity, and refinancing risks, and works in close cooperation with the Group's divisions. Group Treasury and Corporate Risk Management units are organized within Neste Oil's Finance function, headed by the Chief Financial Officer.
Credit and counterparty risk management is organized within Corporate Risk Management. Decisions on the creditworthiness of counterparties are taken at the relevant levels of the line organization, as well as the Credit Committee, which consists of divisional repre-sentatives, and Group Treasury and Corporate Risk Management.
Note 3 continues
Neste Oil 2008

88 Consolidated financial statements
and refined petroleum products in any given period, the business will remain exposed to some degree of basis risk.
From a risk management perspective, Neste Oil’s refinery inven-tory consists of two components. The first and largest component remains relatively constant over time, at approximately 70-80% of total inventory volumes, and is referred to as the 'base' inven-tory. This consists of the minimum level of stocks that Neste Oil is required to maintain under Finnish laws and regulations, plus the operational minimum level of supplies without which its refineries cannot be reasonably assured of remaining in operation. Base inventory creates a risk in Neste Oil’s income statement and bal-ance sheet inasmuch as Neste Oil applies the FIFO method for measuring the cost of goods sold, raw materials, and inventories. Hedging operations related to price risk do not target the base inventory. Instead, Neste Oil’s inventory risk management policies target inventories in excess of the 'base inventory' inasmuch as these stocks create cash flow risks depending on the relation-ships between feedstock purchases, refinery production, and refined petroleum product sales over any given period.
The amount of inventories in excess of base inventory that Neste Oil will seek to hedge at any given time depends on management’s view as to the likely magnitude and duration of the excess inventory over base levels and general market conditions. In practice, how-ever, the entire excess inventory position is typically hedged.
Note 24 summarizes the exposure to open positions of oil de-rivative contracts as of 31 December 2008 (2007).
2. Foreign exchange risk
As the pricing currency used in the oil industry is the U.S. dollar and Neste Oil reports in euro, this factor, among others, exposes Neste Oil's business to short-term transaction and longer-term economic currency risks.
The objective of foreign exchange risk management in Neste Oil is to limit the uncertainty created by changes in foreign exchange rates on the future value of cash flows and earnings, and in the Group's balance sheet. Generally, this is done by hedging currency risks in contracted and forecasted cash flows and balance sheet exposures (referred to as transaction exposure) as well as the equity of non-euro zone subsidiaries (referred to as translation exposure).
Transaction exposure
In general, all divisions hedge their transaction exposure related to highly probable future cash flows. Net foreign currency cash flows are forecasted over a maximum of 12-month period on a rolling basis depending on the hedged item, and hedged 100% for the first six months and 50% for the following six months. Deviations from this risk-neutral benchmark position are subject to separate approvals set by the Group Treasury Risk Policy. The most impor-tant hedged currency is the U.S. dollar. The Group's net exposure is managed through the use of forward contracts, swaps, and options. All transactions are made for hedging purposes and the majority are also hedge accounted for. Divisions are responsible for forecasting net foreign currency cash flows, while Group Trea-sury is responsible for implementing hedging transactions.
Neste Oil has several currency-denominated assets and liabili-ties in its balance sheet, such as foreign currency loans, deposits,
Notes: 1 2 3 4 5 6 7 8 9 10 11 12 13 14 15 16 17
Oil price risk management is organized in Oil Refining division's Risk Management unit, which manages hedging for the Group's refining margin, refinery inventory price risk, and various position transactions, including managing the price risk associated with the obligation to return emission allowances. The Risk Manage-ment unit also provides oil price hedging services to internal and external counterparties. Oil Refining's Supply, Sales and Trading unit, and other divisions to a smaller degree, enter into derivative contracts to limit the price risk associated with certain physical oil and freight contracts. Oil Refining's Supply, Sales and Trading unit together with the Shipping division enters into derivative transac-tions for trading purposes within consolidated risk limits.
Risk management processCorporate Risk Management drives the risk management process and develops and reviews risk control processes. Divisional risk management supports the Group's businesses in managing the threats and opportunities linked to day-to-day business; and participates in corporate-level risk management identification and assessment, as well as management and control.
Neste Oil's risk management reporting is coordinated by the Chief Financial Officer. Major Group-level risks and risk manage-ment capability levels are reported to the Board of Directors, the Audit Committee, the President & Chief Executive Officer, and other corporate management two times a year. A report on the market and financing risks of divisions and the Group is included in the monthly management report.
Market risks1. Oil price risk
The market prices for crude oil and other feedstock, as well as refined petroleum products, are subject to significant fluctuations resulting from a variety of factors affecting demand and sup-ply globally. Neste Oil's results of operations in any given period are principally driven by the demand for and prices of refined petroleum products relative to the supply and cost of crude and other feedstock. These factors, combined with Neste Oil's own consumption of crude oil and other feedstock and output of refined products, drive operational performance and cash flows in Oil Refining, which is Neste Oil's largest business division in terms of sales, profits, and net assets.
As the total refining margin is an important determinant of Oil Refining earnings, its fluctuations constitute a significant risk. With the aim of securing a minimum margin per barrel, Neste Oil hedges its refining margin using derivative financial instruments. The level of hedging depends on the forecast for the period in question and management’s view of market conditions. The nor-mal convention, however, is that up to 10% of the total refining mar-gin of Neste Oil’s refinery output volume over each rolling 12-month period will be hedged. Hedging transactions are targeted at the components of Neste Oil’s total refining margin, based on its forecasted sales and refinery production, that are exposed to international market price fluctuations. Because of the differences between the qualities of the underlying crude oil and refined pe-troleum products for which derivative financial instruments can be sold and purchased and the actual quality of Neste Oil’s feedstock

89Consolidated financial statements
net working capital, and cash in other currencies than home cur-rency. The principle is to hedge this balance sheet exposure fully using forward contracts and options. Open exposures are allowed based on risk limits set by the Group Treasury Risk Policy. The larg-est and most volatile item in terms of balance sheet exposure is net working capital. Since many of the Group's business transac-tions, sales of products and services, and purchases of crude oil and other feedstock are linked to the U.S. dollar environment, the daily exposure of net working capital is hedged as part of the balance sheet hedge in order to neutralize the effect of volatility in EUR/USD exchange rate. During 2008, the range of daily balance sheet exposure fluctuated between approximately EUR 185 million and 861 million. Group Treasury is responsible for consolidating various balance sheet items and carrying out hedging transac-tions. Foreign exchange risk is estimated by measuring the impact of currency rate changes based on historical volatility.
The table below shows the nominal values of the Group's interest-bearing debt by currency as of 31 December, in millions of euros.
Currency 2008 2007
EUR 974 715
USD 72 76
Other 13 16
1,059 807
Note 24 summarizes the nominal and fair values of outstanding for-eign exchange derivative contracts as of 31 December 2008 (2007).
Translation exposure
Group Treasury is responsible for managing Neste Oil's translation exposure. This consists of net investments in foreign subsidiar-ies, joint ventures, and associated companies. Although the main principle is to leave translation exposure unhedged, Neste Oil may seek to reduce the volatility in equity in the consolidated balance sheet through hedging transactions. Forward contracts are used to hedge translation exposure. Any hedging decisions are made on a case-by-case basis by Group Treasury, based on an assess-ment of various factors, including hedging costs and prevailing market conditions. The total non-euro-denominated equity of the Group's subsidiaries and associated companies was EUR 424 million as of 31 December 2008 (2007: EUR 401 million), and the exposures and hedging ratios are summarized in the following table. As at 31 December 2008 or 2007 the Group had not hedged the translation exposure.
3. Interest rate risk
Neste Oil is exposed to interest rate risk mainly through its interest-bearing net debt. The objective of the Company's interest rate risk management is to reduce the volatility of interest expenses in the income statement. The risk-neutral benchmark duration for the debt portfolio is 12 months, and duration can vary between six and 36 months. Interest rate derivatives have been used to adjust the duration of the net debt portfolio. The Group's interest rate risk management is handled by Group Treasury. Note 24 summarizes the nominal and fair values of outstanding interest rate derivative contracts as of 31 December 2008 (2007).
The following table summarizes the re-pricing of the Group’s interest-bearing debt.
Group translation exposure
2008 2007
EUR millionInvest-
ment Hedge Hedge %Invest-
ment Hedge Hedge %
USD 57 - 0% 37 - 0%
SEK 125 - 0% 124 - 0%
CAD 70 - 0% 73 - 0%
PLN 16 - 0% 20 - 0%
RUB 62 - 0% 56 - 0%
EEK 46 - 0% 40 - 0%
LTL 29 - 0% 26 - 0%
Other 19 - 0% 25 - 0%
424 - 0% 401 - 0%
18 19 20 21 22 23 24 25 26 27 28 29 30 31 32 33 34 35
within 1 year
1 year - 5 years Total Period in which repricing occurs
Financial instruments with floating interest rate
Financial liabilities
Bonds 80 80
Loans from financial institutions 756 756
Pension loans 20 20
Finance lease liabilities 83 83
Effect of interest rate swaps -355 355 0
Financial instruments with fixed interest rate
Bonds 120 120
Total 584 475 1,059
Note 3 continues
Neste Oil 2008

90 Consolidated financial statements
the sensitivity related to oil derivative contracts held for hedging expected future refining margin is included; the underlying ex-pected refining margin position is excluded from the calculation the sensitivity related to oil derivative contracts for the price diffe-rence between various petroleum product qualities is excluded from the calculation, as the price variation of these contracts is assumed to be zerothe sensitivity related to oil derivative contracts for the time spread of crude oil and petroleum products is excluded from the calculation, as the price variation of these contracts is assumed to be zero.The following assumptions were made when calculating the
sensitivity to changes in the EUR/USD exchange rate:the variation in EUR/USD-rate is assumed to be +/- 10%the position includes USD-denominated financial assets and liabilities, such as interest-bearing liabilities, deposits, trade and other receivables, liabilities, and cash and cash equivalents, as well as derivative financial instrumentsthe position excludes USD-denominated future cash flows.The following assumptions were applied when calculating the
sensitivity to changes in interest rates:the variation of interest rate is assumed to be a 1% parallel shift in the interest rate curvethe interest rate risk position includes interest-bearing liabilities, interest-bearing receivables, and interest rate swapsthe income statement is affected by changes in the interest ra-tes of floating-rate financial instruments, excluding those deriva-tive financial instruments that are designated as and qualifying for cash flow hedges, which are recorded directly in equity. The sensitivity analysis presented in the following table may not
be representative, since the Group's exposure to market risks also arises from other balance sheet items than financial instruments, such as inventories. As the sensitivity analysis does not take into account future cash flows, which the Group hedges in significant volumes, it only reflects the change in fair value of hedging instru-ments. In addition, the size of the exposure sensitive to changes in the EUR/USD exchange rate varies significantly, so the position on the balance sheet date may not be representative for the financial period on average. Equity in the following table includes items recorded directly in equity. Items affecting the income statement are not included in equity.
4. Key sensitivities to market risks
Sensitivity of operating profit to market risks arising from
the Group's operations
Due to the nature of its operations, the Group's financial per-formance is sensitive to the market risks described above. The following table details the approximate impact that movements in the Group's key price and currency exposures would have on its operating profit for 2009 (2008), based on assumptions regard-ing the Group's reference market and operating conditions, but excluding the impact of hedge transactions.
Approximate impact on operating profit, excluding hedges
2009 2008
10% in the EUR/USD exchange rate EUR million +/- 100–120 +/- 100–125
USD 1.00/barrel in total refining margin USD million +/- 110 +/- 110
USD 1.00/barrel in crude oil price USD million +/- 10 +/- 10
Sensitivity to market risks arising from financial instruments as required by IFRS 7
2008 2007
Income statement Equity
Income statement Equity
+/- 10% change in oil price EUR million -/+ 11 0 -/+ 11 0
+/- 10% change in EUR/USD exchange rate EUR million +20 / -17 +43 / -54 +41 / -50 +55 / -51
1% parallel shift in interest rates EUR million +/- 4 +/- 4 +/- 3 +/- 3
Notes: 1 2 3 4 5 6 7 8 9 10 11 12 13 14 15 16 17
Sensitivity to market risks arising from financial instruments
as required by IFRS 7
The following analysis, required by IFRS 7, is intended to illustrate the sensitivity of the Group's profit for the period and equity to changes in oil prices, the EUR/USD exchange rate, and interest rates, resulting from financial instruments, such as financial assets and liabilities and derivative financial instruments, as defined by IFRS, included in the balance sheet as of 31 December 2008 (2007). Financial instruments affected by the above market risks include working capital items, such as trade and other receivables and trade and other payables, interest-bearing liabilities, deposits, cash and cash equivalents, and derivative financial instruments. When cash flow hedge accounting is applied, the change in the fair value of derivative financial instruments is assumed to be recorded fully in equity.
The following assumptions were made when calculating the sensitivity to the change in oil prices:
the flat price variation for oil derivative contracts of crude oil and refined oil products is assumed to be +/- 10% the sensitivity related to oil derivative contracts held for hedging refinery oil inventory position is included; the underlying physi-cal oil inventory position is excluded from the calculation, since inventory is not a financial instrument

91Consolidated financial statements
Fair value hedges
Certain interest rate swaps are designated as fair value hedges. Changes in the fair value of the derivative financial instruments designated and qualifying as fair value hedges, and which are highly effective, are recorded in the income statement, together with any changes in the fair value of the hedged assets or liabilities attributable to the hedged risk. The ineffective portion is also rec-ognized in the income statement.
Hedges of net investments in foreign entities
Hedges of the net investments in foreign operations are ac-counted for in a similar way to cash flow hedges. Any gain or loss on the hedging instrument relating to the effective portion of the hedge is recognized in equity, while any gain or loss relating to the ineffective portion is recognized immediately in the income state-ment. Gains and losses accumulated in equity are included in the income statement when the foreign operation is disposed of.
Liquidity and refinancing risksLiquidity and refinancing risk is defined as the amount by which earnings and/or cash flows are affected as a result of the Group not being able to secure sufficient financing. Neste Oil's princi-pal source of liquidity is expected to be cash generated from operations. In addition, the Group seeks to reduce liquidity and refinancing risks by maintaining a diversified maturity profile in its loan portfolio. Certain other limits have also been set to minimize liquidity and refinancing risks. The Group must always have access to unutilized, committed credit facilities to cover all loans maturing within the next 12 months and any potential forecasted negative cash flows after investment activities. Unutilized committed credit facilities must always amount to at least EUR 500 million. In addi-tion, total short-term financing shall not account for more than 30% of the total interest-bearing liabilities.
The average loan maturity as of 31 December was 4.4 years. The most important financing programs in place are:
Revolving multicurrency credit facility (committed), EUR 1,500 millionOverdraft facilities (committed), EUR 150 millionRevolving credit facility (committed), EUR 75 millionDomestic commercial paper program (uncommitted), EUR 400 million.
As of 31 December 2008, the Company had cash and cash equiva-lents and committed, unutilized credit facilities totaling EUR 1,536 million at its disposal.
5. Hedge accounting
The Group uses foreign currency derivative contracts to reduce the uncertainty created by changes in foreign exchange rates on the future cash flows of forecasted future sales and earnings, as well as in Neste Oil's balance sheet. Foreign exchange derivative contracts have been designated as hedges of forecasted transac-tions, e.g. cash flow hedges, net investment hedges, or as deriva-tive financial instruments not meeting hedge accounting criteria. The Group uses foreign exchange forward contracts and options as hedging instruments.
With the aim of securing a minimum refining margin per barrel, the Group hedges its refining margin using oil commodity deriva-tive contracts. Certain oil commodity derivative contracts have been designated as hedges of forecasted transactions, e.g. cash flow hedges. The Group uses oil commodity forward contracts for hedging purposes.
The Group uses interest rate derivatives to reduce the volatility of interest expenses in the income statement and by adjusting the duration of the debt portfolio. Interest rate derivative contracts have been designated as hedges of forecasted transactions, e.g. cash flow hedges, hedges of the fair value of recognized assets or liabilities, or as derivative financial instruments not meeting hedge accounting criteria. The Group uses interest rate swaps as hedg-ing instruments.
Cash flow hedges
Derivative financial contracts that meet the qualifications for hedge accounting are designated as cash flow hedges. Such contracts are foreign currency derivatives contracts hedging USD-sales or capital expenditure denominated in foreign currencies for the next twelve months, oil commodity derivative contracts hedging the refining margin for the next twelve months, and interest rate swaps directly linked to underlying funding transactions maturing 2012.
The effective portion of the changes in the fair value of the derivative financial instruments that are designated as and qualify for cash flow hedges are recognized in equity. Any gain or loss relating to the ineffective portion is recognized immediately in the income statement. In 2008 and 2007 the ineffective portion has been immaterial. Back testing is conducted on a quarterly basis to review the effectiveness of hedging transactions.
Amounts accumulated in equity are recycled in the income statement in the periods when the hedged item affects the income statement, e.g. for example when a forecasted sale, that is being hedged, takes place. The gain or loss relating to the effec-tive portion of the foreign exchange derivative contracts hedging of the future USD-sales are recorded within sales. This is expected to take place within the next 12 months from the balance sheet date. When the forecast transaction that is being hedged results in the recognition of a non-financial asset, for example property, plant and equipment, the gain or loss is included in the cost of the as-set. The amounts are ultimately recognized in depreciation in the income statement. Interest element of interest rate swaps hedging variable rate interest-bearing liabilities is recognized in the income statement within finance costs, and the change in fair value of the hedging instrument is accumulated in equity. Movements in hedg-ing reserve are presented in the statement of changes in equity.
Items recognized in the income statement
2008 2007
- gain or loss on the hedging instrument 4 1
- gain or loss on the hedged item -4 0
18 19 20 21 22 23 24 25 26 27 28 29 30 31 32 33 34 35
Note 3 continues
Neste Oil 2008

92 Consolidated financial statements
Cash and cash equivalents and committed unutilized credit facilities
2008 2007
Floating rate
– cash and cash equivalents 55 52
– overdraft facilities, expiring within one year 146 60
– revolving credit facilities, expiring beyond one year 1,335 1,380
1,536 1,492
As of 31 December 2008, the contractual maturity of interest-bearing liabilities was as follows:
2009 1) 2010 2011 2012 2013 2014- Total
Bonds and debentures 86 4 4 124 - - 218
- less finance charges 6 4 4 4 - - 18
Repayment of bonds and debentures 80 - - 120 - - 200
Loans from financial institutions 87 37 41 275 227 259 926
- less finance charges 39 33 33 27 19 17 168
Repayment of loans from financial institutions 48 4 8 248 208 242 758
Pension loans 1 1 1 1 1 21 26
- less finance charges 2) 1 1 1 1 1 1 6
Repayment of pension loans - - - - - 20 20
Finance lease liabilities 9 9 7 8 39 28 100
- less finance charges 4 3 3 3 3 1 17
Repayment of finance lease liabilities 5 6 4 5 36 27 83
Interest rate swaps
- less finance charges -4 0 -1 -2 -1 - -8
1) Repayments in 2009 are included in current liabilities in the balance sheet.2) While pension loan is a perpetual loan, finance charges in 2014 include payment only from one year.
Finance charges are primarily interest expenses. The contractual maturities of derivative financial instruments are included in Note 24.
Notes: 1 2 3 4 5 6 7 8 9 10 11 12 13 14 15 16 17

93Consolidated financial statements
As of 31 December 2007, the contractual maturity of interest-bearing liabilities was as follows:
2008 1) 2009 2010 2011 2012 2013- Total
Bonds and debentures 8 86 4 4 124 - 226
- less finance charges 8 6 4 4 4 - 26
Repayment of bonds and debentures - 80 - - 120 - 200
Loans from financial institutions 157 17 17 17 132 255 595
- less finance charges 18 17 17 17 12 25 106
Repayment of loans from financial institutions 139 - - - 120 230 489
Pension loans 2 2 2 2 2 40 50
- less finance charges 2) 2 2 2 2 2 2 12
Repayment of pension loans - - - - - 38 38
Finance lease liabilities 10 10 9 8 8 64 109
- less finance charges 5 5 4 4 4 4 26
Repayment of finance lease liabilities 5 5 5 4 4 60 83
Other liabilities 1 - - - - - 1
- less finance charges 0 - - - - - 0
Repayment of other long-term liabilities 1 - - - - - 1
Interest rate swaps
- less finance charges -2 -2 2 1 -1 - -2
1) Repayments in 2008 are included in current liabilities in the balance sheet.2) While pension loan is a perpetual loan, finance charges in 2013 include payment only from one year.
Credit and counterparty riskCredit and counterparty risk arises from sales, hedging and trad-ing transactions as well as from cash investments. The risk arises from the potential failure of a counterparty to meet its contractual payment obligations, and the risk depends on the creditworthi-ness of the counterparty as well as the amount of the exposure. The objective of credit and counterparty risk management is to minimize the losses incurred as a result of a counterparty not fulfilling its obligations. The management principles for credit and counterparty risk are covered in the Neste Oil Credit and Coun-terparty Risk Management Principles approved by the Board of Directors, and risk management is implemented through authority mandates across the organization.
The amount of risk is quantified as the expected loss to Neste Oil in the event of a default by a counterparty. Credit risk limits are set at the Group level, designated by different levels of authoriza-tion and delegated to Neste Oil's divisions. The latter are respon-sible for counterparty risk management within these limits. When determining the credit lines for sales contracts for oil deliveries, counterparties are screened and evaluated vis-à-vis their credit-worthiness to decide whether an open credit line is acceptable or a collateral or other credit enhancements such as letter of credit, bank guarantee or parent company guarantee have to be posted. In the event that a collateral is required, the credit risk is evaluated
based on a financial evaluation of the party posting the collateral. If appropriate in terms of the potential credit risk associated with a specific customer, advance payment is required before delivery of products or services.
The credit lines for counterparties are divided into two cat-egories according to contract type: physical sales contracts and derivative contracts. Credit lines are restricted in terms of the time horizon associated with the payment and credit exposure risk. In determining counterparty credit limits, two levels of delegation are used: authority mandates to the rated counterparties by the general rating agencies and authority mandates related to other counterparties. For OTC (over-the-counter) derivative financial instrument contracts, Neste Oil has negotiated a framework agreement in the form of an ISDA (International Swaps and Deriva-tives Association, Inc.) agreement with the main counterparties concerning oil commodity, currency and interest rate derivative financial instruments. These contracts permit netting and allow for termination of the contract on the occurrence of certain events of defaults. Some of these agreements concerning commodity derivatives include Credit Support Annexes with the aim of reduc-ing credit and counterparty risk by requiring margin call deposits in the form of cash or letter of credit for balances exceeding the mutually agreed limit.
18 19 20 21 22 23 24 25 26 27 28 29 30 31 32 33 34 35
Note 3 continues
Neste Oil 2008

94 Consolidated financial statements
Analysis of trade receivables by age
2008 2007
Undue trade receivables 529 781
Trade receivables 1–30 days overdue 34 40
Trade receivables 31–60 days overdue 2 1
Trade receivables more than 60 days overdue 9 11
574 833
2008 2007
Total interest-bearing liabilities 1,059 807
Cash and cash equivalents 55 52
Interest-bearing net debt 1,004 755
Total equity 2,179 2,427
Interest-bearing net debt and total equity 3,183 3,182
Leverage ratio 31.5% 23.7%
Group Treasury reduces credit risk by executing transactions only with counterparties with approved counterparty risk limits. All counterparties are rated with the minimum counterparty credit rating requirement being BBB (S&P). Foreign subsidiaries may have bank accounts in unrated financial institutions. In order to decrease credit risk associated with local banks used by subsidiaries in for-eign countries, the subsidiaries are required to deposit their excess cash balances with the Group Treasury on an ongoing basis.
As to counterparty risk management vis-à-vis insurance com-panies for Neste Oil Group, the minimum credit rating requirement for the insurers and/or reinsurers is A- (S&P).
As of the balance sheet date, there was no major concentration of credit risk in respect of trade receivables from any single coun-terparty or counterparties within a same group, as the Group has a large number of different customers and counterparties on inter-national markets. As to the range of the counterparties, the most significant types are mainly large international oil companies and financial institutions. However, the Group's exposure to unexpected credit losses within one reporting segment may increase with the concentration of credit risk through a number of counterparties operating in the same industry sector or geographical area, which may be adversely affected by changes in economic, political or other conditions. Also, balances due from a single counterparty with open credit line may amount to EUR 10 million due to the nature of the business, where cargoes including large volumes of refined oil products, for example 35,000 tons, are sold as one trans-action. For this example, oil product price is based on a crude oil price of USD 40/barrel representing the price level prevailing at the turn of the financial period 2008/2009.
In order to further reduce credit and counterparty risk, the Group has intensified the application of the Credit and Counterparty Risk Management Principles during the financial period 2008. The Group has for example enhanced the ongoing screening of open credit lines and assessed the impact of the financial market conditions to the Group's counterparties with regard to the associated credit risk by taking into account all available information about counterparties, their financial situation and business activities.
Vis-à-vis counterparties to the contracts comprising the deriva-tive financial instruments receivables exposure as at 31 December 2008, 58% of the counterparties or their parent companies related to commodity derivative contracts have investment grade rating from Standard & Poor's, Moody's or Fitch. Respectively, Group Treasury had an exposure for currency and interest rate derivative contracts with banks, of which all have investment grade rating.
The following table shows an analysis of trade receivables by age. 39% of the trade receivables portfolio exposure are from counterparties having investment grade rating. Of the exposure from the counterparties not having credit rating, 64% consists of trade receivables from a large number of retail corporate and private customers. With respect to undue trade receivables, there were no indications as of 31 December 2008 that the counterpar-ties would not meet their obligations.
Notes: 1 2 3 4 5 6 7 8 9 10 11 12 13 14 15 16 17
Capital risk managementThe Group's objective when managing capital is to secure an efficient capital structure that gives the Group access to capital markets at all times despite the volatile nature of the industry in which Neste Oil operates. Despite the fact that the Group does not have a public rating, the Group's target is to have a capital structure equivalent to that of other oil refining companies with a public investment grade rating. The capital structure of the Group is reviewed by the Board of Directors on a regular basis.
The Group monitors its capital on the basis of leverage ratio, the ratio of interest-bearing net debt to interest-bearing net debt plus total equity. Interest-bearing net debt is calculated as interest-bearing liabilities less cash and cash equivalents.
Over the cycle, the Group's leverage ratio is likely to fluctuate, and it is the Group's objective to maintain the leverage ratio within the range of 25-50%. The leverage ratio as of 31 December 2008 and 2007 was as follows:

95Consolidated financial statements
4. Segment information
Operating segmentsNeste Oil's reportable segments are the five business divisions Oil Refining, Renewable Fuels, Specialty Products, Oil Retail, Shipping as well as Other segment. The segments produce and sell differ-ent products and services for different customer groups using different delivery chanels.
Oil Refining produces and sells gasoline, diesel fuel, light and heavy fuel oil, aviation fuel, and liquefied petroleum gas to do-mestic and international wholesale markets. Renewable Fuels segment produces and sells NExBTL rene-wable diesel based on Neste Oil's proprietary technology to domestic and international wholesale markets.Specialty Products produces and sells base oils and gasoline components.Oil Retail segment markets and sells petroleum products and associated services directly to end-users, of which the most important are private motorists, industry, transport companies, farmers, and heating oil customers. Traffic fuels are marketed through Neste Oil’s own service station network and direct sales.Shipping segment operates a tanker fleet, which carries crude oil, petroleum products, and chemicals for the Group and other customers. Other segment includes Group administration, shared servi-ce functions as well as Research and Technology and Neste Jacobs Group.
Reporting segments presented above don't include any segments which are formed from aggregating two or more smaller seg-ments.
The segments' operating results are measured based on comparable operating profit and return on comparable net assets. The accounting policies of the segments are the same as those for the Group, as described in 'Summary of significant accounting policies'. All inter-segment transactions are on arm's length basis and are eliminated in consolidation. Segment operating profit include realized gains and losses from foreign currency and oil derivative contracts hedging cash flows of commercial sales and purchases that have been recycled in the income statement. The 'other expenses' included in the income statement for each busi-ness segment includes the following major items in the order of significance:
Oil Refining: maintenance, freights, rents, and other property costs and insurance premiums, change in the fair value of open oil derivative positionsRenewable Fuels: project costs, planning and consultancy costs and maintenanceSpecialty Products: freights and maintenanceOil Retail: rents and other property costs and maintenance Shipping: time-charter fees, operating costs of ships and main-tenance.
18 19 20 21 22 23 24 25 26 27 28 29 30 31 32 33 34 35
Segment operating assets and liabilities comprise of assets and liabilities utilized in the segments' business operations. Assets consist primarily of property, plant and equipment, intangible assets, investment in associates and joint ventures, pension as-sets, inventories and receivables. They exclude deferred taxes, interest-bearing receivables, and derivative financial instruments designated as hedges of forecasted future cash flows. Segment operating liabilities comprise operating liabilities, pension liabilities, and provisions; and exclude items such as current and deferred taxes, interest-bearing liabilities, and derivative financial instruments designated as hedges of forecasted future cash flows.
Group's customer structure in 2008 and 2007 did not result in any major concentration in any given geographical or business area.
Note 4 continues
Neste Oil 2008

96 Consolidated financial statements
2008Oil
RefiningRenewable
FuelsSpecialtyProducts
OilRetail Shipping Other Eliminations Group
External sales 10,035 97 585 4,065 206 55 - 15,043
Internal sales 1,995 19 6 8 231 88 -2,347 0
Total sales 12,030 116 591 4,073 437 143 -2,347 15,043
Other income 20 - 2 4 12 23 -17 44
Share of profit of associates and joint ventures - - 13 - - - - 13
Materials and services -11,295 -67 -500 -3,819 -89 -18 2,131 -13,657
Employee benefit costs -123 -7 -9 -41 -38 -105 8 -315
Depreciation, amortization and impairments -143 -7 -17 -31 -15 -10 - -223
Other expenses -366 -33 -61 -161 -253 -75 230 -719
Operating profit 123 2 19 25 54 -42 5 186
Financial income and expense -57
Profit before taxes 129
Income taxes -28
Profit for the period 101
Comparable operating profit 510 2 50 22 55 -42 5 602
Changes in the fair value of open oil and freight derivative positions 23 - - 2 -1 - - 24
Inventory gains/losses -422 - -31 - - - - -453
Sales gains/losses 12 - - 1 - - - 13
Operating profit 123 2 19 25 54 -42 5 186
Capital expenditure and investments in shares 132 249 30 63 3 31 - 508
Segment operating assets 2,848 439 212 567 294 131 -173 4,318
Investment in associates and joint ventures 0 1 135 1 15 - - 152
Deferred tax assets 16
Unallocated assets 234
Total assets 2,848 440 347 568 309 131 -173 4,720
Segment operating liabilities 876 69 20 217 37 65 -177 1,107
Deferred tax liabilities 297
Unallocated liabilities 1,137
Total liabilities 876 69 20 217 37 65 -177 2,541
Segment net assets 1,972 371 327 351 272 66 4 3,363
Return on net assets, % 5.2 0.9 5.3 6.8 18.8
Comparable return on net assets, % 21.7 0.9 13.9 6.0 19.2
Notes: 1 2 3 4 5 6 7 8 9 10 11 12 13 14 15 16 17

97Consolidated financial statements
2007Oil
RefiningRenewable
FuelsSpecialtyProducts
OilRetail Shipping Other Eliminations Group
External sales 7,762 36 641 3,424 196 44 - 12,103
Internal sales 1,586 4 8 11 198 49 -1,856 0
Total sales 9,348 40 649 3,435 394 93 -1,856 12,103
Other income 9 - 1 4 8 18 -13 27
Share of profit of associates and joint ventures - - 39 - - - - 39
Materials and services -8,186 -22 -499 -3,168 -66 -21 1,683 -10,279
Employee benefit costs -114 -4 -8 -38 -33 -61 2 -256
Depreciation, amortization and impairments -126 -5 -13 -27 -15 -9 - -195
Other expenses -291 -21 -47 -146 -258 -57 182 -638
Operating profit 640 -12 122 60 30 -37 -2 801
Financial income and expense -38
Profit before taxes 763
Income taxes -183
Profit for the period 580
Comparable operating profit 484 -13 109 59 28 -39 -2 626
Changes in the fair value of open oil and freight derivative positions -7 1 - -1 2 - - -5
Inventory gains/losses 161 - 13 - - - - 174
Sales gains/losses 2 - - 2 - 2 - 6
Operating profit 640 -12 122 60 30 -37 -2 801
Capital expenditure 193 69 5 51 2 14 - 334
Segment operating assets 3,244 173 198 664 315 101 -190 4,505
Investment in associates and joint ventures 0 - 162 1 15 - - 178
Deferred tax assets 7
Unallocated assets 181
Total assets 3,244 173 360 665 330 101 -190 4,871
Segment operating liabilities 1,079 31 36 284 33 42 -192 1,313
Deferred tax liabilities 289
Unallocated liabilities 842
Total liabilities 1,079 31 36 284 33 42 -192 2,444
Segment net assets 2,165 142 324 381 297 59 2 3,370
Return on net assets, % 30.1 -11.4 36.8 17.4 9.9
Comparable return on net assets, % 22.7 -12.3 32.9 17.1 9.3
18 19 20 21 22 23 24 25 26 27 28 29 30 31 32 33 34 35
Note 4 continues
Neste Oil 2008

98 Consolidated financial statements
Geographical informationThe Group operates production facilities in Finland, Canada, Belgium and Portugal, and retail selling network in Finland, Russia, Estonia, Latvia, Lithuania and Poland. The following table provides information of the Group's sales by geographical area, irrespective of the origin of the goods or services, and non-current assets and capital expenditure by geographical area.
Sales are allocated based on the country in which the customer is located. Non-current assets and capital expenditure are allocated based on where the assets are located. Non-current assets comprise of intangible assets, property, plant and equipment and invest-ments in associates and joint ventures. 'Other Nordic countries' include Sweden, Norway, Denmark and Iceland. 'Baltic Rim' includes Estonia, Latvia, Lithuania, Russia and Poland. The Group's activities in this geographical area comprise mainly of retail activities in the mentioned countries.
2008 Finland
Other Nordic
countries Baltic rim
Other European countries
North and South
AmericaOther
countriesElimi-
nations Group
Sales by destination 6,446 1,396 1,986 3,395 1,779 41 0 15,043
Non-current assets 2,390 137 166 50 37 98 0 2,878
Capital expenditure 384 0 25 5 14 80 0 508
2007 Finland
Other Nordic
countries Baltic rim
Other European countries
North and South
AmericaOther
countriesElimi-
nations Group
Sales by destination 5,187 1,300 1,342 2,525 1,736 13 0 12,103
Non-current assets 2,257 165 177 10 41 5 0 2,655
Capital expenditure 283 0 40 1 4 6 0 334
Notes: 1 2 3 4 5 6 7 8 9 10 11 12 13 14 15 16 17

99Consolidated financial statements
5. Acquisitions and disposals of subsidiaries
Acquired subsidiariesNeste Jacobs, subsidiary of Neste Oil Group, acquired 90% of the shares of an engineering company, Rintekno, which employs 230 people. The acquisition was closed on 29 February 2008. Prior to this, Neste Jacobs already owned 10% of the company. Rintekno is an engineering company specialized in engineering services for oil refining, chemicals and biopharma industries. Neste Jacobs and Rinte-kno have worked together for a number of years in connection with engineering of Neste Oil's investment projects.
On consolidation, intangible assets related to order backlog, customer relationships and trade name have been recognized at fair value in the balance sheet. Total amount recognized is EUR 1 million and the assets are depreciated during their expected life time, in 1-5 years. Goodwill recognized in the consolidated balance sheet is attributable to the experienced and capable personnel employed by Rintekno Group and to synergies achieved in engineering projects due to Rintekno's previous experience as a subcontractor in Neste Oil's major investment projects.
The profit of Rintekno Group included in the Neste Oil consolidated income statement 1 January – 31 December 2008 is immaterial. Also, management estimates that Rintekno Group's effect on Neste Oil's consolidated sales or profit for the period would have been im-material as at 31 December 2008, had the acquisition taken place on 1 January 2008.
Assets and liabilities of Rintekno Group
2008 Acquired fair value Acquired book value
Intangible assets 1 0
Property, plant and equipment 1 1
Trade and other receivables 5 5
Cash and cash equivalents 6 6
Total assets 13 12
Trade and other payables 5 5
Pension liabilities 1 1
Total liabilities 6 6
Acquired net assets 7 6
Purchase consideration 16
Direct costs related to the acquisition 0
Goodwill 9
Purchase consideration settled in cash 16
Direct costs related to the acquisition 0
Cash and cash equivalents in Rintekno Group -6
Cash outflow on acquisition 10
No acquisitions took place in 2007.
Disposed subsidiariesDuring the financial period 2008 there were no disposals of subsidiaries. In 2007, the Group sold its subsidiary Eastex Crude Company to the other owner of the company. The sale was completed on 15 February 2007. The company was included in the Oil Refining segment and its sales consolidated to Neste Oil Group totaled EUR 151 million in 2007. The company's impact on the Group's or segment's results have been insignificant.
Net cash inflow arising from disposal
Eastex Crude Company 15 Feb 2007
Cash consideration received 14
Cash and cash equivalents disposed of 21
-7
18 19 20 21 22 23 24 25 26 27 28 29 30 31 32 33 34 35
Neste Oil 2008

100 Consolidated financial statements
6. Analysis of sales by category2008 2007
Sale of goods 14,715 11,817
Revenue from services 285 259
Royalty income 1 2
Other 42 25
15,043 12,103
Sale of goods include product sales from the Group's own refineries, other production facilities and retail stations as well as other sale of petroleum products, feedstock, raw materials and oil trading. Excise taxes included in the retail selling price of finished oil products amounting to EUR 1,213 million (2007: EUR 1,070 million) are included in product sales. The corresponding amount is included in 'Materials and services', Note 8.
Oil trading included in Sale of goods comprise of revenue from physical and derivative financial instrument trading activities conduct-ed on international and regional markets by taking delivery of and selling petroleum products and raw materials within a short period of time for the purpose of generating a profit from short term fluctuations in product and raw material prices and margins. Trading mainly involves transactions based on the use of derivative financial instruments.
Revenue from services mainly comprises revenue from the Shipping segment and Neste Jacobs included in Other segment.Revenue from product exchanges included in 'Sale of goods' amounted to EUR 126 million (2007: EUR 177 million).
7. Other income2008 2007
Gain on sale of subsidiaries - 3
Capital gains on disposal of other non-current assets 12 3
Rental income 4 3
Government grants 12 8
Other 16 10
44 27
Government grants relate mainly to the Shipping segment, which is entitled to apply for certain grants based on Finnish legislation. EUR 9 million (2007: EUR 5 million) of the amount is included in 'Trade and other receivables' in the consolidated balance sheet. This amount relating to operations in the financial period ended 31 December are applied for and received during the following financial period. The Group believes that it has fullfilled all the conditions related to the grants recognized in the income statement.
8. Materials and services2008 2007
Change in product inventories 115 -94
Materials and supplies
Purchases 13,328 10,518
Change in inventories 195 -168
External services 19 23
13,657 10,279
Purchases include excise taxes included in the retail selling price of petroleum products amounting to EUR 1,213 million (2007: EUR 1,070 million). The corresponding amount is included in ’Sales’, Note 6.
Notes: 1 2 3 4 5 6 7 8 9 10 11 12 13 14 15 16 17

101Consolidated financial statements
9. Employee benefit costs2008 2007
Wages, salaries 251 210
Social security costs 24 25
Pension costs-defined contribution plans 28 21
Pension costs-defined benefit plans 2 -8
Other costs 10 8
315 256
Detailed information concerning pension costs is included in Note 29, ’ Retirement benefit obligations’. Key management compensation is included in Note 31, ’Related party transactions’.
Number of personnel (average)
2008 2007
Oil Refining 1,881 1,864
Renewable Fuels 42 29
Specialty Products 102 93
Oil Retail 1,392 1,377
Shipping 505 509
Other 1,252 938
5,174 4,810
10. Depreciation, amortization and impairment charges2008 2007
Depreciation of property, plant, and equipment
Buildings and structures 51 47
Machinery and equipment 152 132
Other tangible assets 10 7
213 186
Amortization of intangible assets 10 9
Depreciation, amortization and impairment charges total 223 195
11. Other expenses2008 2007
Operating leases and other property costs 149 152
Freights relating to sales 108 114
Repairs and maintenance 124 108
Other 338 264
719 638
Operating leases include rents for land, premises, machinery and equipment as well as time charter vessels.Other expenses include services, selling expenses, insurance premiums and unrealized changes in the fair value of open oil and
freight derivative positions when negative.
Fees charged by the statutory auditor, EUR thousands
2008 2007
Audit fees 786 560
Auditor's mandatory opinions 19 3
Tax advisory 157 17
Other advisory services 846 55
1,808 635
18 19 20 21 22 23 24 25 26 27 28 29 30 31 32 33 34 35
Neste Oil 2008

102 Consolidated financial statements
12. Financial income and expenses2008 2007
Financial income
- Dividend income on available-for-sale investments 0 0
- Interest income from loans and receivables 8 8
- Other financial income 0 0
8 8
Financial expenses
- Interest expenses for financial liabilities at amortized cost -53 -37
- Interest rate derivatives, hedge accounted 0 0
- Interest rate derivatives, non-hedge accounted -14 0
- Other financial expenses -3 -3
-70 -40
Exchange rate and fair value gains and losses
- Loans and receivables -12 18
- Other 3 -3
- Foreign exchange derivatives, non-hedge accounted 14 -21
5 -6
Financial cost - net -57 -38
Net gains/losses on financial instruments included in operating profit
2008 2007
Foreign exchange rate and oil derivative financial instruments designated as cash flow hedges 34 58
Non-hedge accounted foreign exchange rate, oil and freight derivative instruments -11 -81
23 -23
Net gains/losses include realized and unrealized gains and losses on derivative financial instruments. Finacial instruments held for trad-ing purposes incude also the net result of physical trading transactions for those contracts that meet the criteria specified in IAS 39.5-6. Non-hedge accounted derivative financial instruments include net result of transactions entered into for hedging purposes amounting to EUR 10 million (2007: EUR -85 million), and transactions entered into for trading purposes amounting to EUR -21 million (2007: EUR 4 million).
Aggregate exchange differences charged/credited to the income statement
2008 2007
Sales 29 -13
Materials and services -12 18
17 5
Notes: 1 2 3 4 5 6 7 8 9 10 11 12 13 14 15 16 17

103Consolidated financial statements
13. Income tax expenseThe major components of tax expenses are:
2008 2007
Current tax expense 15 137
Adjustments recognized for current tax of prior periods -3 -1
Change in deferred taxes 16 47
28 183
The difference between income taxes at the statutory tax rate in Finland and income taxes recognized in the consolidated income state-ment is reconciled as follows:
2008 2007
Profit before tax 129 763
Hypothetical income tax calculated at Finnish tax rate 26% (2007: 26%) -34 -198
Effect of different tax rates of foreign subsidiaries -1 -1
Tax exempt income 4 6
Non-deductible expense -2 -1
Taxes for previous periods 3 1
Net results of associated companies 3 10
Other -1 0
Tax charge in the consolidated income statement -28 -183
The Group's effective income tax rate was 21.79% (2007: 24.04%). The effective tax rate is continually being slightly lower than the Finnish corporate tax rate of 26%. The share of profits of associates and joint ventures and tax-exempt capital gains decreased the effective tax rate. The main reason for the effective tax rate is the effect of Finnish on-going business operations.
14. Earnings per shareBasic and diluted earnings per share are calculated by dividing the profit attributable to equity holders of the Company by the weighted average number of ordinary shares outstanding during the year. Since the Company has not granted any options, there is no dilution. The average number of shares has been adjusted with treasury shares, 500,000 shares, as described in note 25.
2008 2007
Profit attributable to equity holders of the Company 97 577
Weighted average number of ordinary shares in issue (thousands) 255,904 255,971
Earnings per share basic and diluted (euro per share) 0.38 2.25
15. Dividend per shareThe dividends paid in 2008 were EUR 1.00 per share, totalling EUR 256 million and 2007 EUR 0.90 per share, totalling EUR 231 million. A dividend of EUR 0.80 per share will be proposed at the Annual General Meeting on 3 April 2009, corresponding to total dividends of EUR 205 million for 2008. This dividend is not reflected in the financial statements.
18 19 20 21 22 23 24 25 26 27 28 29 30 31 32 33 34 35
Neste Oil 2008
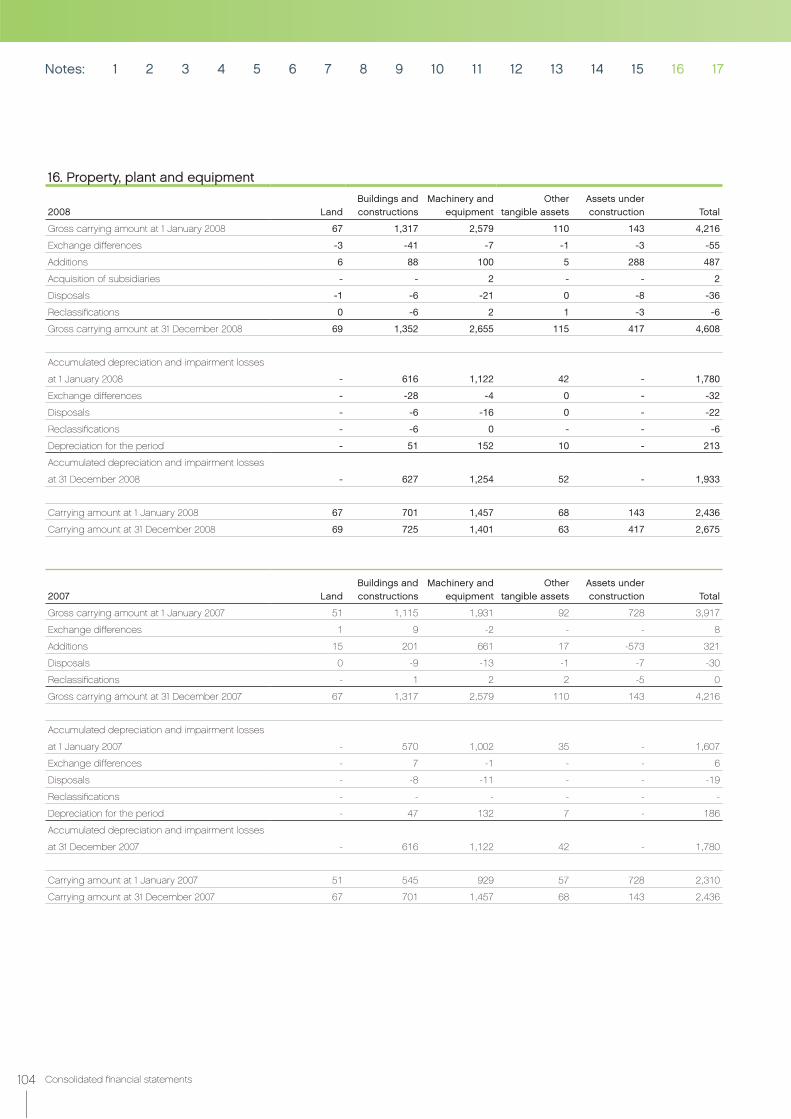
104 Consolidated financial statements
16. Property, plant and equipment
LandBuildings and constructions
Machinery and equipment
Other tangible assets
Assets under construction Total2008
Gross carrying amount at 1 January 2008 67 1,317 2,579 110 143 4,216
Exchange differences -3 -41 -7 -1 -3 -55
Additions 6 88 100 5 288 487
Acquisition of subsidiaries - - 2 - - 2
Disposals -1 -6 -21 0 -8 -36
Reclassifications 0 -6 2 1 -3 -6
Gross carrying amount at 31 December 2008 69 1,352 2,655 115 417 4,608
Accumulated depreciation and impairment losses
at 1 January 2008 - 616 1,122 42 - 1,780
Exchange differences - -28 -4 0 - -32
Disposals - -6 -16 0 - -22
Reclassifications - -6 0 - - -6
Depreciation for the period - 51 152 10 - 213
Accumulated depreciation and impairment losses
at 31 December 2008 - 627 1,254 52 - 1,933
Carrying amount at 1 January 2008 67 701 1,457 68 143 2,436
Carrying amount at 31 December 2008 69 725 1,401 63 417 2,675
LandBuildings and constructions
Machinery and equipment
Other tangible assets
Assets under construction Total2007
Gross carrying amount at 1 January 2007 51 1,115 1,931 92 728 3,917
Exchange differences 1 9 -2 - - 8
Additions 15 201 661 17 -573 321
Disposals 0 -9 -13 -1 -7 -30
Reclassifications - 1 2 2 -5 0
Gross carrying amount at 31 December 2007 67 1,317 2,579 110 143 4,216
Accumulated depreciation and impairment losses
at 1 January 2007 - 570 1,002 35 - 1,607
Exchange differences - 7 -1 - - 6
Disposals - -8 -11 - - -19
Reclassifications - - - - - -
Depreciation for the period - 47 132 7 - 186
Accumulated depreciation and impairment losses
at 31 December 2007 - 616 1,122 42 - 1,780
Carrying amount at 1 January 2007 51 545 929 57 728 2,310
Carrying amount at 31 December 2007 67 701 1,457 68 143 2,436
Notes: 1 2 3 4 5 6 7 8 9 10 11 12 13 14 15 16 17

105Consolidated financial statements
17. Intangible assets
2008 GoodwillOther
intangible assets Total
Gross carrying amount at 1 January 2008 2 112 114
Exchange differences - -1 -1
Additions 9 10 19
Disposals - -8 -8
Reclassifications - 6 6
Gross carrying amount at 31 December 2008 11 119 130
Accumulated amortization and impairment losses at 1 January 2008 - 73 73
Exchange differences - -2 -2
Disposals - -8 -8
Reclassifications - 6 6
Amortization for the period - 10 10
Accumulated amortization and impairment losses at 31 December 2008 - 79 79
Carrying amount at 1 January 2008 2 39 41
Carrying amount at 31 December 2008 11 40 51
2007 GoodwillOther
intangible assets Total
Gross carrying amount at 1 January 2007 2 107 109
Exchange differences - 1 1
Additions - 13 13
Disposals - -9 -9
Gross carrying amount at 31 December 2007 2 112 114
Accumulated amortization and impairment losses at 1 January 2007 - 71 71
Exchange differences - 0 0
Disposals - -7 -7
Amortization for the period - 9 9
Accumulated amortization and impairment losses at 31 December 2007 - 73 73
Carrying amount at 1 January 2007 2 36 38
Carrying amount at 31 December 2007 2 39 41
Finance leases
Machinery and equipment includes the following amounts where the Group is a lessee under a finance lease:
2008 2007
Gross carrying amount 145 145
Accumulated depreciation 38 32
Carrying amount 107 113
Capitalized borrowing costsBorrowing costs amounting to EUR 2 million (2007: EUR 6 million) were capitalized during the financial period related to the Renewable Fuels investment projects in Singapore and Rotterdam (2007: Porvoo Diesel Production line). They are included in 'Assets under construction'. The Group's average interest rate of borrowings for each quarter was applied as the capitalization rate, which resulted in average capitalization rate of 4.00% (2007: 4.20%).
18 19 20 21 22 23 24 25 26 27 28 29 30 31 32 33 34 35
Note 17 continues
Neste Oil 2008

106 Consolidated financial statements
Emission allowancesNeste Oil's Porvoo and Naantali refineries come under the European Union's greenhouse gas emission trading system, and were granted a total of 16.1 million tons emission allowances for the period 2008–2012. Emission allowances purchased are accounted for as intangible assets and measured at cost, and emission allowances received free of charge are accounted for at nominal value, i.e. at zero. An impairment charge is recognized in the income statement if the fair value is lower than the carrying value.
A provision is recognized to cover the obligation to return emission allowances if emission allowances received free of charge do not cover actual emissions. The provision is measured at its probable settlement amount. The difference between emissions made and emission allowances received, as well as the change in the probable amount of the provision, are reflected in operating profit.
As at 31 December 2008 emission allowances were reflected in the balance sheet of Neste Oil in provisions amounting to EUR 3 million. This amount represents the estimated obligation to purchase emission allowances. The actual amount of CO2 emissions in 2008 were 3.4 million tons (2007: 3.2 million tons). The Group has neither purchased nor sold emission allowances during the financial period ended 31 December 2008 (2007: purchased 25 thousand tons). The Group has exchanged an immaterial amount of emission allowances to Certified Emission Reduction (CER) during the financial period ended 31 December 2008.
Impairment test of goodwill
Goodwill is allocated to the Group’s cash-generating units (CGU’s), which are identified as the Group’s operating segments, Oil Refining, Renewable Fuels, Specialty Products, Oil Retail, Shipping and Neste Jacobs sub-group within Other segment.
A segment-level summary of the goodwill allocation is presented below:
2008 2007
Oil Refining 2 2
Other 9 -
11 2
The recoverable amount of a cash-generating unit is determined based on value-in-use calculations. These calculations use cash flow projections based on financial plans approved by the management covering a period of three years. The key assumptions used for the plans in Neste Jacobs are the demand and the price level for engineering services within oil refining, chemicals and biopharma indus-tries, as well as the billability rate.
Cash flows beyond the period are extrapolated for Neste Jacobs Group using a negative nominal growth rate. The negative nominal growth rate is due to goodwill being attributable to the experienced and capable personnel employed by the acquired Rintekno Group. The negative growth rate takes into account the potential turnover of personnel. The discount rate used is 9.5%, representing the WACC specified for the division in question after tax, which is adjusted by tax effects in connection with the test. The WACC formula inputs are risk-free rate of return, market risk premium, industry-specific beta factor, target capital structure, borrowing cost and country risks.
The key assumptions used in the impairment test in Neste Jacobs are the billability rate affecting the EBITDA, and the discount rate. A reasonably possible change in the key assumptions would not create a situation in which the carrying amounts of the cash generat-ing units would exceed their recoverable amounts.
Notes: 1 2 3 4 5 6 7 8 9 10 11 12 13 14 15 16 17

107Consolidated financial statements
18. Investments in associates and joint ventures
Investments in associates
2008 2007
Carrying amount
At 1 January 2 2
At 31 December 2 2
A complete list of Group's associated companies, countries of incorporation, and interests held is disclosed in Note 32.
Summarized financial information in respect of the Group’s associates, all of which are unlisted, is set out below:
2007
Assets 13
Liabilities 11
Sales 55
Profit/loss 0
The financial statements of the Group’s associates are not published within the Group’s reporting timetable. The summarized financial information presented above, therefore, is from the latest published financial statements of the associates concerned (2007).
Investments in joint ventures
2008 2007
Carrying amount
At 1 January 176 159
Share of profits of joint ventures 13 39
Investments in joint ventures during the financial period 1 0
Translation differences -20 -6
Hedging reserves in joint ventures -1 1
Dividends -19 -17
At 31 December 150 176
The Group’s interest in its principle joint ventures at 31 December, all of which are unlisted, were as follows:
Country of incorporation
2008% interest held
2007% interest held
Glacia Ltd Bermuda 50.00 50.00
Lacus Ltd Bermuda 50.00 50.00
NSE Biofuels Oy Ltd Finland 50.00 50.00
Nynas AB Sweden 49.99 49.99
Terra Ltd Bermuda 50.00 50.00
18 19 20 21 22 23 24 25 26 27 28 29 30 31 32 33 34 35
Note 18 continues
Neste Oil 2008

108 Consolidated financial statements
Nynas AB (formerly AB Nynäs Petroleum) is a Swedish company that specializes in producing and marketing bitumen in Europe and naphthenics globally. The sales volumes, incl. various fuels produced as side products, amounted to 3.7 million tons in total in 2008. The remaining 50.01% of the shares of Nynas is owned by a subsidiary of a Venezuelan oil company, Petroleos de Venezuela S.A. Nynas AB is governed as a 50/50 owned joint venture, although the other party owns the majority of the company's total share capital.
Glacia Ltd is a joint venture company owned on a 50/50 basis by Neste Oil and Stena Maritime AG (part of the Stena Group). The company owns an Aframax-size crude tanker, which joined the Neste Oil fleet in January 2007. Neste Oil has entered into a 10-year time charter contract with the joint venture for the vessel of which 8 years remain.
Terra Ltd and Lacus Ltd are two joint venture companies owned on a 50/50 basis by Neste Oil and Concordia Maritime AG (part of the Stena Group). Both companies own Panamax-size product tankers, which joined the Neste Oil fleet in January and February 2007. Neste Oil has entered into a 10-year time charter contract with the joint ventures for the vessels of which 8 years remain.
NSE Biofuels Oy Ltd is an equally owned joint venture between Neste Oil and Stora Enso located in Varkaus, Finland. The purpose of the company is to build a demonstration plant for biowax production based on gasification of wood-based biomass. The target of the demonstration facility is to develop production process for future commercialization. The company was established during the financial period 2007.
Joint ventures have been consolidated using the equity method.
Summarized financial information in respect of the Group's joint ventures is set out below:
1) Based on August 2008 figures.
The financial statements of all the Group's joint ventures are not published within the Group's reporting timetable. The summarized finan-cial information presented above concerning Nynas AB are from the latest published interim financial statements of the company. The share of profits of joint ventures for 2008 is consolidated based on the company's preliminary results for the financial period.
2008Non-current
assetsCurrent assets
Non-current liabilities
Current liabilities Sales Profit/loss
Glacia Ltd 46 4 36 2 5 1
Lacus Ltd 31 3 24 2 5 1
NSE Biofuels Oy Ltd 15 9 18 5 0 0
Nynas AB 1) 274 935 242 588 1,658 65
Terra Ltd 31 3 24 2 5 1
2007Non-current
assetsCurrent assets
Non-current liabilities
Current liabilities Sales Profit/loss
Glacia Ltd 42 2 36 2 5 0
Lacus Ltd 31 13 24 2 4 0
NSE Biofuels Oy Ltd 0 0 0 0 0 0
Nynas AB 256 552 215 279 2,016 84
Terra Ltd 31 2 24 2 5 0
Notes: 1 2 3 4 5 6 7 8 9 10 11 12 13 14 15 16 17

109Consolidated financial statements
19. Carrying amounts of financial assets and liabilities by measurement categoriesFinancial assets/liabilities at fair
value through income statement Loans and
receiv-ables
Available- for-sale
financial assets
Financial liabilities
measured at amortized cost
Carrying amounts by
balance sheet item
Fair value Note
Hedge accounting
Non-hedge accounting2008 Balance sheet item
Non-current financial assets
Non-current receivables - - 13 - - 13 13 20
Derivative financial instruments - 16 - - - 16 16 24
Available-for-sale financial assets - - - 1 - 1 1 20
Current financial assets
Trade and other receivables - - 786 - - 786 786 22
Derivative financial instruments 13 200 - - - 213 213 24
Carrying amount by category 13 216 799 1 - 1,029 1,029
Non-current financial liabilities
Interest-bearing liabilities - - - - 926 926 925 26
Derivative financial instruments 5 27 - - - 32 32 24
Other non-current liabilities - - - - 3 3 3 26
Current financial liabilities
Interest-bearing liabilities - - - - 133 133 133 26
Current tax liabilities - - - - 1 1 1 26
Derivative financial instruments 37 160 - - - 197 197 24
Trade and other payables - - - - 916 916 916 26
Carrying amount by category 42 187 - - 1,979 2,208 2,207
Financial assets/liabilities at fair value through income statement Loans
and receiv-
ables
Available- for-sale
financial assets
Financial liabilities
measured at amortized cost
Carrying amounts by
balance sheet item
Fair value Note
Hedge accounting
Non-hedge accounting2007 Balance sheet item
Non-current financial assets
Non-current receivables - - 3 - - 3 3 20
Derivative financial instruments - 22 - - - 22 22 24
Available-for-sale financial assets - - - 2 - 2 2 20
Current financial assets
Trade and other receivables - - 955 - - 955 955 22
Derivative financial instruments 48 78 - - - 126 126 24
Carrying amount by category 48 100 958 2 - 1,108 1,108
Non-current financial liabilities
Interest-bearing liabilities - - - - 662 662 661 26
Derivative financial instruments 6 16 - - - 22 22 24
Other non-current liabilities - - - - 5 5 5 26
Current financial liabilities
Interest-bearing liabilities - - - - 145 145 145 26
Current tax liabilities - - - - 14 14 14 26
Derivative financial instruments 1 76 - - - 77 77 24
Trade and other payables - - - - 1,211 1,211 1,211 26
Carrying amount by category 7 92 - - 2,037 2,136 2,135
The fair values of each class of financial assets and financial liabilities are presented in the detailed note for each balance sheet itemreferred to in the table above.
18 19 20 21 22 23 24 25 26 27 28 29 30 31 32 33 34 35
Neste Oil 2008

110 Consolidated financial statements
20. Non-current receivables and available-for-sale financial assets
Non-current receivablesFair value Carrying amount
2008 2007 2008 2007Non-current interest-bearing receivables 12 2 12 2
Other non-current receivables 1 1 1 1
13 3 13 3
The carrying amounts of loan receivables are measured at amortized cost using the effective interest rate method, and the fair values are determined by using the discounted cash flow method, applying the market interest rate at the balance sheet date. The maximum exposure to credit risk at the reporting date is the carrying amount of the loan receivables.
Available-for-sale financial assets2008 2007
At 1 January 2 2
Disposals -1 -
At 31 December 1 2
Investments in unlisted equity instruments 1 2
1 2
Available-for-sale financial assets are investments in unlisted equity instruments, and are measured at cost, because their fair value can-not be reliably measured in the absence of an active market.
21. Inventories2008 2007
Materials and supplies 237 415
Work in progress 206 179
Finished products and goods 193 373
Other inventories 1 1
637 968
Inventories held for trading purposes are measured at fair value, less selling expenses. They amounted to EUR 17 million as at 31 Decem-ber 2008 (2007: EUR 38 million). Write downs of inventories amounted to EUR 43 million as at 31 December 2008 (2007: EUR 0 million).
22. Current trade and other receivablesFair value Carrying amount
2008 2007 2008 2007Trade receivables 574 833 574 833
Other receivables 85 63 85 63
Advances paid 16 9 16 9
Accrued income and prepaid expenses 111 50 111 50
786 955 786 955
The carrying amounts of current receivables are reasonable approximations of their fair value. The maximum exposure to credit risk at the reporting date is the carrying amount of the trade and other receivables. Impairment of trade receivables amounted to EUR 18 million (2007: EUR 0 million).
Analysis of trade receivables by age is presented in Note 3, Financial risk management, section 'credit and counterparty risk'.
23. Cash and cash equivalents
Cash and cash equivalents include the following:2008 2007
Cash at bank and in hand 54 46
Short term bank deposits 1 6
55 52
The maximum exposure to credit risk at the reporting date is the carrying amount of the cash and cash equivalents.
Notes: 1 2 3 4 5 6 7 8 9 10 11 12 13 14 15 16 17

111Consolidated financial statements
24. Derivative financial instruments
Nominal values of interest rate and currency derivative contracts and share forward contracts
2008Remaining maturities
2007Remaining maturities
< 1 year 1–5 years Total < 1 year 1–5 years Total
Derivative financial instruments designated as cash flow hedges
Interest rate swaps 1) - 35 35 - 35 35
Forward foreign exchange contracts 604 - 604 484 - 484
Currency options
- Purchased 336 - 336 353 - 353
- Written 256 - 256 188 - 188
1,196 35 1,231 1,025 35 1,060
Derivative financial instruments designated as fair value hedges
Interest rate swaps 1) - 60 60 - 60 60
- 60 60 - 60 60
Non-hedge accounting derivative financial instruments
Interest rate swaps 1) - 380 380 - 250 250
Forward foreign exchange contracts 777 - 777 705 - 705
Share forward contracts 2) 5 9 14 3 14 17
782 389 1,171 708 264 972
1) Interest rate swaps mature in 5 years (2007: 3–5 years).2) Share forward contracts relate to share based payments (Note 30) and they mature in 0–2 years (2007: 0–2 years).
Volumes of oil and freight derivative contracts
2008Volume million bbl
Remaining maturities
2007Volume million bbl
Remaining maturities
< 1 year 1–2 years Total < 1 year 1–2 years Total
Oil derivative contracts designated as cash flow hedgesFutures and forwards- Sales contracts - - - 2 - 2
- - - 2 - 2
Non-hedge accounting oil derivative contracts 3)
Futures and forwards- Sales contracts 26 1 27 50 8 58
- Purchase contracts 19 1 20 47 8 55
Options- Purchased - 1 1 - - -
- Written - 1 1 - - -
45 4 49 97 16 113
Non-hedge accounting freight derivative contracts 3)
Futures and forwards- Sales contracts 1 - 1 8 - 8
- Purchase contracts 12 - 12 15 3 18
Options - Purchased - - - 1 - 1
- Written - - - - - -
13 - 13 24 3 27
3) Oil and freight derivative contracts with non-hedge accounting status consist of trading derivative contracts and cash flow hedges without hedge accounting status.
18 19 20 21 22 23 24 25 26 27 28 29 30 31 32 33 34 35
Note 24 continues
Neste Oil 2008

112 Consolidated financial statements
Fair values of derivative financial instruments
Fair value 2008 Fair value 2007
Interest rate and currency derivative contracts and share forward contracts
Positive Negative Positive Negative
< 1 year 1–5 years < 1 year 1–5 years < 1 year 1–5 years < 1 year 1–5 years
Derivative financial instruments designated as cash flow hedges
Interest rate swaps 1) - - - 4 - - - 2
Forward foreign exchange contracts 12 - 20 - 33 - - -
Currency options
- Purchased 1 - 6 - 12 - - -
- Written 0 - 11 - 1 - - -
13 - 37 4 46 - - 2
Derivative financial instruments designated as fair value hedges
Interest rate swaps 1) - - - - - - - 4
- - - - - - - 4
Non-hedge accounting derivative financial instruments
Interest rate swaps 1) - - - 8 - 6 - -
Forward foreign exchange contracts 28 - 3 - 4 - 2 -
Share forward contracts 2) - - 3 5 2 - - 0
28 - 6 13 6 6 2 0
1) Interest rate swaps mature in 5 years (2007: 3–5 years).2) Share forward contracts relate to share based payments (Note 30) and they mature in 0–2 years (2007: 0–2 years).
Fair value 2008 Fair value 2007
Positive Negative Positive Negative
Oil and freight derivative contracts < 1 year 1–2 years < 1 year 1–2 years < 1 year 1–3 years < 1 year 1–3 years
Oil derivative contracts designated as cash flow hedges
Futures and forwards
- Sales contracts - - - - 2 - 1 -
- - - - 2 - 1 -
Non-hedge accounting oil derivative contracts 3)
Futures and forwards
- Sales contracts 169 4 8 - 9 2 64 14
- Purchase contracts 3 - 137 3 61 14 10 2
Options
- Purchased - - - 12 - - - -
- Written - 12 - - - - - -
172 16 145 15 70 16 74 16
Non-hedge accounting freight derivative contracts 3)
Futures and forwards
- Purchase contracts - - 9 - 2 - - -
Options
- Purchased - - - - 0 - - -
- - 9 - 2 - - -
3) Oil and freight derivative contracts with non-hedge accounting status consist of trading derivative contracts and cash flow hedges without hedge accounting status.
Notes: 1 2 3 4 5 6 7 8 9 10 11 12 13 14 15 16 17
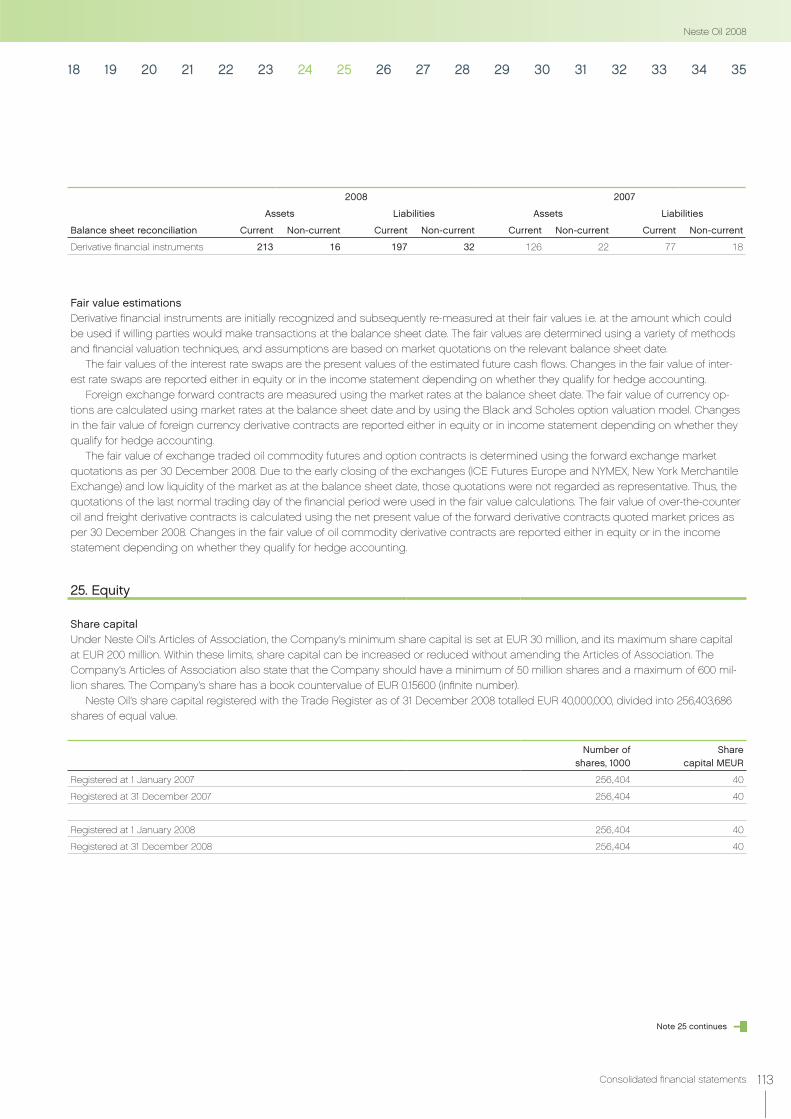
113Consolidated financial statements
2008 2007
Assets Liabilities Assets Liabilities
Balance sheet reconciliation Current Non-current Current Non-current Current Non-current Current Non-current
Derivative financial instruments 213 16 197 32 126 22 77 18
Fair value estimationsDerivative financial instruments are initially recognized and subsequently re-measured at their fair values i.e. at the amount which could be used if willing parties would make transactions at the balance sheet date. The fair values are determined using a variety of methods and financial valuation techniques, and assumptions are based on market quotations on the relevant balance sheet date.
The fair values of the interest rate swaps are the present values of the estimated future cash flows. Changes in the fair value of inter-est rate swaps are reported either in equity or in the income statement depending on whether they qualify for hedge accounting.
Foreign exchange forward contracts are measured using the market rates at the balance sheet date. The fair value of currency op-tions are calculated using market rates at the balance sheet date and by using the Black and Scholes option valuation model. Changes in the fair value of foreign currency derivative contracts are reported either in equity or in income statement depending on whether they qualify for hedge accounting.
The fair value of exchange traded oil commodity futures and option contracts is determined using the forward exchange market quotations as per 30 December 2008. Due to the early closing of the exchanges (ICE Futures Europe and NYMEX, New York Merchantile Exchange) and low liquidity of the market as at the balance sheet date, those quotations were not regarded as representative. Thus, the quotations of the last normal trading day of the financial period were used in the fair value calculations. The fair value of over-the-counter oil and freight derivative contracts is calculated using the net present value of the forward derivative contracts quoted market prices as per 30 December 2008. Changes in the fair value of oil commodity derivative contracts are reported either in equity or in the income statement depending on whether they qualify for hedge accounting.
25. Equity
Share capitalUnder Neste Oil’s Articles of Association, the Company’s minimum share capital is set at EUR 30 million, and its maximum share capital at EUR 200 million. Within these limits, share capital can be increased or reduced without amending the Articles of Association. The Company’s Articles of Association also state that the Company should have a minimum of 50 million shares and a maximum of 600 mil-lion shares. The Company’s share has a book countervalue of EUR 0.15600 (infinite number).
Neste Oil’s share capital registered with the Trade Register as of 31 December 2008 totalled EUR 40,000,000, divided into 256,403,686 shares of equal value.
Number of shares, 1000
Share capital MEUR
Registered at 1 January 2007 256,404 40
Registered at 31 December 2007 256,404 40
Registered at 1 January 2008 256,404 40
Registered at 31 December 2008 256,404 40
18 19 20 21 22 23 24 25 26 27 28 29 30 31 32 33 34 35
Note 25 continues
Neste Oil 2008

114 Consolidated financial statements
Treasury sharesNeste Oil has entered into an agreement with a third party service provider concerning the administration of the new share-based management share performance arrangement for key management personnel. As part of the agreement, the service provider has purchased a total of 500,000 Neste Oil shares in February 2007 in order to hedge part of Neste Oil's cash flow risk in relation to the future payment of the rewards, which will take place partly in Neste Oil shares and partly in cash during 2010 and 2013. Despite the legal form of the hedging arrangement, it has been accounted for as if the share purchases had been conducted directly by Neste Oil, as required by IFRS 2, Share based payments and SIC-12, Consolidation – Special purpose entities. The consolidated balance sheet and the con-solidated changes in total equity reflect the substance of the arrangement with a deduction amounting to EUR 12 million in equity. This amount represents the consideration paid for the shares by the third party service provider.
Other reservesReserve fund comprises of restricted reserves other than share capital.
Fair value and other reserves include the effective portion of the change in fair value of derivative financial instruments that are designated as and qualify for cash flow hedges, amounts recognized directly in equity concerning available-for-sale investments, and concerning equity settled share based payments, the amount corresponding to the expense recognized in the income statement.
Translation differences include exchange differences arising from the translation of the net investment in foreign entities on consoli-dation, change in the fair value of currency instruments designated as hedges of the net investment, and exchange differences resulting from the translation of income statement of foreign entities at the average exchange rates and balance sheet at the closing rates.
26. Non-current and current liabilitiesFair value Carrying amount
Non-current liabilities 2008 2007 2008 2007
Bonds 115 193 120 196
Loans from financial institutions 712 351 708 350
Pension loans 20 39 20 38
Finance lease liabilities 78 78 78 78
Other non-current liabilities 1 1 1 1
Accruals and deferred income 2 4 2 4
Non-current liabilities total 928 666 929 667
of which interest-bearing 926 662
The carrying amounts of non-current liabilities are measured at amortized cost using the effective interest rate method and the fair values are determined by using the discounted cash flow method employing market interest rates or market values at the balance sheet date.
Fair value Carrying amount
Current liabilities 2008 2007 2008 2007
Bonds 80 - 80 -
Loans from financial institutions 43 95 43 95
Finance lease liabilities 5 5 5 5
Advances received 15 2 15 2
Trade payables 496 767 496 767
Other current liabilities 327 416 327 416
Current tax liabilities 1 14 1 14
Accruals and deferred expenses 83 71 83 71
Current liabilities total 1,050 1,370 1,050 1,370
of which interest-bearing 133 145
The carrying amounts of current interest-free liabilities are reasonable approximations of their fair value. The carrying amounts of current interest-bearing liabilities are measured at amortized cost using the effective interest rate method and the fair values are determined by using the discounted cash flow method employing market interest rates at the balance sheet date.
Notes: 1 2 3 4 5 6 7 8 9 10 11 12 13 14 15 16 17

115Consolidated financial statements
The future minimum lease payments of finance lease liabilities and their present value in the balance sheet
2008 2007
Minimum lease
payments
Future finance
charges
Present value of minimum-
lease payments
Minimum lease
payments
Future finance
charges
Present value of minimum
lease payments
Amounts payable under finance lease:
Within one year 10 5 5 9 5 4
Between one and five years 85 7 78 67 14 53
More than 5 years - - - 28 2 26
Total amounts payable 95 12 83 104 21 83
Finance lease liabilities relate to Shipping segment and arise from bareboat agreements on crude oil tankers Tempera and Mastera de-livered in 2002 and 2003, escort tugs Ukko and Ahti delivered in 2002 and a leasing agreement made in 2003 on spare parts of Mastera that are classified as finance lease agreements under IAS 17. The lease terms are 12 years for all the vessels with the lessor having an option to extend the term with additional 3 years, and 7 years for the spare part leasing agreement. The bareboat agreements covering the vessels include call options to purchase the leased assets in the 10th and 11th year of the lease period at a value determined at the inception of the lease. Neste Oil has announced it will exercise the call options. The spare part leasing agreement includes a call option to purchase the leased asset at termination of the agreement at a value determined at the inception of the lease. The option prices stated in the agreements are used as the residual values for the leased assets. Minimum lease payments in each agreement include these option prices as terminal payments. Contingent rents amounted to EUR 2 million (2007: EUR 3 million).
27. Deferred income taxes
The movement in deferred tax assets and liabilities during 2008:
at 1 Jan 2008
Charged to Income
StatementCharged in
Equity
Exchange rate differences
and other changes
at 31 Dec 2008
Deferred tax assets
Tax loss carried forward 0 1 - - 1
Provisions 2 1 - - 3
Other temporary differences 5 7 - - 12
Total deferred tax assets 7 9 - - 16
Deferred tax liabilities
Depreciation difference and untaxed reserves 211 29 - - 240
Excess of book basis over tax basis of property, plant and equipment 19 -5 - - 14
Pensions 21 6 - - 27
Cash flow hedges 14 -10 -16 - -12
Finance leases 8 -1 - - 7
Capitalized interest 10 0 - - 10
Other temporary differences 6 6 -1 - 11
Total deferred tax liabilities 289 25 -17 - 297
18 19 20 21 22 23 24 25 26 27 28 29 30 31 32 33 34 35
Note 27 continues
Neste Oil 2008

116 Consolidated financial statements
The movement in deferred tax assets and liabilities during 2007:
at 1 Jan 2007
Charged to Income
StatementCharged in
Equity
Exchange rate differences
and other changes
at 31 Dec 2007
Deferred tax assets
Tax loss carried forward 3 -3 - - 0
Provisions 4 -2 - - 2
Other temporary differences 1 4 - - 5
Total deferred tax assets 8 -1 - - 7
Deferred tax liabilities
Depreciation difference and untaxed reserves 167 44 - - 211
Excess of book basis over tax basis of property, plant and equipment 24 -5 - - 19
Pensions 19 2 - - 21
Cash flow hedges 10 0 4 - 14
Finance leases 6 2 - - 8
Capitalized interest 9 1 - - 10
Other temporary differences 4 2 - - 6
Total deferred tax liabilities 239 46 4 - 289
Deferred tax assets and liabilities are offset when there is a legally enforceable right to offset current tax assets against current tax liabili-ties and when the deferred income taxes relate to the same fiscal authority. Deferred tax assets and liabilities in the same jurisdictions amounting to EUR 13 million (2007: EUR 2 million) have been netted in the balance sheet.
Deferred tax assets
2008 2007
Deferred tax asset to be recovered after more than 12 months 10 5
Deferred tax asset to be recovered within 12 months 6 2
16 7
Deferred tax liabilities
2008 2007
Deferred tax liability to be recovered after more than 12 months 290 264
Deferred tax liability to be recovered within 12 months 7 25
297 289
Deferred income tax assets are recognized for tax loss carry forwards to the extent that realization of the related tax benefit through the future taxable profits is probable.
The deferred tax liability on undistributed earnings of subsidiaries has not been recognized in the consolidated balance sheet be-cause distribution of the earnings is controlled by the Group, and such distribution, which will realize a relevant tax effect, is not probable within foreseeable future. The Finnish dividend taxation system, which came into effect in the beginning of 2005, enables distribution of earnings in Finnish entities without any compensatory tax.
Notes: 1 2 3 4 5 6 7 8 9 10 11 12 13 14 15 16 17

117Consolidated financial statements
The nature of certain of Neste Oil's businesses exposes Neste Oil to risks of environmental costs and potential contingent liabilities aris-ing from the manufacture, use, storage, disposal and maritime and inland transport as well as sale of materials that may be considered to be contaminants when released into environment. Liability may arise also through the acquisition, ownership or operation of proper-ties or businesses.
29. Retirement benefit obligationsThe Group has several pension arrangements in different countries. In Finland, the statutory TyEL plan, as well as voluntary pension plans, are funded through Group's own pension fund 'Neste Oil Eläkesäätiö'. The fund is under the supervision of Financial Supervisory Authority. Since the employer has ultimate responsibility for the return of the plan assets, the funded portion of the TyEL and the future disability pensions are accounted for as a defined benefit plan under IAS 19. The Group also has a defined benefit plan in Belgium and in the UK. The unfunded portion of the Finnish TyEL as well as pension plans in other countries are defined contribution plans.
The Finnish TyEL plan is a statutory earnings-related plan, funded largely on a pay-as-you-go basis, although there is an element of advance funding. The benefits provided under TyEL are old age pensions, disability pensions, unemployment pensions, and survivors' pensions. The Group's voluntary pension plan grants additional pension benefits in excess of statutory benefits. The fund provides old age pensions, disability pensions, survivors' pensions, and funeral grants. The voluntary pension fund has been closed since 1 January 1994.
Defined benefit pension plansAmounts recognized in the income statement
2008 2007
Current service cost 17 14
Interest cost 31 27
Expected return on plan assets -46 -46
Net actuarial gains and losses recognized during the period 0 -3
Total included in personnel expenses (Note 9) 2 -8
Amounts recognized in the balance sheet
2008 2007
Present value of funded obligations 627 704
Fair value of plan assets -601 -781
26 -77
Unrecognized actuarial gains and losses -119 7
Net liability (+) / asset (-) -93 -70
28. Provisions
Environmental provisions
Provision to return emission
allowancesRestructuring
provisions Other provisions Total
At 1 January 2008 5 - - 3 8
Charged to income statement
Additional provisions 3 3 9 2 17
Amounts used during the period -1 - - 0 -1
At 31 December 2008 7 3 9 5 24
2008 2007
Current provisions 16 0
Non-current provisions 8 8
24 8
18 19 20 21 22 23 24 25 26 27 28 29 30 31 32 33 34 35
Note 29 continues
Neste Oil 2008
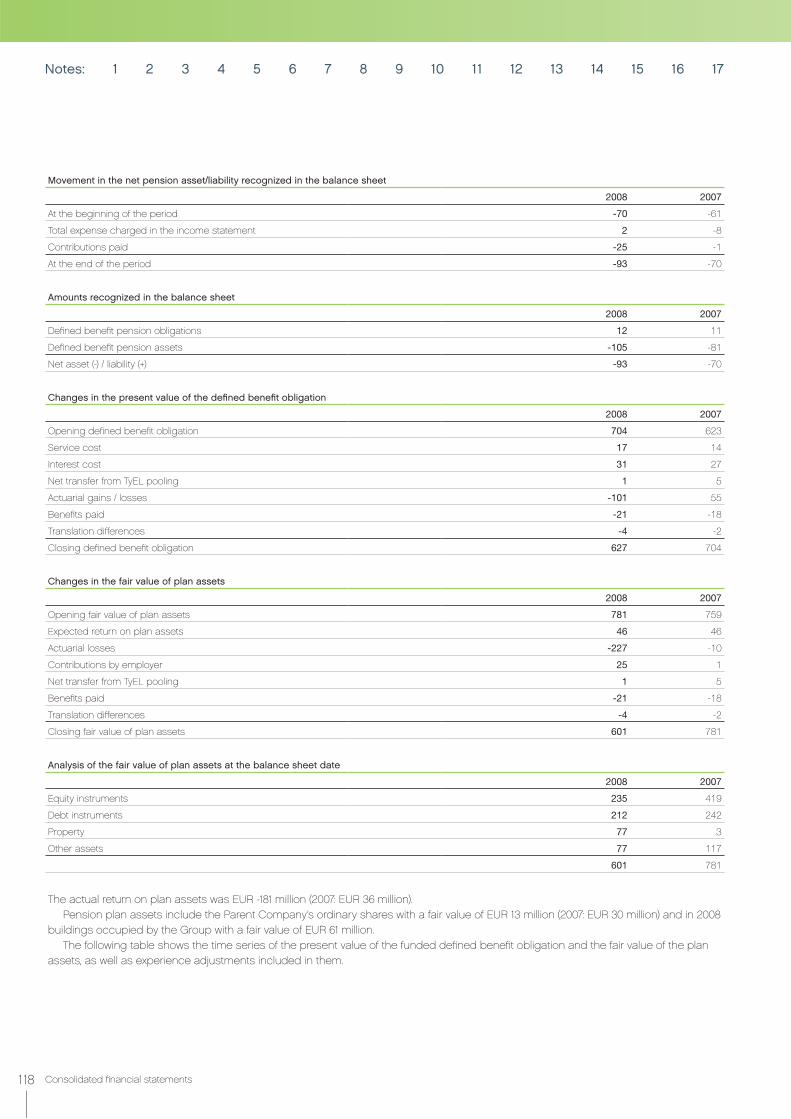
118 Consolidated financial statements
Movement in the net pension asset/liability recognized in the balance sheet
2008 2007
At the beginning of the period -70 -61
Total expense charged in the income statement 2 -8
Contributions paid -25 -1
At the end of the period -93 -70
Amounts recognized in the balance sheet
2008 2007
Defined benefit pension obligations 12 11
Defined benefit pension assets -105 -81
Net asset (-) / liability (+) -93 -70
Changes in the present value of the defined benefit obligation
2008 2007
Opening defined benefit obligation 704 623
Service cost 17 14
Interest cost 31 27
Net transfer from TyEL pooling 1 5
Actuarial gains / losses -101 55
Benefits paid -21 -18
Translation differences -4 -2
Closing defined benefit obligation 627 704
Changes in the fair value of plan assets
2008 2007
Opening fair value of plan assets 781 759
Expected return on plan assets 46 46
Actuarial losses -227 -10
Contributions by employer 25 1
Net transfer from TyEL pooling 1 5
Benefits paid -21 -18
Translation differences -4 -2
Closing fair value of plan assets 601 781
Analysis of the fair value of plan assets at the balance sheet date
2008 2007
Equity instruments 235 419
Debt instruments 212 242
Property 77 3
Other assets 77 117
601 781
The actual return on plan assets was EUR -181 million (2007: EUR 36 million).Pension plan assets include the Parent Company’s ordinary shares with a fair value of EUR 13 million (2007: EUR 30 million) and in 2008
buildings occupied by the Group with a fair value of EUR 61 million.The following table shows the time series of the present value of the funded defined benefit obligation and the fair value of the plan
assets, as well as experience adjustments included in them.
Notes: 1 2 3 4 5 6 7 8 9 10 11 12 13 14 15 16 17
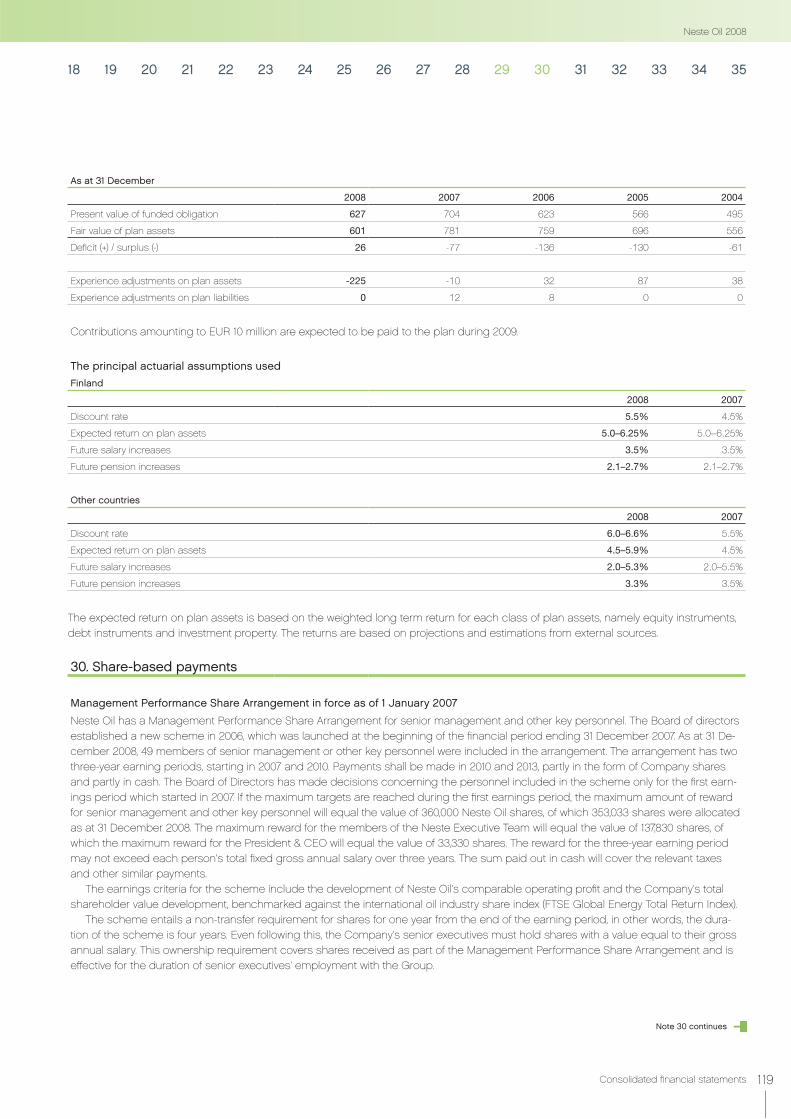
119Consolidated financial statements
As at 31 December
2008 2007 2006 2005 2004
Present value of funded obligation 627 704 623 566 495
Fair value of plan assets 601 781 759 696 556
Deficit (+) / surplus (-) 26 -77 -136 -130 -61
Experience adjustments on plan assets -225 -10 32 87 38
Experience adjustments on plan liabilities 0 12 8 0 0
Contributions amounting to EUR 10 million are expected to be paid to the plan during 2009.
The principal actuarial assumptions usedFinland
2008 2007
Discount rate 5.5% 4.5%
Expected return on plan assets 5.0–6.25% 5.0–6.25%
Future salary increases 3.5% 3.5%
Future pension increases 2.1–2.7% 2.1–2.7%
Other countries
2008 2007
Discount rate 6.0–6.6% 5.5%
Expected return on plan assets 4.5–5.9% 4.5%
Future salary increases 2.0–5.3% 2.0–5.5%
Future pension increases 3.3% 3.5%
The expected return on plan assets is based on the weighted long term return for each class of plan assets, namely equity instruments, debt instruments and investment property. The returns are based on projections and estimations from external sources.
30. Share-based payments
Management Performance Share Arrangement in force as of 1 January 2007
Neste Oil has a Management Performance Share Arrangement for senior management and other key personnel. The Board of directors established a new scheme in 2006, which was launched at the beginning of the financial period ending 31 December 2007. As at 31 De-cember 2008, 49 members of senior management or other key personnel were included in the arrangement. The arrangement has two three-year earning periods, starting in 2007 and 2010. Payments shall be made in 2010 and 2013, partly in the form of Company shares and partly in cash. The Board of Directors has made decisions concerning the personnel included in the scheme only for the first earn-ings period which started in 2007. If the maximum targets are reached during the first earnings period, the maximum amount of reward for senior management and other key personnel will equal the value of 360,000 Neste Oil shares, of which 353,033 shares were allocated as at 31 December 2008. The maximum reward for the members of the Neste Executive Team will equal the value of 137,830 shares, of which the maximum reward for the President & CEO will equal the value of 33,330 shares. The reward for the three-year earning period may not exceed each person's total fixed gross annual salary over three years. The sum paid out in cash will cover the relevant taxes and other similar payments.
The earnings criteria for the scheme include the development of Neste Oil's comparable operating profit and the Company's total shareholder value development, benchmarked against the international oil industry share index (FTSE Global Energy Total Return Index).
The scheme entails a non-transfer requirement for shares for one year from the end of the earning period, in other words, the dura-tion of the scheme is four years. Even following this, the Company's senior executives must hold shares with a value equal to their gross annual salary. This ownership requirement covers shares received as part of the Management Performance Share Arrangement and is effective for the duration of senior executives' employment with the Group.
18 19 20 21 22 23 24 25 26 27 28 29 30 31 32 33 34 35
Note 30 continues
Neste Oil 2008

120 Consolidated financial statements
Assumptions used in calculating the value of the reward
2008 2007
Amount of granted shares at the beginning of the period, maximum reward 319,000 0
Amount of shares granted during the period, maximum reward 62,363 329,000
Adjustments to the amount of shares -28,330 -10,000
Amount of granted shares at the end of the period, maximum reward 353,033 319,000
Number of participants at the end of the financial period 49 49
Share price at the end of the financial period, euros 10.58 24.13
Estimated rate of realization of the earnings criteria, % 58% 60%
Estimated termination rate before the end of the restriction period, % 10% 10%
An estimate of the realization of the earnings criteria, 58% (2007: 60%), as well as an estimate of the termination rate, 10% (2007 10%) were made at grant date. The estimate regarding the total shareholder value development is based on Monte Carlo simulation, using Neste Oil's share and FTSE Global Energy Total Return Index historical total shareholder return and volatilities. The estimated rate of realization regarding the development of Neste Oil's comparable operating profit is based on the most recent financial estimates and market analy-sis, which were available for the financial periods 2007–2009 at the grant date.
Management Performance Share Arrangement in force as at 31 December 2007 and during previous accounting periodsThe previous Management Performance Share Arrangement was in force during the financial period ended 31 December 2007 and previous financial periods. The criteria used in respect of the previous scheme were based on each participant's performance and their success in meeting their personal targets, as well as the targets set for the Company's financial performance and success. Approximately 60 members participated in the arrangement.
The arrangement was divided into individual performance share plans, with a new plan being introduced annually and each plan having a duration of approximately six years. The Board decided annually as to the inclusion of participants in commencing performance share plans. Each performance share plan begun with a three-year earning period, during which a participant accumulates annual bonus percentages, followed by a three-year restriction period, at the end of which a participant received a pre-determined number of Neste Oil shares. The maximum value in shares a participant could be granted after the first three years was equal to one year’s salary (incl. fringe benefits). The actual final value of each share plan was always dependent on the performance of Neste Oil and each individual during the earning period, as well as the Neste Oil share price development over the course of the restriction period.
The following terms and the assumptions have been used in accounting for the performance share plan:
Grant dates and prices during the financial period 2008
Grant dates 2 Jan 2008 23 April 2008 1 Dec 2008
Grant prices, euros 22.80 19.50 10.44
Share price as at grant date, euros 24.90 20.60 11.54
Grant dates and prices during the financial period 2007
Grant dates 2 Jan 2007 25 April 2007
Grant prices, euros 20.13 24.57
Share price as at grant date, euros 23.13 26.67
The grant price, i.e. fair value at grant date, has been determined as follows: grant price equals the share price as at grant date deducted by expected dividends payable during the three year earnings period 2007–2009.
Term of the plan
Beginning of earnings period 1 Jan 2007
End of earnings period 31 Dec 2009
End of restriction period 31 Dec 2010
Notes: 1 2 3 4 5 6 7 8 9 10 11 12 13 14 15 16 17

121Consolidated financial statements
2008 2007 2006 2005
Grant date - 19 Feb 2007 23 Feb 2006 11 Feb 2005
Grant price, euros - 23.85 25.02 15.00
Estimated termination rate before the end of the restriction period, % 3% 3% 3% 3%
Share price at the end of the financial period, euros 10.58 24.13 23.03 23.88
Number of share participations at the beginning of the period 731,466 393,693 217,047 0
Number of share participations granted during the period - 358,789 177,174 217,047
Adjustments to the number of share participations granted initially -11,213 -21,016 -528 -
Number of shares delivered during the period -205,899 0 0 0
Total number of granted share participations outstanding at the end of the period 514,354 731,466 393,693 217,047
The number of shares granted after the three-year earning period (share participation) was based on the annual bonus percentages accumulated over those three years. In order to determine the number of shares, the participant’s annual salary was multiplied by the cumulative annual bonus percentages, and this figure was divided by the grant price. The number of shares granted under each annual share plan was adjusted during the restriction period by potential dividends paid up until the share delivery, which takes place at the end of the restriction period. After deducting taxes and other charges payable by the participants the final number of shares will be dimin-ished to approximately 50% of the granted number. The first plan began in 2002, when Neste Oil was part of Fortum Group. The shares earned during 2002-2004 were converted from Fortum shares to Neste Oil shares in 2005.
As at 31 December 2008, four separate plans were in place, which had started in 2003, 2004, 2005 and 2006. Concerning the 2003 plan, the earnings period ended on 31 December 2005. In December 2006 the Board of Directors decided that no new plans will com-mence in 2007, and that the earnings period for all remaining plans would end as at 31 December 2006. As a result, the earnings period for the plans started in 2005 and 2006 were two years and one year respectively. The restriction period for the 2004, 2005 and 2006 plans is 2007–2009. As at 31 December 2008 the members of Neste Executive Team had been granted share participations equivalent to a total number of 105,796 shares as part of the above described scheme.
The first delivery of shares to the participants took place in February 2008, and a reward equaling the gross amount of 205,899 shares, or EUR 4 million, was paid. The net amount shares delivered to the participants totaled 110,219 shares and the rest of the reward was paid in cash to cover taxes and other charges payable by the participants. The fair value of the share as at delivery date was 20.39 euros. The members of Neste Executive Team received a reward equaling the gross amount of 48,654 shares.
The following terms and assumptions have been used in accounting for the performance share plan. The assumptions included in each column are those concerning the share participations granted during that financial period.
After deducting taxes and other charges payable by the participants the actual number of shares to be delivered to the participants will be approximately 50% of the granted amounts presented in the table above.
The grant price for the purpose of determining the number of shares allocated as a share participation was the trade-weighted aver-age price of the Company's share as quoted on Helsinki Exchange during the last five trading days preceding the grant date. The shares granted during the financial period ended 31 December 2005 were originally granted as shares of Fortum Corporation, since Neste Oil was part of Fortum Group at that time. These Fortum shares were converted into shares of Neste Oil Corporation when Neste Oil was spun off from the Fortum Group. The conversion was based on the share price of Fortum Corporation at the time of the spin off (11.58 euros) and the IPO selling price of the Neste Oil share (15 euros).
18 19 20 21 22 23 24 25 26 27 28 29 30 31 32 33 34 35
Note 30 continues
Neste Oil 2008

122 Consolidated financial statements
The expense included in the income statement is specified in the following table.
2008 2007
Expense recognized in the income statement 4 4
Change in fair value of the liability recognized in the balance sheet -5 1
Total expense charged to the income statement -1 5
Change in fair value of the hedging instrument 10 -1
Net effect of share based payments in the income statement 9 4
The liability recognized in the balance sheet related to share based payments amounted to EUR 2 million (2007: EUR 6 million). The remaining amount of the expense to be recognized during the financial periods 2008, 2009 and 2010 amounted to EUR 3 million as at 31 December 2008. The actual amount may differ from this estimate.
HedgingThe Group hedges its exposure to the share price development during the time period between the grant date and the delivery date concerning both Performance Share Arrangements. The hedging arrangement concerning the new Management Performance Share Arrangement is accounted for as treasury shares and has been described in detail in Note 25.
The previous Management Performance Share Arrangement is hedged using a net cash settled share forward. The hedge covers both the equity settled and the cash settled portions of the earned bonus. The hedging instrument is measured at fair value at each reporting date and the change in the fair value of the hedging instrument is recognized in the income statement to offset the change in the fair value of the bonus liability. The nominal and fair value of the hedging instrument is disclosed in Note 24.
Accounting treatmentThe performance share arrangements are accounted for as a share based transaction with cash alternative. The portion of the earned bonus (approximately 50%) for which the participants will receive shares of Neste Oil is accounted for as an equity settled transaction, and the portion of the earned bonus to be settled in cash to cover tax and other charges payable by the participants (approximately 50%), is accounted for as a cash settled transaction. The earned bonuses are entered into the income statement spread over the earnings period and restriction period. In respect of the equity settled portion, the amounts recognized in the income statement are accumulated in equity; and in respect of the cash settled portion, a respective liability is entered into the balance sheet. The liability is measured at fair value at each reporting date, and the respective change in the fair value is reflected in operating profit in the income statement.
Notes: 1 2 3 4 5 6 7 8 9 10 11 12 13 14 15 16 17
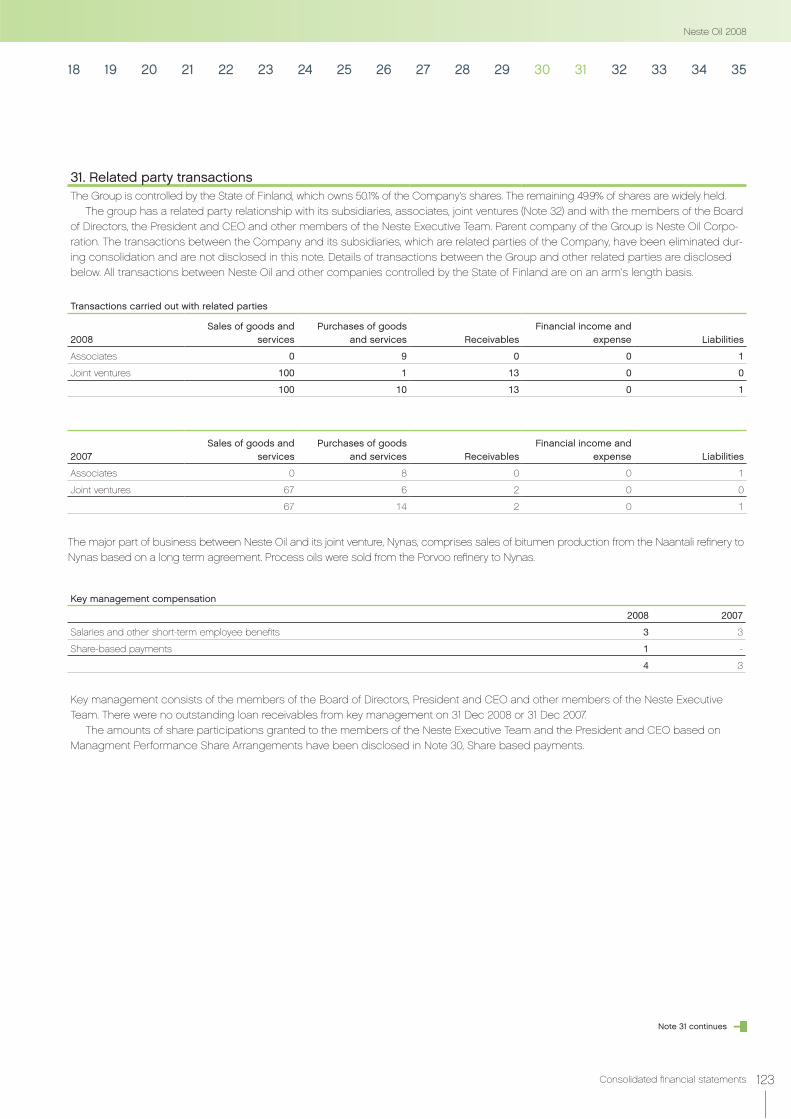
123Consolidated financial statements
31. Related party transactionsThe Group is controlled by the State of Finland, which owns 50.1% of the Company’s shares. The remaining 49.9% of shares are widely held.
The group has a related party relationship with its subsidiaries, associates, joint ventures (Note 32) and with the members of the Board of Directors, the President and CEO and other members of the Neste Executive Team. Parent company of the Group is Neste Oil Corpo-ration. The transactions between the Company and its subsidiaries, which are related parties of the Company, have been eliminated dur-ing consolidation and are not disclosed in this note. Details of transactions between the Group and other related parties are disclosed below. All transactions between Neste Oil and other companies controlled by the State of Finland are on an arm's length basis.
Transactions carried out with related parties
Sales of goods and services
Purchases of goods and services Receivables
Financial income and expense Liabilities2008
Associates 0 9 0 0 1
Joint ventures 100 1 13 0 0
100 10 13 0 1
Sales of goods and services
Purchases of goods and services Receivables
Financial income and expense Liabilities2007
Associates 0 8 0 0 1
Joint ventures 67 6 2 0 0
67 14 2 0 1
The major part of business between Neste Oil and its joint venture, Nynas, comprises sales of bitumen production from the Naantali refinery to Nynas based on a long term agreement. Process oils were sold from the Porvoo refinery to Nynas.
Key management compensation
2008 2007
Salaries and other short-term employee benefits 3 3
Share-based payments 1 -
4 3
Key management consists of the members of the Board of Directors, President and CEO and other members of the Neste Executive Team. There were no outstanding loan receivables from key management on 31 Dec 2008 or 31 Dec 2007.
The amounts of share participations granted to the members of the Neste Executive Team and the President and CEO based on Managment Performance Share Arrangements have been disclosed in Note 30, Share based payments.
18 19 20 21 22 23 24 25 26 27 28 29 30 31 32 33 34 35
Note 31 continues
Neste Oil 2008

124 Consolidated financial statements
32. Group companies on 31 December 2008
Subsidiaries Group holding%Country of
incorporation
Kide Automaatit Oy 100.00% Finland
Kotka Control Oy 3) 100.00% Finland
Neste Canada Inc. 100.00% Canada
Neste Crude Oil Inc. 100.00% USA
Neste Eesti AS 100.00% Estonia
Neste Jacobs Oy 60.00% Finland
Neste LPG AB 100.00% Sweden
Neste Markkinointi Oy 100.00% Finland
Neste Oil AB 100.00% Sweden
Neste Oil BR Ltd 100.00% Belarus
Neste Oil Components Finance B.V 100.00% The Netherlands
Neste Oil Finance B.V 100.00% The Netherlands
Neste Oil Holding (U.S.A.) Inc. 100.00% USA
Neste Oil Insurance Ltd 100.00% Guernsey
Neste Oil Ltd 100.00% Great Britain
Neste Oil Netherlands B.V 2) 100.00% The Netherlands
Neste Oil N.V. 100.00% Belgium
Neste Oil Portugal S.A. 100.00% Portugal
Neste Oil Renewable Fuels Oy 1) 100.00% Finland
Neste Oil Services Inc. 100.00% USA
Neste Oil Singapore Pte Ltd 100.00% Singapore
Compensation to President and CEO, Board of Directors and Supervisory Board, EUR
2008 2007
Matti Lievonen, President and CEO as of 1 December 2008 50,040 -
Risto Rinne, President and CEO until 30 September 2008 562,575 774,154
Board of Directors
Timo Peltola, chairman 75,050 62,500
Mikael von Frenckell, vice chairman 59,200 49,500
Michiel A. M. Boersma 56,450 32,500
Ainomaija Haarla 45,850 37,500
Kari Jordan - 9,000
Juha Laaksonen - 10,000
Nina Linander 51,650 42,500
Antti Tanskanen 43,450 24,500
Markku Tapio 34,950 -
Pekka Timonen 8,500 37,000
Maarit Toivanen-Koivisto 43,450 37,000
Board of Directors, all members total 418,550 342,000
Supervisory Board, all members total 61,600 62,000
Compensation to the Board of Directors include annual remuneration and meeting fee paid to each member of the Board for each meeting attended as well as for any meetings of the Board committees attended.
In the event the Company decides to give notice of termination to the President and Chief Executive Officer, he will be entitled to com-pensation equalling 24 months' salary. The retirement age of the President and CEO is 60, and the pension paid is 60% of his salary.
Notes: 1 2 3 4 5 6 7 8 9 10 11 12 13 14 15 16 17

125Consolidated financial statements
Subsidiaries Group holding%Country of
incorporation
Neste Oil (Suisse) S.A. 2) 100.00% Switzerland
Neste Oil US Inc. 1) 100.00% USA
Neste Petroleum Inc. 100.00% USA
Neste Polska Sp.z.oo 100.00% Poland
Neste Shipping Oy 100.00% Finland
Neste St. Petersburg OOO 100.00% Russia
Neste Trading (U.S.A.) Inc. 100.00% USA
Neste USA, L.L.C. 100.00% USA
Reola Gaas AS 93.85% Estonia
Rintekno Oy 3) 100.00% Finland
Rintekno AB 3) 100.00% Sweden
SIA Neste Latvija 100.00% Latvia
SIA Saskidrinata Naftas Gaze 100.00% Latvia
Systecon Inc. 3) 100.00% USA
Systecon Oy 3) 100.00% Finland
Turun Sähkösuunnittelu Oy 3) 100.00% Finland
UAB Neste Lietuva 100.00% Lithuania
US Active Oy 100.00% Finland
Associated companies Group holding%Country of
incorporation
Alberta Envirofuels Inc. 50.00% Canada
Innogas Oy AB 50.00% Finland
Nemarc Shipping Oy 50.00% Finland
Neste Arabia Co. Ltd 48.00% Saudi-Arabia
Oy Atlas-Öljy AB 40.00% Finland
Porvoon Alueverkko Oy 33.33% Finland
Repsol Producao de Electricidade e Calor, Ace 33.33% Portugal
Svartså Vattenverk - Mustijoen Vesilaitos 40.00% Finland
Tahkoluodon Polttoöljy Oy 31.50% Finland
Tapaninkylän Liikekeskus Oy 40.03% Finland
Vaskiluodon Kalliovarasto Oy 50.00% Finland
Joint ventures Group holding%Country of
incorporation
Glacia Ltd 50.00% Bermuda
Lacus Ltd 50.00% Bermuda
NSE Biofuels Oy Ltd 50.00% Finland
Nynas AB 1) 49.99% Sweden
Terra Ltd 50.00% Bermuda
1) Name change during the financial period2) Founded during the financial period3) Acquired during the financial period
18 19 20 21 22 23 24 25 26 27 28 29 30 31 32 33 34 35
Neste Oil 2008

126 Consolidated financial statements
33. Contingencies and commitments
Contingent liabilities
2008 2007
Debt Value of collateral Debt Value of collateral
On own behalf for debt
Pledged assets - - 1 2
Total - - 1 2
On own behalf for commitments
Real estate mortgages 26 26
Pledged assets 3 2
Other contingent liabilities 37 42
Total 66 70
On behalf of associates and joint ventures
Guarantees 5 2
Other contingent liabilities 2 1
Total 7 3
On behalf of others
Guarantees 12 12
Total 12 12
- 85 1 87
Operating lease liabilities
2008 2007
Due within one year 106 108
Due between one and five years 262 183
Due later than five years 465 119
833 410
Operating leases
Lease rental expenses amounting to EUR 132 million (2007: EUR 137 million) relating to the lease (under operating leases) of property, plant and equipment are included in the income statement in other expenses.
Commitments
2008 2007
Commitments for purchase of property, plant and equipment 540 88
Commitments for purchase of intangible assets 0 0
540 88
Other contingent liabilities
Neste Oil Corporation has a collective contingent liability with Fortum Heat and Gas Oy related to liabilities of the demerged Fortum Oil and Gas Oy (30 April 2004) based on Chapter 17 Paragraph 16.6 of the Finnish Companies Act.
Notes: 1 2 3 4 5 6 7 8 9 10 11 12 13 14 15 16 17

127Consolidated financial statements
34. Disputes and potential litigationsSome Group companies are involved in legal proceedings or disputes incidental to their business. In management's opinion, the outcome of these cases is not likely to have material effect on Group's financial position. The Group is also involved as a claimant or defendant in certain potential legal disputes, whose outcomes are difficult to predict.
Neste Oil has clarified its claims against YIT Industrial and Network Services to total some EUR 107 million in a contract dispute that was put before the Court of Arbitration in April 2008. Neste Oil's claims against YIT consist of damages based on contract delays, now specified at approximately EUR 38.5 million, and damages valued at some EUR 68.5 million resulting from subsequent lost production. The dispute between Neste Oil and YIT relates to disagreements related to the final financial settlement of mechanical installation work on diesel production line 4, which was completed and came on stream at Neste Oil's Porvoo oil refinery in the summer of 2007. YIT has lodged counter-claims against Neste Oil totaling some EUR 25 million, primarily based on work carried out under the contract and the additional costs incurred due to the prolongation of the project. Both parties contest each other's claims.
35. Events after the balance sheet dateThe Group will reorganize its operations around three business areas and seven common functions, and will introduce a new organiza-tion reflecting this on 1 April 2009. The new business areas will act as profit centers and will be responsible for their customers, products, and business development. The new business areas are as follows: Oil Products, Renewable Fuels, and Oil Retail. Activities outside these business areas will be grouped under Others. The new common functions will be: Production & Logistics, Finance, Human Resources, HSE, Technology & Strategy, Communications, and Legal Affairs.
The Specialty Products Division will be amalgamated into the Oil Products business area. Shipping operations will be reported in con-nection with the business areas that use them, and the Shipping business incorporated into Production & Logistics.
Neste Oil’s financial reporting will be based on these business areas.
18 19 20 21 22 23 24 25 26 27 28 29 30 31 32 33 34 35
Neste Oil 2008

128 Parent company financial statements
Parent company income statement
MEUR Note 1 Jan–31 Dec 2008 1 Jan–31 Dec 2007
Net sales 2 12,398 9,254
Change in product inventories and work in progress -99 90
Other operating income 3 31 18
Materials and services 4 -11,499 -8,133
Personnel expenses 5 -173 -144
Depreciation, amortization and write-downs 6 -136 -120
Other operating expenses 7 -420 -344
Operating profit 102 621
Financial income and expenses 8 -4 246
Profit before extraordinary items 98 867
Extraordinary items 9 19 23
Profit before appropriations and taxes 117 890
Appropriations 10 -89 -158
Income tax expense 11 1 -111
Profit for the year 29 621

129Parent company financial statements
Parent company balance sheet
MEUR Note 31 Dec 2008 31 Dec 2007
ASSETS
Fixed assets and other long-term investments 12,13
Intangible assets 21 22
Tangible assets 1,723 1,802
Other long-term investments
Shares in group companies 888 474
Shares in associated companies 1 1
Other shares and holdings 253 194
2,886 2,493
Current assets
Inventories 14 444 755
Long-term receivables 15 4 3
Short-term receivables 16 713 831
Cash and cash equivalents 6 10
1,167 1,599
Total assets 4,053 4,092
SHAREHOLDERS’ EQUITY AND LIABILITIES
Shareholders’ equity 17
Share capital 40 40
Retained earnings 947 583
Profit for the year 29 621
1,016 1,244
Accumulated appropriations 18 773 699
Provisions for liabilities and charges 19 18 12
Liabilities 20
Long-term liabilities 1,209 825
Short-term liabilities 1,037 1,312
2,246 2,137
Total equity and liabilities 4,053 4,092
Neste Oil 2008

130 Parent company financial statements
Parent company cash flow statement
MEUR 1 Jan–31 Dec 2008 1 Jan–31 Dec 2007
Cash flows from operating activities
Profit before extraordinary items 98 867
Depreciation, amortization and write-downs 136 120
Other non-cash income and expenses 10 -6
Financial income and expenses 4 -246
Divesting activities, net -12 -2
Operating cash flow before change in working capital 236 733
Change in working capital
Decrease (+) / increase (-) in interest-free receivables 156 -41
Decrease (+) / increase (-) in inventories 292 -283
Decrease (-) / increase (+) in interest-free liabilities -276 169
Change in working capital 172 -155
Cash generated from operations 408 578
Interest and other financial expenses paid, net -50 -47
Dividends received 39 36
Income taxes paid -54 -153
Realized foreign exchange gains and losses -5 -22
Group contributions received, net 23 23
Net cash from operating activities 361 415
Cash flows from investing activities
Capital expenditure -217 -250
Proceeds from sale of fixed assets 5 6
Investments in shares in subsidiaries -300 -49
Proceeds from sale of shares in subsidiaries - 2
Proceeds from sale of other shares 12 -
Change in other investments, increase (-)/decrease (+) -1 -81
Net cash used in investing activities -501 -372
Cash flow before financing activities -140 43
Cash flows from financing activities
Proceeds from long-term liabilities 1,573 726
Payments of long-term liabilities -1,108 -436
Change in short-term liabilities -72 -112
Dividends paid -257 -231
Cash flow from financing activities 136 -53
Net increase (+) / decrease (-) in cash and cash equivalents -4 -10
Cash and cash equivalents at the beginning of the period 10 20
Cash and cash equivalents at the end of the period 6 10
Net increase (+) / decrease (-) in cash and cash equivalents -4 -10
.

131Parent company financial statements
1. Accounting policiesThe financial statements of Neste Oil Corporation (Parent company) are prepared in accordance with Finnish GAAP. The financial state-ments are presented in millions of euros unless otherwise stated.
Net salesNet sales include sales revenues from actual operations and exchange rate differences on trade receivables, less discounts, indirect taxes such as value added tax and excise tax payable by the manufacturer and statutory stockpiling fees. Trading sales include the value of physical deliveries and the net result of deriva-tive financial instruments.
Other operating incomeOther operating income includes gains on the sales of fixed assets and contributions received as well as all other operating income not related to the sales of products or services, such as rents.
Foreign currency itemsTransactions denominated in foreign currencies have been valued using the exchange rate at the date of the transaction. Receiv-ables and liabilities denominated in foreign currencies outstanding on the balance sheet date have been valued using the exchange rate quoted on the balance sheet date. Exchange rate differences have been entered in the income statement. Net exchange rate differences relating to financing have been entered in financial income or expenses.
Derivative financial instrumentsNeste Oil uses derivative financial instruments mainly to hedge oil price, foreign exchange and interest rate exposures.
Oil commodity derivative contracts hedging future cash flow are booked once the underlying exposure occurs. Unrealized losses on derivatives held for trading purposes are booked immediately, but gains are booked only at maturity or when the open exposure is closed with a similar instrument.
There are two different types of foreign exchange derivative contracts: hedges for future cash flow and hedges of balance sheet items. Gains or losses on derivative financial instrument that hedge future cash flows are recognized once the underly-ing income or expense occurs. Derivative financial instruments used to hedge balance sheet items e.g. bank accounts, loans or receivables are valued employing the exchange rate quoted on the balance sheet date, and gains or losses are recognized in the income statement. The interest element on all forward contracts is accrued. Option premiums are treated as advances paid or received until the option matures.
Gains or losses for derivative financial instrument used to hedge the interest rate risk exposure are accrued over the period to maturity and are recognized as an adjustment to the interest income or expense of the underlying liabilities.
Fixed assets and depreciationThe balance sheet value of fixed assets consists of historical costs less depreciation according to plan and other possible write-offs, plus revaluation permitted by local regulations. Fixed assets are depreciated using straight-line depreciation based on the expected useful life of the asset. Land areas are not depreciated. The depreciation is based on the following expected useful lives:
Buildings and structures 20–40 yearsProduction machinery and equipment 15–20 yearsOther equipment and vehicles 3–15 yearsOther tangible assets 20–40 yearsIntangible assets 3–10 years
InventoriesInventories have been valued on the FIFO principle at the lower of direct acquisition cost or market value, taking into account the impact of possible hedging operations.
Research and developmentResearch and development expenditures are expensed as incurred with the exception of investments in buildings and equip-ment.
Pension expensesStatutory pension obligations are covered through a compulsory pension insurance policy. Payments to Group's pension fund are recorded in the income statement in amounts determined by the pension fund according to the actuarial assumptions pursuant to the Finnish Employee's Pension Act. The liabilities on pensions granted by the Company itself have been entered as a provision in the balance sheet.
Extraordinary itemsExtraordinary items consist of received or given group contribu-tions from or to Neste Oil Group companies.
Deferred taxesDeferred taxes are determined on the basis of temporary differ-ences between the financial statement and tax bases of assets and liabilities. Deferred income tax is determined using tax rates that have been enacted at the balance sheet date and are ex-pected to apply.
ProvisionsForeseeable future expenses and losses that have no correspond-ing revenue and which Neste Oil Corporation is committed or obliged to settle, and whose monetary value can reasonably be assessed, are entered as expenses in the income statement and included as provisions in the balance sheet. These items include expenses relating to the pension liabilities, guarantee obligations, expenses relating to the future clean-up of proven environmental damage and obligation to return emission allowances. Provisions are recorded based on management estimates of the future obligation.
Notes to the parent company financial statements
Notes: 1 2 3 4 5 6 7 8 9 10 11 12 13 14 15 16 17 18 19 20 21 22 23 24
Neste Oil 2008

132 Parent company financial statements
2. Net sales
Net sales by segment
2008 2007
Oil Refining 12,127 8,982
Renewable Fuels 69 39
Specialty Products 356 373
Oil Retail 1 1
Other 42 23
Eliminations -197 -164
12,398 9,254
Net sales by market area
2008 2007
Finland 5,376 4,212
Other Nordic countries 1,374 1,254
Baltic countries, Russia and Poland 816 450
Other European countries 3,434 2,285
North and South America 1,357 1,040
Other countries 41 13
12,398 9,254
3. Other operating income2008 2007
Rental income 9 8
Gains on sale of subsidiaries - 2
Gains on sale of other shares 12 -
Government grants 3 1
Other 7 7
31 18
4. Materials and services2008 2007
Materials and supplies
Purchases during the period 11,305 8,325
Change in inventories 193 -193
11,498 8,132
External services 1 1
11,499 8,133
Notes: 1 2 3 4 5 6 7 8 9 10 11 12

133Parent company financial statements
5. Staff costs 2008 2007
Wages, salaries and remunerations 127 118
Indirect employee costs
Pension costs 34 13
Other indirect employee costs 12 13
173 144
Salaries and remuneration
Key management compensations are presented in Note 31 in the Neste Oil Group consolidated financial statements.
Average number of employees
2008 2007
Oil Refining 1,847 1,799
Renewable Fuels - 26
Specialty Products 30 22
Other 504 423
2,381 2,270
6. Depreciation, amortization and write-downs2008 2007
Depreciation according to plan 135 118
Write-offs 1 2
136 120
7. Other operating expenses2008 2007
Operating leases and other property costs 18 15
Freights relating to sales 138 118
Repairs and maintenance 89 73
Other 175 138
420 344
Other operating expenses include write-offs and losses on sales of tangible assets 3 0
Fees charged by the statutory auditor, EUR thousands
2008 2007
Audit fees 289 286
Auditor's mandatory opinions 4 -
Tax advisory 133 -
Other advisory services 839 74
1,265 360
13 14 15 16 17 18 19 20 21 22 23 24
Neste Oil 2008

134 Parent company financial statements
8. Financial income and expenses2008 2007
Dividend income
From Group companies 39 305
Dividend income total 39 305
Interest income from long-term loans and receivables
From Group companies 2 1
Interest income from long-term loans and receivables total 2 1
Other interest and financial income
From Group companies 4 4
Other 3 4
Other interest and financial income total 7 8
Interest expenses and other financial expenses
To Group companies -13 -15
Other -52 -39
Interest expenses and other financial expenses total -65 -54
Exchange rate differences 13 -14
Financial income and expenses total -4 246
Total interest income and expenses
2008 2007
Interest income 9 9
Interest expenses -62 -52
Net interest expenses -53 -43
9. Extraordinary items2008 2007
Extraordinary income
Group contributions 19 23
10. Appropriations
Change in depreciation difference
2008 2007
Difference between depreciation according to plan and depreciation in taxation -89 -158
11. Income tax expense2008 2007
Income taxes on regular business operations -4 102
Income taxes on extraordinary items 5 6
Change in deferred tax assets -2 3
-1 111
Notes: 1 2 3 4 5 6 7 8 9 10 11 12
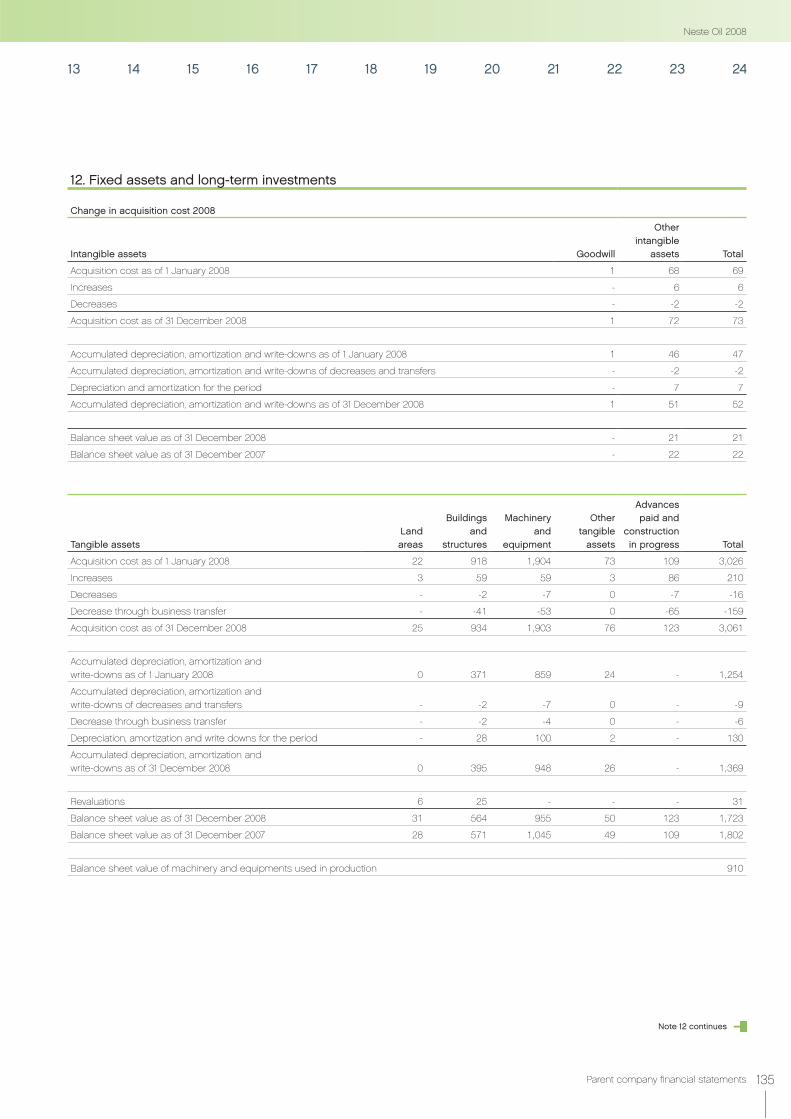
135Parent company financial statements
12. Fixed assets and long-term investments
Change in acquisition cost 2008
Intangible assets Goodwill
Other intangible
assets Total
Acquisition cost as of 1 January 2008 1 68 69
Increases - 6 6
Decreases - -2 -2
Acquisition cost as of 31 December 2008 1 72 73
Accumulated depreciation, amortization and write-downs as of 1 January 2008 1 46 47
Accumulated depreciation, amortization and write-downs of decreases and transfers - -2 -2
Depreciation and amortization for the period - 7 7
Accumulated depreciation, amortization and write-downs as of 31 December 2008 1 51 52
Balance sheet value as of 31 December 2008 - 21 21
Balance sheet value as of 31 December 2007 - 22 22
Tangible assetsLandareas
Buildings and
structures
Machinery and
equipment
Othertangible
assets
Advancespaid and
constructionin progress Total
Acquisition cost as of 1 January 2008 22 918 1,904 73 109 3,026
Increases 3 59 59 3 86 210
Decreases - -2 -7 0 -7 -16
Decrease through business transfer - -41 -53 0 -65 -159
Acquisition cost as of 31 December 2008 25 934 1,903 76 123 3,061
Accumulated depreciation, amortization and write-downs as of 1 January 2008 0 371 859 24 - 1,254
Accumulated depreciation, amortization and write-downs of decreases and transfers - -2 -7 0 - -9
Decrease through business transfer - -2 -4 0 - -6
Depreciation, amortization and write downs for the period - 28 100 2 - 130
Accumulated depreciation, amortization and write-downs as of 31 December 2008 0 395 948 26 - 1,369
Revaluations 6 25 - - - 31
Balance sheet value as of 31 December 2008 31 564 955 50 123 1,723
Balance sheet value as of 31 December 2007 28 571 1,045 49 109 1,802
Balance sheet value of machinery and equipments used in production 910
13 14 15 16 17 18 19 20 21 22 23 24
Note 12 continues
Neste Oil 2008

136 Parent company financial statements
Shares in group
companies
Receivables from group companies
Shares in associated companies
Receivables from
associatedcompanies
Othershares and
holdingsOther
receivables TotalOther long-term investments
Acquisition cost as of 1 January 2008 474 179 1 0 1 14 669
Increases 414 60 - 0 0 - 474
Decreases - - - 0 -1 0 -1
Acquisition cost as of 31 December 2008 888 239 1 0 0 14 1,142
Accumulated depreciation, amortization and write-downs as of 1 January 2008 - - - 0 0 0 0
Accumulated depreciation, amortization and write-downs of decreases and transfers - - - - 0 - 0
Accumulated depreciation, amortization and write-downs as of 31 December 2008 - - - 0 0 0 0
Balance sheet value as of 31 December 2008 888 239 1 0 0 14 1,142
Balance sheet value as of 31 December 2007 474 179 1 0 1 14 669
Interest-bearing and interest-free receivables 2008 2007
Interest-bearing receivables 226 181
Interest-free receivables 27 12
253 193
13. RevaluationsRevaluations
as of Jan 1 Increases DecreasesRevaluations as of Dec 31
Land areas 6 - - 6
Buildings 25 - - 25
Total revaluations 31 - - 31
Policies and principles for revaluations and evaluation methods
The revaluations are based on fair values at the moment of revaluation. Deferred taxes have not been booked on revaluations.
14. Inventories2008 2007
Raw materials and supplies 163 345
Work in progress 202 172
Products/finished goods 79 238
444 755
Replacement value of inventories 444 831
Book value of inventories 444 755
Difference 0 76
15. Long-term receivables2008 2007
Deferred tax assets 4 3
Notes: 1 2 3 4 5 6 7 8 9 10 11 12
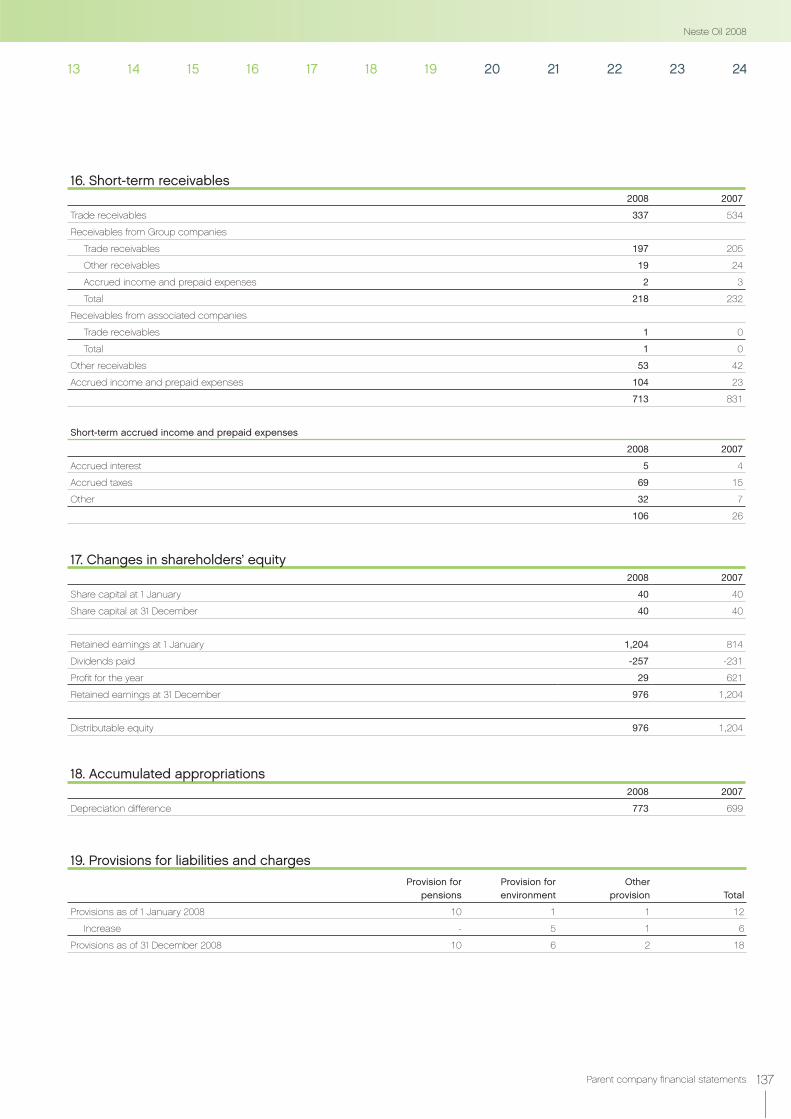
137Parent company financial statements
16. Short-term receivables2008 2007
Trade receivables 337 534
Receivables from Group companies
Trade receivables 197 205
Other receivables 19 24
Accrued income and prepaid expenses 2 3
Total 218 232
Receivables from associated companies
Trade receivables 1 0
Total 1 0
Other receivables 53 42
Accrued income and prepaid expenses 104 23
713 831
Short-term accrued income and prepaid expenses
2008 2007
Accrued interest 5 4
Accrued taxes 69 15
Other 32 7
106 26
17. Changes in shareholders’ equity2008 2007
Share capital at 1 January 40 40
Share capital at 31 December 40 40
Retained earnings at 1 January 1,204 814
Dividends paid -257 -231
Profit for the year 29 621
Retained earnings at 31 December 976 1,204
Distributable equity 976 1,204
18. Accumulated appropriations2008 2007
Depreciation difference 773 699
19. Provisions for liabilities and chargesProvision for
pensionsProvision forenvironment
Otherprovision Total
Provisions as of 1 January 2008 10 1 1 12
Increase - 5 1 6
Provisions as of 31 December 2008 10 6 2 18
13 14 15 16 17 18 19 20 21 22 23 24
Neste Oil 2008

138 Parent company financial statements
20. Liabilities
Long-term liabilities
2008 2007
Bonds 120 200
Loans from financial institutions 709 349
Pension loans 20 38
Liabilities to Group companies
Other long-term liabilities 355 232
Accruals and deferred income 5 6
1,209 825
Interest-bearing liabilities due after five years
2008 2007
Loans from financial institutions 242 230
Pension loans 20 38
Liabilities to Group companies 355 232
617 500
Short-term liabilities
2008 2007
Bonds 80 -
Loans from financial institutions 34 120
Advances received 8 0
Trade payables 372 633
Liabilities to Group companies
Advances received 1 0
Trade payables 29 29
Other short-term liabilities 157 139
Accruals and deferred income 13 2
Total 200 170
Liabilities to associated companies
Trade payables 5 1
Total 5 1
Other short-term liabilities 286 342
Accruals and deferred income 52 46
1,037 1,312
Short-term accruals and deferred income
2008 2007
Salaries and indirect employee costs 35 34
Accrued interests 16 11
Other short-term accruals and deferred income 15 3
66 48
Notes: 1 2 3 4 5 6 7 8 9 10 11 12
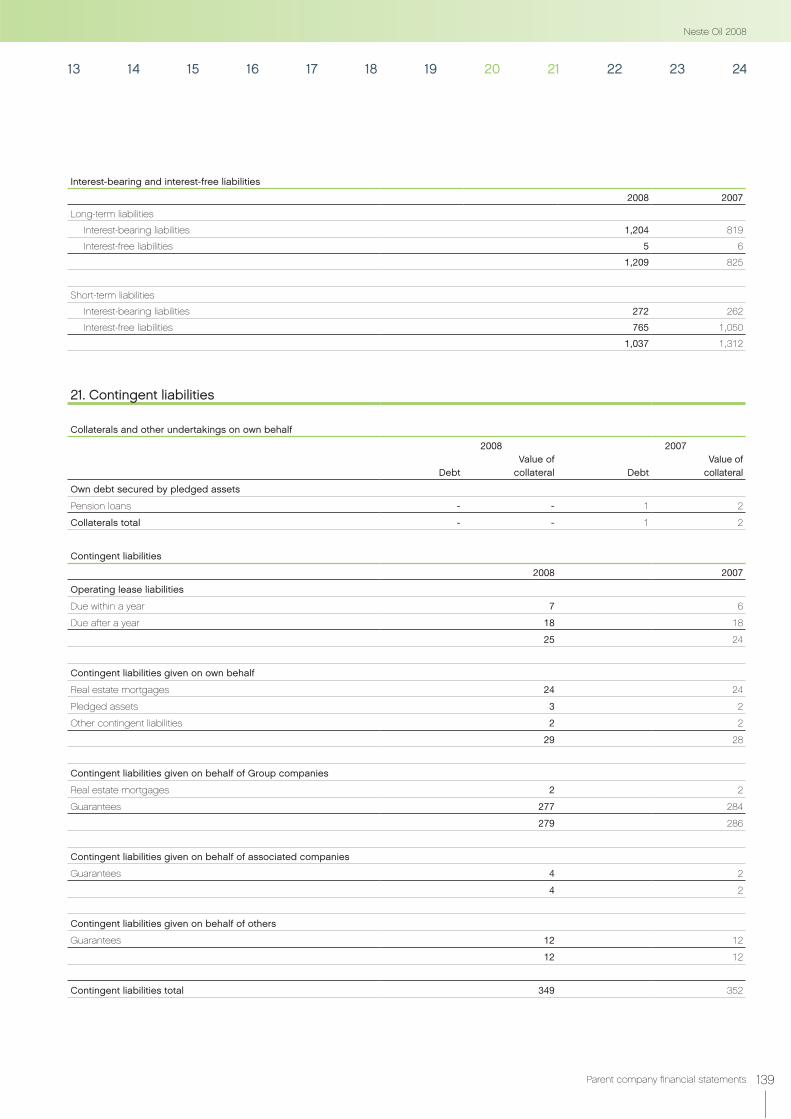
139Parent company financial statements
Interest-bearing and interest-free liabilities
2008 2007
Long-term liabilities
Interest-bearing liabilities 1,204 819
Interest-free liabilities 5 6
1,209 825
Short-term liabilities
Interest-bearing liabilities 272 262
Interest-free liabilities 765 1,050
1,037 1,312
21. Contingent liabilities
Collaterals and other undertakings on own behalf
Debt
2008Value of
collateral Debt
2007Value of
collateral
Own debt secured by pledged assets
Pension loans - - 1 2
Collaterals total - - 1 2
Contingent liabilities
2008 2007
Operating lease liabilities
Due within a year 7 6
Due after a year 18 18
25 24
Contingent liabilities given on own behalf
Real estate mortgages 24 24
Pledged assets 3 2
Other contingent liabilities 2 2
29 28
Contingent liabilities given on behalf of Group companies
Real estate mortgages 2 2
Guarantees 277 284
279 286
Contingent liabilities given on behalf of associated companies
Guarantees 4 2
4 2
Contingent liabilities given on behalf of others
Guarantees 12 12
12 12
Contingent liabilities total 349 352
13 14 15 16 17 18 19 20 21 22 23 24
Neste Oil 2008
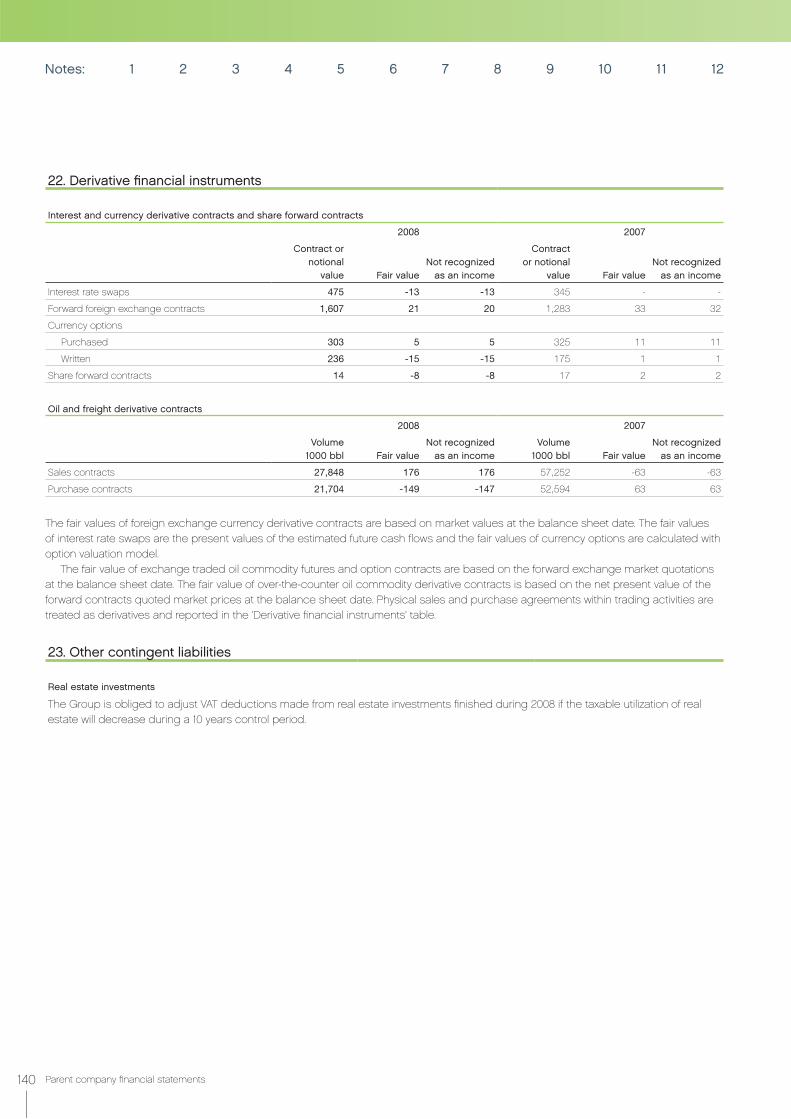
140 Parent company financial statements
23. Other contingent liabilities
Real estate investments
The Group is obliged to adjust VAT deductions made from real estate investments finished during 2008 if the taxable utilization of real estate will decrease during a 10 years control period.
22. Derivative financial instruments
Interest and currency derivative contracts and share forward contracts
2008 2007
Contract or notional
value Fair valueNot recognized
as an income
Contract or notional
value Fair valueNot recognized
as an income
Interest rate swaps 475 -13 -13 345 - -
Forward foreign exchange contracts 1,607 21 20 1,283 33 32
Currency options
Purchased 303 5 5 325 11 11
Written 236 -15 -15 175 1 1
Share forward contracts 14 -8 -8 17 2 2
Oil and freight derivative contracts
2008 2007
Volume1000 bbl Fair value
Not recognizedas an income
Volume 1000 bbl Fair value
Not recognizedas an income
Sales contracts 27,848 176 176 57,252 -63 -63
Purchase contracts 21,704 -149 -147 52,594 63 63
The fair values of foreign exchange currency derivative contracts are based on market values at the balance sheet date. The fair values of interest rate swaps are the present values of the estimated future cash flows and the fair values of currency options are calculated with option valuation model.
The fair value of exchange traded oil commodity futures and option contracts are based on the forward exchange market quotations at the balance sheet date. The fair value of over-the-counter oil commodity derivative contracts is based on the net present value of the forward contracts quoted market prices at the balance sheet date. Physical sales and purchase agreements within trading activities are treated as derivatives and reported in the 'Derivative financial instruments' table.
Notes: 1 2 3 4 5 6 7 8 9 10 11 12

141Parent company financial statements
24. Shares and holdings
Country of incorporation No. of shares Holding, %
Book value 31 Dec 2008
EUR thousands
Subsidiary shares
Neste Eesti AS Estonia 10,000 100.00 5,926
Neste Jacobs Oy Finland 2,100 60.00 438
Neste Markkinointi Oy Finland 210,560 100.00 51,467
Neste Oil (Suisse) S.A. Switzerland 200 100.00 62
Neste Oil Ab Sweden 2,000,000 100.00 23,972
Neste Oil BR Ltd Belarus 1 100.00 -
Neste Oil Components Finance B.V. The Netherlands 40 100.00 22
Neste Oil Finance B.V. The Netherlands 26,090 100.00 34,177
Neste Oil Holding (USA) Inc USA 1,000 100.00 18,428
Neste Oil Insurance Ltd Guernsey 7,000,000 100.00 3,000
Neste Oil Ltd Great Britain 500,100 100.00 1,793
Neste Oil N.V Belgium 2,227,960 99.99 519,752
Neste Oil US Inc. USA 1,000 100.00 1,100
Neste Renewable Fuels Oy Finland 200 100.00 113,581
Neste Shipping Oy Finland 101 100.00 55,452
Neste St.Petersburg OOO Russia 10 100.00 58,427
887,597
Associated companies
Neste Arabia Co. Ltd Saudi-Arabia 480 48.00 156
Porvoon Alueverkko Oy Finland 40 33.33 7
Svartså Vattenverk-Mustijoen Vesilaitos Finland 14 40.00 124
Tahkoluodon Polttoöljy Oy Finland 630 31.50 490
Vaskiluodon Kalliovarasto Oy Finland 330 50.00 17
794
Other shares and holdings
Cleen Oy Finland 100 100
Ekokem Oy Ab Finland 375 2.68 125
Fine Carbon Fund Ky Finland 1 1
Finnish Measurement Systems FMS Oy Finland 80 10.91 -
Nordic Carbon Fund ky Finland 1 1
Posintra Oy Finland 190 34
261
Real estate companies
Oy Kokonhalli Ab Finland 55 20.00 93
Telephone shares
Kymen Puhelin Oy Finland 1 0
Pietarsaaren Seudun Puhelin Oy Finland 3 1
Pohjanmaan Puhelinosuuskunta PPO Finland 1 -
Savonlinnan Puhelinosuuskunta SPY Finland 1 1
2
Others Finland 6
Connection fees 70
Total 888,823
13 14 15 16 17 18 19 20 21 22 23 24
Neste Oil 2008

142
Proposal for the distribution of earnings and signing of the Review by the Board of Directors and the Financial Statements
The parent company's distributable equity as of 31 December 2008 stood at EUR 976 million. The Board of Directors proposes Neste Oil Corporation to pay a dividend of EUR 0.80 per share for 2008, totalling EUR 205 million, and that any remaining distributable funds be allocated to retained earnings.
Espoo, 4 February 2009
Timo Peltola Michiel A. M. Boersma Mikael von Frenckell Ainomaija Haarla
Nina Linander Antti Tanskanen Markku Tapio Maarit Toivanen-Koivisto
Matti LievonenPresident and CEO

143
Auditor's report
To the Annual General Meeting of Neste Oil CorporationWe have audited the accounting records, the financial statements, the report of the Board of Directors, and the administration of Neste Oil Corporation for the financial period 1.1.–31.12.2008. The financial statements comprise the consolidated balance sheet, income statement, cash flow statement, statement of changes in equity and notes to the consolidated financial statements, as well as the parent company's balance sheet, income statement, cash flow statement and notes to the financial statements.
The responsibility of the Board of Directors and the Managing DirectorThe Board of Directors and the Managing Director are responsible for the preparation of the financial statements and the report of the Board of Directors and for the fair presentation of the consolidated financial statements in accordance with International Financial Re-porting Standards (IFRS) as adopted by the EU, as well as for the fair presentation of the parent company’s financial statements and the report of the Board of Directors in accordance with laws and regulations governing the preparation of the financial statements and the report of the Board of Directors in Finland. The Board of Directors is responsible for the appropriate arrangement of the control of the company’s accounts and finances, and the Manag-ing Director shall see to it that the accounts of the company are in compliance with the law and that its financial affairs have been arranged in a reliable manner.
Auditor’s responsibilityOur responsibility is to perform an audit in accordance with good auditing practice in Finland, and to express an opinion on the parent company’s financial statements, on the consolidated financial statements and on the report of the Board of Directors based on our audit. Good auditing practice requires that we comply with ethical requirements and plan and perform the audit to obtain reasonable assurance whether the financial statements and the report of the Board of Directors are free from material misstatement and whether the members of the Supervisory Board as well as of the Board of Directors and the Managing Director of the parent company have complied with the Limited Liability Companies Act.
An audit involves performing procedures to obtain audit evidence about the amounts and disclosures in the financial
statements and the report of the Board of Directors. The proce-dures selected depend on the auditor’s judgment, including the assessment of the risks of material misstatement of the financial statements, whether due to fraud or error. In making those risk assessments, the auditor considers internal control relevant to the entity’s preparation and fair presentation of the financial state-ments in order to design audit procedures that are appropriate in the circumstances. An audit also includes evaluating the appropri-ateness of accounting policies used and the reasonableness of accounting estimates made by management, as well as evaluating the overall presentation of the financial statements and the report of the Board of Directors.
The audit was performed in accordance with good auditing practice in Finland. We believe that the audit evidence we have obtained is sufficient and appropriate to provide a basis for our audit opinion.
Opinion on the consolidated financial statementsIn our opinion, the consolidated financial statements give a true and fair view of the financial position, financial performance, and cash flows of the group in accordance with International Finan-cial Reporting Standards (IFRS) as adopted by the EU.
Opinion on the company’s financial statements and the report of the Board of DirectorsIn our opinion, the financial statements, together with the con-solidated financial statements included therein, and the report of the Board of Directors give a true and fair view of the financial performance and financial position of the company in accor-dance with the laws and regulations governing the prepara-tion of the financial statements and the report of the Board of Directors in Finland. The information in the report of the Board of Directors is consistent with the information in the financial statements.
We recommend that the financial statements should be adopted. The proposal by the Board of Directors regarding the use of the profit shown at the balance sheet is in compliance with the Limited Liability Companies Act. We recommend that the Members of the Supervisory Board and the Board of Directors as well as the Managing Director of the parent company should be discharged from liability for the financial period audited by us.
Espoo, February 4, 2009
Ernst & Young OyAuthorized Public Accountant Firm
Anna-Maija SimolaAuthorized Public Accountant
Neste Oil 2008

144
Statement by the Supervisory Board
The Supervisory Board has today at its meeting reviewed Neste Oil Corporation's financial statements for the financial period ended 31 December 2008, including also consolidated financial state-ments, Review by the Board of Directors and the related Board of Directors' proposal on the distribution of the profit shown in the balance sheet, as well as the Auditor's report provided by the Com-pany's Auditor. The Supervisory Board has no comments to make
Espoo, 5 February 2009
Heidi Hautala Hannes Manninen Esko Ahonen Mikael Forss
Timo Heinonen Markus Mustajärvi Jutta Urpilainen Anne-Mari Virolainen
on these. The Supervisory Board recommends that the financial statements, including also the consolidated financial statements, can be adopted and concurs with the Board of Directors' proposal on the distribution of the profit shown in the balance sheet.
The Supervisory Board states that it has received adequate information from the Board of Directors and the Company's man-agement.

145
Quarterly segment information
Sales
MEUR 10–12/2008 7–9/2008 4–6/2008 1–3/2008 10–12/2007 7–9/2007 4–6/2007 1–3/2007
Oil Refining 2,097 3,763 3,624 2,546 2,740 2,310 2,516 1,782
Renewable Fuels 20 27 46 23 27 7 4 2
Specialty Products 112 149 164 166 138 164 181 166
Oil Retail 915 1132 1078 948 965 853 843 774
Shipping 100 114 123 100 87 82 115 110
Other 43 36 33 31 26 20 24 23
Eliminations -482 -700 -648 -517 -522 -458 -476 -400
Total 2,805 4,521 4,420 3,297 3,461 2,978 3,207 2,457
Operating profit
MEUR 10–12/2008 7–9/2008 4–6/2008 1–3/2008 10–12/2007 7–9/2007 4–6/2007 1–3/2007
Oil Refining -292 -2 231 186 139 148 246 107
Renewable Fuels -9 -2 12 1 2 -7 -4 -3
Specialty Products -37 23 28 5 10 34 47 31
Oil Retail -6 9 11 11 9 22 18 11
Shipping 2 22 23 7 -5 -4 16 23
Other -12 -7 -14 -9 -9 -16 -6 -6
Eliminations 2 1 -1 3 -3 3 -3 1
Total -352 44 290 204 143 180 314 164
Comparable Operating Profit
MEUR 10–12/2008 7–9/2008 4–6/2008 1–3/2008 10–12/2007 7–9/2007 4–6/2007 1–3/2007
Oil Refining 131 149 133 97 85 125 168 106
Renewable Fuels -10 -3 13 2 3 -6 -5 -5
Specialty Products -6 29 19 8 2 34 41 32
Oil Retail -5 7 11 9 10 21 17 11
Shipping 3 23 20 9 -4 -1 12 21
Other -12 -7 -14 -9 -9 -17 -5 -8
Eliminations 2 1 -1 3 -3 3 -3 1
Total 103 199 181 119 84 159 225 158
Neste Oil 2008

Information for shareholders
Annual General MeetingNeste Oil Corporation’s Annual General Meeting will be held on Friday, 3 April 2009 at 11.00 am EET in the Congress Wing of the Helsinki Fair Centre, Messuaukio 1, FI-00520 Helsinki. Registration and the distribution of voting papers will begin at 10.00 am.
Shareholders wishing to participate in the Annual General Meeting should inform the company by 4.00 pm on 27 March 2009 at the latest by:
visiting www.nesteoil.com and following the instructions given there, orsending an email to [email protected], orphoning +358 (0)10 458 9595, or writing to Neste Oil Corporation, Marja Telenius, POB 95, FI-00095 Neste Oil.
Holders of proxies are requested to forward them when stating their wish to participate, ensuring that they reach the company by 4.00 pm on 27 March 2009 at the latest.
AGM and dividend payment in 200924 March AGM record date3 April AGM8 April Dividend payment record date17 April Dividend payable.
DividendThe Board of Directors will propose to the AGM that a dividend of EUR 0.80 per share shall be paid for the financial year ending 31 December 2008.
Investor relationsNeste Oil’s Investor Relations observes the principles of providing accurate and timely information, commitment, transparency, accessibility, and equal treatment of all investors. To view Neste Oil’s IR policy in its entirety, see www.nesteoil.com.
Annual Report for 2008The Annual Report will be published in Finnish and English, and will be posted to all those requesting a copy. The Annual Report will also be available in PDF format at www.nesteoil.com.
Stock exchange releasesStock exchange releases are available in Finnish and English immediately after publi-cation at www.nesteoil.com. Anyone wanting to be placed on the email distribution list for releases can find a form for this purpose at www.nesteoil.com.
Closed periodNeste Oil observes a closed period (‘closed window’) prior to the publication of its results lasting a minimum of four weeks. During this period, the company will not comment on non-disclosed developments or the prospects for its business in the quarter concerned, nor will company rep-resentatives meet analysts or investors, or take part in capital markets events.
6.
Interim reports in 2009
Interim Report for January – March: 28 April 2009Interim Report for January – June: 30 July 2009Interim Report for January – September: 29 October 2009
Interim reports are published in Finnish and English and can be downloaded from www.nesteoil.com in PDF format.
146 Additional information | Shareholder information

Contact information
Investor Relations:Ilkka Salonen, CFO, tel. +358 (0)10 458 [email protected]
Juha Rouhiainen, IR Manager, tel. +358 (0)10 458 [email protected]
Sauli Saumala, IR Officer, tel. +358 (0)10 458 [email protected]
Neste Oil’s general e-mail address for investors is [email protected].
Investor services on the InternetThe Investors section of Neste Oil’s website (www.nesteoil.com/investors) contains the information presented here, together with other IR-related information, including a real-time stock monitor, delayed by 15 min-utes, a list of the company’s insiders and their holdings, extensive presentation mate-rial, current oil market information, such as prices and refining margins updated weekly, as well as services such as analyst forecasts and a share yield calculator.
www.nesteoil.com/investors
Analysts following Neste OilThe number of banks providing analyses of Neste Oil reduced by four during 2008. As of the end of the year, 23 banks produced forecasts on Neste Oil.
Banks following Neste OilBernstein ResearchCarnegieCheuvreuxCitigroupCredit Suisse Danske BankDeutsche BankEnskilda SecuritieseQ BankEvli SecuritiesExane BNP ParibasFIMGoldman SachsHandelsbankenJP MorganMerrill LynchMorgan StanleyNatixsis SecuritiesPohjolaSofia BankStandard & Poor’sUBSÖhman
Contact information for the analysts fol-lowing Neste Oil at the organizations listed above can be found at the company's website.
147Additional information | Shareholder information
Neste Oil 2008
Glossary of terms
Aframax Worldscale A marine cargo rate index calculated by the Baltic Exchange in London and based on shipments carried between Sullom Voe and Rotterdam in vessels capable of loading in excess of 80,000 tons of cargo.
Alkylate A premium gasoline component with a high octane number and excellent antiknock properties.
Barrel (b or bbl) A standard unit of crude oil measurement, equivalent to 42 gallons and approx. 159 liters, 0.137 tons, or 0.159 m3.
Base oil The main component in lubricant blends.
Biofuels Fuels produced from vegetable oil and other organic sources. Use of these fuels reduces greenhouse gas emissions (CO2).
Biogasoline Gasoline that includes a biocompo-nent, typically ethanol or ETBE.
Bitumen The bottom product of crude oil vacuum distillation; solid or semi-solid at room temperature.
Brent Light crude oil from the North Sea, named after one of the region’s largest fields.
Catalysis A phenomenon that takes places on the surface of a catalyst in which a chemical reaction is accelerated without the catalyst itself being consumed.
Catalyst A substance used to accelerate a chemical reaction that does not take part in the reaction itself.
Coker A processing unit that converts residual oil into gasoline, diesel, or jet fuel, and petroleum coke.
Component A term used to describe the constitu-ents used in producing fuels. Gasoline, for example, can comprise over 10 individual components.
Cracking A process in which heavy fractions are broken down into simpler molecules, either at high temperatures (thermal cracking) or with the help of catalysts and high pressure (catalytic cracking, hydrocracking). Cracking yields large volumes of hydrocarbons that can be used to produce gasoli-ne and other light distillates.
Dwt, deadweight ton A unit of measurement referring to the total weight of a vessel, including cargo, fuel, fresh water, stores, and crew.
ERM Enterprise Risk Management – a systematic process designed to manage the opportuni-ties, goals, risks, and threats associated with a company’s strategy, annual planning, and opera-tions.
Esterification A process in which alcohol and acid react to produce ether and water.
ETBE Ethyl Tert-Butyl Ether – a bioethanol-based gasoline component designed to enhance com-bustion and reduce tailpipe emissions.
Ethibel (www.ethibel.org) An independent con-sultancy agency that provides advice on socially responsible investment to financial institutions and manages a quality label and index awarded to European banks and brokers offering ethical products and funds.
EtOH Ethanol.
FAME Fatty Acid Methyl Ester – conventional bio-diesel produced by esterification.
Feedstocks Crude oil, condensate, components, and other materials used by refineries and other facilities as their raw material input.
Fossil fuels Fuels originating from organic material laid down millions of years ago, including oil, coal, and natural gas.
Gallon The US gallon (3.8 liters) is the standard unit of measurement used in the oil industry. The impe-rial gallon is slightly larger, equivalent to 4.5 liters.
HSE An abbreviation of Health, Safety, and the Environment.
Hydrocracker A unit used to ‘crack’ heavy hydro-carbons at high pressure and high temperature in the presence of hydrogen, to produce fractions for premium-quality fuels.
IEA Brent Cracking A reference refining margin used by Neste Oil that refers to the typical margin achieved by refineries in Northern Europe using Brent crude. Calculated by the International Energy Agency (IEA).
ISO (International Organization for Standardization)ISO 9000/14000/18000 standards covering quality, the environment, and safety are widely used in industry.
Isomerate A gasoline component used to improve a fuel’s octane rating.
Isomerization A reaction that modifies the structu-re and property of a hydrocarbon without changing its molecular weight.
Iso-octane A high-octane, low vapor pressure hydrocarbon component used in producing low-emission gasoline. Produced from butane.
LWIF Lost Workday Injury Frequency – the number of accidents resulting in absences from work per million hours worked. The figure includes both Nes-te Oil’s own personnel and those of its contractors and subcontractors.
Middle distillate A distillate with a distillation range of 180-350 °C. Middle distillates typically refer to pro-ducts such as kerosene, heating oil, and diesel fuel.
MTBE Methyl Tert-Butyl Ether – an oxygenate de-signed to promote cleaner gasoline combustion.
Naphthenic specialty oils Oils produced from base oil containing a high proportion of cyclic hyd-rocarbon fractions and used in certain specialty applications.
NExBTL A renewable diesel fuel based on Neste Oil’s proprietary technology that can be produced from virtually any vegetable oil or animal fat. The first NExBTL production unit was completed at Porvoo in summer 2007.
Panamax A class of ship with the maximum dimensions that will fit through the locks of the Panama Canal.
PAO Polyalphaolefin – a synthetic base oil used in the production of premium-quality lubricants.
Pinch analysis A method used to optimize energy usage.
Polypropylene (PP) One of the most common ty-pes of plastics, used to produce freezer containers for example.
Ppm Parts per million, milligrams per kilo.
QSAR Quantitative Structure Activity Relationship – a computer modeling technique for evaluating the properties of structurally similar substances. Used to replace many animal tests.
RC Responsible Care – a voluntary environment, health, and safety program developed and promo-ted by the international chemical industry.
Refining margin The difference in value between the products produced by a refinery and the cost of the feedstocks and operations used to produce them.
Russian Export Blend (REB) A blend that con-tains crude oil from a number of fields connected to the Russian pipeline network.
Specification A detailed, officially recognized requirement, typically used to specify a product’s target performance.
Sulfur-free fuel A fuel that contains less than 10 mg/kg (ppm) of sulfur.
TRIF Total Recordable Incident Frequency – the number of incidents requiring medical attention per million hours worked. The figure includes both Neste Oil’s own personnel and those of its contractors and subcontractors.
Urals Rotterdam The spot price quoted in Rotter-dam for Russian crude oil loaded in the Baltic.
Vacuum Gas Oil VGO – produced by vacuum distillation and used as a cracking feedstock.
VHVI Very High Viscosity Index – a base oil used to produce premium-quality motor oils that contribute to reduced fuel consumption.
148 Additional information | Glossary of terms

Con
sep
t, g
rap
hic
des
ign
and
layo
ut: M
iltto
n O
y, P
hoto
gra
phs
: Nes
te O
il, An
u Ak
kane
n, Is
mo
Hen
ttone
n an
d G
etty
Imag
es, T
rans
latio
n: P
eter
Her
ring
, Prin
ting
: Lib
ris O
y, H
elsi
nki 2
009

Neste Oil CorporationKeilaranta 21P.O. Box 9500095 NESTE OIL, FinlandTel: +358 10 458 11www.nesteoil.com
Domicile Espoo, Business ID FI 1852302-9 This Annual Report can be recycled.