Nesma autumn conference 2015 - Agile normalized size - Theo Prins

Richard Sweer | [email protected] | 12 november 2015 | versie 1.3
Is FPA a valuable addition to predictable Agile projects?
- NESMA annual autumn conference 2015 -

2/28
Contents
• Project context
• Approach and use of metrics
• Metrics specific for agile
• Metrics for contracting (agile) projects
• Conclusion

3/28
Project context
• The company has written its existing Trading and Traffic System in Powerbuilder (Client) and PL-SQL/Oracle (Backend).
• The company continues to maintain the system and the business community still has wishes to implement a new functionality or a modified functionality. Consequently, Powerbuilder is set to be replaced by a different programming environment.
• The existing system is complex and comprehensive. The system is used by more than 900 users in more than 16 countries. We have determined the scope of the system by conducting a NESMA 2.2 Function Point Analysis. The total online scope exclusive batches and interfaces is approximately 13,000 Function Points.
• After a brief preliminary study, the choice has fallen on a Oracle (DBMS), Microsoft .NET and TypeScript/AngularJS environment.
4/28
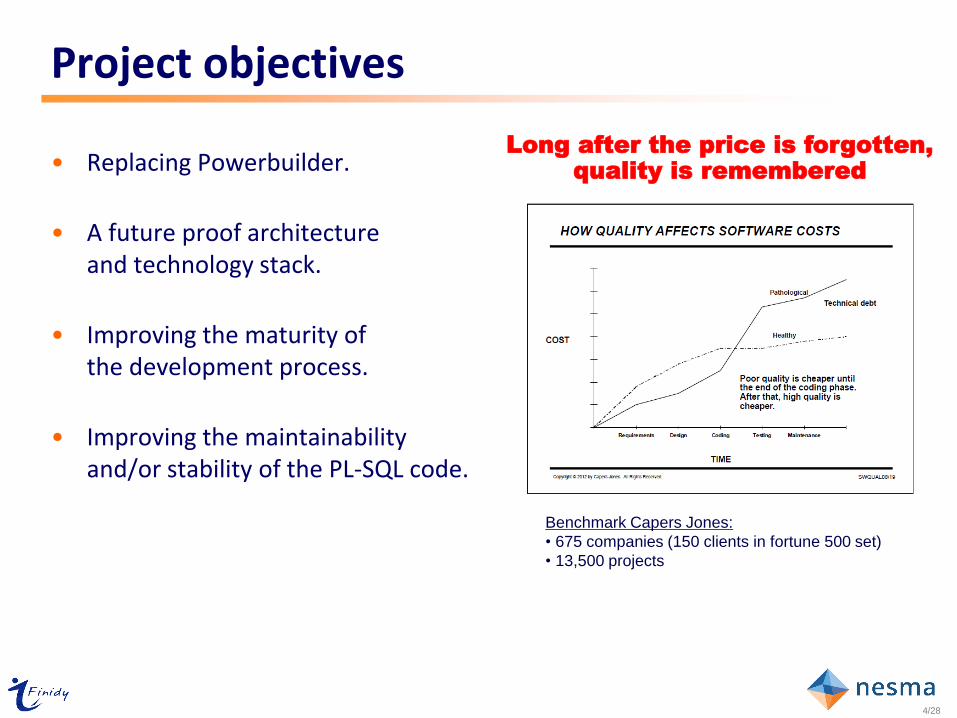
Benchmark Capers Jones:
• 675 companies (150 clients in fortune 500 set)
• 13,500 projects
Project objectives
Long after the price is forgotten,
quality is remembered
• Replacing Powerbuilder.
• A future proof architecture and technology stack.
• Improving the maturity of the development process.
• Improving the maintainability and/or stability of the PL-SQL code.

5/28
Overall approach –Application development
MANAGABLE AND SUPPORTABLE TECHNICAL AND ORGANIZATIONAL
- Monitoring & alerting (such as New Relic, SolarWinds, BMC, Tivoli, GensysX)
- Root Cause Analysis (such as Splunk, logstash, graylog) - Configuration Management (such as Puppet, Chef)

6/28
Architecture: Keep It Simple TTS - Application Platform – Future
Database Server - Oracle
Web / Application Server – .NET/C#
Bu
sin
ess
La
ye
r
Da
ta
Acc
es
La
ye
r
Client and/or Web/Application Server – HTML5 / Javascript / .NET
Pre
sen
tati
on
La
ye
r
Enterprise Service Bus – Jboss FuseSe
rvic
es
La
ye
r
Ge
ne
ric
Asp
ect
sG
en
eri
c A
spe
cts
User Interface
Presentation Logic
Application Facade
Entities Workflow
Data Access ESB Agent
PL/SQL packages:Data intensive Business Rules & Data
Access
Data
Messaging:Apache ActiveMQ
Routing & Mediation:Apache Camel
Web Services:Apache CXF
Integration Logic & Adapters:
Java
See also: Microsoft Application Architecture
Guide 2nd Edition.
Services Interface
Security
Management
Communication
Metrics
Message Types
Security
Management
Communication
Metrics

7/28
Architecture: Keep It Simple
TTS - Application Platform – Future
Database Server - Oracle
Web / Application Server – .NET/C#
Bu
sin
ess
La
ye
r
Da
ta
Acc
es
La
ye
r
Client and/or Web/Application Server – HTML5 / Javascript / .NET
Pre
sen
tati
on
La
ye
r
Enterprise Service Bus – Jboss FuseSe
rvic
es
La
ye
r
Ge
ne
ric
Asp
ect
sG
en
eri
c A
spe
cts
User Interface
Presentation Logic
Application Facade
Entities Workflow
Data Access ESB Agent
PL/SQL packages:Data intensive Business Rules & Data
Access
Data
Messaging:Apache ActiveMQ
Routing & Mediation:Apache Camel
Web Services:Apache CXF
Integration Logic & Adapters:
Java
See also: Microsoft Application Architecture
Guide 2nd Edition.
Services Interface
Security
Management
Communication
Metrics
Message Types
Security
Management
Communication
Metrics
8/28
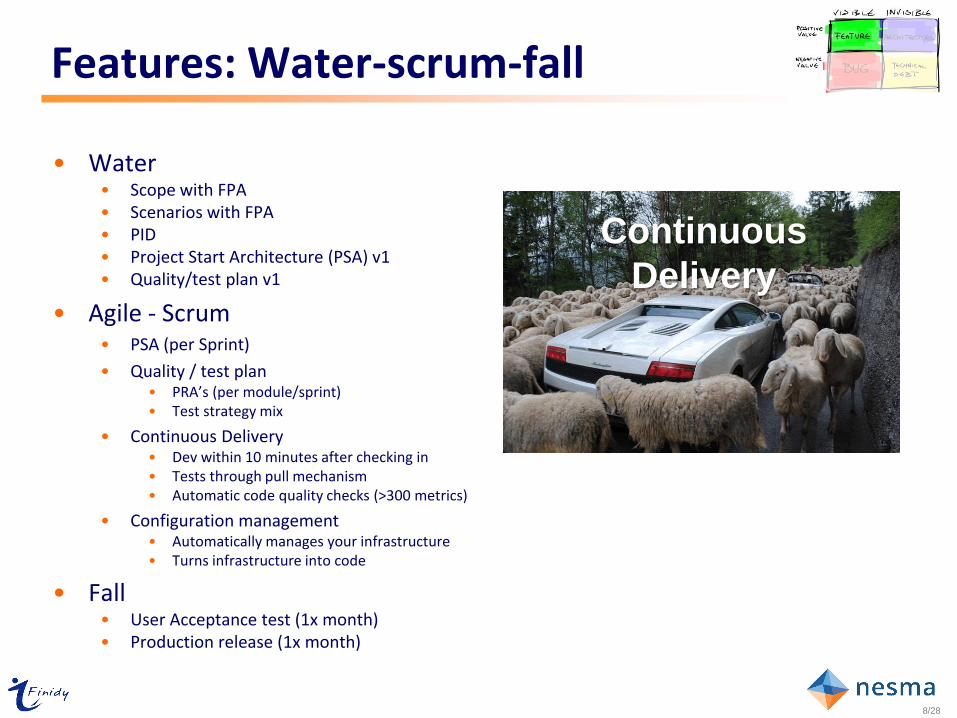
• Water • Scope with FPA • Scenarios with FPA • PID • Project Start Architecture (PSA) v1 • Quality/test plan v1
• Agile - Scrum • PSA (per Sprint)
• Quality / test plan • PRA’s (per module/sprint) • Test strategy mix
• Continuous Delivery • Dev within 10 minutes after checking in • Tests through pull mechanism • Automatic code quality checks (>300 metrics)
• Configuration management • Automatically manages your infrastructure • Turns infrastructure into code
• Fall • User Acceptance test (1x month) • Production release (1x month)
Continuous
Delivery
Features: Water-scrum-fall
9/28
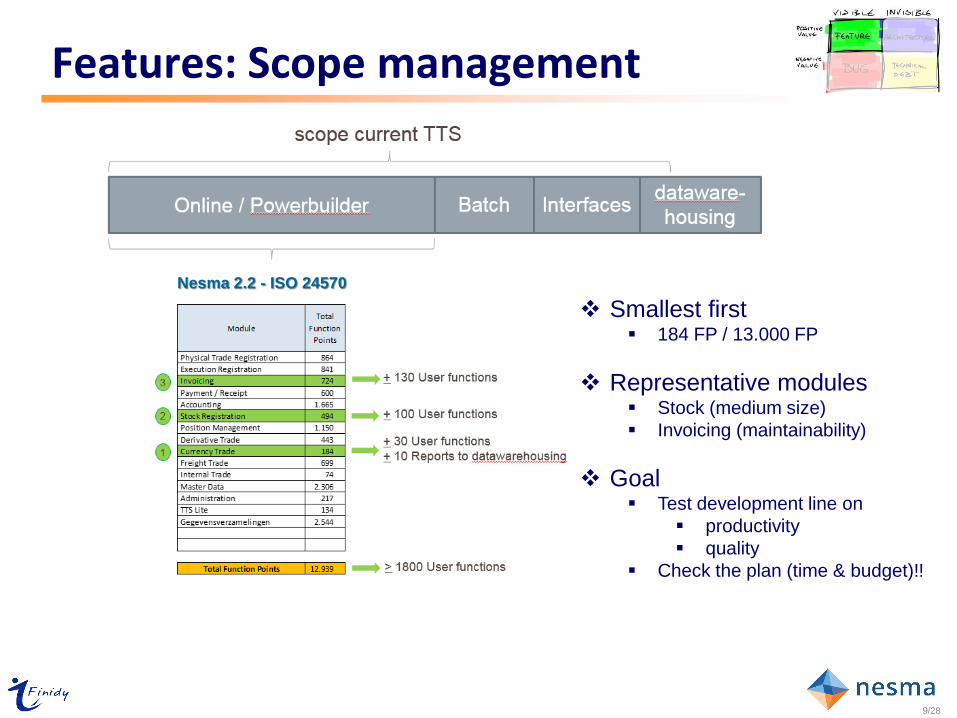
Features: Scope management
Smallest first 184 FP / 13.000 FP
Representative modules Stock (medium size)
Invoicing (maintainability)
Goal Test development line on
productivity
quality
Check the plan (time & budget)!!
Nesma 2.2 - ISO 24570

10/28
Galorath > 20.000, Q/P Management Group > 15.000, Capers Jones > 13.500, QSM > 10.000, ISBSG > 6000 ….. more than 64.000 projects
• Investments • Early determination of size
and investment scenarios
• Risk management • Realistic tenders
• Cost • Supplier management
and monitoring
• Productivity • Portfolio monitoring
and benchmarking
• Clearness • In ‘stormy weather’ projects
Features: Benchmarking – why?

11/28
Features: Project scenarios
• The requested scenarios are: • Scenario 1: 10% - 10% higher productivity than market average
• Scenario 2: 30% - 30% higher productivity than market average
• Scenario 3: available team size
• Scenario 4: 2 teams

12/28
Bugs: Reliability (ISO 25010)
• Main metrics • Defects per function point during
user tests and production • 35% are code defects
• Defect removal efficiency
• Code Coverage
• Abstract Interpretation
• Compiler warnings
• Coding standards
• Measures taken: • Refinement session ~ User Stories
• Test Driven Development
• During sprints • No registration of all defects
• Have the nerve not to accept ‘worthless’ software
• During acceptance/user test and production
• All defects are registered
Copyright © 2012 by Capers Jones. All Rights Reserved
During nightly build
and before
checking in code
13/28
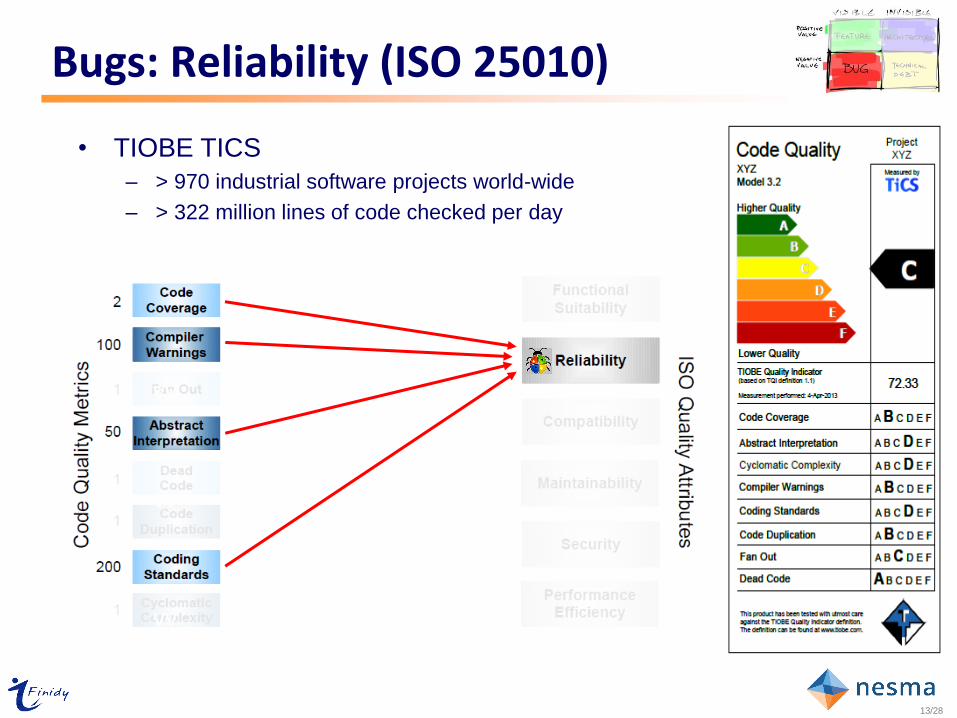
Bugs: Reliability (ISO 25010)
• TIOBE TICS
– > 970 industrial software projects world-wide
– > 322 million lines of code checked per day
vv
vv
vv
vv

14/28
Technical Debt
• Ward Cunningham describes this concept in 1992 as follows: • "Shipping first-time code is like going into debt ...“
• “Every minute spent on not-quite-right code counts as interest on that debt. Entire engineering organizations can be brought to a stand-still under the debt load of an unconsolidated implementation ….”
• “In addition, technical debt is not just poor code. Bad code is bad code, and technical debt can result from the work of good programmers under unrealistic project constraints.”
• Measures taken • Page on confluence (wiki environment) with
all technical design/code debts
• Measure the static code quality (> 300 metrics)
• External architectural reviews
• 10-20% from Sprint spent on reducing technical debt
• Project Start Architecture and technical designs

15/28
• TIOBE TICS enterprise dashboard • World-wide real time data
• TIOBE TICS intranet viewer • Drill down to sources
• TIOBE TICS IDE integration • Detailed and before checking in the code
Technical Debt: Code level
IDE integration
World-wide (near) real time data
Drill down to sources for each project
More than 300 metrics

16/28
Contents
• Project context
• Approach and use of metrics
• Metrics specific for agile
• Metrics for contracting (agile) projects
• Conclusion

17/28
• Productivity rates
Hours of effort
(User requested) size of Software Product Delivered
• Cost effectiveness Project dollar cost
(User requested) size of Software Product Delivered
• Product quality 1) Defects delivered
(User requested) size of Software Product Delivered
2) Quality attributes based on (ISO 25010 past 9126)
3) Software architectural audits
Metrics: (agile) software projects

18/28
Sprint Planning Meeting
- Review Product Backlog
- Estimate Sprint Backlog
- Commit
Daily Scrum Meetings
- Done since last meeting
- Plan for today
- Roadlocks/Accelerators?
Sprint Review Meeting
- Demo features to all
- Retrospective on the
Sprint
Time-boxed “Sprint” Cycles
Product Backlog Backlog tasks
Product Backlog
- Client prioritized
product features
Sprint Backlog
- Features assigned to
Sprint
- Estimated by team
- Team commitment
Working Code Ready
for Shipping
Time-boxed
Test/Develop
Story Points for team commitment
&
Functions Points for competitive
productivity, cost effectiveness and product quality
FPA FPA FPA increase
decrease
increase
decrease
Metrics: Applicability SCRUM and FPA

19/28
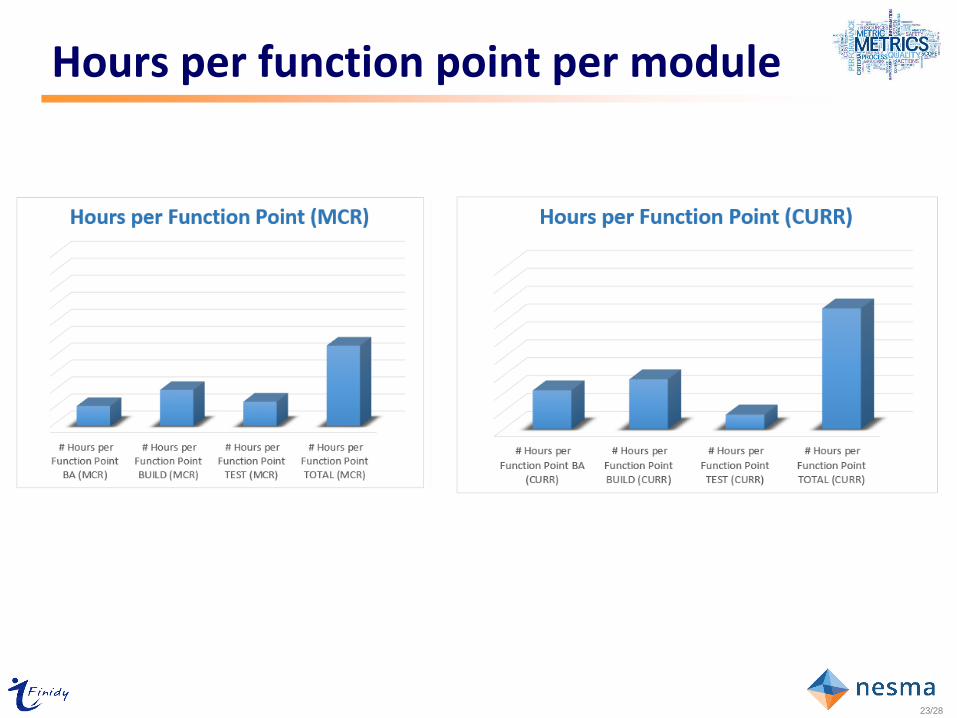
Metrics: specific Agile/Scrum metrics • Per sprint and cumulative
• Total hours spent (Business analysis, Build and Test (SIT/FT) • # Functions points • # lines of code per function point (database, backend and frontend) • # Story Points • # Product Backlog Items (PBI) • # Test cases • Fun at Work (0-10) • Limit Work in Progress (WIP) • DoD on Kanban board (code quality & products)
Calculated per sprint and cumulative • Hours per function point (per module) • Hours per Story Point • Average Story Points per PBI • Ratio business analysis vs build vs Test(SIT/FT) • Ratio Functions points vs Story points
(to prove there is no relationship) • Test scenarios per function point
• The percentage of defects that can be corrected through communication

20/28
Metrics: Kanban board

21/28
Metrics: specific Agile/Scrum metrics

22/28
Metrics: 80-120% Marge
23/28
Hours per function point per module

24/28
Metric: Standish Group Report - chaos
The Standish Group research shows a staggering 31.1% of projects will be cancelled before they ever
get completed. Further results indicate 52.7% of projects will cost 189% of their original estimates.
Agile
Agile en FPA
Agile en FPA
Agile en FPA
Agile en FPA
Agile
FPA FPA

25/28
• Delivering quality costs money, not delivering quality costs capital 1. Price per function point (ISO 24570)
2. Maximum number of errors per function point during GAT and first 90 days during production
3. Product quality – TIOBE, SIG, Cornerstone, Omnext rating (ISO 25010)
4. Acceptance criteria based on ISO 25010 (ISO 9126)
Contracts: When IT really matters!
26/28
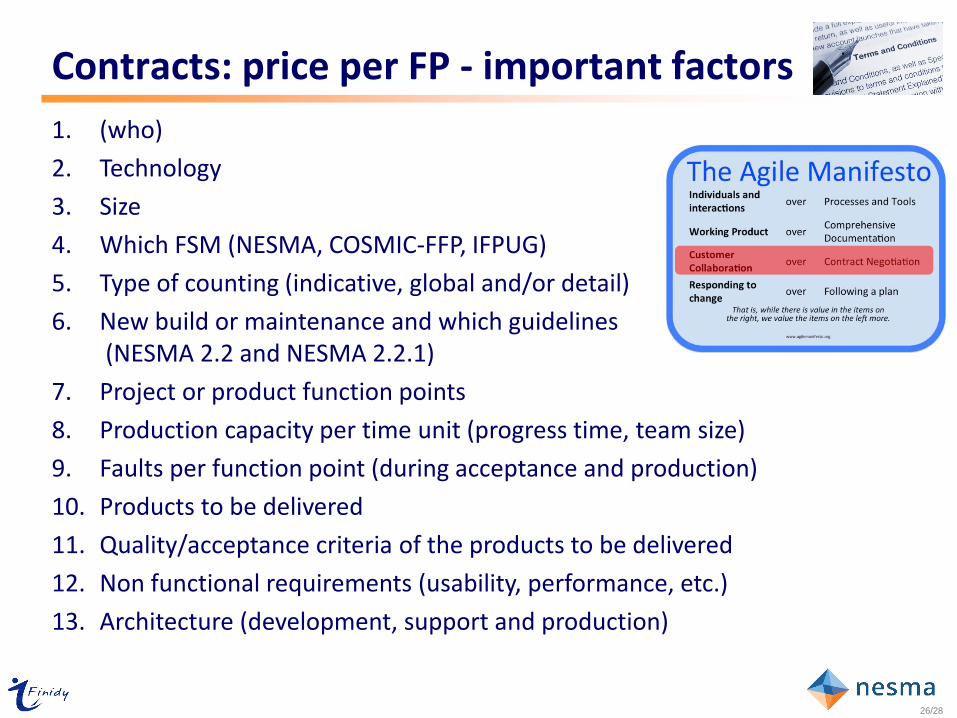
1. (who)
2. Technology
3. Size
4. Which FSM (NESMA, COSMIC-FFP, IFPUG)
5. Type of counting (indicative, global and/or detail)
6. New build or maintenance and which guidelines (NESMA 2.2 and NESMA 2.2.1)
7. Project or product function points
8. Production capacity per time unit (progress time, team size)
9. Faults per function point (during acceptance and production)
10. Products to be delivered
11. Quality/acceptance criteria of the products to be delivered
12. Non functional requirements (usability, performance, etc.)
13. Architecture (development, support and production)
Contracts: price per FP - important factors

27/28
Conclusion
• Function Point Analysis is an added value to Agile projects • Keep (enterprise) projects in control (FPA) • To proof productivity and product quality (FPA + other metrics)
• Function Point and Story Points ‘fits like a glove’ • Story Point for team commitment • Function Point for competitive productivity, cost effectiveness and product quality
• You can’t benchmark Story Points but you can benchmark Function Points
• Story Points = Functionality (FPA) + “Non func. requirements” + Technical Debt!
• With function point you can prove that an Agile/Scrum approach is much more productive and delivers more quality
• Price per function point alone is not enough for contracts based on function points (sheet 26)
• You still need architectural/design reviews to avoid/reduce technical debt
• The Dutch market has a lot of vendors who wish to close a contract based on function points (but you must ask them!)

28/28