
Nerve growth factor and chronic ethanol treatment alter calcium homeostasis in developing rat septal...
15
Developmental Brain Research 143 (2003) 57–71 www.elsevier.com / locate / devbrainres Research report Nerve growth factor and chronic ethanol treatment alter calcium homeostasis in developing rat septal neurons a,b a,b,c, a,b * Barbara Webb , Don W. Walker , Marieta B. Heaton a Department of Neuroscience, Center for Alcohol Research, Gainesville, FL, USA b McKnight Brain Institute, Center for Alcohol Research, Gainesville, FL, USA c V . A. Medical Center, Gainesville, FL, USA Accepted 18 March 2003 Abstract Chronic ethanol treatment (CET) during development produces cellular adaptations resulting in tolerance to the acute effects of ethanol (EtOH). The objectives of this study were to determine whether CET during the prenatal period (PCET) followed by a period of in vitro 21 CET (PCET-CET) altered intracellular calcium [Ca ] and produced tolerance to acute EtOH treatment (AET), and whether nerve i growth factor (NGF) modulated the effects of PCET-CET in cultured developing rat septal neurons. Fetuses were obtained from EtOH-fed and sucrose-fed (diet-control) female rats. Neurons from PCET fetuses were cultured in the presence of NGF (1NGF) and 200 mg / dl (mg %) EtOH and diet-control cultures received NGF and no EtOH. PCET and diet-control cultures were then divided into two groups, 1NGF and 2NGF (withdrawn from NGF), and exposed acutely to one of five doses of EtOH during stimulation with potassium 1 21 21 (K ) chloride. [Ca ] was measured using fura-2. PCET-CET did not affect resting [Ca ] . PCET-CET decreased and acute EtOH i i 1 21 withdrawal increased overall K -stimulated changes in [Ca ] , but only in 1NGF PCET neurons. Reducing the level of EtOH from 200 i 1 21 to 100 mg % decreased overall K -stimulated [Ca ] in 2NGF PCET neurons. The effects of PCET-CET or PCET-CET combined with i 1 21 1 NGF on overall K -stimulated changes in [Ca ] occurred mostly in the early and middle phases of the K -response. NGF reduced i 1 21 overall K -stimulated changes in [Ca ] in PCET neurons during EtOH withdrawal and during AET with 200 mg % EtOH and i 1 21 increased overall K -stimulated changes in [Ca ] during AET with 400 and 800 mg % EtOH. There was no effect of NGF on overall i 1 21 1 K -stimulated changes in [Ca ] in diet-control neurons with the exception that NGF-treatment decreased overall K -stimulated i 21 1 21 changes in [Ca ] during AET with 400 mg % EtOH. The effects of AET on overall K -stimulated changes in [Ca ] mostly occurred i i 21 in 1NGF PCET neurons. In conclusion, CET during development of the brain could adversely affect Ca -dependent functions such as neuronal migration, neurite outgrowth, and synaptogenesis in neurons even in the presence of neurotrophin support. 2003 Elsevier Science B.V. All rights reserved. Theme: Neural basis of behavior Topic: Drugs of abuse: alcohol, barbiturates, and benzodiazepines Keywords: Nerve growth factor; Intracellular calcium; Prenatal ethanol exposure; Chronic and acute ethanol exposure; Cultured rat septal neuron 1. Introduction (CNS). Rodent models have been used to investigate the consequences of alcohol-induced morphological alterations Alcohol exposure during development causes numerous in the CNS. Chronic ethanol exposure during prenatal morphological alterations of the central nervous system development (PCET) in the rat produces changes in brain weight and in the ability of cerebral cells to subsequently grow in culture [7], changes in neuronal proliferation and migration [34,36,37], defects in neuromorphological de- *Corresponding author. Present address: Department of Neuroscience, velopment [9,14,27], changes in neurochemistry [6,54,55], McKnight Brain Institute, University of Florida, Box 100244 JHMHC, alterations in neuronal number [4], and long-lasting detri- Gainesville, FL 32610, USA. Tel.: 11-352-392-4219; fax: 11-352-392- mental effects on learning [12] and behavior [44,45]. In 8347. E-mail address: [email protected] (D.W. Walker). humans, exposure to alcohol in utero causes similar CNS 0165-3806 / 03 / $ – see front matter 2003 Elsevier Science B.V. All rights reserved. doi:10.1016 / S0165-3806(03)00100-7
-
Upload
barbara-webb -
Category
Documents
-
view
217 -
download
4
Transcript of Nerve growth factor and chronic ethanol treatment alter calcium homeostasis in developing rat septal...
Developmental Brain Research 143 (2003) 57–71www.elsevier.com/ locate/devbrainres
Research report
N erve growth factor and chronic ethanol treatment alter calciumhomeostasis in developing rat septal neurons
a,b a,b,c , a,b*Barbara Webb , Don W. Walker , Marieta B. HeatonaDepartment of Neuroscience, Center for Alcohol Research, Gainesville, FL, USA
bMcKnight Brain Institute, Center for Alcohol Research, Gainesville, FL, USAcV.A. Medical Center, Gainesville, FL, USA
Accepted 18 March 2003
Abstract
Chronic ethanol treatment (CET) during development produces cellular adaptations resulting in tolerance to the acute effects of ethanol(EtOH). The objectives of this study were to determine whether CET during the prenatal period (PCET) followed by a period of in vitro
21CET (PCET-CET) altered intracellular calcium [Ca ] and produced tolerance to acute EtOH treatment (AET), and whether nervei
growth factor (NGF) modulated the effects of PCET-CET in cultured developing rat septal neurons. Fetuses were obtained fromEtOH-fed and sucrose-fed (diet-control) female rats. Neurons from PCET fetuses were cultured in the presence of NGF (1NGF) and 200mg/dl (mg %) EtOH and diet-control cultures received NGF and no EtOH. PCET and diet-control cultures were then divided into twogroups,1NGF and2NGF (withdrawn from NGF), and exposed acutely to one of five doses of EtOH during stimulation with potassium
1 21 21(K ) chloride. [Ca ] was measured using fura-2. PCET-CET did not affect resting [Ca ] . PCET-CET decreased and acute EtOHi i1 21withdrawal increased overall K -stimulated changes in [Ca ] , but only in1NGF PCET neurons. Reducing the level of EtOH from 200i
1 21to 100 mg % decreased overall K -stimulated [Ca ] in2NGF PCET neurons. The effects of PCET-CET or PCET-CET combined withi1 21 1NGF on overall K -stimulated changes in [Ca ] occurred mostly in the early and middle phases of the K -response. NGF reducedi
1 21overall K -stimulated changes in [Ca ] in PCET neurons during EtOH withdrawal and during AET with 200 mg % EtOH andi1 21increased overall K -stimulated changes in [Ca ] during AET with 400 and 800 mg % EtOH. There was no effect of NGF on overalli
1 21 1K -stimulated changes in [Ca ] in diet-control neurons with the exception that NGF-treatment decreased overall K -stimulatedi21 1 21changes in [Ca ] during AET with 400 mg % EtOH. The effects of AET on overall K -stimulated changes in [Ca ] mostly occurredi i
21in 1NGF PCET neurons. In conclusion, CET during development of the brain could adversely affect Ca -dependent functions such asneuronal migration, neurite outgrowth, and synaptogenesis in neurons even in the presence of neurotrophin support. 2003 Elsevier Science B.V. All rights reserved.
Theme: Neural basis of behavior
Topic: Drugs of abuse: alcohol, barbiturates, and benzodiazepines
Keywords: Nerve growth factor; Intracellular calcium; Prenatal ethanol exposure; Chronic and acute ethanol exposure; Cultured rat septal neuron
1 . Introduction (CNS). Rodent models have been used to investigate theconsequences of alcohol-induced morphological alterations
Alcohol exposure during development causes numerous in the CNS. Chronic ethanol exposure during prenatalmorphological alterations of the central nervous system development (PCET) in the rat produces changes in brain
weight and in the ability of cerebral cells to subsequentlygrow in culture[7], changes in neuronal proliferation andmigration [34,36,37], defects in neuromorphological de-
*Corresponding author. Present address: Department of Neuroscience,velopment[9,14,27],changes in neurochemistry[6,54,55],McKnight Brain Institute, University of Florida, Box 100244 JHMHC,
alterations in neuronal number[4], and long-lasting detri-Gainesville, FL 32610, USA. Tel.:11-352-392-4219; fax:11-352-392-mental effects on learning[12] and behavior[44,45]. In8347.
E-mail address: [email protected](D.W. Walker). humans, exposure to alcohol in utero causes similar CNS
0165-3806/03/$ – see front matter 2003 Elsevier Science B.V. All rights reserved.doi:10.1016/S0165-3806(03)00100-7

58 B. Webb et al. / Developmental Brain Research 143 (2003) 57–71
21alterations that often manifest as speech[26] and learning stabilize neuronal Ca have been shown to correlate withdisorders[2,48,51]. the ability of NGF to protect HP neurons in culture against
21Septal neurons were chosen for use in this study becausecell death induced by toxic insults[10,31]. Ca regulatesthis anatomical area contains the cholinergic neurons thatmany critical neuronal functions[35], and NGF modulates
21have been shown to be sensitive to ethanol[3,22] and transient and long-lasting elevations of neuronal [Ca ] ini
because septal neurons play a role in learning and memoryseptal neurons[64–68].[16,60]. Morphological and neurophysiological changes Neuronal survival is greatly influenced by electricaloccur in the developing rodent septum following PCET activity during certain stages of development. It is not clear[39]. The neurophysiological changes include changes in whether the neurotoxic actions of PCET are a result of theneurochemistry [19] and neurotransmitter release action of ethanol at the neuronal cell body or at the level of
1[1,42,71,72], and in the number and distribution of re- synaptic activity. Depolarization with high potassium (K )ceptors[5] and synapses. Often changes in neurophysiolo- leads to the activation of VSCCs that selectively allow the
21gy are accompanied or preceded by changes in calciumentrance of Ca into neurons. Activation of VSCCs with21 1(Ca ) homeostasis. Changes in cytoplasmic calcium high K mimics the activation of VSCCs during synaptic21 21([Ca ] ) occur when Ca is released from intracellular activity.i
stores, when there is an increase or decrease in the influx In the present study we hypothesized that in developing21 21of Ca through ion-gated or voltage-sensitive Ca septal neurons: (i) chronic alcohol exposure during de-
channels (VSCCs), or when there is a change in the efflux velopment reduces the concentration of intracellular cal-21of Ca by membrane transporters. cium; (ii) the withdrawal of alcohol after chronic alcohol
21PCET significantly reduces Ca entry through VSCCs exposure increases the concentration of intracellular cal-21[29], affects the assembly of the Ca permeableN- cium; (iii) chronic alcohol exposure changes the effect of
methyl-D-aspartate (NMDA) receptor[40], increases the acute ethanol exposure and/or nerve growth factor on thehippocampal levels of mRNAs encoding for certain concentration of intracellular calcium; and (iv) treatmentsubunits of the NMDA receptor in the rat[25], decreases with nerve growth factor during chronic ethanol exposurethe affinity and increased number of MK-801 binding sites ameliorates the effect of acute ethanol exposure. To testin the guinea pig cortex[11], and reduces NMDA-stimu- these hypotheses, embryonic rat septal neurons were
21lated increases in [Ca ] in the rat hippocampus, forebrain exposed to ethanol in utero from gestational day 1 toi21and cerebellum[50]. PCET also affects release of Ca gestational day 21 and then in culture for 7–9 days. The
from intracellular stores by affecting phosphoinositide effects of chronic ethanol exposure, acute ethanol with-hydrolysis [43]. Therefore, PCET may be changing the drawal, acute ethanol exposure, and nerve growth factor on
21 1neurophysiology of septal neurons by changing Ca long-lasting (resting) and transient (high K -stimulated)homeostasis. changes in intracellular calcium were determined.
The compensatory changes in ion channel function thatoccur during PCET and CET can result in neuronalhyperexcitability during alcohol withdrawal. CET is asso- 2 . Materials and methodsciated with increases in VSCCs, particularly of the L-type[17,62], and NMDA receptor-mediated postsynaptic po- 2 .1. Prenatal ethanol treatmenttentials in the hippocampus[70]. Increased NMDA re-
21ceptor and Ca channel activity underlies ethanol with- Impregnated nulliparous Long-Evans hooded rats weredrawal hyperexcitability and ethanol-mediated neurode- obtained from Charles River Company. They were main-generation following CET[61,70] and PCET[46,59]. tained at the University of Florida Brain Institute Animal
Nerve growth factor (NGF) affords protection to em- Facility. At the time of their receipt (G1, gestation day 1),bryonic day 18 (E18) hippocampal (HP) neurons in vitro they were assigned to one of two treatment groups: Onewhen cultured E18 HP cultures are exposed to ethanol, group received an ethanol-containing (8.4%) liquid diet inhypoglycemia, or hypoxia[38]. NGF enhances survival of which ethanol accounted for 36% of the total caloriccultured septohippocampal (SH) neurons during neuro- intake. The second group received an identical diet excepttoxic insults and enhances survival of SH neurons during for the isocaloric substitution of sucrose for ethanol. TheCET [22]. Our laboratory reported that NGF provided liquid diets were prepared from the mixture of a stocksome level of neuroprotection against the effects of CET in ethanol solution or an isocaloric sucrose solution withcultured embryonic septal neurons[21,22], but PCET Sustacal (Mead Johnson, Evansville, IN). Both diets werealtered the responsiveness of cultured septal and HP additionally fortified with Vitamin Diet Fortification Mix-neurons to acute ethanol treatment (AET) and NGF by ture and Salt Mixture (ICN Biomedical, Aurora, OH). Theincreasing tolerance to EtOH and decreasing responsive- diets contained 1.3 kcal /ml and provided several times theness to NGF[23]. daily requirement of all essential vitamins and nutrients
Previous reports have demonstrated that NGF modulates[16]. The animals receiving the sucrose control diet were21neuronal Ca homeostasis[18,30]. Mechanisms that individually pair-fed with animals in the ethanol group by
B. Webb et al. / Developmental Brain Research 143 (2003) 57–71 59
giving each sucrose animal the volume of diet that its age derived from diet-control fetuses (from sucrose-dietand weight-matched ethanol group partner consumed the females) receive only culture medium. NGF (20 ng/ml;previous day. The animals were housed individually under Harlan) was added to all cultures. The cultures were placedcontrolled temperature and humidity conditions on a into a tissue culture incubator (at 378C with 5.0% CO ).2
07:00–19:00 h light cycle, and the ethanol or sucrose diets Culture medium was replaced daily. All cultures werewere given throughout gestation. Blood ethanol concen- treated with 2mM arabinosylcytosine (Ara-C) on culturetrations (BECs) were determined from a number of the days 4 and 5 to inhibit cell division in non-neuronal cells.pregnant dams on the evening of G18 (between 00:00 and02:00 h), using a microenzymatic assay (Sigma Ethanol 2 .2.1. NGF treatmentKit no. 332-UV). The animals were given the ethanol- Experimental cultures of PCET neurons and sucrose-dietcontaining diets in the mornings, but due to their nocturnal (diet-control) neurons were randomly sub-divided into twohabits, typically ate only after the lights were turned off groups on days 6–8 of culture. One group of neurons(19:00 h). Thus, the time of BEC determination repre- (2NGF) was deprived of NGF and received fresh mediumsented a peak or near peak level. BECs were not stable in containing a monoclonal antibody (0.7mg/ml) to NGFthe animals and varied from peak levels to as low as 0 (Boehringer Mannheim) for 24 h. The2NGF neuronsmg/dl over 24 h because of their consumption patterns were treated with the monoclonal antibody to NGF for 24(unpublished findings). It has previously been shown that h prior to study. Previously, we reported that NGF-activitythere is a close correspondence between maternal and fetal was blocked by this monoclonal antibody to NGF after 24BECs[20,33].The dam was anesthetized with methoxyflu- h[61]. The other group of neurons was not deprived ofrane and the uterus removed through a transverse abdomi- NGF (1NGF)nal incision. The intact uterus containing the fetuses wasimmersed in ice-cold sterile saline. The pregnant female rat 2 .3. Fura-2 loadingwas euthanized by decapitation. Each fetus was individual-ly removed from the uterus, freed from the amniotic sac, After 24 h the culture medium in experimental culturesand decapitated. The brain from ten to 16 rat fetuses was (1NGF PCET, 1NGF diet-control,2NGF PCET, andremoved. Gender of the fetus was not determined. The2NGF diet-control) was replaced with HEPES bufferedsepti were dissected from each of the brains and prepared solution (referred to as buffer). The buffer contained 126for culture. Each septum was used to generate three mM NaCl, 1.25 mM KCl, 4 mM MgCl , 1 mML-ascorbic2
cultures. Similarly, on day G21 a pregnant female rat that acid, 4.2 mM glucose, 10 mM HEPES, 2 mM CaCl in2
had been given the sucrose-diet was anesthetized and sterile filtered deionized, distilled water, pH 7.4 and 2mMseptal neurons were prepared for culture. fura-2AM (fura-2AM; Molecular Probes, Eugene, OR).
The neurons were exposed to fura-2AM for 0.5 h at room2 .2. General culture temperature, and rinsed by gently agitating with fresh
buffer. The cultures containing fura-2 loaded neurons wereDetails of our culture methods have been previously kept at room temperature for 1.5 h before measuring
21described[65]. Briefly, the septi were collected in Hanks [Ca ] to allow for the de-esterification of the dye to itsi
balanced salt solution (Life Technologies), and placed in calcium sensitive form, fura-2. Throughout the fura-2phosphate-buffered saline (PBS, pH 7.4) with 0.15 ml loading and incubation period, 200 mg % EtOH was addedtrypsin (2.5%; Life Technologies) and 0.10 ml deox- to the buffer of1NGF and2NGF PCET cultures so thatyribonuclease I (DNAse; Sigma) in a water bath (378C). the neurons would not experience EtOH withdrawal. TheThe buffer-trypsin solution was then removed and replaced 1NGF neurons were deprived of NGF and there was nowith L-15 (Leibowitz) media (lackingL-glutamine; Life antibody to NGF present in the2NGF cultures during theTechnologies) containing 0.5% fetal bovine serum (FBS; loading and incubation of fura-2 (total of 2 h) becauseLife Technologies), 5.0% heat inactivated horse serum NGF and anti-NGF are large molecules that could affect(HIH; Life Technologies), 200 mM glutamine (Sigma), fura-2 processing.0.6% fungizone (Life Technologies), and 0.95% penicillin-streptomycin (Life Technologies). The tissues were then 2 .4. Experimental design to test treatment effects on
21dissociated by gentle trituration, and neurons were plated [Ca ] i
onto sterile glass coverslips coated with type I rat tailcollagen and polyornithine (0.05 and 0.04 mg/ml, respec- The culture dish containing the loaded neurons wastively; Sigma). Plating density averaged 35,000–39,000 secured on the microscope stage using soft dental wax.
2neurons/cm . EtOH (200 mg %) was added to the medium One field of neurons was chosen in each culture. Typically,21of cultures derived from PCET fetuses. PCET neurons a field contained two to five neurons. Baseline [Ca ] wasi
were treated with 200 mg % EtOH because this level of measured for each neuron in the field and then the bufferEtOH was determined to be similar to the level of EtOH in the culture was replaced with experimental buffer. Thethe PCET neurons were exposed to in utero. Cultures buffer used during the 2 h required for the loading and

60 B. Webb et al. / Developmental Brain Research 143 (2003) 57–71
21incubation of fura-2 (loading buffer) lacked NGF. There- values used for this study were for the formula [Ca ]5ifore, the1NGF cultures were withdrawn for 2 h before k B(R2R ) /(R 2R): k 5150 nM (publishedk ford min max d d
and during the initial measurement of resting (baseline) fura-2 at 228C), B511.43,R 59.91, andR 50.23.max min21[Ca ] . Each1NGF and2NGF PCET and1NGF andi
2NGF diet-control culture received experimental buffer21containing 30 mM KCl, pH 7.4, and one of five levels (0, 2 .6. Determination of [Ca ] i
100, 200, 400, or 800 mg/dl (mg %)) of alcohol (95%ethanol, U.S.P.). The amount of NaCl was reduced in KCl The recordings were made from cultures of heteroge-containing buffer to prevent a change in osmolarity. neous neuronal types. The cultures contained 95% neuronsExperimental buffer only contained 20 ng/ml NGF when after treatment with Ara-C. This was determined by
1added to1NGF cultures (Fig. 1). Measurements of K - counting the number of glia positively labeled with an21 antibody for glial fibrillary acidic protein (GFAP; Sigma)stimulated changes in [Ca ] were taken during the bufferi
and neurons positively labeled with a neuron specificexchange, every second for 30 s, and at 1 and 2 min.antibody (Neurotag Red; Boehringer Mannheim) from fourEach treatment was repeated at least three times infields in randomly selected cultures. Only cells withrandomly chosen cultures derived from the fetuses of threeneuronal morphology similar to the cells labeled withdifferent litters. The values (mean6S.D.) reported for the
21 Neurotag Red were used in this and previously reportedamplitude of the Ca signal were determined by taking21 studies[65–68].the average of the Ca signal in all of the neurons
21The values for [Ca ] were generated by positioningreceiving the same treatment at each time point. Baseline i21 the coverslip located in the center of each culture dish onCa signals were compared before making treatment
an inverted microscope (Olympus IX 70). A field ofwithin factor and between factor comparisons. The rawcultured neurons was selected. The cells were excited atdata were used to determine significant treatment differ-
21 340 and 380 nm (Deltascan, Photon Technology Interna-ences because the baseline Ca signal was the same in alltional). The respective emission image from each field wasneurons regardless of treatment.digitized using an intensified CCD camera (Dage-MTI)and computer frame grabber (Photon Technology Interna-
2 .5. Validation of calcium measurements tional). Data background was also acquired from the field.During analysis a region of interest (ROI) was drawn
The system was calibrated forR in the septal neurons around the cell body of each neuron in the 340-nmmax21 21by adding buffer containing 2 mM Ca and 10mM Ca emission image. A ratio (fluorescent intensity of 340/380)
ionophore 4-Bromo A23187 (pH 8.4) to previously fura-2 for each ROI was determined. The background data wereloaded septal neurons. ThenR was determined in the subtracted from each ROI during the final analysis. Themin
21same septal neurons by changing the extracellular buffer to values for [Ca ] were determined using the formulai21 21 21a buffer containing 0 mM Ca , 10mM Ca ionophore [Ca ]51714.5 nM (ratio–0.23) /(9.91–ratio). Changes ini
4-Bromo A23187 and 2mM EGTA (pH 8.4). The resultant the ROI ratio in each neuron due to experimental treat-R and R images were used to determineB. The ments were interpreted as an indication of relative calciummax min
Fig. 1. Schematic of the experimental design. Septal neurons were exposed in utero to alcohol-containing diet (PCET neurons) or to sucrose-containingdiet (Diet-control neurons). The septal neurons were prepared for culture on E21. PCET and diet-control neurons were cultured for 7–9 days in media thatcontained 20 ng/ml NGF. PCET culture media also contained 200 mg % EtOH (PCET-CET). At 24 h prior to testing, the cultures were randomly dividedinto two groups, one that continued to receive 20 ng/ml NGF (1NGF) and another that was withdrawn from NGF (2NGF) and treated with a monoclonalantibody to NGF. During testing1NGF and2NGF cultures randomly received acute treatment with one of five doses of EtOH (0, 100, 200, 400 or 800mg %) and 30 mM KCl.1NGF cultures also received 20 ng/ml NGF.

B. Webb et al. / Developmental Brain Research 143 (2003) 57–71 61
21increase or decrease. All measurements were acquired at3 .3. Effect of PCET-CET on baseline [Ca ] andi21 1room temperature. [Ca ] during K -stimulationi
2 .7. Statistical analysis PCET cultures were exposed to EtOH in utero and to200 mg % EtOH during culture (PCET-CET) for 7–9 days
21Statistical analyses of treatment effects on the dependent and for 1.5 h prior to measuring resting (baseline) [Ca ] .i21 21variable, [Ca ] , were performed using either the Ca To determine if PCET-CET caused long-lasting changes ini
21 21signal at a certain time (i.e. peak) or the total change in [Ca ] in developing septal neurons, baseline [Ca ] wasi i21 21Ca signal over all time points (‘overall’ change in Ca measured in1NGF and2NGF PCET and1NGF and
21signal). The total or ‘overall’ change in Ca signal was 2NGF diet-control neurons. PCET-CET did not affect21used to determine significant treatment effects because the Ca homeostasis in developing septal neurons. Baseline
21 21dependent variable, [Ca ] , was measured across time in [Ca ] was 173.9635 nM in 2NGF PCET neuronsi i21the same culture. Each measurement of [Ca ] taken over (n582), 166.5642 nM in 2NGF diet-control neuronsi
time in the same culture meant that measurements of (n549), 161.7635 nM in 1NGF PCET neurons (n554),21[Ca ] at later time points were not independent of and 162.1637 nM in 1NGF diet-control neurons (n542).i
21measurements at earlier time points. All measurements are PCET-CET may alter the Ca -responses of1NGF and1presented as mean6S.D. Treatment effects of ethanol 2NGF septal neurons to K -stimulation. Therefore, we
21 1withdrawal, ethanol (PCET-CET and AET) and NGF were compared the overall changes in [Ca ] during K -stimu-i
determined by one-way analysis of variance (ANOVA) lation in1NGF PCET neurons with the overall changes in21 1followed by Bonferroni /Dunn posthoc comparisons within [Ca ] during K -stimulation in1NGF diet-controli
21 1significant variables. Significant interactions between fac- neurons and the overall changes in [Ca ] during K -i
tors (NGF and ethanol) were determined by two-way stimulation in2NGF PCET neurons with the overall21 1ANOVA. Significance level wasP#0.05 (StatView, SAS changes in [Ca ] during K -stimulation in2NGF diet-i
Institute). control neurons. Before making between group compari-1sons of the overall K -response, we compared baseline
21[Ca ] in each treatment group and determined thati213 . Results baseline [Ca ] was the same in the four treatment groupsi
(Tables 1 and 2).13 .1. Maternal BEC PCET-CET reduced the K -response of1NGF neurons
1but did not change the K -response of2NGF neurons.1The mean daily EtOH consumption of dams was Between group comparisons of overall K -stimulated
2114.9760.617 g/kg per day. Maternal BEC ranged from [Ca ] in1NGF PCET withdrawn from EtOH or treatedi
150 to 175 mg/dl (mean 161618 mg/dl) obtained onT able 1G14–G18. Maternal BEC at time of sacrifice (9:30–11:30
21 1Measurements of resting (baseline) [Ca ] and K -stimulated changes inih) on G21 was 161613 mg/dl. BECs in our dams did not21[Ca ] in septal neurons that were exposed to ethanol in utero (PCET)ichange as a function of the days of EtOH treatment. Since
and cultured in the presence of 200 mg % EtOH (PCET-CET) and NGFfetal EtOH levels have previously been shown to closely and then either treated with (1NGF) or withdrawn from NGF (2NGF)reflect maternal levels[20,33],we assumed that the fetuses
Treatment Baseline Overall Peak Time towere experiencing levels of EtOH similar to their dams. 21 21 21[Ca ] [Ca ] [Ca ] peaki i iBECs were not stable in the dams and varied from peak (nM) (nM) (nM) (s)levels to as low as 0 mg/dl over 24 h because of the dams’
1NGF PCET-CETconsumption patterns (unpublished findings). Therefore, 0 mg % (no EtOH) 165633 5896267 7706361 35646
†the fetuses normally experienced a cyclic rather than stable100 mg % EtOH 175638 4046119 4816125 33632†200 mg % EtOH 142631 4136178 5546166 968alcohol exposure during each gestational day.
400 mg % EtOH 149641 6736217** 9196239 26648†800 mg % EtOH 164633 7776516**, 9936621 226433 .2. EtOH concentration (EC) in PCET cultures
2NGF PCET-CETCET during culture consisted of adding EtOH (200 mg 0 mg % (no EtOH) 159643 6486384 8526435 26630
100 mg % EtOH 194624 3816107* 4876111 63653%) to the medium of cultures containing PCET neurons.200 mg % EtOH 188627 6786267 9056310 33638Culture medium was changed daily in all cultures. A time400 mg % EtOH 160627 5056294* 6996388 46648course for the evaporation of EtOH from the cultures was800 mg % EtOH 170642 4466240* 6046312 49652
determined by measuring the EC in six test cultures at 0, 2,Values are mean6S.D. Within NGF-treatment group comparisons statisti-6, and 24 h using a microenzymatic assay (Sigma Ethanolcal test by ANOVA and Bonferroni /Dunn post hoc test.
Kit no. 332-UV). EC was 216630 mg/dl at 0 h, 149637 *P,0.0001 compared to 0 or 200 mg %.mg/dl at 2 h, 170636 mg/dl at 6 h and 97619 mg/dl ** P,0.0001 compared to 200 mg %.
†after 24 h. P,0.0001 compared to 0 mg %.

62 B. Webb et al. / Developmental Brain Research 143 (2003) 57–71
T able 2 stimulation and AET in1NGF diet-control neurons, and21 1 21 1Measurements of resting (baseline) [Ca ] and K -stimulated changes ini baseline and overall changes in [Ca ] during K -stimu-21 i[Ca ] in septal neurons that were exposed to sucrose-control diet ini lation and AET in2NGF PCET neurons with baseline andutero and cultured in the presence of NGF (diet-control) and then either 21 1overall changes in [Ca ] during K -stimulation and AETtreated with (1NGF) or withdrawn from NGF (2NGF) i
21in 2NGF diet-control neurons. Baseline [Ca ] was theiTreatment Baseline Overall Peak Time to21 21 21 same in all treatment groups. PCET-CET decreased the[Ca ] [Ca ] [Ca ] peaki i i 1K -response of2NGF septal neurons during AET. AET(nM) (nM) (nM) (s)
1(all doses given) did not significantly alter the K -response1NGF Diet-control
of 2NGF diet control neurons. Comparisons of overall0 mg % (no EtOH) 162633 6946305 9206392 326331 21
100 mg % EtOH 138631 4436108 5526206 1868 K -stimulated changes in [Ca ] in2NGF PCET neu-i1200 mg % EtOH 179647 6906576 8986737 34635 rons for each dose of AET with overall K -stimulated
21400 mg % EtOH 151630 5196280* 7346373 36626 changes in [Ca ] in2NGF diet-control neurons treatedi800 mg % EtOH 161640 6026224 7596282 8610 1with the same dose of EtOH, showed that the K -responseof 2NGF PCET neurons were significantly lower than the2NGF Diet-control
10 mg % (no EtOH) 163647 6396279 8496276 32636** K -response of2NGF diet-control neurons stimulated in
†100 mg % EtOH 181624 5366193 6246206 1669 the presence of 100 mg % (P,0.0001) and 800 mg %††200 mg % EtOH 162641 6666433 8546406 30641 (P,0.0001) ETOH (Fig. 2).
400 mg % EtOH 176632 5926245 7306231 93639 1 21†† We compared overall K -stimulated changes in [Ca ]i800 mg % EtOH 142663 6736233 9046232 32637
in 1NGF PCET neurons for each dose of AET to theValues are mean6S.D. Within NGF-treatment group comparisons statisti- responses of1NGF diet-control neurons treated with thecal test by ANOVA and Bonferroni /Dunn post hoc test.
same dose of EtOH. First we confirmed that baseline*P,0.0001 compared to 0 mg %.21[Ca ] was the same in each treatment group of1NGF**P50.0002 compared to 400 mg % i
†P,0.0001 compared to 400 mg %. diet-control and PCET neurons. Between group compari-†† 1P50.0004 compared to 400 mg %. sons demonstrated that overall K -stimulated changes in
21[Ca ] in 1NGF PCET neurons were significantly loweri1 21than overall K -stimulated changes in [Ca ] in1NGFi
diet-control neurons stimulated with 200 mg % (P,1 21 1with 200 mg % ETOH with overall K -stimulated [Ca ] 0.0001) and greater than overall K -stimulated changes ini
21in 1NGF diet-control neurons in the absence of EtOH [Ca ] in1NGF diet-control neurons stimulated with 400i1 21demonstrated that overall K -stimulated [Ca ] was mg % (P50.0003) or 800 mg % (P50.0008) ETOH (Fig.i
significantly lower in the EtOH withdrawn (5896267 nM; 3A and B).diet-control: 6946305 nM; P50.0006) and 200 mg %EtOH treated (4136178 nM; diet-control: 6946305 nM;P,0.0001)1NGF PCET neurons. The overall change in
21[Ca ] was the same in2NGF PCET and2NGF diet- i1control neurons during K -stimulation without EtOH
(PCET: 6486384 nM; diet-control: 6396279 nM) or with200 mg % ETOH (PCET: 6786267 nM; diet-control:6666433 nM) (Table 1).
21 13 .4. Effect of PCET-CET on [Ca ] during K -i
stimulation and AET
PCET-CET may change the sensitivity of septal neurons1to AET during K -stimulation. The PCET neurons may
respond differently to doses of EtOH that are differentfrom the dose of EtOH that they were chronically exposedto in utero (150–175 mg %) and in culture (200 mg %).Therefore, all the neurons were stimulated with KCl in the Fig. 2. Effect of PCET-CET on NGF-withdrawn septal neurons. Overall
1 21presence of EtOH at doses that were less than, equal to, orK -stimulated changes in [Ca ] were significantly lower in2NGFi
PCET-CET neurons than in2NGF diet-control (Diet-Con) neuronsgreater than 200 mg % EtOH (100, 200, 400 or 800 mgstimulated in the presence of 100 mg % EtOH (P,0.0001). Overall%). 1 21K -stimulated changes in [Ca ] were significantly lower in2NGF21 iWe compared baseline and overall changes in [Ca ]i PCET neurons than in2NGF diet-control neurons stimulated in the
1during K -stimulation and AET in1NGF PCET neurons presence 800 mg % (P,0.0001) ETOH. Statistical analysis: ANOVA21 1with baseline and overall changes in [Ca ] during K - with Bonferroni /Dunn post hoc test (P#0.05).i

B. Webb et al. / Developmental Brain Research 143 (2003) 57–71 63
stimulation in 1NGF PCET withdrawn from EtOH with1
1NGF PCET neurons stimulated with K in the presenceof 200 mg % EtOH showed that acute EtOH withdrawal
1significantly increased (P,0.0001) the overall K -re-sponse of 1NGF PCET neurons from 4136178 to5896267 nM (Table 1, Fig. 4).
21 213 .6. Effects of NGF on baseline [Ca ] and [Ca ]i i1 1during K -stimulation and during K -stimulation and
AET
To determine whether or not NGF treatment affected21 1baseline [Ca ] and the K -responses of the PCETi
1neurons, we compared baseline and overall-K -stimulated21[Ca ] in 1NGF and 2NGF PCET neurons withi
1 21baseline and overall-K -stimulated [Ca ]1NGF andi21
2NGF diet-control neurons. Baseline [Ca ] was thei
same in the two groups of PCET and two groups of1diet-control neurons. Comparison of the overall-K -stimu-
21lated [Ca ] in1NGF diet-control neurons with overall-i1 21K -stimulated [Ca ] in2NGF diet-control neurons thati
received the same treatment indicated that there was no1significant difference in the overall K -response of1NGF
1diet-control neurons compared with the K -responses of2NGF diet-control neurons in the absence of EtOH orduring AET.
1In PCET neurons, comparison of overall-K -stimulated21 1[Ca ] in 1NGF PCET neurons with overall-K -stimu-i
21lated [Ca ] in 2NGF PCET neurons indicated thati1 21overall-K -stimulated [Ca ] was significantly lowerFig. 3. Effect of PCET-CET in NGF-treated septal neurons. (A) Overall i
1 21 (P50.0310) in1NGF PCET neurons (5896267 nM) thanK -stimulated changes in [Ca ] were significantly lower (P,0.0001)i
in 1NGF PCET-CET neurons than in1NGF diet-control (Diet-Con) in 2NGF PCET neurons (6486384 nM) during EtOH1neurons stimulated in the presence of 200 mg % EtOH. (B) Overall withdrawal. During AET, the overall K -response was the
1 21K -stimulated changes in [Ca ] were significantly higher in1NGFi same in1NGF and2NGF PCET neurons in the presencePCET-CET neurons than in1NGF Diet-Con neurons stimulated with1 21 of 100 mg % EtOH, was significantly lower (P,0.0001)400 mg % EtOH (P50.0003). Overall K -stimulated changes in [Ca ]i
in 1NGF PCET neurons (4136178 nM) than in2NGFwere significantly higher in1NGF PCET-CET neurons than in1NGFDiet-Con neurons stimulated with 800 mg % EtOH (P50.0008). Statisti-cal analysis: ANOVA with Bonferroni /Dunn post hoc test (P#0.05).
213 .5. Effect of acute ethanol withdrawal on [Ca ] i1during K -stimulation
EtOH was removed from the experimental buffer during1K -stimulation of some1NGF and2NGF PCET neu-
21rons. Baseline [Ca ] was the same in each treatmenti
group of PCET neurons. Comparison of overall changes in21 1[Ca ] during K -stimulation in2NGF PCET neuronsi
acutely withdrawn from 200 mg % EtOH (6486384 nM)1with 2NGF PCET neurons stimulated with K in the
Fig. 4. Effect of acute ethanol withdrawal in1NGF PCET-CET septalpresence of 200 mg % EtOH (6786267 nM) demonstratedneurons. Acute ethanol withdrawal significantly increased (P,0.0001)
that acute ethanol withdrawal did not change the overall 1 21overall K -stimulated changes in [Ca ] in1NGF PCET-CET neurons.i1K -response of2NGF PCET neurons (Table 1). But, Statistical analysis: ANOVA with Bonferroni /Dunn post hoc test (P#21 1comparison of overall changes in [Ca ] during K - 0.05).i

64 B. Webb et al. / Developmental Brain Research 143 (2003) 57–71
21PCET neurons (6786267 nM) in the presence of 200 mg lated changes in [Ca ] in2NGF PCET neurons.i21% EtOH and significantly higher (P,0.0001) in 1NGF Baseline [Ca ] was the same in each treatment group ofi
PCET neurons than in2NGF PCET neurons during 2NGF PCET neurons (Table 1). Acute application of 100exposure to 400 mg % ETOH (1NGF: 6736217 nM; mg % EtOH (P,0.0001), 400 mg % EtOH (P,0.0001)2NGF: 5056294 nM) and 800 mg % EtOH (1NGF: and 800 mg % EtOH (P,0.0001) significantly reduced
1 217776516 nM; 2NGF: 4466240 nM) (Fig. 5A and B). K -stimulated changes in [Ca ] when the changes ini21[Ca ] in 2NGF PCET neurons were compared to thei
1 21 213 .7. Effect of AET on K -stimulated [Ca ] in 2NGF changes in [Ca ] in2NGF PCET neurons in thei i
and 1NGF PCET neurons absence of EtOH or in the presence of 200 mg % EtOH(Table 1, Fig. 6).
1 1The K -response of PCET neurons that were deprived Second, we measured baseline and K -stimulated21of (2NGF) or treated with NGF could be affected differ- changes in [Ca ] in1NGF PCET neurons. Baselinei
1 21ently by AET. First, we measured baseline and K -stimu- [Ca ] was the same in each treatment group of1NGFi
PCET neurons (Table 1). There was a significant inter-action between EtOH and NGF (P,0.0001) that altered
1 1the K -response of1NGF PCET neurons. K -stimulated21changes in [Ca ] were unchanged with AET of 100 mgi
% EtOH, and were significantly greater (P,0.0001) withAET of 400 mg % EtOH and 800 mg % EtOH compared
1 21to overall K -stimulated [Ca ] in1NGF PCET neuronsi
in the presence of 200 mg % EtOH (Table 1, Fig. 7A).1Comparison of the K -response of EtOH treated1NGF
PCET neurons with the response of acutely EtOH with-drawn (0 mg % EtOH)1NGF PCET neurons showed thatAET with 100 or 200 mg % EtOH significantly lowered(P,0.0001) and 800 mg % EtOH significantly increased
1 21(P,0.0001) overall K -stimulated [Ca ] (Table 1, Fig.i
7B).
1 213 .8. Effect of AET on K -stimulated [Ca ] in 2NGFi
and 1NGF diet-control neurons
1The K -response of diet-control neurons that weredeprived of (2NGF) or treated with NGF could be
Fig. 5. Effect of NGF-treatment in PCET-CET septal neurons. (A)1 21Overall K -stimulated changes in [Ca ] were significantly lower (P,i
0.0001) in 1NGF PCET-CET neurons than in2NGF PCET-CET1neurons treated with 200 mg % EtOH. (B) Overall K -stimulated
21changes in [Ca ] were significantly higher (P,0.0001) in 1NGF Fig. 6. Effect of AET in2NGF PCET-CET neurons. Acute applicationi
PCET-CET neurons than in2NGF PCET-CET neurons during acute of 100 mg % EtOH (P,0.0001), 400 mg % EtOH (P,0.0001) and 8001 21 1exposure to 400 mg % ETOH. Overall K -stimulated changes in [Ca ] mg % EtOH (P,0.0001) significantly reduced K -stimulated changes ini
21 1were significantly higher (P,0.0001) in1NGF PCET-CET neurons than [Ca ] in2NGF PCET-CET neurons compared to K -stimulatedi21in 2NGF PCET-CET neurons during acute exposure to 800 mg % EtOH. changes in [Ca ] in2NGF PCET-CET neurons in the absence of EtOHi
Statistical analysis: ANOVA with Bonferroni /Dunn post hoc test (P# (0 mg %) or in the presence of 200 mg % EtOH. Statistical analysis:0.05). ANOVA with Bonferroni /Dunn post hoc test (P#0.05).
B. Webb et al. / Developmental Brain Research 143 (2003) 57–71 65
interaction between EtOH and NGF that occurred in the1NGF PCET neurons was not observed in the1NGFdiet-control neurons. The only significant effect of AET on
1the K -response of1NGF diet-control neurons occurredwhen 1NGF diet-control neurons treated with 400 mg %
1EtOH had a significantly smaller (P,0.0001) overall K -response than1NGF diet-neurons that were not treatedwith EtOH (Table 2).
3 .9. Effects on peak change and time to peak change in1 21K -stimulated [Ca ] i
1First we measured the peak change in K -stimulated21 1 21[Ca ] and time to peak change in K -stimulated [Ca ]i i
for each PCET and diet-control neuron during eachtreatment. There was a significant interaction (NGF3
treatment;P50.0146) in PCET neurons that affected peak1 21change in K -stimulated [Ca ] but not time to peaki1 21change in K -stimulated [Ca ] . Comparison of2NGFi
PCET and1NGF PCET neurons during all treatments1 21showed that peak change in K -stimulated [Ca ] wasi
significantly lower (P50.0053) in1NGF PCET neurons(5546166 nM) than in2NGF PCET neurons (9056310nM) in the presence of 200 mg % EtOH.
There was a significant interaction (NGF3treatment;P50.0147) in the diet-control neurons that affected when
1 21peak change in K -stimulated [Ca ] occurred but not thei1 21level of peak change in K -stimulated [Ca ] . Com-i
parison of 2NGF diet-control with 1NGF diet-controlneurons during all treatments showed that in the2NGF
1 21diet-control neurons peak change in K -stimulated [Ca ]i
occurred significantly later (P50.0002) in 2NGF diet-control neurons (93639 s) than in1NGF diet-control
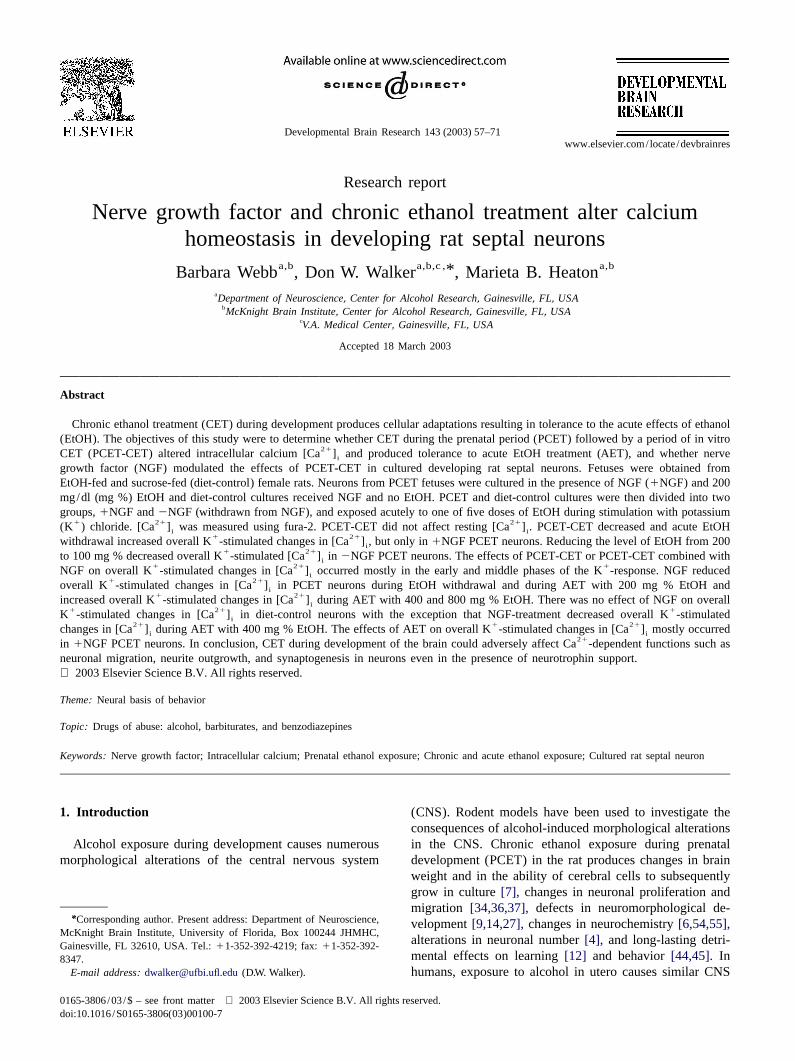
Fig. 7. Effect of AET in 1NGF PCET-CET neurons. (A) Overall neurons (36626 s) in the presence of 400 mg % EtOH1 21K -stimulated changes in [Ca ] were significantly greater (P,0.0001)i (Table 2). Within the2NGF diet-control treatment groups,with AET of 400 mg % EtOH and 800 mg % EtOH compared to overall
1 211 21 peak change in K -stimulated [Ca ] occurred signifi-K -stimulated [Ca ] in1NGF PCET-CET neurons in the presence of ii
1 21 cantly later in2NGF diet-control neurons treated with 400200 mg % EtOH. (B) Overall K -stimulated changes in [Ca ] werei
significantly lower with AET of 100 mg % or 200 mg % EtOH mg % EtOH compared with all other treatments (Table 2).(P,0.0001) and significantly higher (P,0.0001) with AET of 800 mg % Between group comparisons of peak change and time toEtOH compared with1NGF PCET-CET neurons that were withdrawn 1 21peak change in K -stimulated [Ca ] in1NGF PCET1 21 ifrom EtOH (0 mg %). (C) Overall K -stimulated changes in [Ca ]i
with 1NGF diet-neurons and2NGF PCET neurons withwere significantly lower with AET of 100 mg % EtOH, 200 mg % EtOH,2NGF diet-neurons demonstrated that PCET-CET did notand PCET-CET withdrawn from EtOH (0 mg %) compared with1NGF
1Diet-Con neurons that were not exposed to EtOH (0 mg %). Statistical effect peak change or time to peak change in K -stimu-21analysis: ANOVA with Bonferroni /Dunn post hoc test (P#0.05). lated [Ca ] in either1NGF or 2NGF neurons.i
affected differently by AET. First, we measured baseline 3 .10. Effects on the early, middle, and late phases of the1 21 1and K -stimulated changes in [Ca ] in2NGF diet- K -responsei
21control neurons. Baseline [Ca ] was the same in eachi1treatment group of2NGF diet-control neurons. AET did One limitation of analyses using the overall K -re-
1not significantly alter the K -response of2NGF diet sponse of the PCET and diet-control neurons is that it willcontrol neurons (Table 2). not detect the differential effects of PCET-CET, acute
1Second, we measured baseline and K -stimulated EtOH withdrawal, AET, and NGF effects on a specific21 1changes in [Ca ] in 1NGF diet-control neurons. phase(s) of the K -response. Therefore, we divided thei
21 1Baseline [Ca ] was the same in each treatment group of K -response into three phases: early (1–13 s), middlei
1NGF diet-control neurons (Table 2). The significant (14–30 s), and late phase (60–120 s). Between group
66 B. Webb et al. / Developmental Brain Research 143 (2003) 57–71
21comparisons of1NGF PCET neurons with1NGF diet- showed that acute EtOH withdrawal did not affect [Ca ]i1control neurons showed that1NGF PCET neurons that more during any one phase of the K -response than during
were acutely withdrawn from EtOH (0 mg %) or treated the others (Table 3). Comparison of the different phases of1with 100 mg % EtOH responded the same during all the K -response in the2NGF PCET neurons showed that
1phases of the K -response as1NGF diet-control neurons neurons treated acutely with 100, 400, or 800 mg % EtOH1 21that did not receive EtOH (0 mg %). During the early had significantly smaller K -stimulated changes in [Ca ]i
1phase of the K -response, acute treatment with 200 mg % compared to neurons treated with 200 mg % EtOH or1in 1NGF PCET neurons significantly reduced K -stimu- EtOH withdrawn neurons during the early and middle
21 1 1lated changes in [Ca ] compared to K -stimulated phases of the K -response (Table 3).i21changes in [Ca ] in1NGF diet-control neurons treated Within group comparisons of the effects of the differenti
21with 0 mg % EtOH (P,0.0001) or 200 mg % EtOH doses of AET on [Ca ] during the different phases of thei1(P50.0001). Acute treatment with 400 mg % EtOH K -response demonstrated that in2NGF diet-control
1 1significantly increased (P50.0003) K -response of neurons, AET did not affect the K -response differently1
1NGF PCET neurons compared to the K -response of during the early phase, that the response of neurons acutelysimilarly treated1NGF diet-control neurons. treated with 100 mg % EtOH was significantly less (P5
The response of the1NGF PCET neurons treated with 0.0001) than the response of neurons treated with 800 mg200 mg % EtOH was also significantly reduced compared % EtOH during the middle phase, and that the response of
1 21to K -stimulated changes in [Ca ] in1NGF diet-con- neurons acutely treated with 100 mg % EtOH was sig-i
trol neurons treated with 0 mg % EtOH during the early nificantly less (P50.0003) than the response of neurons(P,0.0001), middle (P,0.0001), and late phases (P5 treated with 200 mg % EtOH during the late phase of the
1 10.0007) of the K -response. During the middle (P, K -response (Table 3).10.0001) and late phases (P,0.0001) of the K -response Between group comparisons showed that2NGF PCET
only acute treatment of 200 mg % EtOH caused sig- neurons that were acutely withdrawn responded the same1nificantly less of a K -response in the1NGF PCET as2NGF diet-control neurons treated with 0 mg % EtOH.
1neurons than in the1NGF diet-control neurons demon- During the early and middle phases of the K -response,1strating that PCET-CET affected K -stimulated changes in treatment with 100 mg % EtOH and 800 mg % EtOH
21 1 1[Ca ] during all three phases of the K -response. significantly reduced the K -response of2NGF PCETi1neurons compared to the K -response of2NGF diet-
13 .11. Effects of acute ethanol withdrawal and AET on control neurons. During the middle phase of the K -1the early, middle, and late phases of the K -response in response treatment with 200 mg % EtOH significantly
12NGF neurons increased the K -response of2NGF PCET neurons
1compared to the K -response of2NGF diet-controlWithin group comparisons in2NGF PCET neurons neurons.
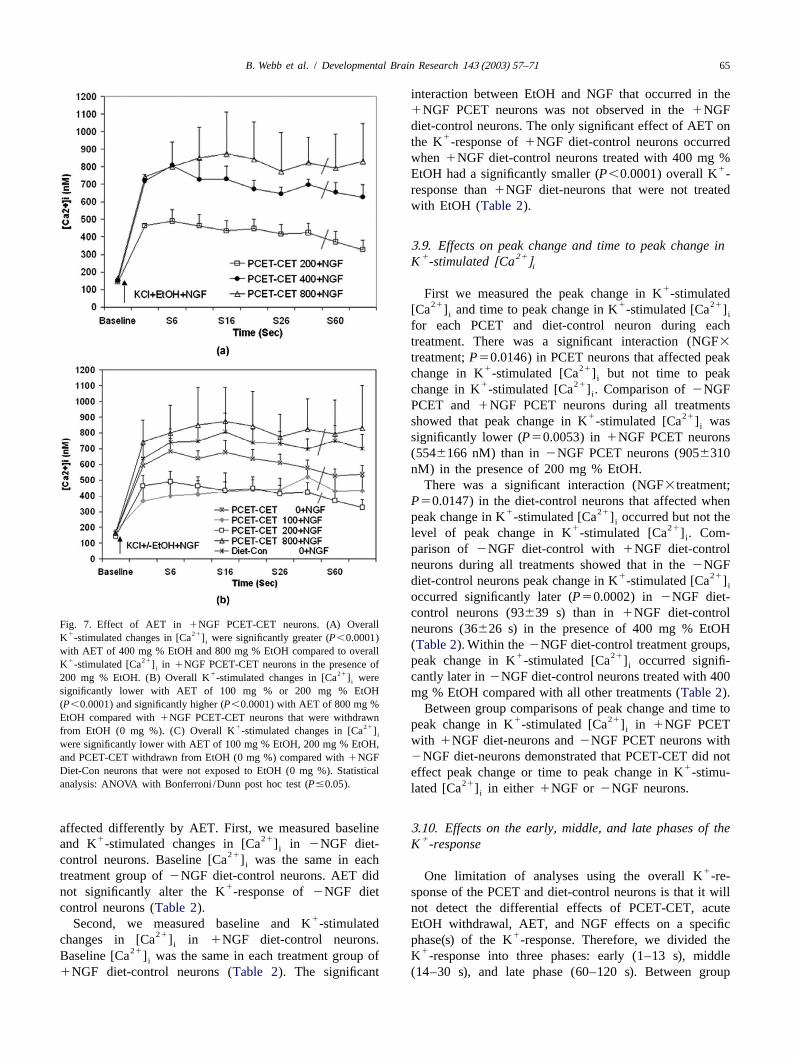
T able 31 21 1Measurements of K -stimulated changes in [Ca ] during the early, middle, and late phases of the K -response in septal neurons that were exposed toi
ethanol in utero (PCET) and cultured in the presence of 200 mg % EtOH (PCET-CET) and NGF and then either treated with (1NGF) or withdrawn fromNGF (2NGF)
Treatment Early (1–13 s) Middle (14–30 s) Late (60–120 s)21 21 21[Ca ] [Ca ] [Ca ]i i i
(nM) (nM) (nM)
1NGF PCET-CET0 mg % (no EtOH) 6486265 6256241 5326213100 mg % EtOH 395693* 4406106* 4306126200 mg % EtOH 4366176** 4286162* 3496154400 mg % EtOH 7586222* 6846109* 6416173
†800 mg % EtOH 8176485* 8226501* 8126620
2NGF PCET-CET0 mg % (no EtOH) 6576339 6946350 7496468100 mg % EtOH 361690* 414686* 422689200 mg % EtOH 6776233 7396219 7286304400 mg % EtOH 4836338* 5586268* 5406206800 mg % EtOH 4406207* 4786228* 4886338
Values are mean6S.D. Within NGF-treatment group comparisons statistical test by ANOVA and Bonferroni /Dunn post hoc test.*P,0.0001 compared to 0 or 200 mg %.** P50.0004 compared to 0 mg %.†P50.0003 compared to 200 mg %.
B. Webb et al. / Developmental Brain Research 143 (2003) 57–71 67
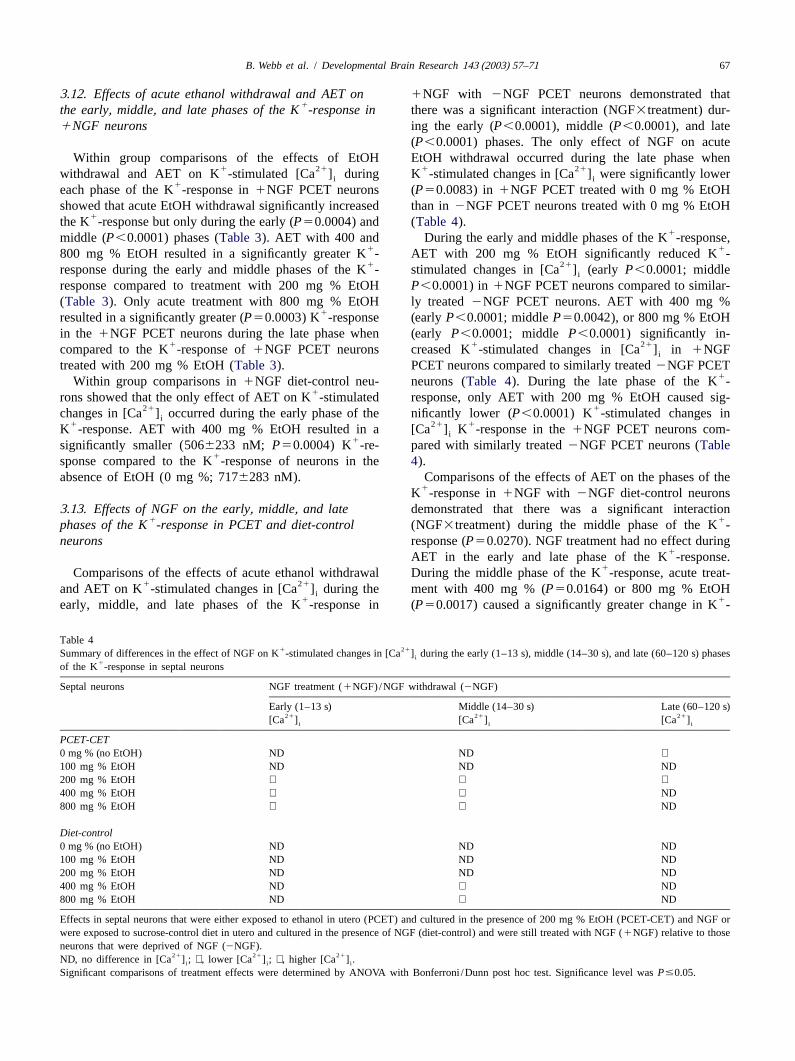
3 .12. Effects of acute ethanol withdrawal and AET on 1NGF with 2NGF PCET neurons demonstrated that1the early, middle, and late phases of the K -response in there was a significant interaction (NGF3treatment) dur-
1NGF neurons ing the early (P,0.0001), middle (P,0.0001), and late(P,0.0001) phases. The only effect of NGF on acute
Within group comparisons of the effects of EtOH EtOH withdrawal occurred during the late phase when1 21 1 21withdrawal and AET on K -stimulated [Ca ] during K -stimulated changes in [Ca ] were significantly loweri i
1each phase of the K -response in1NGF PCET neurons (P50.0083) in1NGF PCET treated with 0 mg % EtOHshowed that acute EtOH withdrawal significantly increased than in2NGF PCET neurons treated with 0 mg % EtOH
1the K -response but only during the early (P50.0004) and (Table 4).1middle (P,0.0001) phases (Table 3). AET with 400 and During the early and middle phases of the K -response,
1 1800 mg % EtOH resulted in a significantly greater K - AET with 200 mg % EtOH significantly reduced K -1 21response during the early and middle phases of the K - stimulated changes in [Ca ] (earlyP,0.0001; middlei
response compared to treatment with 200 mg % EtOH P,0.0001) in1NGF PCET neurons compared to similar-(Table 3). Only acute treatment with 800 mg % EtOH ly treated2NGF PCET neurons. AET with 400 mg %
1resulted in a significantly greater (P50.0003) K -response (earlyP,0.0001; middleP50.0042), or 800 mg % EtOHin the 1NGF PCET neurons during the late phase when (earlyP,0.0001; middle P,0.0001) significantly in-
1 1 21compared to the K -response of1NGF PCET neurons creased K -stimulated changes in [Ca ] in1NGFi
treated with 200 mg % EtOH (Table 3). PCET neurons compared to similarly treated2NGF PCET1Within group comparisons in1NGF diet-control neu- neurons (Table 4). During the late phase of the K -
1rons showed that the only effect of AET on K -stimulated response, only AET with 200 mg % EtOH caused sig-21 1changes in [Ca ] occurred during the early phase of the nificantly lower (P,0.0001) K -stimulated changes ini
1 21 1K -response. AET with 400 mg % EtOH resulted in a [Ca ] K -response in the1NGF PCET neurons com-i1significantly smaller (5066233 nM; P50.0004) K -re- pared with similarly treated2NGF PCET neurons (Table
1sponse compared to the K -response of neurons in the4).absence of EtOH (0 mg %; 7176283 nM). Comparisons of the effects of AET on the phases of the
1K -response in1NGF with 2NGF diet-control neurons3 .13. Effects of NGF on the early, middle, and late demonstrated that there was a significant interaction
1 1phases of the K -response in PCET and diet-control (NGF3treatment) during the middle phase of the K -neurons response (P50.0270). NGF treatment had no effect during
1AET in the early and late phase of the K -response.1Comparisons of the effects of acute ethanol withdrawal During the middle phase of the K -response, acute treat-
1 21and AET on K -stimulated changes in [Ca ] during the ment with 400 mg % (P50.0164) or 800 mg % EtOHi1 1early, middle, and late phases of the K -response in (P50.0017) caused a significantly greater change in K -
T able 41 21Summary of differences in the effect of NGF on K -stimulated changes in [Ca ] during the early (1–13 s), middle (14–30 s), and late (60–120 s) phasesi
1of the K -response in septal neurons
Septal neurons NGF treatment (1NGF)/NGF withdrawal (2NGF)
Early (1–13 s) Middle (14–30 s) Late (60–120 s)21 21 21[Ca ] [Ca ] [Ca ]i i i
PCET-CET0 mg % (no EtOH) ND ND ⇓100 mg % EtOH ND ND ND200 mg % EtOH ⇓ ⇓ ⇓400 mg % EtOH ⇑ ⇑ ND800 mg % EtOH ⇑ ⇑ ND
Diet-control0 mg % (no EtOH) ND ND ND100 mg % EtOH ND ND ND200 mg % EtOH ND ND ND400 mg % EtOH ND ⇑ ND800 mg % EtOH ND ⇑ ND
Effects in septal neurons that were either exposed to ethanol in utero (PCET) and cultured in the presence of 200 mg % EtOH (PCET-CET) and NGF orwere exposed to sucrose-control diet in utero and cultured in the presence of NGF (diet-control) and were still treated with NGF (1NGF) relative to thoseneurons that were deprived of NGF (2NGF).
21 21 21ND, no difference in [Ca ] ;⇓ , lower [Ca ] ; ⇑ , higher [Ca ] .i i i
Significant comparisons of treatment effects were determined by ANOVA with Bonferroni /Dunn post hoc test. Significance level wasP#0.05.
68 B. Webb et al. / Developmental Brain Research 143 (2003) 57–71
21stimulated [Ca ] in1NGF diet-control neurons com- result of exposure to ethanol, could manifest as mor-i1 21 phological alterations in the CNS[4,9,12,14,24,27,pared to the K -stimulated changes in [Ca ] in similarlyi
34,36,37,44,45,49,69].treated2NGF diet-control neurons (Table 4).21Since normal neuronal activity requires that [Ca ] bei
21maintained at an optimal level and increases in [Ca ] arei
required for neurotransmitter release, neurite outgrowth,21and other signal transduction events, levels of Ca that4 . Discussion
fall below this optimal level could greatly compromise21 cellular function and neuronal survival. PCET-CET re-4 .1. PCET-CET did not alter resting Ca homeostasis
2121 duced Ca influx in NGF-treated septal neurons. Reducedbut PCET-CET decreased voltage-dependent Ca influx21Ca influx could have major effects on morphologicalin cultured septal neurons
21and physiological processes that are dependent on Ca . Inthe hippocampus of adult rats, PCET resulted in decreasedAlthough septal neurons were chronically exposed tophysiological and short-term plasticity[15,47,56],reducedethanol in utero and in vitro, PCET-CET did not have a
21 the number of CA1 pyramidal cells[4,42,45], alteredlong-term effect on resting [Ca ] . One possible explana-i
organization of mossy fibers[69], synaptic physiology andtion for this result is that the septal neurons had adapted to21 synaptic formation[57], and delayed synaptogenesis andalcohol. Others have demonstrated that changes in Ca
cell maturation in the dentate gyrus[24,28]. Therefore,homeostasis may play a central role in processes leading to21reduced Ca influx resulting from PCET may have majoradaptation of cells to alcohol. For example, CET followed
21 effects on neurotransmitter release, neurite outgrowth, andby a period of withdrawal caused an elevation of [Ca ]i
other signal transduction events in adult septal neurons.in cultured IM-9 human lymphoblast cells[41]. Theaddition of EtOH after withdrawal of EtOH for 24 h
21 4 .2. PCET-CET increased the sensitivity of septaldecreased the elevated [Ca ] of alcohol-adapted cells toi
neurons to AETthe resting level of control cells demonstrating that alcoholdependence had developed at the cellular level.
11 While the K -response of PCET neurons in the presenceExamination of the K -response of septal neurons alsoor absence of NGF was quite sensitive to the effects ofrevealed that during the period of PCET-CET exposure,
21 1AET on changes in [Ca ] , K -stimulated changes insome adaptation to alcohol may have occurred. Withdrawal i211 21 [Ca ] in the diet-control neurons was not affected byof EtOH increased the K -stimulated changes in [Ca ] ii
AET. AET with levels of EtOH above 200 mg % causedin the 1NGF PCET-CET neurons. Although acute with-1 211 increases in K -stimulated changes in [Ca ] in NGF-drawal of EtOH increased the K -stimulated changes in i
121 treated PCET-CET neurons and decreased K -stimulated[Ca ] in the PCET-CET neurons in the presence of NGF,i211 21 changes in [Ca ] in NGF-withdrawn PCET-CET neu-the overall K -stimulated change in [Ca ] was still ii
rons. Brief exposure to EtOH inhibits L-type and N-typebelow that observed in diet-control neurons.VSCCs in neural cells[13] while CET up-regulates theIn the present study, PCET-CET decreased the overall
1 density and function of L-type VSCCs in septal neuronsresponse of the septal neurons to K -stimulation even inand PC-12 cells[17,32,63]. NGF can act directly tothe presence of NGF. PCET-CET inhibited voltage-depen-
21 increase conductance in and density of L-type VSCCs indent Ca entry into septal neurons in a manner similar to21 PC12 cells[52,53]. It is not clear whether or not NGF-how PCET alone affected voltage-dependent Ca entry in
21other neurons. PCET alone decreased voltage-dependent facilitation of Ca currents through L-type VSCCs is21entry of Ca into neonatal-dissociated whole brain neu- attributable to a direct action of NGF on the receptor, or
1rons during K -stimulation[29]. The decrease in voltage- indirectly by alteration of the state of the channel, such as21dependent Ca entry into neonatal-dissociated brain alteration of the phosphorylation state of the channel. The
neurons did not involve the selective inhibition of any data from this study did not demonstrate how PCET-CET21 21individual type of Ca channel. Ca -channel density affected the L-type VSCC. One possible explanation of our
increases over time in cultured septal neurons and septal data is that NGF could be acting at the same site of action21neurons express multiple Ca channel types[58]. The as PCET-CET. If NGF and EtOH act at the same site of
1K -response of cultured septal neurons is dependent on action on VSCCs, this would explain why NGF potentiated21 1extracellular Ca and|80% of the K -response occurs the action of EtOH in this study by causing greater
21 1 21through L-type Ca channels[8,58]. Therefore, it is increases or decreases in K -stimulated changes in [Ca ]i1possible that PCET-CET reduces the K -response of septal than were observed with AET alone or by actually
21neurons by slowing the development of Ca -channel reversing the effect of AET.densities or by inhibiting VSCCs. It is equally possible that
1PCET-CET affected the function of the VSCCs altering 4 .3. PCET-CET altered the effect of NGF on K -21their state of activation/ inactivation. Since VSCCs play an stimulated [Ca ] in cultured septal neuronsi
important role in normal cellular function, functionalchanges in these channels, ‘adaptation’ which occur as a PCET-CET neurons were sensitive to the effect of NGF

B. Webb et al. / Developmental Brain Research 143 (2003) 57–71 69
21 albino rats at 90 days of postnatal age, Am. J. Obstet. Gynecol. 173on Ca homeostasis and the diet-control neurons were(1995) 514–519.not. NGF has been reported to enhance the survival of
[7] P .M. Blakley, S. Federoff, Effects of prenatal alcohol exposure onbasal forebrain cholinergic neurons[21,22] and to modu- neural cells in mice, Int. J. Dev. Neurosci. 3 (1985) 69–76.21late septal, septohippocampal and HP neuronal Ca [8] D . Bleakman, J.D. Roback, B.H. Wainer, R.J. Miller, N.L. Harrison,homeostasis during AET[64–68]. In this study, the Calcium homeostasis in rat septal neurons in tissue culture, Brain
Res. 600 (1993) 257–267.presence of NGF was responsible for the effect of acute1 [9] R .C. Burrows, A.T. Shetty, D.E. Phillips, Effects of prenatal alcoholethanol withdrawal but not the effects of AET on K -
exposure on postnatal morphology of the rat oculomotor nucleus,21stimulated changes in [Ca ] in the PCET-CET neurons.i Teratology 51 (1995) 318–328.These results may explain why in previous studies our [10] B . Cheng, M.P. Mattson, NGF and bFGF protect rat hippocampallaboratory observed that PCET septal neurons were less and human cortical neurons against hypoglycemic damage by
stabilizing calcium homeostasis, Neuron 7 (1991) 1031–1041.sensitive than control septal neurons to the neuroprotective[11] J . Chiu, J.F. Brien, P. Wu, J.H. Eubanks, L. Zhang, J.N. Reynolds,action of neurotrophins[23]. NGF ameliorated the inhib-
Chronic ethanol exposure alters MK-801 binding sites in cerebralitory effect of CET on neurite outgrowth in control septalcortex of the near-term fetal guinea pig, Alcohol 17 (3) (1999)
neurons but not in PCET septal neurons. Our laboratory 215–221.1previously reported that NGF affected K -stimulated [12] P . Clausing, S.A. Ferguson, R.R. Holson, R.R. Allen, M.G. Paule,
21Prenatal ethanol exposure in rats: long-lasting effects on learning,changes in [Ca ] in different ways in different neuronali
1 Neurotoxicol. Teratol. 17 (1995) 545–552.populations. We observed NGF-facilitation of K -stimu-21 [13] F .T. Crews, A.L. Morrow, H. Criswell, G. Breese, Effects of ethanollated [Ca ] in medial septal neurons and NGF-inhibitioni on ion channels, Int. Rev. Neurobiol. 39 (1996) 283–343.
in septohippocampal neurons[64–68]. While PCET neu- [14] D .L. Davies, D.E. Smith, A Golgi study of mouse hippocampal CA1rons may not be responsive to one action by NGF, they pyramidal neurons following perinatal ethanol exposure, Neurosci.may be responsive to another action mediated through a Lett. 26 (1981) 49–54.
[15] J .L. Diaz-Granados, K. Spuhler-Phillips, M.W. Lilliquist, A. Amsel,different mechanism or signal-transduction pathway.S.W. Leslie, Effects of prenatal and early postnatal ethanol exposureIn summary, septal neurons developed an increased 3on [ H]MK-801 binding in rat cortex and hippocampus, Alcohol.
sensitivity to AET following PCET-CET. NGF treatment Clin. Exp. Res. 21 (5) (1997) 874–881.altered the responses of septal neurons to PCET-CET[16] F . Freund, D.W. Walker, Impairment of avoidance learning bywithdrawal and AET. These data provide important new prolonged ethanol consumption in mice, J. Pharmacol. Exp. Ther.
179 (1971) 284–292.insights into how PCET affects CNS neurons at the[17] E .H. Gerstin Jr., T. McMahon, J. Dadgar, R.O. Messing, Proteincellular level.
kinase C delta mediates ethanol-induced regulation of L-typecalcium channels, J. Biol. Chem. 273 (26) (1998) 16409–16414.
[18] A . Ghosh, J. Carnahan, M.E. Greenberg, Requirement of BDNF inactivity-dependent survival of cortical neurons, Science 263 (1994)A cknowledgements1618–1623.
[19] M . Gothert, K. Fink, Inhibition ofN-methyl-D-aspartate (NMDA)-Research support was provided by NIAAA grantsand L-glutamate-induced noradrenaline and acetylcholine release in
AA00200, AA10480, AA12151, and AA09128, the Medi- the rat brain by ethanol, Naunyn Schmiedebergs Arch. Pharmacol.cal Research Service Department of Veterans Affairs. 340 (1989) 516–521.
[20] Z . Gottesfeld, B. Morgan, J.R. Perez-Polo, Prenatal alcohol exposurealters the development of the sympathetic synaptic components andof nerve growth factor receptor expression selectivity in lymphoid
R eferences organs, J. Neurosci. 26 (3) (1990) 308–316.[21] M .B. Heaton, M. Paiva, D.J. Swanson, D.W. Walker, Modulation of
A 2 ethanol neurotoxicity by nerve growth factor, Brain Res. 620 (1993)[1] L .G. Aguayo, Ethanol potentiates the GABA -activated Cl current78–85.in mouse hippocampal and cortical neurons, Eur. J. Pharmacol. 187
(1990) 127–130. [22] M .B. Heaton, M. Paiva, D.J. Swanson, D.W. Walker, Responsiveness[2] P . Antuono, S. Sorbi, L. Bracco, T. Fusco, L.A. Amakucci, Discrete of cultured septal and hippocampal neurons to ethanol and neuro-
sampling technique in senile dementia of the alzheimer type and trophic substances, J. Neurosci. Res. 39 (1994) 305–318.alcoholic dementia: study of the cholinergic system, in: L. Amaduc- [23] M .B. Heaton, M. Paiva, D.J. Swanson, D.W. Walker, Alterations inci, A.N. Davison, P. Antuono (Eds.), Aging of the Brain and responsiveness to ethanol and neurotrophic substances in fetalDementia, Vol. 13, Raven Press, New York, 1980, pp. 151–158. septohippocampal neurons following chronic prenatal ethanol expo-
[3] T . Arendt, Y. Allen, R.M. Marchbanks, M.M. Schugens, J. Sinden, sure, Dev. Brain Res. 85 (1995) 1–13.P.L. Lantos, J.A. Gray, Cholinergic system and memory in the rat: [24] S .F. Hoff, Synaptogenesis in the hippocampal dentate gyrus: effectseffects of chronic ethanol, embryonic basal forebrain brain trans- of in utero ethanol exposure, Brain Res. Bull. 21 (1988) 47–54.plants and excitotoxic lesions of cholinergic basal forebrain projec- [25] P .D. Hughes, W.R. Wilson, S.W. Leslie, Effect of gestational ethanoltion system, Neuroscience 33 (1989) 435–462. exposure on the NMDA receptor complex in rat forebrain: from
[4] D .E. Barnes, D.W. Walker, Prenatal ethanol exposure permanently gene transcription to cell surface, Brain Res. Dev. Brain Res. 129reduces the number of pyramidal neurons in rat hippocampus, Dev. (2) (2001) 135–145.Brain Res. 1 (1981) 333–340. [26] S . Iosub, M. Fuchs, N. Hingol, D.S. Gromisch, Fetal alcohol
[5] S .V. Bhave, L.D. Snell, B. Tabakoff, P.L. Hoffman, Ethanol sen- syndrome revisited, Pediatrics 68 (1981) 475–479.sitivity of NMDA receptor function in developing cerebellar granule [27] L .A. Kotkoskie, S. Norton, Morphometric analysis of developing ratcells, Eur. J. Pharmacol. 369 (2) (1999) 247–259. cerebral cortex following acute prenatal ethanol exposure, Exp.
[6] A .C. Black Jr., L.W. Goolsby, G.A. Cohen, H.E. Young, Effects of Neurol. 106 (1989) 283–288.prenatal ethanol exposure on the hippocampal neurochemistry of [28] M . Ledig, L. Megias-Megias, G. Tholey, Effect of maternal alcohol

70 B. Webb et al. / Developmental Brain Research 143 (2003) 57–71
consumption on nerve cell development in the offspring, Alcohol [48] D .E. Shaywitz, D.J. Cohen, B.A. Shaywitz, Behavior and learningdifficulties in children of normal intelligence born to alcoholicAlcohol. Suppl. 1 (1991) 403–408.mothers, J. Pediatr. 96 (1980) 978–982.[29] Y .-H. Lee, K. Spuhler-Phillips, P.K. Randall, S.W. Leslie, Effects of
[49] D .E. Smith, D.L. Davies, Effect of perinatal administration ofprenatal ethanol exposure on voltage-dependent entry into neonatalethanol on the CA1 pyramidal cell of the hippocampus and Purkinjewhole-brain dissociated neurons, Alcohol. Clin. Exp. Res. 20 (5)cell of the cerebellum, J. Neurocytol. 19 (1990) 708–717.(1996) 921–928.
[50] K . Spuhler-Phillips, Y.H. Lee, P. Hughes, L. Randoll, S.W. Leslie,[30] E .S. Levine, C.F. Dreyfus, I.B. Black, M.R. Plummer, DifferentialEffects of prenatal ethanol exposure on brain region NMDA-me-effects of NGF and BDNF on voltage-gated calcium currents indiated increase in intracellular calcium and the NMDAR1 subunit inembryonic basal forebrain neurons, J. Neurosci. 15 (4) (1995)forebrain, Alcohol. Clin. Exp. Res. 21 (1) (1997) 68–75.3084–3091.
[51] A .P. Streissguth, A.P.S. Landesman-Dweyer, J.C. Martin, D.W.[31] M .P. Mattson, B. Cheng, Growth factors protect neurons againstSmith, Teratogenic effects of alcohol in humans and laboratoryexcitotoxic / ischemic damage by stabilizing calcium homeostasis,animals, Science 209 (1980) 353–361.Stroke 24 (1993) 136–140.
[52] J . Streit, H.D. Lux, Distribution of calcium currents in sprouting[32] T . McMahon, R. Anderson, P. Metten, J.C. Crabbe, R.O. Messing,PC12 cell, J. Neurosci. 9 (1989) 4190–4199.
Protein kinase C epsilon mediates up-regulation of N-type voltage-[53] J . Streit, H.D. Lux, Calcium current inactivation during nerve-
gated calcium channels by ethanol, Mol. Pharmacol. 57 (1) (2000)growth-factor-induced differentiation of PC12 cells, Eur. J. Physiol.
53–58.416 (1990) 368–374.
[33] L .D. Middaugh, W.O. Boggan, Ethanol levels in pregnant mice and [54] D .J. Swanson, M.A. King, D.W. Walker, M.B. Heaton, Chronicfetuses, Soc. Neurosci. Abstr. 16 (1990) 135. prenatal ethanol exposure alters the normal ontogeny of choline
[34] M .W. Miller, Effects of alcohol on the generation and migration of acetyltransferase activity in the rat septohippocampal system, Al-cerebral cortical neurons, Science 233 (1986) 1308–1311. cohol. Clin. Exp. Res. 19 (1995) 1252–1260.
[35] R .J. Miller, Multiple calcium channels and neuronal function, [55] D .J. Swanson, L. Tonjes, M.A. King, D.W. Walker, M.B. Heaton,Science 235 (1987) 46–52. Influence of chronic prenatal ethanol on cholinergic neurons of the
[36] M .W. Miller, Generation of neurons in the rat dentate gyrus and septohippocampal system, J. Comp. Neurol. 364 (1996) 104–112.hippocampus: effects of prenatal or postnatal treatment with ethanol, [56] S .E. Tan, R.F. Berman, E.L. Abel, C.S. Zajac, Prenatal alcoholAlcohol. Clin. Exp. Res. 19 (1995) 1500–1509. exposure alters hippocampal slice electrophysiology, Alcohol 7
[37] M .W. Miller, Limited ethanol exposure selectively alters the prolifer- (1990) 507–511.ation of precursor cells in the cerebral cortex, Alcohol. Clin. Exp. [57] H . Tanaka, F. Nasu, K. Inomata, Fetal alcohol effects: decreasedRes. 20 (1996) 139–144. synaptic formations in the field CA3 of fetal hippocampus, Int. J.
[38] J .J. Mitchell, M. Paiva, D.B. Moore, D.W. Walker, M.B. Heaton, A Dev. Neurosci. 9 (5) (1991) 509–517.comparative study of ethanol, hypoglycemia, hypoxia and neuro- [58] J .S. Thinschmidt, B. Webb, D.E. Martin, D.H. Feldman, M.A. King,trophic factor interactions with fetal hippocampal neurons: a multi- D.W. Walker, The development and pharmacological characterizationfactor in vitro model for developmental ethanol effects, Dev. Brain of calcium channel currents in cultured rat septal cells, Dev. BrainRes. 105 (1998) 241–250. Res. 118 (1999) 13–21.
[39] D .B. Moore, A.C. Ruygrok, D.W. Walker, M.B. Heaton, Effects of [59] J .D. Thomas, S.P. Weinert, S. Sharif, E.P. Riley, MK-801 administra-prenatal ethanol exposure on parvalbumin-expressing GABAergic tion during ethanol withdrawal in neonatal rat pups attenuatesneurons in the adult rat medial septum, Alcohol. Clin. Exp. Res. 21 ethanol-induced behavioral deficits, Alcohol. Clin. Exp. Res. 2197(5) (1997) 849–856. (1997) 1218–1225.
[40] M . Naassila, M. Daoust, Effect of prenatal and postnatal ethanol [60] D .W. Walker, G. Freund, Impairment of shuttle box avoidanceexposure on the developmental profile of mRNAs encoding the learning following prolonged alcohol consumption in rats, Physiol.NMDA receptor subunits in rat hippocampus, J. Neurochem. 80 (5) Behav. 7 (1971) 773–778.(2002) 850–860. [61] D .W. Walker, N. Lee, M.B. Heaton, M.A. King, B.E. Hunter,
[41] J . Nagy, Alcohol dependence at the cellular level: effects of ethanol Chronic ethanol consumption reduces the neurotrophic activity in raton calcium homeostasis of IM-9 human lymphoblast cells, J. Stud. hippocampus, Neurosci. Lett. 147 (1995) 77–80.Alcohol 61 (2) (2000) 225–231. [62] H .J. Walter, R.O. Messing, Regulation of neuronal voltage-gated
[42] E .P. Noble, T. Ritchie, Prenatal ethanol exposure reduces the effects calcium channels by ethanol, Neurochem. Int. 35 (2) (1999) 95–of excitatory amino acids in the rat hippocampus, Life Sci. 45 101.(1989) 803–810. [63] H .J. Walter, T. McMahon, J. Dadgar, D. Wang, R.O. Messing,
[43] S .A. Queen, C.F. Sanchez, S.R. Lopez, L.L. Paxton, D.D. Savage, Ethanol regulates calcium channel subunits by protein kinase CDose- and age-dependent effects of prenatal ethanol exposure on delta-dependent and independent mechanisms, J. Biol. Chem. 275hippocampal metabotropic-glutamate receptor-stimulated phos- (33) (2000) 25717–25722.phoinositide hydrolysis, Alcohol. Clin. Exp. Res. 17 (4) (1993) [64] B . Webb, M.B. Heaton, D.W. Walker, The effect of ethanol on887–893. calcium homeostasis in cultured embryonic hippocampal neurons is
[44] E . Reyes, J. Wolfe, D.D. Savage, The effects of prenatal alcohol altered by nerve growth factor, Alcohol. Clin. Exp. Res. 21 (9)exposure on radial arm maze performance in adult rats, Physiol. (1997) 1643–1652.Behav. 46 (1989) 45–48. [65] B . Webb, S.S. Suarez, M.B. Heaton, D.W. Walker, Ethanol and nerve
[45] E .P. Riley, The long-term behavioral effects of prenatal alcohol growth factor effects on calcium homeostasis in cultured embryonicexposure in rats, Alcohol. Clin. Exp. Res. 14 (1990) 670–673. rat medial septal neurons before and during depolarization, Brain
[46] C .A. Ruhe, J.M. Littleton, The possible role of voltage-operated Res. 701 (1995) 61–74.calcium channels in enhancement of excitatory amino acid toxicity [66] B . Webb, S.S. Suarez, M.B. Heaton, D.W. Walker, Cultured postnatalfollowing chronic ethanol exposure in vitro, Alcohol Alcohol. rat medial septal neurons respond to acute ethanol treatment andSuppl. 2 (1994) 217–221. nerve growth factor by changing intracellular calcium levels,
[47] D .D. Savage, S.A. Queen, C.F. Sanchez, L.L. Paxton, J.C. Mahoney, Alcohol. Clin. Exp. Res. 20 (8) (1996) 1385–1394.C.R. Goodlett, J.R. West, Prenatal ethanol exposure during the last [67] B . Webb, S.S. Suarez, M.B. Heaton, D.W. Walker, Cultured postnatalthird of gestation in the rat reduces hippocampal NMDA agonist rat septohippocampal neurons change intracellular calcium in re-binding site density in 45-day-old offspring, Alcohol 9 (1991) sponse to ethanol and nerve growth factor, Brain Res. 778 (1997)37–41. 354–366.

B. Webb et al. / Developmental Brain Research 143 (2003) 57–71 71
[68] B . Webb, S.S. Suarez, M.B. Heaton, D.W. Walker, Calcium homeo- receptor and calcium channel activity underlying ethanol withdrawalstasis in cultured embryonic rat septohippocampal neurons is altered hyperexcitabilty, Alcohol Alcohol. 30 (1) (1995) 105–114.by ethanol and nerve growth factor before and during depolarization, [71] J .J. Woodward, R.A. Gonzales, Ethanol inhibition ofN-methyl-D-Brain Res. 729 (1996) 176–189. aspartate-stimulated endogenous dopamine release from rat striatal
[69] J .R. West, C.A. Hodges, A.C. Black Jr., Prenatal exposure to ethanol slices: reversal by glycine, J. Neurochem. 54 (1990) 712–715.alters the organization of hippocampal mossy fibers in rats, Science [72] K . Yoshimoto, W.J. McBride, L. Lumeng, T.-K. Li, Alcohol stimu-211 (1981) 957–959. lates the release of dopamine and serotonin in the nucleus accum-
[70] M .A. Whittington, J.D. Lambert, H.J. Little, Increased NMDA bens, Alcohol 9 (1992) 17–22.


