NERC Frequency Response Standard Webinar 2011 07 18 DL/NERC_Frequency... · Industry Webinar...
58
Industry Webinar Industry Webinar BAL BAL-003 003-1 Draft Frequency Response 1 Draft Frequency Response Standard and Supporting Process Standard and Supporting Process J l 18 2011 July 18, 2011
Transcript of NERC Frequency Response Standard Webinar 2011 07 18 DL/NERC_Frequency... · Industry Webinar...

Industry WebinarIndustry WebinarBALBAL--003003--1 Draft Frequency Response 1 Draft Frequency Response Standard and Supporting ProcessStandard and Supporting Process
J l 18 2011July 18, 2011

AgendaAgenda
Frequency Response and Standard background
Overview of BAL-003-1
What’s changingWhat s changing
Field TrialF R S F 2• Frequency Response Survey Form 2
• Frequency Response Survey Form 1
O h fi ld i l i i i• Other field trial activities
Questions
2 Next Steps

Background
FERC Order 693 directed specific changes forFERC Order 693 directed specific changes for BAL-003
SAR drafted to address the issues identified by SAR drafted to address the issues identified by FERC
NERC OC th i d F R fi ld NERC OC authorized Frequency Response field trial to help standard development at the June 7–8 2011 OC meeting7–8, 2011 OC meeting
3

Frequency Response BasicsFrequency Response Basics
Frequency Response, termed beta (β), is• A fundamental reliability service
• A combination of governor and load response
Following a generator (or load loss)• β stabilizes frequency at a new pointβ stabilizes frequency at a new point
• Frequency does not return to 60 Hz until the contingent Balancing Authority replaces the loss
4

Typical Frequency EventsTypical Frequency Events
Typical Events (5 seconds before unit trip to 60 seconds thereafter)
5

Bias vs. Frequency ResponseBias vs. Frequency Response
Frequency Bias (B) is not the same as Frequency Response (β)• Frequency Response is actual MW contribution to stabilize frequency• Frequency Response is actual MW contribution to stabilize frequency• Bias is an approximation of β used in the ACE equation (prevents AGC
withdrawal of β)
Both are negative numbers (as frequency drops, MW output increases and g ( q y p , pvise versa)
Both are measured in MW/0.1Hz Bias (absolute value) must be > β (absolute value)Bias (absolute value) must be β (absolute value)
In the East, B (absolute value) is about 2-3 x as large as β (absolute value)
Bias (absolute value) must be at least 1% of Balancing Authority peak load under current standardunder current standard
If there is to be a difference between B and β, it is preferable to be over-biased
6

FRS Original GoalsFRS Original Goals
Original SAROriginal SAR• Objectively benchmark and track BA and
Interconnection performancep Confirm trends
Learn why and where response is low
• Additional generator level data from low responders
• Accurate data for models
• Enable technically sound decisions on setting any future performance obligations
7 FERC Order No. 693 directed additional work

BALBAL--003003--1 Overview1 Overview
Drafting Team proposing five Requirements ( l i i ifi t h )(only one is a significant change)• Frequency Response performance obligation
• Frequency Bias Setting Implementation
• AGC to be operated in Tie-Line Bias
• Appropriate Frequency Bias Setting for those providing Overlap Regulation Service,
• Minimum Frequency Bias Setting
NERC has committed to file BAL-003-1 in theNERC has committed to file BAL 003 1 in the first quarter of 2012 8

Reasons for ChangesReasons for Changes
FERC directives in Order No. 693FERC directives in Order No. 693• Determine the appropriate periodicity of frequency
response surveys p y
• Define the necessary amount of Frequency Response needed for Reliable Operation for each balancing authority with methods of obtaining and measuring that the frequency response is achieved
Details are described in the Background Document that will be posted with the Standard
9

Requirement R1Requirement R1
BA to provide an average (median) amount of Frequency Response for defined set of eventsFrequency Response for defined set of events
Frequency Response Obligation (FRO) is defined for upcoming year (based on BA size)defined for upcoming year (based on BA size)
BA reports performance at the end of the year for frequency excursions during the yearfor frequency excursions during the year
Most, if not all BAs should have no trouble meeting FROmeeting FRO• Generally sufficient Frequency Response in each
Interconnection
• Standard provides mechanisms to obtain response10

R2R2--R5 Similar to TodayR5 Similar to Today
2. Implement Frequency Bias Setting on date specified p q y g pby NERC
3. AGC operation in Tie-Line Bias, unless detrimental to reliability
4. Defines how Overlap Regulation providers Simplement Bias Setting
5. Identifies minimum Bias Setting Drafting team proposes 0.8% of peak/0.1Hz
Attachment B outlines process for changes to Bias Setting floorfloor
11

Attachment A to the StandardAttachment A to the Standard
Defines Process NERC will follow toDefines Process NERC will follow to• Select events for analysis
All t th I t ti ’ F R• Allocate the Interconnection’s Frequency Response Obligation to BAs
• NERC will publish lists of events during the year so• NERC will publish lists of events during the year so BAs will have “heads up” on events that will be used
BAs encouraged to develop local tools to scan BAs encouraged to develop local tools to scan for events and capture data for ongoing analysis
12

Allocation Methodology in Attachment A
Determine FRO based on the average ofDetermine FRO based on the average of forecasted peak load and installed capacity
Formula Formula
FROBA = FROInt x
13

EstimatingEstimating your FROyour FRO
1. Use the proposed FRO for your Interconnection1. Use the proposed FRO for your Interconnection Eastern Western Texas HQ Starting Frequency 60 60 60 60 Hz *Highest UFLS 59.6 59.5 59.3 58.5 Hz
2. Multiply this value by:
Contingency Protection Criteria 4500 2740 2750 1700 MW **Base Obligation 1125 548 229 113 MW/0.1HzWith 25% Safety Margin 1406 685 286 141 MW/0.1Hz
p y y_____Your BA’s Bias Setting____Your Interconnection’s Total Bias
You can find Bias Setting values at:
http://www nerc com/docs/oc/rs/2011%20CPS2%20Bounds%20Reporthttp://www.nerc.com/docs/oc/rs/2011%20CPS2%20Bounds%20Report%20v6b(Update20110601).pdf
14

Key Field Trial ActivitiesKey Field Trial Activities
Frequency events have been identified for theFrequency events have been identified for the period December 2010 through present utilizing Attachment A of the proposed standard
NERC is requesting that the BAs fill out FRS Forms 1 and 2 for those events related to the interconnection in which the BA operates
This data request was approved by the NERC This data request was approved by the NERC Operating Committee at their June 7–8, 2011 meetingg
15

Other Field Trial ActivitiesOther Field Trial Activities
2010 NERC Recommendations (Alerts) on2010 NERC Recommendations (Alerts) on governors and BA Frequency Response
2011 Bias calculation 2011 Bias calculation
2012 Bias calculation (following Attachment A )process)
Evaluate impact due to change from 1% to 0.8% floor for Bias Setting
Adjust based on observationsj
16

Candidate Frequency Event DetectionCandidate Frequency Event Detection
Combination of tools used: Univ of Tenn Enhanced FNet System Univ. of Tenn. Enhanced FNet System
• High-speed sensors (10 samples/second)• Detects frequency excursions and estimates gen or load lost• Triangulates to estimate location of disturbance• Records data & calculates key frequency response factors
CERTS Resource Adequacy (RA)Tool CERTS Resource Adequacy (RA)Tool• Smart Alarm System
Based on 1-minute average frequency ICCP readings
Indicates frequency deviations and alarms beyond trigger levels
Provides BA-level variances in ACE
CERTS Frequency Monitoring and Analysis (FMA) Tool
17
CERTS Frequency Monitoring and Analysis (FMA) Tool• After-the-fact analysis of detected and recorded data

Frequency Triggers for DetectionFrequency Triggers for Detection
Frequency Deviation• Eastern – ±60 mHz• Eastern – ±60 mHz• Western – ±80 mHz• Texas – ±100 mHz
Resource / Load Loss (FNet Estimate)• Eastern – ±1,000 MW• Western – ±700 MW• Texas – ±450 MW
18

FNet Sample Detection OutputFNet Sample Detection OutputTrace of All Eastern Interconnection FDRs Trace of All Eastern Interconnection FDRs
19
Courtesy of Power Information Technology Laboratory, University of Tennessee

FNet Sample OutputFNet Sample Output5 Point Median Eastern Interconnection 5 Point Median Eastern Interconnection
Point A
Estimated Resource Loss
60.0080 Hz
1,360 MWActual Resource Loss
1,178 MWDelta FrequencyP i t C P i B Delta Frequency
A to C – 58.8 mHz
A to B – 53.9 mHz
Point C 59.9492 Hz
Point B 59.9541 Hz
Interconnection Frequency Response
A-C -2,003 MW/0.1 Hz
20
Courtesy of Power Information Technology Laboratory, University of Tennessee
HzA-B -2,186 MW/0.1
Hz

Frequency Event Selection CriteriaFrequency Event Selection Criteria
1. Freq. Resp. Measurement Periods (12 months)• December 1 through November 30• December 1 through November 30
2. At least 25 Freq. excursions/interconnection• Older events used if necessaryOlder events used if necessary
3. Event stabilization must be in less than 18 seconds, AND:
Point C Point CInterconnection Delta F (Hz) Under Freq. Over Freq.
Eastern 0 04 < 59 97 > 60 03Eastern 0.04 < 59.97 > 60.03Western 0.04 < 59.97 > 60.03Texas 0.15 < 59.97 > 60.03
Q
21
Quebec 0.04 < 59.97 > 60.03

Frequency Event Selection CriteriaFrequency Event Selection Criteria
4. Pre-disturbance frequency stable and ~60 Hz• Value A calculated for -16 sec to 0 sec before transient• Value A calculated for -16 sec. to 0 sec. before transient
5. Events with a second event before first scan of Value B not used
6. Exclude frequency events near top of hour when large changes in load or interchange are occurring
7. Use cleanest 2-3 frequency excursions each month – older or other events from same season may be substitutedy
Other detected candidate events may be used by ERO to evaluate interconnection frequency response performance
22
performance

Introduction of FRS Form 2Introduction of FRS Form 2
FRS Form 2 receives BA AGC scan rate data toFRS Form 2 receives BA AGC scan rate data to measure the BA’s primary frequency response performance to a single, identified frequency perturbation on the system.
Measures the change in Net Actual Interchange g gand the change in frequency due to the perturbation.
Standardizes the measurement process for all BAs in all Interconnections.• The field trial is testing 5 different average periods in
this measure.23

ObjectiveObjective
We will review the function of FRS Form 2.We will review the function of FRS Form 2.
The general layout where input from the BA is requiredrequired.
What data is required for each event.
Where this data is placed in Form 2.
How to execute the calculation of frequency How to execute the calculation of frequency response performance.
File naming convention File naming convention.24

FRS Form 2 FunctionFRS Form 2 Function
3850.0
60.06
60.08
Balancing Authority My BA Initial P.U. PerformanceMonday, October 12, 2009Monday, October 12, 2009Monday, October 12, 2009 1.171Monday, October 12, 2009
2.046 Initial P.U. Performance Adjusted
20 to 52 second Average Period
3800.0
59.98
60
60.02
60.043788.85
1. Aligns the data for
3700.0
3750.0
59.9
59.92
59.94
59.96
uency ‐H
z MW
MW
MW
3715.464
MW
gaveraging for each average period.
3650.0
59.82
59.84
59.86
59.88Freq
u
59.8888
3645 30 3 C l l t t d3600.0
59.74
59.76
59.78
59.8
3645.30
2. Calculates pre and post event average change.
3. Calculates expected response to meet the FRO and actual response.
25
3550.059.72
2:26:24 2:26:34 2:26:44 2:26:54 2:27:04 2:27:14 2:27:24 2:27:34 2:27:44 2:27:54 2:28:04 2:28:14 2:28:24
Hz Average Frequency MW Average MW EPFR for FRO Adjusted

FRS Form 2 Workbook Tabs FRS Form 2 Workbook Tabs –– Entry DataEntry Data
26“Entry Data” Tab: General BA information and evaluation execution.

FRS Form 2 Workbook Tabs FRS Form 2 Workbook Tabs -- DataData
“Data” Tab: BA Event scan rate data placed in specific columns.
27

FRS Form 2 Workbook Tabs FRS Form 2 Workbook Tabs -- EvaluationEvaluation
28“Evaluation” Tab: All calculations of performance with data tables for averaging data and graphing are in columns A through DR.
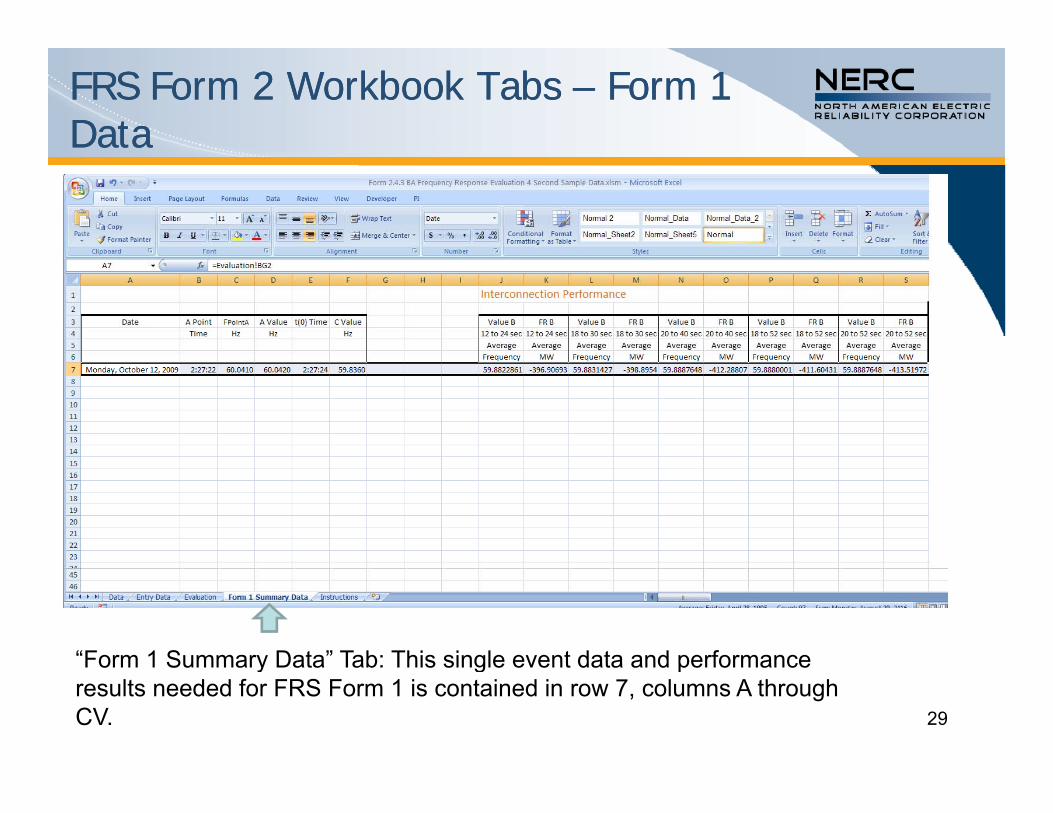
FRS Form 2 Workbook Tabs FRS Form 2 Workbook Tabs –– Form 1 Form 1 DataData
“Form 1 Summary Data” Tab: This single event data and performance
29
Form 1 Summary Data Tab: This single event data and performance results needed for FRS Form 1 is contained in row 7, columns A through CV.

FRS Form 2 Workbook Tabs FRS Form 2 Workbook Tabs -- InstructionsInstructions
30“Instructions” Tab: Detailed instructions for each step of the process.

FRS Form 2 Spreadsheet Setup FRS Form 2 Spreadsheet Setup –– Entry Entry DataData1. Enter your BA’s name(pneumonic) in cell “B1” and Frequency Response
Balancing Authority Name: My BABalancing Authority Frequency Response
Obligation (FRO from FRS Form 1) ‐80
Note: See "Instruction" tab for more detailed instructions.Cell b
Frequency Response Obligation (FRO) in cell “B2” in the green highlighted cells of the “Entry Data”
Step 1. Copy and Paste Event Data into the appropriate cells of the "Data" worksheet.Maintain date and time format of mm/dd/yy hh:mm:ss.
Step 2.Determine Time of T(0) and edit formula in cell "C8" to reference the correct row of the "Data" worksheet. 2:27:24T(0) is the first change in frequency of about 0.010 Hz (10 mHz) which should be the first scan of frequency data of the event.
Step 3. Time of Frequency Recovery to 60 Hz or Pre‐Perturbation Hz 2:33:08
begworrefefreq
worksheet. Save the file as a master copy for your BA.
Step 4. Enter MW output of generator or load that caused event (+ for gen loss, ‐ for load loss) 633 MW(Value from NERC Event List. If multiple units, enter total MW loss.)
Step 5.Hit the big blue button to copy your data for pasting into FRS Form 1 "BA Event Data" worksheet.
60.05
60.1
Copy Form 2 Data for Pasting into Form 1
59.7
59.75
59.8
59.85
59.9
59.95
60
31
Step 6. Paste data into FRS Form 1 in the appropriate row on the "BA Event Data" worksheet.
Step 7. Save this workbook using the following file name format:NYISO_yymmdd_hhmm_FRS_Form2.xlsx10/12/09 Date mmddyy
2:27 Time hh:ss of T(0)

FRS Form 2 Spreadsheet Layout FRS Form 2 Spreadsheet Layout -- DataData
Critical Data: Time,
Important Data: Transferred Frequency Response, Contingent BA Loss Bias
JOU Non‐ Transferred ContingentN t D i C f i P d R i F BA BA BA
frequency and NAI.Contingent BA Loss, Bias Setting and BA Load
Net Dynamic Conforming Pumped Ramping Frequency BA BA BAActual Schedules Load Hydro Units Response Lost Generation Bias Load
Interchange Imp(‐) Exp (+) Load (‐) Load (‐) Gen (+) Gen (+) Rec (‐) Del (+) Load (‐) Gen (+) SettingTime (T) Hz MW MW MW MW MW MW/0.1 Hz MW MW/0.1 Hz MW
10/12/09 02:12:00 59.981 3669.878418 350 351.361511 0 0 10 15 ‐103 750010/12/09 02:12:04 59 981 3671 699707 350 351 361511 0 0 5 10 15 103 7500 3310/12/09 02:12:04 59.981 3671.699707 350 351.361511 0 0.5 10 15 ‐103 7500.3310/12/09 02:12:08 59.98 3671.698486 350 351.361511 0 1 10 15 ‐103 7500.66
Optional Data: Adjustments –JOU, Non-conforming load, Pumped Hydro, Ramping Units.
32
DO NOT delete columns for any optional data not utilized or any non-applicable data for Transferred Frequency Response, Contingent BA Loss or Load,. Leave data as zero or blank.

Data Sign ConventionData Sign Convention
Net Actual Interchange +/-
Joint Owned Unit• Import (-) Export (+)Import ( ) Export ( )
Non-Conforming Load (-)O i E l i k h fli i i i• Option on Evaluation worksheet to flip sign to positive in cell “AS1”. Enter “+” if your load data is positive. Enter “-” if your load data is negative.y g
Pumped-HydroL d ( ) G (+)• Load (-) Gen (+)
Ramping Units Gen (+) 33
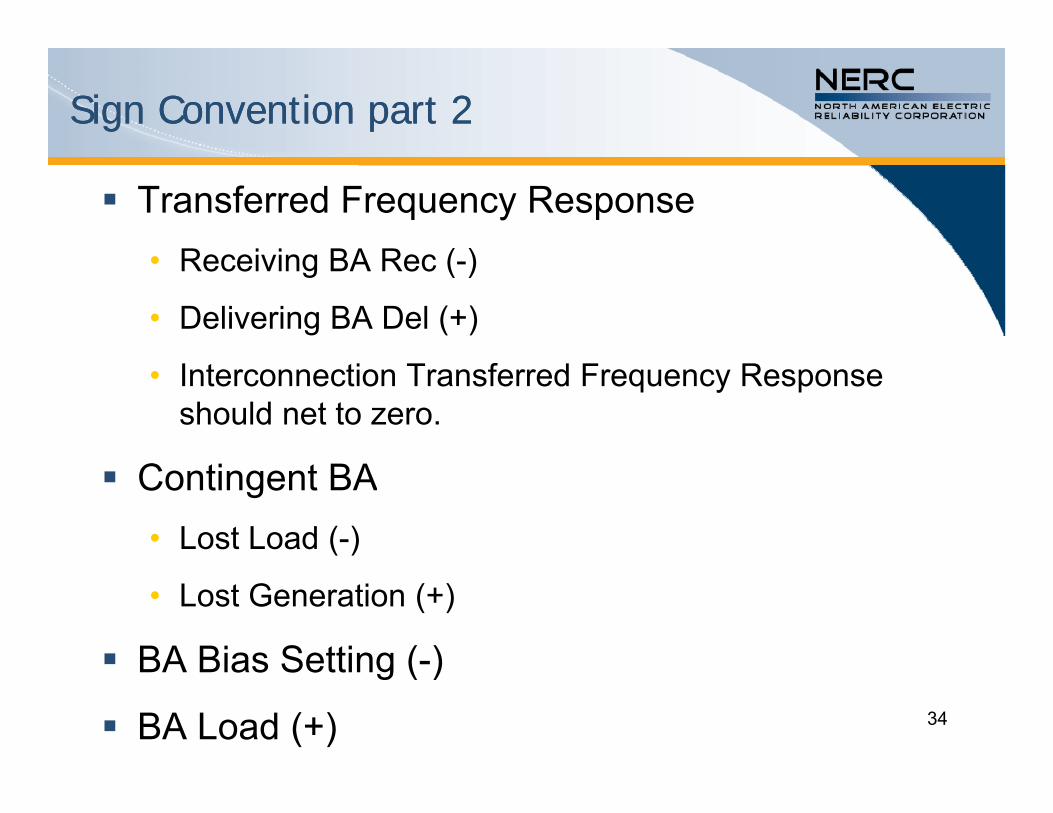
Sign Convention part 2Sign Convention part 2
Transferred Frequency ResponseR i i BA R ( )• Receiving BA Rec (-)
• Delivering BA Del (+)
• Interconnection Transferred Frequency Response should net to zero.
Contingent BA• Lost Load (-)
• Lost Generation (+)
BA Bias Setting (-) BA Bias Setting (-)
BA Load (+) 34

Form 2 Pasting Data into Data WorksheetForm 2 Pasting Data into Data Worksheet
Historian data collection formulas should beHistorian data collection formulas should be removed from Form 2 before submitting. Use PasteSpecial/Values to strip formulas and only paste data values into the worksheet.
Do not delete any data columns.y
Provide a minimum of 5 minutes of data before the beginning of the event and a minimum of 15the beginning of the event and a minimum of 15 minutes of data after the event. The spreadsheet will easily accommodate 60 p yminutes of data.
35

FRS Form 2 FRS Form 2 -- ExecutionExecution
After pasting event data into Form 2, determineAfter pasting event data into Form 2, determine the time of the beginning of the event.• Observe the frequency graph on the Entry DataObserve the frequency graph on the Entry Data
worksheet for the approximate time of the event.
• On the “Data” worksheet, scroll down the frequency , q ydata column to the approximate time to determine the first change in frequency at the beginning of the eventevent.
• Note the row number in the “Data” worksheet that this occurs.occurs.
36

FRS Form 2 FRS Form 2 –– Execution Execution –– Beginning of Beginning of EventEvent
Row 237 contains the first change in frequencyin frequency identifying the beginning of the event.
37

FRS Form 2 Execution FRS Form 2 Execution –– Set Event Set Event BeginningBeginningg gg g
Return to the “Entry Data” worksheet and editReturn to the Entry Data worksheet and edit the formula in cell “C8” to reference the row number (237) in the previous step.
Select cell “C8” and editSelect cell C8 and edit formula here to reference row identified in previous step. Press
38
enter.

FRS Form 2 Execution FRS Form 2 Execution –– Event End TimeEvent End Time
Return to the “Data” worksheet and determineReturn to the Data worksheet and determine when frequency returns to 60.00 Hz, schedule or the pre-event frequency.• Note the row number on the “Data” worksheet that
this occurs.
39

FRS Form 2 Execution FRS Form 2 Execution –– Find Event End Find Event End TimeTime
Row 323 contains the recovery frequency
40
frequency identifying the end of the event.

FRS Form 2 Execution FRS Form 2 Execution –– Set Event End Set Event End TimeTime
Return to the “Entry Data” worksheet and editReturn to the Entry Data worksheet and edit the formula in cell “C11” to reference the row number (323) in the previous step.
Select cell “C11” and edit formula here toformula here to reference row identified in previous step. Press enter.
41

FRS Form 2 FRS Form 2 –– Execution completeExecution complete
If available from Form 1, enter the size (in MW) of the generator or load that caused this eventof the generator or load that caused this event into cell “C15” of the “Entry Data” worksheet.
Thi i ti l f th I t ti f• This is optional for the Interconnection performance evaluation.
E ec tion is no complete Execution is now complete.• Performance of your BA for all the average periods in
the field trial is ready to be copied into FRS Form 1the field trial is ready to be copied into FRS Form 1.
• Perform a mouse click on the “Copy Form 2 Data for Pasting into Form 1” macro on the “Entry Data”Pasting into Form 1 macro on the Entry Data worksheet. The correct data is now copied.
42

Alternate Copy of Performance DataAlternate Copy of Performance Data
If you prefer not to enable macros.If you prefer not to enable macros.• Navigate to the “Form 1 Summary Data” worksheet.
S l t ll “A7 th h CV7”• Select cells “A7 through CV7”
• Select copy.
• PasteSpecial/Values into FRS Form 1.
43

FRS Form 2 File Naming ConventionFRS Form 2 File Naming Convention
Use the following file name convention.Use the following file name convention.• Xxxxx_yymmdd_hhmm_FRS_Form2.xlsm
Where xxxxx is your BA pneumonic Where xxxxx is your BA pneumonic
yy is year
mm is monthmm is month
dd is day
hh is hour
mm is minute
44

Introduction of FRS Form 1Introduction of FRS Form 1
One FRS Form 1 for each Interconnection willOne FRS Form 1 for each Interconnection will be generated and posted by NERC.
Contains list of events: date and time that each Contains list of events: date and time that each BA in that Interconnection must measure performance by completing a FRS Form 2.p y p g
As each FRS Form 2 is completed, the resulting BA performance data is added to FRS Form 1BA performance data is added to FRS Form 1 by using the PasteSpecial/values action.
Each BA creates a FRS Form 1 with the Each BA creates a FRS Form 1 with the performance of their BA to each event. 45

ObjectiveObjective
FRS Form 1 layoutFRS Form 1 layout
BA data entry.
FRS Form 2 data entry.
FRS Form 1 file naming convention.g
46

FRS Form 1 LayoutFRS Form 1 Layout
“Instructions” Tab: Basic instructions for completing FRS Form 1Instructions Tab: Basic instructions for completing FRS Form 1.
47

FRS Form 1 Layout FRS Form 1 Layout –– Data Entry TabData Entry Tab
Selecting “N” will add the performance of the event to the yearly average.
Enter appropriate i f ti i thinformation in the green cells. The “reason’s” section will be entered only if adjustments are y jutilized in the analysis.
48Correct “year” information will automatically update when the 24th frequency event is identified by NERC and added to the Event Date/Time column.

FRS Form 1 BA Form 2 Event DataFRS Form 1 BA Form 2 Event Data
PasteSpecial/Values your BA performance results from FRS Form 2 on the appropriate event row starting in row “7”, column “D” through “CY” for all identified events.
“BA Form 2 Event Data” Tab: The BA will enter the performance data from FRS Form 2 in this section.
49

FRS Form 1 Naming ConventionFRS Form 1 Naming Convention
Use the following file name convention.Use the following file name convention.• Xxxxx_yyyy_FRS_Form1.xlsm
Where xxxxx is your BA pneumonic Where xxxxx is your BA pneumonic
yyyy is year
50
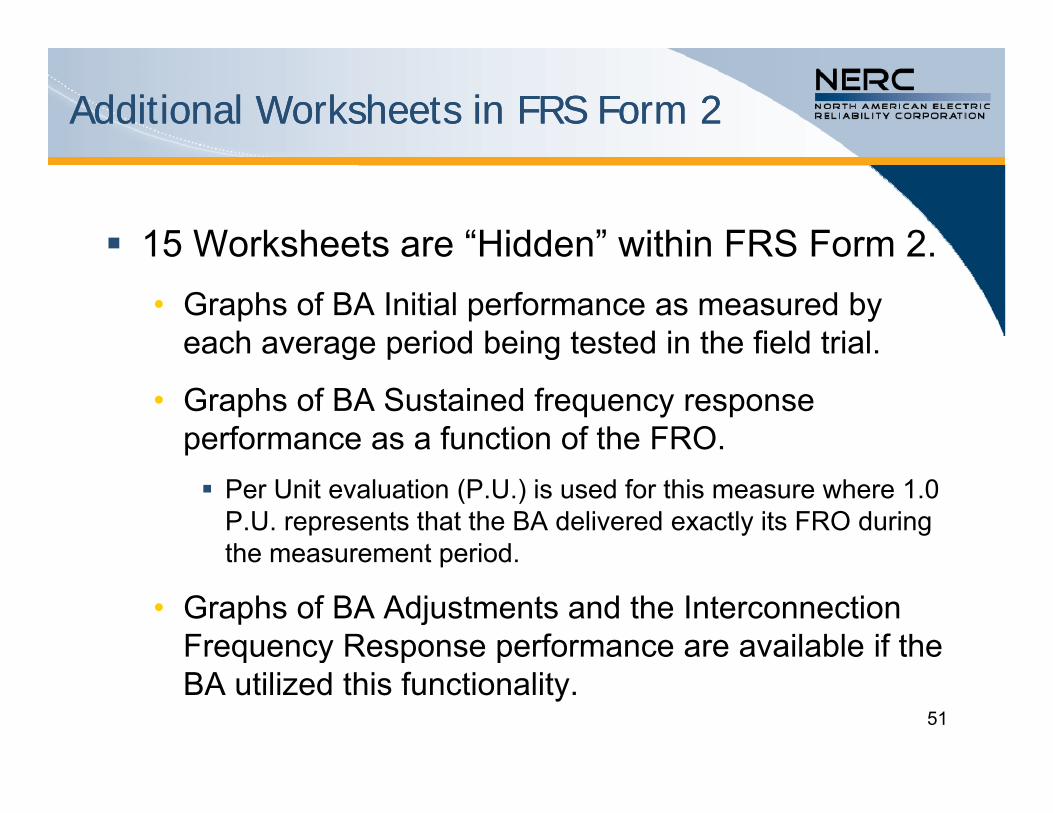
Additional Worksheets in FRS Form 2Additional Worksheets in FRS Form 2
15 Worksheets are “Hidden” within FRS Form 2.15 Worksheets are Hidden within FRS Form 2.• Graphs of BA Initial performance as measured by
each average period being tested in the field trial.g p g
• Graphs of BA Sustained frequency response performance as a function of the FRO. Per Unit evaluation (P.U.) is used for this measure where 1.0
P.U. represents that the BA delivered exactly its FRO during the measurement period.the measurement period.
• Graphs of BA Adjustments and the Interconnection Frequency Response performance are available if the yBA utilized this functionality.
51

To View Hidden WorksheetsTo View Hidden Worksheets
Right “click” any tab at the bottom of theRight click any tab at the bottom of the workbook.
Select “Unhide” Select Unhide .
Select the worksheet to be displayed.
Select ok.
52

Graph Example Graph Example –– BA Performance 20 to BA Performance 20 to 52 second evaluation.52 second evaluation.
3850.0
60.06
60.08
Balancing Authority My BA Initial P.U. PerformanceMonday, October 12, 2009Monday, October 12, 2009Monday, October 12, 2009 1.171Monday, October 12, 2009
2.046 Initial P.U. Performance Adjusted
20 to 52 second Average Period P.U. performance is displayed. (Adjusted and
3800.0
59.98
60
60.02
60.043788.85
Actual Net Interchange
The first change in frequency will always align
unadjusted).
3700.0
3750.0
59.9
59.92
59.94
59.96
uency ‐H
z MW
MW
MW
3715.464
MW
Interchange MW
q y y gin the center of this graph.
3650.0
59.82
59.84
59.86
59.88Freq
u
59.8888
3645 30
The minimum frequency response to meet FRO for
3600.0
59.74
59.76
59.78
59.8
3645.30 meet FRO for this single event is displayed.
The “average” periods of the pre event and post event data is highlighted.
53
3550.059.72
2:26:24 2:26:34 2:26:44 2:26:54 2:27:04 2:27:14 2:27:24 2:27:34 2:27:44 2:27:54 2:28:04 2:28:14 2:28:24
Hz Average Frequency MW Average MW EPFR for FRO Adjusted

Graph Example Graph Example –– Sustained GraphSustained Graph
3850.0
60.06
60.08
My BA 0.895 Sustained P.U. PerformanceMonday, October 12, 2009
3750.0
3800.0
59.98
60
60.02
60.04
3700.0
59.9
59.92
59.94
59.96
quen
cy ‐Hz M
WThe Event recovery period “Target” is calculated and
3600.0
3650.0
59.82
59.84
59.86
59.88Freq
gdisplayed based on the BA’s FRO, starting and ending NAI.
3550.0
59.74
59.76
59.78
59.8
The Ramp MW trend is calculated based on beginning and ending NAI adjusted for starting and ending frequency.
54
3500.059.72
2:26:24 2:27:24 2:28:24 2:29:24 2:30:24 2:31:24 2:32:24 2:33:24 2:34:24 2:35:24 2:36:24 2:37:24 2:38:24 2:39:24 2:40:24 2:41:24 2:42:24
Hz Interchange MW Recovery Period Target MW Recovery Period Ramp MW

Question & Answer
55

Working Documents
Draft BAL-003-1Draft BAL 003 1
Draft Attachment A to BAL-003-1
Draft Attachment B to BAL-003-1
Draft FRS Form 1
Draft FRS Form 2
BAL-003-1 Background Document
56

Next StepsNext Steps
Download FRS Forms 1 and 2 for your Interconnection yand Scan Rate
• Files can be found at: http://www.nerc.com/filez/standards/Frequency_Response-RF.html
( f f ) f Extract data (5 minutes before to 15 minutes after) for each event
Populate FRS Forms 1 and 2 (one FRSForm 2 for each Populate FRS Forms 1 and 2 (one FRSForm 2 for each event)
The address to send FRS Forms 1 and 2 will be The address to send FRS Forms 1 and 2 will be distributed with the announcement of event dates.
57

Contact InformationContact Information
If you have questions related to the dataIf you have questions related to the data request, contact:• Questions concerning FRS Form 1 and FRS Form 2
Sydney Niemeyer
– (T) 713.537.3715
– (E) [email protected]
• Questions concerning the Standard and Associated Documents
Darrel RichardsonDarrel Richardson
– (T) 609.613.1848
– (E) [email protected]
58