nepc.colorado.edu€¦ · Web viewnepc.colorado.edu
107
2.21.19 A Consumer’s Guide to Testing under ESSA Madhabi Chatterji 1 A Consumer’s Guide to Testing under the Every Student Succeeds Act (ESSA): What Can the Common Core and Other ESSA Assessments Tell Us? Madhabi Chatterji, Ph. D. Teachers College, Columbia University Prepared for the National Education Policy Center (NEPC) at the University of Colorado, Boulder February 21, 2019
Transcript of nepc.colorado.edu€¦ · Web viewnepc.colorado.edu

2.21.19A Consumer’s Guide to Testing under ESSA
Madhabi Chatterji 1
A Consumer’s Guide to Testing under the Every Student Succeeds Act (ESSA): What Can the Common Core and Other
ESSA Assessments Tell Us?
Madhabi Chatterji, Ph. D.
Teachers College, Columbia University
Prepared for the National Education Policy Center (NEPC) at the University of Colorado, Boulder
February 21, 2019
2.21.19A Consumer’s Guide to Testing under ESSA
Madhabi Chatterji 2
Note:
The author is solely responsible for the content and opinions expressed in this guide, which are not attributable to the National Education Policy Center (NEPC), or other authors and entities referenced or cited in the guide.
Errata:
An earlier version of this Guide incorrectly described the PARCC tests as having vertically scaled metrics. This specific error was corrected as of 4/11/19, along with minor edits in wording and language throughout for added accuracy and clarity in communication.
Acknowledgements:
The author thanks the NEPC, particularly Kevin G. Welner and William J. Mathis, for their support of this work. Thanks are due to NEPC’s anonymous peer reviewers, Stephen Sireci of the University of Massachusetts-Amherst, James Harvey of the National Superintendents Roundtable , and Howard T. Everson of the City University of New York- Graduate Center for thoughtful comments that helped mold earlier versions of this guide into its present form. Thanks, finally, are also due to Dalveer Kaur of Teachers College (TC), Columbia University for her invaluable assistance behind-the-scenes. This guide was prepared under the joint sponsorship of the NEPC and the Assessment and Evaluation Research Initiative (AERI) at TC.
Author Information:
Madhabi Chatterji, Ph.D. is Professor of Measurement, Evaluation and Education, and the Director of the Assessment and Evaluation Research Initiative at Teachers College, Columbia University. Her research deals with assessment design, validation, validity and test use issues; improving research methods to support evidence based practices; educational equity; and standards based reforms in education. Email: [email protected]

2.21.19A Consumer’s Guide to Testing under ESSA
Madhabi Chatterji 3
Table of Contents
Executive Summary………………………………………………………………………………..…. 4
1.0 Introduction…..…………………………………………………………………………………… 7
2.0 What ESSA Requires of Schools and School Systems: Shifting Trends in Public Accountability 13
3.0 Mapping the Assessment Purposes in Accountability Contexts…..……………………………… 18
4.0 Critically Evaluating the Quality of Academic and Non-Academic Measures: The Fourth Step... 24
5.0 Pointers and Illustrative Test Reviews for Broad Types of Tests in ESSA’s State Plans……….... 29
6.0 Concluding Thoughts………………………………….……………………………………..……. 52
2.21.19A Consumer’s Guide to Testing under ESSA
Madhabi Chatterji 4
Executive Summary
Policy Context: Between May-August, 2018, the federal government approved some 44 proposals submitted by state departments of education to meet Grade K-12 testing and accountability requirements under the Every Student Succeeds Act (ESSA) of 2015. Separately, several of the 45 states originally participating in the two main Common Core State Standards assessment consortia had “opted out” of the consortia student testing programs in 2017, choosing instead to use alternative standardized testing programs and adopting college entrance tests as a part of their state plans for accountability purposes. Today, about 20 of the original member states are continuing to participate in the Common Core assessment programs to meet ESSA’s requirements.
Purpose: Misuse of test information in educational accountability contexts is like misreading a Fahrenheit thermometer in degrees Celsius. Such misuses can pose unexpected barriers to goals that educators and stakeholders set and hope to achieve in schools. The purpose of this guide is to promote better uses of information from standardized achievement tests or other academic and non-academic measures that state education systems and other educational entities select, adopt, and plan to use in the context of ESSA or other accountability systems that apply to their organizations.
Public protests against testing under the No Child Left Behind and Race to the Top reform initiatives showed that much can go wrong in high stakes contexts involving standardized assessments, particularly when the information from tests is applied too early in reform implementation contexts, or misinterpreted in educational accountability settings. As various states move towards implementing their most recent, federally approved plans, this “consumer’s guide” offers guidelines for meeting external regulatory requirements for accountability with a mind to how and why the adopted tests were designed, and to their technical merits and limitations. The guide may be useful in orientation and professional development settings for the intended and other audiences, detailed in Section 1.0.
Method: The guide draws on “best practice” guidelines in the 2014 Standards for Educational and Psychological Testing, combined with published recommendations of selected professional associations, educational researchers, educational leaders and practitioners to elaborate on the problem, and to provide guidelines, examples and recommendations. The Common Core tests are reviewed in some depth to demonstrate how state-level stakeholders might review and critique particular tests or testing programs with their planned inferential needs and uses in mind. Guidelines are also provided for making appropriate uses of college entrance exams, non-academic measures, and statistically transformed indices from test data in ESSA contexts.
Findings: Due to their technical complexity, current tests and testing programs are a “black box” to most test users. A review of ESSA’s stringent accountability regulations against presently approved state plans suggests that the “black box” effect in K-12 testing contexts may get exacerbated further, increasing the likelihood for test-based information misuses in ways we have seen before (Sections 1.0-2.0).
2.21.19A Consumer’s Guide to Testing under ESSA
Madhabi Chatterji 5
Under ESSA, many education systems are making multiple demands on a single test without due attention to its limitations, and several have proposed uses of test information at student- and upper-levels of the system without sufficient evidentiary support of validity, reliability and utility in hand. These are “Red Flags” that test users and test makers should heed, as they could lead to inadvertent test-based misinterpretations and misuses of information (Sections 3.0-4.0, Tables 1-3). The Common Core test reviews, although illustrative and limited in scope in this guide, suggest that some essential types of validity evidence necessary to support the proposed uses of information under ESSA are still unavailable. Evidence that test scores of high school students on current college entrance examinations or the Common Core tests will predict college and career readiness levels is also mostly absent (Section 5.0, Tables 4-6).
Further, many states propose to use different types of statistically derived indices from test-based data to rank, rate or examine growth of schools or education systems to fulfill ESSA’s requirements. However, measurement experts, researchers and professional associations (such as the American Educational Research Association and the American Statistical Association) have cautioned against several of these—particularly, “student growth percentiles”, “value added” growth models, and multi-indicator “composite” scores (Section 5.0). Recommendations for appropriate applications are included. Appendices A-C provide a glossary of technical terms, a quick guide for teachers and front-line educators on standardized testing, and a question guide for selecting or validating academic measures to meet accountability regulations under ESSA.
Conclusions and Recommendations: New accountability requirements open up opportunities for test developers to design new and innovative assessments. But the new demands are coupled with tight timelines under ESSA. This should not lead test makers to compromise rigor, nor “over-sell” their tests to users before the tools are ready. When there are known limitations to certain test design techniques for certain purposes, test developers bear the responsibility of communicating those clearly, openly, and in user-accessible terms to stakeholders. While most test-makers undertake this responsibility seriously, there is room for improvement in this area. Not only should test makers select “tried and true” test design methods as most tend to do, but also attend to user needs without introducing added complexities with new limitations to tests.
To pre-empt inappropriate or unjustified inferences and uses with test-based information, test users should (a) specify all intended test-based inferences and uses up front; (b) avoid multi-purposing a test in ways that exceed a test’s declared purposes or reported evidence; (c) justify all planned inferences and uses of test-based data using appropriate criteria for validity, reliability and utility (see inside for definitions); and (d) seek out expert technical reviews of tests and non-academic measures before adopting these tools for accountability purposes.
To mitigate or forestall potential adverse outcomes of testing, some caveats that test makers, test users and education stakeholders could jointly bear in mind are as follows.
1. Even the best standardized tests and assessment programs have technical limitations. They fulfill some functions well, but not others. Uses of test-based data should be contained within
2.21.19A Consumer’s Guide to Testing under ESSA
Madhabi Chatterji 6
the parameters of what particular tests can do, and high-stakes applications should be avoided until and unless there is clear evidentiary support for all the test-based interpretations and actions that users propose.
2. The “next generation” standardized educational tests, based on the reviews enclosed, appear to be good tools for describing a student’s achievement level at the time of testing. The scores depict performance in broad, but defined areas of math or English language Arts in a grade. They are not so good at measuring student or school system progress over time. Test users should be cautious about these issues, particularly when growth indices are used in high stakes, school/school system evaluations. Personnel evaluations should be avoided with growth models that rely on achievement test data.
3. Scale score metrics (defined inside) are an “industry standard” in standardized achievement test design contexts. These metrics are sought by users to map student and system-wide growth over time. However, when scale scores are linked by test makers for creating comparable scores in two different forms or levels of a test, they are not meant for measuring growth in high stakes contexts. Regions of the scales where different grade level or forms of tests are joined are vulnerable to errors. Also, scale score metrics tend to measure one general area, and may limit the depth and breadth of content standards measured where test users may seek more detailed information regarding what students learned.
4. Standardized achievement test data are useful as one of many indicators in descriptive data profiles denoting school and school-system quality. But, as experts have been stressing for many years, education systems should avoid an over-reliance on standardized test scores alone for high-stakes decision-making in educational evaluation contexts.
5. Test users and test developers must remain alert to, and monitor outcomes of, the proposed test uses under ESSA’s reforms with studies that examine the consequences of testing. Such studies are consistent with modern notions of validity and could help identify any untoward or adverse outcomes of testing for individuals or groups in high-stakes evaluative contexts.
6. In K-12 education contexts, standardized tests should not serve as the main policy driver for reforms. For the intended, positive outcomes to be realized in schools and education systems, the new content standards must be aligned with instructional processes first, with student assessment and accountability requirements implemented afterwards. This will help schools avoid test-driven corruption of educational processes.
7. Lastly, communication and cross-learning among educational test makers, leaders, policy makers at the highest levels, and educators and parents on the ground, must continue towards improving test-based information uses in educational accountability contexts in schools and school systems.
2.21.19A Consumer’s Guide to Testing under ESSA
Madhabi Chatterji 7
A Consumer’s Guide to Testing under the Every Student Succeeds Act (ESSA): What Can the Common Core and Other ESSA Assessments Tell Us?
1.0 Introduction
1.1. The Policy Issue: Validity, Test Use and Accountability
When it comes to educational achievement tests and information they can provide, “validity” is not a fixed property that can be built into the tools. Although the content of the test, or the quality of questions and the scale that produces the test scores matter, the extent to which such tests yield meaningful (or valid) information on student learning, or the quality of schooling, depends on how appropriately test results are put to use in decision-making contexts.
As stipulated by the American Education Research Association, the National Council on Measurement in Education and the American Psychological Association (AERA, APA & NCME, 2014), once a validated test is taken out of the originally intended context of use and applied for a new purpose, we can no longer claim validity with as much certainty for a new test-taking population, new score-based inferences, or a new set of actions. To defend each new use of data from a given test, we must secure new, and sometimes, different kinds of validity evidence.
Why should validity in relation to test use be of concern to us as new regulations for educational accountability are implemented under the Every Student Succeeds Act (ESSA)? Consider two recent cases that follow (discussed at length in Chatterji, 2013a-b; 2014).
Case 1. Under the federal regulations of the Race to the Top initiative, the Common Core State Standards and accompanying assessment programs sparked a national backlash and opt-out movement against testing and accountability (see Singer, 2016; Thousands Refuse Common Core Testing at http://www.huffingtonpost.com/alan-singer/thousands-refuse-common-c_b_9631956.html). Educators, parents and local school officials feared at the time that the tests were serving as policy instruments to drive top-down reforms too soon. There was inadequate time for designing new curriculum, instruction and assessments to match, with little or no professional development of teachers and school leaders. The critical resources and supports that schools needed to succeed, were neglected (Noonan, 2014; Pellegrino, 2014).
Validity Issue: With ill-prepared students, teachers and schools, to what extent were the test results valid in conveying how much students learned, or the quality of education they received?
Case 2. The old SAT was designed to serve as a college entrance test, meant to provide verbal and math scores in high school students at the individual level and expected to predict students’ academic successes in college (Shaw & McKenzie, 2010). Regardless, policy makers and education observers often made direct causal inferences about whether public

2.21.19A Consumer’s Guide to Testing under ESSA
Madhabi Chatterji 8
schools at large were doing a good job of educating students on the basis of average SAT score trends. (See for example, “ SAT reading scores hit a four decade low” in the Washington Post, September 24, 2012). Under the No Child Left Behind act, a “value–added” study in a school district applied sophisticated statistical tools to identify exceptional schools and school practices, using a combined SAT verbal and math score as the outcome measure (Schatz, VonSecker & Alban, 2005).
Validity Issues: As the SAT was not designed originally to serve as a curriculum-based outcome measure for identifying promising schooling practices, to what extent are such inferences from the aggregated SAT scores valid in this application? Further, as more wealthy college-bound students tended to take the SAT as an optional test at the time, there would likely be “self-selection biases” in average test scores. Given that added fact, to what extent would inferences about effective schools and practices be valid?
Using tests in ways that go beyond their original purposes, properties and technical capacities is like reading a temperature gauge in Fahrenheit units when it is designed for Celsius. Misuse and misinterpretation of the information can lead to false conclusions about the performance of students, teachers and/or schools and education systems. In addition, it can drive decisions with consequences that diverge from the goals that educational stakeholders hoped to achieve.
Most commercial, standardized tests are designed to serve particular purposes well, for particular populations, and can support only particular inferences and decisions at best. To optimize validity of test uses in accountability contexts, all interpretations and uses of test-based data must occur with due attention to a test’s originally stated purposes and evidence we have in hand to support those specified uses with test results (Chatterji, 2013 a-b; 2014).
Following the passage of the Every Student Succeeds Act (ESSA) in 2015, states in the U.S. began concerted efforts to revamp their student assessment and educational accountability systems to comply with new federal regulations (Bae, 2018; Stosich, Snyder & Wilczak, 2018). Starting in 2010, two multi-state consortia, namely, the Smarter Balanced Assessment Consortium (SBAC) and the Partnership for Assessment of Readiness for College and Careers (PARCC) had already begun developing student achievement tests to match the new Common Core State Standards in mathematics and English Language Arts (ELA) for Grades 3-12. PARCC is now distributed by Pearson (2017). SBAC is housed presently at The National Center for Research on Evaluation, Standards and Student Testing (CRESST, 2017). (For more on SBAC, see http://www.smarterbalanced.org/; for more on PARCC, see http://parcc.pearson.com/)
In response to the most recent ESSA requirements, several of the 45 states originally participating in the PARCC and SBAC consortia, opted out of those student testing programs, choosing instead to use college entrance examinations for accountability purposes, or self-selected student achievement testing programs as alternatives to the Common Core assessments to meet ESSA’s accountability requirements (Gewertz, 2017 a-b). In May 2018, Education Week published a summary chart
2.21.19A Consumer’s Guide to Testing under ESSA
Madhabi Chatterji 9
showing the state plans for student assessment and accountability that the U.S. Department of Education approved. This chart is continuously updated (Klein & Ujifusa, 2018; see the web link for the latest).
1.2 Purpose
As recently witnessed from public protests against testing under Race to the Top reform initiatives (Singer, 2016), much can go wrong in high stakes, accountability contexts involving standardized assessments, particularly when the information from tests is applied too early in reform implementation contexts, or misinterpreted or misused in high stakes, educational settings (Chatterji, Valente & Lin, 2018). As states begin to implement their just-proposed accountability programs to comply with ESSA, the intent of this guide is to delineate steps that education policymakers at national, state and district levels can take to:
(a) evaluate the tests they adopt vis-à-vis their stated information needs and purposes, and
(b) make interpretations and uses of various forms of test-based data in ways that lie within the bounds of a test’s purposes, content and technical properties.
Given the broad types of tests featured in ESSA’s state plans, the guide provides cautionary pointers on Do’s and Don’ts to pre-empt misinterpretations, misuses or over-uses of raw scores and other forms of transformed or aggregated data from tests--referred to generally as “test-based data” in this guide.
Readers should note that the objective of the guide is not to critique a particular test or testing program, although the Common Core assessments are reviewed as illustrations. Rather, it is to provide test users with a “tool-kit” of steps, key concepts, guidelines, and examples to help avert the most common pitfalls and adverse consequences of inappropriate test information use for students, families and concerned stakeholders situated in state/district school systems. As such, portions, or the guide as a whole, may be useful for orientation, training and professional development of selected audiences in education systems in either public or private schooling contexts.
The guide is intended for non-specialists in educational assessment, but some use of technical language was unavoidable. Where used, technical terms are presented in bold font and defined in the text. A Glossary is also provided in Appendix A. Given the scope and space limitations of this guide, however, readers are directed to supplementary resources for added information on particular tests and testing programs. As and where needed, they should also seek further technical consultation on specific topics of interest.
1.3 Why a Consumers’ Guide? “Black Box” Tests, Testing Programs and ESSA’s Requirements
In a recent blog on international assessments, James Harvey, the executive director of the National Superintendents Roundtable, described the frustrations of school system stakeholders when they face

2.21.19A Consumer’s Guide to Testing under ESSA
Madhabi Chatterji 10
standardized testing reports and ancillary information from large scale testing programs (Harvey, 2014). His specific words were:
“In education today, measurement experts occupy the exalted status of Irish priests. With their figurative back to the schools, these prelates genuflect at the altar of Item Response Theory and mumble confidently amongst themselves in a language known as psychometrics. No one in the school congregation understands a word of it, but we are assured these mysteries are based on science...”
Hard as it may be for education assessment specialists and test-makers to accept (and this author falls squarely within that category of professionals/scholars), test consumers and stakeholders in state and district education systems often confront a proverbial “black box” when they receive results of standardized tests.
“Raw” test scores--the total points students earn based on test questions they answer correctly, or the average “raw scores” for a group of students in a school--are results that most education stakeholders and laypersons would understand. But instead of raw scores, standardized test-makers typically provide reports with various kinds of “derived scores”. Derived scores are statistically transformed versions of the original raw scores. A derived score we frequently encounter, for example, is the percentile rank (PR) which denotes the percent of people placed below a person’s raw score, when that score is compared to a distribution of scores of a similar group of test takers (see Glossary).
PR scores and variations of these are featured in many state plans under ESSA as of 2018. But: What can they tell us about what students have learned in a grade, or how schools and education systems are doing?
Another derived score is the “scaled score” or “scale score”. To better reflect student performance on a single straight line measure, standardized test makers often derive scales from raw scores called a scaled score metric. Scale scores have equal sized units and typically measure a single thing, like achievement in a defined mathematics topic. The scores can be interpreted somewhat like a ruler for measuring length. When tests measure several, clearly distinct areas, separate scale score metrics may become necessary for the different domains. This way, the test scores reflect the differences in meaning more accurately for the different areas tested.
At other times, starting with a derived score like the scale score in a domain like mathematics, test makers like to create a single common scale from tests at different grade levels or tests with different forms or modalities (e.g., computer-based versus paper and pencil modes). The point of these “linked” or “equated” scale scores is to facilitate comparable interpretations of what is being measured even when forms or grade levels of the test change.
However, the goals and limitations of such scaling work are often unknown to test adopters and other test users who rely on the data for meeting their immediate information needs. For example, while it is true that equating methods help create comparable numeric scales--they do so within margins of

2.21.19A Consumer’s Guide to Testing under ESSA
Madhabi Chatterji 11
error! Typically, test equating procedures rely on small numbers of common items in the tests being linked. Importantly, the methods cannot equate the content and cognitive processes each pair of tests or test forms measures with thoroughness (Price, 2018; Bandalos, 2018).
So, while most test makers have sound technical reasons for making these complex transformations, the information remains obscure or inaccessible to a vast majority of test users. Left largely in the dark about what the scores can or cannot provide, many policymakers and test users often fall into the trap of misusing test-based information against their best intentions, especially when technically untrained. The state of affairs is not new, and led to recent calls for greater transparency in the Common Core testing contexts (Baker, 2014).
To compound matters, the new legislated accountability requirements increase the chances for misuses of test-based data in ways we have already seen (see Cases 1-2 again). On the one hand, ESSA’s requirements – detailed next – offer flexibility for states to choose their own tests and design their accountability programs with a “multiple measures” model. On the other, the regulatory language places extremely tight reporting restrictions on states and Local Education Agencies (LEAs) under state jurisdictions to meet self-set goals on academic indicators they select (LEAs are the school systems and schools in given regions). As before, the primary emphasis is on ELA and mathematics standards and assessments. Additionally, the language of the law strongly encourages schools and educational entities to set long-term “growth-related” targets.
In all of the approved state plans to date, the academic indicators involve standardized tests of student achievement and college entrance tests. Plus, to meet the very specific performance targets that ESSA requires, many states are proposing to rank or rate schools by combining data from tests and other indicators in somewhat arbitrary ways, or by using student growth percentiles from test data to document gains over time (see Klein & Ujifusa, 2018). All of this is occurring without adequate attention to the built-in, technical properties and limitations of the adopted tests’ data, and the purposes for which the tools were designed in the first place.
For example, states might be tempted to develop a weighted, multi-indicator composite score of school or district quality that combines mean results on college entrance examinations, a Common Core assessment, along with school attendance and on-time graduation data. While this practice may appeal to common sense at the ground level, it would be unacceptable technically on several counts.
Each indicator--test scores, attendance and graduation rates--must be tested and proven to be a reasonable, valid, and reliable indicator for the proposed accountability-related inferences and uses in school systems, whether in a given year or over time.
The weights applied to each indicator, and the weighted composite, must be reviewed, tested and found to be meaningful and statistically defensible in accountability contexts.
As we will see in Section 5.0, the Common Core tests currently provide validity information for interpretations of curriculum-based performance, and for students in a given grade only. They offer little or no evidence yet to support the validity of inferences at the school or school system level.
2.21.19A Consumer’s Guide to Testing under ESSA
Madhabi Chatterji 12
Likewise, as Case 2 showed, the results of given college entrance examinations may have acceptable validity levels to serve as predictors of individual students’ college performance, but little or no evidence to support their use as quality indicators for educational systems.
Finally, the “composite index” must itself be transparent and meaningful to all consumers of test-based information, including decision-makers, parents, school principals, teachers, students, and concerned public/media.
In sum, while a weighted school quality index might appear to be an easy and straightforward solution to fulfill ESSA’s needs, it must be interpreted and used correctly to uphold validity principles in applied settings.
To sum up, ESSA’s current accountability regulations (Department of Education, 2017 a-b) may exacerbate the “black box” effect in K-12 testing contexts, increasing the likelihood for test-based information misuses, with adverse consequences in both high and low stakes evaluative contexts in schools and school systems. Given the above, this consumer’s guide takes a first step in opening up the black box for the major types of tests selected by state-level practitioners, with cautionary pointers for using each.
1.3 Audience
The primary audience for this guide includes:
School System Superintendents and Leaders State Department of Education Officials Policy-makers, Leaders, and Assessment Specialists at National, State or District Level
Agencies Responsible for Formulating, Translating or Implementing ESSA or other Accountability Regulations in Education Systems Using Data from Tests.
The secondary audience consists of:
Test Developers, Assessment Specialists and Researchers involved supporting the Primary Audience (above) in meeting Educational Testing and Accountability Goals
The primary audience above is selected as it typically undertakes the major decisions on test selection, adoption and validation of test-based information uses for various types of decision-making in accountability contexts. The secondary audience is also a key to the purposes of this guide, as, typically, it works in concert with the primary audience with interests in promoting appropriate test use.
Despite its defined audiences, the guide acknowledges that tests and testing programs have many added stakeholders, all with some level of vested interest in educational tests and testing outcomes in accountability contexts. These include: school principals/leaders, front-line educators and teachers, parents, students, prospective student employers, concerned citizens and the media/others who serve the public’s interest. Appendix B provides a one-page “quick guide” for teachers that may be useful in stakeholder orientation, capacity-building or training contexts.
2.21.19A Consumer’s Guide to Testing under ESSA
Madhabi Chatterji 13
1.4 Methods/Approach
This guide begins with a review of ESSA’s requirements, and elaborates on four steps (or tasks) educational entities could take in critically reviewing and evaluating the merits and technical limitations of given tests/testing programs guided by their own purposes and information needs under external regulatory conditions. As specific examples and to support points, the guide conducts reviews of the SBAC and PARCC Common Core assessments in some detail using published documentation on those testing programs available through August, 2018. It recommends appropriate ways to use other standardized achievement tests, college entrance examinations, and “non-academic” data sources as school quality indicators for accountability purposes. Briefly, it alerts test users on issues surrounding selected forms of transformed test-based data featured in current state plans. To make conclusions and recommendations, the guide draws on “best practice” guidelines given in the latest Standards for Educational and Psychological Testing (AERA, APA & NCME, 2014; Standards hereafter), combined with published works of selected professional associations, educational researchers, educational leaders and practitioners.
2.0 What ESSA Requires of Schools and School Systems: Shifting Trends in Public Accountability
With the passage of ESSA in 2015, public school systems across states in America renewed their commitment to prepare students for college, career and life. The intent of ESSA is captured in the words of former president Barack Obama. “With this bill”, he stated, “we reaffirm that fundamental American ideal that every child, regardless of race, income, background, the zip code where they live, deserves the chance to make out of their lives what they will” (Department of Education, 2017a). ESSA’s final regulations were published by the U.S. Department of Education very recently and relaxes some of the prior federal requirements under Race to the Top, as follows (Department of Education, 2017a-b; italics and brackets added):
“The bipartisan law [ESSA] gives states and districts the opportunity to move beyond No Child Left Behind’s reliance on a limited range of metrics and punitive “pass/fail” labels for schools, and use their planning and accountability processes to reimagine and redefine what a high-quality education should mean for their students. To that end, the final regulations clarify ESSA’s statutory language by ensuring that accountability systems use multiple measures of school success, including academic outcomes, student progress, and school quality, thereby reinforcing that all students deserve a high-quality and well-rounded education that will prepare them for success.”
As compared earlier laws, ESSA does indeed give states greater flexibility to redesign their own systems of student assessment and accountability. At the same time, it holds state education systems accountable for documenting educational progress using self-selected academic and non-academic measures in their plans in very specific and stringent ways. For any education system, for example, the state plan must clarify the:
2.21.19A Consumer’s Guide to Testing under ESSA
Madhabi Chatterji 14
(a) long term goals with specific targets identified in measurable terms;
(b) methods by which individual school performance will be evaluated;
(c) procedures for documenting the system’s performance on selected academic and non-academic indicators;
(d) methods for disaggregating performance by ethnic, linguistic and other groups, with defensible numbers of students in each sub-group; and
(e) system-wide approaches to handle and correct for “opting out” by students of the required testing regimen.
The highest priority indicator for documenting performance of the education system is an Academic Achievement Indicator under ESEA Section 1111(c)(4)(B). To be federally-approved, the state proposal for accountability must respond in detail to the following multi-part requirement.
“Describe the Academic Achievement indicator, including a description of how the indicator (i) is based on the long-term goals; (ii) is measured by proficiency on the annual Statewide reading/language arts and mathematics assessments; (iii) annually measures academic achievement for all students and separately for each subgroup of students; and (iv) at the State’s discretion, for each public high school in the State, includes a measure of student growth, as measured by the annual Statewide reading/language arts and mathematics assessments.” (Excerpted as cited from the Consolidated Plan for New Hampshire, New Hampshire Department of Education, 2018, p.15-44)
As of the summer, 2018, the federal government approved 44 comprehensive accountability proposals from states for meeting ESSA requirements (Klein & Ujifusa, 2018; for periodic updates to the chart, please see: https://www.edweek.org/ew/section/multimedia/key-takeaways-state-essa-plans.html).
2.1 What’s new or different in the approved ESSA Plans?
Although educators, scholars, reformers and policy-makers in individual states have made concerted efforts towards reframing their educational accountability systems in significant ways under ESSA, a quick review shows that standardized achievement tests and test scores remain the dominant component in all the state-proposed frameworks, and serve as the primary outcome indicator for evaluating educational quality.
In a new trend under ESSA, however, we see states like California, New Mexico, and others, adopting the recommended “multiple measures” approach with: 1) broader sets of outcome measures that go beyond a reliance on students’ scores only from a single standardized test; 2) a mix of state-level and local-level indicators; 3) use of “non-academic” measures, such as, surveys o f “opportunity to learn” for assuring educational quality; 4) multi-indicator data dashboards; as well as, 5) school quality reviews (Bae, 2018).

2.21.19A Consumer’s Guide to Testing under ESSA
Madhabi Chatterji 15
Some states, like New Hampshire, had initially proposed student performance portfolios in the mix of high school exiting requirements (Stosich et al., 2018). However, the state’s final plan reflects a more traditional test-based reporting mode using new, state-adopted assessments in mathematics and ELA from 2018 onwards. New Hampshire has also set steep multi-year growth targets on the new assessments. In particular, they plan to use student growth percentiles (SGPs) based on the Betebenner (2009) approach (New Hampshire Department of Education, 2018, p.15-44). Although measurement experts differ on their position on measuring student and school system growth with vertically linked scales, (see Briggs & Peck, 2015), some have warned against applying SGP statistics for evaluating educational entities (Sireci et al, 2016; See also https://theconversation.com/want-to-understand-your-childs-test-scores-heres-what-to-ignore-62155). More on this point follows in Section 5.0.
In other emergent frameworks, schools are treated as learning organizations with a mission towards continuously improving the quality of their programs, practices and services. Schools that adopt an organizational learning philosopy make a commitment to growth over time through quality improvement cycles of ongoing experimentation, innovation, evaluation and self-reflection. Such an approach is recommended by many practice-oriented researchers and research entities today (Conley, 2015; Darling-Hammond, 2017; LeMahieu & Bryk, 2017).
2.2 Major Types of Tests and Data Sources in ESSA Plans
Outside the primary “academic indicator” of educational quality, ESSA also requires that schools provide evidence that the conditions of learning are of sufficiently high quality. States have incorporated “non-academic” indicators outside test scores to meet this latter need.
2.2.1 Academic Indicators of Educational Quality. There are three categories of standardized tests featured in state plans. Based on a 2017 Education Week survey on the emerging national landscape of ESSA testing and accountability (Gewertz, 2017a-b), these are:
Grade 3-12 mathematics and English Language Arts (ELA) tests tied to the Common Core standards, developed by the SBAC and PARCC consortia and incorporated in plans by some 20 states and the District of Columbia;
College entrance examination scores serving as ESSA accountability indicators, incorporated in plans by some 25 states, of which 12 identify these data sources explicitly as an indicator of students’ college and career readiness; and
Self-selected or self-designed, norm-referenced and/or criterion-referenced student achievement tests for grades 3-12, incorporated in plans by some 25 states.
Outside the Common Core consortia, states are mainly opting for the SAT or ACT as college entrance tests, depending on region (Section 5.0 offers further details on added and specific types of uses). Although they may often serve as exiting tests at the local school/district level, “passing” the tests is not a high school graduation requirement set by the states. The two main types of standardized achievement tests that ESSA’s state users are proposing-- Criterion-referenced Tests and Norm-
2.21.19A Consumer’s Guide to Testing under ESSA
Madhabi Chatterji 16
referenced Tests--are distinguished next in terms of purpose, to help readers follow the forthcoming sections.
Criterion-referenced Tests (CRTs): CRTs are designed primarily for meeting information needs in instructional contexts and should be tied to the major goals and objectives of educational curricula. CRT results are meant to serve as indicators of domain-referenced learning for individual students or groups, showing their demonstrated mastery levels in the knowledge and skills tested in defined areas of the math or ELA curriculum—called the domains.
The Standards (AERA, APA, & NCME, 2014) defines criterion-referenced score interpretation as “an individual’s or a group’s level of performance in relationship to a defined criterion domain.” (p. 218). Well-functioning CRTs provide information (test scores) with high validity and reliability with respect to the specific content and skills tested. Ideally, results must allow interpretations of proficiency on the overall domain and sub-domains tested.
Typically, CRTs are accompanied with performance standards that mark out ranges of scores from high to low using “cut-scores”. These score points are the criteria applied for making determinations of proficiency or mastery in a domain. Cut-scores on the test metric could denote Pass/Fail categories or a series of Performance Levels. The Common Core mathematics and ELA assessment results were intended for making criterion-referenced score interpretations, given the available documentation (Section 4.0).
Norm-referenced Tests (NRTs): NRTs, in contrast, are designed to support interpretations of scores by ranking or placing a test-taker’s score within a distribution of scores in a defined group of similar individuals (see Standards, AERA, APA, & NCME, 2014, p. 221). These scores do not denote mastery levels on fine-grained skills or concepts, providing instead rank-based information of general performance in the domains tested. Well-functioning NRTs yield data that help in the selection and placement of test takers in particular programs based on their ranks or comparative test scores.
The reference group of test-takers is called the “norm group” or the standardization sample (“norms” in shorthand). To ensure the quality of score-based inferences for a person in comparison with scores in the norm group, the reference group must be relevant (e.g., in ESSA accountability contexts, all test takers must be exposed to the same curriculum under similar conditions). Norms must also be recent (not more than 5 years old) and demographically representative of all potential test-takers who could take the test well after it is designed and released for use. College entrance tests like the SAT® have features to support norm-referenced interpretations of scores (Section 5.0). A Percentile Rank, mentioned before, is a popular norm-referenced score.
2.21.19A Consumer’s Guide to Testing under ESSA
Madhabi Chatterji 17
2.2.2 Non-academic Indicators of School Quality. While states vary greatly on
particular choices of this quality indicator, the main types of data sources in currently approved state plans are (Klein & Ujifusa, 2018):
Survey-based measures: For example, New Mexico’s plan includes an “opportunity to learn” survey purported to capture student-perceptions of school climate, student engagement and other “non-cognitive” domains. Non-cognitive domains refer to student dispositions, beliefs, social-emotional or affective mind sets, and attitudinal constructs related to schooling (Duckor, 2017, gives a definition).
Student attendance rates: A vast majority of state plans identify reducing “chronic absenteeism” based on student attendance rates as a target for schools to fulfill the “non-academic” requirement.
Additional academic indicators: Other states have broadened their definitions of overall quality of schooling with additional academic indicators. Florida, Kansas, Louisiana, Mississippi, New Hampshire, North Carolina, Texas, Utah, and Wyoming opted for expanding the number and types of academic indicators in different ways, going beyond mathematics and ELA test scores of students, to meet this need. Some of these are: mapping achievement growth trends in the lowest-performing students: mapping science and social studies achievement growth trends; or Advanced Placement and International Baccalaureate participation rates of students.
2.3 Will ESSA Achieve its Mission?
As the core objective of this guide is to improve applications of test-based information in ESSA accountability contexts and prevent negative consequences of test misuse, the question of whether ESSA’s mission will come to pass, is relevant here. ESSA aims to improve the quality of education for all students, and prepare them for future successes (see Section 2.0 excerpt). With heavily test-dependent state plans, however, much can go awry if egregious misuses or overuses of test-related data occur during implementation of reform and accountability regulations.
ESSA’s allowances to states could be viewed as a shift in the right direction. Historically, U.S. public education systems were conceived as decentralized and democratic entities, supported mainly by regional taxpayers, giving local entities control over their public schools (Tyack, 1974). From this standpoint, ESSA’s altered regulations in 2016-17 are a plus. The “jury is still out”, however, in terms of the short- and long-term impacts of the state-proposed accountability programs under the ESSA’s newly initiated accountability reforms. This guide therefore recommends that consequences of ESSA’s state testing and accountability programs be formally investigated on individual students, schools, school systems and society at large (Section 6.0).
3.0 Mapping the Assessment Purposes in Accountability Contexts

2.21.19A Consumer’s Guide to Testing under ESSA
Madhabi Chatterji 18
The following sections now offer steps, tools, and guidelines to improve uses of data from standardized tests and other assessments in accountability contexts.
3.1 The First Step: Identify the Proposed Test-based Inferences and Uses
The quality of a given test or assessment instrument, and the data it provides, must be evaluated in relation to the purposes for which the test-based information is to be used (AERA, APA & NCME, 2014). To start, therefore, test users must identify their assessment purposes in specific and clear terms.
Tables 1 and 2 map out the range of assessment purposes based on the latest published information, that state level test users are presently proposing for students, schools, and school systems (Klein & Ujifusa, 2018). Three (3) key terms relevant to Tables 1-2 are defined next to help readers follow along: Users, Inferences, and Uses.
Test Users: Test users (the test’s consumers, or simply ‘users’), are individuals who have specific assessment information needs related to their functions and roles in education systems. Different groups of users rely on test-based data for fulfilling their own specific needs. As clear in Tables 1-2, students and teachers have needs primarily at the classroom level; in contrast, school/school system leaders and policy-makers have other, specific interests and needs at upper levels of the education system. Note that different users want to make different inferences based on a given test’s scores or score aggregates.
Inferences: “Inferences” are the interpretations that users make with assessment results. Test score inferences refer to what the test scores mean, given the domains tested and the population units of interest--such as, students. For example, by design, scores from the Common Core math assessments are intended to be meaningful indicators of students’ mathematics proficiency levels in a grade. The inference here is about how much students learned in a defined curricular domain at their grade level. When the same mathematics test scores are aggregated up to the school or school system levels, they are now expected to serve as indicators of schooling outcomes, usually denoting levels of educational quality. These are two different inferences from data of the same standardized test, and on two different units of analysis (students versus schools/school systems).
Uses: “Uses” refer to the decisions and actions that stakeholders plan to make with the assessment results, either at the student level or with data aggregated at upper levels. Examples in Tables 1-2 show two broad kinds of decisions that school-based stakeholders could make – formative and summative. Formative decisions are meant for planning, modifying and improving instruction or schooling conditions. Summative decisions are meant for making final judgments and frequently, taking consequential actions on students, staff, programs or institutions, such as, deciding whether a student is promoted to the next grade, or whether a school system meets a set performance criterion when evaluated.

2.21.19A Consumer’s Guide to Testing under ESSA
Madhabi Chatterji 19
Unsurprisingly under ESSA, in Tables 1-2, we find a greater interest among users in making accountability-related inferences and uses at upper levels of the education system (Table 2). But, there is also interest in using a test’s results at the individual student and classroom levels for teaching and learning purposes (Table 1). Despite being controversial, evaluations of educational personnel – namely, teachers and school leaders – with test-based information also apply in particular instances.
To provide some context on the controversy surrounding use of test scores in teacher evaluations, Haertel (2013) pointed out that accumulated studies show that schools/teachers account for about 9-20% of the overall variance in standardized test scores in education, with the rest accounted for by out-of-school factors and “noise” (error) in the data. Popham (2014) expressed concern that most standardized tests today are designed to function as NRTs. Their data are too limited to allow direct inferences about the quality of curriculum-based teaching and learning in classrooms, and therefore, should not be used for evaluating teachers whose core work deals with instruction. More will follow on these points in Section 5.5.
In reviewing Tables 1-2 again, three patterns of usage may already suggest potential “red flags”.
1. Multiple demands on a single test. State plans suggest that there could be many stakeholder groups and users of the test-based information, each with interests in making very specific, but different, data-based inferences and uses of data from the very same test. The question arises, then: Will the test be up to the many tasks we are asking of it? A diversity of demands on a given standardized test can tax the assessment tool beyond its technical capacities and limits (Chatterji, 2014).
2. Multiple inferences and uses at different levels. We also see that there are many units of analysis in Tables 1-2. The units are the levels of the system at which users will focus upon for making their desired inferences and uses/decisions with test-related information, such as, students, classrooms/teachers, schools or school systems. Two questions arise here: Have the test-makers supplied evidence to support all the planned inferences and uses, at all levels and units of analysis? To what extent is each particular data-based inference or use valid based on what we know about the test and its qualities?
3. Consequences of test use or misuse. Adoption and implementation of tests in education systems always carries some consequences for education stakeholders. In an ideal world, tests are meant to have positive consequences in education systems.
The implicit assumption on which most accountability systems, including ESSA’s legislated reforms, is built is that schooling processes and outcomes will change for the better once the new content standards, instruction, standards-based assessments and accountability requirements are in effect (Section 2.0). This underlying assumption is called the reform and accountability program’s Theory of Action (ToA) which can be mapped graphically as a logic model (Donaldson, 2007; Rogers et al., 2000). Assuming that all goes according to the
2.21.19A Consumer’s Guide to Testing under ESSA
Madhabi Chatterji 20
intended plan, in time, education stakeholders can expect positive consequences of the reforms.
At the same time, when assumptions are not met in practice and policy environments, there could also be unintended, and sometimes adverse consequences for some or all stakeholders. A major interference could arise from misinterpretations, over-uses or misuses of assessment-related data in accountability contexts without the appropriate evidence to support those uses.
3.2 The Second Step: Identify Vulnerable Areas for Test Misuse
From a user perspective, the second step has to do with ensuring that the information from tests will be employed in ways that are consistent with the purposes that the test-developers had in mind, or lie within the limits of what a test can realistically provide. To execute this step, users must review each different data-based inference and use that they plan, against the overall characteristics of a test, its purposes, and technical capacities.
To help implement the Second Step, state and district level users should start by creating a table similar to Tables 1-2, as applicable to their own regional systems. Examples of some context-specific questions they could then ask, follow.
Are we making too many demands on a single test? If so, which test-based inferences and uses should be our priority, based on available evidence on what the test can do?
How many types of inferences and uses are we planning at different levels of the system? What specific kinds of test data will we use at each level?
Have the test makers provided evidence to support all our planned data-based inferences and uses at different levels of the system? If not, should we initiate studies to collect the necessary evidence?
Does the test, and data it provides, have the qualities for meeting our highest priority needs adequately now?
To test the “Theory of Action” underlying ESSA’s reforms, the following added questions could be asked.
To what extent are the uses of the test-based and supplemental data for school improvement and accountability under ESSA, leading to the intended, positive outcomes for students, schools, school systems, and overall society?
Are there likely to be any adverse consequences of test-based and accountability–related actions we take? If so, who could be most affected--examinees, teachers, educational leaders or institutions as a whole? What actions will mitigate or reverse any ill-effects?
Table 1How States Plan to Interpret and Use Results of Academic Measures for Students, Classrooms and SchoolsType of Measure
Unit of Analysis
ESSA-Monitoring Plan
Inferences Assessment Purposes –Specific Uses
Users
2.21.19A Consumer’s Guide to Testing under ESSA
Madhabi Chatterji 21
Academic Measures: Standardized Achievement Tests and College Entrance Tests
Individual Students, Classrooms, Schools, and School Systems
Documenting students’ academic performance levels in given grade levels by year of schooling –cross-sectional “census” testing
Student learning and proficiency levels in academic domains tested, in given grade levels and by year of schooling
Formative decisions(e.g., For classrooms- evaluating“learning progressions”,designing or modifying curriculum and instructionfor meeting student needs)
Summative decisions(e.g., For students: assigning marks,promotions to next grade;For school-wide or district-wideevaluations: decisions on program continuation)
Classroom teachers, school administrators, policy-makers and public stakeholders
Tracking students’ achievement growth over time by academic domain in grade level cohorts- longitudinal “census” testing
Student growth in academic domains, over years of schooling
Formative decisions(e.g., For classrooms and schools: designing/modifying teaching strategies and educational services)
Summative decisions(e.g., For students- assigning marks,promotions to next grade;For school-wide or district-wide evaluations- decisions on hiring staff, program continuation)
Classroom teachers, administrators, policy-makers and public stakeholders
End of high school testing
a. Student readiness levels for collegeb. Student readiness for specified or chosen career pathsc. Student mastery levels in valued domains of knowledge and skill
Formative decisions(e.g., For students: counselling/advisement for college and job searches)
Summative decisions: (e.g., For students: graduation decisions, college admissions decisions, job hiring and recruitment decisions; For school-wide or district-wide evaluations:Identifying or recognizing high and low performing programs/entities/staff )
Students and families,school personnel, employers, policy-makers and public stakeholders
2.21.19A Consumer’s Guide to Testing under ESSA
Madhabi Chatterji 22
Table 2How States Plan to Interpret and Use Results of Both Academic and Non-academic Measures to Evaluate Schools, School Systems, and Leaders/TeachersType of Measure
Unit of Analysis
ESSA-Monitoring Plan
Inferences Assessment Purposes –Specific Uses
Users
Academic – Standardized Achievement Tests and College Entrance Tests
Schools, school districts, state educational systems
1. Monitoring school or system-level growth over time on student cohorts by grade
Inferences as “outcomes” or indicators of educational quality based on targeted improvements over time
Formative(e.g., planning decisions on funding allocation, technical assistance, strategic changes)
Summative(e.g., school or school system “grades”,“ratings”, public recognitions, andAccountability under ESSA)
Classroom teachers and educational staff (formative)Administrators, policy-makers and public stakeholders (summative)
2. Education system monitoring at end of school year with test score aggregates or a combined “index” on selected indicators
Inferences as “outcomes” or indicators of educational quality annually
Formative(e.g., planning decisions on fundingallocation, technical assistance, strategic changes)
Summative(e.g., school or school system “grades”, “ratings”, public recognitions, and ESSA accountability
Classroom teachers and educational staff (formative)Administrators, policy-makers and public stakeholders (summative)
3. Monitoring achievement gaps between different sub-groups of students (e.g., by poverty level, ethnicity, gender, native language and disability)
Inferences as “outcomes” or indicators of educational quality for meeting targeted gap reduction goals
Formative(e.g., planning decisions on funding allocation, technical assistance, strategic changes)
Summative(e.g., school or school system “grades”, “ratings”, public recognitions, and ESSA accountability)
Classroom teachers and educational staff (formative)Administrators, policy-makers and public stakeholders (summative)
4. Monitoring teacher or school leader/staff performance with aggregated test scores
Inferences on effectiveness or performance of school personnel
Formative(e.g., staff coaching and development)
Summative(e.g., annual performance reviewsfor tenure, promotions, salary or merit pay)
Mentor teachers and educational leaders (formative)Administrators, policy-makers and public stakeholders (summative)

2.21.19A Consumer’s Guide to Testing under ESSA
Madhabi Chatterji 23
3.3 The Third Step: Justify Inferences and Uses of Test-based Data
The third step is the other side of the same coin dealing with identifying “red flags”. It is to ensure that proposed inferences and uses of data from tests and assessments, once adopted, are justifiable. In ESSA-related or other evaluative contexts, four actions could help test consumers.
1. Make All Intended Test Data-based Inferences Clear and Explicit. The more explicit the user intentions, the better we can evaluate how well-suited given tests or assessment tools are for the stated needs. Recognizing each intended inference and use up-front is a prerequisite to being able to evaluate how well a test or testing program can fulfill those desired functions.
Some assessment purposes may be implicit and ambiguous. For example, tracking student achievement test results in aggregate form may be to make descriptive inferences about the domain-based performance of student groups. Or, the intent may be to make a bigger inference about education systems’ overall quality. Which is it? Could results be used for actions that are consequential for any persons or groups?
2. Look for Documentation and Evidence to Support each Planned Inference or Use. Vigilance about reviewing the documentation and evidence on each test or assessment program that states adopt must be done thoroughly and carefully. As discussed earlier, tests today have highly complex designs, and some uses may complicate matters further. States and test users should seek out technical consultants for carrying out this task. Sections 4.0-5.0 provide pointers with illustrative test reviews on how to approach this task.
3. Beware of Multi-purposing a Test Without Supporting Documentation.Unjustifiable applications of test information lead to invalid inferences and uses. Multi-purposing a given standardized test in more than one way, without adequate supporting evidence from test-makers, is a common problem (Chatterji, 2013a-b; 2014). According to the Standards (AERA, APA, & NCME, 2014), test users must themselves bear responsibility for validating the test for each new or unsupported inference and use.
4. Be Clear About High versus Low Stakes Test Uses Implicit in Tables 1-2 is the fact that some proposed test uses might have high versus low stakes for concerned parties. If adverse consequences of test use can be anticipated, they should be averted or mitigated.
Formative decisions that rely on tests and similar data usually involve improvement-oriented actions. These carry lower stakes, with less likelihood of serious or lasting consequences for
2.21.19A Consumer’s Guide to Testing under ESSA
Madhabi Chatterji 24
examinees and concerned individuals, especially in cases of possible data misuse or misinterpretation.
Summative uses, in contrast, involve final judgmental decisions that usually carry more weight, with far higher stakes for concerned stakeholders. For instance, a high stakes action with test results for a student might have to do with a college admission decision which is irreversible. With teachers, school staff or leaders, parallel actions using test data might involve a demotion or loss of a job. Thoughtless or public release of school-based test results that causes embarrassment to school leaders and teachers is another form of high stakes action often associated with adverse consequences. In all, mistakes could matter for involved entities or persons with long-lasting stigmas or impacts.
4.0 Critically Evaluating the Quality of Academic and Non-Academic Measures: The Fourth Step
This fourth step or task flows directly from the first three. It is the key to following best practices in test adoption, validation and use. This section applies to both academic and non-academic measures selected to fulfill ESSA’s requirements (AERA, APA & NCME, 2014; Chatterji, 2003).
4.1 Evidence on Tests and Evaluation Criteria
Whether a test is up to performing the job required by users, is an empirical question that can only be answered by careful evaluation of the body of information that test-makers and other researchers report on a test’s intended purposes, its built-in content, properties and demonstrated qualities. As needed, test users should seek out advisors with advanced psychometric training to ensure that the different kinds of reported evidence on a test or testing program are adequate for their intended purposes.
To enable users to judge the merits of a test for their prioritized assessment purposes, commercial test developers and associated psychometric research entities are obligated to provide user-accessible and timely reports, manuals or resources (AERA, APA & NCME, 2014). Such materials are usually compiled in Technical Manuals or User/Teacher Manuals (in print or online) that accompany particular tests and testing programs. Such assessment resources should describe in user-friendly terms what a test measures, for whom it is intended, how the test was designed, and why (Baker, 2014; Chatterji, 2003).
Three general criteria for evaluating the evidence on a given test or assessment fall under: Validity, Reliability and Utility. But, depending on the type of test and the test’s declared purposes, a different mix of evidence may be required to defend its application.

2.21.19A Consumer’s Guide to Testing under ESSA
Madhabi Chatterji 25
4.2 Validity
4.2.1. Definition. Validity refers to meaningfulness and accuracy of interpretations and uses of test results based on what a test purportedly measures (e.g., a domain of mathematics skills), taking into account the population tested (e.g., 5th graders) and the assessment purposes that users have in mind. Purposes for assessment are central to evaluating validity (Shepard, 2013).
To judge validity, it is not enough to ask: Does the test measure what it is supposed to measure? As we saw in Cases 1-2 and Tables 1-2, a given test can be used for more than one purpose regardless of what it was meant to measure originally. To evaluate validity under ESSA, all the inferences and uses that state level users wish to make with the adopted test’s results, must be considered separately (Chatterji, 2003).
There is usually a theory about what a test purportedly measures, whether it is student learning or quality of educational practices in schools. Therefore, the Standards defines validity as “the degree to which evidence and theory support the interpretations of test scores for the proposed uses of tests” (AERA, APA & NCME, 2014, p. 11 see also, AERA, APA & NCME, 1999; Cronbach, 1971; Messick, 1989; Kane, 2006).
Validation refers to the “process through which the validity of a proposed interpretation of scores for a given use is investigated” (AERA, APA & NCME, 2014, p. 225). Validation deals with the formal and informal studies that test-makers and associated researchers undertake to examine the extent to which various inferences and uses that we wish to claim from the test-based information, are warranted. All the different ways in which assessment developers and users plan to interpret and use test results must be validated separately, whether they rely on raw scores, derived scores or other forms of statistically transformed data.
What are the different kinds of validity evidence that would be pertinent for tests under ESSA? The most current Standards (2014, pp.13-22) identifies five broad sources of validity evidence for justifying a broad range of score-based inferences and uses, as follows. Table 3 presents the same types with abbreviated language for ease of communication, along with others. They are:
(1) “evidence based on test content” (content based validity in Table 3);
(2) “evidence based on response processes” (validity of response processes in Table 3);
(3) “evidence based on internal structure” (validity of internal structure in Table 3);
(4) “evidence based on relations to other variables” (correlational evidence of validity in Table 3, with specific examples of convergent, discriminant, and predictive validity evidence); and
(5) “evidence for validity and consequences of testing” (validity of consequences of test use in Table 3).
2.21.19A Consumer’s Guide to Testing under ESSA
Madhabi Chatterji 26
Given the range in ESSA state plans in Tables 1-2, at least eleven (11) major and specific kinds of validity evidence could be relevant, as defined in A-K categories in Table 3. Again, each state or educational entity must evaluate validation needs vis-à-vis its own specified inferences and uses with test data in its ESSA plan.
4.3 Reliability
4.3.1 Definition. Reliability refers to the consistency of test scores or data produced by an assessment instrument under different conditions, holding everything else constant. Reliability estimates speak to the precision and generalizability of test scores. The Standards defines Reliability as “the consistency of scores across replications of a testing procedure” (AERA, APA & NCME, 2014; p. 33). To gauge reliability, the empirical question is: To what extent will test scores in a given group remain consistent if we were to use different sets of items, forms of a test, testing occasions, or raters/examiners, assuming these are all random samples of some defined universe?
Importantly, reliability evaluations are different and separate from validity evaluations. High reliability estimates accompanied with little or no evidence of validity of score-based inferences is hardly ideal, and should not be a desired target. For an example, think of measuring the width of a room over and over again and getting the same result (showing high reliability of the measures), but concluding it was the length of the room (showing an entirely invalid inference about the attribute of interest).
Test-makers report reliability information in a number of different ways, such as, as reliability coefficients, standard errors of measurement, generalizability coefficients, test information functions, or classification accuracy rates. Each gives a different type of information regarding the precision of test scores. Reliability coefficients are the most common form of evidence and easier to interpret. They range from 0-1.0, where numbers approaching or better than .90 are desirable.
Which types of reliability estimates are relevant would depend again on the assessment purposes users prioritize. At a minimum, test-makers should report the following with the data from ESSA-related tests.
Test-retest reliability coefficient: Will individual student scores remain stable over replicated testing occasions? This evidence is necessary for most tests. It will indicate the extent to which test scores are stable over short time periods of at least 2 weeks.
Internal consistency reliability coefficient: Will individual students respond consistently to different items or item sets of the test? This evidence is also necessary for all tests. It will indicate the extent to which typical test-takers are consistent in their own responses to test questions in a given domain (within-person consistency). Cronbach’s alpha is a common form of this type of reliability evidence.
2.21.19A Consumer’s Guide to Testing under ESSA
Madhabi Chatterji 27
Classification consistency rates: Will the placement of students in a performance category following testing, remain consistent over replicated testing? This evidence will apply when users select CRTs with cut-scores to separate different levels of performance. The results would indicate how reliable the classifications are, or how much measurement error is associated with cut-scores that separate the groups.
Inter-rater reliability coefficient: Will scores be replicable regardless of the rater or examiner who grades papers or observes performances? This evidence will be relevant for tests that incorporate human raters or scorers, such as, tests with essays, performances or constructed response tasks. Most standardized achievement tests today include a writing assessment that calls for some degree of human rater involvement. This type of reliability evidence is relevant even when computer-scoring algorithms may be employed for scores.
4.4. Utility
4.4.1 Definition: From a user’s perspective, utility is a very important property of a test and testing program, having to do with the practical factors governing the usefulness and usability of tests and any supplemental technologies, materials, data systems, or reports meant for users (Gronlund, 1981; Chatterji, 2003). Utility could be affected by several factors, including how complex it is to administer and score test items, the quality of the print-, media- or technology-based platforms that give examinees and users access to the tests and reports.
Utility could also refer to user accessibility, transparency, and ease of interpretability of information from tests for different users. This last criterion on test utility deals with practical factors essential for assuring validity of test use in applied settings: How well can the information produced by tests be interpreted and used by prospective users in the ways the test developers intended? (Chatterji, 2013 a-b).
Teachers, school leaders, and policymakers would each be interested in different kinds of test reports and materials for meeting their different needs. Test developers should report on studies they perform to assure utility levels are high for their primary users.

2.21.19A Consumer’s Guide to Testing under ESSA
Madhabi Chatterji 28
Table 3 Types of Validity Evidence and Rationale for UseEvidence Type RationaleA – Content based Validity Evidence
To justify claims that test results have “content-based validity”, we need evidence from external experts, or authoritative documents and literature verifying that the content covered by items and the test is tied to the domain meant to be tested, such as, math or ELA.
B - Evidence of Validity of Response Processes
To justify claims that results will accurately reflect the targeted mental processes and thinking skills of test-takers, we need evidence that a test actually taps into those “response processes”.
C - Evidence on the Validity of Internal Structure
To justify claims that responses to test items tap into the underlying components of the domain that test makers intended--such as, specifically targeted mathematics skills--we need evidence validating the test’s “internal structure”.
D - Correlational Evidence of Validity
There could be many types of correlational validity evidence:Predictive Validity: To support claims that test scores will correlate with selected criterion performances in the future, we need “predictive validity” evidence at the appropriate unit of analysis.Convergent Validity: To support claims that test scores will correlate concurrently with results of other tests that measure similar domains, we need “convergent validity evidence” at the appropriate unit of analysis.Discriminant Validity: To support claims that test scores will not correlate, or correlate poorly/negatively, with results of other tests that measure the dissimilar domains, we need concurrent, “discriminant validity evidence” at the appropriate unit of analysis.
E – Evidence of Validity Based on Consequences of Test Use
To claim that the application of a test in educational reform or other settings will have the expected positive impacts on students, schools and society, without any adverse impacts, we need evidence on the consequences of test use.
F - Evidence on the Lack of Measurement Biases
To claim that the items, the test’s content, or test scores are not biased towards particular individuals or groups of test-takers, we need evidence of the lack of any form of systematic, test-related biases.
G - Validity of Norms and Norm-Referenced Scores
For defending norm-referenced interpretations and uses of test results, we need evidence showing that the norm group data are recent (+/- 5 years), relevant, and representative of the population of interest. Norms are used for deriving norm-referenced scores like percentile ranks.
H - Validity of Performance Standards and Criterion-Referenced Scores
For defending criterion-referenced interpretations and uses of test results, we need evidence on the accuracy of standard-setting procedures (cut-scores) for the domains tested, and in the populations specified. Cut-scores to determine “performance levels” should be set after domain-referenced assessments are validated (A-D and F above).
I - Validity of “Grouped” or “Group-Score” Inferences and Uses
For inferences and uses at upper levels of the education system, we need appropriate forms of evidence validating the meaningfulness and utility of grouped scores as units of analysis (i.e. scores aggregated at classroom/teacher, school, school system levels).
J – Validity of Scales, Long-term Metrics, and “Linked” Scores
When test makers derive a single “scale score” metric to reflect student performance in a single domain, or multiple “scale score” metrics for different domains, we need evidence to support each metric’s purpose.For making inferences about individual students’ long-term performance across multiple grade levels, or concurrently on multiple forms/ test modalities, we need appropriate forms of evidence to defend the validity of the test’s “linked” scale scores.If the student “growth” scores are aggregated at upper levels of systems, we need evidence showing what the data mean with respect to system-wide improvement/growth
K - Validity Evidence to Support Claims of Group Differences
To justify claims that the scores will be sensitive to, and show expected differences between defined groups (such as, instructed and uninstructed groups of students), we need evidence to support inferences about group differences with grouped scores.
Note: Only selected types of evidence are presented here, as relevant to ESSA requirements.
2.21.19A Consumer’s Guide to Testing under ESSA
Madhabi Chatterji 29
5.0 Pointers and Illustrative Test Reviews for Broad Types of Tests in ESSA’s State Plans
Critical reviews of any standardized test or testing program should start with examinations of materials locally, using all relevant published documentation available from test developers. Preferably, that information should then be combined with technical reviews performed by independent, educational assessment experts. This section provides cautionary pointers and “look for” issues when reviewing each general type of test in ESSA’s plans, organized as follows.
Sub-sections 5.1-5.2 offer reviews of the Common Core State Standards (CCSS) assessments of the SBAC and PARCC consortia in some depth, as illustrations on how to perform similar reviews of standardized achievement tests under ESSA. These reflect two “next generation” Grade K-12 testing programs, adopted by several states under ESSA. For each review, the sections first describe the developers’ purported purposes for each assessment, claims they make about what the tests and different test scores provide, and documented evidence published by test-developers or other researchers associated with the consortia. This is followed by this author’s critical review of “Plus” points and gaps by comparison of test-related documentation against state users’ range of information needs, as mapped in Tables 1-2. Tables 4-5 summarize findings of each review, respectively. Appendix C provides a list of questions users could potentially ask test makers, with assistance from a technical consultant when seeking specific kinds of validity information or initiating validation studies.
Sub-section 5.3 deals with college entrance examinations for high school students. The new version of the SAT® is referenced as a specific example, but the test is not reviewed. Table 6 offers guidelines on Do’s and Don’ts with similar tests.
Sub-section 5.4 speaks briefly to evaluating the quality of “non-academic” measures and indicators of school quality. Special attention is given to survey-based measures.
Finally, Sub-section 5.5 provides brief discussions on interpreting and using different kinds transformed data in ESSA inferential contexts. Specific attention is given to: grouped scores, composite indices of education quality, student growth percentiles, and value-added statistical models.
Limitations: The purpose of the two illustrative “critical reviews” enclosed is to demonstrate what the typical review process might look like to the test user. Readers should bear in mind that the reviews rely on limited documentary information from sources cited on each assessment program, as posted on their web sites through August, 2018. Findings are presented vis-à-vis the general set of assessment purposes represented in Tables 1-2, and not any given state’s accountability plan. Because the reviews here do not speak to state-specific validation needs, individual states could consider undertaking such reviews themselves, as needed.
2.21.19A Consumer’s Guide to Testing under ESSA
Madhabi Chatterji 30
Likewise, evidence or information on the tests published since, or reported outside the technical manuals reviewed, may have been omitted. Other state-adopted or locally designed student achievement testing programs for grades K-12 have not been reviewed as the process of test and evidence evaluation would be similar to those demonstrated.
Finally, readers should bear in mind that the discussion is very limited in Sub-section 5.5 on value added models and various forms of transformed indices here due to space constraints, but some references are provided for further reading. Interested readers are encouraged to seek out added technical consultation and resources on these topics.
5.1 SBAC’s Common Core Assessments in Mathematics and English Language Arts
Description of the testing program provided by developers in SBAC’s consortium
5.1.1 What are the declared purposes of the SBAC’s assessment program, their targeted domains and, populations? The SBAC collaborative aims to create a “high quality, balanced, multistate assessment system” based on the Common Core State Standards (CCSS) in English language arts/literacy (ELA/L) and mathematics for students in grades 3-8 and 11. The main mission of the SBAC assessment system is to “improve teaching and learning” so as to ensure that all students leave high school prepared for post-secondary success in college or a career (CRESST, 2017, p. v). SBAC consortia participants include test developers and psychometric research entities, researchers, policy-makers and state/school district leaders in the participating regions. For the latest updates on SBAC state membership, see Gewertz (2017c).
5.1.2. What are the key design features of SBAC’s dual and integrated assessment system, as given by developers? To achieve its mission and goals, the SBAC assessment program includes two complementary systems: (1) a “summative” assessment program that administers end-of-school year tests at each grade level, with comparable reports to all participant states on both student proficiency levels and gains students make from year to year in ELA and math domains; and (2) a formatively-oriented, “interim” assessment system that is meant to help teachers make instructional changes throughout the school year using assessment results tied to the same domains. The latter is supported with a digital library of professional development materials, instructional resources, and assessment tools aligned to the mathematics and ELA content standards.
According to SBAC’s technical report, the “(c)urriculum and assessments are organized around a well-defined set of learning progressions along multiple dimensions within subject areas. Formative and interim/benchmark assessments and associated support tools are conceptualized in tandem with summative assessments; all of them are linked to the CCSS and supported by a unified
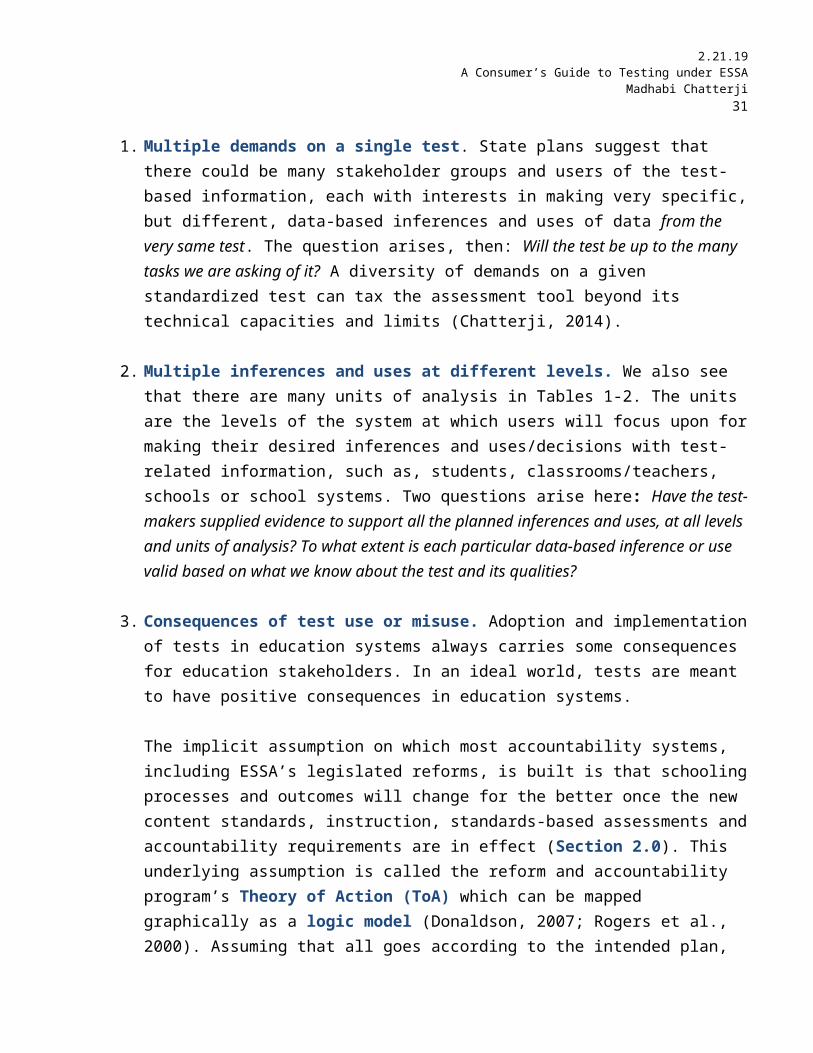
2.21.19A Consumer’s Guide to Testing under ESSA
Madhabi Chatterji 31
technology platform” (CRESST, 2017, p. i-vii italics and bold font added). The program’s main components are the following:
ELA Test Content, Structure and Composition: SBAC’s ELA test for grades 3-8 and 11 has a complex structure made up of four subdomains: Reading, Writing, Listening/Speaking, and Research. Such a test is described as multidimensional by the developers, with each dimension yielding a separate sub-test score. There is also a combined Overall ELA Score across items in all the sub-tests. The sub-test scores are called “claim scores” to refer to the claims that users can make about what the information means.
Math Test Content, Structure, and Composition: SBAC’s math test for grades 3-8 and 11 also has a multidimensional structure. Subdomains are: Concepts and Procedures, Problem-solving, Modeling and Data Analysis, and Communicating and Reasoning. Each produces a sub-test score (also called “Claim scores”), with an Overall Mathematics Score combined across the sub-domains.
Scores and Scales: SBAC’s tests produce “scaled scores”—a type of derived score on a linear metric developed using Item Response Theory (IRT) methods (see Section 1.0). The tests provide criterion-referenced information in the form of four performance levels on the scaled score metric. The cut-scores for categories were set using a method called “book-marking”, drawing on judgments of large numbers of classroom educators and state system stakeholders. The levels denote progressive proficiency levels in the tested domains at particular grade levels.
SBAC assessments also provide percentile ranks. The norm group was selected from the SBAC regions.
5.1.3 What Does SBAC’s Testing Program Promise? The SBAC system claims to offer the following for participating state users of the tests and related information (CRESST, 2017, p. v-vii):
1. Provide valid, reliable and fair assessments of “deep disciplinary learning and higher order thinking skills” in diverse students to meet demands of a global economy
2. Support educators in bringing about “deeper learning” levels in students on the CCSS, with teachers able to address students’ learning challenges by “differentiating instruction” as they teach with the new CCSS content standards.
3. Achieve the targeted outcomes in students and foster the development of “college and career ready students”.
4. Deliver assessments and standardized reports that are timely and cost effective, and useful for different audiences in “tracking and analyzing student progress towards college and

2.21.19A Consumer’s Guide to Testing under ESSA
Madhabi Chatterji 32
career-readiness” at different levels of the system, namely, for individual students, subgroups, classroom, school and district levels.
A diagrammed “Theory of Action” (ToA) in SBAC’s technical manuals depicts the assumptions and plan of operation for the SBAC program at state system levels to make the program work (CRESST, 2017, Figure 1, p.ix). Outside the complex design aspects for the assessment system, the ToA identifies a range of necessary inputs (e.g., CCSS content standards, tests, assessment products and technology systems/resources) that are expected to help the assessment program function as intended, in an ideal scenario. Identified processes also include “professional development” of teachers on the CCSS and tests.
Critical Review of SBAC’s Assessment Program
5.1.3 What’s New in SBAC’s assessment approach? The SBAC’s integrated system of interim and summative assessments is an innovation, along with new item types that include multiple-choice questions (predominantly), extended-response and various forms of interactive, technology-enhanced items, as well as performance tasks that are intended to allow students to demonstrate critical thinking and problem solving skills.
Also new is SBAC’s Computer Adaptive Testing (CAT) technology. Through CAT procedures, a student first takes items on a short, “routing” assessment; the computer then automatically adjusts the difficulty of any new questions it presents based on the students’ prior answering patterns. During the testing process, CAT methods allow for more efficient testing by presenting only items best matched to students’ assessed ability levels (Price, 2018; Bandalos, 2018).
CAT systems are meant to offer more reliable yet efficiently produced information to educators about student achievement in a given domain than is possible with a much longer, traditionally-designed paper and pencil test. However, the efficiency could shortchange the deep and broad definition of the tested domains that SBAC originally desired. CAT procedures rely on pre-set items organized by estimated levels of difficulty. Because the item difficulty levels are estimated using psychometric models that require unidimensional score scales (basically, test items that measure a single domain), the depth and breadth of content tested could alter and fail to capture the scope of the complex, multidimensional domain structure that SBAC hoped to assess (see Section 5.1.2). Appendix C includes a question on this issue that test users could explore with test developers.
5.1.4 Plus Points and Unresolved Issues of SBAC’s Assessment System under ESSA. Overall, the SBAC’s Plus Points are fivefold:
(a) The integrated and dual assessment system is a Plus. The ToA linking interim assessments to support teaching and learning goals of schools on the CCSS, with a
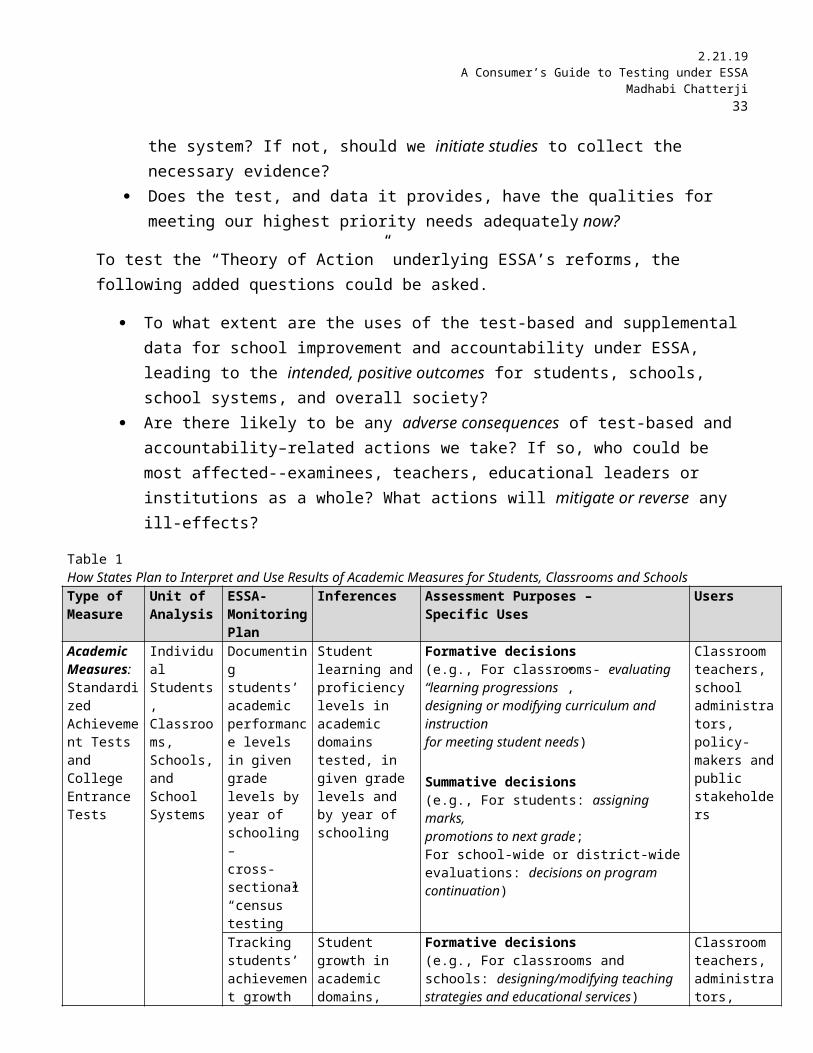
2.21.19A Consumer’s Guide to Testing under ESSA
Madhabi Chatterji 33
summative, year-end testing program to support accountability and school evaluation needs, is an innovation that opens opportunities for test developers and users to join forces in studying how well the ToA is upheld during implementation of reforms. They can alter course along the way, as needed.
(b) The SBAC engaged stakeholders in test development processes more extensively than is typical—this is a Plus. For example, the developers used the “book-marking” method to set performance standards on the achievement metric using large panels of stakeholders online, and a smaller, selective and more qualified group for verification.
(c) Adequately detailed technical manuals, web-based materials and resources are a Plus. In theory, the resources for Grades 3-8 and 11 tests in mathematics and ELA for the integrated assessment system should facilitate appropriate test uses per the ToA. To their credit, SBAC provides technical manuals separately for the interim and summative measures.
(d) The use of new technologies and innovative item types is a Plus. The new assessments and items attempt to tap into complex domains, as prioritized by CCSS reforms under ESSA.
(e) Systematic efforts to comply with the 2014 Standards are also a Plus. SBAC’s test developers strived to follow technical procedures, test design, validation and reporting procedures per the latest guidelines.
Potential Issues and Evidence Gaps under ESSA
For particular test-based inferences and uses specified in their ESSA plans, at the moment, there are several issues that individual states should examine with care. This guide identifies omissions/oversights that may be problematic immediately, or could become major issues down the road in high stakes test use contexts. The main areas of concern are as follows.
1. ValidityTable 4 summarizes the main issues that would need careful evaluation, based on a review of SBAC’s latest technical information and portions of Tables 1-2 that could apply to many of SBAC’s states. Much of the validity evidence that users will need under ESSA is not available at the moment.
The most complete information and evidence is on performance standards for criterion-referenced inferences, and norms for making norm-referenced interpretations of student scores. To ensure fairness for all test-takers, SBAC’s test makers also paid a good deal of attention to issues of Differential Item Functioning (DIF). DIF studies apply statistical procedures to identify and eliminate malfunctioning items that show biases towards particular groups or individuals. These are all Plus Points.
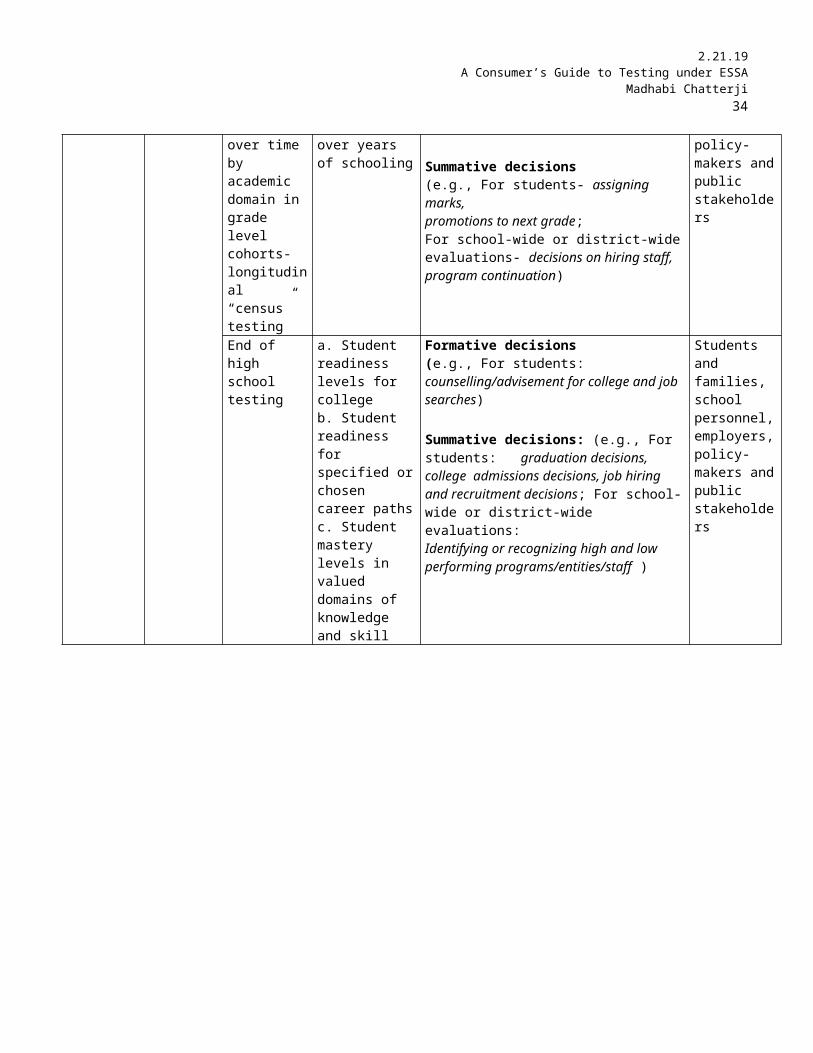
2.21.19A Consumer’s Guide to Testing under ESSA
Madhabi Chatterji 34
Despite the stated goals, the reported evidence and some opaqueness of the SBAC’s program presently overlook essential needs of teachers and educators on the ground. For example, these questions may be raised: Given that unidimensional scales were developed for multidimensional mathematics and ELA/L domains, what is the content coverage and emphases in final test forms by grade level after scale score metrics were derived? Or, why is predictive validity evidence lacking presently for score-based interpretations, when college and career readiness is a key goal of SBAC? These are issues and evidence gaps that test makers and test users could jointly aim to close at the earliest.
2. ReliabilityThe reliability levels of Overall Scores on math and ELA tests are at around .90, which are acceptably high. Additionally, the reliability is acceptably high for classification of students in proficiency categories. However, the reliability levels fall well short on some sub-test scores (the Claim Scores). These are in the .50-.70 range. This is an area of some concern, as SBAC claims to provide teachers with the useful formative and diagnostic information on sub-tests so that they can differentiate and tailor teaching methods for diverse students on a “learning progressions” continuum, leading up to college and career readiness. Given the present reliability data, high stakes or summative decisions should not be made with the sub-test scores.
3. Technical TensionsThere are two areas of tension that test users should seek to clarify with developers. First, as pointed out earlier, despite multidimensional and multi-layered domain structures mentioned earlier, SBAC’s test developers combined two IRT models to obtain a unidimensional metric. IRT-based scaling methods offer the technical advantage of yielding a single linear scale from which a common longitudinal scale can be derived by linking together grade level tests in math or ELA/L. But this advantage could potentially undermine content-based validity of test scores at a given grade level, as the method retains only those test items that fit the IRT models using mathematical criteria. What is tested at given grade levels could change after scaling is completed. Without this key information, educators and teachers will misinterpret what students have learned; further, this could also compromise the teaching and learning goals of SBAC.
To facilitate better interpretations and uses of the results, state and school system users should ask for added information (see Appendix C). For example: After scaling was completed, are there adequate numbers and types of items on the valued content standards in a grade?
A second tension arises due to the construction of the tests to simultaneously allow for criterion referenced and norm-referenced interpretations of scores. The conflicting design criteria and purposes of CRTs and NRTs discussed in Section 2.0, respectively, becomes the source of this technical issue. The end result is that the final tests function better as one or the other type of test. From the technical
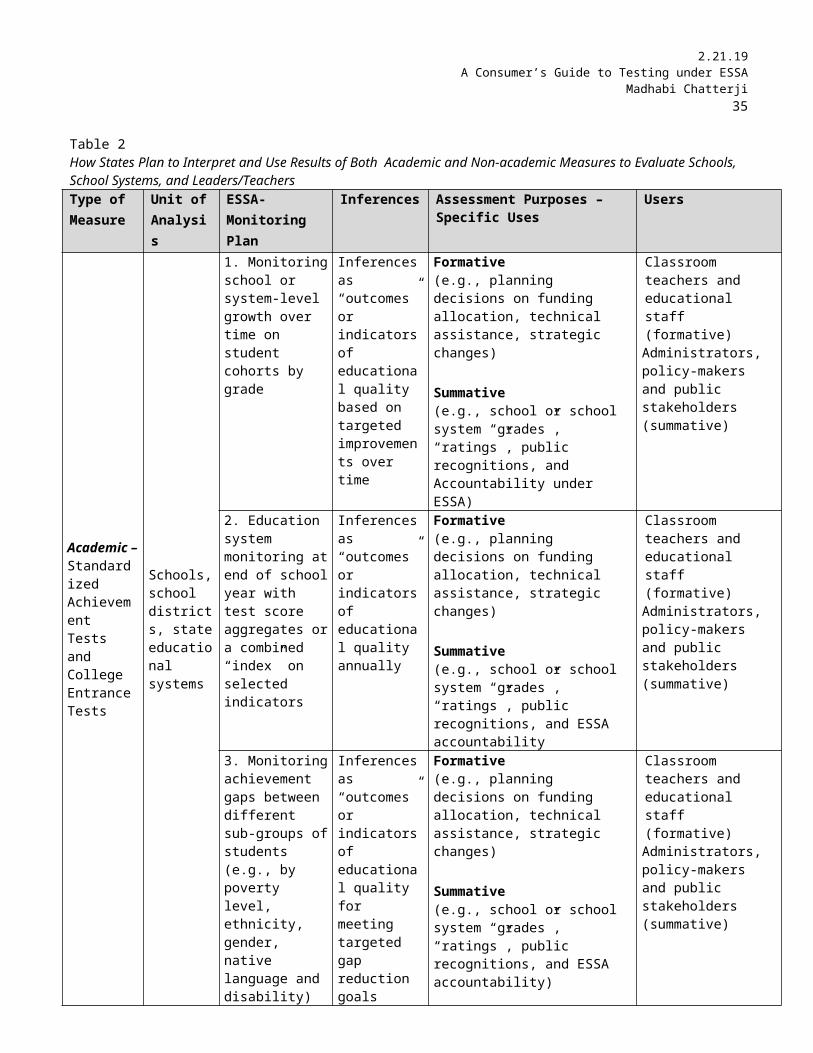
2.21.19A Consumer’s Guide to Testing under ESSA
Madhabi Chatterji 35
information reviewed, in this author’s opinion, the tests appear to be functioning more as NRTs at the moment than CRTs. That is, scores allow for better comparative interpretations in the general domains tested in mathematics and ELA/L, rather than the fine-grained inferences about “deeper” learning levels on the knowledge and skills taught in a grade.
4. Longitudinal Metric Issues SBAC applied well-established techniques with IRT models to achieve scale score metrics and vertically linked scales. As discussed in Section 1.0, the main purpose for vertically linking scores from adjacent grade level tests—such as, grades 3, 4, and 5—is to create a common, equated scale whereby the scale scores become interpretable in similar ways in those grades. The procedure is not meant to measure long term growth in a single domain, as the curriculum changes from grade to grade. The procedure has too many limitations that bar longitudinal, growth-based inferences in accountability contexts.
For example, scale score metrics--once linked--have set “floors” (lower limits of score scales), “ceilings” (upper limits of score scales), and equating errors (errors in the region of the scale where grade level tests are joined, usually with just a few common items). At scale points where grade level tests are linked, scores might appear falsely to stagnate or decline due to the artifacts of the vertical linking method rather than actual student learning changes. A recent controversy on declining group-scores on SBAC’s tests makes more transparency on scales and scaling techniques essential for users (McRae & Evers, 2018).
As seen in Tables 1-2, many test users and policy makers still seek out the scale scores for evaluating growth of students, schools and systems. To facilitate better test use, test-makers should make the trade-offs between the IRT-based scaling outcomes and content based validity of scores more clear to practitioners and policy makers. Further, far more information on the limitations of growth-based inferences from vertically equated scales is necessary to allow more contained and appropriate interpretations at individual student and group-score levels. Generally, however, growth-based inferences from scale scores should be avoided for high stakes and summative decisions.
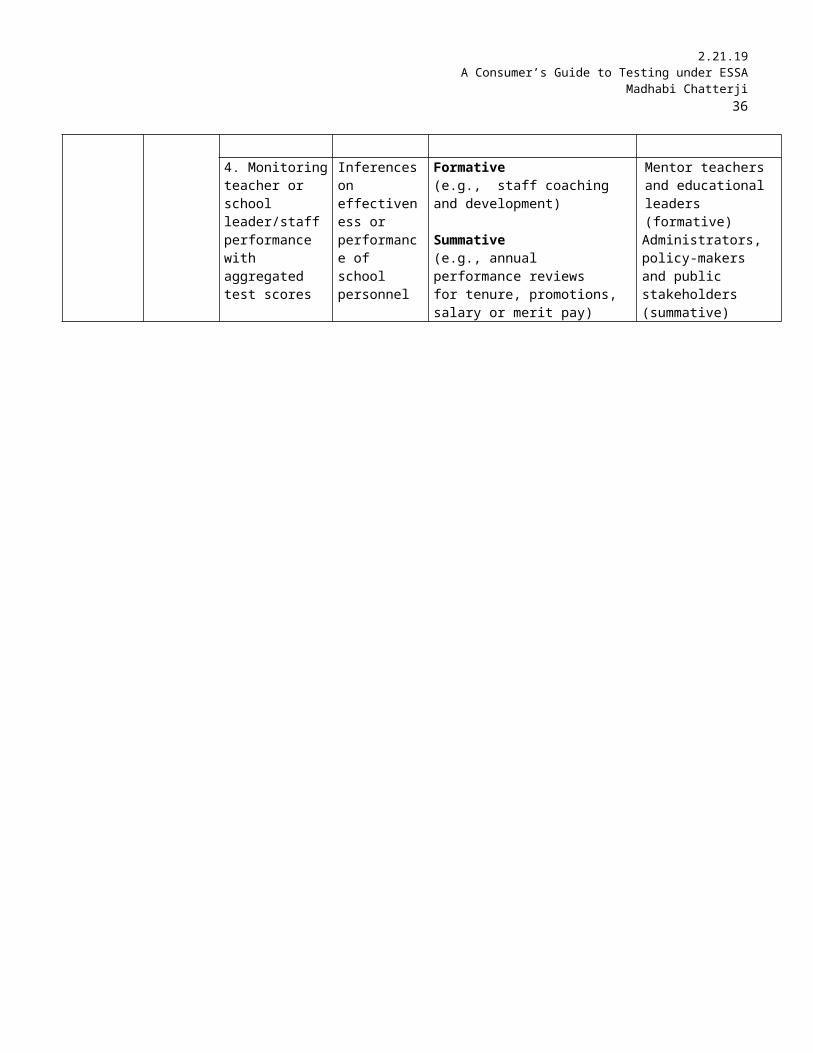
2.21.19A Consumer’s Guide to Testing under ESSA
Madhabi Chatterji 36
Table 4SBAC Tests: Currently Available Evidence to Evaluate Validity and Reliability of Test Scores in ESSA Contexts
Evidence Adequacy Evaluation
Evidence Type Explanation
Adequate evidence
G - Validity evidence of norms and norm-referenced scores
There is enough detail in manuals for users to evaluate this validity aspect. Norms and scales were established using accepted methods. Norms are recent, relevant and representative of SBAC regions.
H – Validity evidence of standards, performance levels and criterion-referenced scores
There is enough detail in manuals for users to evaluate this validity aspect. Established methods were followed to develop standards and performance levels.
Partial evidence
A - Content-based Validity Evidence
Items were content validated via a series of external studies, a Plus. But there is little information on item content and composition in final test forms at each grade level and subject area after IRT-based scales were finalized.
B- Validity of Response Processes
Current evidence is limited or absent to verify students’ “deeper” learning” levels in domains of learning, and how learning progressions are mapped through scores as students advance, a major claim of SBAC.
C – Validity of Internal Structure
The domain structures described is “multidimensional” in terms of content and cognitive processes. There is no evidence yet on the factor structure of grade level tests in math and ELA. As “unidimensional” scaling models were applied, there are questions as to how well the full scope and dimensions of complex CCSS domains are measured by the tests.
D – Correlational Evidence of Validity
Currently, test-makers provide only inter-correlations of subtest scores-these show reasonable but modest overlaps. There is no evidence on predictive or convergent validity of scores yet with other variables. Predictive validity studies should be a priority, given SBAC’s goals.
F – Evidence of Lack of Measurement Biases
SBAC did thorough Differential Item Functioning (DIF) and other bias studies on test items. There are no studies yet on possible predictive biases of high school level scores, or subgroup differences on total scores and performance levels, with measures of college and career success as criteria.
I – Validity of Longitudinal Scales
SBAC provides adequate information on linking and scaling with individual students across multiple grades, but no evidence yet on validity of grouped score gains that are also necessary to support ESSA’s inferences on achievement growth of schools and school systems.
No evidence
E – Validity Evidence on Consequences of Test Use
There is no evidence on this yet; this evidentiary support is necessary in light of SBAC’s and ESSA’s ToA.
J – Validity of Inferences with Grouped Scores
There is no evidence on this yet; some evidence of validity and reliability is critical due to ESSA accountability requirements at schools and upper levels of system
Reliability Evidence: Overall Scores on math and ELA tests are acceptable at or better than .90. Reliability of Sub-test Scores in math and ELA in the .50-.70 range. Classification accuracy rates high with reliable categorizations.
2.21.19A Consumer’s Guide to Testing under ESSA
Madhabi Chatterji 37
5. Interpreting Initial Student Proficiency Rates with CautionStandard-setting methods ought to involve appropriately qualified content experts. SBAC worked hard to meet this criterion. Historically, book-marking methods tend to yield highly difficult standards and cut-scores for tested groups, particularly in initial stages of test adoption when implementation of new curricula at schools is uneven. Predictably, therefore, there were large percentages of student failures in the first operational test administrations. These issues will likely settle as the CCSS curriculum, instruction and assessments become better aligned through improved school practices. As testing continues, however, reform implementation levels should be monitored to assure validity of content-based inferences from SBAC’s test proficiency categories and scores.
6. Monitoring Achievement GapsSBAC’s technical reports present data on student achievement gaps – a positive. The results in proficiency categories now suggest significantly different patterns of performance by ethnic group: Asians, followed by Whites, have the highest proportions falling in the two highest proficiency categories; Hispanics followed by Blacks have the lowest proportions meeting the same standards, with large achievement gaps between subgroups in both math and ELA/L. Because SBAC’s classification accuracy rates with error bands suggest reliable categorizations, test makers and users should jointly look into the possible causes for these early results on achievement gaps. The gap patterns are consistent with previous educational literature, but productive classroom interventions towards closing the gaps could begin now.
7. No Evidence yet on Predictive Validity and Prediction-Selection BiasesLacking at the moment are predictive validity studies on SBAC’s test scores along with examinations of potential biases towards subgroups of exiting high school students. Widely used college entrance examinations like the SAT ® have tended to under-predict for high school girls as compared to boys. Such findings are not necessarily “ minus” points on a test if test users are aware of the limitations and can make appropriate adjustments when using the data. But, the evidence must be available. Given SBAC’s emphasis on college and career readiness, predictive validity evidence with future performance criteria gathered in college and career settings, is necessary.
Summary - SBAC’s Testing Program Review
SBAC’s assessments are being carefully designed with established procedures, and are generally compliant with the 2014 Standards. The program has very ambitious goals. The integrated program of formative and summative assessments is both an innovation and a strength that capitalizes on several technology advancements. The technologies give greater user access, add variety to items, and open up testing options to diverse examinees and consortium users.
2.21.19A Consumer’s Guide to Testing under ESSA
Madhabi Chatterji 38
The ToA is a first in a large scale, standardized testing program, and shows the test-makers gave attention to schooling-related implementation factors beyond just attention to the test design and psychometric properties of tests. The ToA also provides an opportunity for studies that investigate consequences of test use in future.
The tests are performing reasonably well now in providing point-in-time measures of student-level performance in general CCSS domains, and for making norm-referenced interpretations. The student test scores also allow some criterion-referenced interpretations by performance level, but in general mathematics and ELA/L domains (without deeper interpretations of mastery in concept- or skill-specific areas). SBAC’s tests in the interim assessment program could be redesigned for better information on deeper learning levels of students, consistent with the consortium’s goals.
Importantly, some of the most essential evidence is still unavailable for meeting ESSA’s upcoming accountability requirements. Validity of grouped scores for annual performance evaluations and predictive validity evidence for high school students are areas that need immediate attention, in this author’s view. When using the test scores in ESSA contexts, users must bear in mind limitations of particular test design procedures, the timing of test administration, and the status of reform implementation processes in school systems.
5.2 PARCC’s Assessments in Mathematics and English Language Arts/Literacy
Description of the testing program provided by test developers in PARCC’s consortium1
5.2.1 What are the declared purposes, domains, and populations of the PARCC’s assessment program? The Partnership for Assessment of Readiness for College and Careers (PARCC) is the second multi-state consortium that purports to create “next-generation assessments” aligned to the Common Core State Standards (CCSS). They declare three purposes for the PARCC Mathematics and English Language Arts/Literacy (ELA/L) assessments for Grades 3-8, and high school students: (1) The tests are intended to provide information on the extent to which students are on track for college- and career-readiness; (2) the tests produce “summative” measures on the “total breadth of student performance” on the “full range” of CCSS by grade; and (3) the tests are designed to provide data to help inform classroom instruction, student interventions and professional development (Pearson, 2017, pp. 1-2). The PARCC consortium consists of eleven states, the District of Columbia and the Bureau of Indian Education in the U.S (Pearson, 2017, pp. 1-2).
2.21.19A Consumer’s Guide to Testing under ESSA
Madhabi Chatterji 39
5.2.2 What are the design features of PARCC’s assessment system, as given by developers? A general description follows of the tests, as given in the PARCC’s manuals and published documentation.
Structure: PARCC’s assessment system has two components: a Performance-Based Assessment (PBA) and the End-of-Year (EOY) assessment. Both can be administered as computer-based or as paper-based tests. The program has conducted comparability studies on the two modes of testing that do not show interchangeability at the moment, according to their own reports. The program generates a summative score when a student achieves a “valid” score on both components, PBA and EOY (Pearson, 2017), for which the determination criteria are not immediately clear.
Item Types: The tests comprise various item types: selected response, brief and extended constructed response, technology-enabled and technology-enhanced items, and performance tasks. Technology-enabled items provide a digital question as a stimulus or an open-ended response box to which students provide answers. Technology-enhanced items employ student performance tasks on computers. In an example, students “categorize information, organize or classify data, order a series of events, plot data, generate equations, highlight text, or fill in a blank” (Pearson, 2017, p. 2).
Tested Domains and Scores in ELA/L: PARCC’s ELA assessments have five sub-domains, each producing a separate score (also called Claim Scores), as follows: (1) Vocabulary, Interpretation, and Use; (2) Reading Literature; (3) Reading Informational Text; (4) Written Expression; and (5) Knowledge of Language and Conventions. A total scale score is also produced for the overall tests by grade using an IRT-based scale construction model. The best fitting items from all sub-domains define the unidimensional scale that generates the overall scale score.
Tested Domains and Scores in Math: PARCC’s math assessments yield four subdomain scale scores and a total scale score, as well. The subdomain scores (called Claim Scores again) are titled: (1) Major Content with Connections to Practices (2) Additional and Supporting Content with Connections to Practices; (3) Highlighted Practices with Connections to Content: Expressing Mathematical Reasoning--by constructing viable arguments, critiquing the reasoning of others, and/or attending to precision when making mathematical statements; (4) Highlighted Practice with Connections to Content: Modeling/Application-- by solving real-world problems by applying knowledge and skills articulated in the standards. Again, a total scale score is produced for the overall tests by grade
2.21.19A Consumer’s Guide to Testing under ESSA
Madhabi Chatterji 40
using an IRT-based scale construction model. The best fitting items from all sub-domains define the unidimensional scale that generates the overall scale score
Performance Levels: The PARCC’s ELA/L and mathematics tests report IRT-based scaled scores for each grade level. Five performance levels are identified on this metric using cut-scores: Level 5-Exceeded expectations; Level 4: Met expectations; Level 3: Approached expectations; Level 2: Partially met expectations; and Level 1: Did not yet meet expectations.
Horizontal Equating: Because of the multiple modes of assessments, technology-based and various item types in multiple test forms, presented in different languages, the test-makers performed several “horizontal equating” studies with common linking items to try to set up a single, common and comparable scale across the different modes, forms, and languages (Pearson, 2017, p. 2).
Vertical Scaling: PARCC did not vertically link grade level tests in the Mathematics and ELA/L domains to derive a common and comparable score scale as grades increase.1
5.2.3 What’s New in PARCC’s assessment approach?
Creative and Maximal Use of Technology: PARCC’s assessments depart from traditional achievement test design techniques in their extensive use of technology-enabled and technology-enhanced assessment tasks to tap complex performances and abilities. Additionally, they incorporate performance tasks in the assessments. PARCC also utilizes several technology-based tools to add efficiency to different stages of test design, for example, for item-banking and test assembly, item scoring and administration, providing assistive technologies for students with disabilities, intelligent essay readers for scoring constructed response items, testing security checks, and software programs like ePEN2 to monitor human scoring performance (Pearson, 2017, p. 2).
5.2.4 What Does PARCC’s Testing Program Promise? The main declared focus is on assessing the CCSS comprehensively. PARCC test-makers’ key claim is that a student’s total scores will allow inferences about “how much knowledge and skill in the content area the student has acquired”. The classifications by performance levels purportedly separate students “in terms of the level of knowledge and skill in the content area” as they progress through school (Pearson, 2017, p. 3). The “Master Claim Structure” provides the content domain specifications in both mathematics and ELA/L, spelling out the targeted learning outcomes in general and more specific terms that the tests aim to tap.

2.21.19A Consumer’s Guide to Testing under ESSA
Madhabi Chatterji 41
Critical Review of SBAC’s Assessment Program vis-à-vis ESSA
5.2.5 Plus Points and Unresolved Issues in PARCC’s Tests Overall, the PARCC’s Plus points are as follows:
(a) Creative use of new technologies and innovative item types. To better tap into the CCSS comprehensively, and provide more access, accommodations and alternative options to various assessment users and examinees, PARCC’s program capitalizes on new technologies. This is a Plus.
(b) Adequately detailed technical manuals, web sites and resources for consortium users are also a Plus. Materials are available to both evaluate and use different aspects of the assessment system.
(c) Systematic efforts to comply with the 2014 Standards are another Plus. PARCC’s assessment program strives to comply with technical procedures, test design, validation and reporting procedures per the latest standards.
(d) Systematic efforts to add new technologies for efficiency in test design, scoring and administration is a Plus. Pearson is possibly a leader in the testing industry in taking some of these technology-based test design procedures to scale. Technologies have been added extensively to improve item scoring, rater training and quality control procedures during test development.
Potential Issues and Evidence Gaps under ESSA
As with any testing program, individual states should examine the PARCC assessments carefully in light of their proposed data-based inferential needs and uses in their own accountability plans. See Table 5 and details that follow.
The best and most complete validity evidence available to date on the PARCC tests is on performance standards and standard-setting methods. There are several areas with partial evidence. The main areas of where issues can arise under ESSA are as follows. Suggested questions to help users explore the evidence gaps further, and seek productive resolutions with test developers, are in the Appendix C.
1. Validity. Much of the essential validity evidence that users will likely need under ESSA is not available at the moment. PARCC’s program makes modest claims for interpreting and using of scores at the student level only, but at present there is incomplete evidence to support many immediate inferential needs at the student level, too. For example, the sub-test score correlations are largely in the .60s, suggesting only around 36% of overlapping variance in the data from sub-test components. Such evidence indicates that each sub-test might be separately measuring unique dimensions in ELA/L or math (see

2.21.19A Consumer’s Guide to Testing under ESSA
Madhabi Chatterji 42
Claim Structure in manuals). However, score scales derived with Item Response Theory (IRT) models could mask such information, and will allow mostly general, norm-referenced interpretations of students’ placement on the scale continuum at the moment. Users need clarity on how to interpret total scores and sub-test scores (the “claim” scores) more accurately with reference to each test’s domain specifications following derivation of scale scores.
Evidence on predictive validity and validity of grouped scores are omissions that need immediate attention under ESSA’s requirements, too, along with content-based validity evidence for teachers to facilitate criterion-referenced interpretations of student performance. PARCC’s tests currently offer partial evidence in several of these areas, as explained in Table 5.
2. Reliability. The internal consistency reliability of Total Scores on PARCC’s math and ELA/L tests are at acceptably high levels (.80s to .90s) in tested populations. The reliability levels were checked and replicated in all or most subgroup breakdowns—this is a Plus.
On sub-test scores, however, the average reliabilities are lower (in the .50-.70 range). While lower reliability in sub-test scores may be acceptable for meeting more formative needs in teaching and learning contexts that involve low stakes information uses, the depressed estimates are of more serious concern in summative decision-making applications.
Classification accuracy rates for criterion-referenced interpretations of performance levels are very high (.8 to .9) for performance levels 3 and higher. Users should ask for accuracy rates at lower levels and be cautious in using less reliable data for summative decisions.
3. Technical Tensions and CCSS measuresPARCC’s test developers also combined two unidimensional Item Response Theory (IRT) models to calibrate different types of test items to create one linear scale score metric for grade level tests. The rationale for unidimensional scaling is similar to that of SBAC’s program—to obtain horizontally linked metrics that have comparable scores. As indicated, reliance on this methodology is predicated on the assumption that items that “best fit” the selected IRT mathematical models will tap into the general underlying ability that is being tested. But, the cost is that all the components and dimensions of the CCSS curriculum will not be measured in depth or breadth. As PARCC’s stated aims are to maximally tap into the full scope of CCSS, this technical decision presents a paradox with unclear content-based validity levels in data produced by the final test forms.
2.21.19A Consumer’s Guide to Testing under ESSA
Madhabi Chatterji 43
Table 5PARCC: Currently Available Evidence to Evaluate Validity and Reliability of Test Scores in ESSA Contexts
Adequacy of Evidence Evidence Type Explanation
Adequate evidence
H – Validity of standards, performance levels and criterion-referenced scores
There is enough detail in manuals for users to evaluate this aspect of validity.
Partial evidence
A - Content-based validity
Items were content validated with systematic and multiple reviews of domains before item-level psychometric work and IRT scaling began. There is limited or no information on content emphasis and cognitive processes tested in the final test forms by grade. This is necessary to help school practitioners align curriculum, instruction and assessments to the CCSS, and improve outcomes.
C – Validity of internal structure
There is little or no data on factor structure of domains and sub-domains. Unidimensional IRT models were applied to scale the data from tests to derive a best-fitting linear metric. As the CCSS domain structures are complex and multidimensional, users need evidence on the extent to which PARCC’s summative tests at each grade level yield data consistent with the intended domain and sub-domain structure (Claim Structures in manuals).
D – Correlational evidence on validity
Currently, only inter-subtest score correlations are available. There is no evidence on predictive validity, which is necessary to support PARCC’s long term goals for college/career ready students. Other forms of convergent validity will clarify what the tests at each grade level are measuring.
F – Lack of systematic biases
PARCC did thorough item DIF studies, but there is no evidence yet on prediction/selection biases or subgroup differences on total scores related to predictive validity, and on performance levels.
I – Validity horizontally linked scales and scale scores
PARCC devoted extensive resources to horizontal linking of student scores from different test forms and modes. But, there is little or no supporting evidence yet on the various forms that are linked, nor guidance to test users on limitations of the techniques—this is necessary for improving test score uses for student/school evaluations under ESSA.
No evidence
B – Validity of response processes
Evidence is absent now on how, and what types of, students’ cognitive processes are tapped when they engage with various CCSS tasks
E – Evidence of validity based on consequences of test use
There is no evidence on consequences of test use yet; this evidentiary support is necessary long term in light of ESSA’s larger ToA.
J – Validity of inferences with grouped scores
There is no evidence on what grouped scores mean in cross-sectional or longitudinal evaluations. Some evidence of validity and reliability is critical due to ESSA accountability requirements that call for score aggregations at upper levels of system, with clear communications of limitations.
Reliability Evidence: Total Scores on math and ELA/L tests are at .80s to .90s. Sub-test scores are in n the .50-.70 range. Classification accuracy rates are at.80 to .90 for levels 3-5

2.21.19A Consumer’s Guide to Testing under ESSA
Madhabi Chatterji 44
As with SBAC, test users should therefore ask to review content-based validity levels again by grade level as ESSA implementation begins. Ask: After scaling, how well do the content/cognitive processes in the final test forms compare against the original CCSS domain specifications for each grade and subject area? Transparency on the content and cognitive processes tapped by tests will help teachers, and is relevant to PARCC’s goals to give teaching-learning supports to schools and school systems. Allowing users to examine the domain specifications of final test forms may also facilitate curriculum implementation in alignment with the content emphases reflected in CCSS tests (Appendices B-C).
4. Currently, PARCC’s Items are Prohibitively DifficultItem analysis results from the first operational testing of PARCC show that test items across grades, subject areas, and modes of testing are extremely difficult for targeted students by grade. On ELA/L items the median proportions of students who were able answer items correctly ranged from 37%-47% only in 2015-16. On math items those median proportions ranged from 22%-55% only (PARCC-Pearson, 2017, pp 64-65). Users and test-makers should examine the possible causes for this finding, as that report uses data collected five years after reform implementation began. Discussions on how best to align CCSS reform implementation in schools with the testing schedule under ESSA need to occur immediately, so as to optimize results with higher levels of content-based validity.
5. Potential Fallout from Horizontal Equating of Tests and Test FormsPARCC has equated test forms of different modalities, languages, item types and so on, horizontally (within given grade levels), so as to establish comparable score scales. Given that the PARCC’s mode comparison studies (paper based versus computer based tests) do not show one-to-one equivalence, there may be concerns as to whether the test forms can all be placed on a common scale in a manner that carries a common meaning with respect to CCSS content tested in a given grade. Adequate details on these studies are lacking at the moment and may be useful to test users and other researchers in advising schools and districts on appropriate test-based interpretations and uses.
Summary -PARCC’s Testing Program ReviewPARCC’s tests are also being developed with attention to detail, using established and appropriate procedures per the 2014 Standards. The program is using new technologies maximally to improve efficiency and production at scale. Based on current evidence, the mathematics and ELA/L tests by grade level are producing information of student proficiency by performance level in the general CCSS domains tested. The scaling methods yield data more suited for norm-referenced interpretations on a continuum of measured ability, although the program does not present norm-referenced scores. There is not enough evidence to support more detailed skill-specific inferences of student learning.
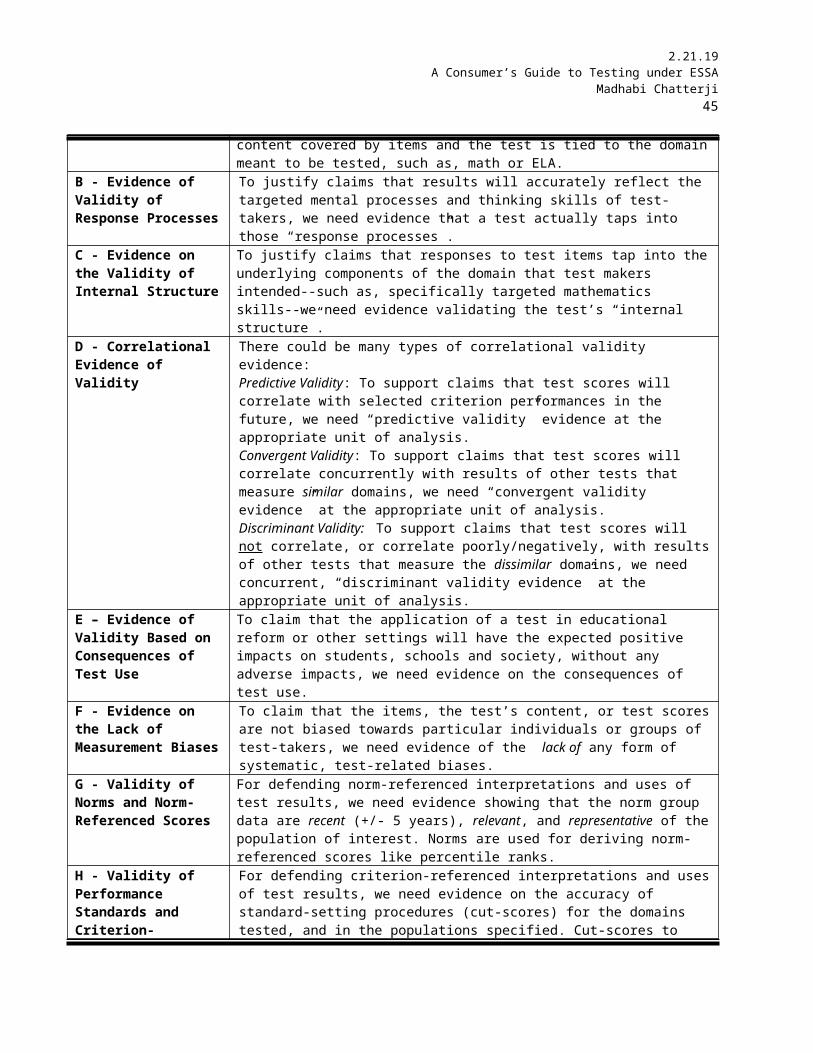
2.21.19A Consumer’s Guide to Testing under ESSA
Madhabi Chatterji 45
Under ESSA’s new needs, currently, the main user needs for validity evidence are partially met or not addressed yet. The main missing elements deal with the validity, reliability and utility of grouped scores at upper levels of education systems for annual evaluations, a need for clarifying limitations of scale score metrics for individual student and grouped data, when used, the lack of evidence on predictive validity and potential group-specific selection biases, and evidence of content-based validity after scale scores were derived. Evidence of validity of the expected positive consequences of test use under ESSA school reform contexts is also highly desirable.
Currently, the test-makers claim “construct validity” of scores for inferences and uses at the student level only based on their reported assessment design procedures and evidence. They claim the tested domains are unidimensional based on inter-correlations of sub-test scores, local independence of items, and levels of data fit with their selected IRT models. This reviewer agrees that each of the grade level tests is measuring a global domain consonant with the claim that the measured constructs are unidimensional. But, given the test maker’s proposed multidimensional domain structures, and moderate inter-correlations of sub-test scores reported in the technical manuals, several design-related questions must be resolved. Discussion among test developers and test users should ideally follow on these issues (see #1 above and Appendix C for questions users might ask).
As mentioned before, the “unidimensional” scale score derived is useful for measuring a single, general achievement domain. But, it comes at the cost of measuring the full breadth and depth of CCSS domains for making detailed, instructionally useful, domain-referenced interpretations—a stated goal of PARCC. The limitations and trade-offs between content-based validity necessary for making domain-referenced interpretations of scores vis-a-vis the outcomes of IRT-based scale construction, must be communicated clearly. Specifically, clarity of construct meanings after horizontal equating procedures should also be given attention.
Consistent with PARCC’s and test user’s goals in state school systems under ESSA, new validation studies would need to be undertaken in prioritized areas. Test uses must be curtailed in areas where test makers have not yet provided sufficiently strong evidentiary support (see Tables 1-3, and 5).
For students to succeed on the EOY tests and reach the college and career readiness levels after high school, schools/school systems must be able to align and implement all components of the reformed curricula under ESSA’s new accountability requirements. For this to occur, school system educators and teachers need time and ongoing support, including professional development on the CCSS assessment and curricular resources. Test users at high level leadership and policy making positions should not rush to make high stakes inferences/uses of the data too early, or in ways that test makers caution against.

2.21.19A Consumer’s Guide to Testing under ESSA
Madhabi Chatterji 46
5.3 Using College Entrance Examinations under ESSAUnder ESSA, several states are planning to use results of college entrance examinations in the following ways:
1) To assess students’ college and career readiness levels, and 2) For school system/district evaluation and accountability purposes.
In addition, many school systems and individual schools add a third use:3) As high school exiting examinations for students in verbal and mathematics domains,
Several of the cautionary pointers and issues discussed for tests developed by under SBAC and PARCC would apply to college entrance examinations when the data are employed under ESSA’s rubrics. The caveat is that college entrance examinations are not achievement tests tied to K-12 curricula. The declared audiences, assessment purposes, domains and populations for these types of tests are different from those of standardized achievement tests. The SAT ® will be referenced as a specific example in this category to make particular points, but the test has not been reviewed.
See the summarized set of recommendations in Table 6. The Do’s and Don’ts apply for test users adopting college entrance tests for meeting specific accountability needs under ESSA, or other uses.
5.3.1 Purposes of College Entrance Assessment Programs College entrance examinations are typically a part of large scale, standardized testing programs designed to assess high school students’ readiness to succeed in college at the undergraduate level. In response to recent education reform initiatives, most of these tests have been revamped to determine the degree to which students are prepared to succeed both in college and the workplace. The audiences for whom the tests are designed are primarily higher education institutions, students aiming for higher education, and now, K-12 education system stakeholders aiming to prepare students for college and careers.
The SAT® is among the most widely used of such programs in the US and overseas. It is a test developed by the College Board, labeled as a college and career readiness assessment as a part of a group of similar assessments that includes the PSAT/NMSQT, PSAT 10, and PSAT 8/9 for middle and high school students (The College Board, 2017).
5.3.2 What are the Typical Design Features of College Entrance Examinations? In terms of content, college entrance examinations typically measure general domains of knowledge, skill, and understanding that stakeholders deem are necessary for students’ success in college and careers in future. For example, the SAT was recently redesigned in keeping with latest research on college and career readiness to have a deeper focus on fewer topics, covering reading, writing, language, and math skill areas. The emphasis now, as described by the test-makers, is on testing “in context” with items that have real world relevance, and demanding problem-solving

2.21.19A Consumer’s Guide to Testing under ESSA
Madhabi Chatterji 47
and analytic capacities rather than a reliance only on subject area knowledge. To illustrate, the SAT Math Test has four parts, labeled: Heart of Algebra, Problem Solving and Data Analysis, Passport to Advanced Math, and Additional Topics in Math. The stated goal of this revised test is to improve predictions about students’ college and career success from the scores, than was possible with earlier versions of the SAT (The College Board, 2017). This goal of test makers makes adequate predictive validity evidence a requisite for such tests, using a suitable criterion measure of students’ future performance in college and the workplace (AERA, APA, & NCME, 2014).
Table 6Do’s and Don’ts: Using Data from College Entrance Tests to Fulfil ESSA’s Assessment Purposes
Do’s
Do perform appropriate content-based validity and correlational validity checks to support inferences/uses, if applied (a) as high school exiting tests, (b) for evaluating domain-referenced mastery levels in students, or (c) for evaluating school- or system-wide performance by grade level
Do examine the predictive validity evidence, along with predictive and other selection biases for particular sub-groups, to make better inferences and uses about future college and career readiness, or placement/recruitment decisions.
If grouped test scores are to be used in school or personnel evaluation/accountability contexts, do examine the validity evidence that test-makers provide. If unavailable, commission or conduct added studies to establish necessary levels of validity and reliability before use.
Do ensure high school students have had exposure to necessary coursework in the general domains tested (e.g., algebra classes), before they take the tests.
Do give students practice tests to orient them to the test’s item formats and computer interfaces, thereby reducing potential random errors unrelated to the test’s content.
Do review all validity, reliability, scale development, utility and other information on scores, including test’s limitations
Do keep data-based inferences and decision-making within boundaries of a test’s purposes and limitations, as provided by developers.
Don’ts
Don’t make high stakes or summative decisions unless there is strong evidentiary support for the specific interpretation for a given accountability-related use.
Don’t infer from, or make use of test results in ways that test makers caution against, or do not provide sufficiently strong evidentiary support.
5.3.3 Cautions and Evidence Needs: Using College Entrance Examinations for ESSA-related Purposes. This section offers cautionary pointers for using college entrance assessments as high school exiting exams, as college readiness tests, as career readiness tests, and as outcome measures in education system evaluations or for accountability. See Table 6.
1. Using a college entrance examination as a high school exiting test: While achievement tests, such as, the tests designed by SBAC and PARCC, are meant to tap into curriculum-based domains in different subject areas by grade level, college entrance tests are
2.21.19A Consumer’s Guide to Testing under ESSA
Madhabi Chatterji 48
not. If the inferences that users make from the results are about students’ proficiency levels referring back to specific content standards taught through the high school curriculum, then, college entrance test scores will not be the most valid indicators. However, the tests will likely provide information on student abilities in the general domains that test-makers delineate.
Users should carefully review an adopted test’s content specifications to evaluate content-based validity as exiting exams before using the tests to make inferences on students’ knowledge and skill mastery in particular subject areas. Correlational evidence of validity—such as, correlating achievement test results with college entrance test scores--will also show how much overlap exists to warrant their use as high school exiting examinations (Table 3).
2. Using a College Entrance Examination to Assess College Readiness: This is the prioritized purpose for which these tests are expressly designed. Assuming that the test developers provide systematically gathered evidence to support inferences about college readiness, especially, evidence of adequate levels of predictive validity, reliability, and lack of predictive/selection biases for any sub-groups, this would be an appropriate use.
3. Using College Entrance Examinations to Evaluate Career Readiness: College and career readiness are not the same thing! Although most college entrance examinations gather predictive validity evidence using student performance measures taken in college as the criterion, predictive evidence to support inferences and uses on career readiness indicators is relatively limited or absent on most such published tests at the moment. Given the many pathways open to high school students, the difficulty is in finding a single measure of career success. With the new SAT®, the College Board mentions its plans to use student performance measures from workforce training programs as the criterion. But, such evidence is still absent as of this writing.
4. Using College Entrance Examinations for School Evaluation and Accountability Purposes: This is the assessment purpose for which the evidence on college entrance tests is most limited or totally absent. For the old SAT ®, the College Board discouraged such applications on their web site. Regardless, using such data for school evaluations is popular among many data analysts, researchers and school systems. But, the tests are typically not designed for these purposes; hence, the burden falls on users to gather the necessary validity evidence to justify the data-based inferences and uses they choose (AERA, APA & NCME, 2014).
Minimally, one should have appropriate forms correlational evidence of validity in hand using test score aggregates and literature-supported criterion measures of overall educational quality
2.21.19A Consumer’s Guide to Testing under ESSA
Madhabi Chatterji 49
at upper levels of education systems, to understand better what such data mean. If long-term outcomes are to be measured, the predictive validity of the aggregated data must also be evaluated. Such evidence will allow for better decision-making with the data for accountability purposes. Given their limitations, any “growth” based scales should be evaluated very cautiously for high stakes, accountability purposes, preferably with technical guidance.
5.4 Evaluating the Quality of Non-Academic Measures in ESSA Contexts
States are required to select non-academic measures as a part of their accountability plan under ESSA. To be sure about what these non-academic measures mean with respect to the domains tapped, and the inferences and decisions that users desire at different levels and for units of analysis, states must secure the requisite evidence to assure the quality of measures.
See Tables 1-2 with reference to Table 3 again. How sound is “chronic absenteeism” as a data-based indicator of overall school climate? To what extent do data from parent satisfaction surveys yield evidence of educational quality? Can we measure growth of educational systems in valid and reliable ways with “non-academic” indicators in aggregate form? Non-academic measures must be validated in the same manner, and against the same standards, as academic measures. This is especially true when results are used in high stakes decisions or accountability contexts. Again each specific inference and use must be appropriately validated (AERA, APA & NCME, 2014).
For instance, surveys are one instrument type that some states have selected to tap into perceptions of school-based respondents on school climate, an indicator of conditions of learning required under ESSA. Survey responses provide the original data at the respondent level--students, parents, teachers or leaders – from which inferences can be drawn about the intended characteristic of schools. The data may then be aggregated up from the respondent levels up to schools and school systems to make inferences about the unit’s performance on the measures (see Table 2). As with academic measures, evidence of validity, reliability and utility must be gathered for each unit of analysis from which inferences are drawn, or decisions will be made (For an example of a validation study of survey-based non-cognitive measures for use in school systems, see Chatterji & Lin, 2018).
This call for evidentiary support to justify the quality of non-academic measures should not discourage state and school district systems to abandon these indicators altogether! On the contrary, once the evidence is obtained, it would strengthen the school and system-wide evaluation models immensely for accountability purposes, and other systems could adopt the tools, thereby making the research investment worthwhile.
5.5 Cautions about Using Test Scores in Statistically-Transformed Indices

2.21.19A Consumer’s Guide to Testing under ESSA
Madhabi Chatterji 50
Last but not least, we return again to statistical aggregates, composites and manipulated data from test scores and non-academic measures. Four forms of such data are mentioned in ESSA-approved plans. These are discussed briefly next. However, users and state level stakeholders are advised to seek added technical consultation to verify that the methods by which specific indices are derived locally are sound, and that each type of measure is transparent and defensible in each application.
Aggregated Score Counts by Performance Level: States are proposing to aggregate test scores in various ways. Aggregates could be reported as counts and percentages of students falling in different performance categories on a test score scale based on cut scores. Such reports are often prepared by grade level, by school, by school district, or by state education system. The presentation formats are similar to those of the National Assessment of Educational Progress (NAEP; see The Nation’s Report Card at https://nces.ed.gov/nationsreportcard).
These descriptive data summaries are easy to interpret and use without distorting or altering the meaning of original scores and data. Assuming the achievement test is supported with adequate validity and reliability evidence for the specified purposes, these forms of data aggregations are recommended. But inferences should pertain to the general domains tested, and for describing student performance at a given time point.
Average Score Means in Schools or at Upper Levels of System: At other times, states wish to obtain “grouped scores” as arithmetic averages of test scores by grade level, by school, school district, or state education system. As shown in Table 3, grouped scores need to be supported separately with validity and reliability evidence for the intended inferences/uses at the unit and level of aggregation. With some evidentiary support, annual means may be interpreted descriptively as average performance of a group in a subject area domain at that point in time. When long-term “growth” is measured using “grouped” scale scores, however, the technical limitations of the vertically equated scales must be borne in mind, and might preclude data uses for accountability-related decisions.
Growth Curve Models: ESSA’s requirements have caused many states to respond with a commitment to showing growth on students’ test scores, so that direct inferences can be made about whether schools and teachers are doing a good job. Growth curve models, also called value-added models (VAMs) are sophisticated statistical approaches that have been developed to achieve this end. Many education systems have created data systems linking student test scores to individual teachers or schools to allow for VAM analyses. However, experts caution that such methods are statistically “messy” (Haertel, 2013, p. 3-4).
VAMs depend too much on the linked scale scores that standardized test-makers provide, which have their own built-in limitations discussed earlier. VAMs are not recommended by the American Educational Research Association (AERA) in a 2015 statement titled “AERA
2.21.19A Consumer’s Guide to Testing under ESSA
Madhabi Chatterji 51
statement on use of value-added models (VAM) for the evaluation of educators and educator preparation programs”. The American Statistical Association (ASA) similarly cautions VAM applications in a statement titled, “ASA statement on using value-added models for educational assessment”. In sum, it is extremely unwise to rely heavily on VAMs that incorporate test score metrics to make high stakes inferences and uses for educational accountability. For added viewpoints on VAMs, and the influence of student background factors on assessments, readers are referred to: Briggs & Peck, 2015; Chudgar & Luschei, 2009; Raudenbush & Marshall, 2012 at http://www.carnegieknowledgenetwork.org/briefs/value-added/interpreting-value-added).
More importantly, recall the Section 1.0 discussion on “black box” effects. Accumulated evidence from school-based research with VAMs shows that when schooling outcomes are measured even on well-designed standardized student tests today, about 20% of the variance in test scores is attributable to what schools and teachers do, with about 9-13% attributable to teachers. Over 60% of the test score variance is accounted for by “out of school factors” (Haertel, 2013, p. 5). What explains the rest? Student background factors, such as, poverty and prior achievement levels in school, are among student-level factors that consistently explain a good portion of the remaining test score variability. Albeit small, the proportion of variance in student test scores explained by schools and teachers is, in fact, systematic and replicated over multiple studies.
What are the implications of this research for using student test data in accountability plans? When designing models of educational quality and accountability, the importance given or weight allocated to student test data as an indicator of quality should be proportionate to this established research finding. We know that test scores are definitely influenced by what schools and teachers do, but the amount of influence is small compared to other factors. Under ESSA, therefore, national, state and school district stakeholders could consider multiple outcome indicators, and allocating relatively less weight to student test score aggregates.
Student Growth Percentiles: Student growth percentiles, related to VAMs, are another route that some states are taking to track growth of schools and school systems. Sireci, Wells, and Keller (2016) recommend that these statistics are problematic and should be “abandoned”. Among their reasons are that they are not reliable, they are not valid for making domain-referenced interpretations of student learning (as they are a type of percentile rank), and that they violate recommendations of the 2014 Standards, as well as, AERA’s and ASA’s guidelines for VAMs. As perspectives differ (see Betebenner, 2009; Sireci et al, 2016), readers are encouraged to examine other research on the merits and limitations of student growth percentiles in accountability contexts before adopting the methods.

2.21.19A Consumer’s Guide to Testing under ESSA
Madhabi Chatterji 52
Multi-indicator Composite Scores: Another method that states have proposed in their accountability plans involves combining data from different data sources statistically, also discussed in the opening section. Sometimes different weights are attached to each indicator to create a ratings system or to assign ranks or grades to schools and school districts. Similar “school grades” have been used before.
With any multi-indicator index, questions arise with regard to the defensibility of weights assigned to different indicators, the statistical methods applied to derive composite indices, and the validity and reliability of individual indicators and composite scores for the intended inferences and uses. Because weights incorporated in such indices are subjective, they must be defended using both local stakeholder values and appropriate literature on measures of educational quality. Therefore, this author recommends that all multi-indicator indices be subjected to validation studies in the same manner as are the original test scores (Table 3), especially before taking high stakes actions.
Transparency and perceived fairness for stakeholders are also a must to prevent public distrust. Imagine if students were in the dark about how their teachers graded them on consequential final examinations in their classes! School or school system grades or ratings are no different in accountability settings.
6.0 Concluding Thoughts
Educational tests are useful, but limited instruments. This guide was premised on the firm belief that the enduring testing issues we encounter in educational accountability contexts can be prevented. It concludes with the same aspiration.
There are, no doubt, political forces at play that influence actions of education policy makers, test developers and primary test users in accountability settings. A discussion of political issues was outside the scope of this guide. Some caveats, however, follow with a recap of the main findings and recommendations.
6.1 Caveats
First, political forces in reform policy contexts must be acknowledged. There are varied political views about the federal role. Under the latest ESSA requirements, different states have responded according to their local politics and own value-based perspectives on this.
Second, federal and state regulatory incentives tend to overextend data uses. Patterns of test-based data uses in educational accountability contexts are influenced by these incentives.

2.21.19A Consumer’s Guide to Testing under ESSA
Madhabi Chatterji 53
There is also a political demand for high-stakes uses of test data that is likely to continue. Even the latest Phi Delta Kappa poll indicates that, regardless of the recent backlash, the public still seeks standardized test scores--not only for students but also for obtaining a better gauge of their local schools (The 49th PDK Poll, 2017, see supplement to the magazine article). Combined, these factors create conditions for some of the recurring testing issues that this guide identifies.
6.2 Main Findings
A combined analysis of ESSA requirements, approved state plans, and “next generation” test development trends, led to the following three findings.
Black box effect due to complex test designs: Test developers and assessment consortia rely on complex psychometric models and long-standing test design techniques that obscure the purposes that the tools best serve, and their technical limitations for meeting several educational accountability-related information needs prioritized under ESSA.
Exacerbation of black box effect due to inappropriate data uses and non-transparent composite indices: Multiple uses of a single test, unclear data aggregation methods at different levels of system, use of growth models and composite indices raised “red flags”. Many of the composite indices proposed to rate and rank schools/education systems presently hide critical information. How different kinds of data are selected and compiled, weights allocated, statistical procedures applied, and their correct interpretations and limitations, are unclear to key stakeholders in school systems.
Heavily test-dependent accountability plans without adequate supporting evidence: Under ESSA’s state plans, the primary indicators of educational quality involve test data from achievement and college entrance examinations of students. But, much of the necessary validity evidence for the proposed uses is still absent.
6.3 Recommendations 6.3.1 Recommendations for Educational Policy-makers and Leaders: To pre-empt inappropriate or unjustified inferences and uses with test-based information in all its forms (raw scores, derived scores, aggregates, etc.), test users should (a) specify all intended test-based inferences and uses up front; (b) avoid multi-purposing a test in ways that exceed a test’s declared purposes or reported evidence; (c) justify all planned inferences and uses of test-based data using appropriate criteria for validity, reliability and utility (see inside for definitions); and (d) seek out expert technical reviews of tests and non-academic measures before adopting these tools for accountability purposes.
Second, standardized test data should serve as one of many indicators for describing overall quality of education systems. The importance given to test-based data in school and school system evaluation
2.21.19A Consumer’s Guide to Testing under ESSA
Madhabi Chatterji 54
contexts should be proportional to established research findings on what standardized achievement tests can realistically provide. Growth-based indices should be avoided in high stakes, accountability contexts, as most standardized tests are not designed to support such longitudinal inferences on individual-level or system-wide growth.
Finally, to comply with the “multiple measures” approach endorsed by ESSA (a good thing, in this author’s view), the use of descriptive quality profiles is recommended, rather than the use of composite indices. Descriptive quality profiles for given schools and school systems would report aggregated results on a series of locally-valued indicators, but separately. This approach will likely be more meaningful and user-accessible. Suitable graphs would also allow monitoring of schools and school systems across years on multi-indicator profiles.
6.3.2 Recommendations for Test Developers and Assessment Specialists: New accountability requirements open up opportunities for test developers to design innovative assessments and testing programs. But the new demands and tight timelines also lead test makers to release assessment products to users before these are ready, or to make compromises in design and validation procedures. A ready test is one with the essential validity evidence in hand for particular uses of test scores that the primary test users prioritize.
Second, when there are known limitations to certain techniques for certain purposes, test developers must take the responsibility for communicating those clearly, openly, and in user-accessible terms to all users. Most test makers already take this responsibility seriously, but there is room for improvement in this area. The “tried and true” methods are the best, to be sure. But, Shavelson (2017) asked the measurement community to replace a “Can do” mind set with a “Should we do?” approach in educational practice and policy contexts. IRT-based scale scores have well-known limitations for accountability purposes that are still widely misunderstood by primary test users. This omission must be corrected without “over-selling” the tests.
6.3.3 Recommendations for Education Reformers and Test Users at Large: Both test users and test developers must remain alert to, and monitor outcomes of, the proposed test uses under ESSA’s reforms. Studies of consequences would help identify any untoward or adverse outcomes of testing for individuals or groups in high stakes evaluative contexts.
Finally, standardized tests should not, and cannot be, the main policy driver for education reforms. Assessment and accountability systems should be implemented after instruction with new standards begins and is sustained over a reasonable period. For the desired outcomes to be realized, the curriculum (content standards), instruction, assessment and accountability requirements must all be aligned. Implementation must permeate evenly across all levels of the education system. Theories of Action (ToAs) must take into account all relevant systems-based elements, and allocate time to allow
2.21.19A Consumer’s Guide to Testing under ESSA
Madhabi Chatterji 55
school practitioners and leaders to implement the new reforms, or transition from one set of reforms to another. To these ends, communication and cross-learning among all groups of education stakeholders must continue.

2.21.19A Consumer’s Guide to Testing under ESSA
Madhabi Chatterji 56
References
AERA, APA, & NCME (2014). Standards for educational and psychological testing. Washington, D.C.: American Educational Research Association.
American Educational Research Association (2015). AERA statement on use of value-added models (VAM) for the evaluation of educators and educator preparation programs. Educational Researcher. Retrieved from http://www.aera.net/Newsroom/NewsReleasesandStatements/AERAIssuesStatementontheUseofValue-AddedModelsinEvaluationofEducatorsandEducatorPreparationPrograms/tabid/16120/Default.aspx
American Educational Research Association (AERA), American Psychological Association (APA), & National Council on Measurement in Education (NCME) (1999). Standards for educational and psychological testing. Washington, D.C.: American Educational Research Association.
American Statistical Association (2014). ASA statement on using value-added models for educational assessment. Retrieved from http://www.amstat.org/policy/pdfs/asa_vam_statement.pdf
Bae, S. (2018). Redesigning systems of school accountability: A multiple measures approach to accountability and support. Education Policy Analysis Archives, 26(7), 1-32.
Baker, E. L. (2014). Can we trust assessment results? Education Week.Retrieved from http://blogs.edweek.org/edweek/assessing_the_assessments
Bandalos, D.L. (2018). Measurement theory and applications for the social sciences. New York, NY: Guilford.
Berliner, D. C. (2014). Morality, validity and the design of instructionally useful tests. Education Week. Retrieved from http://blogs.edweek.org/edweek/assessing_the_assessments
Betebenner, D.W. (2009). Norm- and criterion-referenced student growth. Educational Measurement: Issues and Practice, 28 (4), 42-51.
Briggs, D. C., & Peck, F. A. (2015). Using learning progressions to design vertical scales that support coherent inferences about student growth. Measurement: Interdisciplinary Research and Perspectives, 13(2), 75-99.
Bushaw, W. J., & Calderon, V. J. (2014). Americans put teacher quality on center stage: The 46th annual PDK/Gallup poll of the public's attitudes toward the public schools: Part II. Phi Delta Kappan, 96(2), 49-59.
Center for American Progress & the Council of Chief State School Officers (2014). Next-generation accountability systems: An overview of current state policies and practices. Retrieved from
2.21.19A Consumer’s Guide to Testing under ESSA
Madhabi Chatterji 57
https://www.americanprogress.org/issues/education-k-12/reports/2014/10/16/99107/next-generation-accountability-systems/
Chatterji, M. (2003). Designing and Using Tools for Educational Assessment. Boston, MA: Allyn & Bacon/Pearson.
Chatterji, M. (2014). Validity Counts: Let’s mend, not end, educational testing. Education Week, 24, March 11, 2014. Retrieved from http://www.tc.columbia.edu/aeri/conferences-and-forums/education-week-blog-2014/0311Chatterji.pdf
Chatterji, M. (2013a). Bad tests or bad test use? A case of SAT® use to examine why we need stakeholder conversations on validity. Teachers College Record, 115 (9), 1-7.
Chatterji, M. (Ed.) (2013b). Validity and test use: An international dialogue on educational assessment, accountability, and equity. Bingley, UK: Emerald Group Publishing Limited.
Chatterji, M., & Lin, M. (2018). Designing non-cognitive construct measures that improve mathematics achievement in grade 5-6 learners. A user-centered approach. Quality Assurance in Education, 26(1), 70-100.
Chatterji, M., Valente, E., & Lin, M. (2018). Validity issues in large scale testing contexts: An analysis of stakeholder perspectives. Paper presented at the annual meeting of the National Council on Measurement in Education (NCME) on April 16, 2018 in New York City, NY.
Chudgar, A., & Luschei, T. F. (2009). National income, income inequality, and the importance of schools: A hierarchical cross-national comparison. American Educational Research Journal, 46(3), 626–658.
Conley, D. T. (2015). A new era for educational assessment. Education Policy Analysis Archives, 23(8). http://dx.doi.org/10.14507/epaa.v23.1983. This article is part of EPAA/AAPE's Special Series on A New Paradigm for Educational Accountability: Accountability for Meaningful Learning. Guest Series edited by Dr. Linda Darling-Hammond.
Cronbach, L. J. (1971). Test validation. In R. L. Thorndike (Ed.), Educational measurement (2nd ed., pp. 443-507). Washington, DC: American Council on Education.
Darling-Hammond, L. (2017). Developing and measuring higher order skills: Models for state performance assessment systems. Retrieved from https://www.learningpolicyinstitute.org/sites/default/files/product files/Models_State_Perfonnance_Assessment_Systems_REPORT.pdf

2.21.19A Consumer’s Guide to Testing under ESSA
Madhabi Chatterji 58
Darling-Hammond, L., Wilhoit, G., & Pittenger, L. (2014). Accountability for college and career readiness: Developing a new paradigm. Stanford, CA: Stanford Center for Opportunity Policy in Education.
Department of Education (2017a). Every Student Succeeds Act. Retrieved from https://ed.gov/policy/elsec/leg/essa/index.html
Department of Education (2017b). Every Student Succeeds Act – Accountability, state plans and data reporting: Summary of final regulations. Retrieved from https://www2.ed.gov/policy/elsec/leg/essa/essafactsheet170103.pdf
Donaldson, S. I. (2007). Program theory-driven evaluation science. New York, NY: Lawrence Erlbaum.
Duckor, B. (2017). Got grit? Maybe... Phi Delta Kappan, 98(7), 61–66.
Gewertz, C. (2017b, February 15). What tests does each state require? Retrieved from https://www.edweek.org/ew/section/multimedia/what-tests-does-each-state-require.html
Gewertz, C. (2017a, February 15). National testing landscape continues to shift. Retrieved from https://www.edweek.org/ew/articles/2017/02/15/state-solidarity-still-eroding-on-common-core-tests.html
Gewertz, C. (2017c, February 15). Which states are using PARCC or Smarter Balanced? An interactive breakdown of states’ 2016-17 testing plans. Retrieved from https://www.edweek.org/ew/section/multimedia/states-using-parcc-or-smarter-balanced.html
Gronlund, N.E. (1981). Measurement and evaluation in teaching. New York: Macmillan.
Haertel, E. H. (2013). Reliability and validity of inferences about teachers based on student test scores. Princeton, NJ: Educational Testing Service.
Harvey, J. (2014). Catnip for politicians: International assessments. In Assessing the Assessments: K-12 Measurement and Accountability in the 21st Century at Education Week’s blog site on April 11, 2014: http://blogs.edweek.org/edweek/assessing_the_assessments Also at: https://www.tc.columbia.edu/aeri/conferences-and-forums/education-week-blog-2014/
Kane, M. T. (2006). Validation. In R. L. Brennan (Ed.), Educational Measurement (4th Edition., pp. 17-64). Washington, DC: American Council on Education.
Klein, A. & Ujifusa, A. (2018, June 28). Approved ESSA plans: Explainer and key takeaways from each state. Education Week. Retrieved from https://www.edweek.org/ew/section/multimedia/key-takeaways-state-essa-plans.html

2.21.19A Consumer’s Guide to Testing under ESSA
Madhabi Chatterji 59
LeMahieu, P.G. & Bryk A.S. (2017). Working to improve: Seven approaches to quality improvement in education. Quality Assurance in Education, 25(1), 2-4.
Mazzeo, J., Lazer, S., & Zieky, M. J. (2006). Monitoring educational progress with group-score assessments. In R. L. Brennan (Ed.), Educational measurement (4th ed., pp. 17-64). Westport, CT: Praeger Publishers.
McRae, D.J. & Evers, W.M. (2018, January 4). Is the Smarter Balanced national test broken?. Real Clear Education. Retrieved from https://www.realcleareducation.com/articles/2018/01/04/is_the_smarter
Messick, S. (1989). Validity. In R. L. Linn (Ed.), Educational measurement (3rd ed., pp. 13-103). New York, NY: Macmillan Publishing Co, Inc.
New Hampshire Department of Education (2018). Consolidated state plan. The Elementary and Secondary Education Act of 1965, as amended by the Every Student Succeeds Act (Final Submission ~ January 19, 2018). New Hampshire: Author.
Noonan, R. (2014). On assessment: Less is more. Education Week. Retrieved from http://blogs.edweek.org/edweek/assessing_the_assessments/2014/04/mt-preview-47b7844a9180cfc7bdcfa5660d32f8eaa866a588.html?print=1
Pearson (2017). Partnership for Assessment of Readiness for College and Careers: Final technical report for 2016 administration. Retrieved from https://parcc-assessment.org/wp-content/uploads/2018/02/PARCC-2016-Tech-Report.pdf
Pellegrino, J.W. (2014). Learning from reform mistakes of the past. Education Week. Retrieved from http://blogs.edweek.org/edweek/assessing_the_assessments. Also at: https://www.tc.columbia.edu/aeri/conferences-and-forums/education-week-blog-2014/
Popham, W. J. (2014). Correcting a harmful misuse of students’ test scores. Education Week. Retrieved from http://blogs.edweek.org/edweek/assessing_the_assessments. Also at: https://www.tc.columbia.edu/aeri/conferences-and-forums/education-week-blog-2014/
Price, L.R. (2018). Psychometric methods: Theory into practice. New York, NY: Guilford.
Raudenbush, S. & Jean, M. (2012). How should educators interpret value-added scores? Carnegie Knowledge Network. Retrieved from http://www.carnegieknowledgenetwork.org/briefs/value-added/interpreting-value-added )
Rogers, P. , A. Petrosino , T. Hacsi and T. Huebner (2000). Program Theory Evaluation: Practice, Promise and Problems. In P. Rogers , A. Petrosino, T. Hacsi and T. Huebner (Eds.) Program Theory Evaluation: Challenges and Opportunities (pp. 5—13). New Directions in Evaluation series. San Francisco, CA: Jossey-Bass.
2.21.19A Consumer’s Guide to Testing under ESSA
Madhabi Chatterji 60
Shavelson, R. J. (2017). On assumptions and applications of measurement models: Is the tail wagging the dog? The Robert L. Linn Distinguished Address presented at the annual meeting of the American Educational Research Association at San Antonio, TX on April 28, 2017.
Schatz, C. J., VonSecker, C. E., & Alban, T. R. (2005). Balancing accountability and improvement: Introducing value-added models to a large school system. In R. W. Lissitz (Ed.), Value added models in education: Theory and applications (pp. 1–18). Maple Grove, MN: JAM Press.
Shaw, E. J., & McKenzie, E. (2010). The national SAT® validity study: Sharing results from recent college success research. Presented at the Annual Conference of the Southern Association for College Admission Counseling.
Shepard, L. A. (2013). Validity for what purpose? Teachers College Record, 115(9).
Singer, A. (2016, April 7) Thousands refuse Common Core testing, calls for national opt-out and Washington march. The Huffington Post. Retrieved from http://www.huffingtonpost.com/alan-singer/thousands-refuse-common-c_b_9631956.html
Sireci, S.G., Wells, C.S., & Keller, L.A. (2016). Why we should abandon student growth percentiles. Research Brief 16-1. Amherst, MA: Center for Educational Assessment, University of Massachusetts.
Stosich, E. L., Snyder, J., & Wilczak, K. (2018). How do states integrate performance assessment in their systems of assessment? Education Policy Analysis Archives, 26(7-16), 1-31.
The College Board (2017). SAT® suite of assessments technical manual: Characteristics of the SAT®. Retrieved from https://collegereadiness.collegeboard.org/pdf/sat-suite-assessments-technical-manual.pdf
The National Center for Research on Evaluation, Standards, and Student Testing (2017). Smarter Balanced Assessment Consortium: 2015-2016 Summative technical report. Los Angeles, CA: CRESST
The National Center for Research on Evaluation, Standards, and Student Testing (2017-18). Smarter Balanced Assessment Consortium: Formative technical report. Los Angeles, CA: CRESST
The 49th Annual PDK Poll of the Public’s Attitudes Toward the Public Schools: Academic achievement isn’t the only mission. (2017). Supplement to article in Phi Delta Kappan, 99(1), NP1–NP32. Retrieved from https://journals.sagepub.com/doi/pdf/10.1177/0031721717728274
Tyack, D. B. (1974). The one best system: A history of American urban education. Harvard University Press.

61
Appendices
Appendix A-Glossary
Appendix B-A Quick Guide for Teachers
Appendix C-Questions that Test Adopters and Users Could Ask under ESSA

62
Appendix A
Glossary of Terms Assessment Purposes: The inferences and uses that test users propose to make with information obtained from tests.
Bookmarking method: A method for setting cut scores for making criterion-referenced score interpretations, typically involving judgments of teachers and experts.
Composite index (of educational quality): A statistically combined score for school organizations that could use data from several different sources, like student test scores, student attendance, and surveys. Each data source is an indicator of quality, and may be given a numeric weight to denote its relative importance in the composite score. Also called a weighted composite index.
Construct: The underlying ability, attitude or attribute that a test or scale is meant to measure
Content specifications, test design specifications: The blueprint or plan that guided how the test was designed, showing all the topics, sub-topics and skills tested and the number of questions allocated to each. Some sample questions may also be provided.
Criterion-referenced score interpretations: Interpreting test scores with reference to the domain of knowledge and skills tested, and by comparing scores against a pre-set criterion for mastery, called the performance level or standard.
Cut scores: Applies to Criterion-referenced score interpretations, where score points are selected on a test score scale to separate different performance levels.
Descriptive Quality Profiles (of schools or school systems): A method for reporting descriptive statistics (like averages and percentages) on an array of locally valued indicators of quality for schools and school systems
Differential Item Functioning (DIF): When a test’s items perform differently in different ethnic, gender or other groups of similar ability. DIF studies are done to rule out measurement bias (see Table 3)
Domain: The defined body of knowledge, behaviors or skills that a test or scale purports to measure.
Equated test score metrics: See “Linked” test score metrics.
Evidence of Validity: Different types of evidence collected to justify particular interpretations and uses of test scores. See Section 4.0 and Table 3 in guide for types of validity evidence and definitions from the Standards.
Formative decisions or uses (of test data): When test-based data are used to plan, improve, or modify educational programs or classroom instruction.
Grouped scores or group-scores: Averaged or aggregated test scores for groups of students in classrooms, schools, or upper levels of education systems.
High stakes decisions or uses (of test data): When test-based data are used to make evaluative decisions that have irreversible, adverse, and/or lasting consequences for examinees, individuals or entities.
“Linked” test score metrics: Methods for joining tests to create a single common scale with the same units that allow comparisons. Linking can be done with tests from different grades (vertical linking), or with different forms of the same test in a grade (horizontal linking). Also called test equating.
Logic models: See Theory of Action (ToA)
Low stakes decisions or uses (of test data): When test-based data are used to make evaluative decisions that have little or no lasting consequences on individuals or entities.
63
Multi-dimensional (scales or tests): Tests or scales that measure several distinct domains or sub-domains of one or more constructs.
Norm group, norms: A defined comparison group that allows meaningful norm-referenced score interpretations
Norm-referenced score interpretations: Interpreting test scores by comparing them to the performance of a defined comparison group, called the norm group.
Pass/Fail categories: A cut score that separates two levels of performance for criterion-referenced score interpretations.
Percentile Rank (PR): A type of norm-referenced score that describes where a person’s score is ranked or placed compared to those of peers in a defined group.
Performance level: See Criterion-referenced score interpretations
Population units: Individuals or entities in a defined group for whom the data-based inferences and uses apply.
Prediction-Selection Biases: When different groups or sub-groups, such as, males and females, have different predictive validity coefficients showing that the test scores predict future performances differently for each. See Table 3 for more on evidence of predictive validity.
Reliability (or Reliability Coefficient): Quantified estimates indicating the consistency and precision levels of test scores.
Scaled score (or scale score): A type of statistically converted test score that depicts all scores on a single, straight line, usually measuring a single construct or domain.
Self-selection bias: Biased inferences that could occur when the composition of a tested group is unbalanced due to some participants deciding to either take a test or opt out.
Stakeholders: Individuals with a vested interest in education programs and school organizations, such as, policy-makers, leaders, teachers, students and parent.
Standardization sample: See Norms and Norm Group
Student Growth Percentile (SGP): A type of mathematically predicted score for students estimated from score patterns of previous years. SGPs are ranks but are not like percentile ranks based on direct comparisons of a student’s score with a peer group’s scores (see Sireci et al, 2016).
Summative decisions or uses (of test data): When test-based data are used to make final judgments of the merit or worthiness of students, programs, staff, or other participants.
Test-based Data, Test Data: Test scores as original “raw scores”, transformed scores like percentile ranks, or aggregated scores for schools, classrooms or school systems as means, percentages or other statistics.
Test Users: Stakeholders at different levels of education systems who rely on test data for making decisions.
Test Uses: Decisions made or actions taken with test-based information in either applied or research settings.
Theory of Action (ToA): The set of implicit and explicit assumptions on which a program, policy or a set of reforms is based. ToAs are mapped using path diagrams called logic models showing how the desired outcomes will be achieved.
Unidimensional (scales or tests): Tests or scales that mostly measure a single construct/domain.
Validation: The processes of obtaining evidence of validity, reliability and utility of tests for the intended purposes, constructs and populations. Different types of validity evidence may be collected through formal studies, such as: evidence of content based validity; validity of internal structure; validity of consequences of test use; evidence of predictive validity; or correlational evidence of validity. See Section 4.0 and Table 3 in the guide for types of validity evidence and definitions from the Standards.
64
Validity: The meaningfulness of scores and test-based information for the assessment purposes, the constructs/domains tested, and the targeted populations.
Value Added Models: Statistical methods called “multi-level models” or “growth curve models” intended to measure change over time in individual students, classrooms or schools on the desired outcomes.

65
Appendix B
A Quick Guide for Teachers on Standardized Testing
1. Learning how to interpret and use test-based information accurately is the key to making sound classroom decisions on instructional goals and learning targets for your students.
2. Do read the teacher’s manual or web-based resources on the standardized testing programs that apply to your school or district.
3. Standardized achievement tests are made up of a sample of questions that should ideally match the long-term goals (content standards) and short-term objectives of a grade level curriculum.
4. Achievement test scores are most valid when students have had sufficient opportunities to learn the material tested. Do design your teaching plans for the year to match the test’s topic coverage and the test administration schedule—seek out this information from test’s manuals and other resources.
5. Do teach to the content standards and objectives of the curriculum, as drilling students on test items will not lead to lasting learning.
6. Giving students some exposure to various item formats may help in cutting down outside errors in test scores. 7. Standardized tests provide many kinds of test scores and score reports, but each is usually for a different purpose. 8. Criterion-referenced scores describe students’ proficiency levels in a defined body of knowledge and skills
against set performance standards. Do check out how the performance standards were set and whether they are reasonable for your class.
9. Criterion-referenced test reports should also provide details on what students did or did not master, and may be useful for teaching and learning purposes.
10. Norm-referenced scores describe where a student’s score is placed when compared with scores of grade level peers in a region or the nation (called the norm group). To better interpret your students’ scores, make sure the test’s norm group is appropriate for the class.
11. Percentile ranks are norm-referenced scores. A percentile rank of 80 means that the student performed better than 80% of the students in the norm group that took the same test.
12. Scores that purportedly show growth, like “scale scores”, are created by joining tests at different grade levels. Scale scores are vulnerable to interpretation errors and not useful for decisions that teachers commonly make.
13. Standardized test scores must be reliable (consistent). A good reliability coefficient for a test score is .90 or better. An estimate under .70 suggests weak reliability.
14. Do reach out to the testing and assessment department in your school district or state education system for more information on standardized tests that apply to your school.

66
Appendix C
Questions That Test Adopters and Front-Line Educators Could Ask under ESSA (in Consultation with Assessment Specialists)
1. Evidence of Content-based Validity: a. Were studies conducted to verify that the tests and test forms match the content standards, thinking
skills and expectations prioritized by educators and stakeholders at each grade level and each domain? b. Were studies conducted to verify to what degree the new tests match the coursework/classes students
typically take in school before they are tested at each grade level? c. Did the original test or content specifications alter after scales were created? If so, in what specific ways
did the final test forms change in the terms of content coverage at each grade? d. Could Computer Adaptive Testing (CAT) methodology affect the full scope of content standards and
skills covered by tests in a grade and subject area? If so, how? e. Given the evidence in hand, what score-based inferences can we make on the full range of knowledge
and skills by domains and grade?2. Test Content and Item Specifications:
a. What skills/content do the items measure at each grade level and subject area? b. What are the item formats and modes of testing? How are items in different modalities scored? How
many are there for each content standard and skill area? Please share samples of these items.c. Which tasks and items measure “deeper learning” levels or higher order thinking skills of examinees?
How many items are there at each grade level and subject area? Can we look at a sample of items?3. Evidence on the Meaning of Scores and Learning Progressions:
a. How do the test scores map how students will likely progress in their learning in given subject areas and grades?
b. What evidence is there to show that the “learning progressions” are similar for diverse student groups? 4. Validity of Internal Structure:
a. Are there studies that shed light on whether the data from tests are predominantly “unidimensional” or “multidimensional” in structure? Are there factor analytic studies?
b. How should the scale scores be interpreted, given those results?5. Predictive Validity Evidence:
a. What evidence shows that test scores will correlate with future measures of college success? b. What evidence shows that test scores will correlate with future measures of career success? c. Are there likely to be any prediction (and selection) biases towards any group, such as, for girls vs. boys
(i.e., different predictive validity coefficients)?6. Evidence of Correlational Validity:
a. What evidence shows that the test scores will correlate as expected with results of different tests/measures of similar domains?
b. What evidence shows that the sub-test scores inter-correlate in expected ways?7. Evidence of Consequences of Test Use:
a. When the new tests were introduced in educational systems, were the expected, positive outcomes realized in students, schools and education systems? How long did it take?
b. What unintended consequences did the assessments or testing system produce? Who was affected adversely, if any group or individual? Why?
c. How much time will schools and school systems need to align and implement the new curriculum, instruction, assessment and accountability procedures, following training and orientation?

67
d. Based on existing evidence, when should schools implement summative assessments for optimizing validity of inferences for high stakes decisions?
8. Evidence of Lack of Measurement Biases: a. Is there sound evidence that the content/language of the test, test scores and items are free of systematic
biases against any individuals or subgroups? 9. Evidence of the Quality of Norms and Norm-referenced Score Inferences:
a. For norm-referenced score interpretations, how well do test-takers in norm groups match the composition of students in local regions on key demographic variables?
10. Evidence of the Quality of Standards and Criterion-referenced Score Inferences: Ia. Is there evidence on the quality and accuracy of standard-setting procedures and cut-scores (standards)
for students? 11. Evidence of the Validity of Grouped Scores:
a. For making inferences and uses at upper levels of the education system, are there appropriate forms of evidence that support inferences from “group-scores” as units of analysis?
12. Evidence of the Validity of Scale Scores as “Growth” Indices: a. What do the growth metrics mean over time vis-à-vis the domain, both for individual students and for
groups? What are the limitations?13. Evidence of the Validity of Linked Scale Scores:
a. How were the tests vertically linked from grade to grade? b. How many common items were used to “anchor” and link the tests at adjacent grade levels [too few
items (<10) will result in greater linking errors]? c. In what regions of the test metric could there be errors due to “floor” or “ceiling” effects?d. How were different parallel test forms, modalities, linguistic versions of tests, horizontally equated (if
applicable)? Why was this done? What are the limitations of the equating procedures? e. What do the test scores mean after equating was completed?
14. Evidence of Score Reliability: a. Is there sufficient evidence of reliability (.70-.99) of all the types of test scores?b. Will the cut-scores allow for reliable categorizations?
15. Evidence of Test Utility: a. Are all assessment materials, supporting technology, reports and supplements, pilot-tested with users?b. Are assessments sufficiently user-friendly?
Note: This is not an exhaustive list, and questions should be modified based on the testing program that applies to given situations.


![Charter, Private, Public Schools and Academic Achievement ...nepc.colorado.edu/files/EPRU-0601-137-OWI[1].pdf · Charter, Private, Public Schools and Academic Achievement: New Evidence](https://static.fdocuments.in/doc/165x107/5a7cd5f07f8b9a66798d2254/charter-private-public-schools-and-academic-achievement-nepc-1pdfcharter.jpg)