Nepal-Statistical Report Vol1
168
NEPAL LIVING STANDARDS SURVEY 2010/11 STATISTICAL REPORT VOLUME ONE CENTRAL BUREAU OF STATISTICS National Planning Commission Secretariat Government of Nepal November 2011
-
Upload
rabi-lamichhane -
Category
Documents
-
view
68 -
download
10
Transcript of Nepal-Statistical Report Vol1

NEPAL LIVING STANDARDS SURVEY 2010/11
STATISTICAL REPORT VOLUME ONE
CENTRAL BUREAU OF STATISTICS National Planning Commission Secretariat
Government of Nepal
November 2011

2
i
NEPAL LIVING STANDARDS SURVEY 2010/11
STATISTICAL REPORT VOLUME ONE
CENTRAL BUREAU OF STATISTICS National Planning Commission Secretariat
Government of Nepal
November 2011

ii
Published by
Central Bureau of Statistics
Thapathali, Kathmandu
Nepal
Phone: 4229406, 4261506, 4245946-48
Fax: 977-1-4227720
E-mail: [email protected]
Web site: www.cbs.gov.np
First Edition: November 2011
1,500 copies
Printed in Nepal
iii

iv

v
PREFACE
It is my pleasure to present the main results of the third Nepal Living Standards Survey (NLSS III). NLSS III is a nation-wide household survey conducted year round through February 2010 to February 2011 which consists of multiple topics related to household welfare. The last Living Standards Survey (NLSS II) was conducted in 2003/04 which updated the poverty profile of the country prepared originally on the basis of the information provided by the first Living Standards Survey (NLSS I) conducted in 1995/96. The present survey has been conducted at a time when political and economic changes are taking place in the country. The survey results are presented in two statistical volumes covering twenty sections of the household questionnaire. The re-introduction of the anthropometric section in the household questionnaire in NLSS III and its successful implementation has provided us new opportunities of multidimensional analysis of the survey data. In fact, the successful completion of the survey has elevated the survey capacity of the CBS in designing, operation, data management and analysis as well. I, upon completion of the overall operation of NLSS III, would like to extend my sincere gratitude to all the respondents who generously spared their time and cooperated with us by supplying their intimate information to make the survey a success. May I express gratitude to the World Bank for providing financial and technical support generously for the survey also. I would also like to thank UNICEF Nepal for supplying anthropometric equipments and salt test-kit for the survey. I heartily thank Mr. Gaurav Datt, Senior Economist, who led the project in the first half period of the survey on behalf of the Bank. Likewise, I am grateful to Mr. Juan Munoz, Mr. Victor Canales and Ms. Beatriz Godoy who contributed significantly in various stages of the survey from design to data management and training. Mr. Dean Jolliffe, Senior Economist of the bank, Ms. Silvia Radaelli, Economist and Mr. Maheshwor Shrestha have provided invaluable contribution in analyzing the results and I am thankful also to them. I am also thankful to Mr. T.G. Srinivasan, Senior Economist of the Bank for his ongoing contribution to the project. Members of the Steering and Technical committee of the survey have provided invaluable inputs for the survey and I am equally thankful to them. Moreover, I appreciate Mr. Bikash Bista, Deputy Director General, for shouldering the overall responsibility of the survey. The whole of the survey operation was successfully conducted by the household survey section under the leadership of Mr. Dhundi Raj Lamichhane, Director of the section. Other team members who were involved in the survey at various times with different capacities were Mr. Shiv Nandan Prasad Shah, Mr. Anil Sharma, Mr. Keshab Kumar Gautam, Mr. Dinesh Bhattarai, Mr. Dol Narayan Shrestha, Mr. Shiv Lal Sharma, Mr. Sunil Kumar Shrestha, Mr. Jay Kumar Sharma, Mr. Bed Prasad Dhakal, Mr. Bikash Malla and Mr. Tulasi Prasad Paudel. I would like to heartily thank them all for working hard day and night in order to bring the survey to this end. Similarly, my appreciation goes to all the members of data collection teams and other personnel from CBS who contributed to the survey. I would like to express my sincere thanks to Mr. Tunga S. Bastola, National Consultant, who has put best of his efforts in various stages of the survey including the finalization of this report. Finally, I request all the users to fully utilize these resources to carry out the analysis of their choice and also request them to provide us invaluable suggestions if any.
November 2011 Kathmandu
Uttam Narayan Malla Director General
Central Bureau of Statistics

vi
vii
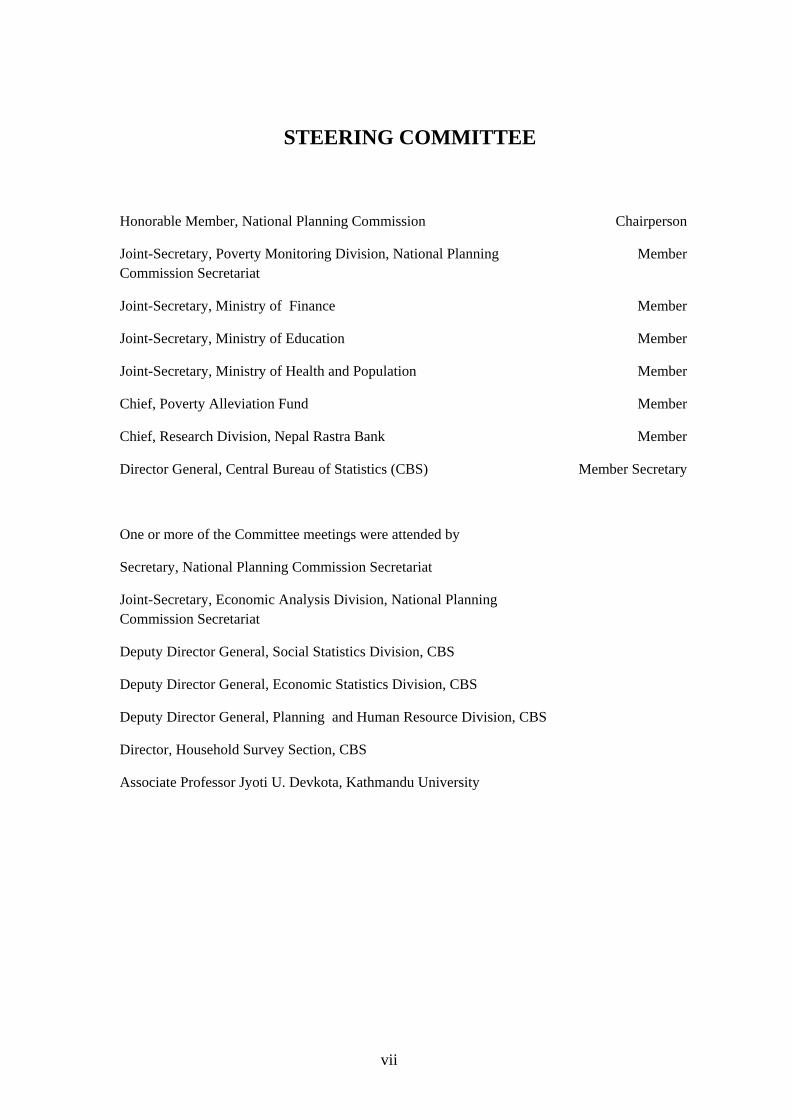
STEERING COMMITTEE
Honorable Member, National Planning Commission Chairperson
Joint-Secretary, Poverty Monitoring Division, National Planning Commission Secretariat
Member
Joint-Secretary, Ministry of Finance Member
Joint-Secretary, Ministry of Education Member
Joint-Secretary, Ministry of Health and Population Member
Chief, Poverty Alleviation Fund Member
Chief, Research Division, Nepal Rastra Bank Member
Director General, Central Bureau of Statistics (CBS) Member Secretary
One or more of the Committee meetings were attended by
Secretary, National Planning Commission Secretariat
Joint-Secretary, Economic Analysis Division, National Planning Commission Secretariat
Deputy Director General, Social Statistics Division, CBS
Deputy Director General, Economic Statistics Division, CBS
Deputy Director General, Planning and Human Resource Division, CBS
Director, Household Survey Section, CBS
Associate Professor Jyoti U. Devkota, Kathmandu University

viii
TECHNICAL COMMITTEE
Deputy Director General, Social Statistics Division, CBS Chairperson
Chief, Central Department of Statistics, Tribhuvan University Member
Chief, Central Department of Economics, Tribhuvan University Member
Chief, Central Department of Sociology, Tribhuvan University Member
Director, Research Division, Nepal Rastra Bank Member
Director, Social Statistics Section, CBS Member
Director, National Accounts Section, CBS Member
Director, Manufacturing Establishment Census and Survey Section, CBS Member
Director, Data Processing and GIS Section, CBS Member
Director, Agriculture Statistics Section, CBS Member
Director, Population Section, CBS Member
Director, Planning, Coordination and Standardization Section, CBS Member
Director, Household Survey Section, CBS Member Secretary
One or more of the Committee meetings were attended by
Director General, CBS
Deputy Director General, Economic Statistics Division, CBS
Deputy Director General, Planning and Human Resource Division, CBS
Director, Publication, Distribution and Library Section, CBS
National Consultant – Mr. Tunga S. Bastola

ix
CONTENTS
EXECUTIVE SUMMARY .......................................................................... 1
CHAPTER I: METHODOLOGY............................................................... 4
1.1 Introduction...........................................................................................................4
1.2 Objective of the Survey ........................................................................................4
1.3 Survey Scope ........................................................................................................4
1.4 Statistical Unit.......................................................................................................5
1.5 Coverage ...............................................................................................................5
1.6 Time Reference.....................................................................................................5
1.7 Survey Methodology.............................................................................................6
1.7.1 Sampling Frame ....................................................................................................7
1.7.2 Stratification..........................................................................................................7
1.7.3 Sample Design ......................................................................................................7
1.7.4 Cross-section Sample............................................................................................8
1.7.5 Panel Sample.........................................................................................................9
1.7.6 Sample Size...........................................................................................................9
1.7.7 Enumeration Status .............................................................................................10
1.8 Survey Questionnaires ........................................................................................10
1.9 Field work Organization .....................................................................................15
1.9.1 Field Teams.........................................................................................................15
1.9.2 Selection of Field Staff and Training..................................................................16
1.9.3 Data Collection and Supervision ........................................................................16
1.9.4 Data Entry and Management ..............................................................................17
1.10 Analytic Domains ...............................................................................................18
1.11 Contents in the Reports.......................................................................................18
1.12 Conclusion ..........................................................................................................19
CHAPTER II: DEMOGRAPHY............................................................... 20
2.1 Introduction.........................................................................................................20
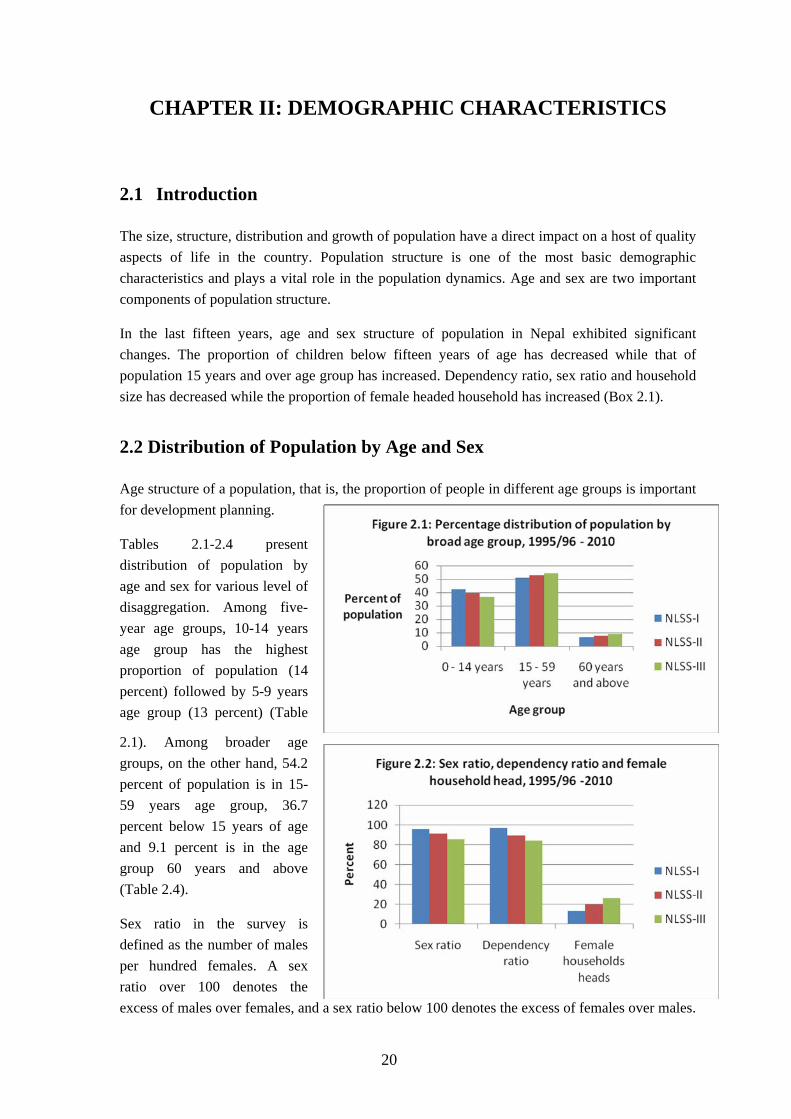
2.2 Distribution of Population by Age and Sex ........................................................20

x
2.3 Dependency Ratio...............................................................................................21
2.4 Household Size and Distribution by Size ...........................................................21
2.5 Sex and Age of the Household Head ..................................................................22
CHAPTER III: HOUSING........................................................................ 30
3.1 Introduction.........................................................................................................30
3.2 Occupancy Status................................................................................................30
3.3 Construction Material of Outer Walls.................................................................31
3.4 Materials for Roofing..........................................................................................31
3.5 Materials for Foundation.....................................................................................32
3.6 Number of Rooms, Area of Dwelling and Housing Plot ....................................32
3.7 Access to Drinking Water Supply.......................................................................33
3.8 Access to Household Utilities and Amenities.....................................................34
3.9 Main Fuel Used for cooking ...............................................................................34
3.10 Households that Used and Collected Firewood ..................................................35
3.11 Place of Firewood collection ..............................................................................35
3.12 Stove Used for Cooking......................................................................................35
3.13 Fodder Collection................................................................................................35
3.14 Use of Iodized Salt..............................................................................................36
CHAPTER IV: ACCESS TO FACILITIES ............................................ 51
4.1 Introduction.........................................................................................................51
4.2 Primary School....................................................................................................51
4.3 Health Post/Hospital ...........................................................................................51
4.4 Bus Stop ..............................................................................................................52
4.5 Road Transport....................................................................................................52
4.6 Police Station, Post Office and Telephone Booth...............................................52
4.7 Market Center and Haat Bazaar .........................................................................53
4.8 Agriculture Centre (Krishi Kendra)....................................................................53
4.9 Commercial Bank ...............................................................................................53
4.10 Source of Drinking Water...................................................................................54
4.11 Cooperatives (Sajha)...........................................................................................54
4.12 Internet and Community Library ........................................................................54

xi
CHAPTER V: LITERACY AND EDUCATION .................................... 80
5.1 Introduction.........................................................................................................80
5.2 Literacy Rates .....................................................................................................80
5.3 Educational Status...............................................................................................81
5.4 Reasons for not Attending School. .....................................................................81
5.5 School Attendance ..............................................................................................82
5.6 Net Attendance Rate ...........................................................................................82
5.7 Mean Year of Schooling .....................................................................................82
5.8 Gross Enrollment ................................................................................................83
5.9 Type of School Attended ....................................................................................83
5.10 Reason for Dropouts ...........................................................................................83
CHAPTER VI: HEALTH SERVICES................................................... 101
6.1 Introduction.......................................................................................................101
6.2 Chronic Illness ..................................................................................................101
6.3 Acute Illness......................................................................................................101
6.4 Health Consultations by Practitioner Type .......................................................102
6.5 Health Consultations by Facility Type .............................................................102
6.6 Health Expenditures..........................................................................................102
6.7 Immunization ....................................................................................................103
6.8 HIV/AIDS – Knowledge and Prevention .........................................................103
6.9 Disability...........................................................................................................104
CHAPTER VII: MATERNITY AND FAMILY PLANNING ............. 117
7.1 Introduction.......................................................................................................117
7.2 Children Ever Born (CEB)................................................................................117
7.3 Fertility Rate (TFR and ASFR).........................................................................118
7.4 Knowledge and Use of Family Planning ..........................................................118
7.5 Type of Family Planning Methods used ...........................................................118
7.6 Reason for Not-using Family Planning Methods..............................................119
7.7 Source of Knowledge about Family Planning Methods ...................................119
7.8 Source of Family Planning Methods.................................................................119

xii
7.9 Place of Delivery and Birth Attendants ............................................................120
7.10 Prenatal and Postnatal Care ..............................................................................120
7.11 Women’s Participation in Decision Making.....................................................121
CHAPTER VIII: MIGRATION AND ABSENTEES ........................... 131
8.1 Migrants ............................................................................................................131
8.1.1 Status of migrants .............................................................................................131
8.1.2 Origin of migration ...........................................................................................131
8.1.4 Reasons for migration .......................................................................................132
8.2 Absentees ..........................................................................................................132
8.2.1 Absentees as a proportion of total population...................................................132
8.2.2 Absentees by place of current residence...........................................................132
8.2.3 Absentees by reason for absence ......................................................................133
8.2.4 Households having absentee .............................................................................133
8.3 Children Away From Home..............................................................................133
8.3.1 Reason for absence of children .........................................................................133
REFERENCES.......................................................................................... 143
ANNEX ..................................................................................................... 144
Annex I : Survey Staff ............................................................................................144
Annex II: Dissemination of NLSS Data .................................................................146
xiii
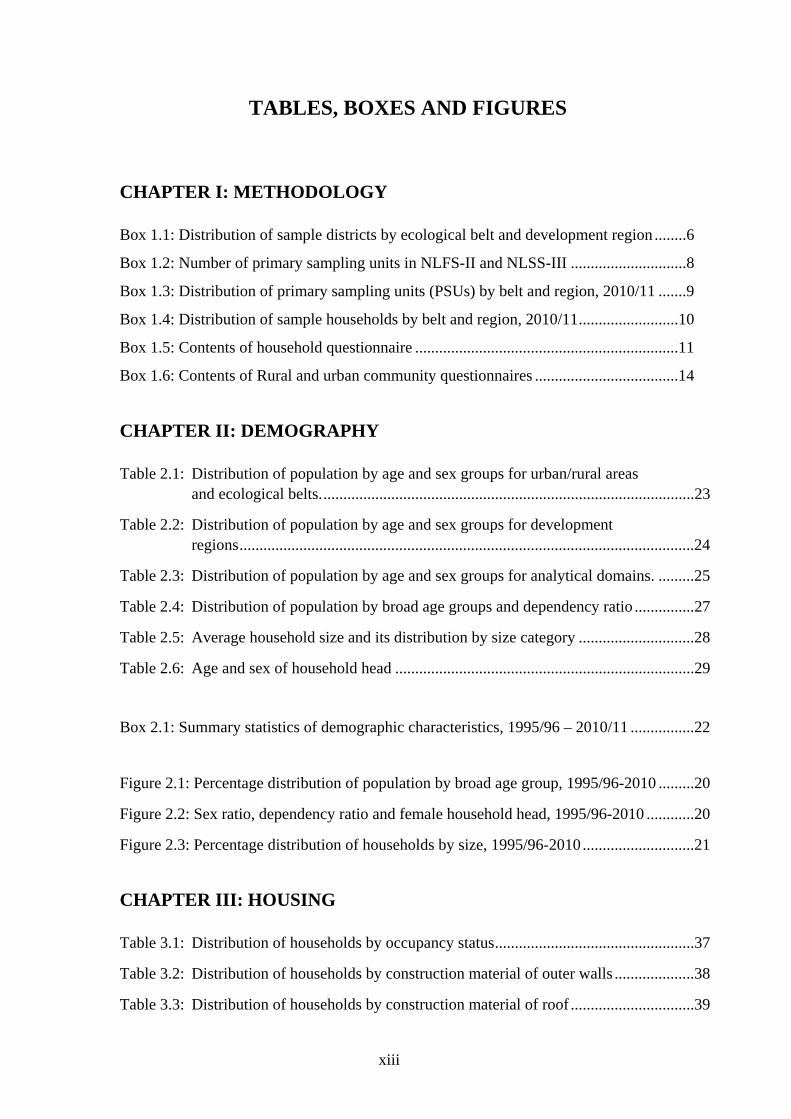
TABLES, BOXES AND FIGURES
CHAPTER I: METHODOLOGY
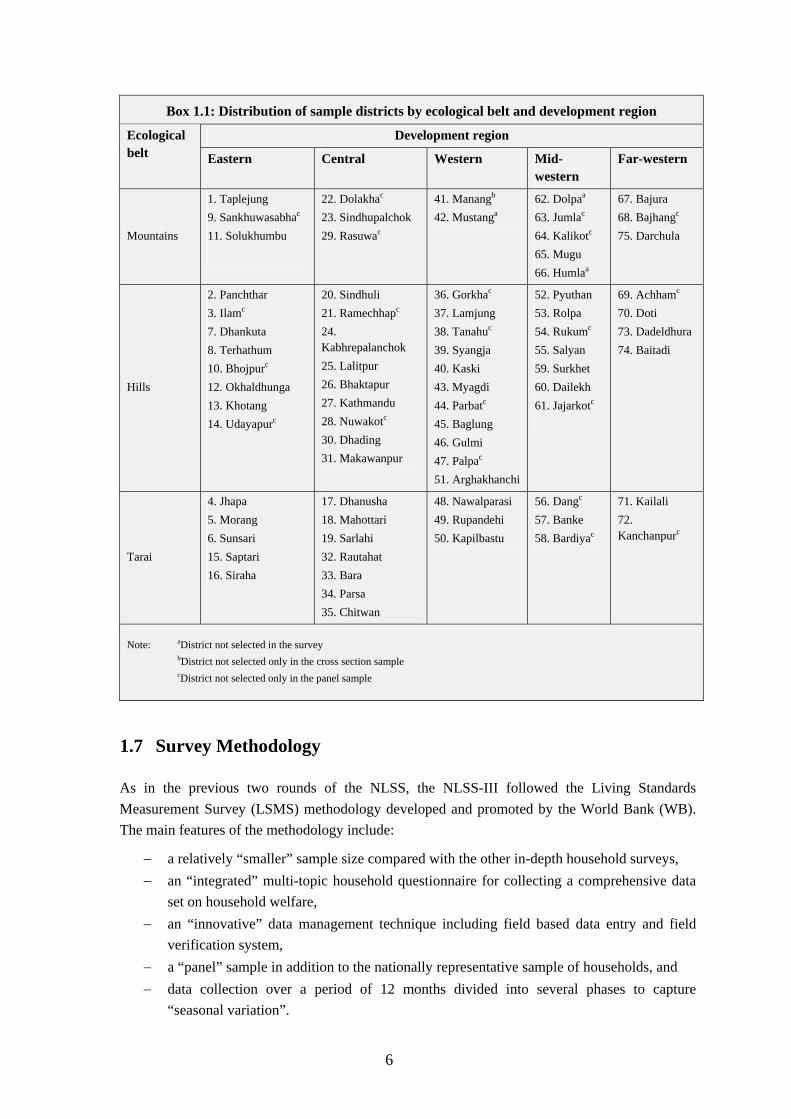
Box 1.1: Distribution of sample districts by ecological belt and development region ........6
Box 1.2: Number of primary sampling units in NLFS-II and NLSS-III .............................8
Box 1.3: Distribution of primary sampling units (PSUs) by belt and region, 2010/11 .......9
Box 1.4: Distribution of sample households by belt and region, 2010/11.........................10
Box 1.5: Contents of household questionnaire ..................................................................11
Box 1.6: Contents of Rural and urban community questionnaires ....................................14
CHAPTER II: DEMOGRAPHY
Table 2.1: Distribution of population by age and sex groups for urban/rural areas and ecological belts..............................................................................................23
Table 2.2: Distribution of population by age and sex groups for development regions..................................................................................................................24
Table 2.3: Distribution of population by age and sex groups for analytical domains. .........25
Table 2.4: Distribution of population by broad age groups and dependency ratio ...............27
Table 2.5: Average household size and its distribution by size category .............................28
Table 2.6: Age and sex of household head ...........................................................................29
Box 2.1: Summary statistics of demographic characteristics, 1995/96 – 2010/11 ................22
Figure 2.1: Percentage distribution of population by broad age group, 1995/96-2010 .........20
Figure 2.2: Sex ratio, dependency ratio and female household head, 1995/96-2010 ............20
Figure 2.3: Percentage distribution of households by size, 1995/96-2010............................21
CHAPTER III: HOUSING
Table 3.1: Distribution of households by occupancy status..................................................37
Table 3.2: Distribution of households by construction material of outer walls ....................38
Table 3.3: Distribution of households by construction material of roof ...............................39

xiv
Table 3.4: Distribution of households by construction material of foundation ....................40
Table 3.5: Average number of rooms and average size of dwelling.....................................41
Table 3.6: Distribution of households by source of drinking water......................................42
Table 3.7: Percentage of households with access to various facilities..................................43
Table 3.8: Distribution of households by main fuel used for cooking..................................44
Table 3.9: Percentage of households using and collecting firewood ....................................45
Table 3.10: Distribution of firewood collecting households by place of firewood collection..............................................................................................................46
Table 3.11: Distribution of households by type of stove used...............................................47
Table 3.12: Fodder collection by households ........................................................................48
Table 3.13: Distribution of households by type of salt used..................................................49
Table 3.14: Distribution of households by type of iodized salt used.....................................50
Box 3.1: Summary statistics of household characteristics..................................................36
Figure 3.1: Households occupancy status..............................................................................30
Figure 3.2: Access to household amenities and facilities, 1995/96-2010/11 ........................34
CHAPTER IV: ACCESS TO FACILITIES
Table 4.1: Distribution of households by time taken to reach the nearest facilities for rural & urban Nepal........................................................................................56
Table 4.2: Distribution of households by time taken to reach the nearest facilities for consumption quintiles ....................................................................................59
Table 4.3: Mean time taken by urban/rural households to reach the nearest facility............64
Table 4.4: Mean time taken by households to reach the nearest facilities for consumption quintiles ..........................................................................................65
Table 4.5: Distribution of households by time taken to reach the nearest primary school ...................................................................................................................66
Table 4.6: Distribution of households by time taken to reach the nearest health post..........67
Table 4.7: Distribution of households by time taken to reach the nearest Sajha (cooperatives).......................................................................................................68
Table 4.8: Distribution of households by time taken to reach the nearest Agriculture center....................................................................................................................69

xv
Table 4.9: Distribution of households by time taken to reach the nearest commercial bank..................................................................................................70
Table 4.10: Distribution of households by time taken to reach the nearest market center....................................................................................................................71
Table 4.11: Distribution of households by time taken to reach the nearest facilities for development regions ......................................................................................72
Table 4.12: Distribution of households by time taken to reach the nearest facilities for ecological zones .............................................................................................77
Box 4.1: Percent of households within the reach of 30 minutes...........................................55
Figure 4.1: Percent of households within the reach of 30 minutes, 1995/96-2010/11...........53
CHAPTER V: LITERACY AND EDUCATION
Table 5.1: Literacy rates by gender.......................................................................................85
Table 5.2: Literacy rates by age group and urban/rural area.................................................86
Table 5.3: Percentage distribution of educational status of population 6 years and older by gender ....................................................................................................87
Table 5.4: Distribution of educational status by urban/rural and age group.........................88
Table 5.5: Percentage distribution of educational status of urban population by gender and age group...........................................................................................88
Table 5.6: Percentage distribution of educational status of rural population by gender and age group...........................................................................................89
Table 5.7: Percentage distribution of educational status of all Nepal by gender and age group..............................................................................................................89
Table 5.8: Reason for not attending school for all population 6-24 years that has never attended school...........................................................................................90
Table 5.9: Reason for not attending school for male population 6-24 years that has never attended school...........................................................................................91
Table 5.10: Reason for not attending school for female population 6-24 years that has never attended school ....................................................................................92
Table 5.11: Percentage of population 15 years and older who ever attended school and their mean years of schooling .......................................................................93
Table 5.12: Percentage of population 15 years and older who ever attended school and their mean years of schooling by age category, Urban Nepal.......................94

xvi
Table 5.13: Percentage of population 15 years and older who ever attended school and their mean years of schooling by age category, Rural Nepal........................94
Table 5.14: Percentage of population 15 years and older who ever attended school and their mean years of schooling by age category, Nepal..................................95
Table 5.15: Gross enrollment rates by level of schooling and gender...................................96
Table 5.16: Net attendance rate by level of schooling and gender ........................................97
Table 5.16A: Net Enrollment rate by level of schooling and gender ....................................98
Table 5.17: Type of school attended by individuals currently in school ..............................99
Table 5.18: Reason for leaving school/collage for population 6-24 years who attended school in the past ...................................................................................100
Box 5.1: Summary statistics of literacy and education.......................................................84
Figure 5.1: Adult literacy rate, 1996/96 – 2010/11 ................................................................80
CHAPTER VI: HEALTH SERVICES
Table 6.1: Percentage of population reporting chronic illnesses by gender ........................106
Table 6.1A: Percentage distribution of types of chronic illness by gender ...........................107
Table 6.2: Percentage distribution of acute illnesses by type ..............................................108
Table 6.2A: Percentage of population reporting acute illnesses by gender...........................109
Table 6.3: Percentage of health consultations for acute illnesses by status and practitioner type ...................................................................................................110
Table 6.4: Percentage of immunization status of children aged under five years................111
Table 6.5: Percentage of health consultations for acute illnesses by type of institution .............................................................................................................112
Table 6.6; Distribution of population 10 years and older who have heard HIV/AIDS by source of information ...................................................................113
Table 6.7: Mean expenditure of last consultation in Government and Private institution for acute illness ...................................................................................114
Table 6.8: Percentage of population by type of disability ....................................................115
Table 6.9: Percent of population reporting different methods of preventing HIV/AIDS............................................................................................................116
Box 6.1: Summary statistics of health services ..................................................................104
xvii
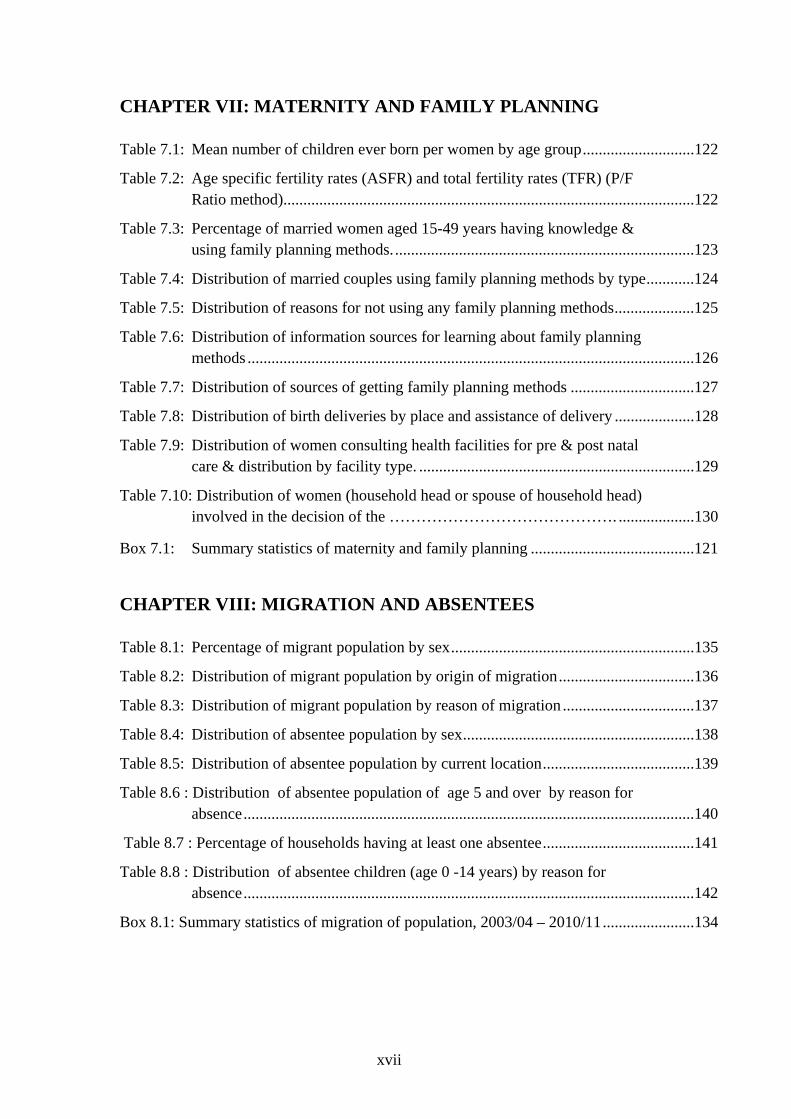
CHAPTER VII: MATERNITY AND FAMILY PLANNING
Table 7.1: Mean number of children ever born per women by age group............................122
Table 7.2: Age specific fertility rates (ASFR) and total fertility rates (TFR) (P/F Ratio method).......................................................................................................122
Table 7.3: Percentage of married women aged 15-49 years having knowledge & using family planning methods............................................................................123
Table 7.4: Distribution of married couples using family planning methods by type............124
Table 7.5: Distribution of reasons for not using any family planning methods....................125
Table 7.6: Distribution of information sources for learning about family planning methods ................................................................................................................126
Table 7.7: Distribution of sources of getting family planning methods ...............................127
Table 7.8: Distribution of birth deliveries by place and assistance of delivery ....................128
Table 7.9: Distribution of women consulting health facilities for pre & post natal care & distribution by facility type. .....................................................................129
Table 7.10: Distribution of women (household head or spouse of household head) involved in the decision of the ……………………………………....................130
Box 7.1: Summary statistics of maternity and family planning .........................................121
CHAPTER VIII: MIGRATION AND ABSENTEES
Table 8.1: Percentage of migrant population by sex.............................................................135
Table 8.2: Distribution of migrant population by origin of migration..................................136
Table 8.3: Distribution of migrant population by reason of migration .................................137
Table 8.4: Distribution of absentee population by sex..........................................................138
Table 8.5: Distribution of absentee population by current location......................................139
Table 8.6 : Distribution of absentee population of age 5 and over by reason for absence.................................................................................................................140
Table 8.7 : Percentage of households having at least one absentee......................................141
Table 8.8 : Distribution of absentee children (age 0 -14 years) by reason for absence.................................................................................................................142
Box 8.1: Summary statistics of migration of population, 2003/04 – 2010/11.......................134

xviii
ACRONYMS AIDS Acquired Immune Deficiency Syndrome ASFR Age Specific Fertility Rate BCG Bacillile Calmette Gurin BSO Branch Statistical Office CBS Central Bureau of Statistics (Nepal) DPT Diphtheria Pertusis and Tetanus ECD Early Childhood Development FAO Food and Agriculture Organization GER Gross Enrolment Rate GPS Global Positioning System HIV Human Immunodeficiency Virus IUD Intra Uterine Device LPG Liquefied Petroleum Gas LSMS Living Standards Measurement Survey MDGs Millennium Development Goals NDHS Nepal Demographic Health Survey NAR Net Attendance Rate NER Net Enrollment Rate NGO Non Government Organization NLFS II Nepal Labour Force Survey 2008 NLSS I Nepal Living Standards Survey 1995/96 NLSS II Nepal Living Standards Survey 2003/04 NLSS III Nepal Living Standards Survey 2010/11 NPCS National Planning Commission Secretariat PHC Public Health Center PPS Probability Proportional to Size PPM Parts Per Million PSU Primary Sampling Unit SSU Secondary Sampling Unit TB Tuberculosis TBA Traditional Birth Attendant TFR Total Fertility Rate TYP Three Year Plan UN United Nations UNICEF The United Nations Children’s Fund VDC Village Development Committee VSC Voluntary Sterilization Camp WB The World Bank WHO World Health Organization

xix

xx

1
EXECUTIVE SUMMARY
METHODOLOGY
Central Bureau of Statistics (CBS) carried out Nepal Living Standards Survey (NLSS) for the first time in 1995/96. The second round of the NLSS was conducted in 2003/04. The Nepal Living Standards Survey 2010/11 (NLSS-III) is the third round of the survey conducted by the CBS as a follow up of the previous two rounds.
All the three surveys followed the Living Standards Measurement Survey (LSMS) methodology developed and promoted by the World Bank. NLSS-II enumerated 3912 households from 326 PSUs compared to 3373 households from 274 PSUs in NLSS-I. NLSS-II also interviewed 1160 households from 95 panel PSUs that were enumerated in NLSS-I.
NLSS-III enumerated 7,020 households, of which 5,988 households are from the cross-section sample and the remaining 1,032 are from the panel sample.
DEMOGRAPHY
During the last 15 years (since NLSS-I), the proportion of population in 0-14 years of age group has decreased from 42 to 37 percent; whereas that in 15-59 years age group has increased from 51 to 54 percent, and that in 60 years and over age group has increased from 7 to 9 percent. Dependency ratio, sex ratio and household size exhibited a decreasing trend during the same period while the proportion of female-headed households almost doubled (increased from 14 percent to 27 percent).
HOUSING
During a period of the last 15 years, the proportion of households residing in their own housing units has decreased from 94 percent to 90 percent. The proportion of renters, on the other hand, has increased from 2 to 8 percent during the same period. Average size of dwelling has remained constant compared with the NLSS-I.
The proportion of households occupying housing units with cement-bonded outer walls, and concrete or galvanized sheet roof have increased between these two periods (1995/96 – 2010/11). However, household’s access to piped water has not changed in the last 7 years.
Access to electricity and telephone has significantly increased in the last 15 years. Access to electricity and telephone has increased from 14 to 70 percent and from one to 13 percent respectively. Overall, 56 percent of households now have toilet/latrine facility in their own dwelling, compared to 22 percent in 1995/96.
ACCESS TO FACILITY
Between 1995/96 and 2010/11, accessibility to different facilities has improved almost universally. Household's access to primary schools within 30 minutes (of travel time) was 88 percent in 1995/96, after 15 years it has reached 95 percent. During the same period, the comparable proportion of households with access to bus stop within 30 minutes has increased by some 33 percentage points, paved road by 27

2
percentage points and dirt road by 22 percentage points. Similarly, access to commercial bank has increased by 20 percentage points. Access to market center within 30 minutes has increased by 21 percentage points, Haat bazaar by 23 percentage points, cooperatives by 28 percentage points, and agriculture center by 19 percentage points.
LITERACY AND EDUCATION
Almost all education indicators show a very noticeable improvement between 1995/96 and 2010/11. Overall literacy rate of population (6 years and above) has increased by some 23-percentage points. This increase is higher for females (27 points) compared with males (19 points). Adult literacy rate has increased significantly during the same period of 15 years. Overall adult literacy rate has increased from 36 percent in 1995/96 to 57 in 2010/11. Female adult literacy increased by some 25 percentage points during this period.
Proportion of population aged 15 years and above that ever attended school was 34 percent in 1995/96 which increased to 55 percent in 2010/11. For these “ever attendees”, the mean years of schooling went up from 7 to 8.2 years between these periods.
According to NLSS-III, net attendance ratio (NAR) for girls are higher than that for boys in primary and secondary levels of schooling, but in other levels NAR are slightly lower for girls compared with that of boys.
Past two surveys (NLSS-I and NLSS-II) tabulated net enrollment ratio (NER) instead of NAR. NER is usually higher than NAR. Primary school NER increased from 57
percent to 78 percent, lower secondary school NER from 19 to 42 and secondary school NER from 9 to 28.
Private school participation rate has gone up from 7 percent to 26.8 percent during the same period.
HEALTH SERVICES
In the last 15 years, the incidence of chronic illness increased from 6 percent in 1995/96 to 12 percent in 2010/11. Incidence of acute illness, on the other hand, increased from 9 percent in 1995/96 to 20 percent in 2010/11. In all the three rounds, the majority of acute illness cases are fever.
While proportion of acute illness consultations with no-one has decreased slightly over this period, proportion of consultations with a doctor has decreased and that with a paramedical has marginally increased.
The proportion of fully immunized children has increased remarkably during the last 15 years.
Overall, about 4 percent of population has some kind of disability. Physical disability is the highest in the country followed by hearing and visual disability.
MATERNITY AND FAMILY PLANNING
The average number of children ever born per woman of age group 45-49 year has decreased from 5.3 in 1995/96 to 4.2 in 2010/11 while total fertility rate (TFR - adjusted) declined from 5.1 to 3.4 during the same period.
The proportion of the women (15-49 years) who have knowledge of at least one family planning method has increased by 23

3
percentage points from 60 percent in 1995/96 to 83 percent in 2010/11. On the other hand, the proportion of married couples using some form of family planning methods has increased from 15 to 39 percent in the last 15 years. The proportion of women receiving prenatal care is 78 percent and that receiving post-natal care is 20 percent in 2010/11.
MIGRATION AND ABSENTEES
The percent of migrant population has remained almost same in the last 7 years (between 2003/04 and 2010/11). However, the gender differential has not changed. In 2010/11, the rate of migration is higher for females (50 percent) than for males (21 percent).
Movement from the urban areas has slightly increased (from 6 percent in 2003/04 to 7 percent in 2010/11). Movements from abroad, on the other hand, have slightly decreased from 13 percent to 12 percent during the same period.
The proportion of migrants reporting “family” reason as the primary reason of their migration slightly increased from 75 percent in 2003/04 to 79 percent in 2010/11. Similarly the reason of migration for “education and training” slightly increased from 3 to 5 percent. On the other, the proportion of migrants reporting the reason as “easier life style” decreased from 12
percent to 7 percent. Percent of people who migrated “looking for job” decreased from 7 percent to 4 percent.
The survey also measured the number of people who the household considered to be household members but who were excluded from the survey’s definition of household membership because of their prolonged absence (away from the household for more than 6 months out of the last 12 months, or expected to be away for more than 6 months).
Almost 15 percent of the total population (including absentees abroad) of all ages was found to be absent or away from home. More adults aged 15 years and above (23 percent of the population including absentees abroad) were away from home as compared to children aged less than 15 years (6 percent of the population). Out of total absentees aged 5 years and above, 21 percent are currently studying and 51 percent are working.
Nearly 44 percent of households have at least one absentee currently living either abroad or within the country. When differentiating between abroad and within the country, it shows that slightly more than 29 percent of households have at least one absentee currently living abroad. Whereas, slightly more than 19 percent of households have at least one absentee currently living within the country.

4
CHAPTER I: METHODOLOGY
1.1 Introduction
The Nepal Living Standards Survey, 1995/96 (NLSS-I) was a milestone in the collection of data for the objective measurement of the living standards of the people and for determining the level of poverty in the country. The survey covered a wide range of topics related to “household welfare” (demography, consumption, income, access to facilities, housing, education, health, employment, credit, remittances and anthropometry, etc.).
NLSS-I for the first time, provided a measure of “extent and dimension” of poverty in Nepal. The survey findings became popular among decision makers in the government agencies, the general public and the international agencies as well.
It was realized that a second round of the survey was needed to update the results and to assess the impact of policies and programs on poverty and social indicators over the years (since the NLSS-I was conducted). Accordingly, the second round of the survey (NLSS-II) was carried out in 2003/04 after 8 years of the first survey.
The findings of the NLSS-II helped the government to monitor progress in improving national living standards and the survey became a good basis for monitoring the Millennium Development Goals (MDGs) over time.
Realizing the importance of time series data, the Government of Nepal decided to conduct another round of the Nepal Living Standards Survey. Accordingly, the Central Bureau of Statistics for the third time conducted the survey in 2010/11 (NLSS-III). The survey was carried out with the assistance from the World Bank.
1.2 Objective of the Survey
The main objective of the NLSS-III is to update data on the living standards of the people. The survey aims to assess the impact of various government policies and programs on the socio-economic changes in the country during the last 7 years. Further, the survey aims to track changes experienced by previously enumerated households during the past fifteen and seven years.
1.3 Survey Scope
The survey scope concerns the data to be collected. Consistent with the basic survey objectives, the data items included in the survey belong to the following broad topics: demography, housing, access to facilities, migration, consumer expenditure, education, health, marriage and maternity history, work and time use, employment and unemployment, wage and salary, agriculture, non agricultural activities, credit and savings, absentees population, remittances and transfers, social assistances, adequacy of consumption and government services/facilities, anthropometry and tracking of households enumerated (in the previous surveys).

5
1.4 Statistical Unit
The statistical unit or the enumeration unit of a survey is the basic entity for which the required data items are gathered. NLSS-III is basically a household survey and the enumeration unit of the survey is the household.
The definition of a household for the survey is primarily adopted from the guidelines laid down by the United Nations in its “Principles and Recommendations for Population and Housing Censuses, Rev 2” (UN, 2008). According to the guidelines the concept of household is based on the “arrangements made by persons, individually or in groups, for providing themselves with food or other essentials for living”. A household may consist of one person or a group of two or more persons. The persons in the group - may pool their incomes, may have a common budget, may be related or unrelated or may constitute a combination of persons both related and unrelated.
1.5 Coverage
The survey in principle covers the whole country, including both rural and urban areas. A brief description of the geographical and administrative division of the country follows. The country is divided into 75 administrative districts. These 75 districts are grouped into three ecological belts running from north to south – the mountains, the hills and the Tarai. Each ecological belt is further divided into five development regions – eastern, central, western, mid-western and far-western region. Thus 15 eco-development regions (or inter-regions) are formed by the cross combination of three ecological belts and five development regions (Box 1.1).
All households in the country were considered eligible for selection in the survey. The survey, however, excluded the households of diplomatic missions. The institutional households (like people living in schools hostels, prisons, army camps and hospitals) were also excluded from the survey. The household members were determined on the basis of the usual place of their residence. Foreign nationals whose usual place of residence is within the country were included in the survey.
1.6 Time Reference
Survey time reference is a period encompassing the various time reference dates or periods of data collection for individual data item. Generally, the time reference for the survey is either the day of enumeration or a particular day (for inventory items) and a longer period (for continuous activities). As required by the nature of the survey, NLSS-III adopted an elaborate time reference scheme. The time references adopted in the NLSS-III are as follows:
• The day of enumeration or a particular day • Past 7 days • Past 30 days • Past 12 months • Past agricultural year
6
Box 1.1: Distribution of sample districts by ecological belt and development region
Development region Ecological belt Eastern Central Western Mid-
western Far-western
Mountains
1. Taplejung 9. Sankhuwasabhac
11. Solukhumbu
22. Dolakhac
23. Sindhupalchok 29. Rasuwac
41. Manangb
42. Mustanga
62. Dolpaa
63. Jumlac
64. Kalikotc
65. Mugu 66. Humlaa
67. Bajura 68. Bajhangc
75. Darchula
Hills
2. Panchthar 3. Ilamc
7. Dhankuta 8. Terhathum 10. Bhojpurc
12. Okhaldhunga 13. Khotang 14. Udayapurc
20. Sindhuli 21. Ramechhapc
24. Kabhrepalanchok 25. Lalitpur 26. Bhaktapur 27. Kathmandu 28. Nuwakotc
30. Dhading 31. Makawanpur
36. Gorkhac
37. Lamjung 38. Tanahuc
39. Syangja 40. Kaski 43. Myagdi 44. Parbatc
45. Baglung 46. Gulmi 47. Palpac
51. Arghakhanchi
52. Pyuthan 53. Rolpa 54. Rukumc
55. Salyan 59. Surkhet 60. Dailekh 61. Jajarkotc
69. Achhamc
70. Doti 73. Dadeldhura 74. Baitadi
Tarai
4. Jhapa 5. Morang 6. Sunsari 15. Saptari 16. Siraha
17. Dhanusha 18. Mahottari 19. Sarlahi 32. Rautahat 33. Bara 34. Parsa 35. Chitwan
48. Nawalparasi 49. Rupandehi 50. Kapilbastu
56. Dangc
57. Banke 58. Bardiyac
71. Kailali 72. Kanchanpurc
Note: aDistrict not selected in the survey bDistrict not selected only in the cross section sample cDistrict not selected only in the panel sample
1.7 Survey Methodology
As in the previous two rounds of the NLSS, the NLSS-III followed the Living Standards Measurement Survey (LSMS) methodology developed and promoted by the World Bank (WB). The main features of the methodology include:
− a relatively “smaller” sample size compared with the other in-depth household surveys, − an “integrated” multi-topic household questionnaire for collecting a comprehensive data
set on household welfare, − an “innovative” data management technique including field based data entry and field
verification system, − a “panel” sample in addition to the nationally representative sample of households, and − data collection over a period of 12 months divided into several phases to capture
“seasonal variation”.

7
1.7.1 Sampling Frame
The initial frame for the NLSS-III survey was based on the frame prepared for the 2008 Nepal Labour Force Survey (NLFS-II). This was done “to take advantage of the cartographic segmentation and household listing operations” conducted by the CBS for the NLFS-II. Number of households at ward level was obtained from the 2001 Population Census. CBS has constructed a data set with basic information (number of households, total population, and male and female population) at the ward level. This data set was used to construct the frame for the selection of primary sampling units (PSUs).
The PSU for the NLFS-II were either individual wards or sub-wards or groups of contiguous wards in the same VDC. A group of wards was considered as single PSU, to ensure that each unit continued at least 30 households.
For the ultimate sample selection of households in the NLFS-II, a frame was prepared in each ward selected at the earlier stage of sampling. A list of all households was prepared in all the wards selected for the survey. Selection of households was carried out from these listings using systematic sampling with a random start. Before the listing, an intensive cartographic work was undertaken (in the urban areas and some of the rural areas) to form appropriate enumeration block having around 200 households.
1.7.2 Stratification
For the NLFS-II sample selection, 75 districts along with the urban and rural areas were grouped into six strata – mountains, urban areas of the Kathmandu valley, other urban areas in the hills, rural hills, urban hills, urban Tarai and rural Tarai. These six strata of the NLFS-II were further regrouped into 14 strata for the NLSS-III purposes. The “explicit” strata formed for the NLSS-III were as follows: mountains, urban areas of the Kathmandu valley, other urban areas in the hills, rural eastern hills, rural central hills, rural western hills, rural mid-western hills, rural far-western hills, urban Tarai, rural eastern Tarai, rural central Tarai, rural western Tarai, rural mid-western Tarai, and rural far-western Tarai.
1.7.3 Sample Design
The sample design adopted in NLSS-III was modified sub-sample of the sample adopted in NLFS-II. For the NLFS-II, 800 PSUs were selected – 400 PSUs each from urban and rural areas. As mentioned earlier, the PSU for the NLFS-II was a ward or a sub-ward or a combination of wards. The PSUs were selected with probability proportional to size, the measure of size being the number of households.
For the NLSS-III, two independent samples were selected: the first was a cross sectional sample and the second was a panel. The panel sample consisted of PSUs and households previously enumerated in one or both of the past two rounds of the survey.

8
1.7.4 Cross-section Sample
The cross-section sample was selected in three stages:
• In the first stage, the enumeration area units (primary sampling units, PSUs) are identical to that of NLFS-II. NLFS selected a sample of 800 PSUs allocated into six explicit strata (Box 1.2). Within each stratum, the PSUs were selected with probability proportional to size (pps), the number of households being the measure of size (mos).
• In the second stage, 500 of the 800 NLFS PSUs were selected to form the NLSS-III PSUs. As mentioned earlier, for this selection purpose the six strata of NLFS-II were further divided into 14 sub-strata (Box 1.2). Within each sub-stratum, the sample was selected with equal probability.
• In the third stage, 12 households were selected with equal probability in each PSU (using the computerized household listings generated by the NLFS-II as a sample frame). An additional 6 households were selected in each PSU, to be used as replacement household for non-response among the 12 originally selected households.
Box 1.2 : Number of primary sampling units in NLFS-II and NLSS-III
Stratum NLFS-II NLSS-III
Mountains 41 34
Urban areas of the Kathmandu valley 131 72
Other urban areas in the hills 92 40
Rural hills 179 155
Eastern 32*
Central 40
Western 40
Mid-western 28*
Far-western 15
Urban Tarai 170 56
Rural Tarai 187 143
Eastern 40
Central 40
Western 29*
Mid-western 20*
Far-western 14*
Nepal 800 500 *Number of PSUs equal to the total number of PSUs in the NLFS-II of this area.

9
1.7.5 Panel Sample
The panel sample of the NLSS-III is composed of all households visited by the NLSS-II in 100 of its primary sampling units (PSU). Fifty of them were taken from the cross-sectional component of the NLSS-II, and the remaining fifty from its panel component. In other words, one half of the NLSS-III panel households were households visited for the first time during the NLSS-II, whereas the other half were the households visited during both the NLSS-I and the NLSS-II.
1.7.6 Sample Size
The sample size for the survey was estimated at 7200 households in 600 PSUs. Among them, 100 PSUs with 1200 households interviewed in the NLSS-I or NLSS-II were selected for re-interviewing in the NLSS-III. And, 500 PSUs with 6000 households were selected as the cross-section sample (Box 1.3 and 1.4). The PSUs were selected with probability proportional to size, the measure of size being the number of households in each ward. As mentioned earlier, twelve households were selected for the enumeration from each of the selected PSU.
Box 1.3 : Distribution of primary sampling units (PSUs) by belt and region, 2010/11
Eastern Central Western Mid western
Far western
Total
Cross-section
Mountains 9 13 0 5 7 34
Hills 36 122 60 31 18 267
Tarai 61 55 36 27 20 199
Total 106 190 96 63 45 500
Panel
Mountains 4 3 1 1 2 11
Hills 6 23 12 6 3 50
Tarai 13 14 7 3 2 39
Total 23 40 20 10 7 100
Combined sample
Mountains 13 16 1 6 9 45
Hills 42 145 72 37 21 317
Tarai 74 69 43 30 22 238
Total 129 230 116 73 52 600

10
Box 1.4 : Distribution of sample households by belt and region, 2010/11
Eastern Central Western Mid western
Far western
Total
Cross-section
Mountains 108 156 0 60 84 408
Hills 432 1464 720 372 216 3,204
Tarai 732 660 432 324 240 2,388
Total 1,272 2,280 1,152 756 540 6,000
Panel
Mountains 48 36 12 12 24 132
Hills 72 276 144 72 36 600
Tarai 156 168 84 36 24 468
Total 276 480 240 120 84 1,200
Combined sample
Mountains 156 192 12 72 108 540
Hills 504 1,740 864 444 252 3,804
Tarai 888 828 516 360 264 2,856
Total 1,548 2,760 1,392 876 624 7,200
1.7.7 Enumeration Status
The survey enumerated 5988 sample households from 499 primary sampling units (PSUs) from the cross section sample. As regards to panel sample, from 100 PSUs 1032 households were tracked and enumerated (out of which 513 households were the households enumerated in the NLSS-II and the rest were the households enumerated in both of NLSS-I & II). Thus, in total 7020 households were enumerated in the survey.
1.8 Survey Questionnaires
As in the previous two surveys, NLSS-III used two types of questionnaires: household questionnaire and community questionnaire. There are two separate community questionnaires one each for rural and urban communities.
As many of the NLSS-II questions as possible were retained in the NLSS-III. However, some important additions and modifications were made in these questionnaires to address the contemporary issues.
A new section with questions on anthropometry and breastfeeding was added in the NLSS-III household questionnaire. Other two new sections added were on “jobs and time use” and “employment and unemployment”. Additional questions on food consumption during the past 7 days were introduced in "food expenses and home production" section. For some other questions of the NLSS-II, answer categories were modified, expanded or elaborated.

11
First, draft questionnaires were developed based on the questionnaires used in the NLSS-II. The questionnaires were pre-tested several times to assess their use under actual field conditions. Pre-tests were conducted in each of the Kanchanpur, Doti, Banke, Rupendehi, Kaski, Kathmandu, Lalitpur, Nuwakot, Dolakha, Dhanusha, Dhankuta, Jhapa and Panchthar districts. Following the experience of the pre-tests and the feedback obtained from potential data users, the questionnaires to be used for the actual survey were finalized.
In line with the project's objective of improving linkages between data users and the data collecting agency, the data needs and priorities identified by the project's Steering and Technical Committees were given special consideration while finalizing the questionnaires.
An 80-paged household questionnaire with 21 sections and 9 appendices was administered in the NLSS-III. The content of this household questionnaire is presented in Box 1.5. The contents of the rural and urban community questionnaires are presented in Box 1.6. An English version of the NLSS-III Household Questionnaire is presented in "Statistical Report Volume 2 Annex 2".
Box 1.5: Contents of household questionnaire
Cover page
Household ID, name and address of the household head, GPS coordinates of the location, and certification of enumerator and supervisor.
Section 0 Survey information
Enumeration details (date of interview and replacement details and certification of supervisor); household information; data entry details (date of data entry and certification by supervisor).
Section 1 Household roster
Demographic characteristics (including name, sex, age, relationship to the household head, birth place, marital status for persons aged 10 years or over, and caste/ethnicity), and identification of household members, and parents of household members (whether living in the same household and educational status).
Section 2 Housing
Type of dwelling occupied by the household, housing expenses, utilities and amenities and use of iodized salt in the household.
Section 3 Access to facilities
Distance to the various (24) public facilities and services, mode of transport and travel time required to reach the facility.
Section 4 Migration (for all household members aged 5 years and over)
First time in migration to the place of enumeration, out migration over the past five years.
Section 5 Food expenses and home production (during past 12 months and past 7 days)
Consumption of foods (over a typical month)- home production, food purchased and food received in kind, and consumption of foods (during past 7 days from the day of enumeration)- home production, food purchased and food received in kind.

12
Box 1.5: Contents of household questionnaire
Section 6 Non food expenditures and inventory of durable goods (over a period of 12 months)
Expenditure of frequent non food items and infrequent non food items, inventory of durable goods, and own account production of goods).
Section 7 Education (for all members aged 3 years and over)
Literacy status, level of education, past enrollment and current enrollment.
Section 8 Health
Disability and chronic illness (for all members), illness and injuries during past 30 days, not able to work due to illness (for members aged 5 years and over), knowledge of HIV/AIDS, immunization (for children below 5 years of age).
Section 9 Marriage and maternity history
Maternity history (for all ever married women aged 15-49 years who have given live birth), pre and post natal care (for all women with a child aged 3 years or less), family planning (for all currently married women aged 15-49 years), and household decision (for spouse of the male household head or female household head).
Section 10 Jobs and time use
Time use (for all household members aged 5 years or over) – total number of hours spent during the past seven days in economic activities, extended economic (home based) activities and non-work activities (household chores); and jobs during the past 12 months, the past 7 days and sector of employment (for all household members aged 5 years and older).
Section 11 Unemployment and under employment
Unemployment i.e., not working; underemployment i.e., working less than 40 hours per week (for all household members aged 5 years or over).
Section 12 Wage jobs
Wage employment in agriculture and outside agriculture wage paid daily, long term or contract basis (for all household members aged 5 years or over).
Section 13 Farming and livestock
Land holding and farming activities (land owned, land sharecropped/rented/mortgaged-in, increase/decrease in holding area), production and use of crops, expenditure on agricultural input (including seeds/seedlings, fertilizers, pesticides, and hired labour), earnings/expenditure of farming, inventory of livestock on holding, earnings/expenditure of livestock, ownership of farming assets and access to extension services.
Section 14 Non-agricultural enterprises/activities
Self employed in non-agricultural enterprise and activities by type and operation of enterprises, and income and expenditure of the enterprises.
Section 15 Credit and savings
Borrowing and outstanding loans (borrower, source, amount, period and collateral); lending and outstanding loans (borrower, source, amount, period and collateral); other assets (land, property and other fixed assets); and household decisions (for male household head or spouse of the male household head).

13
Box 1.5: Contents of household questionnaire
Section 16 Absentees information
Demographic characteristics of the absentee, main reason of leaving home; employment and remittances received from absentees (sector of absentee’s employment, medium of remittances, total amount and use of remittances received).
Section 17 Other remittances
Remittances and transfer-income sent (demographic characteristics of the recipient, work activity of the recipient, total amount sent and medium of transfer); remittances and transfer-income received (demographic characteristics of the donor, work activity of the donor, total amount received, main use of remittances received and medium of transfer).
Section 18 Transfers, social assistance and other income
Amount received under different social assistance programmes (amount expected and amount actually received under the programmes), benefits in-kind, benefits from public work activities, and income from all other sources not covered elsewhere in the questionnaire.
Section 19 Adequacy of consumption and government facilities
Household’s perception on their standards of living and the standards of government facilities/services that the household is using;
Household food security and steps taken to alleviate food shortage.
Section 20 Anthropometrics and breastfeeding practices
Exact age of the child, measurement of height and weight of children of age 59 months or less, exclusive breast feeding (for child of age less than 6 months), and duration of breastfeeding.
Section 21 Panel sample household tracking
Household composition in 1995/96 or 2003/04, present household composition, reason of changes in the household composition, current status (not the household member).

14
Box 1.6: Contents of rural and urban community questionnaires
Rural community questionnaire
Cover page Ward ID and certification of enumerator and supervisor.
Section 1 Population characteristics and infrastructure
Characteristics of the community, status of electricity supply, water supply and sewerage system in the ward.
Section 2 Access to facilities
Services and amenities, and health facilities existing and education status of the residents in the village development committee of the enumeration area.
Section 3 Agriculture and forestry
Land use, irrigation systems, and crop cycles; rate of wages paid to hired labour; rental rates for cattle and machinery; use of forestry.
Section 4 Migration
In and out migration of people in the community.
Section 5 Development programmes, user groups, and quality of life
Development programmes, existing user groups and quality of life in the community.
Section 6 Rural primary school
Education enrollment in the primary school, infrastructure of the school and supplies in the community.
Section 7 Rural health facilities
Health facilities, equipment and services available and health personnel in the community.
Section 8 Market and prices
Local shops, haat bazaar, availability and prices of different goods in local shops/haat bazaar, agricultural inputs and conversion of local units into standard units.

15
Urban community questionnaire
Cover page Ward ID and certification of enumerator and supervisor.
Section 1 Population characteristics and infrastructure
Characteristics of the community, status of electricity supply, water supply and sewerage system in the ward.
Section 2 Access to facilities
Distance from the community to various places and public facilities and services.
Section 4 Market and prices
Availability and prices of different food and non food commodities in the local shops/markets.
Section 4 Quality of life
Quality of welfare items compared with their status 5 years ago.
1.9 Field Work Organization
1.9.1 Field Teams
In the NLSS-III, data were collected by 20 field teams. Each team was responsible for a particular area of the country. Teams were formed to balance the workload and travel time among the teams. The teams were based in the appropriate Branch Statistics Office (BSO) of the CBS, and each team covered on average 30 PSUs during a period of 12 months.
Each team consisted of one supervisor, three interviewers (including at least two female interviewers) and one specially trained data entry operator.
Each team was equipped with a laptop computer, solar panel power box, GPS device, kits for testing iodine in salt, instruments for measuring height and weight of children and other logistics required in the field.
Among the team members, supervisor was responsible for coordinating, supervising, and monitoring the field work. Besides, supervisor was responsible to complete the community questionnaires. Other responsibilities included checking the filled-in questionnaires and doing real time corrections, and supervising data entry activities.
The primary job of the interviewer was to complete the household questionnaire after interviewing the household head or other relevant member(s) of the household. Female interviewers were assigned the additional task of interviewing the female members of household (especially sensitive questions related to women). They were also assigned to measure the height and weight of children in the interviewed household. Further, one of the enumerators was assigned the task of computer data entry in the field.

16
1.9.2 Selection of Field Staff and Training
All together 100 field workers were assigned in the main enumeration of the survey. Majority of the field workers were mobilized from the regular staffs of the CBS and the Branch Statistics Offices (BSOs). In addition to the regular staff, 40 female interviewers were newly recruited for the purposes mentioned earlier - to conduct interviews related to women and to work as an anthropo-metrician.
Female interviewers were recruited on a year contract. To encourage the local participation, these female interviewers were recruited from three centres of the country: Biratnagar, Kathmandu, and Nepalgunj. The required number of female interviewers was recruited on the basis of a job interview of each candidate.
The training of the field workers (supervisors, interviewers, and data entry operators) was the main training for the survey. The training commenced on January 17, 2010 and concluded on February 14, 2010 covering 25 working days in total.
The training was organized in the two adjacent training centres at Jawalakhel, Lalitpur in the Kathmandu valley. There were 120 participants in the training programme at the beginning. The participants were divided into four groups and four concurrent group sessions were held. Out of 120 participants, 117 completed the training successfully.
Different methods of training were adopted. The methods used included study of the questionnaire and the reference manual, classroom sessions, class exercise sessions, mock interviews and field practices and discussions.
A separate training one each for supervisors (on community questionnaires) and data entry operators (on data entry and verification procedures) was also organized. Besides, female interviewers were trained in anthropometrics. Interviewers were also trained on how to measure the iodine contain in salt.
The core team members of the project conducted the training. The UNICEF, Nepal assisted the trainers in conducting the anthropometric sessions. National and international consultants also were involved in the management and supervision of the training.
1.9.3 Data Collection and Supervision
Data collection was carried out over a period of 12 months to cover a complete cycle in agricultural activities and to capture seasonal variations in other variables. Fieldwork took place in four subsequent phases.
The first phase started on February 21, 2010 and 69 PSUs (including 7 panel PSUs) were covered during a period of 29 days. After the completion of the first phase, a 5-day review meeting of the field workers commenced on March 29, 2010. This review meeting was used for discussions about difficulties in the field and preparations for the second phase. During the review meeting,

17
instructions were issued to rectify the errors and inconsistencies found in the field work (especially in the computer data entry programmes).
The second phase of data collection work started from April 3, 2010 and continued till the June 26, 2010. During this phase, work on 131 PSUs was completed. The third phase of the field work continued from July 1, 2010 through October 24, 2010 and 200 PSUs were completed in this period. The fourth phase began on October 29, 2010 and was completed by the first week of February, 2011. Field review meetings were held in the break periods between these phases and they were basically used for discussions of field difficulties and for rectifying the errors.
The team supervisor was charged with day to day field supervision. Besides, there was a provision for the supervision from the CBS (central level) as well as from the BSOs. Central level supervisory visits began immediately after the start of the field work which was carried out by the core team members of Household Survey Section.
During the survey period, the field work was constantly supervised and monitored by the core team members. Besides the core team members, at times central supervisions were carried out by the Director General and Deputy Director General of the Bureau. The core team members prepared a list of instructions based on the observations of the central supervision. A supervision form was developed for the purpose of field supervision.
1.9.4 Data Entry and Management
As in the previous two rounds of the survey, a distinctive feature of the NLSS-III was the use of personal computer in the field. A data entry programme developed specifically for the survey was installed on each computer provided to the field teams.
The data entry programme enabled the data entry operator as well as the team supervisor to find out mistakes and missing data (if any) and to perform inconsistency checks. When problems or errors were found, the interviewers returned to the households to correct the errors. The field supervision from the CBS included the real time check and verification of data entry work in the field.
This process of real time entering, checking and correcting data in the field helped to enhance the quality of data collected. It also reduced the time lag between data collection and data processing. This also helped to make data available for processing shortly after the completion of the collection phase.
After the completion of the field work, the data diskettes were sent back to the CBS from the field. Data processing and analysis was done in the CBS using STATA statistical software package.

18
1.10 Analytic Domains
The original idea was to provide an estimate for each of 14 strata formed for selecting the PSUs. However, it was felt that the number of sample households in some of these strata was insufficient for the required precision of the estimate. Based on experience and statistical theory, it is estimated that the sample can provide desegregated estimates for the following 12 areas (called the analytic domains):
• Mountains • Urban areas of the Kathmandu valley • Other urban areas of the hills • Eastern rural hills • Central rural hills • Western rural hills • Mid-western and far-western rural hills • Urban areas of the Tarai • Eastern rural Tarai • Central rural Tarai • Western rural Tarai • Mid-western and far-western rural Tarai
1.11 Contents in the Reports
This chapter describes methodology of the NLSS-III and its implementation. Other chapters in this volume present results on: Demography (Chapter 2), Housing (Chapter 3), Access to Facilities (Chapter 4), Literacy and Education (Chapter 5), Health Services (Chapter 6), Maternity and Family Planning (Chapter 7), and Migration and Absentees (Chapter 8).
“Volume Two” of the report covers the following 11 chapters: Agriculture (Chapter 9), Consumption (Chapter 10), Income (Chapter 11), Employment Status (Chapter 12), Wage Employment (Chapter 13), Nonfarm Economic Activities (Chapter 14), Remittances and Transfer Income (Chapter 15), Household Loans (Chapter 16), Adequacy of Consumption (Chapter 17), Government Facility (Chapter 18), and Nutrition of Children (Chapter 19).
Most tabulations in these reports present result by rural-urban areas, three ecological zones, five development regions, 12 analytic domains and consumption quintiles1.
1 Based on nominal per capita household consumption, five consumption groups of equal population are generated.

19
1.12 Conclusion
Central Bureau of Statistics (CBS) carried out Nepal Living Standards Survey (NLSS) for the first time in 1995/96. The second round of the NLSS was conducted in 2003/04. The Nepal Living Standards Survey 2010/11 (NLSS-III) is the third round of the survey conducted by the CBS as a follow up of the previous two rounds.
All the three surveys followed the Living Standards Measurement Survey (LSMS) methodology developed and promoted by the World Bank (WB). NLSS-II enumerated 3912 households from 326 PSUs compared to 3373 households from 274 PSUs in NLSS-I. NLSS-II also interviewed 1160 households from 95 panel PSUs that were enumerated in NLSS-I.
NLSS NLSS-III enumerated 7,020 households, of which 5,988 households were from the cross-section sample and the remaining 1,032 were from the panel sample.
20
CHAPTER II: DEMOGRAPHIC CHARACTERISTICS
2.1 Introduction
The size, structure, distribution and growth of population have a direct impact on a host of quality aspects of life in the country. Population structure is one of the most basic demographic characteristics and plays a vital role in the population dynamics. Age and sex are two important components of population structure.
In the last fifteen years, age and sex structure of population in Nepal exhibited significant changes. The proportion of children below fifteen years of age has decreased while that of population 15 years and over age group has increased. Dependency ratio, sex ratio and household size has decreased while the proportion of female headed household has increased (Box 2.1).
2.2 Distribution of Population by Age and Sex
Age structure of a population, that is, the proportion of people in different age groups is important for development planning.
Tables 2.1-2.4 present distribution of population by age and sex for various level of disaggregation. Among five-year age groups, 10-14 years age group has the highest proportion of population (14 percent) followed by 5-9 years age group (13 percent) (Table
2.1). Among broader age groups, on the other hand, 54.2 percent of population is in 15-59 years age group, 36.7 percent below 15 years of age and 9.1 percent is in the age group 60 years and above (Table 2.4).
Sex ratio in the survey is defined as the number of males per hundred females. A sex ratio over 100 denotes the excess of males over females, and a sex ratio below 100 denotes the excess of females over males.

21
Sex ratio is estimated to be about 86 in the country. The sex ratio for rural areas is slightly lower than the national average while among geographic regions the far west has the lowest (81) number of males per hundred females (Table 2.2).
The sex ratio for working age population (15-59 years) is lower compared to that for younger (0-14 years) and older (60 and above) ages.
The proportion of children in the age group 0-14 years has decreased in the last fifteen years while that in the other two groups has increased (Figure 2.1). Sex ratio exhibited a deceasing trend during the same period (Figure 2.2).
2.3 Dependency Ratio
The conventional dependency ratio is defined as the ratio of population in the 0-14 years age group (young population) and those 60 years and above (old population) to the population in the productive age groups, i.e., 15-59 years. The overall dependency ratio of the country is 84.4 percent (Table 2.4). In other words, roughly about 100 persons in the productive ages have to support 84 dependents in terms of the basic necessities of life. The dependency ratio increases further if the economically inactive people in the productive ages are excluded and added to the dependent population.
There is a wide difference between the dependency ratio in the rural areas (92) and in the urban areas (59). Among the ecological belts the mountain region has the highest ratio (101) while the hills has the lowest (91). The discrepancy is even wider among the geographical regions or the analytical domains. The urban Kathmandu valley has the lowest ratio (45) while the highest is recorded in the rural mid and far western hills (107).
The dependency ratio exhibited a decreasing trend during the last fifteen years (Figure 2.2).
2.4 Household Size and Distribution by Size
Household size is the number of members in a household. The average household size in the country is 4.9. In other words, a household contains about 5 persons on the average.
Roughly 14 percent of the households have one or two persons only. Slightly more than one third (35 percent) of the households in the country contain 3-4 persons, another 32 percent contain 5-6 persons and the rest (19 percent) have 7 or more persons (Table 2.5).

22
The household size is the lowest in the urban Kathmandu valley (4.1) while it is the highest in the western rural Tarai (5.7). During the last fifteen years, the proportion of households with less than five persons has increased while the proportion of households with more than four persons has decreased (Figure 2.3).
2.5 Sex and Age of the Household Head
The head of a household is the person in the household acknowledged as head by other members. The head has the primary authority and responsibility for household affairs. In Nepal, 26.6 percent of the households are headed by females. By age groups, about half of heads are aged 30-49 years (Table 2.6).
The western rural hills has the highest proportion of female headed households while the rural central Tarai has the lowest proportion (19). Over the years, the proportion of female headed households has increased steadily (Figure 2.2).
Box 2.1: Summary statistics of demographic characteristics, 1995/96 – 2010/11
Nepal Living Standards Survey Description
1995/96 2003/04 2010/11
Percent of population (0-14 years) 42.4 39.6 36.7
Percent of population (15-59 years) 50.8 52.8 54.2
Percent of population (60 years and above) 6.8 7.6 9.1
Sex ratio (number of males per 100 females) 95.5 92.3 85.6
Dependency ratio 97.0 89.2 84.4
Household size 5.7 5.3 4.9
Percent of households with
1 – 2 persons 9.5 10.8 13.8
3 – 4 persons 25.5 30.1 35.1
5 – 6 persons 33.8 34.8 32.2
7 – 8 persons 19.1 15.3 12.6
9 or more persons 12.2 8.9 6.3
Percent of household head aged
Less than 29 years 14.8 12.6 11.0
30 – 39 years 25.2 24.3 24.7
40 – 49 years 23.8 24.3 23.1
50 – 59 years 17.7 19.4 21.3
60 years and above 18.5 19.4 19.9
Percent of female headed households 13.6 19.6 26.6

23
Table 2.1 : Distribution of population by age and sex groups for urban/rural areas and ecological belts(Percent)
0 -4 5 - 9 10 - 14 15 - 19 20 - 24 25 - 29 30 - 34 35 - 39 40 - 44 45 - 49 50 - 54 55 - 59 60+ TotalNepal
Male 5.4 6.0 6.8 4.9 2.8 2.4 2.3 2.4 2.1 2.1 2.1 1.9 4.6 46.1Female 5.2 6.5 6.7 6.1 4.6 4.1 3.5 3.5 2.8 2.2 2.5 1.9 4.5 53.9Total 10.6 12.6 13.5 11.0 7.4 6.5 5.8 5.9 4.9 4.3 4.6 3.8 9.1 100.0Sex Ratio 104.6 92.7 102.6 81.7 61.9 59.2 66.6 69.9 75.9 95.6 87.1 102.4 101.7 85.6
UrbanMale 4.1 4.8 5.7 6.0 4.1 3.4 3.3 3.1 2.7 2.6 2.3 1.7 3.7 47.4Female 3.9 4.9 5.7 6.2 5.5 4.6 3.9 3.9 3.1 2.8 2.1 1.8 4.2 52.6Total 8.0 9.7 11.4 12.1 9.6 8.0 7.2 7.0 5.8 5.4 4.4 3.5 7.9 100.0Sex Ratio 106.5 99.8 98.7 96.3 74.7 72.9 83.5 80.5 87.3 91.4 108.0 91.7 86.8 90.0
RuralMale 5.7 6.3 7.1 4.7 2.5 2.2 2.1 2.3 2.0 2.0 2.1 2.0 4.8 45.8Female 5.5 6.9 6.9 6.0 4.4 3.9 3.3 3.4 2.7 2.1 2.5 1.9 4.6 54.2Total 11.2 13.2 14.0 10.7 6.9 6.1 5.4 5.7 4.7 4.1 4.7 3.8 9.4 100.0Sex Ratio 104.3 91.5 103.4 78.2 58.2 55.5 61.9 67.1 72.9 96.9 83.0 104.8 105.0 84.6
MountainsMale 6.3 6.5 7.8 4.9 2.5 1.6 2.4 2.2 1.6 2.2 2.0 1.7 5.3 47.0Female 4.9 7.2 7.9 6.4 3.4 3.0 2.9 3.7 2.3 1.7 2.8 2.3 4.5 53.0Total 11.2 13.7 15.7 11.3 5.9 4.6 5.3 5.9 3.9 4.0 4.7 4.0 9.7 100.0Sex Ratio 129.8 89.9 98.9 76.6 72.8 53.7 80.8 58.5 71.8 129.4 70.1 75.7 118.1 88.6
HillsMale 5.0 5.8 6.5 5.0 2.9 2.6 2.2 2.6 2.2 2.2 2.1 1.9 4.8 45.7Female 5.0 6.2 6.5 6.0 4.8 4.2 3.5 3.4 2.9 2.5 2.3 1.9 4.9 54.3Total 10.0 12.0 13.1 11.0 7.8 6.8 5.7 5.9 5.1 4.6 4.4 3.8 9.7 100.0Sex Ratio 99.2 92.7 100.0 84.0 61.1 61.4 63.0 76.0 75.2 87.3 92.3 95.9 96.9 84.3
TaraiMale 5.7 6.2 7.0 4.9 2.8 2.4 2.4 2.4 2.1 2.1 2.2 2.0 4.3 46.3Female 5.3 6.7 6.6 6.1 4.5 4.1 3.5 3.6 2.8 2.1 2.6 1.7 4.2 53.7Total 11.0 12.9 13.6 10.9 7.3 6.4 5.9 5.9 4.9 4.1 4.8 3.7 8.5 100.0Sex Ratio 105.9 93.1 105.6 80.5 61.6 57.8 68.1 66.5 77.0 100.5 85.5 114.1 104.3 86.4
Age groups (Years)
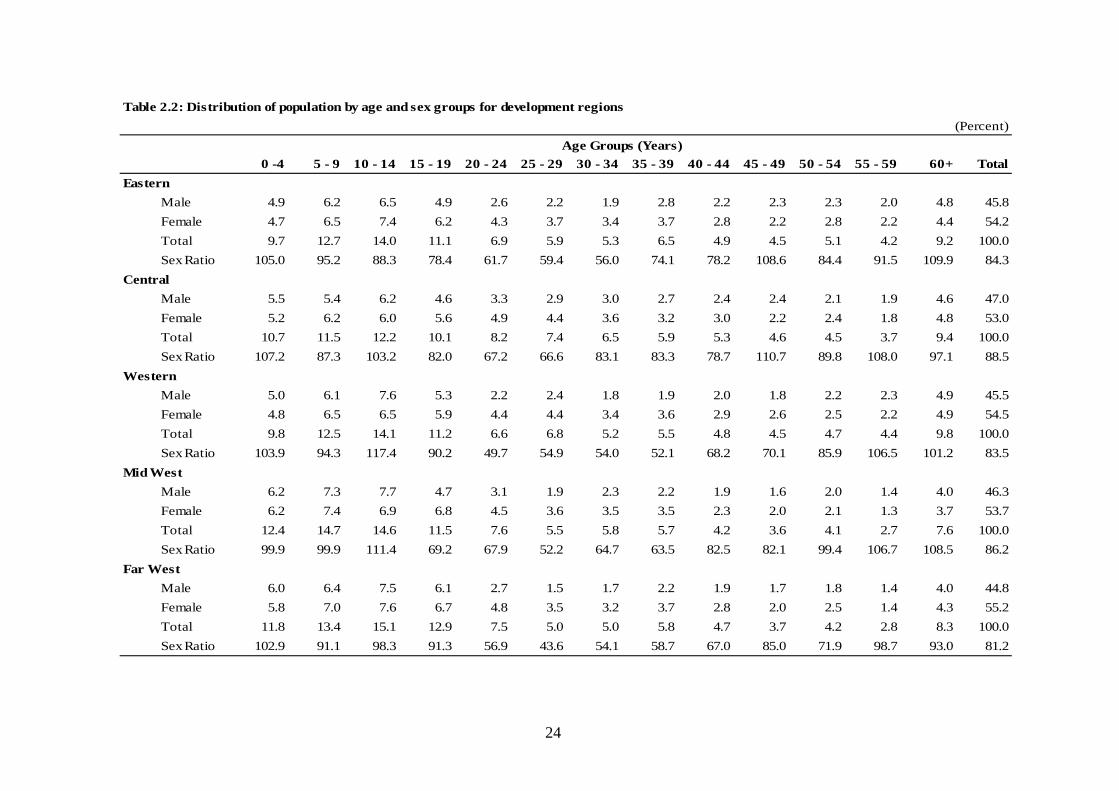
24
Table 2.2: Distribution of population by age and sex groups for development regions(Percent)
0 -4 5 - 9 10 - 14 15 - 19 20 - 24 25 - 29 30 - 34 35 - 39 40 - 44 45 - 49 50 - 54 55 - 59 60+ TotalEastern
Male 4.9 6.2 6.5 4.9 2.6 2.2 1.9 2.8 2.2 2.3 2.3 2.0 4.8 45.8Female 4.7 6.5 7.4 6.2 4.3 3.7 3.4 3.7 2.8 2.2 2.8 2.2 4.4 54.2Total 9.7 12.7 14.0 11.1 6.9 5.9 5.3 6.5 4.9 4.5 5.1 4.2 9.2 100.0Sex Ratio 105.0 95.2 88.3 78.4 61.7 59.4 56.0 74.1 78.2 108.6 84.4 91.5 109.9 84.3
CentralMale 5.5 5.4 6.2 4.6 3.3 2.9 3.0 2.7 2.4 2.4 2.1 1.9 4.6 47.0Female 5.2 6.2 6.0 5.6 4.9 4.4 3.6 3.2 3.0 2.2 2.4 1.8 4.8 53.0Total 10.7 11.5 12.2 10.1 8.2 7.4 6.5 5.9 5.3 4.6 4.5 3.7 9.4 100.0Sex Ratio 107.2 87.3 103.2 82.0 67.2 66.6 83.1 83.3 78.7 110.7 89.8 108.0 97.1 88.5
WesternMale 5.0 6.1 7.6 5.3 2.2 2.4 1.8 1.9 2.0 1.8 2.2 2.3 4.9 45.5Female 4.8 6.5 6.5 5.9 4.4 4.4 3.4 3.6 2.9 2.6 2.5 2.2 4.9 54.5Total 9.8 12.5 14.1 11.2 6.6 6.8 5.2 5.5 4.8 4.5 4.7 4.4 9.8 100.0Sex Ratio 103.9 94.3 117.4 90.2 49.7 54.9 54.0 52.1 68.2 70.1 85.9 106.5 101.2 83.5
Mid WestMale 6.2 7.3 7.7 4.7 3.1 1.9 2.3 2.2 1.9 1.6 2.0 1.4 4.0 46.3Female 6.2 7.4 6.9 6.8 4.5 3.6 3.5 3.5 2.3 2.0 2.1 1.3 3.7 53.7Total 12.4 14.7 14.6 11.5 7.6 5.5 5.8 5.7 4.2 3.6 4.1 2.7 7.6 100.0Sex Ratio 99.9 99.9 111.4 69.2 67.9 52.2 64.7 63.5 82.5 82.1 99.4 106.7 108.5 86.2
Far WestMale 6.0 6.4 7.5 6.1 2.7 1.5 1.7 2.2 1.9 1.7 1.8 1.4 4.0 44.8Female 5.8 7.0 7.6 6.7 4.8 3.5 3.2 3.7 2.8 2.0 2.5 1.4 4.3 55.2Total 11.8 13.4 15.1 12.9 7.5 5.0 5.0 5.8 4.7 3.7 4.2 2.8 8.3 100.0Sex Ratio 102.9 91.1 98.3 91.3 56.9 43.6 54.1 58.7 67.0 85.0 71.9 98.7 93.0 81.2
Age Groups (Years)

25
Table 2.3 : Distribution of population by age and sex groups for analytical domains(Percent)
0 -4 5 - 9 10 - 14 15 - 19 20 - 24 25 - 29 30 - 34 35 - 39 40 - 44 45 - 49 50 - 54 55 - 59 60+ TotalMountains
Male 6.3 6.5 7.8 4.9 2.5 1.6 2.4 2.2 1.6 2.2 2.0 1.7 5.3 47.0Female 4.9 7.2 7.9 6.4 3.4 3.0 2.9 3.7 2.3 1.7 2.8 2.3 4.5 53.0Total 11.2 13.7 15.7 11.3 5.9 4.6 5.3 5.9 3.9 4.0 4.7 4.0 9.7 100.0Sex Ratio 129.8 89.9 98.9 76.6 72.8 53.7 80.8 58.5 71.8 129.4 70.1 75.7 118.1 88.6
Urban-Kathmandu ValleyMale 3.7 4.0 4.0 5.2 5.5 4.5 4.4 3.5 3.7 2.5 2.3 1.7 3.9 48.9Female 3.2 3.6 4.4 5.3 5.9 5.6 4.6 3.7 3.3 2.7 2.1 2.1 4.6 51.1Total 6.9 7.5 8.3 10.6 11.4 10.1 9.0 7.2 6.9 5.2 4.5 3.9 8.5 100.0Sex Ratio 115.5 110.5 91.7 98.3 92.2 79.5 95.7 96.1 112.7 94.3 111.0 83.0 84.4 95.9
Urban-Other HillsMale 3.8 4.9 6.3 6.9 3.6 3.2 2.5 2.9 2.6 2.6 2.1 1.6 3.6 46.5Female 3.6 4.9 6.6 5.9 5.5 4.1 3.9 4.7 2.7 3.0 2.5 1.4 4.7 53.5Total 7.4 9.8 12.9 12.8 9.1 7.4 6.4 7.6 5.3 5.6 4.5 3.0 8.3 100.0Sex Ratio 105.9 99.4 95.0 116.3 65.8 78.7 64.6 61.5 94.3 86.8 84.0 110.8 76.0 86.8
Urban- TaraiMale 4.5 5.5 6.5 6.0 3.5 2.7 2.9 3.0 2.1 2.5 2.3 1.7 3.6 46.8Female 4.4 5.6 6.1 6.9 5.3 4.2 3.5 3.6 3.2 2.8 1.9 1.8 3.8 53.2Total 8.9 11.1 12.6 12.9 8.8 6.9 6.5 6.6 5.3 5.3 4.2 3.5 7.4 100.0Sex Ratio 102.0 97.1 105.7 87.2 65.9 63.6 82.9 84.3 66.7 90.5 124.0 92.2 94.9 88.1
Rural Hills - Eastern Male 4.3 6.2 7.2 4.9 2.5 2.4 1.4 2.8 2.2 2.3 2.5 2.1 5.6 46.4Female 4.7 6.3 7.8 6.2 3.9 3.2 3.0 3.3 3.2 2.2 2.7 2.2 4.9 53.6Total 9.0 12.5 15.1 11.2 6.4 5.5 4.4 6.1 5.4 4.5 5.2 4.3 10.4 100.0Sex Ratio 91.5 99.5 92.4 78.8 63.4 75.3 46.3 83.7 67.3 105.0 93.6 97.4 114.9 86.6
Rural Hills - CentralMale 5.2 5.0 6.4 4.3 2.8 3.0 2.3 3.0 2.1 2.6 1.8 1.9 4.9 45.4Female 5.1 6.5 6.5 6.5 5.3 4.4 3.6 2.5 3.3 2.4 1.8 2.0 4.7 54.6Total 10.3 11.5 12.9 10.7 8.1 7.5 5.9 5.4 5.4 5.1 3.7 3.9 9.6 100.0Sex Ratio 101.0 76.4 98.6 65.9 53.5 69.0 63.6 120.1 64.6 108.9 100.4 95.5 103.8 83.0
(continued..)

26
Table 2.3 : Distribution of population by age and sex groups for analytical domains(Percent)
0 -4 5 - 9 10 - 14 15 - 19 20 - 24 25 - 29 30 - 34 35 - 39 40 - 44 45 - 49 50 - 54 55 - 59 60+ TotalRural Hills- Western
Male 5.4 6.2 7.6 5.3 1.6 1.8 1.4 1.8 1.8 1.8 2.1 2.5 5.9 44.9Female 4.9 6.6 6.0 5.5 4.3 4.3 3.3 3.6 2.8 2.9 2.4 2.5 5.8 55.1Total 10.3 12.8 13.6 10.8 5.9 6.1 4.7 5.4 4.7 4.7 4.5 5.0 11.7 100.0Sex Ratio 109.0 93.2 127.2 94.7 36.3 40.9 41.4 48.6 64.1 60.6 85.9 100.0 103.2 81.6
Rural Hills - Mid & Far WesternMales 6.4 7.4 6.8 4.6 2.9 1.6 2.0 2.1 1.6 1.5 2.0 1.2 3.9 44.1Female 7.2 7.8 7.6 6.3 4.5 3.8 3.0 3.3 2.4 1.8 2.3 1.3 4.5 55.9Total 13.6 15.3 14.5 10.9 7.4 5.4 5.0 5.3 4.0 3.3 4.3 2.6 8.5 100.0Sex Ratio 88.2 95.1 89.4 74.2 64.8 42.8 66.3 64.0 68.6 81.6 85.3 92.0 86.8 79.0
Rural Tarai- EasternMale 5.3 6.1 6.3 4.8 2.8 2.0 1.9 2.6 2.1 2.4 2.4 1.9 4.7 45.4Female 4.8 6.8 7.3 5.9 4.1 3.7 3.9 3.9 2.6 2.1 2.8 2.1 4.4 54.6Total 10.2 13.0 13.7 10.7 7.0 5.8 5.8 6.5 4.6 4.5 5.3 4.0 9.0 100.0Sex Ratio 110.4 89.8 86.1 80.2 67.9 55.0 48.6 66.3 78.9 118.4 86.2 91.2 105.8 83.1
Rural Tarai - CentralMale 7.0 6.4 6.6 4.1 2.7 2.4 2.7 2.3 2.2 1.9 2.1 2.1 4.9 47.3Female 6.4 7.1 5.8 5.0 4.4 4.2 3.2 3.4 2.5 1.6 2.8 1.6 4.7 52.7Total 13.4 13.5 12.4 9.0 7.1 6.6 5.9 5.6 4.7 3.5 4.9 3.7 9.6 100.0Sex Ratio 108.0 91.2 113.8 82.1 62.3 57.3 84.6 67.9 89.8 117.5 72.6 133.5 102.3 89.9
Rural Tarai - WesternMale 4.9 6.4 8.2 5.0 2.3 2.8 2.0 1.7 1.9 1.9 2.2 2.3 4.1 45.8Female 5.2 6.8 7.8 6.3 4.2 4.4 2.9 3.2 2.9 2.1 2.7 1.8 3.9 54.2Total 10.1 13.2 16.0 11.3 6.6 7.3 4.9 4.8 4.8 4.0 4.9 4.0 8.0 100.0Sex Ratio 95.4 95.1 105.4 78.6 54.6 63.8 69.2 52.1 65.6 92.6 81.5 127.9 103.9 84.4
Rural Tarai - Mid & Far WesternMale 5.4 6.7 8.4 5.3 2.5 1.9 2.1 2.0 2.2 1.5 2.0 1.7 3.9 45.7Female 5.1 7.0 6.6 7.4 5.0 3.9 3.9 3.7 2.9 2.2 2.3 1.1 3.2 54.3Total 10.5 13.7 15.0 12.7 7.5 5.8 6.1 5.7 5.2 3.6 4.3 2.8 7.1 100.0Sex Ratio 107.1 96.8 126.2 72.2 51.3 49.1 53.8 54.3 75.2 67.2 84.4 149.0 121.8 84.1

27
Table 2.4: Distribution of population by broad age groups and dependency ratio
(Percent)
Males Females
Development Region
Eastern 36.3 23.2 31.2 9.2 83.7
Central 34.3 25.3 31.0 9.4 77.7
Western 36.4 21.9 31.9 9.8 85.9
Mid West 41.7 21.1 29.6 7.6 97.2
Far West 40.3 21.0 30.5 8.3 94.2
Ecological Zone
Mountains 40.5 21.2 28.6 9.7 101.0
Hills 35.1 23.7 31.5 9.7 81.2
Tarai 37.5 23.1 30.8 8.5 85.3
Urban/Rural
Urban 29.1 29.0 33.9 7.9 58.8
Rural 38.5 21.9 30.3 9.4 91.7
Analytical Domain
Mountains 40.5 21.2 28.6 9.7 101.0
Urban-Kathmandu Valley 22.8 33.4 35.3 8.5 45.5
Urban-Other Hills 30.1 27.9 33.7 8.3 62.3
Urban- Tarai 32.6 26.8 33.2 7.4 66.7
Rural Hills- Eastern 36.6 23.1 29.9 10.4 88.8
Rural Hills- Central 34.6 23.9 31.8 9.6 79.4
Rural Hills- Western 36.6 19.9 31.8 11.7 93.5
Rural Hills- Mid & Far Western 43.3 19.6 28.6 8.5 107.4
Rural Tarai- Eastern 36.8 22.9 31.2 9.0 84.7
Rural Tarai- Central 39.3 22.5 28.6 9.6 95.6
Rural Tarai- Western 39.3 22.1 30.6 8.0 89.8
Rural Tarai - Mid & Far Western 39.2 21.2 32.5 7.1 86.2
Nepal 36.7 23.2 31.0 9.1 84.4
15 - 59 years00 - 14 years
60 years and older
Dependency Ratio

28
Table 2.5: Average household size and its distribution by size category
1- 2 3 - 4 5 - 6 7 - 89 &
more Total
Development Region
Eastern 4.8 13.4 35.5 33.0 12.4 5.7 100.0
Central 4.8 13.8 35.7 31.5 12.3 6.7 100.0
Western 4.6 17.8 35.9 30.2 10.8 5.4 100.0
Mid West 5.2 9.6 32.7 35.0 15.1 7.6 100.0
Far West 5.0 11.5 33.8 33.1 14.9 6.7 100.0
Ecological Zone
Mountains 4.9 13.3 34.6 31.4 13.8 6.9 100.0
Hills 4.5 16.0 37.6 31.4 11.3 3.7 100.0
Tarai 5.2 11.6 32.7 33.1 13.7 9.0 100.0
Urban/Rural
Urban 4.4 16.2 41.7 29.0 9.0 4.1 100.0
Rural 5.0 13.2 33.4 33.0 13.5 6.9 100.0
Analytical Domain
Mountains 4.9 13.3 34.6 31.4 13.8 6.9 100.0
Urban-Kathmandu Valley 4.1 18.3 47.7 25.1 6.3 2.7 100.0
Urban-Other Hills 4.2 18.3 41.6 29.4 8.1 2.5 100.0
Urban- Tarai 4.8 13.3 36.9 31.8 11.8 6.1 100.0
Rural Hills- Eastern 4.7 13.1 34.9 33.5 15.1 3.4 100.0
Rural Hills- Central 4.6 14.2 37.8 31.8 11.8 4.4 100.0
Rural Hills- Western 4.2 20.9 37.5 30.4 9.4 1.9 100.0
Rural Hills- Mid & Far Western 5.1 11.0 29.5 36.5 16.3 6.8 100.0
Rural Tarai- Eastern 4.9 13.5 35.0 33.3 11.5 6.7 100.0
Rural Tarai- Central 5.6 10.2 26.3 34.7 16.7 12.1 100.0
Rural Tarai- Western 5.7 9.7 28.8 32.8 15.3 13.5 100.0
Rural Tarai - Mid & Far Western 5.0 10.1 38.8 31.7 12.5 6.9 100.0
Nepal 4.9 13.8 35.1 32.2 12.6 6.3 100.0
Household Size groups (Percent)Household Size
(Persons)

29
Table 2.6: Age and sex of household head(Percent)
<=19 Years
20 - 29 Years
30 - 39 Years
40 - 49 Years
50 - 59 Years
60 and + Years
Total
Development Region
Eastern 24.4 0.7 8.4 24.3 23.7 22.8 20.0 100.0
Central 21.3 0.6 9.9 24.9 23.5 21.0 20.2 100.0
Western 34.3 1.1 9.9 22.2 22.6 22.5 21.7 100.0
Mid West 28.5 1.0 11.9 28.7 21.2 19.8 17.5 100.0
Far West 34.5 1.6 12.9 25.6 24.2 18.2 17.6 100.0
Ecological Zone
Mountains 23.5 1.0 7.8 25.9 20.8 20.9 23.6 100.0
Hills 28.7 1.1 12.3 23.5 23.1 19.7 20.4 100.0
Tarai 24.9 0.6 8.1 25.9 23.5 23.1 18.8 100.0
Urban/Rural
Urban 27.1 1.2 12.1 26.6 25.0 19.4 15.6 100.0
Rural 26.5 0.8 9.5 24.2 22.6 21.8 21.0 100.0
Analytical Domain
Mountains 23.5 1.0 7.8 25.9 20.8 20.9 23.6 100.0
Urban-Kathmandu Valley 23.3 1.5 16.2 24.3 23.8 17.8 16.4 100.0
Urban-Other Hills 34.6 1.6 11.2 27.3 26.9 18.4 14.6 100.0
Urban- Tarai 25.4 0.5 9.3 28.4 24.9 21.3 15.7 100.0
Rural Hills- Eastern 21.8 0.5 10.1 20.6 22.7 22.7 23.4 100.0
Rural Hills- Central 20.9 0.4 12.2 24.0 23.8 18.4 21.2 100.0
Rural Hills- Western 38.9 1.5 10.8 21.0 21.6 21.3 23.8 100.0
Rural Hills - Mid & Far Western 30.7 1.3 13.3 25.2 21.5 19.1 19.5 100.0
Rural Tarai- Eastern 25.7 0.8 6.9 25.8 24.6 23.3 18.5 100.0
Rural Tarai- Central 19.2 0.4 6.6 24.2 22.5 24.6 21.7 100.0
Rural Tarai- Western 24.1 0.0 7.2 21.5 23.6 26.1 21.6 100.0
Rural Tarai - Mid & Far Western 35.0 1.0 12.2 29.7 22.0 19.7 15.4 100.0
Nepal 26.6 0.9 10.1 24.7 23.1 21.3 19.9 100.0
Female Household
Head
Age of Household Head

30
CHAPTER III: HOUSING
3.1 Introduction
Housing primarily concerns with the accommodation in a dwelling or a housing unit. Well being of the population in general depends upon the quality and quantity of housing facilities available in the country. Housing features included in the NLSS-III are: ownership, construction materials, dwelling size and access to utilities and amenities such as electricity, piped water, cooking fuel, use of iodized salt and sanitary facilities.
During a period of the last fifteen years, there have been significant changes in the housing characteristics in Nepal. The quality of housing in terms of the construction materials used in the building has improved over the years. Access to both electricity and telephone has notably increased. Proportion of population using latrine has more than doubled during the same period. Similarly, the proportion of households residing in the rented housing units has increased by some four-folds in the last fifteen years (Box 3.1).
3.2 Occupancy Status
Occupancy status refers to the juridical aspects under which the households occupy the residence. In the survey, housing occupants are broadly categorized into owner, renter, rent-free and others1. Around 90 percent of the households reside in their own housing units, 8 percent are renters (pay rent) and 2 percent live on rent-free housing units (Figure 3.1).
In the hills, 11 percent of the households pay rent whereas in the other two regions about 5 percent each are renters.
Among development regions, the central development region has the highest proportion of households renting dwellings (14 percent) and the far-western development region has the lowest (2 percent).
In urban areas slightly more than one-fourth (26 percent) of households pay rent whereas in rural areas the proportion is only 3 percent. Almost one-half of households in the Kathmandu urban
1 Housing unit occupied by owner's household is termed as owner occupied while that housing unit
for which the occupant actually pays rent is termed as rented-in and the occupant is a renter. Rent-free housing unit is the one that is occupied with permission of the owner without paying any rent to the owner. Housing unit occupied without the consent or knowledge of the house-owner and squatters are reported in the "others" category.

31
areas pay rent but in other urban hills and urban Tarai the proportions are 18 and 15 percent respectively.
Renters account for 20 percent of households from the richest consumption quintile, while the figure is less than 2 percent for bottom two quintiles (Table 3.1).
3.3 Construction Material of Outer Walls
About one half of the households (48 percent) are living in the housing units walled by mud-bonded bricks/stones. Households residing in the housing units with outer walls made of other construction materials include “cement bonded bricks/stones and concrete” (26 percent), "wood and tree branches" (24 percent), and “others” 2 (2 percent).
The proportion of households occupying housing units structured with “cement bonded bricks/stones and concrete” outer walls is 61 percent in urban areas while it is 17 percent in rural areas. Among the urban areas, urban Kathmandu valley has the highest proportion (76 percent) as compared to the other urban hills and the Tarai urban areas where the corresponding figures are 48 and 59 percent respectively. On the other hand, less than 10 percent of households have housing units with outer walls made of “cement bonded bricks/stones and concrete” in the following rural areas – the mid and far western, the eastern and the western hills and the mountains
There is a direct association between quality of dwelling walls and household consumption. Richer households are more likely to wall their housing units with either cement/concrete or cement bonded bricks/stones while poorer households tend to wall them with mud bonded bricks/stones, wood/branches and other materials (Table 3.2).
3.4 Materials for Roofing
About 30 percent of households in Nepal are living in the buildings and structures roofed over with tile or slate. Households residing in housing units with more durable roofing materials like galvanized sheet and concrete are 28 and 20 percent, respectively. On the other hand, the proportion of households residing in housing units roofed with straw/thatch is 18 percent. Roughly 3 percent of the total households in the country are housed in living structures using “other” roofing materials earth, mud, wood, plank, etc. (Table 3.3).
The use of galvanized sheet is highest in the eastern (45 percent) followed by the western region (40 percent). Tile/slate is more prevalent in the central (37 percent) and the far-western (75 percent) regions while use of straw/thatch is more common in the mid-western development region (33 percent).
In the urban areas of the Kathmandu valley, around three-fourth of the households live in concrete roofed houses whereas the proportion is just about one half in the urban areas taken together. The
2 "Other" category includes the structures with no outer walls, structures walled with un-baked bricks,
and other makeshift houses.
32
story is different in the rural areas of the country, except for the rural-western Tarai, the proportion of households occupying housing units roofed over with concrete is comparatively lower in other rural areas.
The proportion of households living in buildings roofed over with concrete and galvanized sheet is significantly high in the top quintile compared with the lower quintiles. However, except for the richest quintile, however, there is not much difference among the consumption quintiles with respect to the use of "tile and slate" on the roofs of housing units. Not surprisingly, the proportion of households living in structures roofed with straw or thatch is less than 3 percent for the richest quintile.
3.5 Materials for Foundation
The construction materials of the foundation provide an indicator for the structural acceptability of the buildings. This is related to the safety and well being of the occupants.
Almost one in two (49 percent) households is residing in buildings or structures with foundation made of mud bonded bricks/stones. Percentages of households residing in buildings with foundations made up of more durable construction materials like cement bonded bricks/stones and concrete pillars are 14 and 13 percent respectively. About 21 percent of the total households in the country are living in houses whose foundation is wooden pillars. About 3 percent of the total households in the country are living in structures whose underground base has “other” construction materials (earth, mud, wood, etc.).
Structures with foundation of mud bonded bricks/stones are higher in the mountains region (86 percent) compared with the hills region (68 percent) and the Tarai region (28 percent). The highest proportion (38 percent) of households in the Tarai region resides in structures whose foundation is wooden pillars.
In rural areas, majority of the households (54.4 percent) have mud bounded foundation whereas concrete pillars are more common in urban areas.
Except for the richest households in the country, the majority of the households live in buildings and structures with mud bonded bricks/stones foundation. In other words, apart from the richest households in the country, there is not much difference in the construction material of the foundation in the structures occupied by the poor and the rich (Table 3.4).
There is a clear association between quality of construction materials used in the foundation of dwelling and household consumption quintiles.
3.6 Number of Rooms, Area of Dwelling and Housing Plot
The degree of crowding in a household is measured by the number of persons per habitable area or number of rooms. Density of occupancy in terms of the area of dwelling is another measure of the adequacy of housing. Area of housing plot consists of the land on which the dwelling is located.
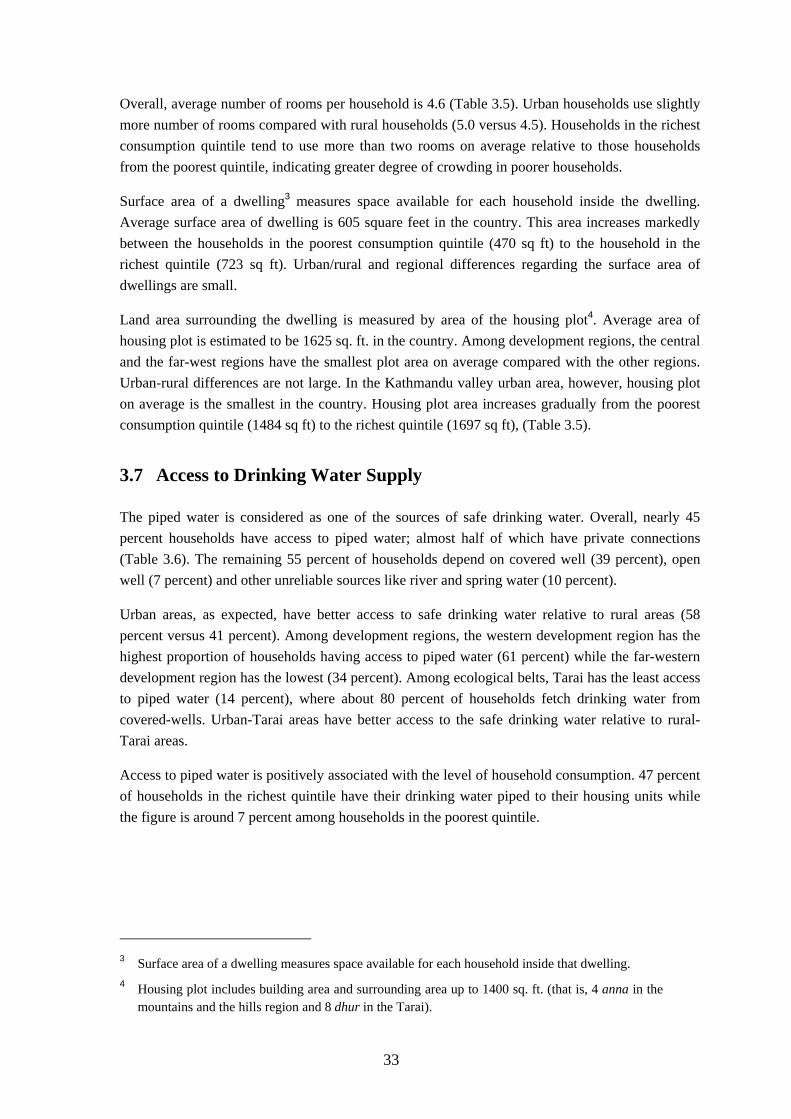
33
Overall, average number of rooms per household is 4.6 (Table 3.5). Urban households use slightly more number of rooms compared with rural households (5.0 versus 4.5). Households in the richest consumption quintile tend to use more than two rooms on average relative to those households from the poorest quintile, indicating greater degree of crowding in poorer households.
Surface area of a dwelling3 measures space available for each household inside the dwelling. Average surface area of dwelling is 605 square feet in the country. This area increases markedly between the households in the poorest consumption quintile (470 sq ft) to the household in the richest quintile (723 sq ft). Urban/rural and regional differences regarding the surface area of dwellings are small.
Land area surrounding the dwelling is measured by area of the housing plot4. Average area of housing plot is estimated to be 1625 sq. ft. in the country. Among development regions, the central and the far-west regions have the smallest plot area on average compared with the other regions. Urban-rural differences are not large. In the Kathmandu valley urban area, however, housing plot on average is the smallest in the country. Housing plot area increases gradually from the poorest consumption quintile (1484 sq ft) to the richest quintile (1697 sq ft), (Table 3.5).
3.7 Access to Drinking Water Supply
The piped water is considered as one of the sources of safe drinking water. Overall, nearly 45 percent households have access to piped water; almost half of which have private connections (Table 3.6). The remaining 55 percent of households depend on covered well (39 percent), open well (7 percent) and other unreliable sources like river and spring water (10 percent).
Urban areas, as expected, have better access to safe drinking water relative to rural areas (58 percent versus 41 percent). Among development regions, the western development region has the highest proportion of households having access to piped water (61 percent) while the far-western development region has the lowest (34 percent). Among ecological belts, Tarai has the least access to piped water (14 percent), where about 80 percent of households fetch drinking water from covered-wells. Urban-Tarai areas have better access to the safe drinking water relative to rural-Tarai areas.
Access to piped water is positively associated with the level of household consumption. 47 percent of households in the richest quintile have their drinking water piped to their housing units while the figure is around 7 percent among households in the poorest quintile.
3 Surface area of a dwelling measures space available for each household inside that dwelling. 4 Housing plot includes building area and surrounding area up to 1400 sq. ft. (that is, 4 anna in the
mountains and the hills region and 8 dhur in the Tarai).

34
3.8 Access to Household Utilities and Amenities
Household utilities and amenities covered in the survey are – drinking water, electricity, telephone, sanitary syatem, garbage disposal and latrine. Access to household utilities and amenities is improving over the years (Figure 3.2).
On the whole, 70 percent of the households have access to electricity in their dwellings (Table 3.7). An overwhelming majority of households (96 percent) in urban areas have access to electricity in their dwelling while the corresponding figure for rural households is 63 percent. Almost all households in the urban areas of the Kathmandu valley are found to have access to electricity but the corresponding figure is 21 percent for the rural- mid and far western hill areas. Access to electricity in the dwelling is gradually increases from the poorest quintile (42 percent) to the richest quintile (94 percent).
On average, 13 percent of the households have access to land line telephone facility in the country. As expected, the access to telephone distribution is highly pro-urban and pro-rich.
About 19 percent of the households have access to sanitary (sewerage) system in the country. It is concentrated in urban areas (56 percent), mostly in the urban-Kathmandu valley (98 percent) and the richest quintile (44 percent).
Access to garbage disposal facility is worse than the sanitary system. Only 10 percent of the households in Nepal have garbage collection/disposal facility. Urban-rural and rich-poor gaps are even more severe.
Overall, 56 percent of households have access to latrine facilities. Other households have no proper latrine facilities and they are bound to defecate in open places. Disparities between urban/rural areas as well as consumption quintile groups are very wide.
3.9 Main Fuel Used for Cooking
Firewood is the primary fuel used for cooking food in most part of the country. Overall, 64 percent of households use firewood as their main source of cooking fuel. Other fuels used for cooking are: LPG (18 percent), cow-dung/leaves (14 percent), and “other” fuels (4 percent).
LPG is the main fuel in urban areas (59 percent), particularly in the Kathmandu valley urban area (93 percent). Most of the rural areas households' main fuel for cooking is firewood while a

35
significant proportion of Tarai households tend to use “cow-dung/leaves/straw/thatch”. Across consumption quintiles, use of LPG and kerosene as main cooking fuel is very pro-rich whereas fire-wood and “cow-dung/leaves/straw/thatch” as pro-poor (Table 3.8).
3.10 Households that Used and Collected Firewood
Apart from the primary source of cooking fuel, firewood is used for other purposes such as heating the house (and preparing animal feed). About 84 percent of the households in the country use firewood for cooking and other purposes. Around 77 percent of these percent of these firewood-user households collect it themselves. As expected, use and collection of firewood is less prevalent in urban households compared to their rural counterparts (Table 3.9).
3.11 Place of Firewood Collection
Overall, 65 percent of households rely on forest for the collection of their firewood: community managed forest (44 percent) and government forest (21 percent). Other places of firewood collection include own land (24 percent) and unspecified place (11 percent). Community managed forest as the primary place of firewood collection is more prevalent in the rural-mid and far western Tarai. Richer households are more likely to use their own land forest for this purpose, while poorer households resort to government forest and unspecified sources. Differences in the collection of firewood from community managed forest are not significant among the consumption quintiles.
3.12 Stove Used for Cooking
Type of stove used for cooking is related to the issue of indoor pollution and the quality of life. More than one half (52 percent) of the households in the country use mud-stove for cooking purposes, followed by kerosene/gas stove (21 percent), open fire-place (22 percent), and smokeless stove (3 percent).
62 percent of urban areas households use gas stove and 58 percent of rural areas households use mud stove for cooking. Most of the households (92 percent) of the urban-Kathmandu valley use gas stove for cooking. Richest households are more likely to use gas stove (61 percent) while poorer households use mud stove (62 percent) for cooking.
3.13 Fodder Collection
Roughly, 70 percent of country’s households collect fodder for their livestock. Around 57 percent of these households collect their fodder from their own land, followed by forest (23 percent) in which the share of community managed forest is 17 percent. On the other hand, 20 percent of households get their fodder from other unspecified place. Not surprisingly, collector households from richer households are more likely to collect their fodder from their own land (Table 3.12).

36
3.14 Use of Iodized Salt
An additional question was asked in NLSS 2010/11 about the type of salt and iodine content in salt used by households. Iodine deficiency is associated with several health disorders – mental retardation, risks of stillbirth and miscarriage, and incidence of goiter. Iodization of salt is a key strategy for achieving the goal of eliminating iodine deficiency. According to the WHO recommendation, the required level of iodization is 15 parts per million (ppm) or more.
About 59 percent of households use packet salt with a logo of “two children” recommended by the government. About 22 percent of the households use rock salt, followed by powder salt (18 percent).
Around 72 percent of households use salt having the recommended level of iodization. 20 percent of households use salt that contains less than 15 ppm of iodine. The remaining 8 percent use salt that have no iodine at all.
The percentage of households using un-iodized salt is the highest in rural- mid and far western hill (22 percent), followed by rural- eastern hill (16 percent) and rural- mid and far western Tarai (13 percent). Among consumption quintiles, use of packet salt (recommended by the government) and containing 15 or more ppm is pro-rich (Tables 3.13 and 3.14).
Box 3.1: Summary statistics of household characteristics
Nepal Living Standards Survey Description 1995/96 2003/04 2010/11
Percent of households who reside in their own housing units
93.8 91.6 89.7
Percent of households occupying housing units for rent
2.2 5.4 7.8
Average size of dwelling (sq. ft.) 604 531 605
Percent of households living in structures with
Cement bonded walls 10.7 18.3 26.1
Concrete roof 11.2 13.6 20.3
Galvanized sheet roof 5.75.7 21.0 28.4
Cement bonded foundation - -- 13.0
Percent of households with access to piped water 32.8 43.9 44.5
Percent of households with access to electricity 14.1 37.2 69.9
Percent of households with access to telephone 1.0 6.1 12.5
Percent of households with own toilet facility 21.6 38.7 56.0
Percent of households using packet salt (with a logo of two child)
- - 59.4
Percent of households using salt containing 15 ppm or more iodine
- - 72.3
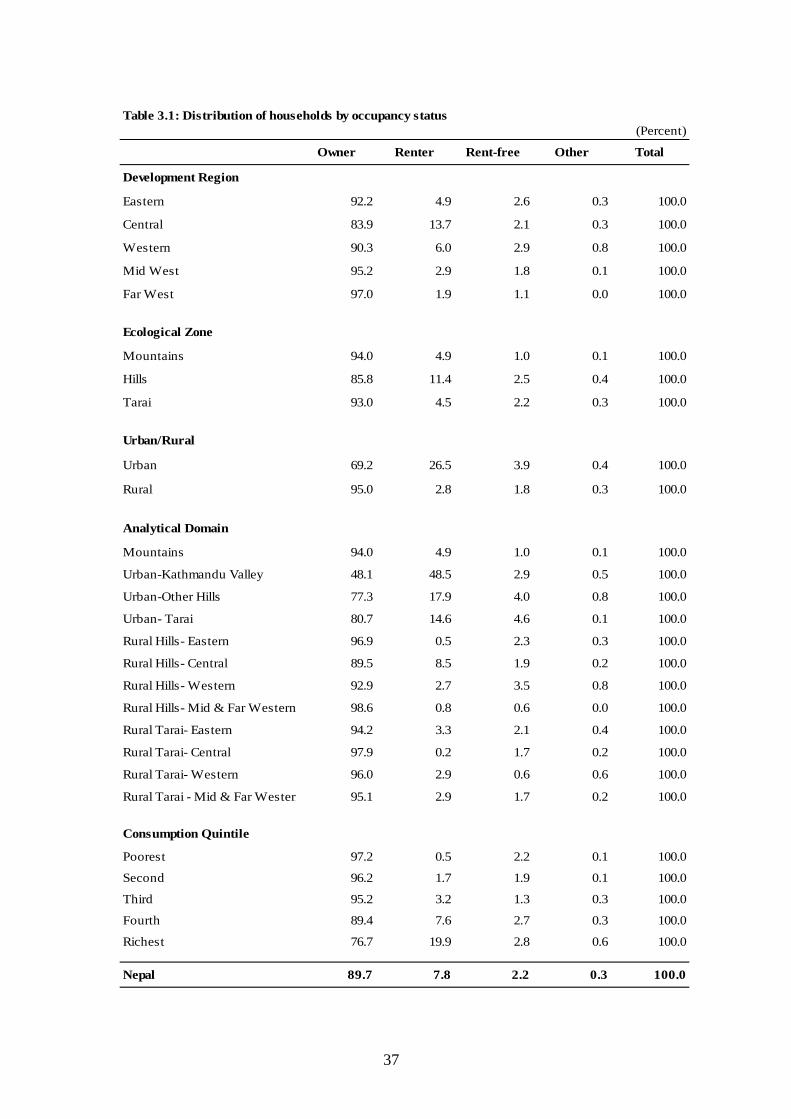
37
Table 3.1: Distribution of households by occupancy status(Percent)
Owner Renter Rent-free Other Total
Development Region
Eastern 92.2 4.9 2.6 0.3 100.0
Central 83.9 13.7 2.1 0.3 100.0
Western 90.3 6.0 2.9 0.8 100.0
Mid West 95.2 2.9 1.8 0.1 100.0
Far West 97.0 1.9 1.1 0.0 100.0
Ecological Zone
Mountains 94.0 4.9 1.0 0.1 100.0
Hills 85.8 11.4 2.5 0.4 100.0
Tarai 93.0 4.5 2.2 0.3 100.0
Urban/Rural
Urban 69.2 26.5 3.9 0.4 100.0
Rural 95.0 2.8 1.8 0.3 100.0
Analytical Domain
Mountains 94.0 4.9 1.0 0.1 100.0
Urban-Kathmandu Valley 48.1 48.5 2.9 0.5 100.0
Urban-Other Hills 77.3 17.9 4.0 0.8 100.0
Urban- Tarai 80.7 14.6 4.6 0.1 100.0
Rural Hills- Eastern 96.9 0.5 2.3 0.3 100.0
Rural Hills- Central 89.5 8.5 1.9 0.2 100.0
Rural Hills- Western 92.9 2.7 3.5 0.8 100.0
Rural Hills- Mid & Far Western 98.6 0.8 0.6 0.0 100.0
Rural Tarai- Eastern 94.2 3.3 2.1 0.4 100.0
Rural Tarai- Central 97.9 0.2 1.7 0.2 100.0
Rural Tarai- Western 96.0 2.9 0.6 0.6 100.0
Rural Tarai - Mid & Far Western 95.1 2.9 1.7 0.2 100.0
Consumption Quintile
Poorest 97.2 0.5 2.2 0.1 100.0
Second 96.2 1.7 1.9 0.1 100.0
Third 95.2 3.2 1.3 0.3 100.0
Fourth 89.4 7.6 2.7 0.3 100.0
Richest 76.7 19.9 2.8 0.6 100.0
Nepal 89.7 7.8 2.2 0.3 100.0
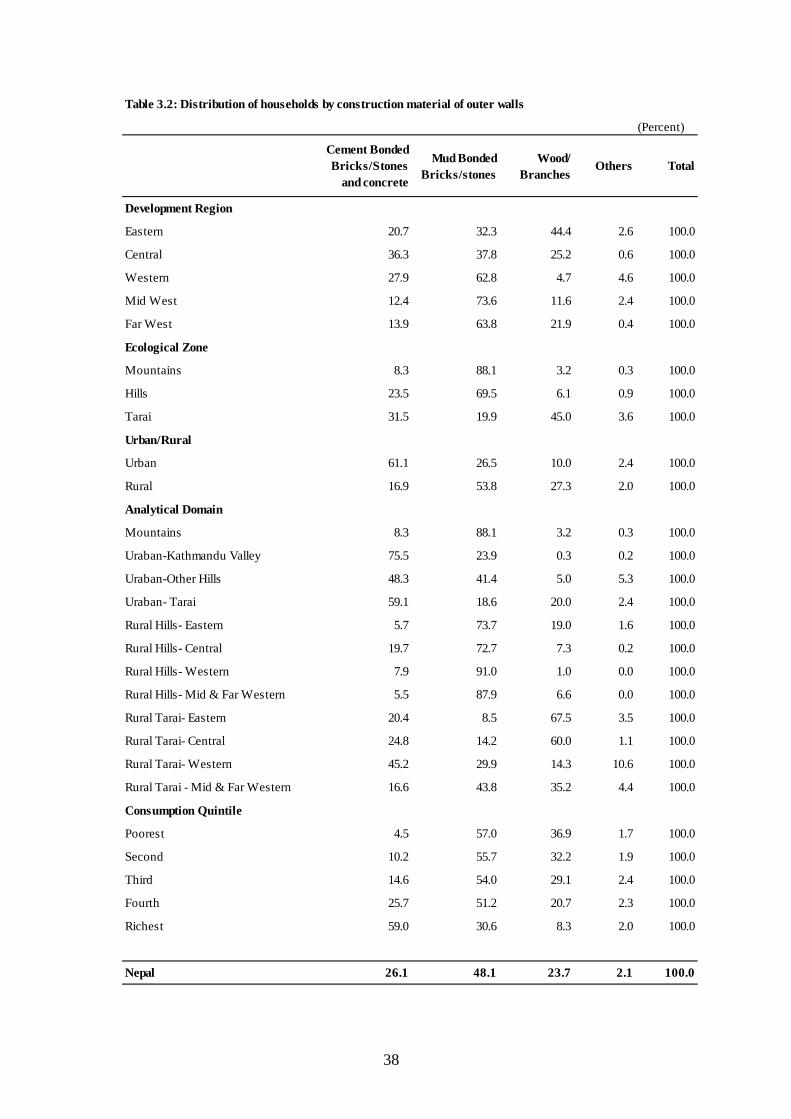
38
Table 3.2: Distribution of households by construction material of outer walls
(Percent)
Cement Bonded Bricks/Stones
and concrete
Mud Bonded Bricks/stones
Wood/ Branches
Others Total
Development Region
Eastern 20.7 32.3 44.4 2.6 100.0
Central 36.3 37.8 25.2 0.6 100.0
Western 27.9 62.8 4.7 4.6 100.0
Mid West 12.4 73.6 11.6 2.4 100.0
Far West 13.9 63.8 21.9 0.4 100.0
Ecological Zone
Mountains 8.3 88.1 3.2 0.3 100.0
Hills 23.5 69.5 6.1 0.9 100.0
Tarai 31.5 19.9 45.0 3.6 100.0
Urban/Rural
Urban 61.1 26.5 10.0 2.4 100.0
Rural 16.9 53.8 27.3 2.0 100.0
Analytical Domain
Mountains 8.3 88.1 3.2 0.3 100.0
Uraban-Kathmandu Valley 75.5 23.9 0.3 0.2 100.0
Uraban-Other Hills 48.3 41.4 5.0 5.3 100.0
Uraban- Tarai 59.1 18.6 20.0 2.4 100.0
Rural Hills- Eastern 5.7 73.7 19.0 1.6 100.0
Rural Hills- Central 19.7 72.7 7.3 0.2 100.0
Rural Hills- Western 7.9 91.0 1.0 0.0 100.0
Rural Hills- Mid & Far Western 5.5 87.9 6.6 0.0 100.0
Rural Tarai- Eastern 20.4 8.5 67.5 3.5 100.0
Rural Tarai- Central 24.8 14.2 60.0 1.1 100.0
Rural Tarai- Western 45.2 29.9 14.3 10.6 100.0
Rural Tarai - Mid & Far Western 16.6 43.8 35.2 4.4 100.0
Consumption Quintile
Poorest 4.5 57.0 36.9 1.7 100.0
Second 10.2 55.7 32.2 1.9 100.0
Third 14.6 54.0 29.1 2.4 100.0
Fourth 25.7 51.2 20.7 2.3 100.0
Richest 59.0 30.6 8.3 2.0 100.0
Nepal 26.1 48.1 23.7 2.1 100.0

39
Table 3.3: Distribution of households by construction material of roof(Percent)
Straw/ Thatch
Galvanized Sheet
Concrete Tile/ Slate
Others Total
Development Region
Eastern 32.1 44.7 8.8 11.7 2.7 100.0
Central 9.8 21.0 29.4 37.3 2.5 100.0
Western 12.0 39.9 27.3 19.8 1.1 100.0
Mid West 33.3 15.3 11.2 28.2 12.1 100.0
Far West 6.4 6.6 10.9 75.4 0.7 100.0
Ecological Zone
Mountains 18.8 21.1 5.8 34.1 20.2 100.0
Hills 20.1 33.1 19.9 24.1 2.8 100.0
Tarai 15.8 24.8 23.0 35.3 1.1 100.0
Urban/Rural
Urban 3.4 31.0 52.2 12.4 1.0 100.0
Rural 21.9 27.8 11.9 34.6 3.9 100.0
Analytical Domain
Mountains 18.8 21.1 5.8 34.1 20.2 100.0
Urban-Kathmandu Valley 0.8 22.1 74.2 2.1 0.8 100.0
Urban-Other Hills 2.7 44.9 37.7 13.9 0.8 100.0
Urban- Tarai 4.9 28.9 45.2 19.8 1.3 100.0
Rural Hills- Eastern 49.9 39.0 1.0 5.9 4.1 100.0
Rural Hills- Central 14.9 33.0 17.6 31.1 3.4 100.0
Rural Hills- Western 17.5 51.5 3.2 26.1 1.7 100.0
Rural Hills- Mid & Far Western 32.2 7.1 4.7 50.6 5.5 100.0
Rural Tarai- Eastern 27.7 51.0 6.3 14.7 0.4 100.0
Rural Tarai- Central 13.7 5.9 13.9 64.8 1.7 100.0
Rural Tarai- Western 8.6 17.0 56.5 17.3 0.6 100.0
Rural Tarai - Mid & Far Western 20.0 17.8 12.2 48.3 1.7 100.0
Consumption Quintile
Poorest 34.5 14.5 4.8 39.8 6.3 100.0
Second 28.8 22.9 6.4 38.6 3.2 100.0
Third 21.5 29.4 9.4 35.9 3.7 100.0
Fourth 12.9 38.7 15.7 29.4 3.2 100.0
Richest 2.6 30.9 51.3 14.0 1.1 100.0
Nepal 18.1 28.4 20.3 29.9 3.3 100.0

40
Table 3.4: Distribution of households by construction material of foundation
(Percent)
Concrete pillar
Cement bonded
brick/stone
Mud bonded brick/stone
Wood pillar
Others Total
Development Region
Eastern 10.3 10.7 33.1 41.0 4.9 100.0
Central 18.2 18.5 39.2 20.2 3.9 100.0
Western 15.4 12.9 62.4 5.5 3.7 100.0
Mid West 6.3 7.6 73.0 12.3 0.8 100.0
Far West 2.4 12.8 64.0 20.7 0.0 100.0
Ecological Zone
Mountains 3.6 4.3 85.8 5.5 0.8 100.0
Hills 13.1 11.0 67.7 7.5 0.7 100.0
Tarai 14.3 17.9 23.3 37.9 6.6 100.0
Urban/Rural
Urban 35.2 26.3 26.8 9.5 2.2 100.0
Rural 7.1 10.4 54.4 24.3 3.7 100.0
Analytical Domain
Mountains 3.6 4.3 85.8 5.5 0.8 100.0
Urban-Kathmandu Valley 44.7 30.4 24.1 0.2 0.6 100.0
Urban-Other Hills 32.3 16.4 43.0 7.6 0.6 100.0
Urban- Tarai 30.2 29.7 18.4 17.3 4.4 100.0
Rural Hills- Eastern 1.8 4.7 68.0 23.4 2.1 100.0
Rural Hills- Central 9.5 11.2 69.4 9.6 0.2 100.0
Rural Hills- Western 3.4 4.8 88.7 2.5 0.6 100.0
Rural Hills- Mid & Far Western 1.7 5.0 87.7 5.3 0.2 100.0
Rural Tarai- Eastern 8.8 11.8 14.5 58.6 6.3 100.0
Rural Tarai- Central 10.0 15.8 20.3 44.4 9.4 100.0
Rural Tarai- Western 19.9 25.0 29.8 14.6 10.6 100.0
Rural Tarai - Mid & Far Western 7.1 11.3 44.7 35.6 1.3 100.0
Consumption Quintile
Poorest 0.4 5.3 58.3 32.9 3.2 100.0
Second 2.4 8.9 56.4 27.0 5.3 100.0
Third 5.0 9.9 54.8 25.8 4.6 100.0
Fourth 9.9 16.0 52.0 18.9 3.2 100.0
Richest 36.6 23.0 30.1 8.9 1.5 100.0
Nepal 13.0 13.7 48.7 21.2 3.4 100.0

41
Table 3.5: Average number of rooms and average size of dwelling
Average number of
rooms
Average size of dwelling
(Sq. Ft.)
Average area of housing
plot (Sq. Ft.)
Development Region
Eastern 4.7 596.4 1,736.9
Central 4.5 655.8 1,477.5
Western 4.9 611.8 1,748.8
Mid West 4.5 558.6 1,732.3
Far West 4.2 466.3 1,495.4
Ecological Zone
Mountains 4.6 650.8 1,599.0
Hills 4.7 607.0 1,646.8
Tarai 4.5 595.8 1,607.3
Urban/Rural
Urban 5.0 571.3 1,472.0
Rural 4.5 613.9 1,665.9
Analytical Domain
Mountains 4.6 650.8 1,599.0
Urban-Kathmandu Valley 4.8 555.4 1,223.7
Urban-Other Hills 5.3 557.9 1,626.5
Urban- Tarai 5.0 589.0 1,571.7
Rural Hills- Eastern 4.8 628.1 1,850.1
Rural Hills- Central 4.3 705.4 1,640.0
Rural Hills- Western 4.7 619.3 1,808.2
Rural Hills- Mid & Far Western 4.5 534.6 1,642.5
Rural Tarai- Eastern 4.4 581.9 1,691.6
Rural Tarai- Central 4.3 641.1 1,475.6
Rural Tarai- Western 4.8 611.5 1,676.4
Rural Tarai - Mid & Far Western 4.1 526.2 1,709.8
Consumption Quintile
Poorest 3.4 469.7 1,483.6
Second 3.9 551.9 1,560.2
Third 4.3 606.6 1,647.0
Fourth 4.8 603.4 1,674.2
Richest 5.8 722.9 1,696.9
Nepal 4.6 605.0 1,625.4

42
Table 3.6: Distribution of households by source of drinking water
(Percent)
Piped to house
Piped outside House
Covered well Open well Other Total
Development Region
Eastern 21.0 13.6 52.6 6.0 6.8 100.0
Central 25.7 18.8 40.2 7.0 8.3 100.0
Western 25.7 35.6 25.0 7.9 5.8 100.0
Mid West 11.0 32.3 29.0 10.2 17.6 100.0
Far West 10.0 23.9 38.3 3.7 24.1 100.0
Ecological Zone
Mountains 21.9 45.4 0.0 3.9 28.8 100.0
Hills 32.6 37.9 3.9 9.5 16.1 100.0
Tarai 9.8 4.2 80.3 5.0 0.7 100.0
Urban/Rural
Urban 49.3 8.6 31.6 3.6 6.8 100.0
Rural 14.1 26.8 40.4 8.0 10.7 100.0
Analytical Domain
Mountains 21.9 45.4 0.0 3.9 28.8 100.0
Urban-Kathmandu Valley 67.8 4.2 10.1 4.0 14.0 100.0
Urban-Other Hills 60.3 20.9 7.1 5.9 5.8 100.0
Urban- Tarai 28.3 4.6 64.0 2.0 1.1 100.0
Rural Hills- Eastern 31.2 37.1 6.0 10.6 15.1 100.0
Rural Hills- Central 25.7 41.8 3.5 12.0 16.9 100.0
Rural Hills- Western 20.9 57.4 0.0 12.6 9.1 100.0
Rural Hills- Mid & Far Western 12.3 45.9 1.2 8.4 32.2 100.0
Rural Tarai- Eastern 8.1 1.7 84.4 5.1 0.8 100.0
Rural Tarai- Central 0.6 4.4 87.9 6.7 0.4 100.0
Rural Tarai- Western 11.2 5.3 81.5 2.0 0.0 100.0
Rural Tarai - Mid & Far Western 5.8 6.7 78.8 8.0 0.7 100.0
Consumption Quintile
Poorest 6.6 26.8 40.5 9.9 16.2 100.0
Second 8.5 27.1 44.5 7.7 12.2 100.0
Third 10.9 26.2 45.0 7.9 10.0 100.0
Fourth 21.5 24.5 39.5 6.4 8.1 100.0
Richest 47.2 14.3 27.6 4.8 6.1 100.0
Nepal 21.5 23.0 38.5 7.0 9.9 100.0
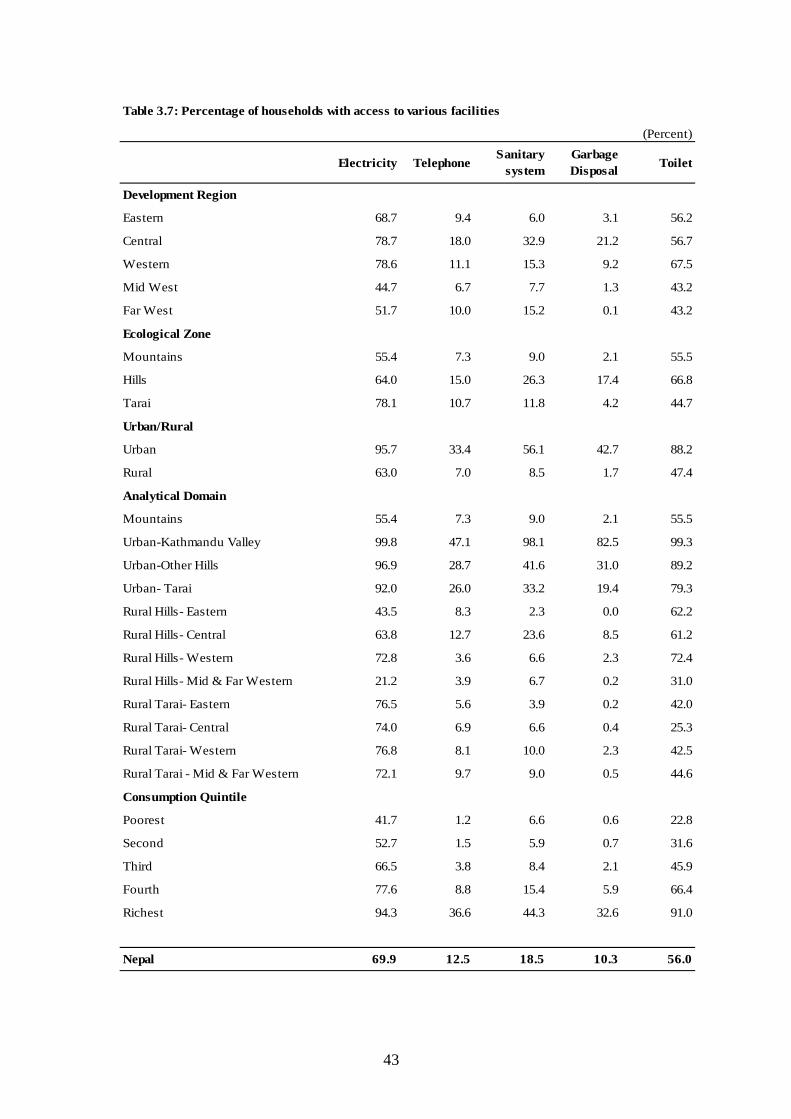
43
Table 3.7: Percentage of households with access to various facilities
(Percent)
Electricity TelephoneSanitary
systemGarbage Disposal Toilet
Development Region
Eastern 68.7 9.4 6.0 3.1 56.2
Central 78.7 18.0 32.9 21.2 56.7
Western 78.6 11.1 15.3 9.2 67.5
Mid West 44.7 6.7 7.7 1.3 43.2
Far West 51.7 10.0 15.2 0.1 43.2
Ecological Zone
Mountains 55.4 7.3 9.0 2.1 55.5
Hills 64.0 15.0 26.3 17.4 66.8
Tarai 78.1 10.7 11.8 4.2 44.7
Urban/Rural
Urban 95.7 33.4 56.1 42.7 88.2
Rural 63.0 7.0 8.5 1.7 47.4
Analytical Domain
Mountains 55.4 7.3 9.0 2.1 55.5
Urban-Kathmandu Valley 99.8 47.1 98.1 82.5 99.3
Urban-Other Hills 96.9 28.7 41.6 31.0 89.2
Urban- Tarai 92.0 26.0 33.2 19.4 79.3
Rural Hills- Eastern 43.5 8.3 2.3 0.0 62.2
Rural Hills- Central 63.8 12.7 23.6 8.5 61.2
Rural Hills- Western 72.8 3.6 6.6 2.3 72.4
Rural Hills- Mid & Far Western 21.2 3.9 6.7 0.2 31.0
Rural Tarai- Eastern 76.5 5.6 3.9 0.2 42.0
Rural Tarai- Central 74.0 6.9 6.6 0.4 25.3
Rural Tarai- Western 76.8 8.1 10.0 2.3 42.5
Rural Tarai - Mid & Far Western 72.1 9.7 9.0 0.5 44.6
Consumption Quintile
Poorest 41.7 1.2 6.6 0.6 22.8
Second 52.7 1.5 5.9 0.7 31.6
Third 66.5 3.8 8.4 2.1 45.9
Fourth 77.6 8.8 15.4 5.9 66.4
Richest 94.3 36.6 44.3 32.6 91.0
Nepal 69.9 12.5 18.5 10.3 56.0

44
Table 3.8: Distribution of households by main fuel used for cooking
(Percent)
WoodCowdung/leaves/
straw/thatch LPG KeroseneOther fuels Total
Development Region
Eastern 61.4 24.2 10.7 0.1 3.6 100.0
Central 51.5 15.5 29.0 1.0 3.0 100.0
Western 64.4 10.7 18.5 0.3 6.1 100.0
Mid West 89.5 0.9 6.0 0.2 3.4 100.0
Far West 91.3 1.0 3.9 0.6 3.2 100.0
Ecological Zone
Mountains 92.6 0.6 5.1 0.9 0.9 100.0
Hills 71.7 0.7 23.9 0.7 3.0 100.0
Tarai 52.6 28.9 13.1 0.3 5.2 100.0
Urban/Rural
Urban 30.2 4.7 58.8 1.7 4.6 100.0
Rural 73.5 15.9 6.8 0.2 3.6 100.0
Analytical Domain
Mountains 92.6 0.6 5.1 0.9 0.9 100.0
Urban-Kathmandu Valley 2.4 0.8 92.8 3.5 0.5 100.0
Urban-Other Hills 43.5 0.6 46.3 1.0 8.5 100.0
Urban- Tarai 42.4 10.2 40.8 0.8 5.7 100.0
Rural Hills- Eastern 98.2 0.8 0.5 0.0 0.5 100.0
Rural Hills- Central 75.9 1.3 19.6 0.4 2.7 100.0
Rural Hills- Western 88.3 0.4 5.7 0.0 5.6 100.0
Rural Hills- Mid & Far Western 97.2 0.4 2.0 0.0 0.4 100.0
Rural Tarai- Eastern 43.4 43.3 8.1 0.0 5.2 100.0
Rural Tarai- Central 54.2 39.6 2.7 0.2 3.3 100.0
Rural Tarai- Western 42.9 36.8 13.6 0.3 6.3 100.0
Rural Tarai - Mid & Far Western 86.7 0.8 5.5 0.0 7.0 100.0
Consumption Quintile
Poorest 79.9 19.7 0.1 0.0 0.3 100.0
Second 75.7 22.5 0.5 0.1 1.2 100.0
Third 75.2 17.6 2.8 0.2 4.2 100.0
Fourth 69.7 12.0 12.1 0.7 5.5 100.0
Richest 34.9 2.2 55.8 1.1 6.0 100.0
Nepal 64.4 13.6 17.7 0.5 3.8 100.0

45
Table 3.9: Percentage of households using and collecting firewood
Household using firewood
Firewood user household collecting
firewood
Development Region
Eastern 88.8 76.1
Central 71.4 66.2
Western 85.8 79.1
Mid West 97.1 88.7
Far West 96.7 90.2
Ecological Zone
Mountains 94.5 94.7
Hills 79.5 91.1
Tarai 86.4 60.3
Urban/Rural
Urban 51.7 52.2
Rural 92.1 80.5
Analytical Domain
Mountains 94.5 94.7
Urban-Kathmandu Valley 10.0 22.8
Urban-Other Hills 67.7 68.3
Urban- Tarai 73.2 45.9
Rural Hills- Eastern 100.0 97.4
Rural Hills- Central 83.4 91.2
Rural Hills- Western 96.4 94.6
Rural Hills- Mid & Far Western 99.6 96.7
Rural Tarai- Eastern 86.7 66.6
Rural Tarai- Central 90.3 52.7
Rural Tarai- Western 83.5 53.0
Rural Tarai - Mid & Far Western 97.8 83.6
Consumption Quintile
Poorest 95.2 89.7
Second 93.1 84.4
Third 93.6 79.4
Fourth 89.1 74.2
Richest 58.1 56.4
Nepal 83.7 76.9

46
Table 3.10: Distribution of firewood collecting households by place of firewood collection
(Percent)
Own landCommunity
managee forest
Government forest Other Total
Development Region
Eastern 29.0 44.6 8.9 17.4 100.0
Central 23.5 34.2 27.5 14.7 100.0
Western 36.3 38.3 16.8 8.6 100.0
Mid West 9.6 54.6 33.0 2.8 100.0
Far West 11.3 60.7 24.4 3.7 100.0
Ecological Zone
Mountains 18.0 46.4 32.5 3.0 100.0
Hills 28.4 46.1 21.0 4.5 100.0
Tarai 18.8 40.4 18.6 22.2 100.0
Urban/Rural
Urban 26.1 41.9 11.1 20.9 100.0
Rural 23.7 44.3 22.2 9.9 100.0
Analytical Domain
Mountains 18.0 46.4 32.5 3.0 100.0
Urban-Kathmandu Valley 50.0 4.9 10.3 34.8 100.0
Urban-Other Hills 34.8 47.6 11.6 5.9 100.0
Urban- Tarai 17.9 37.8 11.2 33.2 100.0
Rural Hills- Eastern 34.4 50.0 7.5 8.0 100.0
Rural Hills- Central 26.5 42.8 28.2 2.5 100.0
Rural Hills- Western 38.3 40.6 15.0 6.2 100.0
Rural Hills- Mid & Far Western 11.6 53.0 34.7 0.6 100.0
Rural Tarai- Eastern 21.6 41.3 12.7 24.4 100.0
Rural Tarai- Central 22.4 16.4 28.8 32.3 100.0
Rural Tarai- Western 27.2 28.2 26.4 18.1 100.0
Rural Tarai - Mid & Far Western 7.9 74.0 14.2 3.8 100.0
Consumption Quintile
Poorest 13.3 44.8 26.4 15.5 100.0
Second 17.8 43.8 24.8 13.6 100.0
Third 24.6 44.4 22.6 8.4 100.0
Fourth 26.6 45.5 17.2 10.7 100.0
Richest 44.2 40.1 12.0 3.7 100.0
Nepal 23.9 44.1 21.2 10.9 100.0
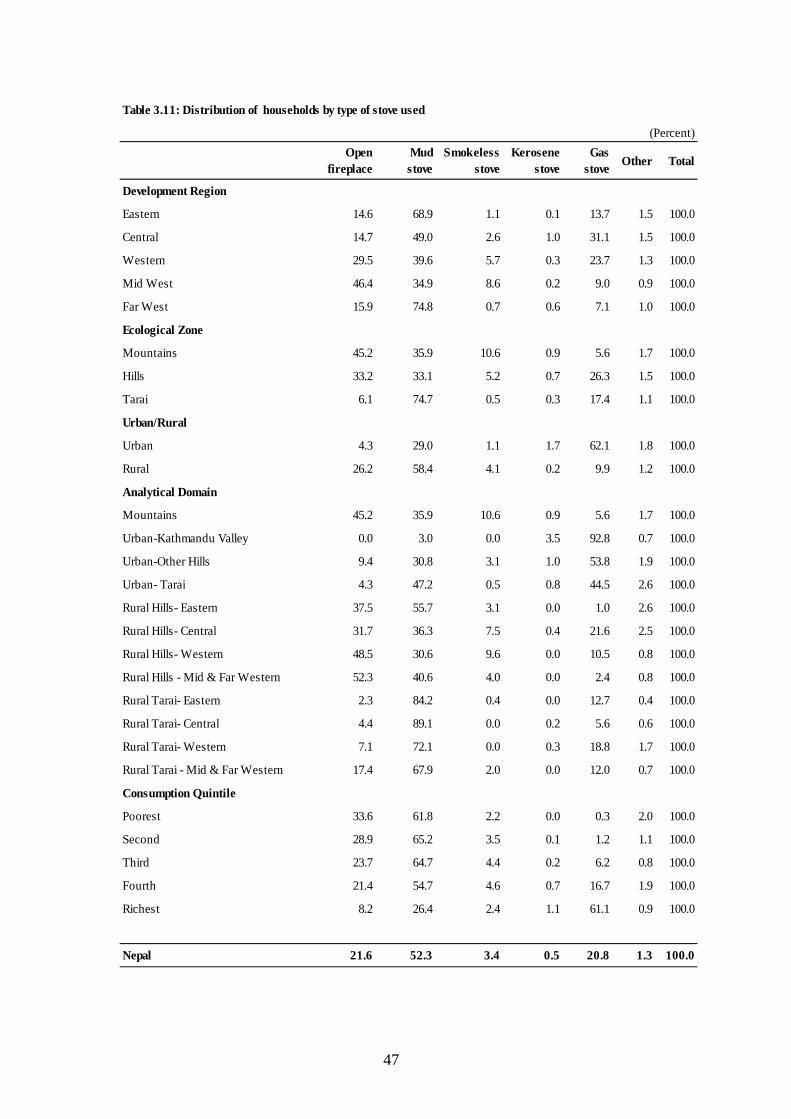
47
Table 3.11: Distribution of households by type of stove used
(Percent)Open
fireplaceMud stove
Smokeless stove
Kerosene stove
Gas stove Other Total
Development Region
Eastern 14.6 68.9 1.1 0.1 13.7 1.5 100.0
Central 14.7 49.0 2.6 1.0 31.1 1.5 100.0
Western 29.5 39.6 5.7 0.3 23.7 1.3 100.0
Mid West 46.4 34.9 8.6 0.2 9.0 0.9 100.0
Far West 15.9 74.8 0.7 0.6 7.1 1.0 100.0
Ecological Zone
Mountains 45.2 35.9 10.6 0.9 5.6 1.7 100.0
Hills 33.2 33.1 5.2 0.7 26.3 1.5 100.0
Tarai 6.1 74.7 0.5 0.3 17.4 1.1 100.0
Urban/Rural
Urban 4.3 29.0 1.1 1.7 62.1 1.8 100.0
Rural 26.2 58.4 4.1 0.2 9.9 1.2 100.0
Analytical Domain
Mountains 45.2 35.9 10.6 0.9 5.6 1.7 100.0
Urban-Kathmandu Valley 0.0 3.0 0.0 3.5 92.8 0.7 100.0
Urban-Other Hills 9.4 30.8 3.1 1.0 53.8 1.9 100.0
Urban- Tarai 4.3 47.2 0.5 0.8 44.5 2.6 100.0
Rural Hills- Eastern 37.5 55.7 3.1 0.0 1.0 2.6 100.0
Rural Hills- Central 31.7 36.3 7.5 0.4 21.6 2.5 100.0
Rural Hills- Western 48.5 30.6 9.6 0.0 10.5 0.8 100.0
Rural Hills - Mid & Far Western 52.3 40.6 4.0 0.0 2.4 0.8 100.0
Rural Tarai- Eastern 2.3 84.2 0.4 0.0 12.7 0.4 100.0
Rural Tarai- Central 4.4 89.1 0.0 0.2 5.6 0.6 100.0
Rural Tarai- Western 7.1 72.1 0.0 0.3 18.8 1.7 100.0
Rural Tarai - Mid & Far Western 17.4 67.9 2.0 0.0 12.0 0.7 100.0
Consumption Quintile
Poorest 33.6 61.8 2.2 0.0 0.3 2.0 100.0
Second 28.9 65.2 3.5 0.1 1.2 1.1 100.0
Third 23.7 64.7 4.4 0.2 6.2 0.8 100.0
Fourth 21.4 54.7 4.6 0.7 16.7 1.9 100.0
Richest 8.2 26.4 2.4 1.1 61.1 0.9 100.0
Nepal 21.6 52.3 3.4 0.5 20.8 1.3 100.0

48
Table 3.12: Fodder collection by households (Percent)
Own land Community forest
Government forest Other Total
Development Region
Eastern 77.7 53.9 15.8 2.0 28.2 100.0Central 56.7 43.2 16.1 9.2 31.5 100.0Western 72.1 70.5 13.5 4.3 11.7 100.0Mid West 81.7 63.1 20.8 12.5 3.7 100.0Far West 85.1 67.0 20.2 9.6 3.2 100.0Ecological Zone
Mountains 85.0 62.2 21.4 13.7 2.6 100.0Hills 70.1 66.3 19.5 9.2 5.0 100.0Tarai 68.1 45.8 12.5 3.0 38.7 100.0Urban/Rural
Urban 27.3 58.0 14.4 2.3 25.3 100.0Rural 81.5 56.8 16.8 7.2 19.2 100.0Analytical Domain
Mountains 85.0 62.2 21.4 13.7 2.6 100.0Urban-Kathmandu Valley 0.9 75.0 12.2 12.8 0.0 100.0Urban-Other Hills 45.2 64.1 18.3 4.1 13.4 100.0Urban- Tarai 36.2 52.9 10.9 0.8 35.4 100.0Rural Hills- Eastern 93.8 68.0 23.6 3.3 5.0 100.0Rural Hills- Central 75.5 53.7 24.0 15.6 6.7 100.0Rural Hills- Western 88.0 73.1 16.2 5.2 5.4 100.0Rural Hills- Mid & Far Western 92.4 69.1 16.6 13.9 0.4 100.0Rural Tarai- Eastern 79.6 44.5 8.6 1.8 45.0 100.0Rural Tarai- Central 73.5 31.2 8.0 4.3 56.5 100.0Rural Tarai- Western 69.2 64.9 7.7 2.9 24.5 100.0Rural Tarai - Mid & Far Western 78.3 56.8 32.2 3.9 7.0 100.0Consumption Quintile
Poorest 86.7 47.6 18.3 11.2 22.9 100.0Second 83.5 53.9 16.6 8.5 21.0 100.0Third 81.9 53.6 16.7 6.9 22.8 100.0Fourth 73.0 61.2 16.9 4.9 17.0 100.0Richest 40.0 71.6 13.7 1.6 13.1 100.0
Nepal 70.2 56.9 16.6 6.8 19.7 100.0
Percentage of households that
collect fodder
Distribution of collector household by place of collection

49
Table 3.13: Distribution of households by type of salt used
(Percent)
Crystal salt
Crushed salt
Two child logo Other Total
Development Region
Eastern 12.6 36.4 50.1 0.9 100.0
Central 14.1 17.0 68.8 0.2 100.0
Western 16.2 7.3 76.4 0.0 100.0
Mid West 52.1 6.4 41.5 0.0 100.0
Far West 55.7 12.4 31.8 0.1 100.0
Ecological Zone
Mountains 48.1 15.0 36.9 0.0 100.0
Hills 30.5 6.7 62.7 0.0 100.0
Tarai 10.0 30.0 59.4 0.6 100.0
Urban/Rural
Urban 5.0 8.4 86.3 0.3 100.0
Rural 27.0 20.4 52.3 0.3 100.0
Analytical Domain
Mountains 48.1 15.0 36.9 0.0 100.0
Urban-Kathmandu Valley 1.4 0.7 97.8 0.1 100.0
Urban-Other Hills 6.4 5.2 88.4 0.0 100.0
Urban- Tarai 6.6 15.7 77.2 0.6 100.0
Rural Hills- Eastern 39.8 29.4 30.8 0.0 100.0
Rural Hills- Central 31.9 4.0 64.1 0.0 100.0
Rural Hills- Western 22.5 0.8 76.7 0.0 100.0
Rural Hills- Mid & Far Western 69.0 6.0 25.0 0.0 100.0
Rural Tarai- Eastern 0.8 44.3 53.3 1.6 100.0
Rural Tarai- Central 2.9 39.5 57.1 0.4 100.0
Rural Tarai- Western 13.8 23.8 62.4 0.0 100.0
Rural Tarai - Mid & Far Western 40.9 10.5 48.6 0.0 100.0
Consumption Quintile
Poorest 45.2 22.7 31.4 0.7 100.0
Second 34.3 23.3 42.4 0.1 100.0
Third 25.2 21.8 52.7 0.3 100.0
Fourth 15.8 18.2 65.5 0.4 100.0
Richest 4.0 8.2 87.6 0.1 100.0
Nepal 22.4 17.9 59.4 0.3 100.0

50
Table 3.14: Distribution of households by type of iodized salt used
(Percent)
0 ppm Less than 15 ppm
Greater than 15
ppmTotal
Development Region
Eastern 7.6 26.8 65.6 100.0
Central 4.4 13.4 82.2 100.0
Western 4.6 14.5 81.0 100.0
Mid West 14.0 30.8 55.2 100.0
Far West 19.8 26.4 53.8 100.0
Ecological Zone
Mountains 9.1 25.0 65.9 100.0
Hills 9.3 17.7 72.9 100.0
Tarai 5.7 21.6 72.7 100.0
Urban/Rural
Urban 2.0 5.7 92.3 100.0
Rural 9.2 23.8 67.1 100.0
Analytical Domain
Mountains 9.1 25.0 65.9 100.0
Urban-Kathmandu Valley 0.0 0.8 99.2 100.0
Urban-Other Hills 1.4 6.9 91.7 100.0
Urban- Tarai 3.8 8.8 87.5 100.0
Rural Hills- Eastern 15.9 30.6 53.5 100.0
Rural Hills- Central 9.3 11.5 79.2 100.0
Rural Hills- Western 4.8 13.8 81.4 100.0
Rural Hills- Mid & Far Western 22.2 39.7 38.2 100.0
Rural Tarai- Eastern 5.2 30.1 64.7 100.0
Rural Tarai- Central 3.4 21.8 74.9 100.0
Rural Tarai- Western 6.6 24.7 68.7 100.0
Rural Tarai - Mid & Far Western 13.3 20.5 66.2 100.0
Consumption Quintile
Poorest 13.0 36.2 50.7 100.0
Second 11.8 31.7 56.5 100.0
Third 10.0 22.1 67.9 100.0
Fourth 5.7 15.2 79.1 100.0
Richest 1.6 4.8 93.6 100.0
Nepal 7.7 20.0 72.3 100.0

51
CHAPTER IV: ACCESS TO FACILITIES
4.1 Introduction
NLSS-III has gathered data on Nepali households’ access to different facilities (altogether 24 facilities). Households’ access to a certain facility is measured in terms of time taken for one-way travel to that facility, irrespective of transport mode (foot or vehicle). The shorter is the time taken by a household to reach a facility, the higher is the degree of access.
During a period of the last 15 years, accessibility has improved almost universally for all types of facilities included in the NLSS-I. Changes in the proportion of the number of households within the reach of 30 minutes from a facility are summarized in Box 4.1. Similarly, changes in the proportion of households within the reach of 30 minutes for selected facilities are depicted in Figure 4.1.
4.2 Primary School
95 percent of households in Nepal are within 30 minutes of access to the nearest primary school (Table 4.5). Among the geographical regions, about cent percent of the urban households have primary school within the reach of 30 minutes while in rural areas. This percentage is the smallest for the rural eastern hills (86 percent) which is slightly lower than similar percentage for the rural mid and far western hills ( 87 percent). In the same way, the richest households have lesser mean time (7 minutes) than the poorest households to reach a similar facility (13 minutes), (Table 4.4)
4.3 Health Post/Hospital
About 86 percent of urban households in the country are within 30 minutes of reach to the nearest health post or sub health post whereas the corresponding percentage for rural households is 59. However, only 21 percent of rural households are within 30 minutes reach to such facilities compared to 83 percent urban households (Table 4.1). Mean time taken to reach the nearest health post or sub-health post for rural and urban households are about the same while the time widely differs in case of public hospital or primary health center. For instance, the mean time for urban households is 26 minutes while it is 135 minutes for rural households (Table 4.3).
There seems no significant difference in the access of rural or urban households with respect to health post or sub-health post. However, difference in the access to the government hospital is striking.

52
4.4 Bus Stop
Bus is the most common means of long-distance travel in the country. According to the survey, 66 percent of households are within 30 minutes of reach to the nearest bus stop. For nearly one-fourth of households it takes 30 minutes to 3 hours, and for 10 percent of households, it takes more than 3 hours to reach the nearest bus stop.
Among development regions, the central development region has the best access to bus stop (78 percent of households are within 30 minutes reach) while the far-western development region has the worst access (43 percent of households are within this reach). Also, the mean time taken for urban households to reach a bus stop is much lower (12 minutes) than the time taken for rural households (73 minutes).
There is a striking difference between the accessibility of the poorest households (154 minutes) and the richest households (8 minutes).
4.5 Road Transport
Access to bus stop is conditional upon access to road. Increase in access to road encourages mobility of goods and expands the labor market, which in turn positively affects living standards of people. The survey gathered data on three types of roads: paved road, vehicle passable dirt road and vehicle impassable dirt road (including horse trail).
Overall, slightly more than one half of the households (51 percent) are within the reach of 30 minutes to the nearest paved road. Three out of four households are within the reach of two hours from their home. 80 percent of households, on the other hand, are within the reach of 30 minutes to the nearest vehicle passable dirt road.
Access to the paved road decreases with the household consumption quintiles. Mean time taken by a household in the richest quintile to reach the nearest paved road is 66 minutes and that for a household in the poorest quintile is 253 minutes.
4.6 Police Station, Post Office and Telephone Booth
Access to the post office as well as to the telephone booth is associated with the ease of communication. Overall, 66 percent of households are within 30 minutes of access to the nearest post office. Access to telephone booth is better compared to the post office. Slightly more than 85 percent of households have telephone booth within the reach of 30 minutes. Access to police station is related to the public security in the neighborhood. About 57 percent of households have access to police station within the reach of 30 minutes. One fourth of the households have to travel one hour or more to reach the nearest police station.
Disparities in access to police station and post office across consumption quintiles are striking. However, access to telephone booth across these quintiles is minimal.

53
4.7 Market Center and Haat Bazaar
45 percent of households are within 30 minutes of access to the nearest market center, followed by “30 minutes to one hour” (18 percent), “1-2 hours” (18 percent), and “2 hours and more” (20 percent). Compared to market center, access to Haat bazaar (local market that operates during certain days of the week) is much better: 64 percent of households in the country are within 30 minutes reach to the nearest Haat bazaar.
As expected, rural areas have lesser proportion of households having access to market center and Haat bazzar within the reach of 30 minutes compared to proportion of households in urban areas. For instance, the mean time taken by an urban household to reach the nearest market centre is 19 minutes while the time taken by a rural household is 2 hours and 16 minutes. In rural areas, access to Haat is better compared with market centre (Table 4.3).
4.8 Agriculture Centre (Krishi Kendra)
43 percent of households in Nepal reach the nearest agriculture center within 30 minutes, followed by “30 minutes – one hour” (22 percent), “1-2 hours” (17 percent), and “2 hours and more” (17 percent).
About one in two households in the Tarai, one in three in the hills and one in six households in the mountains region can reach the nearest agriculture center within 30 minutes.
Access in rural areas is worse compared with urban areas. Disparities in the access across consumption quintiles are wide – 70 percent of households in the richest quintile are within the reach of 30 minutes while the comparable figure for the poorest household is only 21 percent. Access to the facility in the urban areas is far better compared with the rural areas.
4.9 Commercial Bank
A commercial bank provides financial services to depositors, borrowers and investors. Access to a commercial bank is rather low in the country. Only 40 percent of households in the country can reach the nearest bank within 30 minutes. For some 44 percent of households, it takes one hour and more. Similarly, only 27 percent of rural households have access to a bank which is extremely lower than the percentage of urban households (89 percent) with

54
the same facility within 30 minutes of time.
There is much disparity among the ecological belts regarding the percentage of households having access to a bank. Tarai region has the highest percentage of households (75 percent) having access to this facility within one hour time whereas the same percentages for the hills and the mountains are 45 and 17 respectively (Table 4.1).
There is also much difference between mean time taken to reach the nearest bank between urban and rural households. The mean time taken for rural households (135 minutes) is about eight times higher than the time taken for urban households (16 minutes).
4.10 Source of Drinking Water
Most accessible facility in the country is the source of drinking water. Almost all (99 percent) of households are within 30 minutes of this source. Access is uniform during both rainy and dry seasons. Further, disparities across geographical regions and consumption quintiles are minimal.
4.11 Cooperatives (Sajha)
Cooperative is an institution that supplies goods (including farming inputs such as fertilizers and seeds) to households. The percentage of households within 30 minutes of access to this facility is 54 in Nepal. 27 percent of households have to travel one hour or more to reach the nearest cooperatives centre.
Access in the urban areas is far better than that in the rural areas. The mean time taken by a household in rural to reach the facility, for example, is 75 minutes whereas it is only 18 minutes for an urban household.
4.12 Internet and Community Library
About 43 percent of the households in Nepal have access to internet facility within the reach of 30 minutes, and 39 percent have access to community library within the same time. In urban areas access to these facilities is far better compared with the access in the rural areas (Table 4.1).
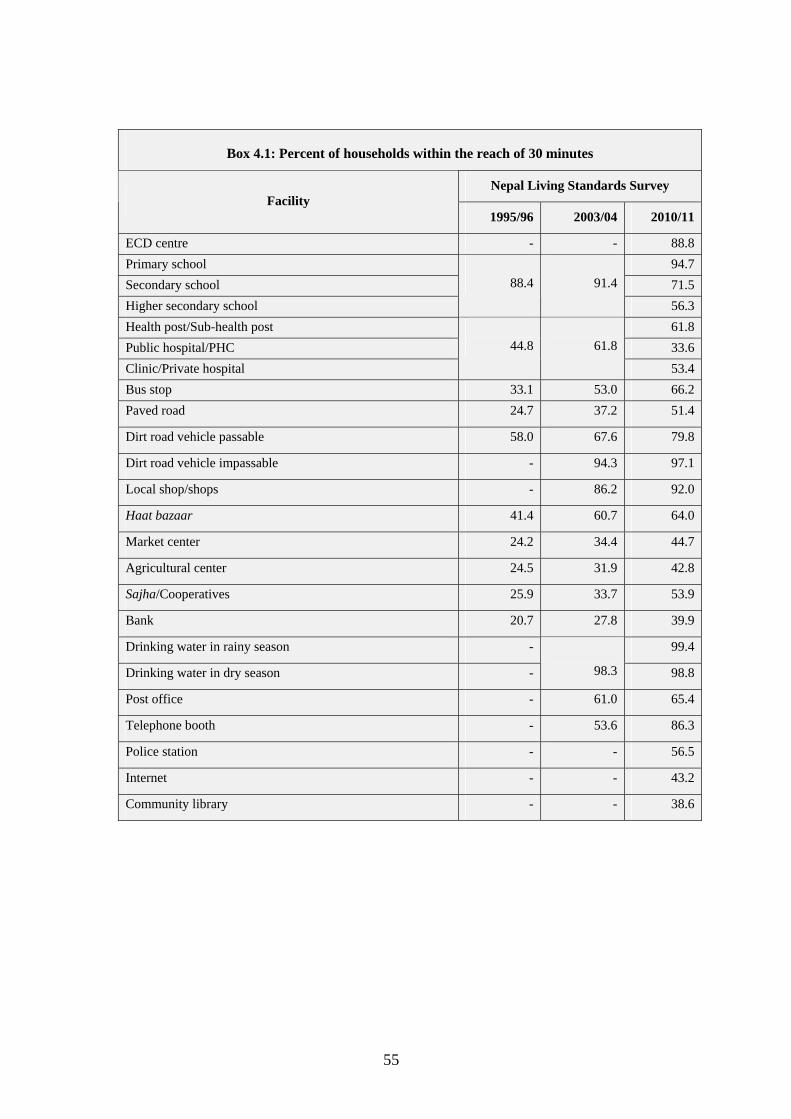
55
Box 4.1: Percent of households within the reach of 30 minutes
Nepal Living Standards Survey Facility
1995/96 2003/04 2010/11
ECD centre - - 88.8 Primary school 94.7 Secondary school 71.5 Higher secondary school
88.4
91.4
56.3 Health post/Sub-health post 61.8 Public hospital/PHC 33.6 Clinic/Private hospital
44.8
61.8
53.4 Bus stop 33.1 53.0 66.2 Paved road 24.7 37.2 51.4
Dirt road vehicle passable 58.0 67.6 79.8
Dirt road vehicle impassable - 94.3 97.1
Local shop/shops - 86.2 92.0
Haat bazaar 41.4 60.7 64.0
Market center 24.2 34.4 44.7
Agricultural center 24.5 31.9 42.8
Sajha/Cooperatives 25.9 33.7 53.9
Bank 20.7 27.8 39.9
Drinking water in rainy season - 99.4
Drinking water in dry season -
98.3 98.8
Post office - 61.0 65.4
Telephone booth - 53.6 86.3
Police station - - 56.5
Internet - - 43.2
Community library - - 38.6

56
Table 4.1: Distribution of households by time taken to reach the nearest facilities for rural & urban Nepal
(Percent)
Up to 30 minutes
30 minutes to 1 hour
1 - 2 hours 2 -3 hours
3 hours & more Total
Urban
ECD Center 97.1 1.9 0.8 0.1 0.1 100.0
Primary School 99.3 0.8 0.0 0.0 0.0 100.0
Secondary school 95.1 3.8 1.1 0.0 0.0 100.0
Higher Secondary School 91.7 6.3 1.8 0.1 0.1 100.0
Health Post/Sub-health Post 85.9 12.2 1.8 0.0 0.1 100.0
Public Hospital/PHC 82.6 11.5 5.3 0.4 0.1 100.0
Clinic/Private Hospital 92.0 5.4 2.3 0.2 0.1 100.0
Bus Stop 93.5 5.4 0.8 0.1 0.2 100.0
Paved Road 94.7 3.2 1.1 0.4 0.6 100.0
Dirt Road, vehicle passable 99.2 0.2 0.6 0.0 0.0 100.0
Dirt Road, vehicle impassable 99.8 0.0 0.2 0.0 0.0 100.0
Local Shop/Shops 99.2 0.5 0.2 0.0 0.0 100.0
Haat Bazaar 87.1 9.4 3.3 0.2 0.0 100.0
Market Center 87.6 8.0 4.0 0.3 0.1 100.0
Agriclture Center 82.8 13.2 3.6 0.3 0.1 100.0
Sajha (Cooperatives) 89.7 7.0 2.6 0.3 0.4 100.0
Bank 89.0 7.2 3.6 0.3 0.0 100.0
Drinking Water, rainy season 99.8 0.2 0.0 0.0 0.0 100.0
Drinking Water, dry season 99.6 0.3 0.0 0.0 0.0 100.0
Post Office 88.0 9.4 2.3 0.1 0.2 100.0
Telephone Booth 97.9 1.6 0.5 0.0 0.1 100.0
Police Station 91.7 6.2 1.9 0.1 0.1 100.0
Internet Facility 89.8 6.6 3.4 0.3 0.1 100.0
Community Liibrary 85.6 10.6 3.5 0.2 0.1 100.0
(continued..)

57
Table 4.1: Distribution of households by time taken to reach the nearest facilities for rural & urban Nepal
(Percent)
Up to 30 minutes
30 minutes to 1 hour 1 - 2 hours 2 -3 hours
3 hours & more Total
Rural
ECD Center 86.9 8.7 3.3 0.4 0.7 100.0
Primary School 93.4 5.3 1.2 0.0 0.1 100.0
Secondary School 65.2 19.4 11.1 2.9 1.4 100.0
Higher Secondary School 47.0 23.5 17.6 6.5 5.5 100.0
Health Post/Sub-health Post 59.0 22.0 14.3 2.8 1.9 100.0
Public Hospital/PHC 20.6 22.5 23.9 11.6 21.5 100.0
Clinic/Private Hospital 43.2 16.6 14.7 8.3 17.3 100.0
Bus Stop 58.8 13.1 10.6 5.4 12.1 100.0
Paved Road 39.4 14.7 15.6 7.1 23.3 100.0
Dirt Road, vehicle passable 77.4 4.3 6.2 3.9 8.2 100.0
Dirt Road, vehicle impassable 96.8 0.9 2.1 0.1 0.1 100.0
Local Shop/Shops 90.1 4.7 3.2 1.4 0.6 100.0
Haat Bazaar 59.6 15.1 12.1 7.9 5.3 100.0
Market Center 33.4 20.5 21.1 11.1 14.0 100.0
Agriclture Center 32.2 24.6 21.1 11.1 11.0 100.0
Sajha (Cooperatives) 44.4 22.0 16.5 7.6 9.5 100.0
Bank 26.9 18.9 20.4 10.8 23.0 100.0
Drinking Water, rainy season 99.4 0.5 0.1 0.1 0.1 100.0
Drinking Water, dry season 98.5 1.2 0.2 0.1 0.1 100.0
Post Office 59.4 18.8 14.9 4.5 2.5 100.0
Telephone Booth 83.2 8.8 4.9 1.8 1.3 100.0
Police Station 47.3 21.0 17.6 9.0 5.2 100.0
Internet Facility 30.9 18.5 19.2 10.3 21.1 100.0
Community Library 26.2 18.4 23.0 10.7 21.7 100.0
(continued..)

58
Table 4.1: Distribution of households by time taken to reach the nearest facilities for rural & urban Nepal
(Percent)
Up to 30 minutes
30 minutes to 1 hour 1 - 2 hours 2 -3 hours
3 hours & more Total
Nepal
ECD Center 88.8 7.4 2.8 0.4 0.6 100.0
Primary School 94.7 4.4 0.9 0.0 0.1 100.0
Secondary School 71.5 16.1 9.0 2.3 1.1 100.0
Higher Secondary School 56.3 19.9 14.3 5.1 4.4 100.0
Health Post/Sub-health Post 61.8 21.0 13.0 2.5 1.7 100.0
Public Hospital/PHC 33.6 20.2 20.0 9.3 17.0 100.0
Clinic/Private Hospital 53.4 14.2 12.1 6.6 13.7 100.0
Bus Stop 66.0 11.5 8.6 4.3 9.6 100.0
Paved Road 51.0 12.3 12.5 5.7 18.5 100.0
Dirt Road, vehicle passable 79.7 3.9 5.6 3.5 7.3 100.0
Dirt Road, vehicle impassable 97.1 0.8 1.9 0.1 0.1 100.0
Local Shop/Shops 92.0 3.8 2.6 1.1 0.5 100.0
Haat Bazaar 64.0 14.2 10.7 6.7 4.4 100.0
Market Center 44.7 17.9 17.5 8.8 11.1 100.0
Agriclture Center 42.8 22.3 17.4 8.9 8.7 100.0
Sajha (Cooperatives) 53.9 18.8 13.6 6.1 7.6 100.0
Bank 39.9 16.5 16.9 8.6 18.2 100.0
Drinking Water, rainy season 99.4 0.4 0.1 0.0 0.1 100.0
Drinking Water, dry season 98.8 1.0 0.2 0.0 0.1 100.0
Post Office 65.4 16.9 12.3 3.5 2.0 100.0
Telephone Booth 86.3 7.3 4.0 1.4 1.1 100.0
Police Station 56.5 17.9 14.3 7.2 4.1 100.0
Internet Facility 43.2 16.0 15.9 8.2 16.7 100.0
Community Library 38.6 16.8 18.9 8.5 17.2 100.0

59
Up to 30 minutes
30 minutes to 1 hour 1 - 2 hours 2 -3 hours 3 hours &
more Total
Poorest
ECD Center 84.5 9.2 4.5 1.1 0.8 100.0
Primary School 90.2 7.8 2.1 0.0 0.0 100.0
Secondary School 56.4 20.3 17.2 3.7 2.4 100.0
Higher Secondary School 34.9 23.9 21.6 11.2 8.4 100.0
Health Post/Sub-health Post 51.4 21.8 19.1 4.4 3.3 100.0
Public Hospital/PHC 15.2 20.3 20.7 13.3 30.5 100.0
Clinic/Private Hospital 33.2 16.3 15.0 11.9 23.6 100.0
Bus Stop 45.0 14.8 15.1 7.0 18.1 100.0
Paved Road 30.5 14.1 16.4 8.7 30.4 100.0
Dirt Road, vehicle passable 68.7 5.3 8.9 3.8 13.3 100.0
Dirt Road, vehicle impassable 95.3 1.1 3.4 0.0 0.2 100.0
Local Shop/Shops 87.0 5.3 4.1 2.0 1.6 100.0
Haat Bazaar 49.7 17.8 11.4 11.8 9.3 100.0
Market Center 24.0 18.2 22.1 14.7 21.0 100.0
Agriclture Center 21.4 23.9 23.2 15.1 16.3 100.0
Sajha (Cooperatives) 31.0 23.5 18.5 11.3 15.8 100.0
Bank 17.0 19.2 18.2 12.7 32.8 100.0
Drinking Water, rainy season 99.2 0.6 0.0 0.0 0.2 100.0
Drinking Water, dry season 97.3 1.9 0.5 0.1 0.2 100.0
Post Office 48.8 19.7 18.5 8.2 4.8 100.0
Telephone Booth 77.9 11.4 5.9 3.1 1.7 100.0
Police Station 36.9 20.5 19.6 14.8 8.3 100.0
Internet Facility 20.5 16.3 18.9 13.3 31.0 100.0
Community Library 15.6 16.2 23.1 13.4 31.7 100.0
(continued..)

60
Table 4.2: Distribution of households by time taken to reach the nearest facilities for consumption quintiles
(Percent)
Up to 30 minutes
30 minutes to 1 hour
1 - 2 hours 2 -3 hours
3 hours & more Total
Second
ECD Center 84.7 10.1 4.1 0.4 0.7 100.0
Primary School 92.5 5.8 1.6 0.0 0.1 100.0
Secondary School 59.9 21.1 14.7 3.1 1.3 100.0
Higher Secondary School 40.6 24.8 21.9 7.3 5.5 100.0
Health Post/Sub-health Post 54.0 24.1 17.6 2.3 2.0 100.0
Public Hospital/PHC 19.9 19.4 25.5 11.8 23.5 100.0
Clinic/Private Hospital 37.9 16.3 16.5 8.4 20.8 100.0
Bus Stop 51.0 16.8 10.9 6.9 14.4 100.0
Paved Road 36.3 15.9 14.8 7.5 25.5 100.0
Dirt Road, vehicle passable 73.1 5.1 6.7 5.0 10.1 100.0
Dirt Road, vehicle impassable 98.2 0.5 1.3 0.0 0.0 100.0
Local Shop/Shops 89.2 5.2 3.4 1.5 0.7 100.0
Haat Bazaar 57.9 16.1 12.0 9.1 4.9 100.0
Market Center 29.6 20.1 23.8 12.0 14.6 100.0
Agriclture Center 29.8 25.1 21.3 12.4 11.4 100.0
Sajha (Cooperatives) 37.9 23.3 18.9 8.9 11.0 100.0
Bank 24.0 17.4 22.6 10.3 25.7 100.0
Drinking Water, rainy season 99.4 0.7 0.0 0.0 0.0 100.0
Drinking Water, dry season 98.2 1.4 0.3 0.0 0.1 100.0
Post Office 55.8 19.8 16.7 5.4 2.3 100.0
Telephone Booth 80.9 9.4 6.0 2.0 1.7 100.0
Police Station 43.5 21.7 19.5 10.1 5.3 100.0
Internet Facility 27.7 17.9 20.5 10.3 23.6 100.0
Community Library 23.2 18.2 25.8 9.9 22.9 100.0
(continued..)

61
Table 4.2: Distribution of households by time taken to reach the nearest facilities for consumption quintiles
(Percent)
Up to 30 minutes
30 minutes to 1 hour
1 - 2 hours 2 -3 hours
3 hours & more Total
Third
ECD Center 87.9 8.5 2.8 0.2 0.7 100.0
Primary School 93.8 5.2 0.9 0.2 0.0 100.0
Secondary School 65.8 20.5 9.3 2.8 1.6 100.0
Higher Secondary School 47.5 23.8 17.8 5.2 5.7 100.0
Health Post/Sub-health Post 56.8 23.9 13.9 3.4 2.0 100.0
Public Hospital/PHC 24.0 21.4 23.9 11.0 19.8 100.0
Clinic/Private Hospital 44.0 19.6 13.9 7.0 15.6 100.0
Bus Stop 60.5 13.8 10.6 4.1 11.1 100.0
Paved Road 40.8 16.2 14.4 5.9 22.7 100.0
Dirt Road, vehicle passable 80.1 3.7 5.2 3.8 7.2 100.0
Dirt Road, vehicle impassable 96.0 1.3 2.3 0.2 0.2 100.0
Local Shop/Shops 89.9 5.1 3.1 1.5 0.4 100.0
Haat Bazaar 63.2 13.8 11.6 6.6 4.8 100.0
Market Center 33.7 21.7 21.6 9.6 13.4 100.0
Agriclture Center 32.9 26.3 19.9 10.6 10.4 100.0
Sajha (Cooperatives) 43.6 24.0 17.5 6.5 8.4 100.0
Bank 27.5 20.5 20.5 10.6 21.0 100.0
Drinking Water, rainy season 99.1 0.6 0.2 0.1 0.0 100.0
Drinking Water, dry season 98.6 1.2 0.0 0.1 0.0 100.0
Post Office 58.1 20.3 15.9 3.8 2.0 100.0
Telephone Booth 83.7 8.3 5.1 1.6 1.3 100.0
Police Station 48.2 21.3 17.6 7.4 5.6 100.0
Internet Facility 32.5 20.0 19.6 8.3 19.6 100.0
Community Library 28.9 18.9 22.0 9.8 20.4 100.0
(continued..)

62
Table 4.2: Distribution of households by time taken to reach the nearest facilities for consumption quintiles
(Percent)
Up to 30 minutes
30 minutes to 1 hour
1 - 2 hours 2 -3 hours
3 hours & more Total
Fourth
ECD Center 89.3 7.1 2.9 0.2 0.5 100.0
Primary School 95.9 3.7 0.5 0.0 0.0 100.0
Secondary School 75.2 15.4 6.7 2.3 0.5 100.0
Higher Secondary School 59.9 21.2 11.6 3.9 3.5 100.0
Health Post/Sub-health Post 64.3 21.2 11.8 1.8 0.9 100.0
Public Hospital/PHC 33.4 22.4 20.7 9.4 14.1 100.0
Clinic/Private Hospital 55.9 14.7 12.5 6.0 10.8 100.0
Bus Stop 70.2 11.4 7.4 4.0 7.0 100.0
Paved Road 53.2 12.7 12.7 5.6 15.8 100.0
Dirt Road, vehicle passable 84.7 3.4 4.5 3.2 4.3 100.0
Dirt Road, vehicle impassable 97.3 0.8 1.7 0.2 0.0 100.0
Local Shop/Shops 92.6 3.7 2.8 0.8 0.1 100.0
Haat Bazaar 65.0 14.7 12.6 4.8 2.9 100.0
Market Center 46.7 19.6 17.4 7.2 9.1 100.0
Agriclture Center 44.9 22.9 18.7 6.8 6.6 100.0
Sajha (Cooperatives) 58.8 18.5 12.6 4.5 5.7 100.0
Bank 41.3 17.8 18.0 7.9 14.9 100.0
Drinking Water, rainy season 99.5 0.3 0.0 0.1 0.1 100.0
Drinking Water, dry season 99.2 0.7 0.2 0.0 0.0 100.0
Post Office 67.6 17.6 11.5 1.9 1.4 100.0
Telephone Booth 87.2 7.6 3.5 0.9 0.8 100.0
Police Station 58.0 19.5 14.3 5.4 2.8 100.0
Internet Facility 43.7 19.0 16.6 7.5 13.2 100.0
Community Library 38.0 19.2 19.5 8.8 14.5 100.0
(continued..)

63
Table 4.2: Distribution of households by time taken to reach the nearest facilities for consumption quintiles
(Percent)
Up to 30 minutes
30 minutes to 1 hour
1 - 2 hours 2 -3 hours
3 hours & more Total
Richest
ECD Center 94.9 3.6 0.9 0.3 0.3 100.0
Primary School 98.4 1.3 0.2 0.0 0.1 100.0
Secondary School 89.5 7.5 2.2 0.4 0.4 100.0
Higher Secondary School 83.5 10.2 4.4 0.9 1.1 100.0
Health Post/Sub-health Post 79.7 14.3 4.2 1.0 0.9 100.0
Public Hospital/PHC 61.4 17.7 12.4 3.7 4.8 100.0
Clinic/Private Hospital 80.8 7.1 5.7 2.4 4.0 100.0
Bus Stop 89.5 4.3 2.6 1.4 2.3 100.0
Paved Road 78.9 5.6 7.1 2.5 5.9 100.0
Dirt Road, vehicle passable 92.2 1.7 2.7 1.4 2.0 100.0
Dirt Road, vehicle impassable 99.3 0.0 0.3 0.2 0.2 100.0
Local Shop/Shops 98.1 1.0 0.6 0.1 0.2 100.0
Haat Bazaar 82.2 8.8 5.8 2.2 1.0 100.0
Market Center 74.0 11.8 7.6 3.9 2.8 100.0
Agriclture Center 70.1 15.7 8.2 3.1 2.9 100.0
Sajha (Cooperatives) 82.1 9.4 5.1 2.2 1.3 100.0
Bank 72.4 9.9 8.7 4.2 4.9 100.0
Drinking Water, rainy season 99.9 0.1 0.0 0.0 0.0 100.0
Drinking Water, dry season 99.7 0.2 0.0 0.0 0.0 100.0
Post Office 85.4 10.0 3.4 0.7 0.5 100.0
Telephone Booth 96.2 2.3 0.9 0.3 0.3 100.0
Police Station 82.3 9.8 5.1 1.9 0.9 100.0
Internet Facility 75.0 8.9 7.4 4.3 4.4 100.0
Community Library 70.8 12.5 9.0 3.3 4.5 100.0

64
Table 4.3: Mean time taken by urban/rural households to reach the nearest facility
Urban
Minutes Hours Minutes Hours Minutes
ECD Center 12 0 21 0 19
Primary School 6 0 15 0 13
Secondary School 10 0 41 0 35
Higher Secondary School 14 1 8 0 57
Health Post/Sub-health Post 19 0 46 0 44
Public Hospital/PHC 26 2 28 2 2
Clinic/Private Hospital 14 2 6 1 43
Bus Stop 12 1 30 1 14
Paved Road 8 2 55 2 19
Dirt Road, vehicle passable 2 0 59 0 53
Dirt Road, vehicle impassable 2 0 5 0 5
Local Shop/Shops 2 0 15 0 12
Haat Bazaar 20 1 1 0 54
Market Center 19 1 50 1 31
Agriclture Center 25 1 34 1 20
Sajha (Cooperatives) 18 1 26 1 12
Bank 16 2 34 2 5
Drinking Water, rainy season 0 0 2 0 2
Drinking Water, dry season 1 0 3 0 3
Post Office 21 0 51 0 45
Telephone Booth 4 0 25 0 20
Police Station 14 1 9 0 57
Internet Facility 13 2 26 1 58
Community Library 21 2 26 2 0
NepalRuralFacility

65
Table 4.4: Mean time taken by households to reach the nearest facilities for consumption quintiles
Hours Minutes Hours Minutes Hours Minutes Hours Minutes Hours Minutes
ECD Center 0 24 0 22 0 19 0 19 0 14
Primary School 0 18 0 18 0 14 0 12 0 8
Secondary School 0 52 0 45 0 42 0 31 0 16
Higher Secondary School 1 30 1 12 1 6 0 53 0 23
Health Post/Sub-health Post 0 57 0 49 0 48 0 39 0 29
Public Hospital/PHC 3 1 2 38 2 21 1 50 0 58
Clinic/Private Hospital 2 45 2 23 2 0 1 25 0 39
Bus Stop 2 11 1 49 1 25 0 56 0 23
Paved Road 3 53 3 12 2 48 1 55 0 48
Dirt Road, vehicle passable 1 33 1 11 0 54 0 32 0 17
Dirt Road, vehicle impassable 0 7 0 3 0 6 0 4 0 3
Local Shop/Shops 0 21 0 18 0 14 0 10 0 4
Haat Bazaar 1 17 1 2 0 58 0 49 0 28
Market Center 2 26 1 56 1 45 1 20 0 39
Agriclture Center 2 0 1 36 1 32 1 13 0 42
Sajha (Cooperatives) 2 8 1 38 1 19 1 0 0 26
Bank 3 22 2 52 2 28 1 46 0 48
Drinking Water, rainy season 0 4 0 2 0 2 0 2 0 0
Drinking Water, dry season 0 5 0 3 0 3 0 2 0 1
Post Office 1 7 0 54 0 50 0 41 0 23
Telephone Booth 0 31 0 28 0 25 0 19 0 7
Police Station 1 31 1 11 1 8 0 52 0 25
Internet Facility 3 16 2 39 2 19 1 38 0 44
Community Library 3 17 2 35 2 18 1 45 0 48
Richest
Quintiles
Facility Poorest Second Third Fourth
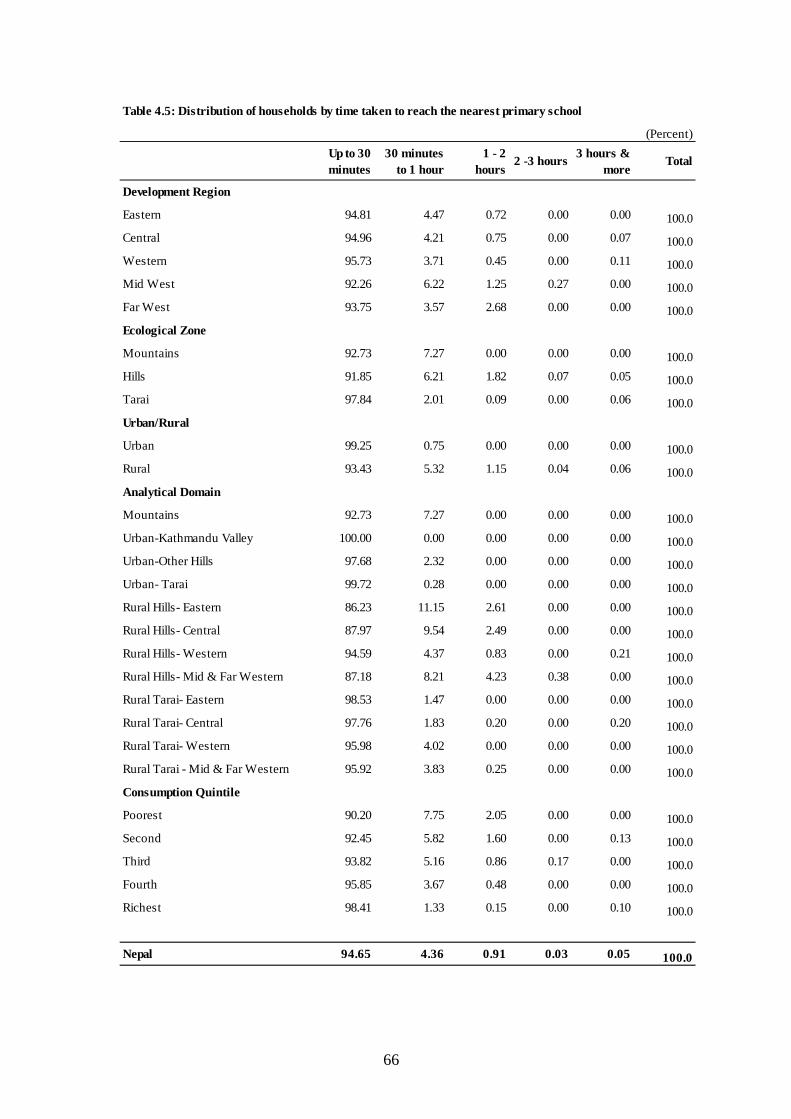
66
Table 4.5: Distribution of households by time taken to reach the nearest primary school
(Percent)Up to 30 minutes
30 minutes to 1 hour
1 - 2 hours
2 -3 hours 3 hours & more
Total
Development Region
Eastern 94.81 4.47 0.72 0.00 0.00 100.0Central 94.96 4.21 0.75 0.00 0.07 100.0Western 95.73 3.71 0.45 0.00 0.11 100.0Mid West 92.26 6.22 1.25 0.27 0.00 100.0Far West 93.75 3.57 2.68 0.00 0.00 100.0Ecological Zone
Mountains 92.73 7.27 0.00 0.00 0.00 100.0Hills 91.85 6.21 1.82 0.07 0.05 100.0Tarai 97.84 2.01 0.09 0.00 0.06 100.0Urban/Rural
Urban 99.25 0.75 0.00 0.00 0.00 100.0Rural 93.43 5.32 1.15 0.04 0.06 100.0Analytical Domain
Mountains 92.73 7.27 0.00 0.00 0.00 100.0Urban-Kathmandu Valley 100.00 0.00 0.00 0.00 0.00 100.0Urban-Other Hills 97.68 2.32 0.00 0.00 0.00 100.0Urban- Tarai 99.72 0.28 0.00 0.00 0.00 100.0Rural Hills- Eastern 86.23 11.15 2.61 0.00 0.00 100.0Rural Hills- Central 87.97 9.54 2.49 0.00 0.00 100.0Rural Hills- Western 94.59 4.37 0.83 0.00 0.21 100.0Rural Hills- Mid & Far Western 87.18 8.21 4.23 0.38 0.00 100.0Rural Tarai- Eastern 98.53 1.47 0.00 0.00 0.00 100.0Rural Tarai- Central 97.76 1.83 0.20 0.00 0.20 100.0Rural Tarai- Western 95.98 4.02 0.00 0.00 0.00 100.0Rural Tarai - Mid & Far Western 95.92 3.83 0.25 0.00 0.00 100.0Consumption Quintile
Poorest 90.20 7.75 2.05 0.00 0.00 100.0Second 92.45 5.82 1.60 0.00 0.13 100.0Third 93.82 5.16 0.86 0.17 0.00 100.0Fourth 95.85 3.67 0.48 0.00 0.00 100.0Richest 98.41 1.33 0.15 0.00 0.10 100.0
Nepal 94.65 4.36 0.91 0.03 0.05 100.0

67
Table 4.6: Distribution of households by time taken to reach the nearest health post
(Percent)
Up to 30 minutes
30 minutes to 1 hour
1 - 2 hours
2 -3 hours
3 hours & more
Total
Development Region
Eastern 65.6 19.9 10.9 2.4 1.2 100.0Central 71.7 16.3 8.3 2.0 1.8 100.0Western 55.2 29.3 12.7 1.1 1.7 100.0Mid West 50.6 19.6 20.6 6.6 2.6 100.0Far West 44.9 24.6 26.6 2.0 2.0 100.0Ecological Zone
Mountains 44.3 32.3 20.8 1.5 1.0 100.0Hills 48.9 24.2 19.0 4.5 3.4 100.0Tarai 77.9 15.8 5.6 0.6 0.2 100.0Urban/Rural
Urban 85.9 12.2 1.8 0.0 0.1 100.0Rural 59.0 22.0 14.3 2.8 1.9 100.0Analytical Domain
Mountains 44.3 32.3 20.8 1.5 1.0 100.0Urban-Kathmandu Valley 100.0 0.0 0.0 0.0 0.0 100.0Urban-Other Hills 74.5 22.9 2.6 0.0 0.0 100.0Urban- Tarai 84.4 14.2 1.4 0.0 0.0 100.0Rural Hills- Eastern 45.4 25.6 18.8 6.2 4.0 100.0Rural Hills- Central 49.4 22.4 17.6 5.5 5.1 100.0Rural Hills- Western 42.2 34.2 19.5 1.5 2.6 100.0Rural Hills- Mid & Far Western 35.2 21.1 30.9 8.6 4.2 100.0Rural Tarai- Eastern 78.4 14.7 6.2 0.6 0.0 100.0Rural Tarai- Central 84.4 12.1 3.2 0.2 0.2 100.0Rural Tarai- Western 76.7 20.9 1.5 0.6 0.3 100.0Rural Tarai - Mid & Far Western 60.5 22.1 15.5 1.7 0.3 100.0Consumption Quintile
Poorest 51.4 21.8 19.1 4.4 3.3 100.0Second 54.0 24.1 17.6 2.3 2.0 100.0Third 56.8 23.9 13.9 3.4 2.0 100.0Fourth 64.3 21.2 11.8 1.8 0.9 100.0Richest 79.7 14.3 4.2 1.0 0.9 100.0
Nepal 61.8 21.0 13.0 2.5 1.7 100.0

68
Table 4.7: Distribution of households by time taken to reach the nearest Sajha (cooperative)
(Percent)Up to 30 minutes
30 minutes to 1 hour
1 - 2 hours
2 -3 hours 3 hours & more
Total
Development Region
Eastern 49.1 21.0 16.3 6.1 7.5 100.0Central 60.3 18.4 11.1 5.8 4.4 100.0Western 59.3 21.5 11.9 5.0 2.3 100.0Mid West 42.8 14.9 16.5 8.5 17.3 100.0Far West 43.8 14.1 16.4 6.4 19.3 100.0Ecological Zone
Mountains 37.5 16.3 19.6 11.3 15.3 100.0Hills 54.5 13.6 12.1 7.8 12.0 100.0Tarai 55.8 24.7 14.2 3.5 1.8 100.0Urban/Rural
Urban 89.7 7.0 2.6 0.3 0.4 100.0Rural 44.4 22.0 16.5 7.6 9.5 100.0Analytical Domain
Mountains 37.5 16.3 19.6 11.3 15.3 100.0Urban-Kathmandu Valley 99.8 0.2 0.0 0.0 0.0 100.0Urban-Other Hills 84.8 9.4 4.8 0.8 0.2 100.0Urban- Tarai 85.2 10.9 2.8 0.1 0.9 100.0Rural Hills- Eastern 27.8 14.0 22.1 13.3 22.8 100.0Rural Hills- Central 57.7 14.3 6.9 7.9 13.2 100.0Rural Hills- Western 48.6 25.4 14.0 8.1 3.9 100.0Rural Hills- Mid & Far Western 24.9 10.8 22.0 13.2 29.1 100.0Rural Tarai- Eastern 48.9 30.2 16.4 2.5 2.0 100.0Rural Tarai- Central 35.0 32.5 21.9 8.8 1.7 100.0Rural Tarai- Western 60.0 23.5 13.7 2.3 0.6 100.0Rural Tarai - Mid & Far Western 66.0 19.0 11.0 0.5 3.5 100.0Consumption Quintile
Poorest 31.0 23.5 18.5 11.3 15.8 100.0Second 37.9 23.3 18.9 8.9 11.0 100.0Third 43.6 24.0 17.5 6.5 8.4 100.0Fourth 58.8 18.5 12.6 4.5 5.7 100.0Richest 82.0 9.4 5.1 2.2 1.3 100.0
Nepal 53.9 18.8 13.6 6.1 7.6 100.0

69
Table 4.8: Distribution of households by time taken to reach the nearest Agriculture center
(Percent)
Up to 30 minutes
30 minutes to 1 hour
1 - 2 hours 2 -3 hours
3 hours & more Total
Development Region
Eastern 41.8 21.4 18.3 8.2 10.3 100.0Central 48.1 21.9 14.3 8.6 7.1 100.0Western 41.2 25.8 21.1 7.1 4.8 100.0Mid West 35.6 18.3 17.0 14.4 14.7 100.0Far West 37.0 23.7 19.8 7.7 11.7 100.0Ecological Zone
Mountains 16.3 17.3 25.8 22.6 18.1 100.0Hills 37.4 16.6 19.3 12.4 14.3 100.0Tarai 52.4 28.9 14.2 3.0 1.5 100.0Urban/Rural
Urban 82.8 13.2 3.6 0.3 0.1 100.0Rural 32.2 24.6 21.0 11.1 11.0 100.0Analytical Domain
Mountains 16.3 17.3 25.8 22.6 18.1 100.0Urban-Kathmandu Valley 91.1 8.5 0.3 0.0 0.0 100.0Urban-Other Hills 75.0 16.8 7.1 1.1 0.0 100.0Urban- Tarai 81.5 15.1 3.2 0.1 0.1 100.0Rural Hills- Eastern 14.6 12.2 26.3 19.8 27.2 100.0Rural Hills- Central 29.6 15.3 20.4 14.4 20.2 100.0Rural Hills- Western 22.6 26.5 29.8 12.4 8.7 100.0Rural Hills- Mid & Far Western 17.7 15.0 21.4 21.3 24.6 100.0Rural Tarai- Eastern 47.5 30.2 17.2 2.7 2.4 100.0Rural Tarai- Central 35.0 38.2 18.6 7.2 1.0 100.0Rural Tarai- Western 51.5 31.1 15.4 1.4 0.6 100.0Rural Tarai - Mid & Far Western 57.8 24.5 13.7 0.5 3.5 100.0Consumption Quintile
Poorest 21.4 23.9 23.2 15.1 16.3 100.0Second 29.8 25.1 21.3 12.4 11.4 100.0Third 32.9 26.3 19.9 10.6 10.4 100.0Fourth 44.9 22.9 18.7 6.8 6.6 100.0Richest 70.1 15.7 8.2 3.1 2.8 100.0
Nepal 42.8 22.3 17.4 8.9 8.7 100.0

70
Table 4.9: Distribution of households by time taken to reach the nearest commerical bank
(Percent)
Up to 30 minutes
30 minutes to 1 hour
1 - 2 hours 2 -3 hours
3 hours & more Total
Development Region
Eastern 36.5 22.9 14.3 6.4 19.9 100.0Central 50.2 14.8 15.9 8.4 10.7 100.0Western 35.4 16.1 25.6 11.7 11.2 100.0Mid West 29.5 12.9 11.9 11.1 34.6 100.0Far West 31.3 11.5 14.9 5.0 37.3 100.0Ecological Zone
Mountains 13.9 3.4 15.7 11.1 55.9 100.0Hills 36.3 8.2 16.1 12.2 27.3 100.0Tarai 47.5 27.0 17.9 4.6 3.0 100.0Urban/Rural
Urban 88.9 7.2 3.6 0.3 0.0 100.0Rural 26.9 18.9 20.4 10.8 23.0 100.0Analytical Domain
Mountains 13.9 3.4 15.7 11.1 55.9 100.0Urban-Kathmandu Valley 99.8 0.2 0.0 0.0 0.0 100.0Urban-Other Hills 79.5 12.7 6.9 0.8 0.0 100.0Urban- Tarai 87.0 9.5 3.3 0.1 0.0 100.0Rural Hills- Eastern 11.2 10.2 12.4 11.4 54.8 100.0Rural Hills- Central 31.9 9.6 20.4 14.4 23.7 100.0Rural Hills- Western 16.2 11.3 33.7 19.1 19.7 100.0Rural Hills- Mid & Far Western 10.2 4.7 9.7 17.8 57.6 100.0Rural Tarai- Eastern 37.0 38.4 17.9 4.5 2.2 100.0Rural Tarai- Central 33.2 30.4 23.2 9.1 4.2 100.0Rural Tarai- Western 38.7 30.3 24.2 4.8 2.0 100.0Rural Tarai - Mid & Far Western 49.8 20.8 21.4 1.5 6.5 100.0Consumption Quintile
Poorest 17.0 19.2 18.2 12.7 32.8 100.0Second 24.0 17.4 22.6 10.3 25.7 100.0Third 27.5 20.5 20.5 10.5 21.0 100.0Fourth 41.3 17.8 18.0 7.9 14.9 100.0Richest 72.4 9.9 8.7 4.2 4.9 100.0
Nepal 39.9 16.4 16.9 8.6 18.2 100.0

71
Table 4.10: Distribution of households by time taken to reach the nearest market center
(Percent)
Up to 30 minutes
30 minutes to 1 hour
1 - 2 hours
2 -3 hours
3 hours & more
Total
Development Region
Eastern 44.9 21.5 16.1 6.5 11.1 100.0Central 54.8 17.5 13.3 7.6 6.9 100.0Western 36.3 18.6 26.7 10.8 7.6 100.0Mid West 32.8 14.2 13.8 12.1 27.1 100.0Far West 38.6 12.9 23.1 11.2 14.1 100.0Ecological Zone
Mountains 25.2 10.3 21.0 14.5 28.9 100.0Hills 37.1 11.8 20.6 13.2 17.2 100.0Tarai 55.5 25.3 13.8 3.4 2.0 100.0Urban/Rural
Urban 87.6 8.0 4.0 0.3 0.1 100.0Rural 33.4 20.5 21.1 11.1 14.0 100.0Analytical Domain
Mountains 25.2 10.3 21.0 14.5 28.9 100.0Urban-Kathmandu Valley 96.6 2.4 1.0 0.0 0.0 100.0Urban-Other Hills 76.4 15.0 7.8 0.8 0.0 100.0Urban- Tarai 87.8 8.4 3.5 0.1 0.1 100.0Rural Hills- Eastern 15.9 13.0 21.8 19.0 30.3 100.0Rural Hills- Central 31.2 14.4 21.5 11.9 21.0 100.0Rural Hills- Western 18.1 17.1 34.2 17.4 13.1 100.0Rural Hills- Mid & Far Western 13.9 6.7 24.6 22.8 32.0 100.0Rural Tarai- Eastern 50.4 32.7 14.1 0.6 2.2 100.0Rural Tarai- Central 45.5 31.8 14.4 7.3 1.0 100.0Rural Tarai- Western 39.6 27.0 27.2 4.8 1.4 100.0Rural Tarai - Mid & Far Western 55.3 20.5 14.3 3.3 6.5 100.0Consumption Quintile
Poorest 24.0 18.2 22.1 14.7 21.0 100.0Second 29.6 20.1 23.8 12.0 14.6 100.0Third 33.7 21.7 21.6 9.6 13.4 100.0Fourth 46.7 19.6 17.4 7.2 9.1 100.0Richest 74.0 11.8 7.6 3.9 2.8 100.0
Nepal 44.7 17.9 17.5 8.8 11.1 100.0

72
Table 4.11: Distribution of households by time taken to reach the nearest facilities for development regions
(Percent)Up to 30 minutes
30 minutes to 1 hour
1 - 2 hours
2 -3 hours
3 hours & more
Total
Eastern Region
ECD Center 91.2 5.9 1.8 0.2 1.0 100.0
Primary School 94.8 4.5 0.7 0.0 0.0 100.0
Secondary School 72.0 16.1 10.1 1.6 0.3 100.0
Higher Secondary School 52.5 23.0 16.1 4.9 3.5 100.0
Health Post/Sub-health Post 65.6 19.9 10.9 2.4 1.2 100.0
Public Hospital/PHC 29.6 25.1 16.2 8.9 20.2 100.0
Clinic/Private Hospital 54.0 16.0 11.4 4.7 14.0 100.0
Bus Stop 58.7 10.7 13.5 4.7 12.5 100.0
Paved Road 49.8 12.7 12.9 4.7 19.9 100.0
Dirt Road, vehicle passable 82.4 2.5 5.2 1.7 8.2 100.0
Dirt Road, vehicle impassable 96.3 1.8 1.2 0.5 0.3 100.0
Local Shop/Shops 93.3 3.9 2.2 0.6 0.0 100.0
Haat Bazaar 63.3 13.8 12.4 7.6 3.0 100.0
Market Center 44.9 21.5 16.1 6.5 11.1 100.0
Agriclture Center 41.8 21.4 18.3 8.2 10.3 100.0
Sajha (Cooperatives) 49.1 21.0 16.3 6.1 7.5 100.0
Bank 36.5 22.9 14.3 6.4 20.0 100.0
Drinking Water, rainy season 99.5 0.4 0.1 0.0 0.0 100.0
Drinking Water, dry season 99.5 0.2 0.2 0.0 0.1 100.0
Post Office 66.4 17.1 12.0 3.8 0.6 100.0
Telephone Booth 84.0 8.8 5.4 0.7 1.1 100.0
Police Station 53.7 21.2 14.6 6.4 4.1 100.0
Internet Facility 43.7 20.7 13.3 5.3 17.1 100.0
Community Library 34.2 20.7 20.1 8.2 16.8 100.0
(continued..)
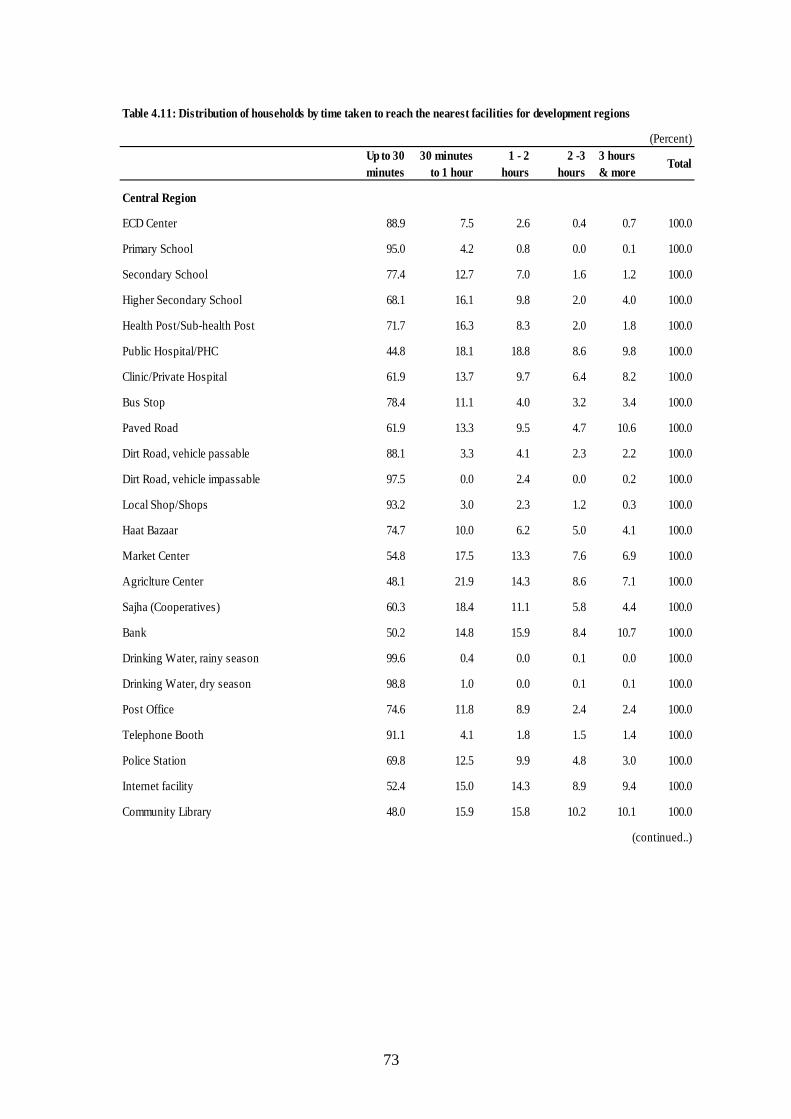
73
Table 4.11: Distribution of households by time taken to reach the nearest facilities for development regions
(Percent)Up to 30 minutes
30 minutes to 1 hour
1 - 2 hours
2 -3 hours
3 hours & more
Total
Central Region
ECD Center 88.9 7.5 2.6 0.4 0.7 100.0
Primary School 95.0 4.2 0.8 0.0 0.1 100.0
Secondary School 77.4 12.7 7.0 1.6 1.2 100.0
Higher Secondary School 68.1 16.1 9.8 2.0 4.0 100.0
Health Post/Sub-health Post 71.7 16.3 8.3 2.0 1.8 100.0
Public Hospital/PHC 44.8 18.1 18.8 8.6 9.8 100.0
Clinic/Private Hospital 61.9 13.7 9.7 6.4 8.2 100.0
Bus Stop 78.4 11.1 4.0 3.2 3.4 100.0
Paved Road 61.9 13.3 9.5 4.7 10.6 100.0
Dirt Road, vehicle passable 88.1 3.3 4.1 2.3 2.2 100.0
Dirt Road, vehicle impassable 97.5 0.0 2.4 0.0 0.2 100.0
Local Shop/Shops 93.2 3.0 2.3 1.2 0.3 100.0
Haat Bazaar 74.7 10.0 6.2 5.0 4.1 100.0
Market Center 54.8 17.5 13.3 7.6 6.9 100.0
Agriclture Center 48.1 21.9 14.3 8.6 7.1 100.0
Sajha (Cooperatives) 60.3 18.4 11.1 5.8 4.4 100.0
Bank 50.2 14.8 15.9 8.4 10.7 100.0
Drinking Water, rainy season 99.6 0.4 0.0 0.1 0.0 100.0
Drinking Water, dry season 98.8 1.0 0.0 0.1 0.1 100.0
Post Office 74.6 11.8 8.9 2.4 2.4 100.0
Telephone Booth 91.1 4.1 1.8 1.5 1.4 100.0
Police Station 69.8 12.5 9.9 4.8 3.0 100.0
Internet facility 52.4 15.0 14.3 8.9 9.4 100.0
Community Library 48.0 15.9 15.8 10.2 10.1 100.0
(continued..)

74
Table 4.11: Distribution of households by time taken to reach the nearest facilities for development regions
(Percent)Up to 30 minutes
30 minutes to 1 hour
1 - 2 hours
2 -3 hours
3 hours & more
Total
Western Region
ECD Center 88.0 9.1 2.5 0.0 0.4 100.0
Primary School 95.7 3.7 0.5 0.0 0.1 100.0
Secondary School 71.1 20.5 5.6 1.3 1.5 100.0
Higher Secondary School 51.2 25.6 14.4 5.7 3.2 100.0
Health Post/Sub-health Post 55.2 29.3 12.7 1.1 1.7 100.0
Public Hospital/PHC 30.0 21.3 29.5 8.7 10.6 100.0
Clinic/Private Hospital 51.6 17.5 16.8 6.4 7.8 100.0
Bus Stop 75.1 12.2 5.0 3.0 4.7 100.0
Paved Road 51.8 11.7 15.4 8.7 12.4 100.0
Dirt Road, vehicle passable 81.8 5.2 4.9 3.2 4.8 100.0
Dirt Road, vehicle impassable 96.8 1.1 2.1 0.0 0.0 100.0
Local Shop/Shops 94.2 4.0 0.9 0.7 0.2 100.0
Haat Bazaar 67.1 19.1 10.1 3.3 0.4 100.0
Market Center 36.3 18.6 26.7 10.8 7.6 100.0
Agriclture Center 41.2 25.8 21.1 7.1 4.8 100.0
Sajha (Cooperatives) 59.3 21.5 11.9 5.0 2.3 100.0
Bank 35.4 16.1 25.6 11.7 11.2 100.0
Drinking Water, rainy season 99.2 0.5 0.0 0.1 0.1 100.0
Drinking Water, dry season 98.8 1.2 0.0 0.0 0.0 100.0
Post Office 62.2 24.7 10.2 1.1 1.8 100.0
Telephone Booth 81.1 11.8 4.9 2.1 0.2 100.0
Police Station 51.1 23.3 16.1 6.7 2.8 100.0
Internet Facility 38.6 15.9 23.8 11.1 10.7 100.0
Community Library 32.2 18.3 30.0 7.0 12.5 100.0
(continued..)

75
Table 4.11: Distribution of households by time taken to reach the nearest facilities for development regions
(Percent)Up to 30 minutes
30 minutes to 1 hour
1 - 2 hours
2 -3 hours
3 hours & more
Total
Mid-Western Region
ECD Center 88.4 7.1 4.2 0.0 0.3 100.0
Primary School 92.3 6.2 1.3 0.3 0.0 100.0
Secondary School 53.9 19.5 16.2 8.1 2.2 100.0
Higher Secondary School 41.0 15.6 17.3 14.0 12.1 100.0
Health Post/Sub-health Post 50.6 19.7 20.6 6.6 2.6 100.0
Public Hospital/PHC 22.6 20.9 15.2 13.8 27.4 100.0
Clinic/Private Hospital 35.4 10.7 13.2 11.3 29.5 100.0
Bus Stop 45.2 13.4 11.5 7.1 22.7 100.0
Paved Road 35.7 11.0 9.9 4.8 38.5 100.0
Dirt Road, vehicle passable 64.4 3.7 9.0 7.3 15.7 100.0
Dirt Road, vehicle impassable 98.5 0.4 1.1 0.0 0.0 100.0
Local Shop/Shops 81.9 6.7 5.7 3.1 2.6 100.0
Haat Bazaar 37.2 17.7 15.6 12.8 16.7 100.0
Market Center 32.9 14.3 13.8 12.1 27.1 100.0
Agriclture Center 35.6 18.3 17.0 14.4 14.7 100.0
Sajha (Cooperatives) 42.8 14.9 16.5 8.5 17.3 100.0
Bank 29.5 12.9 11.9 11.1 34.6 100.0
Drinking Water, rainy season 99.4 0.4 0.1 0.0 0.1 100.0
Drinking Water, dry season 98.9 0.8 0.1 0.0 0.1 100.0
Post Office 49.3 18.3 21.1 8.7 2.7 100.0
Telephone Booth 82.2 8.5 5.3 2.1 1.9 100.0
Police Station 41.9 16.6 21.8 12.3 7.4 100.0
Internet Facility 29.1 12.9 13.1 9.2 35.8 100.0
Community Library 31.3 11.9 9.9 10.8 36.2 100.0
(continued..)

76
Table 4.11: Distribution of households by time taken to reach the nearest facilities for development regions
(Percent)Up to 30 minutes
30 minutes to 1 hour
1 - 2 hours
2 -3 hours
3 hours & more
Total
Far-Western Region
ECD Center 85.1 7.1 5.5 2.2 0.2 100.0
Primary School 93.8 3.6 2.7 0.0 0.0 100.0
Secondary School 71.1 15.4 12.4 0.8 0.4 100.0
Higher Secondary School 51.4 19.8 23.5 4.6 0.6 100.0
Health Post/Sub-health Post 44.9 24.6 26.6 2.0 2.0 100.0
Public hospital/PHC 21.7 11.5 20.2 7.8 38.7 100.0
Clinic/Private Hospital 45.5 9.1 11.3 6.8 27.3 100.0
Bus Stop 42.7 11.3 18.7 7.2 20.1 100.0
Paved Road 30.4 10.3 20.5 6.2 32.6 100.0
Dirt Road, vehicle passable 62.2 6.4 8.4 7.6 15.3 100.0
Dirt Road, vehicle impassable 96.9 0.4 2.8 0.0 0.0 100.0
Local Shop/Shops 93.0 2.5 4.3 0.0 0.2 100.0
Haat Bazaar 58.2 20.6 15.3 5.8 0.0 100.0
Market Center 38.6 12.9 23.1 11.2 14.1 100.0
Agriclture Center 37.0 23.7 19.8 7.7 11.7 100.0
Sajha (Cooperatives) 43.8 14.1 16.4 6.4 19.3 100.0
Bank 31.3 11.5 14.9 5.0 37.3 100.0
Drinking Water, rainy season 99.4 0.4 0.0 0.0 0.2 100.0
Drinking Water, dry season 96.5 2.6 1.0 0.0 0.0 100.0
Post Office 54.5 17.0 19.2 6.1 3.3 100.0
Telephone Booth 90.5 3.9 4.7 0.6 0.4 100.0
Police Station 42.5 20.7 16.9 12.5 7.4 100.0
Internet Facility 34.3 12.3 14.7 5.5 33.4 100.0
Community Library 36.9 12.8 15.7 2.7 31.9 100.0
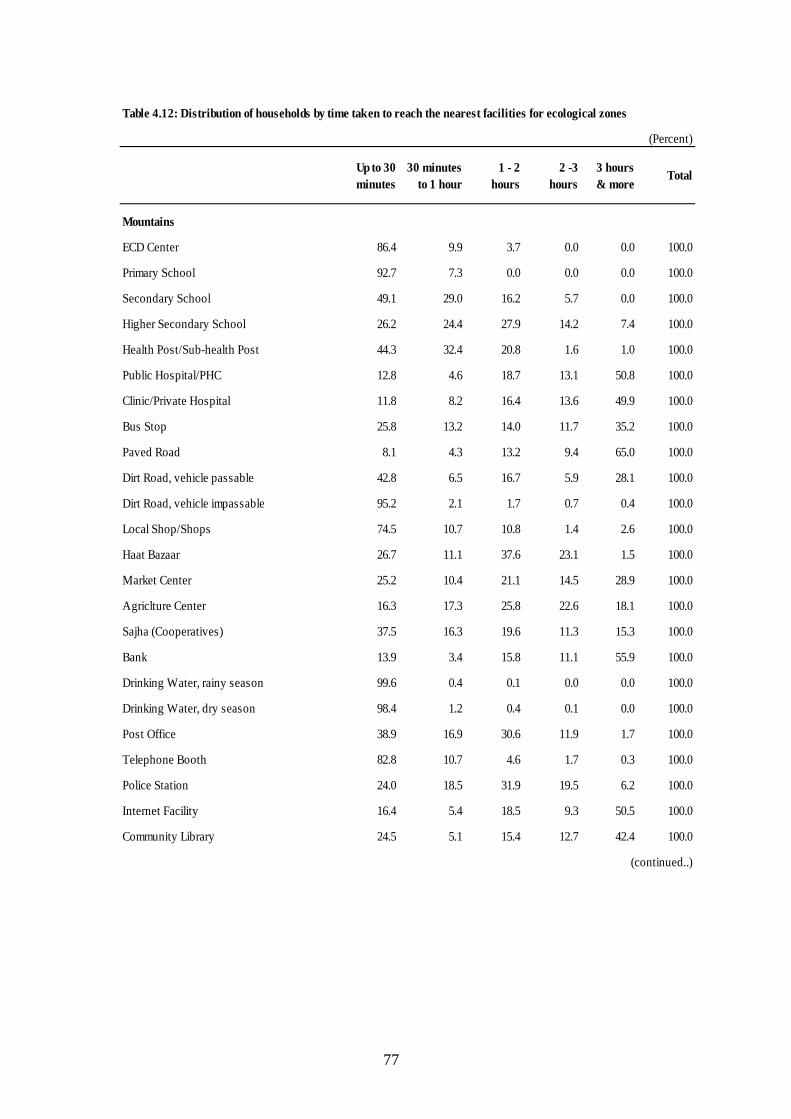
77
Table 4.12: Distribution of households by time taken to reach the nearest facilities for ecological zones
(Percent)
Up to 30 minutes
30 minutes to 1 hour
1 - 2 hours
2 -3 hours
3 hours & more
Total
Mountains
ECD Center 86.4 9.9 3.7 0.0 0.0 100.0
Primary School 92.7 7.3 0.0 0.0 0.0 100.0
Secondary School 49.1 29.0 16.2 5.7 0.0 100.0
Higher Secondary School 26.2 24.4 27.9 14.2 7.4 100.0
Health Post/Sub-health Post 44.3 32.4 20.8 1.6 1.0 100.0
Public Hospital/PHC 12.8 4.6 18.7 13.1 50.8 100.0
Clinic/Private Hospital 11.8 8.2 16.4 13.6 49.9 100.0
Bus Stop 25.8 13.2 14.0 11.7 35.2 100.0
Paved Road 8.1 4.3 13.2 9.4 65.0 100.0
Dirt Road, vehicle passable 42.8 6.5 16.7 5.9 28.1 100.0
Dirt Road, vehicle impassable 95.2 2.1 1.7 0.7 0.4 100.0
Local Shop/Shops 74.5 10.7 10.8 1.4 2.6 100.0
Haat Bazaar 26.7 11.1 37.6 23.1 1.5 100.0
Market Center 25.2 10.4 21.1 14.5 28.9 100.0
Agriclture Center 16.3 17.3 25.8 22.6 18.1 100.0
Sajha (Cooperatives) 37.5 16.3 19.6 11.3 15.3 100.0
Bank 13.9 3.4 15.8 11.1 55.9 100.0
Drinking Water, rainy season 99.6 0.4 0.1 0.0 0.0 100.0
Drinking Water, dry season 98.4 1.2 0.4 0.1 0.0 100.0
Post Office 38.9 16.9 30.6 11.9 1.7 100.0
Telephone Booth 82.8 10.7 4.6 1.7 0.3 100.0
Police Station 24.0 18.5 31.9 19.5 6.2 100.0
Internet Facility 16.4 5.4 18.5 9.3 50.5 100.0
Community Library 24.5 5.1 15.4 12.7 42.4 100.0
(continued..)

78
Table 4.12: Distribution of household by time taken to reach the nearest facilities for ecological zones
(Percent)
Up to 30 minutes
30 minutes to 1 hour
1 - 2 hours
2 -3 hours
3 hours & more
Total
Hills
ECD center 83.6 10.1 4.4 0.7 1.2 100.0
Primary School 91.9 6.2 1.8 0.1 0.1 100.0
Secondary school 62.3 18.1 13.5 3.8 2.4 100.0
Higher Secondary School 47.9 17.0 19.3 8.5 7.4 100.0
Health post/Sub-health post 48.9 24.2 19.0 4.5 3.4 100.0
Public hospital/PHC 29.1 13.1 18.8 12.6 26.4 100.0
Clinic/Private Hospital 46.2 10.4 13.7 9.9 19.8 100.0
Bus Stop 58.8 8.9 11.4 7.0 14.0 100.0
Paved Road 42.6 7.5 15.3 7.7 26.9 100.0
Dirt Road, vehicle passable 66.3 6.8 9.1 6.8 11.1 100.0
Dirt Road, vehicle impassable 96.3 0.9 2.7 0.1 0.1 100.0
Local Shop/Shops 88.2 5.7 3.4 2.0 0.7 100.0
Haat Bazaar 25.3 14.2 24.0 21.8 14.7 100.0
Market Center 37.1 11.8 20.6 13.2 17.2 100.0
Agriclture Center 37.4 16.6 19.3 12.5 14.3 100.0
Sajha (Cooperatives) 54.5 13.6 12.1 7.8 12.0 100.0
Bank 36.3 8.2 16.1 12.2 27.3 100.0
Drinking Water in rainy season 99.2 0.6 0.0 0.1 0.1 100.0
Drinking Water in dry season 97.9 1.7 0.3 0.1 0.1 100.0
Post Office 56.3 18.7 16.6 5.1 3.3 100.0
Telephone Booth 81.2 8.6 5.8 2.7 1.7 100.0
Police station 44.3 17.1 19.5 11.9 7.4 100.0
Internet access 36.4 10.0 16.5 11.9 25.2 100.0
Community library 35.7 11.7 16.4 9.4 26.9 100.0
(continued..)

79
Table 4.12: Distribution of households by time taken to reach the nearest facilities for ecological zones
(Percent)
Up to 30 minutes
30 minutes to 1 hour
1 - 2 hours
2 -3 hours
3 hours & more
Total
Tarai
ECD Center 94.5 4.2 1.1 0.1 0.1 100.0
Primary School 97.8 2.0 0.1 0.0 0.1 100.0
Secondary School 84.3 12.1 3.3 0.2 0.0 100.0
Higher Secondary School 69.7 22.3 7.0 0.2 0.9 100.0
Health Post/Sub-health Post 77.9 15.8 5.6 0.6 0.2 100.0
Public Hospital/PHC 41.4 29.9 21.5 5.2 2.1 100.0
Clinic/Private Hospital 67.2 19.1 9.7 2.1 1.9 100.0
Bus Stop 79.7 13.9 4.9 0.4 1.1 100.0
Paved Road 66.5 18.6 9.5 2.9 2.5 100.0
Dirt Road, vehicle passable 98.7 0.7 0.4 0.0 0.2 100.0
Dirt Road, vehicle impassable 99.7 0.0 0.3 0.0 0.0 100.0
Local Shop/Shops 98.6 0.8 0.5 0.1 0.0 100.0
Haat Bazaar 80.1 14.3 4.3 0.3 0.9 100.0
Market Center 55.5 25.3 13.8 3.4 2.0 100.0
Agriclture Center 52.4 28.9 14.2 3.0 1.5 100.0
Sajha (Cooperatives) 55.8 24.7 14.2 3.5 1.8 100.0
Bank 47.5 27.0 17.9 4.6 3.0 100.0
Drinking Water, rainy season 99.7 0.2 0.1 0.0 0.0 100.0
Drinking Water, dry season 99.7 0.2 0.0 0.0 0.0 100.0
Post Office 78.8 15.0 4.9 0.7 0.6 100.0
Telephone Booth 92.1 5.4 1.9 0.1 0.5 100.0
Police Station 74.2 18.7 6.2 0.4 0.4 100.0
Internet Facility 54.4 23.9 14.8 4.2 2.8 100.0
Community Library 43.8 23.9 22.1 7.0 3.3 100.0

80
CHAPTER V: LITERACY AND EDUCATION
5.1 Introduction
Both literacy and education attainment are important determinants of individual and household welfare. They affect the level and pace of economic development in a given country. Literacy has a positive impact on health and nutritional status and overall well being of the individual and the society. Educational attainment, among other things, is directly related to the economic status of the individual as well as the household.
Literacy has been defined as the ability both to read and to write. A literate person is one who can both read and write a short, simple statement in any language on his or her everyday life.
Almost all indicators for education exhibit a clear improvement between 1995/96 and 2010/11 (during a period of past 15 years). A summary statistics of literacy and education is presented in Box 5.1.
5.2 Literacy Rates
Overall, 61 percent of the population aged 6 years and above is literate (Table 5.1). Literacy rate is substantially higher in urban areas (77 percent) than in rural areas (57 percent). Regional disparities also exist, with the highest literacy rate in the western development region (66 percent), and the lowest rate in the central development region (57 percent). Among ecological belts, the hills belt has the highest overall literacy rate (69 percent). There is a clear association between literacy rate and household consumption quintiles. 79 percent of the population in the richest quintile is literate while only 45 percent is literate in the poorest quintile.
There are marked gender disparities in literacy rates: 72 percent of males aged 6 years and older are literate as opposed to 51 percent of females. Disparities exist across the development regions, ecological belts and urban/rural residence. Gender disparities are worse in the rural- eastern and the central Tarai, the mountains belt, and in the rural-mid and far western hills.
Overall, 57 percent of the adult population aged 15 years and over is literate (Table 5.1). Again, there is a wide gap between male and female literacy rates. The literacy rates of males and females are 72 and 45 percent respectively. Gender and regional differences in adult literacy are similar to those seen in literacy rates for population 6 years and above.

81
Not surprisingly, literacy rates decline with the age increase (Table 5.2). The literacy rate is the maximum at the age group 15-19 years and it declines with age for both males and females. A similar pattern follows in urban and rural areas. Gender gap is comparatively smaller for the younger age cohorts.
Adult literacy rates have improved over the years since 1995/96 (Figure 5.1).
5.3 Educational Status
For the survey, educational status is categorized into a) never attended school, b) attended school in the past, and c) currently attending school. Overall, the proportion of population 6 years and over that “never attended” school is larger than that “ever attended” but smaller than “currently attending” categories (34, 28 and 38 percent respectively).
With respect to the educational status, females are comparatively more disadvantaged than their male counter parts. For instance, never- attendance rate is 23 percent for male population compared to 44 percent for females, past-attendance rate is 36 percent for males whereas this rate is only 22 percent for female population and current-attendance rates, on the other hand, are 41 percent and 34 percent for males and females respectively.
The proportion of population that never attended school among consumption quintiles ranges from 44 percent in the poorest quintile to 21 percent in the richest quintile. Share of female population that never attended school is higher compared with the males and decrease for the higher consumption quintiles. For instance, female population that never attended school is 53 percent in the poorest quintile while the corresponding proportion for the richest quintile is 31 percent.
Tables 5.4 through 5.7 show a similar distribution by age groups. As one would expect, never-attendance rate increases while current-attendance declines with age. There are no significant differences between urban and rural areas with regard to current-attendance rates.
5.4 Reasons for not Attending School
This question was asked to all members (6-24 years of age) of the household who have never attended any school. Respondents were asked to provide the main reason for not attending any school.
Tables 5.8 through 5.10 present distribution of the primary reasons for not attending school for population aged 6-24 years (those who never attended any school). Overall, 8.7 percent of the relevant population never attended school. Among these never-attendees, 30.0 percent reported "parents did not want" as the primary reason, followed by other reasons - "had to work at home" (25.5 percent), “not willing to attend” (17.2 percent). Other reasons include “too young” (7.2 percent), “too expensive” (7.3 percent), “disability” (3.4 percent) and “school far way” (3.1 percent).

82
By sex groups, "not willing to attend" , "parent did not want", "too young" and "help at home" are the most reported reason for males while "parent did not want", "help at home" and "not willing to attend" are the dominant reason for females.
5.5 School Attendance
School attendance is shown in Tables 5.11-5.14. About 54.6 percent of adult population (aged 15 years and above) ever attended school (either attended in the past or are currently attending). About 70 percent of adult males have ever attended school while this figure is only 43 percent for adult females. Disparities across urban/rural areas are quite severe with regard to school attendance. Relative to rural areas, urban areas have a much larger school attendance rate (73 percent versus 50 percent).
Among development regions, the western region has the highest attendance rate (58 percent) while the mid-western region has the lowest rate (51 percent). Among ecological belts, the hills region ranks first with regard to the school attendance rate. Attendance rate is higher among younger cohorts while mean years of schooling is higher for mid-aged ever attendees. Among consumption quintiles, attendance rate rises sharply moving from poorer quintiles to richer ones.
5.6 Net Attendance Rate
Net attendance ratio (NAR) is related to the number of students in the specified age group who are currently attending school. For example, the primary school attendance ratio is the percentage of children of primary school age that are attending primary school. NAR for primary level is defined as the ratio of children of primary school age currently attending primary school to all children of primary school age. The specified age groups used in the calculation of net attendance rates are: 5-9 years for primary, 10-12 years for lower secondary, 13-14 years for secondary, 15-16 years for higher secondary and 17-22 years for tertiary levels of education.
Overall NARs are 69, 27 and 15 percent for primary, lower secondary and secondary schooling level respectively (Table 5.16). The NAR for girls is higher than that for boys in primary, lower secondary and secondary levels but in other levels NAR are slightly lower for girls compared with that of boys.
Disparities across consumption quintiles are very noticeable at higher levels of schooling than in primary level.
5.7 Mean Year of Schooling
Overall, the mean year of schooling is 8.1 years. For the adults, the mean years of schooling is estimated to be 8.1 years. There is no significant gender gap in mean years of schooling. However, disparities across urban and rural areas are quite wide. Relative to rural areas, urban areas have higher mean years of schooling (9.6 versus 7.5 years).

83
Among development regions, the central region has the highest mean years of schooling (8.5 years) while the mid-western region has the lowest value (7.5 years). Among ecological zones, the hills ranks first with respect to the mean years of schooling.
There is a distinct pattern across consumption quintiles. Mean years of schooling rises from the poorest quintile (6 years) to the richest quintile (some 10 years).
By age-groups, mean years of schooling higher among younger cohorts and decreases with the increase of age.
5.8 Gross Enrollment
Gross enrollment rate (GER) is defined as the ratio of the total number of students enrolled in school at a given level of education, irrespective of their age, to the total number of children in the age group specified for that level of education. The specified age group for primary level is 6-10 years, while it is 11-13 years for lower secondary, 14-15 years for the secondary, 16-17 years for the higher secondary and 18-23 years for tertiary level. Early or delayed entry and repetitions will result in GER to exceed 100.
Gross enrollment rates are presented in Table 5.15. According to the survey, the GERs are estimated to be 122 percent, 87 percent and 74 percent for primary, lower secondary and secondary schooling level respectively. Except for the lower secondary level of schooling, boys GERs are higher than those for girls.
There is a sharp decline in GER from primary to secondary level for the poorest consumption quintile (124 percent vs. 41 percent) while the richest quintile exhibits about the same (110 percent vs. 107 percent).
5.9 Type of School Attended
Overall, 72 percent of currently school/college enrolled populations attended government/community schools (Table 5.17). The participation rate in private schools stands at 27 percent. Among development regions, the mid-west and the far-west have much lower private school participation rates (16 percent and 17 percent respectively). Urban areas have less than half of their school enrollees in private schools (56 versus 20 percent). About 60 percent of the students from the richest quintile are currently attending private schools while 6 percent of students from the poorest quintile are in private institutions.
In urban areas, more than one half of the students attend private schools while the proportion in the rural areas is only 20 percent.
5.10 Reason for Dropouts
Table 5.18 shows 25 percent of these dropouts cite “poor academic progress” while 22 percent report “help needed at home” as the primary reason for leaving school. 17 percent leave school

84
because of “married”. Other reasons are “parent did not want” (7 percent) and “too expensive” (7 percent).
Box 5.1: Summary statistics of literacy and education (Percent)
Nepal Living Standards Survey
1995/96 2003/04 2010/11
Literacy rate of population 6 years and above 37.8 50.6 60.9
Adult literacy rate, both sexes (15 years and above) 35.6 48.0 56.5
Males 53.5 64.5 71.6
Females 19.4 33.8 44.5
School ever attended, both sexes (15 years and above) 33.9 45.8 54.6
Males 50.2 61.2 69.6
Females 19.1 32.6 42.9
Mean years of schooling 7.0 7.5 8.1
Net enrollment* at primary school, both sexes 57 72 68.8
Males 67.0 77.9 67.2
Females 46.0 66.9 70.2
Net enrollment* at lower secondary school, both sexes 19.0 29.0 26.7
Males 23.0 31.1 26.9
Females 14.0 26.4 26.5
Net enrollment* at secondary school, both sexes 9.0 15.1 15.0
Males 13.0 16.8 15.7
Females 6.0 13.4 14.2
Attendance in private school, both sex 7.5 16.7 26.8
* Net attendance rate for NLSS-III.

85
Table 5.1: Literacy rates by gender
(Percent)
Male Female Total Male Female Total Male Female TotalDevelopment Region
Eastern 72.3 51.5 60.9 73.8 52.2 61.9 72.9 44.3 56.9Central 67.6 46.6 56.3 68.8 47.3 57.3 69.5 42.7 54.9Western 74.9 56.9 65.0 76.1 57.6 65.9 75.2 51.3 61.4Mid West 71.5 53.0 61.5 73.0 53.5 62.4 69.2 42.8 54.1Far West 70.4 47.4 57.5 72.2 48.6 59.0 73.8 40.0 54.1Ecological Zone
Mountains 69.6 45.3 56.4 70.7 45.8 57.2 66.4 32.4 47.5Hills 77.5 59.4 67.6 78.8 59.9 68.5 76.7 52.1 62.9Tarai 64.9 43.5 53.3 66.4 44.3 54.4 67.6 39.1 51.6Urban/Rural
Urban 84.9 68.4 76.2 85.9 69.0 76.9 87.0 65.8 75.6Rural 67.2 46.5 55.9 68.7 47.2 56.9 67.2 39.1 51.3Analytical Domain
Mountains 69.6 45.3 56.4 70.7 45.8 57.2 66.4 32.4 47.5Urban-Kathmandu Valley 91.3 77.5 84.2 92.3 78.0 84.9 93.7 75.4 84.3Urban-Other Hills 89.0 71.8 79.7 89.3 72.0 80.0 88.0 66.1 76.0Urban- Tarai 78.3 61.0 69.0 79.6 61.7 70.0 81.1 59.1 69.0Rural Hills- Eastern 74.4 58.8 66.1 75.5 58.8 66.5 72.2 46.4 58.1Rural Hills- Central 68.9 52.1 59.7 70.0 53.0 60.6 67.0 45.8 55.2Rural Hills- Western 79.0 59.7 68.2 80.3 60.2 69.0 75.5 52.2 61.7Rural Hills- Mid & Far Western 71.0 49.4 58.9 73.1 50.1 60.1 69.8 37.4 50.8Rural Tarai- Eastern 69.1 42.9 54.5 70.8 43.9 55.9 70.7 37.7 52.1Rural Tarai- Central 53.7 27.9 39.9 55.1 28.5 40.8 56.3 23.6 38.4Rural Tarai- Western 61.2 44.7 52.2 62.4 45.8 53.3 65.4 39.1 50.4Rural Tarai - Mid & Far Western 68.9 53.8 60.6 70.4 54.6 61.7 70.7 47.5 57.1Consumption Quintile
Poorest 53.9 36.3 44.0 55.8 37.2 45.3 52.4 25.3 36.8Second 61.7 42.9 51.5 63.3 43.6 52.6 59.9 32.9 44.8Third 67.8 47.8 56.9 69.3 48.5 57.9 67.3 40.5 52.2Fourth 78.1 55.4 65.8 78.8 55.8 66.3 77.5 49.3 61.6Richest 89.6 69.7 78.9 90.1 70.0 79.3 90.9 66.3 77.4
Nepal 70.8 50.7 59.9 72.2 51.4 60.9 71.6 44.5 56.5
Population 5 yrs and older Population 6 yrs and older Population 15 yrs and older

86
Table 5.2: Literacy rates by age group and urban/rural area(Percent)
Male Female Total Male Female Total Male Female Total 6 - 9 67.2 67.5 67.4 51.8 54.0 53.0 54.2 56.0 55.2 10-14 93.0 91.5 92.3 86.3 82.8 84.6 87.3 84.3 85.815-19 96.3 90.9 93.6 94.4 82.5 87.7 94.8 84.1 88.920-24 96.3 91.3 93.4 87.3 67.7 74.9 89.8 73.1 79.525-29 93.1 82.7 87.1 83.7 54.4 64.9 86.2 60.5 70.130-34 92.2 73.1 81.8 77.2 39.8 54.1 81.2 47.0 60.735-39 86.7 67.9 76.3 70.4 26.3 44.0 74.3 35.1 51.240-44 87.4 55.8 70.6 67.1 23.4 41.8 72.0 30.2 48.245-49 83.5 43.9 62.8 60.0 14.6 36.9 65.4 21.6 43.050-54 78.5 37.3 58.7 46.9 7.1 25.1 53.3 12.0 31.255-59 76.8 38.9 57.0 53.9 4.7 29.9 57.7 11.1 34.760 and+ 63.8 16.2 38.3 34.1 2.9 18.9 38.7 5.3 22.1
Urban Nepal Rural Nepal NepalAge Group (years)

87
Table 5.3: Percentage distribution of educational status of population 6 years and older by gender
Never attended
school
Attended School in the past
Currently in School
Never attended
school
Attended School in the past
Currently in School
Never attended
school
Attended School in the past
Currently in School
Development RegionEastern 22.7 36.6 40.7 42.9 21.2 35.9 33.8 28.1 38.1
Central 24.8 39.3 35.9 46.7 22.2 31.1 36.6 30.1 33.3
Western 20.2 36.5 43.3 40.3 26.1 33.6 31.3 30.8 37.9
Mid West 24.2 28.3 47.5 45.3 17.0 37.7 35.6 22.2 42.2
Far West 18.1 29.9 52.0 43.9 15.5 40.6 32.6 21.8 45.6
Ecological ZoneMountains 24.3 27.7 48.0 49.3 10.9 39.7 37.9 18.6 43.5
Hills 20.5 37.0 42.5 39.7 24.4 35.9 31.0 30.1 38.9
Terais 24.6 36.1 39.2 47.5 20.3 32.2 37.1 27.5 35.4
Urban/ RuralUrban 12.1 47.7 40.2 30.4 34.1 35.5 21.8 40.5 37.7
Rural 25.5 32.9 41.6 47.4 18.5 34.1 37.5 25.0 37.5
Analytic DomainMountains 24.3 27.7 48.0 49.3 10.9 39.7 37.9 18.6 43.5
Urban-Kathmandu Valley 6.9 56.5 36.6 23.3 42.3 34.4 15.3 49.2 35.5
Urban-Hills 11.4 42.9 45.7 30.6 32.0 37.4 21.7 37.0 41.2
Urban- Terais 16.3 43.6 40.1 34.8 30.4 34.8 26.2 36.5 37.3
Rural- Eastern Hills 24.6 33.4 42.0 41.4 18.9 39.6 33.7 25.6 40.7
Rural- Central Hills 28.7 34.1 37.2 46.0 19.5 34.4 38.3 26.0 35.7
Rural- Western Hills 21.1 34.4 44.5 40.1 27.5 32.4 31.8 30.5 37.7
Rural - Mid & Far Western Hills 23.2 27.7 49.1 46.4 14.7 39.0 36.3 20.3 43.4
Rural- Eastern Terai 23.3 36.1 40.7 47.1 19.4 33.5 36.5 26.8 36.7
Rural- Central Terai 32.0 34.9 33.1 58.7 16.0 25.4 46.3 24.7 29.0
Rural- Western Terai 24.2 35.2 40.5 46.8 18.4 34.8 36.6 26.0 37.4
Rural - Mid & Far Western Terai 22.3 30.0 47.8 41.7 20.1 38.3 32.9 24.5 42.5
Consumption QuintilePoorest 32.9 25.3 41.7 53.0 10.8 36.1 44.2 17.2 38.6
Second 28.8 29.3 41.9 49.8 15.4 34.8 40.2 21.8 38.1
Third 25.6 32.8 41.6 46.5 20.2 33.3 37.0 26.0 37.0
Fourth 19.2 39.8 41.1 41.5 25.0 33.5 31.3 31.7 36.9
Richest 9.9 49.8 40.4 31.2 34.5 34.3 21.3 41.5 37.1
Nepal 22.8 35.9 41.3 44.1 21.5 34.4 34.4 28.0 37.5
Male Female Total

88
Table 5.4: Distribution of educational status by urban/ rural and age group(Percent)
Never attended
school
Attended school in the past
Currently in school
Never attended
school
Attended school in the past
Currently in school
Never attended
school
Attended school in the past
Currently in school
6 - 10 4.4 0.2 95.5 6.8 0.2 93.0 6.4 0.2 93.4 10 -14 2.4 3.5 94.1 4.9 2.8 92.4 4.5 2.9 92.715-19 4.8 18.1 77.1 9.9 21.7 68.5 8.8 20.9 70.320-24 6.2 48.0 45.9 23.4 53.1 23.5 19.2 51.8 29.025-29 13.1 71.3 15.6 35.7 60.2 4.2 30.4 62.8 6.930-34 20.8 75.3 3.9 47.9 50.5 1.6 41.4 56.4 2.235-39 25.5 72.7 1.8 57.0 42.2 0.9 49.9 49.0 1.140-44 33.3 65.7 1.0 60.6 38.4 1.0 54.5 44.5 1.045-49 42.1 57.7 0.2 66.5 33.3 0.2 60.7 39.1 0.250-54 47.0 52.3 0.7 77.8 22.1 0.1 72.2 27.6 0.255-59 49.4 49.9 0.7 73.4 26.6 0.0 69.1 30.8 0.160 and+ 71.3 28.7 0.0 88.2 11.8 0.0 85.4 14.6 0.0
Urban NepalAge Group (years)
Rural Nepal Nepal
Table 5.5: Percentage distribution of educational status of urban population by gender and age group
Never attended
school
Attended school in the past
Currently in school Total
Never attended
school
Attended school in the
past
Currently in school Total
6 - 10 3.7 0.3 96.0 100 5.1 0.0 94.9 100 10 - 14 2.0 2.8 95.2 100 2.7 4.2 93.1 10015-19 1.5 20.2 78.4 100 7.9 16.2 75.9 10020-24 2.9 46.1 51.1 100 8.7 49.4 42.0 10025-29 7.2 74.2 18.6 100 17.3 69.3 13.5 10030-34 8.5 85.7 5.7 100 31.1 66.5 2.4 10035-39 13.8 83.0 3.3 100 34.9 64.5 0.6 10040-44 14.1 83.7 2.2 100 50.0 50.0 0.0 10045-49 18.5 81.1 0.5 100 63.7 36.3 0.0 10050-54 23.1 76.0 1.0 100 72.9 26.7 0.4 10055-59 27.9 71.6 0.5 100 69.1 30.0 0.9 10060 and+ 50.7 49.3 0.0 100 89.2 10.8 0.0 100
Age Group (years)
Male Female

89
Table 5.6: Percentage distribution of educational status of rural population by gender and age group
Never attended
school
Attended school in the past
Currently in school Total
Never attended
school
Attended school in the past
Currently in school Total
6 - 10 6.8 0.2 93.0 100 6.8 0.1 93.1 100 10 - 14 3.7 2.6 93.8 100 6.2 2.9 90.9 10015-19 3.7 18.0 78.3 100 14.7 24.5 60.8 10020-24 10.1 59.1 30.8 100 31.2 49.6 19.2 10025-29 13.6 80.1 6.4 100 47.9 49.1 3.0 10030-34 22.0 75.6 2.4 100 63.9 35.0 1.1 10035-39 27.2 71.0 1.9 100 77.0 22.8 0.3 10040-44 32.8 65.1 2.1 100 80.8 19.0 0.2 10045-49 43.0 56.6 0.5 100 89.2 10.8 0.0 10050-54 57.1 42.6 0.3 100 94.9 5.1 0.0 10055-59 51.2 48.8 0.0 100 96.6 3.4 0.0 10060 and+ 78.7 21.2 0.1 100 98.2 1.9 0.0 100
Age Group (years)
Male Female
Table 5.7: Percentage distribution of educational status of all Nepal by gender and age group
Never attended
school
Attended school in the
past
Currently in school Total
Never attended
school
Attended school in the
past
Currently in school Total
6 - 10 6.3 0.2 93.5 100 6.5 0.1 93.4 100
10 - 14 3.4 2.6 94.0 100 5.6 3.1 91.3 100
15-19 3.2 18.5 78.3 100 13.4 22.9 63.7 100
20-24 8.1 55.5 36.4 100 26.0 49.5 24.4 100
25-29 11.9 78.5 9.6 100 41.3 53.4 5.2 100
30-34 18.4 78.3 3.3 100 56.8 41.8 1.4 100
35-39 23.9 73.9 2.2 100 68.1 31.6 0.4 100
40-44 28.3 69.6 2.1 100 74.4 25.5 0.2 100
45-49 37.4 62.2 0.5 100 83.1 16.9 0.0 100
50-54 50.2 49.4 0.4 100 91.4 8.6 0.1 100
55-59 47.3 52.6 0.1 100 91.4 8.4 0.2 100
60 and+ 74.4 25.5 0.1 100 96.5 3.5 0.0 100
Age Group (years)
Male Female

90
Table 5.8: Reason for not attending school for all population 6 - 24 years who have never attended school
Young Too expensive
Too far
Help at home
Parents did not
want
Not willing to
attendDisable Other
Development Region
Eastern 6.6 7.5 13.8 0.5 22.0 31.7 18.8 3.2 2.4Central 12.8 6.8 7.3 3.3 24.2 29.4 19.3 2.6 7.1Western 5.4 6.9 6.9 1.5 23.5 27.2 13.4 5.4 15.2Mid West 9.2 7.0 1.3 6.9 33.6 30.7 13.0 4.0 3.6Far West 5.0 10.0 3.9 1.7 32.0 34.1 12.0 4.6 1.7Ecological Zone
Mountains 8.5 3.1 0.0 9.4 49.7 27.3 7.5 3.1 0.0Hills 4.7 9.7 3.7 6.7 33.0 27.3 9.4 4.6 5.6Terais 12.2 6.7 9.3 1.1 20.4 31.2 20.9 3.0 7.3Urban/Rural
Urban 4.3 7.3 8.6 0.3 18.2 27.9 22.8 6.6 8.3Rural 9.7 7.1 7.2 3.3 26.3 30.2 16.6 3.0 6.2Analytic Domain
Mountains 8.5 3.1 0.0 9.4 49.7 27.3 7.5 3.1 0.0Urban-Kathmandu Valley 1.2 0.0 0.0 0.0 24.8 24.8 25.3 12.5 12.5Urban-Hills 0.8 0.0 14.5 0.0 56.6 0.0 0.0 28.9 0.0Urban- Terais 8.0 8.3 9.1 0.0 15.8 29.7 23.9 4.9 8.4Rural- Eastern Hills 3.1 12.5 4.2 4.2 37.4 16.5 12.5 0.0 12.7Rural- Central Hills 10.1 7.6 4.3 9.8 32.6 28.1 7.6 4.4 5.5Rural- Western Hills 2.3 5.1 0.0 0.0 31.3 47.7 5.4 10.5 0.0Rural - Mid & Far Western Hills 6.8 14.7 3.6 6.3 32.1 24.7 11.1 2.5 4.9Rural- Eastern Terai 8.8 6.9 16.4 0.0 17.4 35.9 21.1 2.3 0.0Rural- Central Terai 21.3 6.7 8.5 1.8 22.4 29.8 21.9 1.8 7.1Rural- Western Terai 10.9 7.1 9.3 2.0 21.7 23.6 13.5 3.1 19.6Rural - Mid & Far Western Terai 6.7 3.4 0.0 0.0 19.8 44.3 21.4 8.0 3.3Consumption Quintile
Poorest 16.6 10.2 8.6 4.9 24.2 29.1 16.1 1.2 5.8Second 12.0 6.2 8.5 1.0 28.5 28.6 18.7 2.5 5.9Third 7.5 3.6 4.5 3.9 22.3 34.4 19.0 3.5 8.7Fourth 4.0 3.4 4.4 0.3 26.7 29.9 18.3 9.6 7.3Richest 2.2 7.5 4.8 2.1 28.5 30.7 7.8 14.2 4.5
Nepal 8.7 7.2 7.3 3.1 25.5 30.0 17.2 3.4 6.4
Reason for not attending school (%)Who have never
attended school (%)

91
(Percent)
Young Too expensive
Too far
Help at home
Parents did not
want
Not willing to attend Disable Other
Development RegionEastern 3.0 16.5 13.2 2.6 10.1 10.8 31.7 12.3 2.6
Central 7.4 11.8 6.7 2.8 15.4 15.5 32.7 6.5 8.6
Western 3.7 12.6 9.4 4.7 4.8 10.3 25.4 11.8 21.1
Mid West 4.7 13.3 0.0 8.4 19.7 18.6 25.2 7.8 7.1
Far West 2.2 32.0 0.0 0.0 12.9 16.7 32.5 5.9 0.0
Ecological ZoneMountains 2.8 0.0 0.0 12.1 29.1 19.6 19.1 20.0 0.0
Hills 2.5 18.8 2.0 10.9 21.4 18.4 14.0 9.6 4.9
Tarai 7.1 13.0 8.7 1.0 10.1 13.0 36.1 7.2 10.9
Urban/ RuralUrban 2.4 14.0 2.8 1.2 13.8 15.7 37.0 9.9 5.6
Rural 5.3 13.7 7.2 4.0 13.5 14.4 29.7 8.1 9.4
Analytical DomainMountains 2.8 0.0 0.0 12.1 29.1 19.6 19.1 20.0 0.0
Urban-Kathmandu Valley 0.6 0.0 0.0 0.0 0.0 25.3 49.5 25.3 0.0
Urban-Other Hills 0.5 0.0 0.0 0.0 48.9 0.0 0.0 51.1 0.0
Urban- Tarai 4.4 16.1 3.3 0.0 13.1 16.0 38.6 6.4 6.4
Rural Hills- Eastern 1.7 33.6 0.0 16.8 16.1 0.0 16.8 0.0 16.8
Rural Hills- Central 6.2 4.1 4.2 12.5 29.3 28.9 12.5 8.5 0.0
Rural Hills- Western 0.8 32.8 0.0 0.0 0.0 34.3 0.0 32.8 0.0
Rural Hills- Mid & Far Western 3.6 36.6 0.0 10.8 15.9 5.4 15.7 5.4 10.3
Rural Tarai- Eastern 3.6 12.4 19.1 0.0 0.0 18.2 37.8 12.4 0.0
Rural Tarai- Central 12.0 13.6 8.4 0.0 13.5 10.3 37.3 5.2 11.8
Rural Tarai- Western 8.9 10.8 10.8 5.4 5.5 8.0 27.1 8.1 24.3
Rural Tarai - Mid & Far Western 4.4 10.8 0.0 0.0 10.4 26.5 42.1 10.2 0.0
Consumption QuintilePoorest 10.3 14.6 8.6 5.8 14.0 14.5 27.9 1.1 13.5
Second 6.5 20.2 7.2 1.3 8.6 9.6 38.4 7.9 6.9
Third 3.0 2.9 3.5 3.0 13.1 22.1 33.7 18.9 2.8
Fourth 2.4 0.0 6.2 1.1 24.5 16.5 24.9 20.6 6.3
Richest 1.5 22.7 0.0 6.3 16.0 18.1 11.9 19.0 6.1
Nepal 4.8 13.7 6.8 3.7 13.5 14.5 30.4 8.3 9.1
Who have never
attended school (%)
Reason for not attending school

92
Table 5.10: Reason for not attending school for female population 6 - 24 years who have never attended school(Percent)
Young Too expensive Too far
Help at home
Parrent did not
want
Not willing to attend Disable Other
Development Region
Eastern 9.6 5.3 14.0 0.0 24.9 37.0 15.5 0.9 2.3
Central 17.4 5.0 7.5 3.5 27.3 34.5 14.5 1.2 6.5
Western 7.0 4.2 5.7 0.0 32.6 35.3 7.6 2.4 12.3
Mid West 13.3 5.1 1.7 6.4 38.0 34.5 9.1 2.8 2.5
Far West 7.3 4.1 4.9 2.1 37.1 38.7 6.5 4.3 2.1
Ecological Zone
Mountains 13.3 3.6 0.0 8.9 53.4 28.7 5.4 0.0 0.0
Hills 6.7 6.9 4.3 5.3 36.7 30.2 7.9 3.1 5.8
Tarai 16.7 4.4 9.5 1.2 24.2 38.0 15.3 1.4 6.0
Urban/Rural
Urban 6.2 5.0 10.6 0.0 19.8 32.1 17.8 5.4 9.2
Rural 13.3 4.9 7.2 3.1 30.6 35.6 12.1 1.3 5.1
Analytical Domain
Mountains 13.3 3.6 0.0 8.9 53.4 28.7 5.4 0.0 0.0
Urban-Kathmandu Valley 1.8 0.0 0.0 0.0 33.2 24.6 17.2 8.2 16.8
Urban-Other Hills 1.1 0.0 20.2 0.0 59.7 0.0 0.0 20.2 0.0
Urban- Tarai 11.2 5.6 11.0 0.0 16.7 34.4 18.8 4.4 9.0
Rural Hills- Eastern 4.2 5.4 5.6 0.0 44.6 22.1 11.0 0.0 11.3
Rural Hills- Central 13.0 8.8 4.4 8.8 33.8 27.8 5.9 2.9 7.5
Rural Hills- Western 3.7 0.0 0.0 0.0 37.1 50.1 6.4 6.4 0.0
Rural Hills- Mid & Far Western 9.5 8.0 4.8 4.9 37.1 30.7 9.7 1.6 3.3
Rural Tarai- Eastern 13.0 5.6 15.8 0.0 21.3 39.9 17.3 0.0 0.0
Rural Tarai- Central 29.4 4.2 8.6 2.4 25.5 36.8 16.4 0.6 5.4
Rural Tarai- Western 12.6 4.9 8.3 0.0 31.7 33.3 5.0 0.0 16.8
Rural Tarai - Mid & Far Western 8.7 0.0 0.0 0.0 24.0 52.3 12.0 6.9 4.7
Consumption Quintile
Poorest 21.5 8.6 8.6 4.5 28.0 34.5 11.7 1.3 2.9
Second 16.7 1.5 9.0 1.0 35.2 35.0 12.1 0.7 5.5
Third 11.2 3.8 4.8 4.1 24.5 37.2 15.6 0.0 10.0
Fourth 5.4 4.7 3.7 0.0 27.6 35.1 15.8 5.4 7.7
Richest 2.9 0.0 7.1 0.0 34.6 36.8 5.8 11.9 3.7
Nepal 12.0 4.9 7.5 2.8 29.6 35.3 12.7 1.7 5.5
Who have never
attended school (%)
Reason for not attending school

93
Table 5.11: Percentage of population 15 years and older who ever attended school and their mean years of schooling
Percentage who ever attended
school
Mean years of schooling for
those who ever attended
Percentage who ever attended
school
Mean years of schooling for
those who ever attended
Percentage who ever attended
school
Mean years of schooling for
those who ever attended
Development RegionEastern 69.2 8.0 43.2 7.9 54.6 7.9Central 69.1 8.5 42.1 8.5 54.4 8.5Western 71.8 8.0 47.9 7.8 58.0 7.9Mid West 65.4 7.7 39.2 7.2 50.5 7.5Far West 73.6 8.3 39.7 8.1 53.9 8.3Ecological ZoneMountains 64.7 7.7 31.2 7.5 46.1 7.6Hills 72.4 8.4 48.5 8.2 59.0 8.3Tarai 67.6 8.0 39.3 7.9 51.7 7.9Urban/RuralUrban 85.1 9.8 62.7 9.3 73.0 9.6Rural 65.1 7.6 37.9 7.5 49.7 7.5Analytical DomainMountains 64.7 7.7 31.2 7.5 46.1 7.6Urban-Kathmandu Valley 91.9 10.6 72.4 10.3 81.8 10.5Urban-Other Hills 84.9 9.4 60.9 8.9 71.7 9.1Urban- Tarai 79.6 9.2 57.0 8.7 67.2 9.0Rural Hills- Eastern 65.5 7.5 42.8 7.7 53.0 7.6Rural Hills- Central 62.8 7.7 41.9 7.9 51.1 7.8Rural Hills- Western 68.9 7.4 48.1 7.1 56.6 7.3Rural Hills- Mid & Far Western 66.5 7.5 35.3 6.9 48.3 7.2Rural Tarai- Eastern 68.6 8.0 38.5 7.8 51.6 7.9Rural Tarai- Central 59.2 7.1 27.0 6.7 41.5 7.0Rural Tarai- Western 67.2 7.6 37.3 8.0 50.2 7.7Rural Tarai - Mid & Far Western 68.1 7.9 45.2 7.8 54.7 7.8Consumption QuintilePoorest 51.9 6.0 24.5 6.0 36.1 6.0Second 59.7 6.8 32.8 6.5 44.7 6.7Third 64.3 7.3 39.3 7.3 50.2 7.3Fourth 74.4 8.3 47.6 8.0 59.3 8.1Richest 88.1 10.1 62.7 9.6 74.2 9.9
Nepal 69.6 8.2 42.9 8.0 54.6 8.1
Male Female Total

94
Percentage who ever attended
school
Mean years of schooling for those who ever attended
Percentage who ever attended
school
Mean years of schooling for those who ever attended
Percentage who ever attended
school
Mean years of schooling for
those who ever attended
15-19 98.5 9.5 92.1 9.6 95.3 9.6
20-24 97.1 11.0 91.4 10.6 93.8 10.8
25-29 92.8 10.4 82.7 9.8 87.0 10.1
30-34 91.5 9.9 68.9 8.8 79.2 9.4
35-39 86.2 9.7 65.1 8.3 74.5 9.0
40-44 86.0 9.7 50.0 8.0 66.7 9.0
45-49 81.5 9.1 36.3 7.7 57.9 8.6
50-54 76.9 9.0 27.1 8.4 53.0 8.8
55-59 72.1 9.1 30.9 8.2 50.6 8.8
60 and+ 49.3 8.7 10.8 7.9 28.7 8.5
Urban 85.1 9.8 62.7 9.3 73.0 9.6
Age group (years)
Male Female Total
Table 5.12: Percentage of population 15 years and older who ever attended school and their mean years of schooling by age category, Urban Nepal
Percentage who ever attended
school
Mean years of schooling for those who ever attended
Percentage who ever attended
school
Mean years of schooling for those who ever attended
Percentage who ever attended
school
Mean years of schooling for
those who ever attended
15-19 96.3 8.4 85.3 8.0 90.1 8.2
20-24 89.9 8.8 68.8 8.4 76.6 8.6
25-29 86.4 7.9 52.1 6.9 64.3 7.4
30-34 78.0 7.6 36.1 6.5 52.1 7.1
35-39 72.9 7.1 23.1 6.2 43.1 6.8
40-44 67.2 7.2 19.2 5.3 39.4 6.7
45-49 57.0 6.5 10.8 5.1 33.5 6.3
50-54 42.9 6.0 5.1 4.9 22.2 5.8
55-59 48.8 6.2 3.4 4.5 26.6 6.1
60 and+ 21.3 5.6 1.9 4.8 11.8 5.6
Rural 65.1 7.6 37.9 7.5 49.7 7.5
Table 5.13: Percentage of population 15 years and older who ever attended school and their mean years of schooling by age category, Rural Nepal
Age group (years)
Male Female Total

95
Percentage who ever attended
school
Mean years of schooling for those who ever attended
Percentage who ever attended
school
Mean years of schooling for those who ever attended
Percentage who ever attended
school
Mean years of schooling for
those who ever attended
15-19 96.8 8.7 86.6 8.4 91.2 8.5
20-24 91.9 9.5 74.0 9.0 80.8 9.2
25-29 88.1 8.6 58.7 7.8 69.6 8.2
30-34 81.6 8.3 43.2 7.3 58.6 7.9
35-39 76.1 7.9 32.0 7.1 50.1 7.6
40-44 71.7 7.9 25.6 6.4 45.5 7.5
45-49 62.7 7.3 16.9 6.4 39.3 7.1
50-54 49.8 6.9 8.7 6.7 27.8 6.9
55-59 52.7 6.9 8.6 7.0 30.9 6.9
60 and+ 25.6 6.5 3.5 6.6 14.6 6.5
Nepal 69.6 8.2 43.0 8.0 54.6 8.1
Table 5.14: Percentage of population 15 years and older who ever attended school and their mean years of schooling by age category, Nepal
Age group (years)
Male Female Total

96
Table 5.15: Gross enrollment rates by level of schooling and gender
Boys Girls Total Boys Girls Total Boys Girls Total Boys Girls Total Boys Girls TotalDevelopment RegionEastern 121.4 122.6 122.0 95.6 101.9 98.9 78.7 65.7 71.5 74.9 68.7 71.4 15.3 7.8 10.8Central 113.8 105.6 109.4 72.4 82.2 77.1 75.7 58.8 66.3 78.9 78.5 78.7 33.3 21.2 26.2Western 118.4 120.0 119.2 86.2 78.2 82.8 81.7 74.5 78.1 77.5 92.1 84.6 17.9 13.7 15.3Mid West 137.7 131.4 134.6 80.7 93.4 86.5 98.8 70.2 84.0 59.9 49.0 53.5 13.2 3.4 7.3Far West 130.1 142.5 136.2 110.4 95.6 102.6 76.8 82.0 79.3 93.2 89.5 91.3 22.1 9.6 14.3Ecological ZoneMountains 155.9 142.3 149.0 85.6 90.0 87.9 81.6 49.1 64.4 100.1 87.0 93.0 12.7 8.5 10.2Hills 132.1 131.9 132.0 87.8 99.1 93.2 88.3 67.6 76.9 94.1 87.8 90.8 31.0 17.8 23.2Tarai 108.4 105.8 107.1 82.7 80.0 81.4 74.8 69.7 72.2 57.7 62.1 60.1 16.2 9.9 12.3Urban/ RuralUrban 106.2 111.6 108.9 96.6 90.9 93.7 93.7 85.9 89.8 106.9 124.4 115.6 48.4 34.1 40.4Rural 124.5 120.7 122.6 83.1 89.3 86.1 77.9 63.1 70.0 68.1 62.6 65.2 13.8 7.6 10.0Analytical DomainMountains 155.9 142.3 149.0 85.6 90.0 87.9 81.6 49.1 64.4 100.1 87.0 93.0 12.7 8.5 10.2Urban-Kathmandu Valley 113.0 121.4 117.1 87.2 91.5 89.4 89.6 88.5 89.0 139.0 147.3 143.2 72.0 59.6 65.8Urban-Other Hills 113.5 130.3 122.0 110.9 88.7 99.7 98.1 110.0 103.7 119.0 139.5 128.3 42.5 27.5 34.1Urban- Tarai 99.7 99.3 99.5 93.6 91.3 92.5 91.9 74.9 83.6 80.2 102.2 91.5 31.1 21.0 25.0Rural Hills- Eastern 136.4 138.6 137.5 90.3 116.1 103.3 74.1 62.0 67.1 91.8 64.5 76.0 9.6 8.4 8.9Rural Hills- Central 135.9 121.4 127.8 77.1 109.6 93.1 80.5 41.3 56.7 93.9 102.5 98.2 28.3 16.8 20.8Rural Hills- Western 134.9 128.8 131.7 90.1 87.3 88.9 94.5 79.0 87.0 73.3 102.8 86.0 6.1 3.5 4.4Rural Hills- Mid & Far Western 136.6 143.1 140.0 82.6 95.9 89.4 93.1 64.4 76.7 68.8 27.9 44.3 17.1 4.3 9.4Rural Tarai- Eastern 114.7 114.2 114.5 101.3 90.8 95.6 83.7 73.2 78.3 67.1 59.1 62.7 15.4 5.6 9.5Rural Tarai- Central 102.2 90.9 96.2 64.8 52.8 59.7 66.1 54.5 59.7 33.6 22.4 28.3 5.5 4.1 4.6Rural Tarai- Western 102.7 114.2 108.4 70.1 66.1 68.2 58.0 64.8 61.3 60.8 56.1 57.9 16.0 16.1 16.1Rural Tarai - Mid & Far Western 125.4 128.1 126.6 92.1 104.6 97.8 70.0 90.2 79.7 58.4 82.5 72.2 16.3 5.9 9.6Consumption QuintilePoorest 126.9 121.0 123.6 66.7 59.2 62.9 48.3 36.3 41.4 17.4 16.6 17.0 0.9 0.4 0.6Second 121.4 125.6 123.5 78.3 86.1 82.3 68.1 50.8 58.9 44.3 35.2 39.2 5.9 1.3 3.1Third 126.9 117.2 121.8 95.8 102.6 98.8 79.9 68.6 74.0 59.6 54.3 56.8 7.5 4.7 5.7Fourth 118.7 116.6 117.7 91.7 110.8 100.7 91.9 77.1 83.8 105.0 97.6 101.1 19.6 10.3 14.1Richest 109.3 111.3 110.3 96.1 99.0 97.5 110.8 107.3 109.1 134.5 161.8 147.8 59.1 44.2 50.8
Nepal 121.7 119.4 120.5 85.2 89.6 87.3 81.0 67.1 73.6 76.8 74.8 75.7 22.9 13.4 17.1
Primary School Lower Secondary School Secondary School Higher Secondary School Tertiary Level

97
Table 5.16: Net attendance rate by level of schooling and gender
Boys Girls Total Boys Girls Total Boys Girls Total Boys Girls Total Boys Girls TotalDevelopment RegionEastern 69.9 74.6 72.3 26.0 31.7 28.9 13.2 16.3 14.9 3.6 4.5 4.1 5.5 4.5 4.9Central 59.7 63.2 61.6 25.1 28.2 26.6 13.3 18.6 15.9 7.1 4.7 5.8 16.0 10.9 13.1Western 67.9 73.6 70.8 34.9 22.3 28.9 13.1 17.7 15.1 5.3 6.8 6.0 6.0 8.0 7.2Mid West 75.0 72.4 73.7 21.7 23.1 22.4 17.6 9.0 13.6 1.0 2.5 1.8 5.8 2.0 3.5Far West 71.5 74.6 73.1 22.1 24.4 23.2 16.6 11.5 13.8 2.9 2.2 2.6 8.0 5.8 6.7Ecological ZoneMountains 84.5 78.9 81.5 15.2 29.0 22.2 17.2 14.5 15.9 0.0 0.5 0.3 4.1 5.1 4.7Hil ls 73.2 77.3 75.4 31.8 30.7 31.3 13.4 16.1 14.7 6.3 7.0 6.7 13.5 8.9 10.9Terais 59.6 62.9 61.3 23.9 23.1 23.6 14.4 15.5 15.0 3.9 2.7 3.3 6.8 5.8 6.2Urban/ RuralUrban 68.2 70.8 69.5 41.8 36.3 39.0 26.6 25.0 25.8 10.7 9.3 10.0 21.6 18.6 19.9Rural 67.1 70.2 68.7 23.7 25.1 24.4 11.7 13.8 12.8 3.0 3.2 3.1 5.7 4.2 4.8Analytic DomainMountains 84.5 78.9 81.5 15.2 29.0 22.2 17.2 14.5 15.9 0.0 0.5 0.3 4.1 5.1 4.7Uraban-Kathmandu Valley 73.1 80.5 76.6 45.1 53.4 49.2 27.3 33.2 30.6 14.9 12.4 13.6 37.3 27.9 32.7Uraban-Hil ls 77.7 81.9 79.8 56.4 44.9 50.3 28.1 27.2 27.7 11.6 14.9 13.1 11.9 14.8 13.5Uraban- Terais 61.1 61.2 61.1 34.1 23.2 28.7 25.4 19.8 22.8 8.6 5.4 7.0 14.5 14.6 14.6Rural- Eastern Hil ls 77.9 84.2 81.1 26.8 31.2 28.9 11.1 13.0 12.2 4.5 4.0 4.2 1.3 2.7 2.2Rural- Central Hil ls 67.5 66.8 67.1 23.2 30.5 27.1 8.1 11.5 9.7 6.9 7.4 7.2 13.1 12.3 12.6Rural- Western Hil ls 76.2 80.7 78.5 40.0 25.9 32.9 12.8 21.8 15.9 3.9 6.5 5.1 3.9 1.7 2.5Rural - Mid & Far Western Hil ls 70.4 77.2 73.9 20.5 21.2 20.9 8.7 7.5 8.0 1.6 2.7 2.2 8.6 1.7 4.4Rural- Eastern Terai 65.3 68.2 66.8 25.8 32.5 29.4 9.8 17.7 14.1 1.6 3.4 2.5 7.7 3.5 5.1Rural- Central Terai 50.6 56.3 53.6 20.7 15.6 18.4 7.3 15.6 11.3 4.2 0.0 1.8 1.9 0.6 1.2Rural- Western Terai 56.1 65.6 61.0 23.6 12.6 18.7 14.2 13.1 13.6 3.8 4.1 3.9 3.9 10.0 7.7Rural - Mid & Far Western Terai 71.5 68.1 69.8 18.4 32.2 24.2 18.8 10.7 14.9 1.6 1.7 1.6 6.3 3.3 4.4Consumption QuintilePoorest 65.1 66.2 65.7 17.2 13.7 15.3 2.3 4.8 3.6 0.0 0.0 0.0 0.8 0.4 0.5Second 64.8 70.9 67.8 18.5 17.7 18.1 7.2 7.6 7.4 0.9 0.0 0.4 2.3 1.0 1.5Third 63.9 68.6 66.5 28.0 32.4 30.0 13.2 12.5 12.8 2.9 2.0 2.4 1.6 3.0 2.5Fourth 71.7 74.1 72.9 29.8 34.8 32.3 14.9 21.8 18.2 9.3 7.4 8.3 9.8 5.7 7.4Richest 75.5 77.3 76.4 47.1 49.5 48.3 34.0 35.4 34.6 9.9 13.6 11.8 24.6 23.2 23.8
Nepal 67.2 70.2 68.8 26.5 26.9 26.7 14.2 15.7 15.0 4.6 4.4 4.5 9.8 7.1 8.2
Primary School Lower Secondary School Secondary School Higher Secondary School Tertiary Level

98
Table 5.16A: Net enrollment rates* by level of schooling and gender
Boys Girls Total Boys Girls Total Boys Girls Total Boys Girls Total Boys Girls TotalDevelopment RegionEastern 78.2 81.4 79.8 44.3 43.1 43.7 26.8 24.5 25.5 11.8 12.1 12.0 8.1 5.1 6.3Central 71.3 73.7 72.6 38.4 44.0 41.1 31.0 29.1 29.9 18.6 14.0 16.3 20.1 13.4 16.1Western 76.7 84.2 80.5 50.1 38.3 45.0 34.4 28.0 31.2 16.4 12.7 14.6 8.2 9.7 9.1Mid West 81.9 81.7 81.8 36.4 38.4 37.3 31.4 20.2 25.6 2.6 11.5 7.9 6.9 2.3 4.2Far West 81.4 88.4 84.8 44.2 39.4 41.7 27.4 25.3 26.4 5.7 8.9 7.4 10.3 6.4 7.9Ecological ZoneMountains 90.9 85.9 88.4 32.9 39.9 36.6 35.5 21.4 28.1 3.3 6.9 5.2 4.6 6.7 5.9Hills 83.2 86.3 84.8 46.9 45.6 46.3 32.0 27.1 29.3 17.9 16.7 17.3 17.9 11.3 13.9Tarai 69.3 74.0 71.7 39.9 37.6 38.8 28.2 26.1 27.2 10.3 9.4 9.8 8.7 6.6 7.4Urban/ RuralUrban 77.7 79.7 78.7 61.0 52.6 56.8 44.9 41.2 43.0 24.7 25.0 24.8 27.0 21.7 24.1Rural 76.4 80.1 78.3 39.0 39.1 39.1 26.9 23.0 24.8 10.2 9.3 9.7 7.6 5.1 6.1Analytical DomainMountains 90.9 85.9 88.4 32.9 39.9 36.6 35.5 21.4 28.1 3.3 6.9 5.2 4.6 6.7 5.9Urban-Kathmandu Valley 88.4 89.9 89.1 60.8 66.6 63.8 49.3 48.0 48.6 37.1 40.2 38.7 41.3 33.6 37.4Urban-Other Hills 79.3 89.4 84.4 68.5 57.8 63.1 46.4 50.9 48.5 25.2 30.2 27.5 21.3 17.5 19.2Urban- Tarai 72.0 71.4 71.7 57.5 41.5 49.8 42.0 33.3 37.8 17.2 12.9 15.0 18.0 16.1 16.9Rural Hills- Eastern 84.9 88.0 86.4 45.1 43.2 44.1 19.6 22.2 21.1 20.0 12.6 15.7 1.6 3.2 2.5Rural Hills- Central 80.7 77.9 79.1 37.3 48.4 42.8 29.6 20.6 24.1 21.3 14.6 17.9 19.7 14.1 16.1Rural Hills- Western 85.6 90.0 87.9 53.4 39.5 47.7 40.0 25.3 32.8 10.5 8.4 9.6 4.6 2.6 3.3Rural Hills- Mid & Far Western 81.3 86.8 84.2 34.6 36.7 35.6 17.1 20.7 19.1 2.0 8.2 5.7 10.5 2.5 5.7Rural Tarai- Eastern 74.4 76.6 75.5 41.3 41.9 41.6 25.1 26.0 25.6 4.1 9.9 7.3 10.7 4.0 6.7Rural Tarai- Central 60.9 68.9 65.2 34.2 28.5 31.8 20.8 25.9 23.7 9.4 2.1 5.9 2.2 0.7 1.3Rural Tarai- Western 66.6 78.4 72.4 35.1 31.3 33.4 23.1 22.1 22.6 18.5 10.2 13.4 4.4 11.9 9.1Rural Tarai - Mid & Far Western 77.9 81.2 79.4 35.4 46.2 40.3 30.2 21.8 26.2 6.4 14.1 10.8 8.2 3.6 5.2Consumption QuintilePoorest 74.8 77.3 76.2 25.8 24.0 24.9 8.9 6.6 7.6 0.0 3.0 1.6 0.9 0.4 0.6Second 75.4 80.1 77.8 30.5 31.8 31.2 20.0 19.5 19.7 5.5 1.4 3.2 3.3 1.3 2.1Third 75.6 78.4 77.1 44.9 47.5 46.1 24.6 25.6 25.2 10.2 5.8 7.8 2.4 3.7 3.2Fourth 78.3 82.7 80.5 54.0 49.7 52.0 34.7 30.1 32.2 14.5 20.9 17.9 12.8 7.1 9.4Richest 81.3 85.3 83.3 62.0 64.3 63.1 60.5 52.3 56.5 31.1 29.8 30.5 32.2 27.4 29.5
Nepal 76.6 80.0 78.4 42.5 41.4 42.0 30.4 26.2 28.2 13.4 12.4 12.9 12.7 8.7 10.3
Primary School Lower Secondary School Secondary School Higher Secondary School Tertiary Level
* The specified age groups used in the calculation of NER are same as those used in 5.8 (page 83)
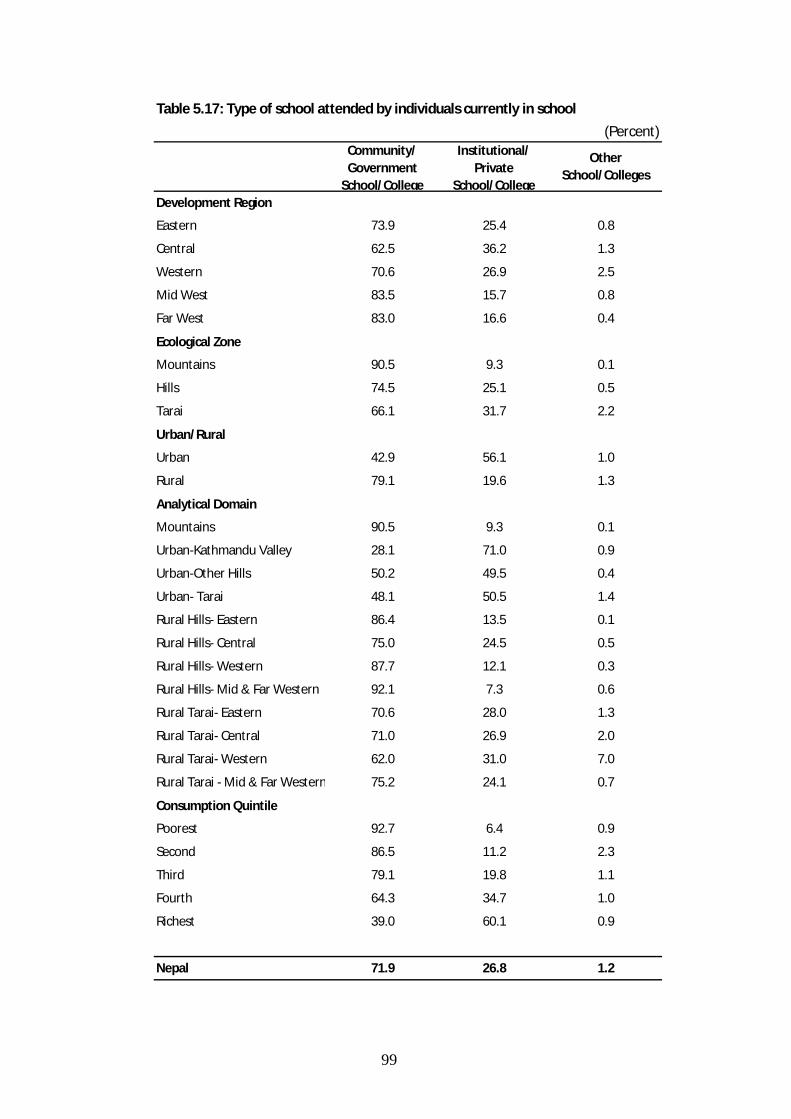
99
Table 5.17: Type of school attended by individuals currently in school(Percent)
Community/ Government
School/ College
Institutional/ Private
School/ College
Other School/ Colleges
Development RegionEastern 73.9 25.4 0.8
Central 62.5 36.2 1.3
Western 70.6 26.9 2.5
Mid West 83.5 15.7 0.8
Far West 83.0 16.6 0.4
Ecological ZoneMountains 90.5 9.3 0.1
Hills 74.5 25.1 0.5
Tarai 66.1 31.7 2.2
Urban/ RuralUrban 42.9 56.1 1.0
Rural 79.1 19.6 1.3
Analytical DomainMountains 90.5 9.3 0.1
Urban-Kathmandu Valley 28.1 71.0 0.9
Urban-Other Hills 50.2 49.5 0.4
Urban- Tarai 48.1 50.5 1.4
Rural Hills- Eastern 86.4 13.5 0.1
Rural Hills- Central 75.0 24.5 0.5
Rural Hills- Western 87.7 12.1 0.3
Rural Hills- Mid & Far Western 92.1 7.3 0.6
Rural Tarai- Eastern 70.6 28.0 1.3
Rural Tarai- Central 71.0 26.9 2.0
Rural Tarai- Western 62.0 31.0 7.0
Rural Tarai - Mid & Far Western 75.2 24.1 0.7
Consumption QuintilePoorest 92.7 6.4 0.9
Second 86.5 11.2 2.3
Third 79.1 19.8 1.1
Fourth 64.3 34.7 1.0
Richest 39.0 60.1 0.9
Nepal 71.9 26.8 1.2
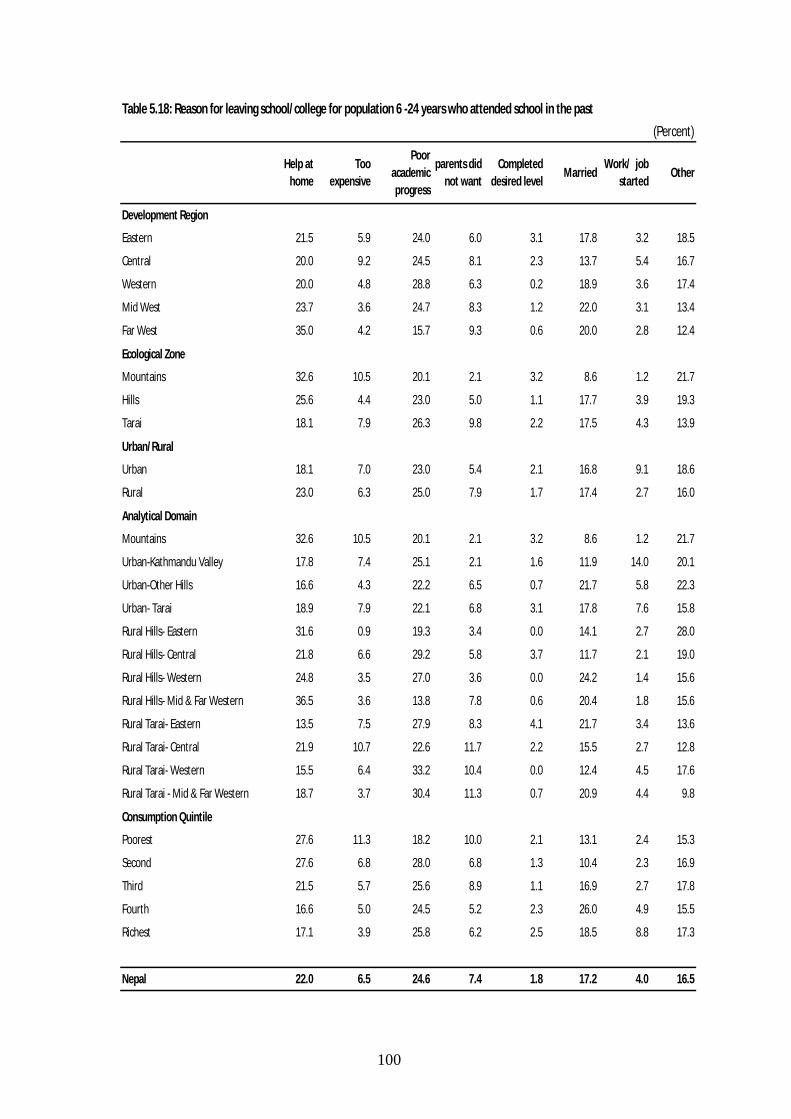
100
Table 5.18: Reason for leaving school/ college for population 6 -24 years who attended school in the past(Percent)
Help at home
Too expensive
Poor academic progress
parents did not want
Completed desired level Married Work/ job
started Other
Development RegionEastern 21.5 5.9 24.0 6.0 3.1 17.8 3.2 18.5
Central 20.0 9.2 24.5 8.1 2.3 13.7 5.4 16.7
Western 20.0 4.8 28.8 6.3 0.2 18.9 3.6 17.4
Mid West 23.7 3.6 24.7 8.3 1.2 22.0 3.1 13.4
Far West 35.0 4.2 15.7 9.3 0.6 20.0 2.8 12.4
Ecological ZoneMountains 32.6 10.5 20.1 2.1 3.2 8.6 1.2 21.7
Hills 25.6 4.4 23.0 5.0 1.1 17.7 3.9 19.3
Tarai 18.1 7.9 26.3 9.8 2.2 17.5 4.3 13.9
Urban/ RuralUrban 18.1 7.0 23.0 5.4 2.1 16.8 9.1 18.6
Rural 23.0 6.3 25.0 7.9 1.7 17.4 2.7 16.0
Analytical DomainMountains 32.6 10.5 20.1 2.1 3.2 8.6 1.2 21.7
Urban-Kathmandu Valley 17.8 7.4 25.1 2.1 1.6 11.9 14.0 20.1
Urban-Other Hills 16.6 4.3 22.2 6.5 0.7 21.7 5.8 22.3
Urban- Tarai 18.9 7.9 22.1 6.8 3.1 17.8 7.6 15.8
Rural Hills- Eastern 31.6 0.9 19.3 3.4 0.0 14.1 2.7 28.0
Rural Hills- Central 21.8 6.6 29.2 5.8 3.7 11.7 2.1 19.0
Rural Hills- Western 24.8 3.5 27.0 3.6 0.0 24.2 1.4 15.6
Rural Hills- Mid & Far Western 36.5 3.6 13.8 7.8 0.6 20.4 1.8 15.6
Rural Tarai- Eastern 13.5 7.5 27.9 8.3 4.1 21.7 3.4 13.6
Rural Tarai- Central 21.9 10.7 22.6 11.7 2.2 15.5 2.7 12.8
Rural Tarai- Western 15.5 6.4 33.2 10.4 0.0 12.4 4.5 17.6
Rural Tarai - Mid & Far Western 18.7 3.7 30.4 11.3 0.7 20.9 4.4 9.8
Consumption QuintilePoorest 27.6 11.3 18.2 10.0 2.1 13.1 2.4 15.3
Second 27.6 6.8 28.0 6.8 1.3 10.4 2.3 16.9
Third 21.5 5.7 25.6 8.9 1.1 16.9 2.7 17.8
Fourth 16.6 5.0 24.5 5.2 2.3 26.0 4.9 15.5
Richest 17.1 3.9 25.8 6.2 2.5 18.5 8.8 17.3
Nepal 22.0 6.5 24.6 7.4 1.8 17.2 4.0 16.5

101
CHAPTER VI: HEALTH SERVICES
6.1 Introduction
Access to health services is critical to individual well-being. This chapter includes results on disability, chronic and acute illnesses, health facility types, consultations and mean expenditures, HIV/AIDS and child immunization.
In the last fifteen years (between 1995/96 and 2010/11), there have been changes in health indicators of Nepal. Several indicators show noticeable improvements. For other indicators, however, the figures are not encouraging. A summary of these health indicators is presented in Box 6.1.
6.2 Chronic Illness
Chronic illness is a long-term suffering and includes the following: cancer, asthma, heart disease, diabetes, kidney problem, epilepsy, respiratory problem, cirrhosis of liver, H/L blood pressure, drug abuse, occupational illness (disability to do any kind of work caused by spine or leg fracture that occurred while in work).
Overall incidence of chronic illness is 12 percent. Of all individuals with chronic illnesses, 31 percent reported gastrointestinal and kidney/liver problem, 15 percent rheumatism, 11 percent H/L blood pressure, 10 percent asthma, 6 percent heart conditions, 5 percent diabetes and 3 percent respiratory, and one percent reported epilepsy. The proportion of asthma and diabetes is higher among males than among females. In contrast, the proportion of rheumatism related illness and gastrointestinal diseases are higher among females than among males (Table 6.1A).
The incidence of chronic illness increases with age and also with household consumption, possibly because of higher reporting of diseases for people in richer quintiles. Difference in reporting of chronic illness for urban and rural areas is minimal (Table 6.1).
6.3 Acute Illness
Acute illness and injuries are defined as sickness (other than chronic illness) and injuries within the last 30 days at the time of enumeration. People were asked whether they were ill or not within the last 30 days.
Of the total population, 20 percent is reported to have been sick or injured within the last 30 days in the country. Cold/fever is by far the most common (31 percent) acute illness followed by other fever (24 percent). Diarrhea makes up for 16 percent of all acute illnesses and physical injury accounts for another 5 percent of illness (Table 6.2).
On average, the incidence is about the same between males and females. Rural area (21 percent) has more incidence than urban area (18 percent). Rural areas of the eastern Tarai, the central

102
Tarai and the western hills have higher incidence (more than 23 percent) relative to other parts of the country.
6.4 Health Consultations by Practitioner Type
About 69 percent of people with an acute illness reported to have consulted with some kind of medical practitioner in the country: 28 percent consulted paramedic, followed by doctor (25 percent), pharmacists (16 percent), and traditional and others (2 percent), (Table 6.3).
Not surprisingly, the share of consultations with a doctor is much higher in urban areas (43 percent) and among richer quintiles (39 percent). On the other hand, the consultation with a paramedics is higher in rural areas, particularly in the mid and far western hills, where as many as 46 percent of acutely ill people visit these paramedics. About 4 percent people of rural-central hill still visits traditional practitioner. The proportion of individuals who do not consult at all is almost the same in all the consumption quintiles.
The proportion of individuals who do not consult any medical practitioner, on the other hand, increases with age of the patient.
6.5 Health Consultations by Facility Type
About 63 percent of visitors go to private health institutions, the remaining go to government institutions. Of all facilities in the country, private clinic is attended by majority of sick people (28 percent). Others are pharmacy (25 percent), hospital/public health center (14 percent), sub-health post (8 percent), health post (8 percent), private hospital (5 percent) and others (7 percent).
More than half of the individuals in the mountains, the rural eastern hills, the rural western hills and the rural mid and far-western hills consult government health facility. On the other hand, proportion of private facility visitors is relatively higher in urban areas compared to the rural areas. Similarly, sick people from the richest households visit private health facilities for treatment.
6.6 Health Expenditures
On average, total cost of treatment at a government health facility is slightly higher than that at a private health institution: Rs. 1,167 at government health institution and Rs. 1,010 at private institution. Dis-aggregating the total cost, except for the cost of medicine, other costs are lower in private institutions than in government facilities (Table 6.7).
Urban areas have expensive consultations relative to their rural counterparts (Rs. 2069 versus Rs. 1040) in government facility; there is a similar trend in the private health facilities.

103
6.7 Immunization
Immunization is an effective measure to protect the children (aged below five) from both fatal diseases as well as non-fatal diseases (such as TB, polio, tetanus, whooping cough, diphtheria and measles). Immunization has a significant role in reducing infant mortality rate.
In the survey information on immunization of children are taken either from the immunization card or from the respondents' reporting on immunization. Children who are given one dose each of BCG and measles, 3 doses each of DPT , polio and hepatitis B (altogether 11 doses) vaccination are regarded as "fully immunized" whereas those of having given vaccination less than 11 doses is regarded as "partially immunized" while that of no dose at all as "not immunized".
About 64 percent of children between 13-59 months old are fully immunized. Gender gap is relatively small. As one would expect, children from richer households are more likely to get fully immunized. The proportion of not immunized children has decreased substantially in the last 15 years (Figure 6.1).
6.8 HIV/AIDS – Knowledge and Prevention
Knowledge of HIV/AIDS and its prevention method were asked individually to all the members (aged 10 years and over) of the household present at the interview.
About 59 percent of respondents report that they have heard about HIV/AIDS. About 65 percent of males reported to have heard of HIV/AIDS compared to 54 percent of females (Figures 6.6).
Main sources of knowledge about HIV/AIDS as reported by the respondents are: radio (39 percent), textbooks (28 percent), friends/relatives (13 percent), television (11 percent), health workers (5 percent), newspapers/pamphlets (4 percent), and other sources (one percent).
Knowledge about prevention methods relate to the prevention efforts and programmes of the government in preventing the HIV/AIDS in the country. This is a multiple answer question. The respondents were asked about their knowledge on preventive measures of HIV/AIDS.
About one in five person of age 10 years and over have no idea about HIV/AIDS prevention methods. On the other hand, major methods of HIV/AIDS prevention reported in the survey are: 50 percent use of condom, 36 percent limiting sex to one partner only, 27 percent avoiding use of needles, and 26 percent avoiding blood transfusion (Table 6.9).
It is interesting to note that the lowest proportion of respondents that do not know about HIV/AIDS is in the far-western development region. The proportion of respondents not knowing preventive methods of HIV/AIDS is more or less the similar in the first four consumption quintiles - about one-fifth of respondents in each quintile have no idea at all. In the richest quintile about 12 percent of respondents have no idea of HIV/AIDS prevention.

104
6.9 Disability
Disability is a physical or mental condition of a person who has some problems in any part of body or physical and mental system, and as such the person feels difficulty in carrying out daily activities normally or in participating fully in social life due to the existing physical, social, and cultural environment.
The survey includes these types of disabilities – physical, visual, hearing, hearing and seeing, speaking, mental and multiple disabilities.
Overall, 3.6 percent of people have some kind of disability. Similarly, the disability rates for males and females are 4.2 percent and 3.0 percent respectively.
Of all persons with some kind of disability, 29.2 percent are physically disabled, 22.3 percent have visual related disability, 23.4 percent hearing related disability, 2.4 percent vision/hearing related disability, 8.6 percent speech related disability, 6.8 percent mentally retarded and 7.3 percent have multiple disability.
The proportion of disability is comparatively lower in the higher consumption quintiles, whereas the proportion increases with the age of the respondent.
Box 6.1: Summary statistics of health services
Nepal Living Standards Survey Description
1995/96 2003/04 2010/11
Percent of population with chronic illness 6.5 5.4 11.7
Percent of population with acute illness 9.0 13.0 20.0
Percentage of acute illness type
Diarrhea 15.5
Dysentery 17.0 11.4
1.7
Cold/fever 30.6
Other fever
43.7 41.2
23.5
Respiratory 5.2 7.7 2.4
Consultation to health practitioner by type (percentage)
Doctor 34.8 26.0 24.6
Paramedic 25.0 36.1 27.8
Not consulted 34.4 33.9 30.6

105
Box 6.1: Summary statistics of health services
Nepal Living Standards Survey Description
1995/96 2003/04 2010/11
Immunization status of children (below five years of age)
Percent fully immunized 36.0 59.4 38.7
Percent partially immunized 42.8 33.2 56.9
Percent not immunized 21.1 7.4 4.5
Percent of population (10 years and above)
Who have heard of HIV/AIDS - 57.6 59.1
Who do not know the means of HIV/AIDS prevention - - 18.4
Percent of respondents (10 years and above) reporting
the method of preventing HIV/AIDS as
Use of condom - - 50.4
Limit sex to single partner - - 36.0
Avoid use of needles (injection) - - 26.9
Avoid blood transfusion - - 25.9
Disability
Both sexes - - 3.6
Males - - 4.2
Females - - 3.0

106
Table 6.1: Percentage of population reporting chronic illnesses by gender
Male Female Total
Development RegionEastern 11.6 13.5 12.6
Central 10.8 14.5 12.8
Western 8.4 13.7 11.3
Mid West 9.6 13.2 11.5
Far West 5.1 7.6 6.5
Ecological ZoneMountains 9.5 13.1 11.4
Hills 9.9 13.5 11.9
Tarai 9.9 13.2 11.7
Urban/ RuralUrban 10.0 13.0 11.6
Rural 9.9 13.4 11.8
Analytical DomainMountains 9.5 13.1 11.4
Urban-Kathmandu Valley 10.8 11.3 11.0
Urban-Other Hills 10.5 14.4 12.6
Urban- Tarai 9.0 13.3 11.3
Rural Hills- Eastern 11.6 13.8 12.8
Rural Hills- Central 8.9 12.1 10.6
Rural Hills- Western 10.3 17.8 14.4
Rural Hills- Mid & Far Western 8.5 11.1 10.0
Rural Tarai- Eastern 12.3 13.7 13.1
Rural Tarai- Central 11.6 16.6 14.2
Rural Tarai- Western 5.4 7.7 6.7
Rural Tarai - Mid & Far Western 7.6 10.4 9.1
Consumption QuintilePoorest 7.1 8.5 7.9
Second 8.1 10.6 9.4
Third 10.1 13.6 12.0
Fourth 11.2 16.6 14.1
Richest 12.8 17.5 15.3
Age Group0 - 5 years 1.0 0.8 0.9
6 - 14 years 1.1 1.0 1.1
15 - 44 years 7.6 12.2 10.3
45 - 59 years 22.5 34.3 28.6
60+ years 36.4 39.6 38.0
Nepal 9.9 13.3 11.7

107
Table 6.1A: Percentage distribution of types of chronic illness by genderIllness type Male Female Total
Heart related 5.0 5.8 5.5
Respiratory 3.8 2.3 2.9
Asthma 12.7 8.7 10.3
Epilepsy 1.4 1.2 1.3
Cancer 0.0 0.3 0.2
Diabetes 6.5 3.5 4.7
Kidney/ liver diseases 2.1 1.0 1.4
Rheumatism related 13.0 15.9 14.8
Gynecological problem 0.0 7.4 4.5
Occupational illness 0.8 0.2 0.5
High/ low blood pressure 11.0 10.6 10.8
Gastrointestinal diseases 28.6 30.1 29.5
Other 15.0 12.9 13.7
Total 100.0 100.0 100.0

108
Table 6.2: Percentage of distribution of acute illnesses by type
Diarrhoea Dysentry Res-piratory
Mailaria Cold/ Fever/ Flu
Other Fever
Skin Disease
Injury Others Total
GenderMale 15.2 1.8 2.7 1.7 31.0 24.1 1.8 6.1 15.5 100.0Female 15.8 1.7 2.1 0.9 30.1 23.1 2.2 3.8 20.4 100.0Development RegionEastern 11.4 1.8 1.7 0.8 27.4 32.7 1.8 4.5 17.9 100.0Central 15.7 1.8 1.6 1.4 33.7 21.0 1.4 4.8 18.6 100.0Western 16.0 1.5 3.0 0.7 31.0 22.1 2.7 4.8 18.1 100.0Mid West 17.8 1.4 5.4 2.5 29.0 18.1 2.1 4.7 19.1 100.0Far West 26.8 2.8 1.6 1.5 27.3 14.0 4.1 7.8 14.1 100.0Ecological ZoneMountains 17.4 1.7 2.7 0.9 35.9 11.1 0.3 4.3 25.5 100.0Hills 16.3 1.7 3.4 0.8 31.8 19.5 2.3 5.5 18.7 100.0Tarai 14.8 1.8 1.6 1.6 29.0 28.1 2.0 4.5 16.8 100.0Urban/ RuralUrban 13.9 1.5 1.8 1.2 34.3 22.5 2.1 5.3 17.4 100.0Rural 15.9 1.8 2.5 1.3 29.8 23.7 2.0 4.8 18.3 100.0Analytical DomainMountains 17.4 1.7 2.7 0.9 35.9 11.1 0.3 4.3 25.5 100.0Urban-Kathmandu Valley 19.1 1.0 3.2 2.5 35.8 14.6 0.8 5.9 17.0 100.0Urban-Other Hills 11.4 1.6 1.9 0.5 36.9 22.4 2.4 5.4 17.6 100.0Urban- Tarai 13.0 1.7 1.1 1.0 31.6 26.9 2.6 5.1 17.0 100.0Rural Hills- Eastern 16.3 0.8 1.8 0.5 24.9 25.4 2.1 9.4 18.6 100.0Rural Hills- Central 13.3 3.0 2.2 0.5 30.9 18.3 0.8 3.6 27.3 100.0Rural Hills- Western 17.7 1.7 3.7 0.4 33.9 18.6 3.0 5.1 15.8 100.0Rural Hills- Mid & Far Western 18.2 1.7 6.5 1.3 30.3 17.7 3.5 4.7 16.0 100.0Rural Tarai- Eastern 8.5 2.4 1.9 1.2 28.1 36.5 1.7 2.7 16.9 100.0Rural Tarai- Central 17.9 1.7 1.0 2.1 32.2 26.2 1.8 4.6 12.5 100.0Rural Tarai- Western 14.7 1.3 2.3 1.3 23.5 28.0 2.5 4.1 22.3 100.0Rural Tarai - Mid & Far Western 21.9 1.0 2.3 2.5 24.4 16.5 1.6 7.2 22.6 100.0Consumption QuintilePoorest 17.4 2.3 3.3 0.8 28.4 24.8 2.6 4.9 15.4 100.0Second 15.7 1.0 2.5 1.2 28.8 26.3 2.5 4.9 17.1 100.0Third 16.5 2.0 2.2 1.8 30.4 22.6 2.1 4.8 17.6 100.0Fourth 14.7 1.9 2.4 1.0 30.4 24.5 1.4 5.5 18.2 100.0Richest 13.3 1.4 1.6 1.4 34.8 19.6 1.4 4.2 22.3 100.0Age Group0 - 5 years 19.2 2.1 5.0 1.0 33.7 22.9 2.6 2.9 10.6 100.06 - 14 years 9.2 1.1 1.0 1.1 34.7 31.3 2.8 5.8 13.1 100.015 - 44 years 15.4 1.5 0.9 1.4 29.0 22.7 1.9 4.9 22.3 100.045 - 59 years 17.2 1.8 2.0 1.8 26.5 20.2 0.9 6.1 23.5 100.060+ years 19.6 3.0 5.9 1.1 26.6 16.3 0.7 5.0 21.7 100.0
Nepal 15.5 1.7 2.4 1.3 30.5 23.5 2.0 4.9 18.1 100.0

109
Table 6.2A: Percentage of population reporting acute illnesses by genderMale Female Total
Development RegionEastern 22.7 22.9 22.8
Central 20.2 19.7 20.0
Western 21.8 20.7 21.2
Mid West 18.8 21.1 20.0
Far West 12.1 12.9 12.5
Ecological ZoneMountains 18.0 17.7 17.8
Hills 18.3 18.5 18.4
Tarai 22.3 22.1 22.2
Urban/ RuralUrban 18.1 18.0 18.1
Rural 20.7 20.7 20.7
Analytical DomainMountains 18.0 17.7 17.8
Urban-Kathmandu Valley 13.8 13.9 13.9
Urban-Other Hills 18.7 18.3 18.5
Urban- Tarai 20.7 20.5 20.6
Rural Hills- Eastern 19.7 21.4 20.6
Rural Hills- Central 16.2 16.3 16.2
Rural Hills- Western 24.0 22.1 23.0
Rural Hills- Mid & Far Western 16.1 17.9 17.1
Rural Tarai- Eastern 24.9 24.7 24.8
Rural Tarai- Central 24.5 22.5 23.4
Rural Tarai- Western 19.6 19.6 19.6
Rural Tarai - Mid & Far Western 17.6 21.6 19.8
Consumption QuintilePoorest 17.2 17.2 17.2
Second 21.3 19.1 20.1
Third 23.0 22.9 22.9
Fourth 21.9 22.5 22.2
Richest 17.7 19.4 18.6
Age Group0 - 5 years 34.2 28.9 31.6
6 - 14 years 18.8 16.6 17.7
15 - 44 years 15.4 18.3 17.1
45 - 59 years 21.2 22.7 22.0
60+ years 20.2 24.3 22.2
Nepal 20.2 20.2 20.2

110
Table 6.3: Percentage of health consultations for acute illnesses by status and practitioner type
Doctor Para-medic
Kaviraj/ Vaidya
Phar-macist
Traditional/Other
GenderMale 23.9 28.5 0.3 16.7 1.1 29.5 100.0Female 25.0 27.4 0.4 14.4 1.3 31.5 100.0Development RegionEastern 21.8 30.4 0.4 14.0 1.2 32.4 100.0Central 29.6 20.3 0.2 14.5 1.7 33.7 100.0Western 25.2 31.4 0.3 17.5 0.9 24.7 100.0Mid West 16.7 36.0 0.8 16.5 0.9 29.0 100.0Far West 20.1 33.0 0.0 19.3 0.3 27.3 100.0Ecological ZoneMountains 20.2 26.9 0.0 10.3 2.1 40.6 100.0Hills 20.8 32.3 0.2 12.1 1.8 32.8 100.0Tarai 27.7 24.8 0.5 18.6 0.7 27.7 100.0Urban/ RuralUrban 43.4 11.9 0.5 13.2 0.5 30.4 100.0Rural 20.6 31.2 0.3 16.0 1.4 30.6 100.0Analytical DomainMountains 20.2 26.9 0.0 10.3 2.1 40.6 100.0Urban-Kathmandu Valley 52.2 3.1 0.6 6.2 0.2 37.7 100.0Urban-Other Hills 33.6 15.8 1.1 19.2 1.8 28.5 100.0Urban- Tarai 43.8 13.9 0.3 13.9 0.0 28.1 100.0Rural Hills- Eastern 11.3 42.9 0.0 4.6 1.9 39.3 100.0Rural Hills- Central 23.9 27.0 0.0 8.9 3.9 36.3 100.0Rural Hills- Western 16.2 36.8 0.2 14.8 1.1 30.9 100.0Rural Hills- Mid & Far Western 9.3 45.7 0.0 17.0 1.3 26.7 100.0Rural Tarai- Eastern 21.8 29.0 0.5 19.0 1.3 28.4 100.0Rural Tarai- Central 25.4 23.1 0.3 19.1 0.9 31.2 100.0Rural Tarai- Western 33.0 30.8 0.0 21.5 0.2 14.5 100.0Rural Tarai - Mid & Far Western 20.5 28.5 1.5 20.2 0.3 29.1 100.0Consumption QuintilePoorest 13.9 35.1 0.3 19.2 2.7 28.9 100.0Second 18.2 30.6 0.1 19.0 1.5 30.6 100.0Third 22.2 31.1 0.4 13.7 0.9 31.7 100.0Fourth 28.6 24.9 0.5 14.9 0.6 30.4 100.0Richest 38.9 18.0 0.5 11.2 0.6 30.8 100.0Age Group0 - 5 years 25.8 32.8 0.1 19.2 1.9 20.3 100.06 - 14 years 20.6 32.2 0.2 15.9 0.9 30.3 100.015 - 44 years 26.5 25.0 0.5 15.1 1.0 32.0 100.045 - 59 years 24.8 24.6 0.7 12.0 1.4 36.3 100.060+ years 22.3 24.2 0.0 13.3 1.3 38.9 100.0
Nepal 24.5 27.9 0.3 15.5 1.2 30.6 100.0
ConsultedNot
Consulted Total

111
Table 6.4: Percentage of immunization status of childern aged under five years(Percent)
Boys Girls Total Boys Girls Total Boys Girls TotalDevelopment RegionEastern 70.1 70.2 70.1 28.3 27.0 27.7 1.6 2.8 2.2Central 62.6 58.7 60.7 34.7 38.0 36.3 2.7 3.3 3.0Western 71.5 67.5 69.5 27.2 27.9 27.5 1.3 4.5 2.9Mid West 67.9 66.5 67.2 31.0 31.8 31.4 1.1 1.7 1.4Far West 43.3 51.2 47.0 52.4 41.5 47.3 4.3 7.3 5.7Ecological ZoneMountains 65.7 63.3 64.6 32.1 30.9 31.5 2.3 5.8 3.8Hills 65.4 62.4 63.9 32.1 33.0 32.6 2.5 4.6 3.6Tarai 64.0 64.4 64.2 34.2 33.3 33.8 1.8 2.3 2.0Urban/ RuralUrban 69.5 74.1 71.8 27.2 25.5 26.4 3.3 0.4 1.9Rural 63.9 61.6 62.8 34.2 34.3 34.2 1.9 4.1 3.0Analytical DomainMountains 65.7 63.3 64.6 32.1 30.9 31.5 2.3 5.8 3.8Urban-Kathmandu Valley 68.1 63.5 66.0 31.0 36.5 33.5 0.9 0.0 0.5Urban-Other Hills 77.9 83.0 80.6 18.7 17.0 17.8 3.3 0.0 1.6Urban- Tarai 66.2 75.6 70.8 29.1 23.6 26.4 4.7 0.8 2.8Rural Hills- Eastern 55.7 60.5 58.2 42.9 34.1 38.4 1.4 5.4 3.4Rural Hills- Central 68.2 55.3 61.9 24.4 36.9 30.5 7.4 7.8 7.6Rural Hills- Western 71.8 63.7 67.8 28.2 31.6 29.9 0.0 4.6 2.3Rural Hills- Mid & Far Western 57.5 61.4 59.6 40.9 34.2 37.2 1.6 4.4 3.2Rural Tarai- Eastern 76.3 72.7 74.6 22.7 26.3 24.4 1.0 1.0 1.0Rural Tarai- Central 54.0 55.3 54.6 45.3 42.5 43.9 0.7 2.2 1.4Rural Tarai- Western 68.0 67.3 67.6 30.8 26.8 28.8 1.2 5.9 3.6Rural Tarai - Mid & Far Western 63.4 59.9 61.8 33.2 37.4 35.1 3.4 2.7 3.1Consumption QuintilePoorest 61.4 57.8 59.5 35.6 36.3 36.0 3.1 5.9 4.5Second 61.8 65.1 63.3 36.8 31.5 34.4 1.4 3.4 2.3Third 67.1 63.4 65.2 29.8 34.2 32.1 3.1 2.4 2.7Fourth 71.2 63.4 67.2 28.0 33.8 31.0 0.8 2.8 1.8Richest 67.4 77.7 71.7 31.0 22.3 27.3 1.7 0.0 1.0
Nepal 64.7 63.4 64.1 33.2 33.0 33.1 2.1 3.5 2.8
Fully immunized Partially immunized Not immunized
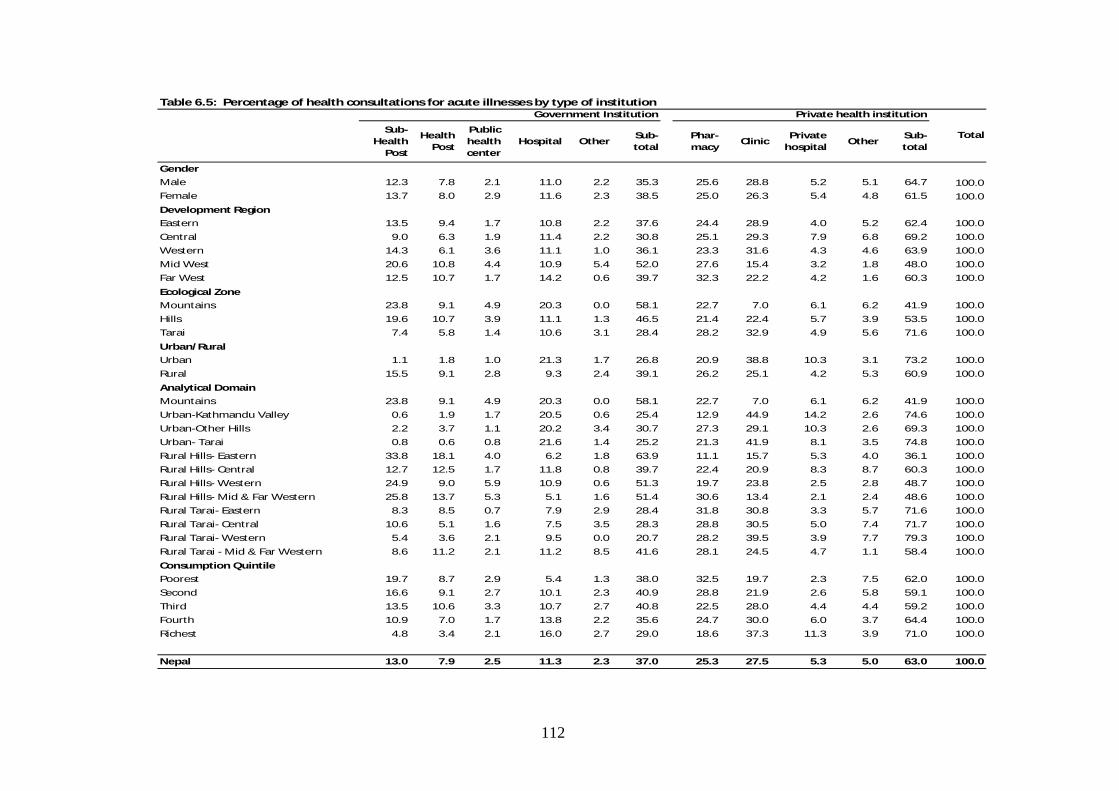
112
Table 6.5: Percentage of health consultations for acute illnesses by type of institution
Sub-Health
Post
Health Post
Public health center
Hospital Other Sub-total
Phar-macy Clinic Private
hospital Other Sub-total
GenderMale 12.3 7.8 2.1 11.0 2.2 35.3 25.6 28.8 5.2 5.1 64.7 100.0Female 13.7 8.0 2.9 11.6 2.3 38.5 25.0 26.3 5.4 4.8 61.5 100.0Development RegionEastern 13.5 9.4 1.7 10.8 2.2 37.6 24.4 28.9 4.0 5.2 62.4 100.0Central 9.0 6.3 1.9 11.4 2.2 30.8 25.1 29.3 7.9 6.8 69.2 100.0Western 14.3 6.1 3.6 11.1 1.0 36.1 23.3 31.6 4.3 4.6 63.9 100.0Mid West 20.6 10.8 4.4 10.9 5.4 52.0 27.6 15.4 3.2 1.8 48.0 100.0Far West 12.5 10.7 1.7 14.2 0.6 39.7 32.3 22.2 4.2 1.6 60.3 100.0Ecological ZoneMountains 23.8 9.1 4.9 20.3 0.0 58.1 22.7 7.0 6.1 6.2 41.9 100.0Hills 19.6 10.7 3.9 11.1 1.3 46.5 21.4 22.4 5.7 3.9 53.5 100.0Tarai 7.4 5.8 1.4 10.6 3.1 28.4 28.2 32.9 4.9 5.6 71.6 100.0Urban/ RuralUrban 1.1 1.8 1.0 21.3 1.7 26.8 20.9 38.8 10.3 3.1 73.2 100.0Rural 15.5 9.1 2.8 9.3 2.4 39.1 26.2 25.1 4.2 5.3 60.9 100.0Analytical DomainMountains 23.8 9.1 4.9 20.3 0.0 58.1 22.7 7.0 6.1 6.2 41.9 100.0Urban-Kathmandu Valley 0.6 1.9 1.7 20.5 0.6 25.4 12.9 44.9 14.2 2.6 74.6 100.0Urban-Other Hills 2.2 3.7 1.1 20.2 3.4 30.7 27.3 29.1 10.3 2.6 69.3 100.0Urban- Tarai 0.8 0.6 0.8 21.6 1.4 25.2 21.3 41.9 8.1 3.5 74.8 100.0Rural Hills- Eastern 33.8 18.1 4.0 6.2 1.8 63.9 11.1 15.7 5.3 4.0 36.1 100.0Rural Hills- Central 12.7 12.5 1.7 11.8 0.8 39.7 22.4 20.9 8.3 8.7 60.3 100.0Rural Hills- Western 24.9 9.0 5.9 10.9 0.6 51.3 19.7 23.8 2.5 2.8 48.7 100.0Rural Hills- Mid & Far Western 25.8 13.7 5.3 5.1 1.6 51.4 30.6 13.4 2.1 2.4 48.6 100.0Rural Tarai- Eastern 8.3 8.5 0.7 7.9 2.9 28.4 31.8 30.8 3.3 5.7 71.6 100.0Rural Tarai- Central 10.6 5.1 1.6 7.5 3.5 28.3 28.8 30.5 5.0 7.4 71.7 100.0Rural Tarai- Western 5.4 3.6 2.1 9.5 0.0 20.7 28.2 39.5 3.9 7.7 79.3 100.0Rural Tarai - Mid & Far Western 8.6 11.2 2.1 11.2 8.5 41.6 28.1 24.5 4.7 1.1 58.4 100.0Consumption QuintilePoorest 19.7 8.7 2.9 5.4 1.3 38.0 32.5 19.7 2.3 7.5 62.0 100.0Second 16.6 9.1 2.7 10.1 2.3 40.9 28.8 21.9 2.6 5.8 59.1 100.0Third 13.5 10.6 3.3 10.7 2.7 40.8 22.5 28.0 4.4 4.4 59.2 100.0Fourth 10.9 7.0 1.7 13.8 2.2 35.6 24.7 30.0 6.0 3.7 64.4 100.0Richest 4.8 3.4 2.1 16.0 2.7 29.0 18.6 37.3 11.3 3.9 71.0 100.0
Nepal 13.0 7.9 2.5 11.3 2.3 37.0 25.3 27.5 5.3 5.0 63.0 100.0
Government Institution Private health institution
Total
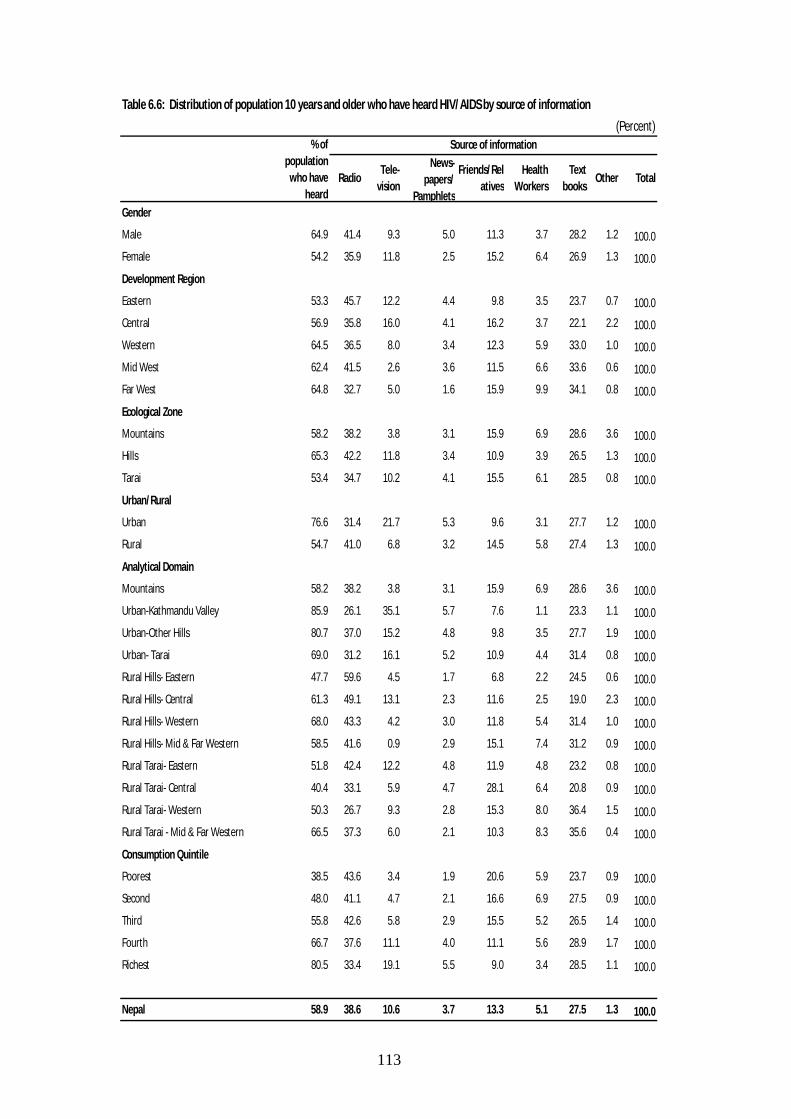
113
Table 6.6: Distribution of population 10 years and older who have heard HIV/ AIDS by source of information(Percent)
Radio Tele-vision
News-papers/
Pamphlets
Friends/ Relatives
Health Workers
Text books Other Total
GenderMale 64.9 41.4 9.3 5.0 11.3 3.7 28.2 1.2 100.0Female 54.2 35.9 11.8 2.5 15.2 6.4 26.9 1.3 100.0Development RegionEastern 53.3 45.7 12.2 4.4 9.8 3.5 23.7 0.7 100.0Central 56.9 35.8 16.0 4.1 16.2 3.7 22.1 2.2 100.0Western 64.5 36.5 8.0 3.4 12.3 5.9 33.0 1.0 100.0Mid West 62.4 41.5 2.6 3.6 11.5 6.6 33.6 0.6 100.0Far West 64.8 32.7 5.0 1.6 15.9 9.9 34.1 0.8 100.0Ecological ZoneMountains 58.2 38.2 3.8 3.1 15.9 6.9 28.6 3.6 100.0Hills 65.3 42.2 11.8 3.4 10.9 3.9 26.5 1.3 100.0Tarai 53.4 34.7 10.2 4.1 15.5 6.1 28.5 0.8 100.0Urban/ RuralUrban 76.6 31.4 21.7 5.3 9.6 3.1 27.7 1.2 100.0Rural 54.7 41.0 6.8 3.2 14.5 5.8 27.4 1.3 100.0Analytical DomainMountains 58.2 38.2 3.8 3.1 15.9 6.9 28.6 3.6 100.0Urban-Kathmandu Valley 85.9 26.1 35.1 5.7 7.6 1.1 23.3 1.1 100.0Urban-Other Hills 80.7 37.0 15.2 4.8 9.8 3.5 27.7 1.9 100.0Urban- Tarai 69.0 31.2 16.1 5.2 10.9 4.4 31.4 0.8 100.0Rural Hills- Eastern 47.7 59.6 4.5 1.7 6.8 2.2 24.5 0.6 100.0Rural Hills- Central 61.3 49.1 13.1 2.3 11.6 2.5 19.0 2.3 100.0Rural Hills- Western 68.0 43.3 4.2 3.0 11.8 5.4 31.4 1.0 100.0Rural Hills- Mid & Far Western 58.5 41.6 0.9 2.9 15.1 7.4 31.2 0.9 100.0Rural Tarai- Eastern 51.8 42.4 12.2 4.8 11.9 4.8 23.2 0.8 100.0Rural Tarai- Central 40.4 33.1 5.9 4.7 28.1 6.4 20.8 0.9 100.0Rural Tarai- Western 50.3 26.7 9.3 2.8 15.3 8.0 36.4 1.5 100.0Rural Tarai - Mid & Far Western 66.5 37.3 6.0 2.1 10.3 8.3 35.6 0.4 100.0Consumption QuintilePoorest 38.5 43.6 3.4 1.9 20.6 5.9 23.7 0.9 100.0Second 48.0 41.1 4.7 2.1 16.6 6.9 27.5 0.9 100.0Third 55.8 42.6 5.8 2.9 15.5 5.2 26.5 1.4 100.0Fourth 66.7 37.6 11.1 4.0 11.1 5.6 28.9 1.7 100.0Richest 80.5 33.4 19.1 5.5 9.0 3.4 28.5 1.1 100.0
Nepal 58.9 38.6 10.6 3.7 13.3 5.1 27.5 1.3 100.0
Source of information% of population who have
heard

114
Table 6.7: Mean expenditure of last consultation in Government and Private institution for acute illness(Current NRs)
Diagnostic & other service
cost
Medicine cost
Travel cost
Total cost
Diagnostic & other service
cost
Medicine cost
Travel cost
Total cost
GenderMale 230 655 134 1,019 212 811 72 1,095
Female 379 776 132 1,286 172 690 69 931
Development RegionEastern 294 583 124 1,001 196 697 75 968
Central 464 925 128 1,518 251 996 77 1,324
Western 339 716 128 1,182 158 583 65 806
Mid West 94 482 74 650 108 514 66 688
Far West 270 1,120 388 1,778 51 404 37 492
Ecological ZoneMountains 302 864 119 1,285 634 616 67 1,317
Hills 391 643 164 1,197 188 649 93 929
Tarai 225 784 100 1,110 168 807 59 1,034
Urban/ RuralUrban 642 1,280 148 2,069 243 780 54 1,077
Rural 266 643 131 1,040 179 740 75 993
Analytical DomainMountains 302 864 119 1,285 634 616 67 1,317
Urban-Kathmandu Valley 1,917 2,253 215 4,385 366 996 68 1,430
Urban-Other Hills 433 773 146 1,352 141 690 39 870
Urban- Tarai 292 1,224 131 1,647 216 698 52 966
Rural Hills- Eastern 574 431 232 1,236 385 835 225 1,445
Rural Hills- Central 214 635 183 1,032 182 555 90 827
Rural Hills- Western 354 697 106 1,157 138 577 106 822
Rural Hills- Mid & Far Western 59 373 165 596 72 485 66 624
Rural Tarai- Eastern 166 784 65 1,015 161 661 44 867
Rural Tarai- Central 250 734 63 1,047 179 1,218 85 1,481
Rural Tarai- Western 345 811 234 1,391 143 588 45 776
Rural Tarai - Mid & Far Western 145 506 115 767 114 437 53 604
Consumption QuintilePoorest 228 497 56 781 53 568 43 663
Second 90 545 54 688 136 648 45 829
Third 225 689 112 1,025 202 909 83 1,194
Fourth 495 800 282 1,577 196 685 57 938
Richest 640 1,215 168 2,022 340 893 118 1,351
Nepal 312 722 133 1,167 191 748 70 1,010
Government institution Private institution

115
Table 6.8: Percentage of population by type of disability(Percent)
Physical Visual HearingVisual
& hearing
Speech Mental Multiple Total
GenderMale 4.2 32.9 19.0 21.4 2.6 9.6 7.9 6.7 100Female 3.0 24.9 26.2 25.9 2.1 7.4 5.6 8.0 100Development RegionEastern 3.5 27.0 21.2 25.7 3.0 9.9 4.6 8.5 100Central 3.5 26.4 24.1 23.9 3.4 7.6 8.8 5.9 100Western 3.1 24.8 20.6 17.1 0.8 14.0 9.9 12.8 100Mid West 4.2 37.3 15.5 30.3 0.7 6.7 4.4 5.1 100Far West 4.1 39.0 31.7 16.9 2.5 2.9 3.9 3.0 100Ecological ZoneMountains 4.9 38.0 23.5 26.6 3.4 3.5 2.3 2.7 100Hills 3.8 26.7 23.1 23.5 2.2 9.0 7.2 8.3 100Tarai 3.2 30.0 21.1 22.7 2.4 9.3 7.4 7.1 100Urban/RuralUrban 2.6 29.8 23.1 17.2 3.4 7.9 11.6 7.0 100Rural 3.8 29.1 22.2 24.4 2.2 8.7 6.1 7.3 100Analytical DomainMountains 4.9 38.0 23.5 26.6 3.4 3.5 2.3 2.7 100Urban-Kathmandu Valley 2.2 30.8 21.6 21.8 3.9 6.5 12.9 2.6 100Urban-Other Hills 3.1 30.5 16.1 16.2 4.8 9.7 9.7 13.0 100Urban- Tarai 2.6 28.5 27.3 15.9 2.3 8.0 12.5 5.6 100Rural Hills- Eastern 4.5 18.3 26.9 26.7 1.2 6.2 3.6 17.1 100Rural Hills- Central 4.1 22.2 26.6 23.4 4.5 9.0 11.1 3.3 100Rural Hills- Western 4.1 23.9 23.7 18.9 1.2 11.9 8.4 11.9 100Rural Hills- Mid & Far Western 4.0 38.1 19.0 29.4 0.0 8.6 1.9 2.9 100Rural Tarai- Eastern 3.3 29.7 19.6 27.4 3.9 12.9 2.6 3.9 100Rural Tarai- Central 3.6 22.6 22.8 27.6 3.1 8.3 7.3 8.3 100Rural Tarai- Western 2.0 28.4 12.8 7.6 0.0 23.3 15.4 12.5 100Rural Tarai - Mid & Far Western 3.8 47.9 18.9 18.5 0.0 0.0 6.6 8.0 100Consumption QuintilePoorest 3.9 25.6 17.2 30.0 2.9 12.3 4.8 7.2 100Second 4.0 34.9 26.7 15.8 1.8 8.7 4.8 7.3 100Third 3.8 29.6 19.6 26.0 2.8 8.3 6.2 7.4 100Fourth 3.3 27.3 25.8 22.1 1.7 6.2 9.5 7.4 100Richest 2.8 28.0 22.8 23.0 2.7 6.1 10.4 7.0 100Age Group0 - 5 years 1.0 45.9 10.0 10.6 0.0 18.6 3.9 11.0 1006 - 14 years 2.0 32.0 14.7 21.6 2.2 10.8 9.5 9.3 10015 - 44 years 3.0 29.1 14.1 23.1 3.3 9.8 13.2 7.4 10045 - 59 years 6.1 27.8 29.7 23.1 1.3 9.0 1.9 7.2 10060+ years 10.5 27.0 32.4 26.8 2.4 4.1 1.7 5.6 100
Nepal 3.6 29.2 22.3 23.4 2.4 8.6 6.8 7.3 100
Disablity
Type of Disability

116
Table 6.9: Percent of population reporting different methods of preventing HIV/ AIDS(Percent)
Abstain from sex
Use condo
m
Limit sex to one
partner
Limit sex to a few partners
Avoid sex with sex workers
Avoid sex with the person having
many sex partners
Avoid sex with drug
users
Avoid blood
transfusio
Avoid use of needles (injection)
Avoid use of blade
Other measures
Do not
knowGenderMale 19.6 55.3 36.1 9.6 18.7 16.0 13.4 26.4 27.7 14.5 10.4 15.5Female 17.0 45.6 35.9 8.5 13.8 15.4 10.6 25.4 26.1 13.6 10.7 21.3Development RegionEastern 18.4 48.0 34.7 10.7 17.5 17.6 11.8 22.8 23.8 9.3 10.5 20.0Central 18.8 45.4 31.1 7.6 13.7 11.6 10.4 21.8 25.1 12.4 15.1 22.2Western 14.1 48.2 40.4 6.1 13.2 14.9 14.2 29.9 29.0 11.3 10.9 18.5Mid West 25.1 61.4 42.9 16.6 23.5 20.0 15.2 27.8 24.6 20.8 3.8 12.8Far West 16.2 62.2 36.7 6.1 18.4 21.2 7.9 35.8 38.6 26.5 3.8 9.9Ecological ZoneMountains 16.2 49.2 32.5 4.3 13.9 10.9 7.7 24.3 19.5 10.4 11.8 23.0Hills 18.5 49.3 35.0 8.1 14.5 14.5 12.9 26.1 26.6 10.6 10.9 17.9Tarai 18.5 51.7 37.7 10.8 18.4 17.7 11.6 26.0 28.3 18.3 10.0 18.3Urban/ RuralUrban 20.0 57.4 37.2 9.4 19.4 17.3 16.0 31.6 32.4 13.4 11.8 12.1Rural 17.8 48.0 35.7 8.9 15.1 15.2 10.6 24.0 25.0 14.2 10.1 20.6Analytical DomainMountains 16.2 49.2 32.5 4.3 13.9 10.9 7.7 24.3 19.5 10.4 11.8 23.0Urban-Kathmandu Valley 21.4 55.7 35.1 8.7 24.9 16.9 24.3 38.4 36.3 11.0 6.7 8.3Urban-Other Hills 26.0 57.9 33.4 7.9 11.2 12.1 10.7 29.3 31.3 11.9 15.4 14.2Urban- Tarai 15.7 58.7 41.2 10.7 20.3 20.6 13.0 28.5 30.6 16.7 13.2 13.2Rural Hills- Eastern 16.6 44.6 28.0 11.1 14.6 14.6 11.9 21.5 21.8 8.2 9.5 20.6Rural Hills- Central 13.8 40.0 29.2 5.2 8.9 6.8 6.2 15.6 16.6 7.7 16.8 29.8Rural Hills- Western 14.2 44.1 41.4 6.6 8.4 17.0 12.3 25.7 25.6 8.2 14.2 18.2Rural Hills- Mid & Far Western 21.8 56.6 38.1 11.0 21.2 19.1 12.5 26.7 29.0 16.9 2.1 14.9Rural Tarai- Eastern 21.4 47.9 35.3 9.9 17.4 16.4 9.9 23.0 25.2 11.4 10.8 20.2Rural Tarai- Central 24.2 38.3 28.5 11.0 12.0 12.9 5.8 16.8 25.8 20.3 13.2 26.4Rural Tarai- Western 7.4 48.3 43.6 4.2 22.3 14.2 19.7 32.0 28.4 12.9 3.4 22.8Rural Tarai - Mid & Far Western 19.0 66.9 43.8 16.6 22.7 24.3 13.5 34.0 32.6 30.7 5.3 8.9Consumption QuintilePoorest 19.6 46.2 31.6 8.0 13.8 15.1 9.9 21.7 26.5 14.4 5.8 21.8Second 17.8 47.5 35.4 9.9 15.7 15.9 8.8 23.2 22.5 13.4 6.6 21.1Third 15.6 46.1 35.9 9.3 16.2 14.8 10.3 23.3 23.6 13.6 9.9 22.8Fourth 19.2 49.5 35.2 8.8 16.2 15.3 11.7 25.5 26.0 13.2 12.4 19.3Richest 19.2 57.0 38.9 9.0 17.5 16.7 15.7 31.0 32.3 15.1 13.4 12.2
Nepal 18.3 50.4 36.0 9.0 16.2 15.7 12.0 25.9 26.9 14.0 10.6 18.4
117
CHAPTER VII: MATERNITY AND FAMILY PLANNING
7.1 Introduction
Fertility is one of the determinants of size and structure of population in a country. It is related to maternity, mother-child health and family planning. The maternity health and family planning are interrelated, and they together have an impact on the quality of population. The number of children ever born (or parity) affects the socio-economic condition of the people in the country. The parity data indicates how average family size varies across age groups. Family size and poverty are positively associated. Information on maternity history of the married women (15-49 years), fertility pattern and family planning practices are presented in this chapter.
Overall, decrease in fertility level (measured in terms of total fertility rate, TFR) in the last 15 years is unprecedented. The TFR decreased from 5.1 in 1995/96 to 3.4 in 2010/11. The level of knowledge and use of family planning methods have also increased over the years (Box 7.1).
7.2 Children Ever Born (CEB)
The number of “children ever born” at various ages of the mother provides one measure of fertility of a population. This measure is used with respect to a specific age group of women. For example, the average number of children born to women ages 45-49 years is the ratio of the total number of children ever born to women ages 45-49 years to the total number of women aged 45-49 years. Overall, the mean number of the children ever born per woman (45-49 years) is estimated to be 4.2.
The rural-mid and far western hills, the rural-central Tarai, the rural eastern hills and the mountains regions each has the higher number of CEB whereas the urban area of the Kathmandu valley has the lowest value of CEB to women ages 45-49 years. Not surprisingly, the urban areas have lower CEB compared to the rural area (Table 7.1).
It is interesting to note that women give birth to 2 children before completing their twenties. In other words, before completing their 30th birthday most of the women exceed their expected life time fertility. However, a slight departure in this pattern is observed in urban areas and more specifically in the Kathmandu valley.
The distribution of the mean number of CEB per woman by consumption quintile, clearly shows that the fertility of women is lower in upper quintiles compared to the lower quintiles.

118
7.3 Fertility Rate (TFR and ASFR)
The total fertility rate (TFR) is the average number of children that would be born to a woman by the time she ended childbearing if she were to pass through all her childbearing years conforming to the age-specific fertility rates of a given year. It is one of the most used indicator of fertility. Total fertility rate (TFR) is the sum of the ASFRs. Age specific fertility rates (ASFR) is calculated by dividing the number of live births to women in a specific age group by the number of women in that age group.
TFR6 for Nepal is estimated to be 3.4 in 2010/11. There is much disparity in the TFR between the urban and rural areas. The urban areas have below replacement level TFR whereas the rural areas show slightly greater TFR than the national average (Table 7.2).
7.4 Knowledge and Use of Family Planning
Knowledge of family planning methods is a “precursor” to use of contraception. About 83 percent of married woman (15-49 years) know about at least one of the family planning methods, 54 percent have ever used it and 39 percent are currently using some form of planning method.
In urban areas, 91 percent of married women of reproductive age know family planning methods, and in rural areas, the corresponding figure is 81 percent. The proportion of women who have ever used family planning method and who are currently using it is higher in urban areas compared to the rural areas.
Knowledge of family planning methods in teenager (15-19 years) married women is 79 percent. Knowledge of family planning methods is as high as 97 percent in the urban-hills followed by the urban-Kathmandu valley (92 percent).
Current use of family planning is highest among women of age group 35-39 years and lowest among women aged 15-19 years. The rural-central Tarai, the rural-eastern hills and the rural-mid and far western hills have least proportion of women using family planning methods currently compared with the other parts of the country.
Both awareness and use of family planning methods are positively associated with the consumption quintiles. People in the upper quintiles have more knowledge of family planning methods than those in the lower quintiles.
7.5 Type of Family Planning Methods used
In response to the question asked to women aged 15- 49 years on the type of family planning methods currently using either by them or by their husbands, 32 percent reported “laproscopy/minilap”. Other methods reported are – vasectomy (15 percent), other temporary
6 TFR for Nepal estimated by the direct method is 2.7 in 2010/11.

119
methods including pills, Depo-Provera, IUD, Norplant, diaphragm, and foam/jelly/cream (41 percent), and condom (12 percent). Laproscopy/minilap and vasectomy are the permanent methods of family planning for females and males respectively (Table 7.4).
The majority couples use temporary rather than permanent methods of family planning. More than fifty percent of teenager uses condom whereas permanent methods of family planning are more common among the older cohorts. The combination of methods changes slightly over different quintiles.
7.6 Reason for not using Family Planning Methods
Knowledge of reasons why women are not using family planning methods is critical to designing effective programmes for providing quality services. Among currently non-users of family planning methods, distribution of major reasons reported are as follows: "husband away home" (33 percent), followed by "want more children" (28 percent), “scared of side effects" (16 percent), and "husband opposed” (3 percent) and “religious reasons" (2 percent).
The fear of side effects is one of the prominent reasons for not using any family planning method. Variations among consumption quintiles are not very substantial. As expected, younger women report "want more children" while older ones report "scared of side effects" as reasons of not using any methods of family planning.
7.7 Source of Knowledge about Family Planning Methods
Knowing source of knowledge about family planning is important for implementing an effective family planning programme. Among the different sources of knowledge about family planning, radio is the most common medium of information. The majority of women, 32 percent, reported radio as the source of information about family planning methods, followed by friends/relatives (27 percent), health workers (18 percent), textbooks (8 percent), husband (7 percent), television (7 percent), and newspaper/poster (one percent). The pattern of this distribution generally holds true across development regions, ecological belts, rural areas, age groups and consumption quintiles. Text book source is more common among younger individuals as compared to the older ones.
7.8 Source of Family Planning Methods
Knowledge about sources of contraception is important for designing family planning policies and programmes. 47 percent of users of family planning methods visit public health facilities to receive those methods, followed by pharmacy (32 percent), private health facility (11 percent) and health workers (10 percent). Public health facilities and pharmacy are the main source of getting the family planning methods for all regions, zones and urban/rural areas.
Individuals at younger ages are more likely to visit pharmacy to get the family planning methods while public health facilities are more popular among older cohorts.

120
7.9 Place of Delivery and Birth Attendants
Babies delivered in safe and clean environment can reduce the health risk of mother and children. Majority of birth deliveries (67 percent) take place at homes, followed by hospitals or primary health facilities (32 percent). In urban areas, however, 72 percent of birth deliveries take place at primary health facilities. In the Kathmandu valley areas, a majority of birth deliveries (92 percent) take place at hospitals or primary health facilities. In rural areas, 74 percent deliveries take place at home as compared to 28 percent in urban areas. Birth delivery at home is the highest in the mountains region (85 percent) followed by the rural-mid and far western hills (84 percent). In households from upper consumption quintiles, the place of delivery is more likely to be a hospital (Table 7.9)
About 58 percent of the total births are assisted by "family members/neighbors", followed by "health practitioners" (33 percent), and TBA (7 percent). In urban areas, 66 percent of the births are assisted by health practitioners followed by family members/neighbors (27 percent). The proportion of birth attended by health practitioners is the highest in the Kathmandu valley urban areas (79 percent). The proportion of births attended by family member decreases sharply with the household consumption quintiles (Table 7.8).
7.10 Prenatal and Postnatal Care
Quality prenatal care can contribute to the prevention of maternal mortality by detecting and managing potential complications and risk factors, including pre-eclampsia, anemia, and sexually transmitted diseases. Pre-natal care also provides opportunities for women to learn the danger signs of pregnancy and delivery, to be immunized against tetanus, to learn about infant care, and to be treated for existing conditions, such as malaria and anemia.
Of all women giving live-births during the past 36 months in the country, 78 percent received some kind of pre-natal care. Of these, 84 percent of pregnant women receive pre-natal care from government health facilities while the remaining 16 percent receive the care from private health facilities. A majority of pregnant women in urban areas receive pre-natal care compared to those in rural areas (93 percent versus 76 percent). Government health facilities are more common than private health facilities for pre-natal checkups.
About 97 percent of the women from the richest consumption quintile receive prenatal care at health facilities while the comparable proportion among women in the poorest quintile is 60 percent.
On the whole, 19 percent of women who give live births receive postnatal care. Of these, 78 percent visit government health facility for the postnatal care, and the remaining 23 percent visit private health facility.
Postnatal care rates are lower than the pre-natal care rates across development regions, ecological zones, urban/rural areas and consumption quintiles (Table 7.9).

121
7.11 Women’s Participation in Decision Making
Women’s empowerment can be measured by their decision making “autonomy”. Women’s participation in the household decision making process is an indicator of this autonomy.
The survey for the first time sought information on women’s participation in fifteen types of different household decisions: children’s education, choice of school for children, personal (her own) health care, pre-natal care, use and method of family planning, children’s health care, expenditure on food, other household expenditure, selling household goods (including livestock), crop cultivation, receiving credit, use of loans, leaving home for job, and use of remittances received. The questions were asked to spouse of male household head (Section 9D) or the female household head (Section 15D).
In all the household decisions specified in the survey, about seven in ten women are “involved a lot” while a half of them actually made final decisions jointly with their spouse. A similar pattern exists in the urban and rural areas (Table 7.10).
Box 7.1: Summary statistics of maternity and family planning
Nepal Living Standards Survey
Description 1995/96 2003/04 2010/11
Average number of children ever born to women (45 -49 years) 5.3 4.8 4.2
Total fertility rate (TFR) 5.1 3.6 3.4
Percent of :
Pregnant woman receiving any prenatal checkup 57.1 78.2
Mothers receiving any postnatal checkup 12.9 19.5
Knowledge and use of family planning methods
Married women (15-49 years) who know of family planning methods
59.7 76.7 82.6
Couples who have ever used any family planning methods 20.4 45.9 54.2
Couples who are currently using family planning methods 14.8 38.3 39.1
Percent of married couples using permanent method of family planning
Males (vasectomy) 19.8 14.7
Females (laproscopy/minilab) 58.5
33.0 32.0

122
Table7.1: Mean number of childern ever born per woman by age group
15 -19 20 - 24 25 - 29 30 - 34 35 - 39 40 - 44 45 - 49 TotalDevelopment RegionEastern 0.1 0.8 1.8 2.8 3.4 4.0 4.4 2.0Central 0.1 0.9 2.0 2.8 3.4 3.6 4.0 2.0Western 0.1 0.9 2.1 2.6 3.5 3.8 4.0 2.1Mid West 0.1 1.0 2.5 3.5 4.1 4.4 4.8 2.3Far West 0.1 1.0 2.3 3.6 4.0 4.4 4.7 2.3Ecological ZoneMountains 0.1 0.8 2.2 3.7 4.5 4.4 5.3 2.4Hills 0.1 0.8 1.9 2.7 3.4 3.7 4.0 2.0Tarai 0.1 1.0 2.1 3.1 3.5 4.0 4.3 2.2Urban/RuralUrban 0.1 0.6 1.4 2.2 2.7 3.2 3.3 1.6Rural 0.1 1.0 2.2 3.1 3.8 4.1 4.5 2.2Analytical DomainMountains 0.1 0.8 2.2 3.7 4.5 4.4 5.3 2.4Urban-Kathmandu Valley 0.0 0.4 1.0 1.6 2.1 2.3 2.4 1.2Urban-Other Hills 0.1 0.6 1.6 2.3 2.8 3.5 3.5 1.7Urban- Tarai 0.1 0.8 1.7 2.7 3.1 3.7 3.7 1.9Rural Hills- Eastern 0.1 0.7 1.6 2.5 3.7 4.2 5.1 2.1Rural Hills- Central 0.1 0.8 2.2 2.9 3.7 3.8 4.1 2.0Rural Hills- Western 0.1 1.1 2.2 2.6 3.6 3.5 4.0 2.2Rural Hills- Mid & Far Western 0.1 1.2 2.5 3.9 4.2 4.7 4.9 2.4Rural Tarai- Eastern 0.1 1.0 2.0 3.0 3.2 3.8 4.1 2.1Rural Tarai- Central 0.2 1.4 2.4 3.3 3.9 4.0 4.9 2.4Rural Tarai- Western 0.1 0.7 2.2 3.1 3.8 4.5 4.4 2.2Rural Tarai - Mid & Far Western 0.1 1.0 2.3 3.2 3.7 4.2 4.4 2.2Consumption QuintilePoorest 0.1 1.4 2.7 4.0 4.8 5.0 5.5 2.7Second 0.1 1.2 2.5 3.4 4.1 4.7 5.3 2.4Third 0.1 1.0 2.0 3.1 3.6 4.0 4.9 2.1Fourth 0.1 0.8 1.7 2.5 3.2 3.6 3.8 1.9Richest 0.0 0.4 1.3 2.0 2.6 3.0 3.1 1.6
Nepal 0.1 0.9 2.0 2.9 3.6 3.9 4.2 2.1
Age group
Age group Urban Rural Nepal 15 - 19 0.04 0.09 0.09 20 - 24 0.20 0.27 0.25 25 - 29 0.13 0.18 0.17 30 - 34 0.07 0.10 0.10 35 - 39 0.03 0.06 0.05 40 - 44 0.00 0.04 0.03 45 - 49 0.01 0.00 0.00
TFR 2.39 3.70 3.43
Table 7.2: Age specific fertility rates (ASFR) and total fertility rates (TFR) (P/ F Ratio method)
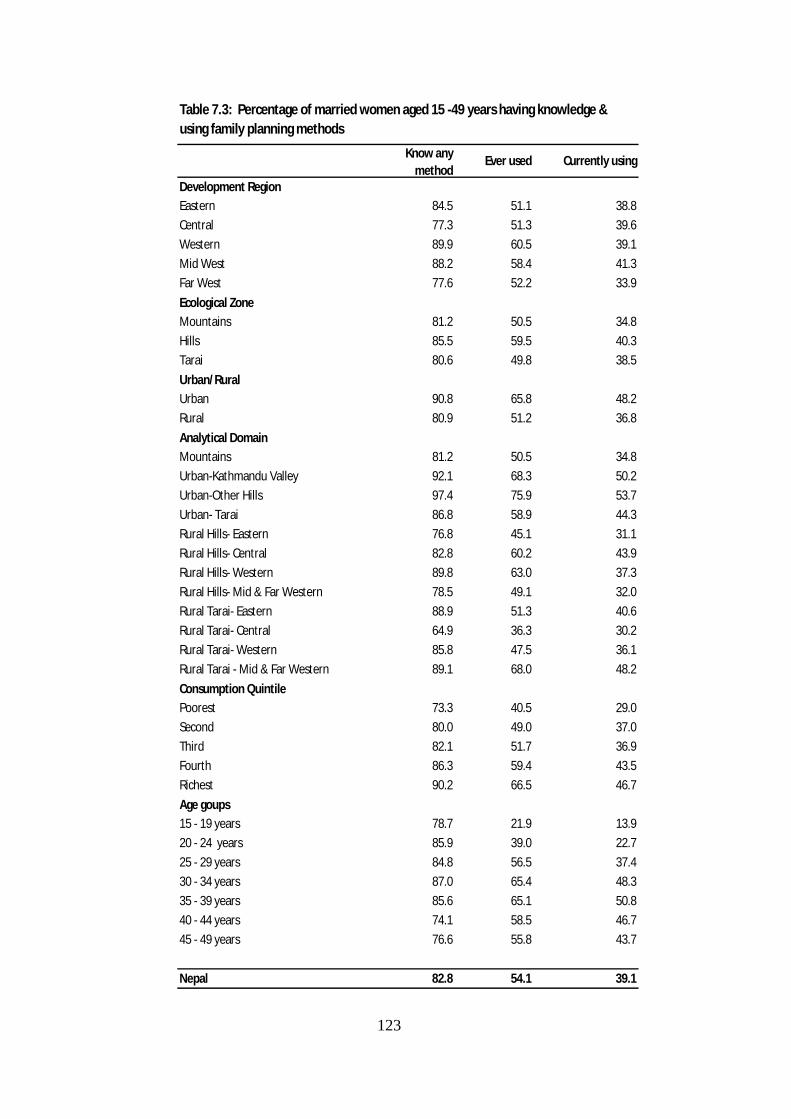
123
Know any method
Ever used Currently using
Development RegionEastern 84.5 51.1 38.8Central 77.3 51.3 39.6Western 89.9 60.5 39.1Mid West 88.2 58.4 41.3Far West 77.6 52.2 33.9Ecological ZoneMountains 81.2 50.5 34.8Hills 85.5 59.5 40.3Tarai 80.6 49.8 38.5Urban/ RuralUrban 90.8 65.8 48.2Rural 80.9 51.2 36.8Analytical DomainMountains 81.2 50.5 34.8Urban-Kathmandu Valley 92.1 68.3 50.2Urban-Other Hills 97.4 75.9 53.7Urban- Tarai 86.8 58.9 44.3Rural Hills- Eastern 76.8 45.1 31.1Rural Hills- Central 82.8 60.2 43.9Rural Hills- Western 89.8 63.0 37.3Rural Hills- Mid & Far Western 78.5 49.1 32.0Rural Tarai- Eastern 88.9 51.3 40.6Rural Tarai- Central 64.9 36.3 30.2Rural Tarai- Western 85.8 47.5 36.1Rural Tarai - Mid & Far Western 89.1 68.0 48.2Consumption QuintilePoorest 73.3 40.5 29.0Second 80.0 49.0 37.0Third 82.1 51.7 36.9Fourth 86.3 59.4 43.5Richest 90.2 66.5 46.7Age goups15 - 19 years 78.7 21.9 13.920 - 24 years 85.9 39.0 22.725 - 29 years 84.8 56.5 37.430 - 34 years 87.0 65.4 48.335 - 39 years 85.6 65.1 50.840 - 44 years 74.1 58.5 46.745 - 49 years 76.6 55.8 43.7
Nepal 82.8 54.1 39.1
Table 7.3: Percentage of married women aged 15 -49 years having knowledge & using family planning methods

124
Table 7.4: Distribution of married couples using family planning methods by type(Percent)
Condom Other Temporary Vasectomy Laproscopy/
Minilap Traditional Total
Development RegionEastern 8.6 48.8 6.0 35.4 1.2 100.0Central 9.6 42.0 14.6 33.2 0.7 100.0Western 14.3 31.4 22.8 30.8 0.8 100.0Mid West 14.6 45.0 17.5 22.0 1.0 100.0Far West 19.4 27.0 14.9 38.2 0.4 100.0Ecological ZoneMountains 15.3 48.5 29.8 5.5 1.0 100.0Hills 14.0 47.7 21.7 15.8 0.8 100.0Tarai 9.2 33.4 6.7 49.7 0.9 100.0Urban/ RuralUrban 16.1 42.3 12.5 27.5 1.4 100.0Rural 10.3 40.1 15.4 33.5 0.6 100.0Analytical DomainMountains 15.3 48.5 29.8 5.5 1.0 100.0Urban-Kathmandu Valley 19.4 63.9 5.7 10.2 0.8 100.0Urban-Other Hills 15.0 34.2 26.3 23.5 0.9 100.0Urban- Tarai 14.4 31.3 8.7 43.4 2.3 100.0Rural Hills- Eastern 8.3 70.9 10.3 10.5 0.0 100.0Rural Hills- Central 8.9 50.6 25.7 13.8 1.0 100.0Rural Hills- Western 16.1 31.5 31.9 19.2 1.3 100.0Rural Hills- Mid & Far Western 15.8 46.0 21.7 16.5 0.0 100.0Rural Tarai- Eastern 6.8 42.8 3.7 46.2 0.5 100.0Rural Tarai- Central 3.7 24.7 6.7 64.9 0.0 100.0Rural Tarai- Western 7.2 34.5 8.6 49.7 0.0 100.0Rural Tarai - Mid & Far Western 15.8 34.3 7.5 40.9 1.5 100.0Consumption QuintilePoorest 8.4 46.9 14.9 29.4 0.3 100.0Second 10.9 44.9 9.8 34.0 0.5 100.0Third 10.8 36.1 13.1 39.6 0.3 100.0Fourth 10.3 38.9 17.8 31.8 1.2 100.0Richest 16.0 39.5 16.3 26.8 1.3 100.0Age goups15 - 19 years 58.8 34.4 0.0 4.5 2.3 100.020 - 24 years 27.1 58.5 2.3 11.4 0.7 100.025 - 29 years 14.3 54.7 9.0 21.9 0.2 100.030 - 34 years 10.3 44.7 11.5 32.7 0.8 100.035 - 39 years 7.4 34.4 21.0 36.6 0.5 100.040 - 44 years 5.4 33.8 18.3 40.5 2.0 100.045 - 49 years 2.8 18.2 27.3 51.2 0.6 100.0
Nepal 11.7 40.7 14.7 32.0 0.8 100.0

125
Table 7.5: Distribution of reasons for not using any family planning methods(Percent)
Not available
Too expensive
Hushand away
Want more
childern
Religious reason
Scared of side
effect
Husband does not
wantOther Total
Development RegionEastern 0.6 0.9 32.0 27.5 1.0 20.4 3.6 13.9 100.0Central 0.6 0.4 22.7 33.2 1.4 15.3 3.0 23.5 100.0Western 0.0 0.7 41.3 21.3 3.7 11.0 3.0 19.0 100.0Mid West 2.6 0.9 34.3 30.4 2.4 16.8 4.4 8.1 100.0Far West 2.3 1.3 43.1 24.5 0.3 14.6 2.1 11.7 100.0Ecological ZoneMountains 2.2 0.0 29.0 32.8 0.7 16.7 5.3 13.3 100.0Hil ls 1.0 0.5 36.4 23.6 0.4 16.1 2.8 19.1 100.0Tarai 0.6 1.1 29.4 31.5 3.4 15.0 3.3 15.7 100.0Urban/ RuralUrban 0.1 0.7 26.3 23.2 2.0 21.6 2.0 24.0 100.0Rural 1.1 0.7 34.0 29.1 1.8 14.2 3.6 15.5 100.0Analytical DomainMountains 2.2 0.0 29.0 32.8 0.7 16.7 5.3 13.3 100.0Urban-Kathmandu Valley 0.3 0.0 18.5 15.5 0.7 29.7 1.7 33.6 100.0Urban-Other Hil ls 0.0 1.6 36.6 23.0 0.5 15.9 0.6 21.8 100.0Urban- Tarai 0.0 0.7 25.9 28.3 3.7 19.6 2.7 19.1 100.0Rural Hi l ls- Eastern 0.7 0.7 31.8 27.7 0.0 21.4 4.3 13.4 100.0Rural Hi l ls- Central 0.6 0.6 26.9 30.9 0.6 12.4 2.4 25.6 100.0Rural Hi l ls- Western 0.0 0.0 49.7 18.7 0.0 10.0 2.8 18.8 100.0Rural Hi l ls- Mid & Far Western 3.9 0.4 41.1 26.1 0.9 16.0 4.3 7.4 100.0Rural Tarai- Eastern 0.9 0.9 32.0 28.9 0.9 19.4 3.0 14.1 100.0Rural Tarai- Central 0.5 0.5 20.6 43.2 2.1 10.4 4.2 18.4 100.0Rural Tarai- Western 0.0 1.6 31.7 24.5 10.5 12.0 3.6 16.1 100.0Rural Tarai - Mid & Far Western 1.7 2.4 42.5 26.4 2.4 12.7 2.9 9.0 100.0Consumption QuintilePoorest 1.9 0.2 34.0 24.3 2.3 20.6 3.4 13.3 100.0Second 0.5 1.4 27.9 29.9 2.7 17.0 5.9 14.6 100.0Third 1.4 1.2 36.2 29.2 2.3 12.5 2.6 14.5 100.0Fourth 0.4 0.6 33.7 32.8 1.2 12.1 2.8 16.6 100.0Richest 0.4 0.2 30.5 23.8 1.1 16.7 1.9 25.4 100.0Age goups15 - 19 years 0.4 0.0 24.1 60.6 1.3 4.7 1.0 8.0 100.020 - 24 years 0.5 0.6 36.4 41.1 0.8 9.3 2.2 9.2 100.025 - 29 years 0.3 0.4 41.4 26.4 1.8 14.9 2.9 11.9 100.030 - 34 years 0.5 0.7 37.9 20.0 2.2 21.4 5.0 12.2 100.035 - 39 years 1.8 1.5 35.8 11.2 1.8 22.4 5.2 20.4 100.040 - 44 years 2.2 0.8 14.8 11.7 3.1 23.6 3.6 40.2 100.045 - 49 years 2.4 1.8 11.0 5.2 4.6 22.3 3.9 48.8 100.0
Nepal 0.9 0.7 32.5 28.0 1.9 15.6 3.2 17.1 100.0
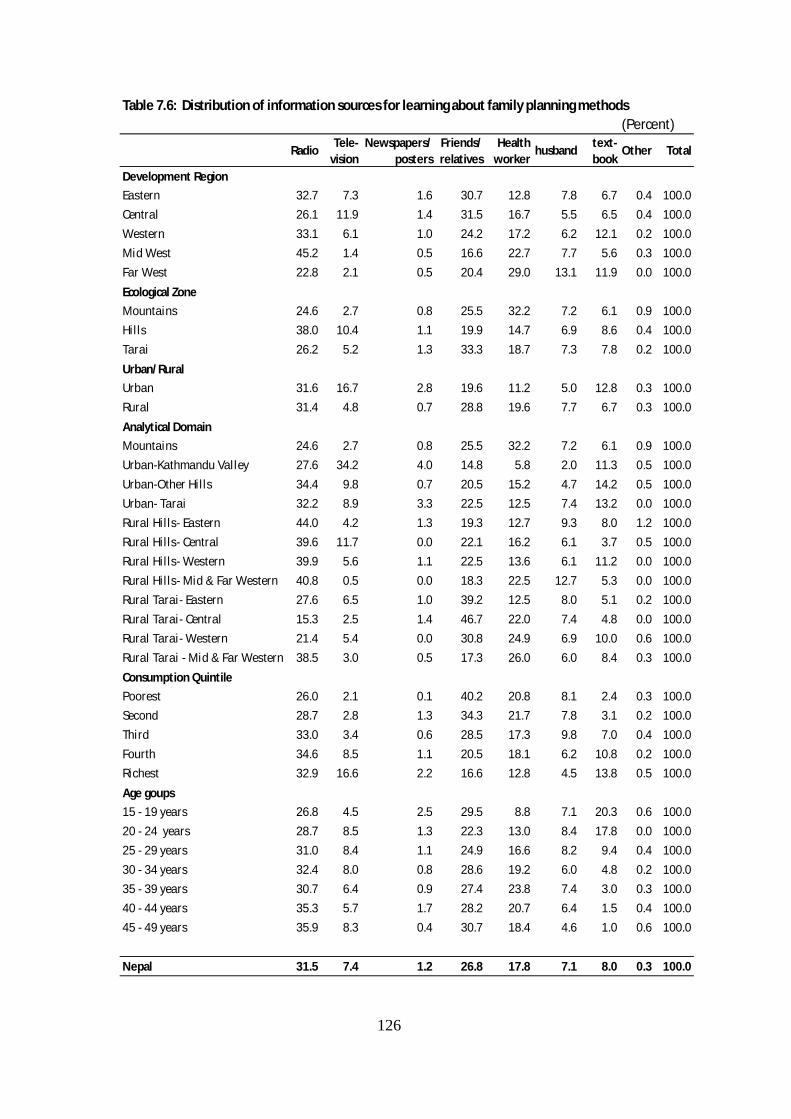
126
Table 7.6: Distribution of information sources for learning about family planning methods(Percent)
Radio Tele-vision
Newspapers/ posters
Friends/ relatives
Health worker husband text-
book Other Total
Development RegionEastern 32.7 7.3 1.6 30.7 12.8 7.8 6.7 0.4 100.0Central 26.1 11.9 1.4 31.5 16.7 5.5 6.5 0.4 100.0Western 33.1 6.1 1.0 24.2 17.2 6.2 12.1 0.2 100.0Mid West 45.2 1.4 0.5 16.6 22.7 7.7 5.6 0.3 100.0Far West 22.8 2.1 0.5 20.4 29.0 13.1 11.9 0.0 100.0Ecological ZoneMountains 24.6 2.7 0.8 25.5 32.2 7.2 6.1 0.9 100.0Hil ls 38.0 10.4 1.1 19.9 14.7 6.9 8.6 0.4 100.0Tarai 26.2 5.2 1.3 33.3 18.7 7.3 7.8 0.2 100.0Urban/ RuralUrban 31.6 16.7 2.8 19.6 11.2 5.0 12.8 0.3 100.0Rural 31.4 4.8 0.7 28.8 19.6 7.7 6.7 0.3 100.0Analytical DomainMountains 24.6 2.7 0.8 25.5 32.2 7.2 6.1 0.9 100.0Urban-Kathmandu Valley 27.6 34.2 4.0 14.8 5.8 2.0 11.3 0.5 100.0Urban-Other Hil ls 34.4 9.8 0.7 20.5 15.2 4.7 14.2 0.5 100.0Urban- Tarai 32.2 8.9 3.3 22.5 12.5 7.4 13.2 0.0 100.0Rural Hil ls- Eastern 44.0 4.2 1.3 19.3 12.7 9.3 8.0 1.2 100.0Rural Hil ls- Central 39.6 11.7 0.0 22.1 16.2 6.1 3.7 0.5 100.0Rural Hil ls- Western 39.9 5.6 1.1 22.5 13.6 6.1 11.2 0.0 100.0Rural Hil ls- Mid & Far Western 40.8 0.5 0.0 18.3 22.5 12.7 5.3 0.0 100.0Rural Tarai- Eastern 27.6 6.5 1.0 39.2 12.5 8.0 5.1 0.2 100.0Rural Tarai- Central 15.3 2.5 1.4 46.7 22.0 7.4 4.8 0.0 100.0Rural Tarai- Western 21.4 5.4 0.0 30.8 24.9 6.9 10.0 0.6 100.0Rural Tarai - Mid & Far Western 38.5 3.0 0.5 17.3 26.0 6.0 8.4 0.3 100.0Consumption QuintilePoorest 26.0 2.1 0.1 40.2 20.8 8.1 2.4 0.3 100.0Second 28.7 2.8 1.3 34.3 21.7 7.8 3.1 0.2 100.0Third 33.0 3.4 0.6 28.5 17.3 9.8 7.0 0.4 100.0Fourth 34.6 8.5 1.1 20.5 18.1 6.2 10.8 0.2 100.0Richest 32.9 16.6 2.2 16.6 12.8 4.5 13.8 0.5 100.0Age goups15 - 19 years 26.8 4.5 2.5 29.5 8.8 7.1 20.3 0.6 100.020 - 24 years 28.7 8.5 1.3 22.3 13.0 8.4 17.8 0.0 100.025 - 29 years 31.0 8.4 1.1 24.9 16.6 8.2 9.4 0.4 100.030 - 34 years 32.4 8.0 0.8 28.6 19.2 6.0 4.8 0.2 100.035 - 39 years 30.7 6.4 0.9 27.4 23.8 7.4 3.0 0.3 100.040 - 44 years 35.3 5.7 1.7 28.2 20.7 6.4 1.5 0.4 100.045 - 49 years 35.9 8.3 0.4 30.7 18.4 4.6 1.0 0.6 100.0
Nepal 31.5 7.4 1.2 26.8 17.8 7.1 8.0 0.3 100.0

127
Table 7.7: Distribution of sources of getting family planning methods(Percent)
Public health facility
Private health facility
Pharmacy Health worker Others Total
Development RegionEastern 45.2 6.8 29.2 17.3 1.5 100.0Central 49.0 12.2 31.9 5.5 1.3 100.0Western 39.4 10.6 38.9 10.1 1.0 100.0Mid West 57.1 11.6 20.1 10.6 0.6 100.0Far West 44.2 11.6 39.0 5.2 0.0 100.0Ecological ZoneMountains 73.1 1.9 23.1 1.9 0.0 100.0Hills 48.8 11.8 29.4 8.7 1.2 100.0Tarai 41.3 10.2 34.6 12.8 1.1 100.0Urban/ RuralUrban 25.5 18.7 49.8 4.2 1.7 100.0Rural 55.5 7.4 24.2 12.0 0.9 100.0Analytical DomainMountains 73.1 1.9 23.1 1.9 0.0 100.0Urban-Kathmandu Valley 26.1 21.8 47.7 2.0 2.4 100.0Urban-Other Hills 26.3 14.4 53.0 5.4 0.9 100.0Urban- Tarai 22.7 18.3 51.3 6.3 1.4 100.0Rural Hills- Eastern 59.1 2.6 11.7 26.6 0.0 100.0Rural Hills- Central 67.4 9.7 17.6 3.5 1.8 100.0Rural Hills- Western 47.3 6.8 31.1 13.5 1.4 100.0Rural Hills- Mid & Far Western 64.1 11.3 15.4 9.1 0.0 100.0Rural Tarai- Eastern 45.9 6.4 28.6 16.9 2.1 100.0Rural Tarai- Central 55.1 2.2 25.6 17.1 0.0 100.0Rural Tarai- Western 46.5 10.3 31.1 12.1 0.0 100.0Rural Tarai - Mid & Far Western 40.3 13.0 34.7 11.0 1.0 100.0Consumption QuintilePoorest 64.5 8.5 15.6 10.7 0.7 100.0Second 57.7 8.4 21.2 12.7 0.0 100.0Third 44.2 8.9 28.3 16.5 2.1 100.0Fourth 50.7 8.9 32.3 7.8 0.3 100.0Richest 30.9 15.2 46.4 5.3 2.2 100.0Age goups15 - 19 years 34.4 3.0 57.6 2.5 2.5 100.020 - 24 years 36.4 12.7 39.1 11.8 0.0 100.025 - 29 years 48.6 12.4 30.5 8.4 0.2 100.030 - 34 years 46.3 11.7 30.4 8.9 2.7 100.035 - 39 years 54.2 8.0 23.7 12.5 1.6 100.040 - 44 years 54.6 8.5 25.5 11.0 0.3 100.045 - 49 years 53.9 9.9 24.2 11.0 0.9 100.0
Nepal 47.4 10.5 31.1 9.9 1.1 100.0

128
Table 7.8: Distribution of birth deliveries by place and assistance of delivery(Percent)
HomePrimary
health facility
Hospital/ Private
hospitalOther
Family member/
Neighbour
Traditional birth
attendant
Health practioner
None and
otherDevelopment Region
Eastern 61.4 5.8 32.2 0.7 49.7 8.7 40.0 1.6
Central 66.0 3.3 29.1 1.6 54.5 9.0 34.4 2.1
Western 64.7 6.9 27.1 1.3 57.6 4.6 36.2 1.6
Mid West 76.6 9.1 13.9 0.4 77.2 2.9 18.8 1.2
Far West 72.8 6.5 18.3 2.4 60.5 9.5 28.5 1.5
Ecological Zone
Mountains 84.7 8.1 6.4 0.9 78.5 5.2 15.4 0.8
Hi l ls 67.0 5.8 26.3 0.9 58.9 6.0 33.1 2.0
Tarai 64.5 5.2 28.8 1.6 54.2 8.7 35.5 1.6
Urban/ Rural
Urban 27.8 2.2 69.5 0.5 27.0 5.1 66.2 1.6
Rural 73.8 6.3 18.6 1.4 63.4 7.7 27.2 1.7
Analytical Domain
Mountains 84.7 8.1 6.4 0.9 78.5 5.2 15.4 0.8
Urban-Kathmandu Val ley 7.4 0.0 91.9 0.8 19.5 0.7 79.0 0.8
Urban-Other Hi l ls 28.5 2.3 69.3 0.0 23.9 3.5 71.5 1.2
Urban- Tarai 38.1 3.1 58.3 0.6 32.2 8.3 57.1 2.4
Rural Hi l ls- Eastern 72.9 12.2 13.6 1.3 57.9 11.2 31.0 0.0
Rural Hi l ls- Central 74.6 3.5 21.9 0.0 63.1 7.9 24.6 4.4
Rural Hi l ls- Western 73.1 7.1 18.0 1.8 61.3 7.2 29.7 1.8
Rural Hi l ls- Mid & Far Western 84.3 6.7 8.0 1.0 76.9 4.0 17.1 2.0
Rural Tarai - Eastern 60.6 3.8 34.9 0.7 50.9 6.8 40.8 1.5
Rural Tarai - Central 77.2 3.0 17.3 2.5 59.4 12.1 27.0 1.5
Rural Tarai - Western 69.4 8.8 20.8 1.0 66.4 1.9 29.7 2.0
Rural Tarai - Mid & Far Western 58.4 12.7 27.1 1.9 57.7 8.4 33.0 1.0
Consumption Quintile
Poorest 83.7 4.5 9.8 1.9 69.5 10.1 17.0 3.4
Second 77.3 5.4 16.5 0.7 66.2 7.8 24.6 1.4
Thi rd 66.8 7.1 24.4 1.7 60.4 4.7 34.4 0.4
Fourth 52.4 7.2 39.9 0.4 42.9 7.3 48.0 1.8
Richest 25.7 4.2 68.9 1.2 30.4 3.5 65.9 0.2
Nepal 67.1 5.7 25.9 1.3 58.1 7.3 32.9 1.7
Place of delivery Assistance at delivery
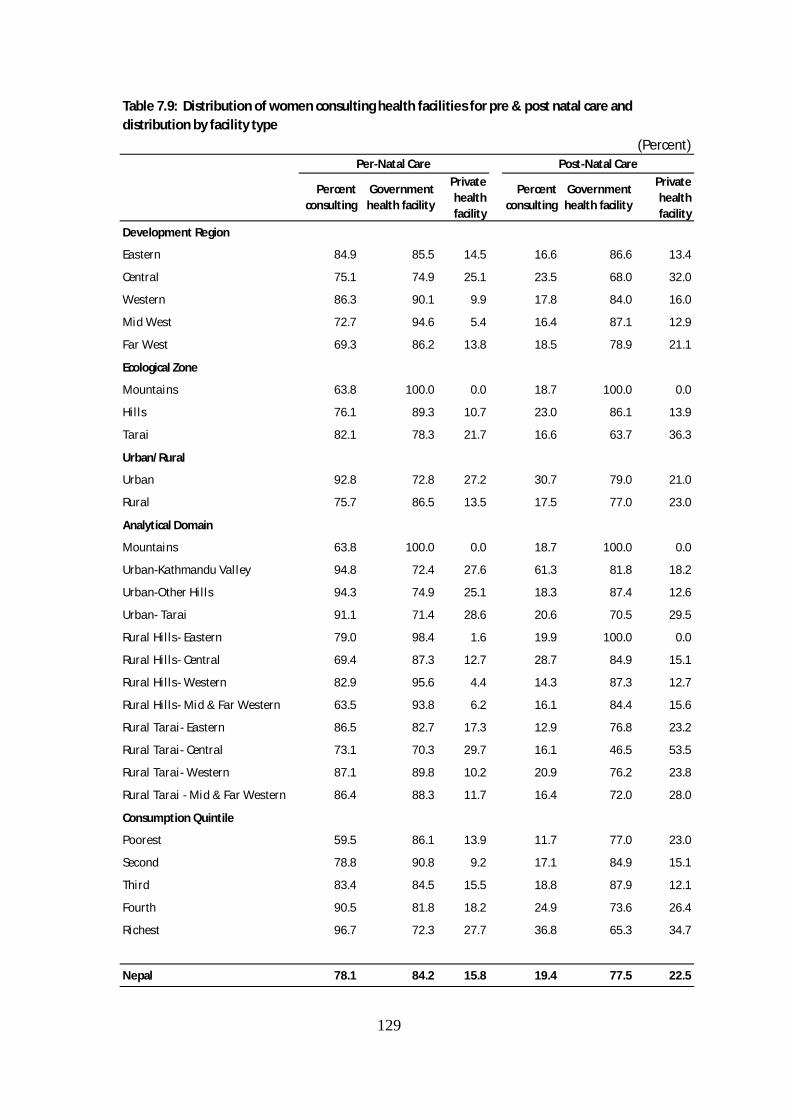
129
(Percent)
Percent consulting
Government health facility
Private health facility
Percent consulting
Government health facility
Private health facility
Development Region
Eastern 84.9 85.5 14.5 16.6 86.6 13.4
Central 75.1 74.9 25.1 23.5 68.0 32.0
Western 86.3 90.1 9.9 17.8 84.0 16.0
Mid West 72.7 94.6 5.4 16.4 87.1 12.9
Far West 69.3 86.2 13.8 18.5 78.9 21.1
Ecological Zone
Mountains 63.8 100.0 0.0 18.7 100.0 0.0
Hil ls 76.1 89.3 10.7 23.0 86.1 13.9
Tarai 82.1 78.3 21.7 16.6 63.7 36.3
Urban/ Rural
Urban 92.8 72.8 27.2 30.7 79.0 21.0
Rural 75.7 86.5 13.5 17.5 77.0 23.0
Analytical Domain
Mountains 63.8 100.0 0.0 18.7 100.0 0.0
Urban-Kathmandu Valley 94.8 72.4 27.6 61.3 81.8 18.2
Urban-Other Hil ls 94.3 74.9 25.1 18.3 87.4 12.6
Urban- Tarai 91.1 71.4 28.6 20.6 70.5 29.5
Rural Hil ls- Eastern 79.0 98.4 1.6 19.9 100.0 0.0
Rural Hil ls- Central 69.4 87.3 12.7 28.7 84.9 15.1
Rural Hil ls- Western 82.9 95.6 4.4 14.3 87.3 12.7
Rural Hil ls- Mid & Far Western 63.5 93.8 6.2 16.1 84.4 15.6
Rural Tarai- Eastern 86.5 82.7 17.3 12.9 76.8 23.2
Rural Tarai- Central 73.1 70.3 29.7 16.1 46.5 53.5
Rural Tarai- Western 87.1 89.8 10.2 20.9 76.2 23.8
Rural Tarai - Mid & Far Western 86.4 88.3 11.7 16.4 72.0 28.0
Consumption Quintile
Poorest 59.5 86.1 13.9 11.7 77.0 23.0
Second 78.8 90.8 9.2 17.1 84.9 15.1
Third 83.4 84.5 15.5 18.8 87.9 12.1
Fourth 90.5 81.8 18.2 24.9 73.6 26.4
Richest 96.7 72.3 27.7 36.8 65.3 34.7
Nepal 78.1 84.2 15.8 19.4 77.5 22.5
Per-Natal Care Post-Natal Care
Table 7.9: Distribution of women consulting health facilities for pre & post natal care and distribution by facility type

130
Household decision A lot little No Me My spouse Both Other
NepalUp to what grade to send children to school/collage 53.9 72.0 27.1 0.8 14.2 15.7 57.8 12.3In which school/collage the children send 55.1 71.9 26.9 1.2 14.1 15.6 56.3 14.0Accessing health care for self 71.9 81.4 18.3 0.4 27.8 11.9 51.5 8.8Accessing health care during pregnancy 11.8 78.8 20.3 1.0 24.5 9.6 56.3 9.6How many children to have 19.6 78.2 21.1 0.7 17.4 10.7 66.3 5.6Which contraceptive method to use 18.0 81.5 17.4 1.1 23.4 10.0 62.4 4.2Accessing health care for children 61.6 79.1 20.5 0.5 20.5 10.5 55.6 13.4Spending on food 83.3 78.1 21.3 0.7 28.1 12.6 48.6 10.8Spending on major household items 71.9 75.7 23.2 1.1 23.5 15.8 49.9 10.8Selling household assets 45.8 70.8 27.9 1.3 18.7 18.6 51.6 11.1Which crops to grow 65.5 76.0 23.2 0.8 20.4 12.3 53.1 14.2To take loans 54.8 70.8 27.4 1.9 15.2 21.5 51.7 11.6How to use loans 51.4 69.9 28.3 1.8 14.4 19.9 54.1 11.5To migrate for employment 23.9 69.3 29.5 1.3 8.5 17.8 48.2 25.5How to use remittance 23.3 80.1 19.1 0.8 22.2 9.9 44.7 23.2UrbanUp to what grade to send children to school/collage 45.5 73.2 26.6 0.2 16.1 14.2 60.8 8.9In which school/collage the children send 50.5 72.7 26.4 0.9 16.1 14.8 58.1 11.0Accessing health care for self 70.5 84.2 15.7 0.1 33.0 11.4 49.4 6.3Accessing health care during pregnancy 10.2 78.9 19.8 1.3 23.7 9.5 60.7 6.0How many children to have 17.1 76.5 22.7 0.7 15.7 12.0 68.6 3.6Which contraceptive method to use 20.0 80.9 18.5 0.6 25.0 12.4 59.9 2.7Accessing health care for children 56.9 83.4 16.5 0.2 23.5 9.9 57.2 9.5Spending on food 78.0 84.2 15.5 0.4 35.1 9.3 46.8 8.8Spending on major household items 67.7 81.1 17.9 1.1 30.2 12.6 48.7 8.5Selling household assets 23.0 73.4 26.0 0.6 24.3 15.9 49.2 10.6Which crops to grow 29.2 75.3 23.7 1.0 27.4 13.3 46.6 12.8To take loans 38.3 72.7 26.0 1.3 16.4 20.4 54.7 8.5How to use loans 36.1 72.3 26.5 1.3 16.2 18.1 56.8 9.0To migrate for employment 14.3 69.9 29.4 0.7 14.2 18.9 49.3 17.6How to use remittance 17.1 84.9 14.7 0.4 38.2 8.7 40.4 12.7RuralUp to what grade to send children to school/collage 56.1 71.8 27.3 1.0 13.8 16.0 57.2 13.0In which school/collage the children send 56.2 71.7 27.0 1.3 13.6 15.8 55.9 14.7Accessing health care for self 72.3 80.7 18.9 0.4 26.5 12.0 52.1 9.5Accessing health care during pregnancy 12.3 78.7 20.4 0.9 24.7 9.6 55.4 10.4How many children to have 20.2 78.6 20.8 0.6 17.8 10.5 65.7 6.0Which contraceptive method to use 17.5 81.7 17.1 1.2 23.0 9.3 63.1 4.6Accessing health care for children 62.8 78.1 21.4 0.5 19.8 10.6 55.3 14.3Spending on food 84.7 76.6 22.7 0.7 26.5 13.3 49.0 11.2Spending on major household items 72.9 74.4 24.4 1.1 21.9 16.6 50.2 11.4Selling household assets 51.7 70.5 28.2 1.3 18.1 19.0 51.9 11.1Which crops to grow 74.8 76.1 23.2 0.7 19.7 12.2 53.7 14.4To take loans 59.0 70.4 27.6 2.0 15.0 21.7 51.2 12.1How to use loans 55.3 69.5 28.6 1.9 14.1 20.3 53.7 12.0To migrate for employment 26.4 69.2 29.5 1.3 7.7 17.7 48.0 26.6How to use remittance 24.8 79.2 19.9 0.9 19.4 10.2 45.5 25.0
Table 7.10: Distribution of women (household head or spouse of household head) involved in the decision
Make decision
Involvement Final decision

131
CHAPTER VIII: MIGRATION AND ABSENTEES
8.1 Migrants
Migration in general refers to geographical or spatial mobility between "one geographical unit and another". It involves a change of usual place of residence from the "place of origin" to the "place of destination". One who migrates is a migrant. The Village Development Committee (VDC) or Municipality, in this survey, has been considered as the migration boundary within the country.
A person who has changed his/her residence from previous place (another VDC or municipality or another country) to the present place (VDC or municipality) is considered a migrant in this survey.
For a person who migrated several times, only the last movement is considered. Internal migrants are asked whether they had moved from urban or rural areas to the present place of residence. In NLSS 1995/96, only household heads were asked about migration. However, in the latter two surveys all of the household members 5 years and older were asked about migration.
During the past 7 years (between 2003/04 and 2010/11), the proportion of migrant population remained almost constant. Gender differentials have, however, changed. A summary statistics of migrant population and population away from home is presented in Box 8.1.
8.1.1 Status of migrants
Of the total population aged 5 years and above, 37 percent have migrated from other places (VDC, municipality or outside the country) to their current place of residence. Migration rates for males and females are 36 and 38 percent respectively (Table 8.1).
Proportion of life time migrants for urban areas is higher than for rural areas. About 51 percent of the urban population is not born in their current place of residence, while the corresponding figure for rural area is 33 percent.
Among the ecological belts, the rate of migration is the highest in the Tarai (42 percent). Among analytic domains, the Kathmandu valley urban ranks the first with regard to the rate of migration ( 53 percent). The rate of migration increases with the household consumption quintiles.
8.1.2 Origin of migration
Origin of migration refers to the previous place of usual residence from where the migrant has moved to the present place (destination). Overall, out of every 100 migrants in the country, 81 have come from rural areas, 7 from urban areas and 12 from abroad. The distribution of migrant population by origin of migration is presented in Table 8.2. Among ecological belts, the percentage of migrants from abroad is the highest in the Tarai belt (18 percent). The rate of migration (from abroad) increases for the lower consumption quintiles.

132
8.1.3 Reasons for migration
Among migrants, a majority (53 percent) ascribed the reason of migration to "marriage". This is followed by "family reason" (27 percent), "easier life style" (7 percent), “education and training” (5 percent), "looking for job" (4 percent) and others (4 percent).
The proportion of migrants reporting "marriage" as the primary reason for migration is more than twice in rural areas (62 percent) than the same in urban areas (28 percent).
The proportion of the migrants reporting “marriage” as the primary reason for migration increases for the richer consumption quintiles while the proportion reporting “family reason” decreases for the migrants in richer quintiles.
8.2 Absentees
For the purpose of the NLSS-III, an “absentee” is an individual who is considered by the reporting household as its member at the time of the interview but who is excluded from the survey-definition of household membership because of his/her prolonged absence (that is, he/she was away from the household for more than 6 months out of the last 12 months, or has recently left and is expected to be away for more than 6 months7, and will return to the same household in the future). Persons who have separated from the household and are now part of another household in Nepal are not considered as absentees8.
8.2.1 Absentees as a proportion of total population
Overall, about 20 percent of the total population (including absentees now living abroad)9 is absentee population (Table 8.4). Among the ecological belts, the proportion of absentee population is the highest in the mountains belt. Among broad age groups, the proportion is the highest in the age group 15 to 29 years. The proportion of absentee population rises steadily for the richer consumption quintiles.
8.2.2 Absentees by place of current residence
Almost 57 percent of the total absentee population is currently residing within Nepal while the remaining 43 percent is residing outside Nepal (Table 8.5). Among ecological belts, the highest
7 Due to misreporting by households, absentees might include the children born overseas to absentees.
According to the survey definition, such children should be excluded because they were never members of the reporting household.
8 Absentees and persons who have left one household to live permanently elsewhere would be enumerated in their new location if they satisfied the 6 months criterion in their new location. Consequently, there is no conceptual omission or duplication in determining the population within Nepal. Absentees who have moved outside Nepal are excluded from the Nepal population.
9 Absentees now in Nepal are not added into the denominator when calculating these percentages because (as explained in the preceding footnote) they should already be included elsewhere in Nepal if surveyed in their new location

133
proportion of absentee population (70 percent) in the mountains belt is currently residing within Nepal, followed by the hills belt (59 percent) and the Tarai (52 percent). Among development regions, the highest proportion of absentee population (69 percent) in the central region is currently residing within Nepal, while the least proportion is in the western region (49 percent). The proportion of absentees (currently residing within Nepal) increases with the household consumption quintiles.
8.2.3 Absentees by reason for absence
About 21 percent of the total population aged 5 years and above (including absentees abroad) is absent from their household - the corresponding proportions for males and females are 32 and 11 percent respectively (Table 8.6). Of the total absentee population, 20 percent have left home due to “family” reasons, 21 percent due to “study or training” purposes, 27 percent due to “working” purposes and the rest 32 percent have left home due to “other” reasons. “Study” as a reason of absence increases sharply for the richer consumption quintiles.
8.2.4 Households having absentee
Overall, 53 percent of the households have at least one absentee living currently within or outside the country. The percentage of households having at least one absentee outside the country is 33 and 28 percent households have at least one absentee currently living within the country. The percentage of households with at least one absentee increases with the household consumption quintiles. There is not much difference, however, in the proportion of absentees living abroad with regard to household consumption quintiles (Table 8.7).
8.3 Children Away From Home
Children away from home are those: who were family members before leaving home, who are less than 15 years old at the time of enumeration, who left home for more than six months, who are expected to return back again, who are missing from the household, who are living in hostels or boarding schools for study, and who come back home occasionally.
Of the total children aged less than 15 years, about 11percent are away from home at the time of enumeration. Comparatively a higher proportion of boys are away from home (Table 8.8).
8.3.1 Reason for absence of children
Of the total children, who are absent from home, 59 percent have left home due to “family” reasons, 31 percent for “study or training”, and 11 percent due to “other” reasons. The proportion of children away from home for “working” purposes is negligible. Among boys, about one in three is absent from home for “study” while about one in four girls is away from home for the same reason (Table 8.8).

134
Box 8.1: Summary statistics of migration of population, 2003/04 - 2010/11 Nepal Living Standards Survey
Description 2003/04 2010/11Percent of migrant population Both sexes 36.6 36.9 Males 50.1 36.1 Females 21.6 37.5Percent of migrants from rural areas 81.5 81.2Percent of migrants from urban areas 5.8 7.0Percent of migrants from other countries 12.7 11.8Reason for migration Family reason 75.2 79.4 Education/training 2.6 4.8 Looking for job 6.8 3.5 Easier life style 11.6 7.0 Other reasons 3.8 4.2Absentees (all ages) as a percentage of total population (including absentees abroad) Both sexes - 20.3 Males - 29.8 Females - 10.9Absentees as a percentage of total population (including absentees abroad) Under 5 years - 11.2 5 to 14 years - 11.1 15 years and above - Percentage of absentees (all ages) by place of current residence Within Nepal 56.9 Outside Nepal 43.1
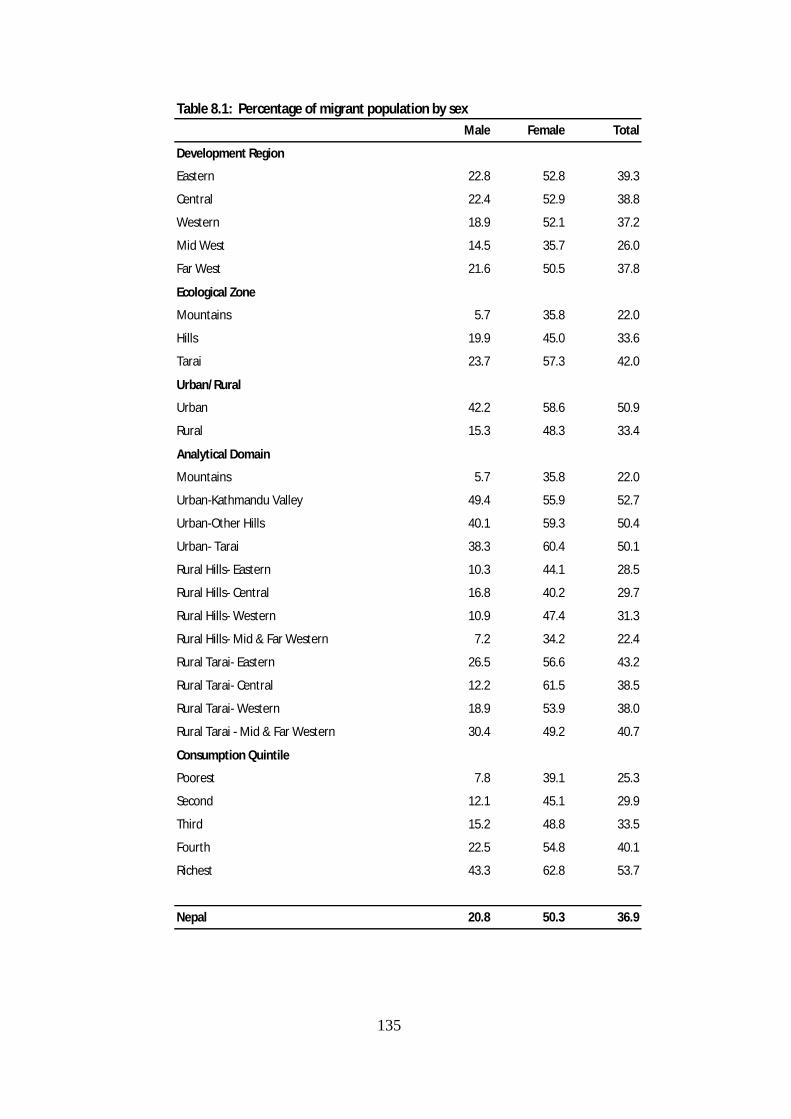
135
Table 8.1: Percentage of migrant population by sexMale Female Total
Development RegionEastern 22.8 52.8 39.3
Central 22.4 52.9 38.8
Western 18.9 52.1 37.2
Mid West 14.5 35.7 26.0
Far West 21.6 50.5 37.8
Ecological ZoneMountains 5.7 35.8 22.0
Hills 19.9 45.0 33.6
Tarai 23.7 57.3 42.0
Urban/ RuralUrban 42.2 58.6 50.9
Rural 15.3 48.3 33.4
Analytical DomainMountains 5.7 35.8 22.0
Urban-Kathmandu Valley 49.4 55.9 52.7
Urban-Other Hills 40.1 59.3 50.4
Urban- Tarai 38.3 60.4 50.1
Rural Hills- Eastern 10.3 44.1 28.5
Rural Hills- Central 16.8 40.2 29.7
Rural Hills- Western 10.9 47.4 31.3
Rural Hills- Mid & Far Western 7.2 34.2 22.4
Rural Tarai- Eastern 26.5 56.6 43.2
Rural Tarai- Central 12.2 61.5 38.5
Rural Tarai- Western 18.9 53.9 38.0
Rural Tarai - Mid & Far Western 30.4 49.2 40.7
Consumption QuintilePoorest 7.8 39.1 25.3
Second 12.1 45.1 29.9
Third 15.2 48.8 33.5
Fourth 22.5 54.8 40.1
Richest 43.3 62.8 53.7
Nepal 20.8 50.3 36.9

136
Table 8.2: Distribution of migrant population by origin of migration(Percent)
Urban Rural External Total
Development RegionEastern 5.5 81.7 12.8 100.0
Central 10.2 77.3 12.5 100.0
Western 4.8 81.7 13.5 100.0
Mid West 3.9 88.5 7.6 100.0
Far West 5.2 87.8 7.0 100.0
Ecological ZoneMountains 3.5 91.8 4.7 100.0
Hills 9.6 85.7 4.6 100.0
Tarai 5.3 77.0 17.7 100.0
Urban/ RuralUrban 15.9 73.5 10.6 100.0
Rural 3.6 84.0 12.3 100.0
Analytical DomainMountains 3.5 91.8 4.7 100.0
Urban-Kathmandu Valley 22.4 72.0 5.5 100.0
Urban-Other Hills 16.0 79.6 4.4 100.0
Urban- Tarai 11.2 71.0 17.8 100.0
Rural Hills- Eastern 2.8 93.4 3.8 100.0
Rural Hills- Central 8.1 88.9 3.1 100.0
Rural Hills- Western 1.9 91.8 6.3 100.0
Rural Hills- Mid & Far Western 1.9 94.2 3.8 100.0
Rural Tarai- Eastern 4.4 79.5 16.1 100.0
Rural Tarai- Central 2.4 77.6 20.1 100.0
Rural Tarai- Western 2.3 72.7 25.0 100.0
Rural Tarai - Mid & Far Western 6.1 85.0 8.9 100.0
Consumption QuintilePoorest 3.3 79.5 17.2 100.0
Second 3.6 79.9 16.5 100.0
Third 3.2 81.3 15.5 100.0
Fourth 6.4 84.0 9.6 100.0
Richest 12.9 80.5 6.6 100.0
Nepal 7.0 81.2 11.8 100.0

137
Table 8.3: Distribution of migrant population by reason of migration(Percent)
MarriageFollow
the family
Other family reason
Edu-cation
Looking for work
Start new job
Start new business
Easier life
styleOther Total
Development RegionEastern 51.2 25.6 5.2 3.3 2.4 0.9 0.9 7.7 2.8 100.0
Central 51.1 18.4 6.2 6.3 5.6 1.4 1.7 6.2 3.0 100.0
Western 59.2 17.2 5.2 4.5 2.6 0.9 1.7 6.9 2.0 100.0
Mid West 51.4 22.7 3.5 5.1 1.3 0.3 1.4 10.4 3.9 100.0
Far West 52.2 27.7 5.0 3.4 2.5 0.4 1.9 5.2 1.5 100.0
Ecological ZoneMountains 74.4 11.4 5.1 2.8 1.8 0.8 1.1 1.1 1.4 100.0
Hills 51.9 19.6 5.6 7.5 5.3 1.4 1.6 4.4 2.8 100.0
Tarai 51.9 23.1 5.3 3.1 2.3 0.7 1.5 9.4 2.8 100.0
Urban/ RuralUrban 27.9 30.1 6.5 11.6 7.8 2.5 2.8 7.1 3.6 100.0
Rural 62.1 17.9 5.0 2.3 1.9 0.5 1.0 7.0 2.4 100.0
Analytical DomainMountains 74.4 11.4 5.1 2.8 1.8 0.8 1.1 1.1 1.4 100.0
Urban-Kathmandu Valley 17.1 28.5 7.3 19.2 14.8 2.8 3.5 3.3 3.6 100.0
Urban-Other Hills 34.4 26.9 5.7 9.2 5.2 3.3 2.8 9.1 3.4 100.0
Urban- Tarai 32.4 32.8 6.2 7.6 4.3 1.8 2.3 8.9 3.7 100.0
Rural Hills- Eastern 68.7 14.9 3.8 3.0 1.3 0.4 0.2 5.8 1.9 100.0
Rural Hills- Central 54.5 21.7 5.4 2.9 5.0 1.2 1.2 4.6 3.5 100.0
Rural Hills- Western 73.7 11.7 5.9 3.9 1.2 0.3 0.3 1.7 1.2 100.0
Rural Hills- Mid & Far Western 75.7 10.0 4.1 2.7 0.6 0.0 0.8 2.9 3.1 100.0
Rural Tarai- Eastern 50.5 26.9 5.2 1.8 2.5 0.9 0.8 8.7 2.7 100.0
Rural Tarai- Central 73.0 8.3 5.9 1.1 1.0 0.1 0.7 7.9 1.9 100.0
Rural Tarai- Western 57.8 18.8 3.9 1.5 1.3 0.3 1.8 11.8 2.8 100.0
Rural Tarai - Mid & Far Western 37.0 35.0 3.6 3.7 2.7 0.3 2.7 12.1 3.0 100.0
Consumption QuintilePoorest 75.8 14.8 2.5 1.0 0.9 0.1 0.2 3.6 1.2 100.0
Second 67.8 16.8 4.0 1.7 2.2 0.2 0.3 5.0 1.9 100.0
Third 63.3 15.1 5.7 2.1 3.0 0.6 0.8 7.0 2.3 100.0
Fourth 51.7 23.0 5.7 3.1 3.4 1.0 1.3 8.1 2.7 100.0
Richest 30.0 28.5 7.0 11.0 5.7 2.1 3.2 8.6 4.0 100.0
Nepal 52.8 21.2 5.4 4.8 3.5 1.0 1.5 7.0 1.7 100.0

138
Table 8.4 : Distribution of absentee population by sex (Percent)
Total Male FemaleAge groups0 - 04 years 11.2 12.0 10.4
5 - 14 years 11.1 13.8 8.3
15 - 29 years 37.0 55.8 19.3
30 - 44 years 27.9 45.8 10.5
45 - 60 years 8.9 14.3 3.3
60 years and above 3.1 3.9 2.2
Development RegionEastern 19.3 28.5 10.3Central 18.5 26.7 10.5Western 24.5 36.1 12.5Mid West 17.7 26.6 8.9Far West 23.9 35.6 12.6
Ecological ZoneMountains 27.6 36.6 18.9Hills 21.7 31.4 12.3Tarai 17.9 27.4 8.4
Urban/ RuralUrban 16.1 22.7 9.5Rural 21.3 31.5 11.2
Analytical DomainMountains 27.6 36.6 18.9Urban-Kathmandu Valley 10.4 13.4 7.4Urban-Other Hills 21.3 31.0 11.8Urban- Tarai 16.8 24.4 9.4Rural Hill- Eastern 21.1 28.8 13.6Rural Hill- Central 22.5 32.0 14.1Rural Hill- Western 29.7 43.2 15.5Rural Hill- Mid & Far Western 19.9 31.0 9.5Rural Tarai- Eastern 18.4 28.8 8.2Rural Tarai- Central 16.7 25.8 7.3Rural Tarai- Western 16.8 26.6 7.0Rural Tarai - Mid & Far Western 22.2 33.0 11.2
Consumption QuintilePoorest (First) 11.5 20.1 3.5Second 14.8 22.8 6.8Third 19.4 29.0 9.8Fourth 24.6 35.4 13.8Richest (Fifth) 30.7 40.9 20.3
Nepal 20.3 29.8 10.9

139
Table 8.5: Distribution of absentee population by current location(Percent)
Believed to be currently living in
Nepal
Believed to be currently living outside Nepal
Total
Development Region
Eastern 58.3 41.7 100.0
Central 65.8 34.2 100.0
Western 48.5 51.5 100.0
Mid West 51.7 48.3 100.0
Far West 52.1 47.9 100.0
Ecological Zone
Mountains 70.1 29.9 100.0
Hills 59.2 40.8 100.0
Tarai 51.5 48.5 100.0
Urban/ Rural
Urban 50.3 49.7 100.0
Rural 58.1 41.9 100.0
Analytical Domain
Mountains 70.1 29.9 100.0
Urban-Kathmandu Valley 24.7 75.3 100.0
Urban-Other Hills 58.9 41.1 100.0
Urban- Tarai 54.2 45.8 100.0
Rural Hills- Eastern 65.3 34.7 100.0
Rural Hills- Central 81.0 19.0 100.0
Rural Hills- Western 53.4 46.6 100.0
Rural Hills- Mid & Far Western 51.6 48.4 100.0
Rural Tarai- Eastern 52.4 47.6 100.0
Rural Tarai- Central 59.3 40.7 100.0
Rural Tarai- Western 34.2 65.8 100.0
Rural Tarai - Mid & Far Western 48.2 51.8 100.0
Consumption Quintile
Poorest (First) 38.0 62.0 100.0
Second 49.0 51.0 100.0
Third 53.3 46.7 100.0
Fourth 62.8 37.2 100.0
Richest (Fifth) 65.1 34.9 100.0
Nepal 56.9 43.1 100.0

140
Table 8.6 : Distribution of absentee population of age 5 and over by reason for absence
Family Study Working Others TotalGenderMale 31.8 9.4 19.6 67.9 3.1 100.0Female 10.9 48.3 26.1 17.2 8.4 100.0Development RegionEastern 20.2 16.5 22.8 40.9 19.8 100.0Central 19.6 19.7 24.4 26.3 29.7 100.0Western 25.3 18.3 20.3 27.7 33.7 100.0Mid West 19.0 19.5 17.7 15.3 47.5 100.0Far West 24.9 27.8 14.6 14.8 42.9 100.0Ecological ZoneMountains 28.3 25.8 22.6 17.0 34.7 100.0Hills 22.6 20.1 23.9 24.0 32.0 100.0Tarai 19.1 17.5 18.1 33.3 31.2 100.0Urban/ RuralUrban 16.7 21.2 25.2 31.3 22.3 100.0Rural 22.4 19.2 20.6 26.7 33.6 100.0Analytical DomainMountains 28.3 25.8 22.6 17.0 34.7 100.0Urban-Kathmandu Valley 10.7 16.8 39.7 19.5 24.1 100.0Urban-Other Hills 21.9 20.5 21.3 39.2 19.0 100.0Urban- Tarai 17.6 23.0 21.2 31.5 24.4 100.0Rural Hill- Eastern 21.2 18.6 28.8 29.7 22.9 100.0Rural Hill- Central 23.4 24.2 20.4 20.8 34.6 100.0Rural Hill- Western 30.8 17.9 23.2 28.0 31.0 100.0Rural Hill- Mid & Far Western 21.5 21.2 21.7 10.6 46.5 100.0Rural Tarai- Eastern 19.5 11.3 20.2 50.1 18.4 100.0Rural Tarai- Central 18.5 16.6 22.8 35.0 25.6 100.0Rural Tarai- Western 17.4 17.4 11.2 19.7 51.7 100.0Rural Tarai - Mid & Far Western 23.1 22.4 9.6 18.6 49.4 100.0Consumption QuintilePoorest (First) 12.9 14.6 8.9 24.2 52.3 100.0Second 16.1 18.9 12.6 23.2 45.3 100.0Third 20.3 18.4 19.5 28.5 33.6 100.0Fourth 25.0 20.5 20.8 31.2 27.6 100.0Richest (Fifth) 30.6 21.4 31.4 26.9 20.3 100.0
Nepal 21.3 19.5 21.3 27.4 31.9 100.0
Total Absentee
Reason for Absence
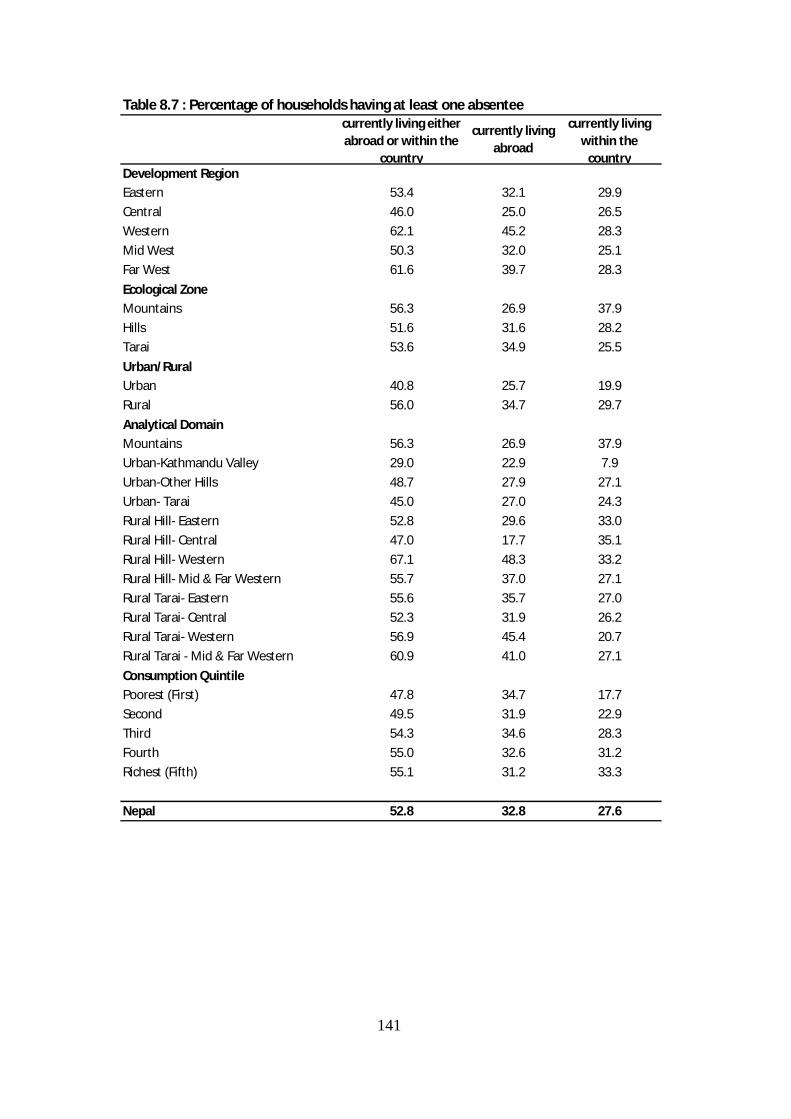
141
Table 8.7 : Percentage of households having at least one absenteecurrently living either abroad or within the
country
currently living abroad
currently living within the country
Development RegionEastern 53.4 32.1 29.9Central 46.0 25.0 26.5Western 62.1 45.2 28.3Mid West 50.3 32.0 25.1Far West 61.6 39.7 28.3Ecological ZoneMountains 56.3 26.9 37.9Hills 51.6 31.6 28.2Tarai 53.6 34.9 25.5Urban/ RuralUrban 40.8 25.7 19.9Rural 56.0 34.7 29.7Analytical DomainMountains 56.3 26.9 37.9Urban-Kathmandu Valley 29.0 22.9 7.9Urban-Other Hills 48.7 27.9 27.1Urban- Tarai 45.0 27.0 24.3Rural Hill- Eastern 52.8 29.6 33.0Rural Hill- Central 47.0 17.7 35.1Rural Hill- Western 67.1 48.3 33.2Rural Hill- Mid & Far Western 55.7 37.0 27.1Rural Tarai- Eastern 55.6 35.7 27.0Rural Tarai- Central 52.3 31.9 26.2Rural Tarai- Western 56.9 45.4 20.7Rural Tarai - Mid & Far Western 60.9 41.0 27.1Consumption QuintilePoorest (First) 47.8 34.7 17.7Second 49.5 31.9 22.9Third 54.3 34.6 28.3Fourth 55.0 32.6 31.2Richest (Fifth) 55.1 31.2 33.3
Nepal 52.8 32.8 27.6

142
Table 8.8 : Distribution of absentee children (age 0 -14 years) by reason for absence
Family Study Working Others TotalGenderMale 13.3 53.0 34.0 0.3 11.3 100.0Female 8.9 66.8 25.6 0.0 10.6 100.0Development RegionEastern 10.5 52.1 37.0 0.0 6.8 100.0Central 10.9 54.2 31.0 0.0 18.5 100.0Western 13.2 60.4 30.2 0.7 12.9 100.0Mid West 8.0 62.3 26.4 0.0 5.8 100.0Far West 13.5 74.9 22.9 0.0 2.0 100.0Ecological ZoneMountains 17.3 64.6 22.6 0.0 20.0 100.0Hills 12.6 61.5 31.5 0.3 11.4 100.0Tarai 8.9 53.1 32.1 0.0 6.3 100.0Urban/ RuralUrban 9.1 63.7 23.1 1.6 13.0 100.0Rural 11.5 57.8 31.7 0.0 10.7 100.0Analytical DomainMountains 17.3 64.6 22.6 0.0 20.0 100.0Urban-Kathmandu Valley 5.5 51.1 34.1 0.0 26.7 100.0Urban-Other Hills 11.1 69.8 15.9 4.6 19.1 100.0Urban- Tarai 9.7 64.0 23.4 0.0 3.9 100.0Rural Hill- Eastern 13.1 64.9 31.9 0.0 5.9 100.0Rural Hill- Central 14.1 61.2 27.6 0.0 18.3 100.0Rural Hill- Western 16.3 58.7 36.4 0.0 12.6 100.0Rural Hill- Mid & Far Western 10.6 62.0 33.9 0.0 0.0 100.0Rural Tarai- Eastern 9.2 37.2 45.3 0.0 11.8 100.0Rural Tarai- Central 8.6 45.1 38.6 0.0 0.0 100.0Rural Tarai- Western 8.2 61.0 22.6 0.0 7.9 100.0Rural Tarai - Mid & Far Western 8.9 76.0 15.6 0.0 6.8 100.0Consumption QuintilePoorest (First) 3.2 58.2 21.2 0.0 16.8 100.0Second 6.6 64.7 25.1 0.0 11.1 100.0Third 10.0 52.2 35.6 0.0 7.0 100.0Fourth 17.4 64.6 26.4 0.0 10.2 100.0Richest (Fifth) 28.0 54.6 35.8 0.6 12.3 100.0
Nepal 11.1 58.5 30.6 0.2 11.0 100.0
Reason for AbsenceTotal Absentee

143
REFERENCES
Central Bureau of Statistics (CBS). 1996. Nepal Living Standards Survey Report 1996: Main Findings, Volume One. Kathmandu, Nepal: Central Bureau of Statistics.
CBS. 1996. Nepal Living Standards Survey Report 1996: Main Findings, Volume Two. Kathmandu, Nepal: Central Bureau of Statistics.
CBS. 2004. Nepal Living Standards Survey, 2003/04: Statistical Report, Volume One. Kathmandu, Nepal: Central Bureau of Statistics.
CBS. 2004. Nepal Living Standards Survey, 2003/04: Statistical Report, Volume Two. Kathmandu, Nepal: Central Bureau of Statistics.
CBS. 2009. Report on the Nepal Labour Force Survey, 2008. Kathmandu, Nepal: Central Bureau of Statistics.
Food and Agriculture Organization of the United Nations (FAO), 2005. A System of Integrated Agricultural Censuses and Surveys, Volume 1, World Programme for the Census of Agriculture, 2010, FAO Statistical Development Series, 11. Rome: Food and Agriculture Organization of the United Nations.
Ministry of Health and Population (MOHP), New ERA, and Macro International Inc. 2007. Nepal Demographic Health Survey 2006. Kathmandu, Nepal: Ministry of Health and Population, New ERA, and Macro International Inc.
The United Nations Children’s Fund (UNICEF), 2006. Multiple Indicator Cluster Survey Manual 2005: Monitoring the Situation of Children and Women. New York: Division of Policy Planning, UNICEF.

144
ANNEX
ANNEX I. SURVEY STAFF
Central Staff
1. Mr Dhundiraj Lamichhane Deputy Director 2. Mr Anil Sharma Statistical Officer 3. Mr Shiva Nandan Shah Statistical Officer 4. Mr Mukti Khanal Statistical Officer 5. Mr Keshab Kumar Gautam Statistical Officer 6. Mr Dinesh Bhattarai Statistical Officer 7. Mr Jaya Kumar Sharma Statistical Officer 8. Mr Bed Prasad Dhakal Statistical Officer 9. Mr Dol Narayan Shrestha Computer Officer 10. Mr Sunil Kumar Shrestha Statistical Officer 11. Mr Shiva Lal Sharma Statistical Officer 12. Mr Bikash Malla Statistical Officer 13. Mr Tulsi Prasad Paudal Statistical Assistant 14. Mr Jit Bahadur Maharjan Office Assistant
Supervisors
1. Mr. Nawa Raj Shrestha 12. Mr. Ram Prasad Wagle 2. Mr. Suman Kumar Shrestha 13. Mr. Kanta Lal Chaudhary 3. Mr. Kedar Prasad Neupane 14. Mr. Bishnu Raj Regmi 4. Mr. Janak Babu Kafle 15. Mr. Jeev Nath Archarya 5. Mr. Bal Ram Dulal 16. Mr. Moti Ram Rokaya 6. Mr. Pawan Kumar Thakur 17. Mr. Damodar Neupane 7. Mr. Raj Kishor Sah 18. Mr. Damodar Gautam 8. Mr. Sanjay Kumar Yadav 19. Mr. Ram Bahadur Thapa 9. Mr. Damodar Shrestha 20. Mr. Bishwa Darshan Dhungana
10. Mr. Dipak Koirala 21. Mr. Mohan Dev Bhatta 11. Ms. Urmila Shahi

145
Interviewers
1. Ms. Indira Khapangi Magar 33. Ms. Shila G.C. 2. Ms. Anjana Oli 34. Ms. Sushila Kumal 3. Ms. Pratima Gyawali (Adhikari) 35. Ms. Pooja Thapa 4. Ms. Khadga Kumari Lamichhane (Sapkota) 36. Ms. Prarthana Bhatta 5. Ms. Ramita Paudyal 37. Ms. Puspa Joshi 6. Ms. Usha Kumari Choudhary 38. Ms. Sapana Bhatt 7. Ms. Babi Dajee Gupta 39. Mr. Laxman Ban 8. Ms. Ganga Bhujel 40. Mr. Ishwor Lal Mandal 9. Ms. Gyani Dhakal 41. Mr. Suresh Kumar Shrestha
10. Ms. Gita Rimal 42. Mr. Lok Nath Lamichhane 11. Ms. Uma Kumari 43. Mr. Santhosh Karki 12. Ms. Kalayani Sah 44. Mr. Kashi Mandal 13. Ms. Pinki Kumari Ojha 45. Mr. Bij Kumar Yadav 14. Ms. Sanu Maiya Shrestha 46. Mr. Ramprit Yadav 15. Ms. Sunita Dhakal (Pokharel) 47. Mr. Jay Kishan Prasad Sonar 16. Ms. Indira Birbal 48. Mr. Mahanta Prasad Yadav 17. Ms. Rama Kumari Thapa 49. Mr. Rajendra Prasad Chaudhari 18. Ms. Binu Shrestha 50. Mr. Gajendra Lal Shrestha 19. Ms. Dambar Kumari Ghale (Pariyar) 51. Ms. Kalkika Shrestha 20. Ms. Kaushila Adhikari (Bohara) 52. Mr. Kiran Bista 21. Ms. Renuka Lamichhane 53. Mr. Nawa Raj Pokhrel 22. Ms. Samjhana Basnet 54. Mr. Rabi Lal Shrestha 23. Ms. Bindu Pandey 55. Mr. Ghan Shyam Sapkota 24. Ms. Anjana Kumari Shrestha 56. Mr. Ram Chandra Gautam 25. Ms. Sharada Pandey 57. Mr. Kamal Paudel 26. Ms. Kalpana Bhandari (Thapa) 58. Mr. Prem Kumar Sharma 27. Ms. Shakuntala Dhakal 59. Mr. Megha Nath Regmi 28. Ms. Hira Sharma 60. Mr. Tek Narayan Adhikari 29. Ms. Susma Adhikari 61. Mr. Shambhu Narayan Panta 30. Ms. Shanta Kumari Pokhrel 62. Ms. Prativa Soti 31. Ms. Laxmi Gupta
Data Entry Operators
1. Mr. Narayan Karki 11. Mr. Krishna Prasad Chaulagain 2. Mr. Ramesh Bahadur Shrestha 12. Ms. Renu Kumari Ghimire 3. Mr. Yam Bahadur Gurung 13. Mr. Surendra Raj Paudel 4. Mr. Narayan Bahadur Thapa 14. Mr. Tilak Prasad Acharya 5. Mr. Santosh Chandra Thapa 15. Mr. Yub Raj Khadka 6. Ms. Sushila Kumari Sah 16. Mr. Saroj Pokhrel 7. Ms. Madhu Mallik 17. Mr. Lanka Bahadur Bam 8. Ms. Nargis Khatoon 18. Mr. Surya Giri 9. Mr. Puskar Prasad Guragai 19. Mr. Hari Bahadur Gharti
10. Mr. Deepak Bhattarai 20. Mr. Ram Dutta Bhatta
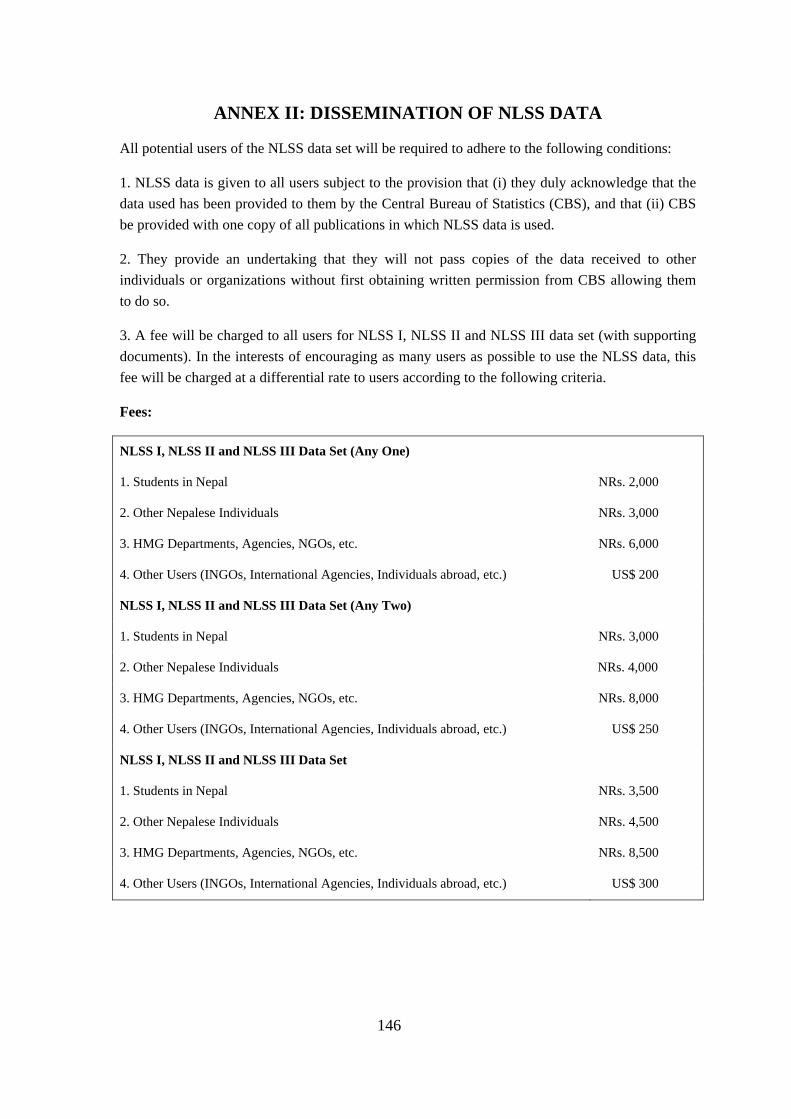
146
ANNEX II: DISSEMINATION OF NLSS DATA
All potential users of the NLSS data set will be required to adhere to the following conditions:
1. NLSS data is given to all users subject to the provision that (i) they duly acknowledge that the data used has been provided to them by the Central Bureau of Statistics (CBS), and that (ii) CBS be provided with one copy of all publications in which NLSS data is used.
2. They provide an undertaking that they will not pass copies of the data received to other individuals or organizations without first obtaining written permission from CBS allowing them to do so.
3. A fee will be charged to all users for NLSS I, NLSS II and NLSS III data set (with supporting documents). In the interests of encouraging as many users as possible to use the NLSS data, this fee will be charged at a differential rate to users according to the following criteria.
Fees:
NLSS I, NLSS II and NLSS III Data Set (Any One)
1. Students in Nepal NRs. 2,000
2. Other Nepalese Individuals NRs. 3,000
3. HMG Departments, Agencies, NGOs, etc. NRs. 6,000
4. Other Users (INGOs, International Agencies, Individuals abroad, etc.) US$ 200
NLSS I, NLSS II and NLSS III Data Set (Any Two)
1. Students in Nepal NRs. 3,000
2. Other Nepalese Individuals NRs. 4,000
3. HMG Departments, Agencies, NGOs, etc. NRs. 8,000
4. Other Users (INGOs, International Agencies, Individuals abroad, etc.) US$ 250
NLSS I, NLSS II and NLSS III Data Set
1. Students in Nepal NRs. 3,500
2. Other Nepalese Individuals NRs. 4,500
3. HMG Departments, Agencies, NGOs, etc. NRs. 8,500
4. Other Users (INGOs, International Agencies, Individuals abroad, etc.) US$ 300