Assessing Targeting Options for Nepal’s Social Grants What Does the Evidence Tell Us DFID Nepal

NEPAL EDUCATION SECTOR ANALYSIS
National Institute for Research and Training (NIRT)
&
American Institute of Research (AIR)
January 2017

Recommended citation: NIRT (2016). Nepal Education Sector Analysis. Kathmandu, Nepal

i
ACKNOWLEDGEMENTS
This education sector analysis has been an unforeseen lengthy process as the overall analysis and planning
process was disrupted by the devastating 2015 earthquakes in Nepal that undid a significant amount of the
progress made within the education sector in the affected areas and demanded the Local Education
Development Partner Group and the Government in terms of devoting available capacity towards response
and recovery. As such, the leadership displayed by the honorable minister of education and the respected
secretary of the Ministry of Education and the Joint secretary of the planning division that balanced the
Ministry’s capacity between the need for the development of a new education sector plan and the needs
emerging from the post disaster context and the agitations related to the promulgation of the country’s
constitution should be acknowledged.
Furthermore, UNICEF Nepal should be acknowledged for their support and guidance to the education sector
analysis process in the role as focal point of the development partners and managing entity of the Education
Sector Program Development Grant (ESPDG), through which the technical assistance and expertise was made
available to the Government. During the different phases of the sector analysis, the participation of the
education and different central level agencies within the education sector, as well as development partners
including civil society organization networks and stakeholder representatives led to a broad platform through
which pertinent issues and opportunities within the education sector were reviewed and analyzed.
Finally, specific reference should be made to Dr. Lava Deo Awasthi, Dr. Hari Prasad Lamsal, Dr. Thulashi
Thapaliya, Dr. Mukunda Mani Khanal, Mr. Deepak Sharma, mr. Shankar Thapa and Dr. Marilyn Hoar.
Through the deployment of the National Institute for Research and Training (NIRT) and its international
partner the American Institute for Research (AIR), the overall sector analysis outline and structure was
developed by Dr. Mohammed Elmeski with the support of Dr. Bhuban Bajracharya and Dr. Vishnu Karki. In
addition to this, key contributors to the analysis were Professor Thirtha Koirala, Professor Mahesh Parajuli,
Dr. Susan Acharya and Dr. Laxmi Paudyal, with special acknowledgement for Dr. Niraj Paudyal and Dr. Pramod
Bhatta for the undertaking of the additional impact analysis.
Overall editing and alignment was supported by Mr. Amit Aryal, Mr. Jimi Oostrum and copy editing by Mr.
Steve Keeling.
ii
EXECUTIVE SUMMARY
A. THE THREE IMPERATIVES OF EDUCATION REFORM
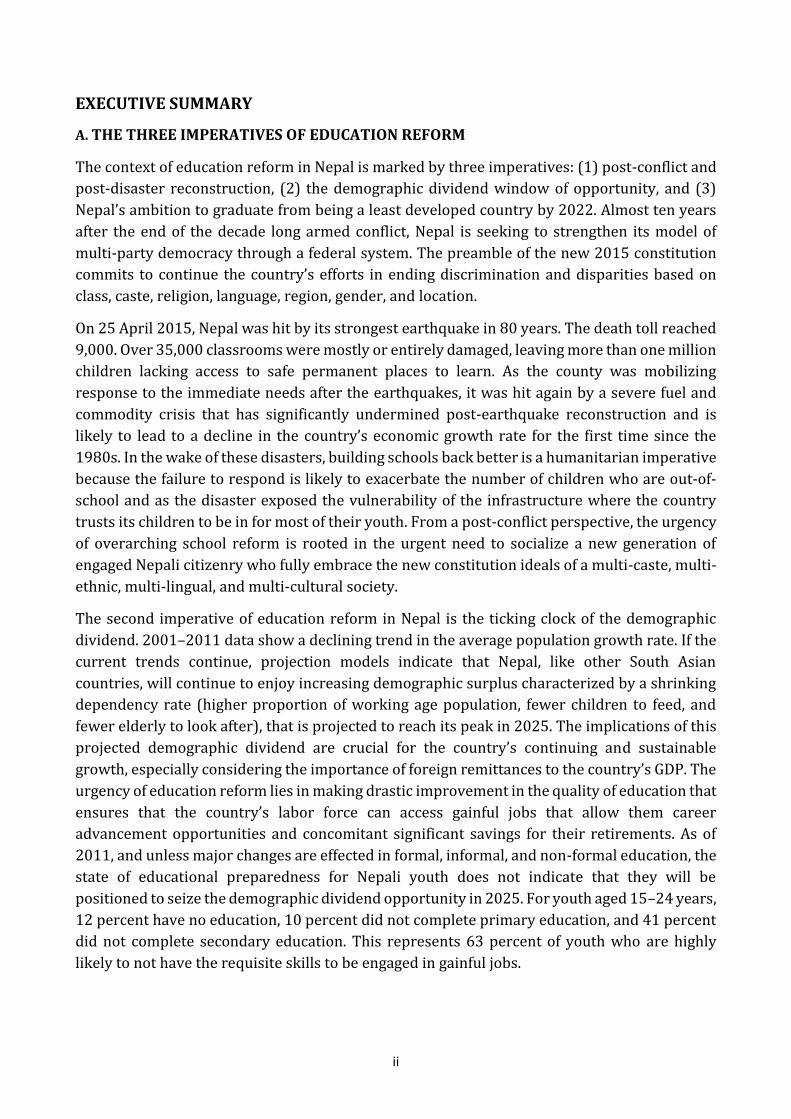
The context of education reform in Nepal is marked by three imperatives: (1) post-conflict and
post-disaster reconstruction, (2) the demographic dividend window of opportunity, and (3)
Nepal’s ambition to graduate from being a least developed country by 2022. Almost ten years
after the end of the decade long armed conflict, Nepal is seeking to strengthen its model of
multi-party democracy through a federal system. The preamble of the new 2015 constitution
commits to continue the country’s efforts in ending discrimination and disparities based on
class, caste, religion, language, region, gender, and location.
On 25 April 2015, Nepal was hit by its strongest earthquake in 80 years. The death toll reached
9,000. Over 35,000 classrooms were mostly or entirely damaged, leaving more than one million
children lacking access to safe permanent places to learn. As the county was mobilizing
response to the immediate needs after the earthquakes, it was hit again by a severe fuel and
commodity crisis that has significantly undermined post-earthquake reconstruction and is
likely to lead to a decline in the country’s economic growth rate for the first time since the
1980s. In the wake of these disasters, building schools back better is a humanitarian imperative
because the failure to respond is likely to exacerbate the number of children who are out-of-
school and as the disaster exposed the vulnerability of the infrastructure where the country
trusts its children to be in for most of their youth. From a post-conflict perspective, the urgency
of overarching school reform is rooted in the urgent need to socialize a new generation of
engaged Nepali citizenry who fully embrace the new constitution ideals of a multi-caste, multi-
ethnic, multi-lingual, and multi-cultural society.
The second imperative of education reform in Nepal is the ticking clock of the demographic
dividend. 2001–2011 data show a declining trend in the average population growth rate. If the
current trends continue, projection models indicate that Nepal, like other South Asian
countries, will continue to enjoy increasing demographic surplus characterized by a shrinking
dependency rate (higher proportion of working age population, fewer children to feed, and
fewer elderly to look after), that is projected to reach its peak in 2025. The implications of this
projected demographic dividend are crucial for the country’s continuing and sustainable
growth, especially considering the importance of foreign remittances to the country’s GDP. The
urgency of education reform lies in making drastic improvement in the quality of education that
ensures that the country’s labor force can access gainful jobs that allow them career
advancement opportunities and concomitant significant savings for their retirements. As of
2011, and unless major changes are effected in formal, informal, and non-formal education, the
state of educational preparedness for Nepali youth does not indicate that they will be
positioned to seize the demographic dividend opportunity in 2025. For youth aged 15–24 years,
12 percent have no education, 10 percent did not complete primary education, and 41 percent
did not complete secondary education. This represents 63 percent of youth who are highly
likely to not have the requisite skills to be engaged in gainful jobs.

iii
Last, but not least, the third imperative for education reform lies in Nepal’s aspiration to
graduate from the status of an LDC. Nepal’s 14th National Development Plan (2016/17 to
2020/21) has graduating from the LDC category by 2022 as its vision. In this regard, the reform
imperative is two-fold:
1. The literacy and secondary school Human Assets Index (HAI) must be, at least, 10 percent
above the LDC inclusion threshold.
2. The education sector needs to prepare the skilled human resources necessary to achieve its
vision of “rebuilding a resilient nation, promoting entrepreneurial farmers and productive
farms, gender equality with empowered women, building infrastructure and creating jobs,
policy reform for growth take-off, connecting communities with markets, and nurturing
nature to harness its riches.”
B. NEPAL SITUATIONAL ANALYSIS: DEMOGRAPHIC, ECONOMIC, AND SOCIAL CONTEXT
Nepal’s topography, climate, religion, and population are very diverse. The country consists of
three topographic regions: the Terai plains in the south, the middle hills (Mid-hills), and the
Himalayan mountains in the north. The country has tropical, sub-tropical, temperate, sub-
arctic, and arctic climatic zones. In the early 1990s, Nepal was the only constitutionally declared
Hindu state in the world. The 2007 Interim Constitution declared Nepal as a secular state. That
said, the country has a majority of people who are Hindus (80.6 percent) followed by Buddhists
(10.7 percent). Other religious minorities include Muslims, Kirats, Christians and Jains. The
most densely populated parts of the country are the southern Terai districts, the Kathmandu
Valley and Kaski district
With regards to the Millennium Development Goals (MDGs), the country has made significant
albeit uneven progress. The country has halved the proportion of people whose income is less
than a dollar a day. The decline of poverty has been steady — between 2004 and 2011 it
decreased annually by an average of 2.5 percent. However, it is necessary to assess the impact
of the severe fuel and commodity shortages since September 2015 on poverty and hunger for
a more accurate appraisal. Furthermore, the country’s progress in achieving universal primary
education is commendable. The net enrolment rate rose from 64 percent in 1990 to 95.3
percent by 2013. The survival rate increased due to the government’s support for early
childhood education and development (ECED) and pre-primary education (PPE), among other
factors.
In terms of gender equality and the empowerment of women, the ratio of girls to boys in
primary education (Grades 1 to 5) has improved significantly since the 1990s, so much that the
MDG target set for 2015 has already been achieved. There are, however, some lingering
disparities by social groups and geographical location. With respect to the empowerment of
women, the share of women’s wage employment in the non-agricultural sector has more than
doubled. Women’s participation in non-traditional sectors such as the armed forces and
overseas employment has increased rapidly in recent years.
With regards to reducing child mortality, childhood mortality has steadily declined over the
past 20 years. In 2001, the infant mortality rate (IMR) declined to 46 and under-five mortality

iv
rate (U5MR) to 54 per 1,000 live, compared to 162 in 1990. The neo-natal mortality rate is still
a challenge as between 2006 and 2011 it remained the same. Although Nepal has achieved both
its maternal mortality ratio (MMR) and attended birth goals by 2015, disparities exist between
urban and rural settings, across ecological and development regions, and among social and age
groups.
Nepal has shown improvement in other social development indicators. However, progress
remains constrained by the persistent challenge of ensuring that gains benefit the country’s
disadvantaged groups and geographical areas. In terms of literacy, Muslims, other Terai castes,
hill Dalits, Terai Janajatis, and Terai Dalits have literacy index scores well below the national
average. The Multi-Dimensional Social Inclusion Index (CDSA 2014). shows hill Brahmans,
Madhesi Brahmans/Chhetris, Newars and hill Chhetris scoring high on social, economic and
cultural dimensions (OPHI 2015). However, the gender inclusion index is lower than the other
social inclusion indices, showing that gender is still a dominant driver of disparities in Nepal.
The large remittance incomes represent a critical lifeline that mitigates poverty, promotes
investment, and increases demand for education. That said, the high number of working age
population outside the country also has social costs affecting families and communities.
C. MACROECONOMIC INDICATORS AND FIDUCIARY ASSESSMENT
Nepal is one of the least developed countries. Its per capita income is US$ 762. Agriculture
employs 70 percent of the population but only accounts for 34 percent of GDP. The damage
caused by the 2015 May/April earthquakes is reckoned to have reduced the growth of the
economy from the expected 6 percent to only 3 percent growth in 2014/15, which was further
reduced to 0.77 percent in 2015/16, with the 5-month severe fuel and commodity shortages
caused by constraints on import of goods at Nepal’s Southern border (Paudel 2015). The share
of recurrent government expenditure has increased by more than 10 percent on average for
the last five years (MoF 2015).
In the last seven years (FY 2009/10-2015/16), the government’s educational expenditure has
consistently stayed at around 15 percent of the national budget, despite a decline to around 12
percent in the last two years of this period. The educational budget has been increasing in
absolute terms, despite that its share of government expenditure has decreased from 21.4
percent in 2010/11 to an estimated 12 percent in 2015/16 because of a significant overall
increase of the national budget, partly due to the need to respond the post disaster emerged
needs for reconstruction and recovery. The Government of Nepal bears the largest burden of
education expenditure although development partners significantly contribute to supporting
education. Also, the contributions of households to education amounted to 3.6 percent of GDP
in fiscal year 2010/11, making private spending an important contributor to education. For
SSRP, the share of funding from development partners that supported the SSRP implementation
through pooled funding remained between 20 and 24 percent. This contribution fell to 15
percent in 2015/16 partly because of development partners’ higher contributions in the first
three years of SSRP, and partly because of the government’s discouragement of foreign loans
for financing education.

v
Basic education has consistently had the lion’s share of government expenditure. But its share
has been slowly decreasing in favor of more spending on secondary education. In 2010/11,
basic education expenditure represented 64.0 percent of the overall spending on education,
this increased to 68.9 percent in 2011/12 before beginning to taper off in 2012/13 to attain
54.1 percent in 2015/2016. Conversely, secondary education (Grades 9–12) steadily rose from
16.9 percent in 2010/2011 to attain 21.0 percent in 2015/16. The rest of sub-sector spending
in 2015/16 includes 1.5 percent for early childhood education and development (ECED), 4
percent for technical and vocational education and training (TVET), 8.2 percent for tertiary
education, 2.3 percent for education management and administration, 0.4 percent for literacy
and lifelong learning and 8.5 percent for teacher pensions and retirement.
To enhance access and improve equity, the government offers 16 types of scholarships
including conflict affected students, individuals with disabilities, girls, Dalits, the poor, and the
talented. However, more effort is needed to better target scholarship to students with financial
needs, and marginalized ethnic groups. From a sustainability perspective, 98 percent of the
SSRP budget was used for recurrent activities such as teacher training and building educational
facilities. In order to further strengthen the targeted and evidence base approach to reduce
disparities in education outcomes, the Government developed the Consolidated Equity Strategy
for the School Education Sector in Nepal {Equity Strategy}, which includes identifying districts
to receive resources based on a disparity based formula. In addition to this, there is a need for
a clear strategy that spells out how such recurrent expenditure will be included and sustained
in the SSDP period.
D. NEPAL EDUCATION SECTOR: PROGRESS ACHIEVED AND LINGERING CHALLENGES
The major achievements of Nepal’s education sector pertain to Education for All (EFA) Goals 1
and 2. Regarding EFA 1, Nepal expanded and improved comprehensive early childhood care
and education, especially for the most vulnerable and disadvantaged children. According to
DoE’s Flash Reports (2010-2014), the country had reached 77.7 percent ECED coverage in
2014. The target for 2015 is 82 percent. However, the provision of pre-primary education to
children aged above three years is uneven between and within districts. EFA Goal 2 is aimed at
ensuring that all children, particularly girls and children in difficult circumstances and those
belonging to disadvantaged ethnic groups, have access to and complete free and compulsory
primary education of good quality. In this regard, the net intake rate in primary schools has
risen to 92.7 percent for girls and 93.3 percent for boys. Net enrolment rates have also steadily
improved, even if they fell short of the SSRP target of 98 percent. The net enrolment rate in
basic education reached 88.7 percent in 2015. Other accomplishments include the gradual
increase in secondary education enrolment, a steady fall in repetition rates in Grades 1 and 8,
and improved survival rates to Grades 5 and 8 to 89.4 percent and 77.2 percent respectively.
Education in Nepal faces lingering challenges in quality and equity. The student teacher ratio
(STR) remains very high in lower secondary schools. In the Terai the STR is a problem in all
grades. Student achievement is also a major problem at all levels of education. In 2013/14, on
average, 48 percent of Grade 3 students, 51 percent of Grade 5 students, and 52 percent of
Grade 8 students did not achieve their grade level in science, math, or English. Trend data shows
vi
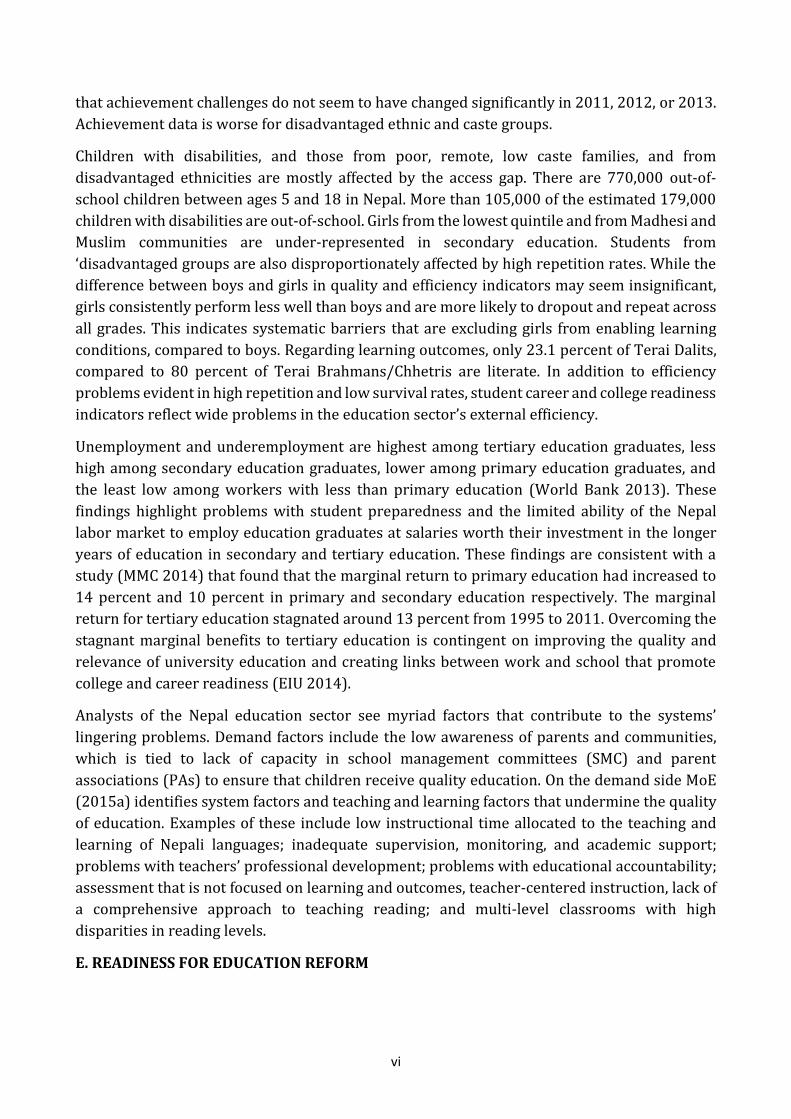
that achievement challenges do not seem to have changed significantly in 2011, 2012, or 2013.
Achievement data is worse for disadvantaged ethnic and caste groups.
Children with disabilities, and those from poor, remote, low caste families, and from
disadvantaged ethnicities are mostly affected by the access gap. There are 770,000 out-of-
school children between ages 5 and 18 in Nepal. More than 105,000 of the estimated 179,000
children with disabilities are out-of-school. Girls from the lowest quintile and from Madhesi and
Muslim communities are under-represented in secondary education. Students from
‘disadvantaged groups are also disproportionately affected by high repetition rates. While the
difference between boys and girls in quality and efficiency indicators may seem insignificant,
girls consistently perform less well than boys and are more likely to dropout and repeat across
all grades. This indicates systematic barriers that are excluding girls from enabling learning
conditions, compared to boys. Regarding learning outcomes, only 23.1 percent of Terai Dalits,
compared to 80 percent of Terai Brahmans/Chhetris are literate. In addition to efficiency
problems evident in high repetition and low survival rates, student career and college readiness
indicators reflect wide problems in the education sector’s external efficiency.
Unemployment and underemployment are highest among tertiary education graduates, less
high among secondary education graduates, lower among primary education graduates, and
the least low among workers with less than primary education (World Bank 2013). These
findings highlight problems with student preparedness and the limited ability of the Nepal
labor market to employ education graduates at salaries worth their investment in the longer
years of education in secondary and tertiary education. These findings are consistent with a
study (MMC 2014) that found that the marginal return to primary education had increased to
14 percent and 10 percent in primary and secondary education respectively. The marginal
return for tertiary education stagnated around 13 percent from 1995 to 2011. Overcoming the
stagnant marginal benefits to tertiary education is contingent on improving the quality and
relevance of university education and creating links between work and school that promote
college and career readiness (EIU 2014).
Analysts of the Nepal education sector see myriad factors that contribute to the systems’
lingering problems. Demand factors include the low awareness of parents and communities,
which is tied to lack of capacity in school management committees (SMC) and parent
associations (PAs) to ensure that children receive quality education. On the demand side MoE
(2015a) identifies system factors and teaching and learning factors that undermine the quality
of education. Examples of these include low instructional time allocated to the teaching and
learning of Nepali languages; inadequate supervision, monitoring, and academic support;
problems with teachers’ professional development; problems with educational accountability;
assessment that is not focused on learning and outcomes, teacher-centered instruction, lack of
a comprehensive approach to teaching reading; and multi-level classrooms with high
disparities in reading levels.
E. READINESS FOR EDUCATION REFORM

vii
The readiness for reform can be assessed according to: (1) the extent to which the policy
framework provides needed feedback for education reform, and (2) the extent to which the
current educational system demonstrates the capacity to implement proposed reform. Four
policy documents represent the policy framework for education reform in Nepal; the country’s
Constitution (2015), the National Development 3 Year Plan (2014/15 to 2016/17), the
Education Act (1971), and SSRP (2009–2016). The new Constitution, commits to the equitable
provision of quality and free education for all until secondary education.
SSRP (2009–2014) is a continuation of a series of national education reform programs going
back to the 1990s. SSRP called for:
• organizing school education into basic (1-8) and secondary levels (9-12);
• resetting the minimum qualifications of teachers;
• revising the curriculum for the integrated secondary education;
• revising the examination system to reflect the proposed new basic secondary education
structure.
Six years after the initiation of SSRP, none of the reforms have materialized because the
necessary amendments in the Education Act have not occurred yet. The Asian Development
Bank’s Institutional Analysis and Capacity Development Plan (Moriani et al. 2013) cautions that
‘without concomitant structural changes and capacity development, past and current reform
aspirations will continue to be mired in what it characterized as a ‘state capability trap’ marked
by incorrect implementation assumptions, form over function, unrealistic expectations, and
aspiring to accomplish too much too soon.’
Considering the above cautionary notes about the state capability trap, the sector analysis
examined the following dimensions of system capacity to assess the education sector’s capacity
to implement the SSDP: (i) performance capacity, (ii) personal capacity, (iii) workload capacity,
(iv) supervisory capacity, (v) facility capacity, (vi) support service capacity, (vii) structural
capacity, (viii) systems capacity and (ix) role capacity.
Performance capacity refers to the availability of inputs to support the implementation of SSDP.
The SSRP mid-term review (Cumming et al. 2012) estimated that the financing gap between
SSRP resources and costs would reach $233 million in 2015/2016. In 2015, the country was hit
by two major shocks: — the earthquake and an economic blockade that drastically restricted
Nepal’s access to fuel and commodities. In this regard, the Nepal Rastra Bank (NRB 2015)
December 2015 report predicted that the economic growth could contract to minus 0.9 percent
if the blockade continued until January 2016 (which it has). The macro-economic implications
of the loss of revenue will affect the resources available for government funding of SSDP in the
short and medium-term. Therefore, unless new sources of funding are found, the SSRP
financing gap and the recent shocks that hit Nepal will weaken MoE’s performance capacity to
implement SSDP.
Personal capacity assesses the extent to which staff are sufficiently knowledgeable, skilled, and
confident to perform properly. By 2014, 94.4 percent of primary school teachers, 80.6 percent

viii
of lower secondary teachers, 90.4 percent of secondary school teachers and 67.6 percent of high
secondary school teachers had been trained. However, on average more than 50 percent of
students fail to perform at grade level in Nepali, English, reading, mathematics and science.
Head teachers and administrative support lack training in effective school leadership and
management. Administrative staff need support in phasing in (1) the federal structure of
education governance, (2) strengthening the leadership skills of provincial and local officials in
educational planning, management and budgeting, and (3) developing clear professional
profiles and recruitment criteria to ensure that staff have the requisite competencies to
undertake their duties successfully.
Workload capacity refers to the availability of staff and the breadth of their skills to cope with
high workloads. The overall teacher-student ratio in Nepal is, on average, 24.8 in primary and
27.4 in secondary schools. This is within South Asian norms. However, low student teacher
ratios are not correlated with higher achievement in Nepal, which, in turn, is a negative
indicator of teachers’ productivity. The Institutional Assessment and Capacity Development
Plan (IACDP) Report (Moriani et al. 2013) findings of a rapid assessment survey of
administrative staff suggested that MoE, DoE, and district education office (DEO) staff did not
agree that their respective organizations had a plan for continuing staff development, or
dedicated grants to support learning opportunities in an equitable manner, or tied human
resource development initiatives to the systematic monitoring of employees’ outcomes. This
indicates that incentives are not perceived to be in place to equip staff with adequate skills that
meet their professional needs. Staff concerns are also symptomatic of broader supervisory
capacity challenges that the IACDP report described as operational rigidities, weak public
disclosure, weak governance, and weak public finance management.
The other dimension of system capacity is facility capacity. This refers to the availability and
quality of existing facilities to function as safe child friendly spaces for quality instruction. The
April 2015 earthquake deprived more than one million children of safe learning spaces. As the
country builds back better, the rebuilding of facility capacity necessitates using materials that
can withstand natural disasters incorporating inclusive principles of universal design that
allow buildings to be safe, usable, and accessible for all individuals. This is a process that
depends, among other things, on support services capacity. This refers to the training and
research capabilities often spearheaded by the country’s universities. In Nepal, there is a need
for home-grown research that informs existing efforts to improve access, equity, quality and
efficiency. While universities offer courses in education, their contribution to strengthening the
support capacity of Nepal education sector seems very limited.
Finally, the multiple dimensions of capacity depend on functional systems, structures, and
clearly defined roles. Minimizing the risk of SSDP being entangled in the same state capability
trap that prevented the full implementation of SSRP requires tackling the political gridlock,
operational rigidities, weak public accountability, weak coordination, duplicative structures,
cross-purpose agendas, insufficient funding, issues with teacher management, and asymmetric
structures and roles (Moriani et al. 2013). These are some of the system issues that obstruct
the flow of information, money, and decision making in a timely and effective way (system

ix
capacity). They are also symptomatic of weak or unenforced structures for communication,
cooperation, cooperation, and collaboration.
Last, but not least, the state capability trap is manifested in low role capacity. This is the lack of
clarity about who is responsible for what. Nepal’s transition to a federal system of governance
presents an opportunity to overhaul the system, structure, and role capacity of the school sector
to maximize its effectiveness, efficiency, and ability to improve equitable access to quality
education for all.
F. EDUCATIONAL SUBSECTORS AND THEMES
Early childhood education and development (ECED)
The government of Nepal launched the National Policy on Early Childhood Development in
2004. The goal is to promote a comprehensive approach to early childhood development (ECD)
programs for children aged 0–5 to safeguard their rights and fully develop their physical, socio-
emotional, cognitive, spiritual and moral potential. Access to ECED centers has improved.
However, it is still not equally available to vulnerable and disadvantaged groups. Of the 39.5
percent of children aged 3–5 who are attending ECED centers, girls, children with special needs,
orphans, children on the streets, and other vulnerable children are the least likely to benefit
from these services. Many ECED facilities lack proper ventilation, adequate lighting, permanent
structures, and toilets and clean water. The Early Learning and Development Standards (ELDS)
are not enforced. This makes it difficult to ensure minimum enabling conditions across centers.
For examples, many centers lack a minimum number of learning corners with sufficient
materials. Other challenges include the management capacity of the management committees,
the limited or lack of training of ECED teachers, poor implementation of the curriculum due to
inadequate teacher preparation and poor infrastructure, DEO ECED units without sufficient
staff or resources to coordinate ECED activities or lead advocacy efforts to engage stakeholders
in prioritizing ECED, and lack of support for holistic approaches to holistic child development.
One major way of addressing these challenges is to define programs by age groups and institute
clear plans for monitoring and evaluation.
Basic education
Within basic education, a decreasing trend in budget allocation was identified as a salient issue.
Furthermore, increased access is observed as significant but should be seen against persisting
disparities in terms of gender, caste ethnicity, ethnic minorities and students speaking ocal
languages and disability, as these disparities are often multidimensional drivers of disparities
and are currently met by strategies that need strengthening in terms of addressing the drivers
of disparity and being targeted and evidence based. Furthermore, targeted interventions have
been observed in establishment of minimum enabling conditions and child friendly
environment. Disaggregating Education Management Information System (EMIS) data to better
understand the demographics and disability status of in school and out-of-school children. The
institution of a support system targeted at children with disabilities (CwDs) that includes early
screening and interventions through closer coordination between health and education
ministries, the provision of age appropriate support (birth to 3, 3 to 5, and 6 to 21), improving
x
accessibility of educational services to CwDs, mainstreaming children with disability in general
education classrooms, updating data about types of disability, their levels of severity, and their
prevalence, updating teacher training program to include special education, and addressing
social stigma associated with disability.
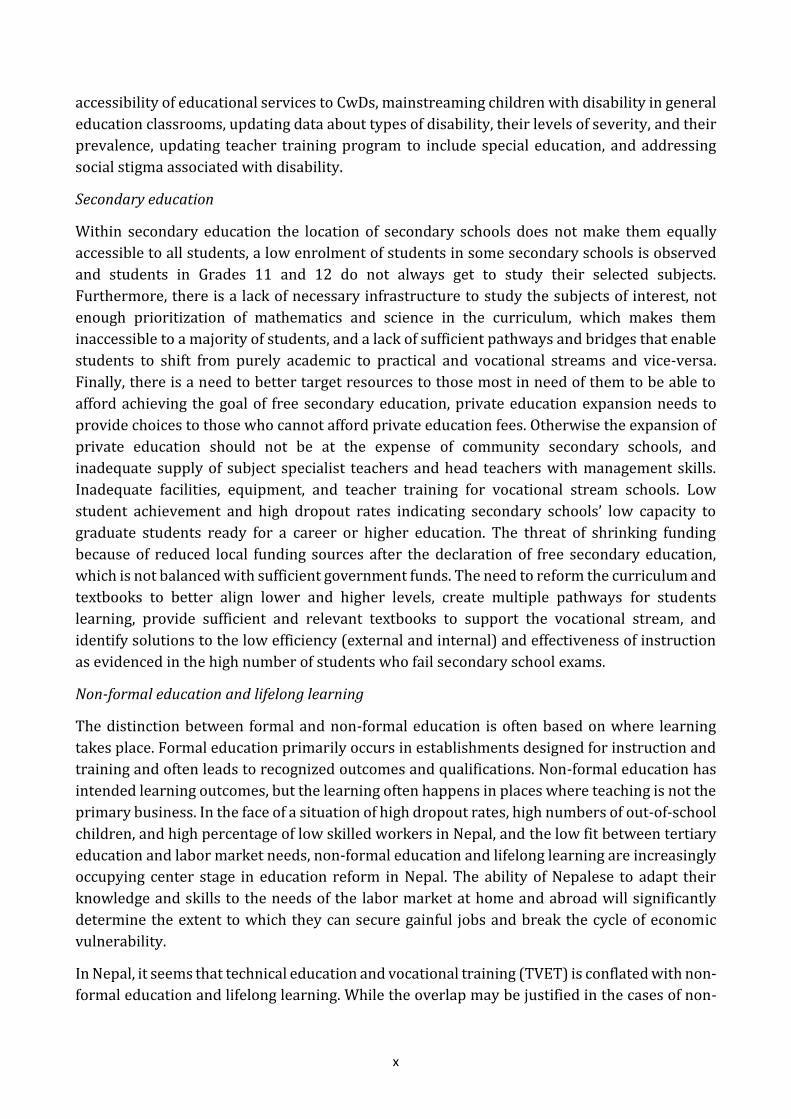
Secondary education
Within secondary education the location of secondary schools does not make them equally
accessible to all students, a low enrolment of students in some secondary schools is observed
and students in Grades 11 and 12 do not always get to study their selected subjects.
Furthermore, there is a lack of necessary infrastructure to study the subjects of interest, not
enough prioritization of mathematics and science in the curriculum, which makes them
inaccessible to a majority of students, and a lack of sufficient pathways and bridges that enable
students to shift from purely academic to practical and vocational streams and vice-versa.
Finally, there is a need to better target resources to those most in need of them to be able to
afford achieving the goal of free secondary education, private education expansion needs to
provide choices to those who cannot afford private education fees. Otherwise the expansion of
private education should not be at the expense of community secondary schools, and
inadequate supply of subject specialist teachers and head teachers with management skills.
Inadequate facilities, equipment, and teacher training for vocational stream schools. Low
student achievement and high dropout rates indicating secondary schools’ low capacity to
graduate students ready for a career or higher education. The threat of shrinking funding
because of reduced local funding sources after the declaration of free secondary education,
which is not balanced with sufficient government funds. The need to reform the curriculum and
textbooks to better align lower and higher levels, create multiple pathways for students
learning, provide sufficient and relevant textbooks to support the vocational stream, and
identify solutions to the low efficiency (external and internal) and effectiveness of instruction
as evidenced in the high number of students who fail secondary school exams.
Non-formal education and lifelong learning
The distinction between formal and non-formal education is often based on where learning
takes place. Formal education primarily occurs in establishments designed for instruction and
training and often leads to recognized outcomes and qualifications. Non-formal education has
intended learning outcomes, but the learning often happens in places where teaching is not the
primary business. In the face of a situation of high dropout rates, high numbers of out-of-school
children, and high percentage of low skilled workers in Nepal, and the low fit between tertiary
education and labor market needs, non-formal education and lifelong learning are increasingly
occupying center stage in education reform in Nepal. The ability of Nepalese to adapt their
knowledge and skills to the needs of the labor market at home and abroad will significantly
determine the extent to which they can secure gainful jobs and break the cycle of economic
vulnerability.
In Nepal, it seems that technical education and vocational training (TVET) is conflated with non-
formal education and lifelong learning. While the overlap may be justified in the cases of non-

xi
formal settings, it is important to underscore that when TVET is delivered as part of the
vocational streams in formal learning institutions, it should be subsumed under formal
education. In this regard, the need for more funding, more up-to-date curriculum, better teacher
training, more vocational stream choices that are relevant to the job market are the main
challenges facing TVET in Nepal. There is, however, little information on the potential of
leveraging existing non-formal and informal channels to supplement formal education efforts
to provide courses in literacy, numeracy, and social skills that equip Nepalese of all ages with
the life skills needed to function independently at the personal and professional levels.
Linkages with higher education
It was earlier explained that the ageing trend of the Nepalese population represents a
demographic dividend opportunity that must be fully seized if the country is to be able to
graduate from being an LDC. It was also noted that key to cashing in on the demographic
dividend is maximizing the productivity of available human resources. One of the means to this
end is educating students to make them ready for college and a career. The Department of
Education’s (DoE) reform vision for SSDP is to prepare citizens who are committed to
democracy, human rights, lifelong learning, a positive disposition toward labor and self-
employment, community participation, and active participation in solving local and national
challenges in the twenty-first century.
Higher education is often the place where these skills and dispositions are tested and honed.
However, there is no reference to links with higher education in the vision or goals of the SSRP.
Thus, of the 14.5 percent of secondary graduates who enrolled in higher education, very little
is known about the extent to which they have the dispositions necessary to succeed in higher
education. According to Conley (2003), these skills include critical and analytical thinking,
problem solving, inquisitiveness, the initiative to take advantage of university resources,
openness to trying new things, being willing to fail at tasks the first time, and the ability to
accept critical feedback and adjust accordingly. These skills are critical to achieving DoE’s
vision. However, without deliberate policies and programs that link education reform to the
broader goal of preparing children who are ready for college and employment, it will be difficult
to translate the vision into an implementable and realistic strategy.
Issues of technical and vocational education and training
Another area where the connection between DoE’s vision and existing programs will need to
be strengthened is technical and vocational education and training (TVET). We noted that the
DoE envisions citizens who have a positive perception of labor, are oriented towards
employment, and have the agency to be active citizens. To achieve this vision, the common view
that TVET is a path of second choice needs to change. Parajuli (2013) notes that only two
percent of secondary and higher secondary students choose TVET, and that this sub-sector
receives only a little bit more than two percent of the national budget. From a management
perspective, TVET programs need to be integrated under one structure instead of being
fragmented into multiple programs under various ministries and offices. The country has yet
to have a vocational qualifications framework even if recognition of the importance of such a

xii
framework began as early as the 1980s. Last, but not least, there is an urgent need to strengthen
the TVET information management system.
Strengthening TVET require connecting the various actors in TVET to create pathways for
further development of TVET participants and alignment of the TVET curriculum with the
demands and needs of the labor market. TVET curricula in Nepal are about 15 years old. In an
increasingly knowledge intensive service driven labor market, the curricula need to be
modernized and connected with modern technology, and there needs to be a robust monitoring
and evaluation system that ensures the enforcement of uniform quality standards and stronger
linkages with the industry to ensure that the curricula and the training fit the labor markets’
needs. Finally, there is a need to institute a national vocational qualification framework that
meets clear and urgent needs, demonstrates compelling benefits, and reflects the financial
constraints and capacities of Nepal.
These actions require political and bureaucratic support, a clear line of command with an
ultimate agency responsible for its implementation, an appreciation of the multiplicity of the
interventions and disposition to build better coordination and flexible pathways connecting
formal and non-formal systems of TVET, reducing barriers to access to TVET. They also need
an integrated system of credit, planning, management, marketing, logistical, support, technical
support, and networking with TVET private and public stakeholders that will make TVET
relevant and responsive to market demands. And all these changes are contingent on a
functional TVET information management system that helps identify needs, disaggregates
services and beneficiaries, better tracks the use of resources, and hence strengthen the
governance of TVET and its attractiveness to private investors.
ICT in education
The vision of the Information and Communication Technology (ICT) in Education Master Plan
(2013–2017) (MoE 2013) is the extensive use of ICT in the education sector for expanding
access to and enhancing the quality of education. The mission is to narrow down the digital
divide through the development of ICT infrastructures, human resources, digital content, and
system enhancement in education. According to UNESCO Institute of Statistics (2012), 6
percent of Nepal’s primary schools and 24 percent of its secondary schools have electricity
connections. One percent of primary schools and 6 percent of secondary schools are connected
to the internet. And only 0.5 percent of primary schools and four percent of secondary schools
use computer-assisted instruction. These data indicate that it may take some time to narrow
the digital divide.
To help speed up ICT penetration in education, ICT needs to be integrated within the National
Information Communication Technology policy. Given the considerable funding necessary to
support ICT penetration, efforts are needed to mobilize the private sector, telecommunication
operators and civil society to help close the digital divide in schools. This could include the
dissemination of local solutions to the generation of electricity and partnerships with local
entrepreneurs (cyber café owners) to improve access to the internet. MoE led solutions should
also include specific strategies aimed at funding ICT infrastructure s (electricity, internet

xiii
connection, computers, trained staff, digital media) in pilot schools, modelling the use of
technology in instruction, training teachers in the use of technology and demonstrating how
ICT can be used to reduce teachers’ workloads and improve students’ focus, retention and
learning. Last, but not least, efforts to support ICT in education should benefit from efforts to
expand the TVET infrastructure. This way, resulting technologically rich platforms in schools
would serve to fulfil the goal of improving access to quality education while planting the seeds
for interest in TVET early in children’s lives.
Teacher management and capacity development
The quality of an education system cannot exceed the quality of its teachers. Improving the
quality of education is an urgent reform priority in Nepal. One main front of effecting change is
by changing the practices of teacher management and capacity development. From a
management perspective, teacher management and capacity development is undertaken by
multiple actors, but the extent to which all the actors are accountable to a single entity is
unclear. This makes the task of enforcing common standards for effective instruction and
effective teacher training at the basic and secondary levels very challenging.
The Teacher Service Commission (TSC) is ultimately responsible for licensing and selecting
permanent teachers. District education offices (DEOs) play a crucial role in recruiting,
deploying, and redeploying teachers. School management committees are responsible for
recruiting temporary teachers. The National Centre for Educational Development (NCED)
manages in-service training for lower secondary and secondary teachers. However, lacking
adequate staff to fulfil its mission, NCED is overwhelmed with in-service training tasks that are
too big to implement successfully.
The backlog of untrained teachers has been largely cleared. The lingering challenge, however,
is that teacher training/qualification has not demonstrated significant effects on student
achievement. The underlying causes of this disconnect should be carefully examined and
analyzed, and factors related to teachers’ preparedness should inform SSDP-related
adjustments to teacher management and capacity development.
Capacity development
Human resource development occurs at individual, organizational and systems levels. Key
provisions of SSRP were not fully implemented because of capacity development weaknesses
at these three levels The SSDP working group has proposed a visionary 50-point capacity
building scenario.
The main thrust of the individual level capacity development scenario is the improvement of
technical skills for executing tasks, use of the curriculum, planning, monitoring supervision, and
documentation using ICT. At the organizational level, the focus of capacity development should
be placed on creating appropriate environments for executing tasks through better work
conditions, high cooperation and team work, action learning, and the promotion of higher
exchange and coordination between branches and authorities with the school sector. At the
systems levels, the need for capacity development is expressed about improving practices in

xiv
staff selection, assigning tasks, preparing rules and regulations, developing work details,
conducting evaluation, and transparent systems of promotion.

xv
CONTENTS
Executive summary ................................................................................................................... i
Contents ................................................................................................................................... xv
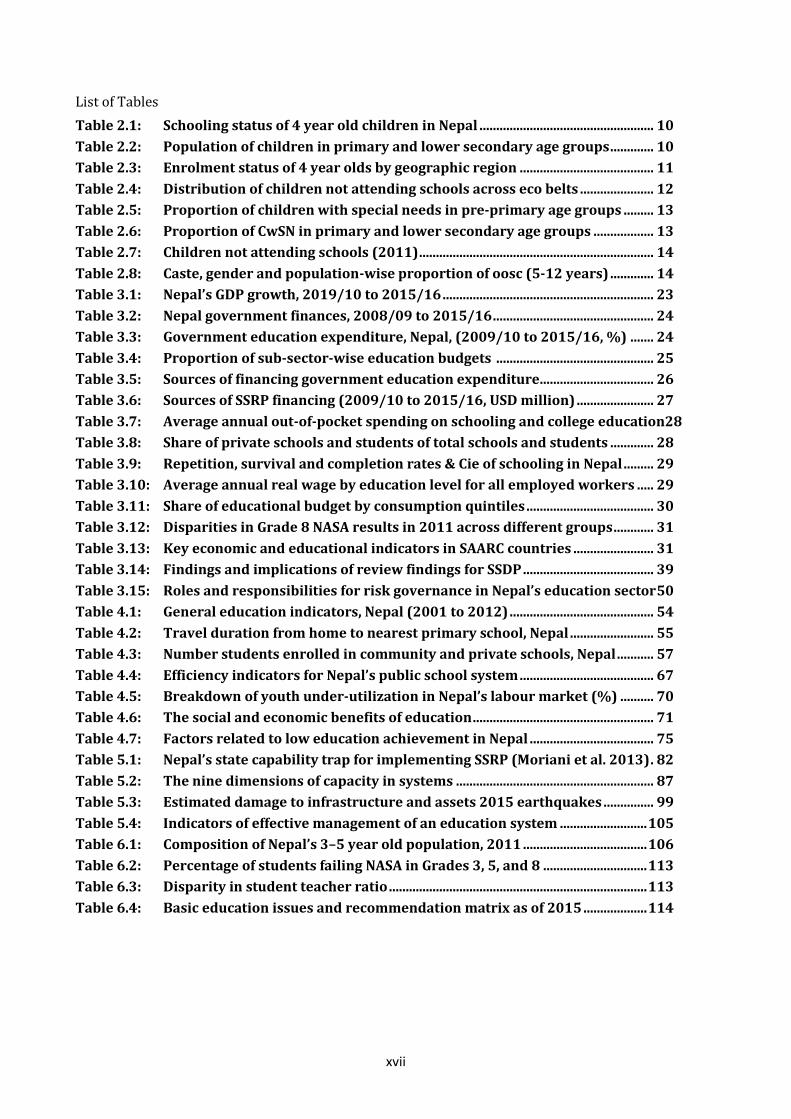
List of Tables ......................................................................................................................... xvii
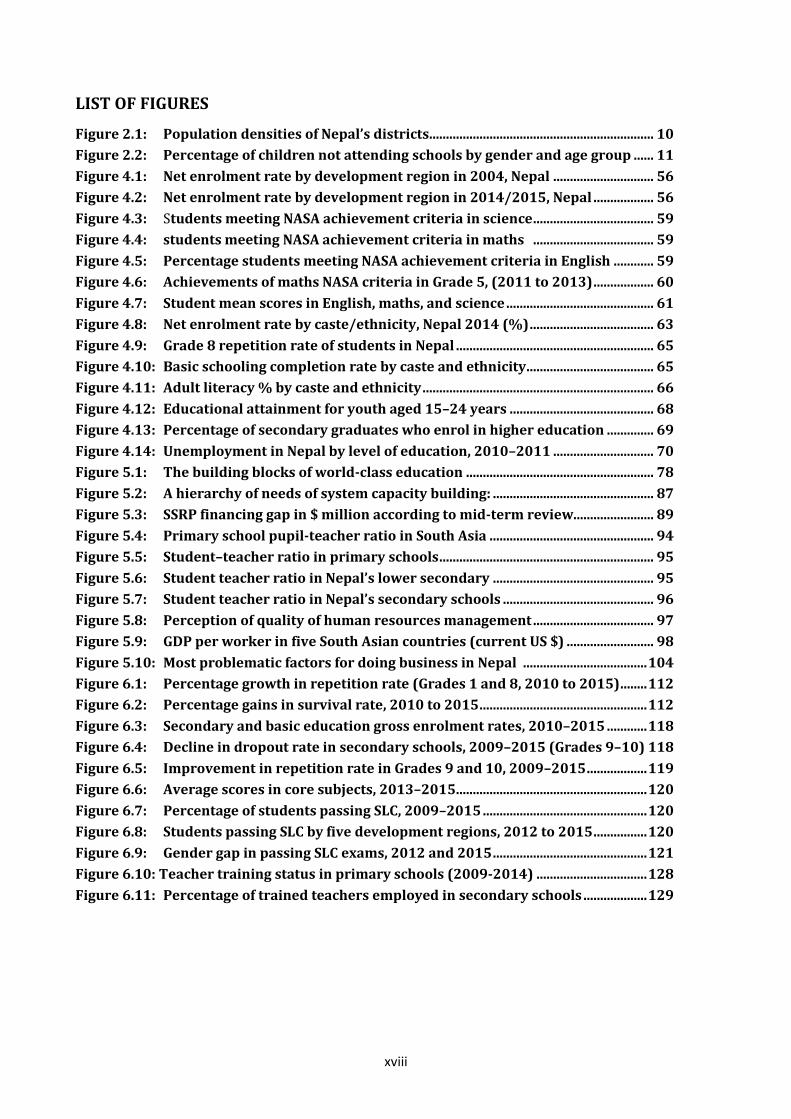
List of Figures ....................................................................................................................... xviii
List of Boxes............................................................................................................................ xix
Acronyms and Abbreviations ................................................................................................. xx
1. Introduction and Context ............................................................................................... 22 1.1 Alignment of development Cooperation .......................................................................... 24 1.2 Coordination and Supervision of the Technical Assistance ........................................... 25 1.3 Supervision of Technical Assistance recruited under the Institutional Consultancy .. 25 1.3.1 Supervision of individually recruited Technical Assistance .......................................... 26 1.3.2 Resource Requirements and Sources for Mobilization of Consultants ......................... 26 1.4 Methodology and production modality / process: ......................................................... 26 1.4.1 Education Sector Analysis and Planning Protocol; ......................................................... 27 1.4.2 Development of the joint ToR ........................................................................................... 28 1.4.3 SSRP Evaluation ................................................................................................................. 28 1.4.4 Sector Analysis ................................................................................................................... 28
2. The Three Imperatives For Education Reform ............................................................... 3 2.1 Post Disaster and Conflict Reconstruction ........................................................................ 3 2.2 The Ticking Clock of the Demographic Dividend: Use It Or Lose It!................................ 4 2.3 Nepal’s Vision for Graduating from LDC Status ................................................................ 6 2.4 In Summary .......................................................................................................................... 7
3. Nepal Situational Analysis: Demographic, Economic and Social Context...................... 9 3.1 Introduction ......................................................................................................................... 9 3.2 Socioeconomic Indicators - Population Density Across Regions and Districts .............. 9 3.2.1 Education – school population ........................................................................................... 9 3.3 In Summary ........................................................................................................................ 22
4. Macroeconomic Indicators and Fiduciary Assessment ................................................ 23 4.1 Introduction ....................................................................................................................... 23 4.2 Macroeconomic and Education Financing Issues ........................................................... 23 4.2.1 GDP growth ........................................................................................................................ 23 4.2.2 Government expenditure .................................................................................................. 24 4.2.3 Government education expenditure ................................................................................ 24 4.3 SSRP Budget and Expenditure Analysis ........................................................................... 33 4.3.1 SSRP classification ............................................................................................................. 33 4.3.2 SSRP budget allocation by program line items ............................................................... 34 4.4 Implications for SSDP ........................................................................................................ 39 4.5 SSDP Fiduciary Management ............................................................................................ 41 4.5.1 Links with overarching legal documents ......................................................................... 42 4.5.2 Resilience and risk mitigation .......................................................................................... 42 4.5.3 Identification and management of risk factors and sources .......................................... 43 4.5.4 Fiduciary risk mitigation policies ..................................................................................... 44 4.5.5 The framework .................................................................................................................. 45
5. Nepal Education Sector: Progress and Challenges ........................................................ 54 5.1 National Education Progress and Challenges .................................................................. 54 5.1.1 Early childhood education ................................................................................................ 55 5.1.2 Basic and secondary schools ............................................................................................ 55 5.1.3 Private education ............................................................................................................... 57

xvi
5.1.4 Non-formal education ....................................................................................................... 57 5.1.5 Challenges .......................................................................................................................... 58
6. Equity ............................................................................................................................... 62 6.1 Equity in access:................................................................................................................. 62 6.2 Equity in participation ...................................................................................................... 64 6.3 Inequity in learning outcomes .......................................................................................... 65 6.4 Efficiency ............................................................................................................................ 67 6.4.1 Internal inefficiency .......................................................................................................... 67 6.4.2 External efficiency ............................................................................................................. 68 6.5 Impact of Education: The Large Untapped Potential ...................................................... 71 6.5.1 Economic impacts .............................................................................................................. 71 6.5.2 The social impacts of education ....................................................................................... 72 6.6 Cross cutting issues underlying problems with access, quality, equity, and efficiency74
7. Readiness for Education Reform ................................................................................... 77 7.1 Policy Framework ............................................................................................................. 78 7.1.1 Nepal Constitution ............................................................................................................. 78 7.1.2 National Development Plan .............................................................................................. 80 7.1.3 The Education Act .............................................................................................................. 82 7.2 Institutional and system readiness .................................................................................. 84 7.3 Capacity to Undertake SSDP ............................................................................................. 86 7.3.1 Performance capacity: ....................................................................................................... 88 7.3.2 Personal capacity ............................................................................................................... 90
8. Analysis of Educational Subsectors and Themes ........................................................ 106 8.1 Early Childhood Education and Development .............................................................. 106 8.2 Basic Education: Gains and Issues.................................................................................. 111 8.3 Secondary Education: Gains and Issues ......................................................................... 117 8.4 Non-formal Education and Lifelong Learning ............................................................... 123 8.5 Links with Higher Education .......................................................................................... 124 8.6 Technical and Vocational Education and Training ....................................................... 124 8.7 ICT in Education .............................................................................................................. 126 8.8 Teacher Management and Capacity Development ....................................................... 126 8.9 Capacity Development .................................................................................................... 130
9. Impact Analysis of the Events in 2015/16 on Nepal's School Sector ......................... 132 9.1 Background and Context ................................................................................................. 132
9.2 Objectives of the Impact Analysis .................................................................................. 133 9.3 Methodology .................................................................................................................... 134 9.4 Limitations ....................................................................................................................... 143 9.5 Analysis of Impacts on Access, Participation and Outcomes in Education ................. 144 9.5.1 Impact on Access and Participation ............................................................................... 144 9.5.2 Impact on Learning ......................................................................................................... 151 9.5.3 Impact on Equity ............................................................................................................. 152
10. Conclusions ................................................................................................................... 155
References ............................................................................................................................. 160
Appendix A: Population density by region and district ...................................................... 167
Appendix B: Standards of USA ED for Teacher and Administrator Competencies ........... 170
Appendix B1: Oregon DoE’s Educational Leadership and Administrator Standards ....... 170
Appendix B2: Massachusetts DoE Standards of Effective Teaching Practice .................... 173
Appendix C: Evolution of the Demographic Dividend Window of Opportunity in Nepal . 175
Appendix D: Strategic Roadmap for Early Childhood Development ................................. 178
xvii
List of Tables
Table 2.1: Schooling status of 4 year old children in Nepal .................................................... 10
Table 2.2: Population of children in primary and lower secondary age groups ............. 10
Table 2.3: Enrolment status of 4 year olds by geographic region ........................................ 11
Table 2.4: Distribution of children not attending schools across eco belts ...................... 12
Table 2.5: Proportion of children with special needs in pre-primary age groups ......... 13
Table 2.6: Proportion of CwSN in primary and lower secondary age groups .................. 13
Table 2.7: Children not attending schools (2011) ...................................................................... 14
Table 2.8: Caste, gender and population-wise proportion of oosc (5-12 years) ............. 14
Table 3.1: Nepal’s GDP growth, 2019/10 to 2015/16 ............................................................... 23
Table 3.2: Nepal government finances, 2008/09 to 2015/16 ................................................ 24
Table 3.3: Government education expenditure, Nepal, (2009/10 to 2015/16, %) ....... 24
Table 3.4: Proportion of sub-sector-wise education budgets ............................................... 25
Table 3.5: Sources of financing government education expenditure .................................. 26
Table 3.6: Sources of SSRP financing (2009/10 to 2015/16, USD million) ....................... 27
Table 3.7: Average annual out-of-pocket spending on schooling and college education28
Table 3.8: Share of private schools and students of total schools and students ............. 28
Table 3.9: Repetition, survival and completion rates & Cie of schooling in Nepal ......... 29
Table 3.10: Average annual real wage by education level for all employed workers ..... 29
Table 3.11: Share of educational budget by consumption quintiles ...................................... 30
Table 3.12: Disparities in Grade 8 NASA results in 2011 across different groups ............ 31
Table 3.13: Key economic and educational indicators in SAARC countries ........................ 31
Table 3.14: Findings and implications of review findings for SSDP ....................................... 39
Table 3.15: Roles and responsibilities for risk governance in Nepal’s education sector 50
Table 4.1: General education indicators, Nepal (2001 to 2012) ........................................... 54
Table 4.2: Travel duration from home to nearest primary school, Nepal ......................... 55
Table 4.3: Number students enrolled in community and private schools, Nepal ........... 57
Table 4.4: Efficiency indicators for Nepal’s public school system ........................................ 67
Table 4.5: Breakdown of youth under-utilization in Nepal’s labour market (%) .......... 70
Table 4.6: The social and economic benefits of education ...................................................... 71
Table 4.7: Factors related to low education achievement in Nepal ..................................... 75
Table 5.1: Nepal’s state capability trap for implementing SSRP (Moriani et al. 2013) . 82
Table 5.2: The nine dimensions of capacity in systems ........................................................... 87
Table 5.3: Estimated damage to infrastructure and assets 2015 earthquakes ............... 99
Table 5.4: Indicators of effective management of an education system .......................... 105
Table 6.1: Composition of Nepal’s 3–5 year old population, 2011 ..................................... 106
Table 6.2: Percentage of students failing NASA in Grades 3, 5, and 8 ............................... 113
Table 6.3: Disparity in student teacher ratio ............................................................................. 113
Table 6.4: Basic education issues and recommendation matrix as of 2015 ................... 114
xviii
LIST OF FIGURES
Figure 2.1: Population densities of Nepal’s districts................................................................... 10
Figure 2.2: Percentage of children not attending schools by gender and age group ...... 11
Figure 4.1: Net enrolment rate by development region in 2004, Nepal .............................. 56
Figure 4.2: Net enrolment rate by development region in 2014/2015, Nepal .................. 56
Figure 4.3: Students meeting NASA achievement criteria in science .................................... 59
Figure 4.4: students meeting NASA achievement criteria in maths .................................... 59
Figure 4.5: Percentage students meeting NASA achievement criteria in English ............ 59
Figure 4.6: Achievements of maths NASA criteria in Grade 5, (2011 to 2013) .................. 60
Figure 4.7: Student mean scores in English, maths, and science ............................................ 61
Figure 4.8: Net enrolment rate by caste/ethnicity, Nepal 2014 (%) ..................................... 63
Figure 4.9: Grade 8 repetition rate of students in Nepal ........................................................... 65
Figure 4.10: Basic schooling completion rate by caste and ethnicity ...................................... 65
Figure 4.11: Adult literacy % by caste and ethnicity ..................................................................... 66
Figure 4.12: Educational attainment for youth aged 15–24 years ........................................... 68
Figure 4.13: Percentage of secondary graduates who enrol in higher education .............. 69
Figure 4.14: Unemployment in Nepal by level of education, 2010–2011 .............................. 70
Figure 5.1: The building blocks of world-class education ........................................................ 78
Figure 5.2: A hierarchy of needs of system capacity building: ................................................ 87
Figure 5.3: SSRP financing gap in $ million according to mid-term review........................ 89
Figure 5.4: Primary school pupil-teacher ratio in South Asia ................................................. 94
Figure 5.5: Student–teacher ratio in primary schools ................................................................ 95
Figure 5.6: Student teacher ratio in Nepal’s lower secondary ................................................ 95
Figure 5.7: Student teacher ratio in Nepal’s secondary schools ............................................. 96
Figure 5.8: Perception of quality of human resources management .................................... 97
Figure 5.9: GDP per worker in five South Asian countries (current US $) .......................... 98
Figure 5.10: Most problematic factors for doing business in Nepal ..................................... 104
Figure 6.1: Percentage growth in repetition rate (Grades 1 and 8, 2010 to 2015)........ 112
Figure 6.2: Percentage gains in survival rate, 2010 to 2015 .................................................. 112
Figure 6.3: Secondary and basic education gross enrolment rates, 2010–2015 ............ 118
Figure 6.4: Decline in dropout rate in secondary schools, 2009–2015 (Grades 9–10) 118
Figure 6.5: Improvement in repetition rate in Grades 9 and 10, 2009–2015 .................. 119
Figure 6.6: Average scores in core subjects, 2013–2015......................................................... 120
Figure 6.7: Percentage of students passing SLC, 2009–2015 ................................................. 120
Figure 6.8: Students passing SLC by five development regions, 2012 to 2015 ................ 120
Figure 6.9: Gender gap in passing SLC exams, 2012 and 2015 .............................................. 121
Figure 6.10: Teacher training status in primary schools (2009-2014) ................................. 128
Figure 6.11: Percentage of trained teachers employed in secondary schools ................... 129

xix
LIST OF BOXES
Box 3.1: The eight elements needed to create a comprehensive and coherent PFM .......... 41
Box 5.1: Rights to education in Nepal’s constitution, 2015 .......................................................... 79
Box 5.2: Nepal’s Three-Year Plan .......................................................................................................... 81
Box 5.3: Policy directions for financing SSDP .................................................................................... 88
Box 5.4: Strategies for implementing policy directions for financing SSDP ........................... 88
Box 5.5: Examples of standards for professional practice in education .................................. 93
Box 5.6: Accessibility and design principles of the OCTAE, U.S Department of Education100
Box 5.7: Manifestations of the capability trap ................................................................................. 103

xx
ACRONYMS AND ABBREVIATIONS
ADB Asian Development Bank
ASIP Annual Strategic Implementation Plan
AWPB annual work plan and budget
bn billion
CBS Central Bureau of Statistics
CDC Curriculum Development Centre
CFS child friendly school
CLC community learning center
CTEVT Council for Technical Education and Vocational Training
CwD children with disabilities
CwSN children with special needs
DDC district development committee
DLI deliverable linked incentives
DoE Department of Education
DEO district education office
ECD early childhood development
ECED early childhood education and development
EFA Education For All
EGRA early grade reading assessment
EMIS Education Management Information System
ERO Education Review Office
ETC education training center
FMR financial monitoring report
FY fiscal year
GDP gross domestic product
GER gross enrolment rate
GoN Government of Nepal
HIV human immunodeficiency virus
IACDP Institutional Assessment and Capacity Development Plan
ICT information and communication technology
ILO International Labour Organization
INGO international non-governmental organization
JFA Joint Financing Arrangement
LDC least developed country
LLL life-long learning
M&E monitoring and evaluation
MCC Millennium Challenge Corporation
MDG Millennium Development Goal
MMR maternal mortality rate
MoE Ministry of Education
MoF Ministry of Finance
MoFALD Ministry of Local Development
MoH Ministry of Health
MoHP Ministry of Health and Population
MoI medium of instruction
MTEF medium term expenditure framework
NASA National Assessment of Student Achievement

xxi
NCASC National Centre for AIDS and STD Control
NCE National Campaign for Education
NCED National Centre for Educational Development
NFE non-formal education
NFEC Non-Formal Education Committee
NGO non-governmental organization
NLSS Nepal Living Standard Survey
NPA National Plan of Action
NPC National Planning Commission
NPR Nepalese rupees
NSII Nepal Multi-Dimensional Social Inclusion Index
NVQF National Vocational Qualification Framework
OECD Organization for Economic Cooperation and Development
OOSC out of school children
PABSON Private and Boarding Schools Organization of Nepal
PCF per capita funding
PDNA Post-disaster Need Assessment
PIAAC Program for the International Assessment of Adult Competencies
PMECs priority minimum enabling conditions
PPC pre-primary class
PPE pre-primary education
PTA parent teacher association
SAARC South Asian Association for Regional Cooperation
SDGs Sustainable Development Goals
SESP Secondary Education Support Program
SHN school health and nutrition
SIP school improvement plan
SLC School Level Certificate
SMC school management committee
SSDP School Sector Development Plan
SSRP School Sector Reform Plan
STEM Science Technology Engineering and Mathematics
SWAp sector wide approach
TPD teacher professional development
TSC Teacher Service Commission
TSLC Technical School Leaving Certificate
TVET Technical and Vocational Education and Training
UNESCO United Nations Educational, Scientific, and Cultural Organization
UNGEI United Nations Girls’ Education Initiative
UNICEF United Nations International Children's Emergency Fund
USAID United States Agency for International Development
VDC Village Development Committee
WFP World Food Program
WHO World Health Organization
Exchange rate as of February 2016, = NPR 108: $1

Nepal Education Sector Analysis
22
1. INTRODUCTION AND CONTEXT
Nepal and the rest of the world are embarking on the Sustainable Development Goals (SDGs).
The country is also entering a new federal education governance era as per the newly
promulgated constitution (2015). In education, the SDGs agenda and the new constitution
advocate for inclusive, equitable, and quality access to education that encompasses early
childhood, primary, secondary and tertiary education, and technical and vocational training.
In this regard, the government’s School Sector Development Program (SSDP), scheduled for
implementation from July 2016 to July 2022, is intended to embody the SDGs and the new
constitution aspirations and put education improvement reforms front and center of Nepal’s
national development. This is all in line with the government’s vision for the country to
graduate from the status of a least developed country (LDC).
The School Sector Reform Plan (SSRP) is the current Education Sector Plan. It was initiated
in 2009 and is due to end in July 2016. The SSDP will be a continuation of the government’s
efforts to ensure access to quality education for all through programs such as Education for
All (EFA), the Secondary Education Support Program (SESP), the Community School Support
Program (CSSP), the Teacher Education Project (TEP) and the SSRP. Building upon the
lessons learned and the gains made under these programs, the SSDP is envisioned to achieve
the unfinished agendas and accomplish the goals defined under the recently agreed SDGs.
To produce a needs-based plan, the Ministry of Education (MoE) is taking an inclusive and
participatory approach and is carrying out a sectoral analysis. This analysis has an important
role in making an evidence-based case for the direction of education reform for Nepal
between July 2016 and 2022. Fullan (2001) argues that planning often fails because it does
not consider local context and culture. National education reform presents a challenge with
a much more complex order of magnitude. As a plan, it is highly complex because it entails
identifying problems by order of urgency, selecting among competing solutions, and getting
the necessary buy-in to allow the SSDP to be implemented with minimum disruptions. All
this requires careful preparation of the case for reform, which in turn is largely dependent
on fully understanding the national context for reform. This sector analysis attempts to do
this.
The report has seven chapters. Chapter 1 describes the rationale for investing in deep and
sweeping education reform. Chapter 2 presents a situational analysis of the demographic,
economic, social, and political context in Nepal. Chapter 3 discusses the macro-economic
picture of the country and state of public finance in its relation to the education sector.
Chapter 4 describes the progress achieved and lingering challenges on access, quality, equity,
and efficiency. Chapter 5 examines dimensions of sector system capacity to gauge
institutional, organizational, and human resource readiness for SSDP. Chapter 6 presents the

Nepal Education Sector Analysis
23
state of the school sector by the sub-sectors of are early childhood education, basic
education, secondary education, tertiary education, and technical vocational education and
training (TVET). Chapter 7 reviews cross-cutting issues including education sector
governance, capacity development, teacher management and ICT. Chapter 8 presents
lessons learned from the sector analysis and recommendations for the way forward.
1. Background
The Government of Nepal has implemented the School Sector Reform Plan (SSRP)
since 2009. The SSRP—jointly supported by several development partners using a
sector-wide approach—builds upon the earlier reforms in the school education
sector and seeks to improve access and equity and quality of the entire school
education system (grades 1–12). It also seeks to consolidate the existing four-tier
structure of school education (comprising of 5 years of primary, three years of lower
secondary, two years of secondary, and two years of higher secondary education)
into eight years of basic (grades 1–8) and four years of secondary (grades 9–12)
education. The SSRP is scheduled to complete at the end of FY 2015-16 (July 2016).
Thus, there is a need for a new sector development plan to build upon the gains made
thus far and to continue the sector wide approach to reforms in the school education
sector for greater impact. To ensure need based and relevant design of the new plan,
translating in further strengthening of access, participation and learning outcomes
across the education sector, the Government of Nepal and the Development Partners
(including (I)NGOs and CSOs) have agreed to jointly undertake the necessary
evaluation, analysis and consultations prior to the development of the new sector
development plan.
In addition to this, the new Education Sector Plan must take the post immediate and
medium term needs that have emerged because of the earthquakes that struck a
large part of Nepal on the 25th of April and 12th of May, which affected the education
of around 1.5 million children in several grades of severities. The plan must build on
the immediate response that has been undertaken by the Government through the
ASIP and the Nepal Education Cluster to mitigate the interruption of education and
the impact of the disaster, both in terms of primary and secondary damage and in
terms of physical damage and social impact. Furthermore, the new plan should have
a strong cross cutting focus on strengthening Disaster Risk Reduction (DRR) and
Resilience.

Nepal Education Sector Analysis
24
2. Purpose and Objectives:
Goal: To ensure a clear roadmap for the development of the SSDP that caters to the needs
of children, youth and adults and contributes to Nepal’s socio-economic and sustainable
development through a continuous process of enhancing institutional and organizational
capacity, as well as the development of human capital and resilience at all levels.
Objective: The Technical expertise mobilized through this Terms of reference will
enable the Government for the development of the School Sector Development Plan
(SSDP), which is envisioned to:
i. foster children’s all-round development, laying a firm foundation for basic
education,
ii. ensure equitable access to quality education through a right based and child
friendly approach,
iii. ensure all teachers have the knowledge and skills required to effectively
facilitate students learning processes and are managed accordingly,
iv. Meet national development needs by producing competent and skilled
human resources and providing a sound foundation for tertiary education.
v. Strengthening resilience of the school education sector and through that of
the Nepalese society.
1.1 Alignment of development Cooperation
The DPs are committed to engage in the SSDP development process with the aim to further
strengthening effective development cooperation, further strengthen national ownership of
the program, further engage I/NGO and CSO networks through participatory approaches to
ensure the achievement of national priorities and enable effective decision making. Building
on the strong practices under the SSRP Sector Wide Approach (SWAp), the Development
Partners and Government aim to align Development Cooperation with national priorities,
build capacity and strengthen institutions where needed and ensure joint monitoring and
assessment of performance through aligned indicators. Strengthening a 'One Door Only'
policy for TA during the SSDP development period is considered a priority to further
strengthen coordination and avoid duplication and redundancy, both in terms of available
resources and in terms of involvement of the (limited) human resources within the
Government allocated for this. Furthermore, it ensures that all SSDP related activities
undertaken will feed into the SSDP development process. In line with the good practices
under the SSRP Joint Financial Arrangement (JFA), this ToR has been jointly developed by
the Development Partners and endorsed by the Ministry of Education. As such, the roadmap
described in this ToR is envisioned to guide the partnership in line with the international
agreements on Aide effectiveness. The ToR supports the development of common
procedures and operational guidelines for management to ensure transparency,
Nepal Education Sector Analysis
25
accountability, results-based monitoring and reporting and increase effectiveness and foster
improved government ownership and prospects of sustainability as activities originate from
implementing agencies, based on their needs.
1.2 Coordination and Supervision of the Technical Assistance
For the overall supervision, a core team will be established, consisting of the SSDP Technical Committee Member Secretary, DP focal and DPs that have provided resources for the deployment of the required TA. The individual TA that will be procured through the institutional consultancy will be supervised by the institution and daily by the Team Leader, guided by the core team. The core team will meet frequently and on a needs basis and will communicate with the institution through UNICEF as both the DP focal point and the Managing entity of the GPE grant through which the institutional consultancy will be procured. For the individually-procured TA for the background studies, a detailed study protocol will be presented by them to the core team within the first 10 days of the deployment that is aligned with the timelines, roles, responsibilities and expected deliverables and outputs stated in this ToR. Regarding the individually recruited TA of the SSDP core team, the TA will develop a detailed work plan in line with the timelines, deliverables, outputs and tasks, as specified in this consultancy which will be submitted to the core team for approval.
1.3 Supervision of Technical Assistance recruited under the Institutional
Consultancy
Nepal has applied for an Education Sector Program Development Grant (ESPDG) from the
GPE for the resourcing of the Technical Assistance that will be deployed through an
institutional consultancy. UNICEF has been endorsed by the Nepal Local Education Group
(LEG) as Managing Entity for this grant and as such will manage the recruitment and
contracting of the institution. The Terms of Reference for this will be developed in line with
UNICEF’s internal requirements and reflect the feedback and input provided by Government
and the LEG members. After the deployment of the team, the Team Leader will initiate the
work by developing an inception report that specifies the planned activities and
methodologies, which will be reviewed and approved by the SSDP Technical Committee and
fulfil the requirements of meeting the expected deliverables stated in the contract. The
institution will be responsible for the recruitment and deployment of the thematic specialists
for the undertaking of additional studies to address the identified knowledge gaps of the
background documentation review and analysis, in line with the requirements and expertise
stated in the ToR. The SSDP support team that will be deployed under the institutional
consultancy will be managed by the SSDP Team Leader and the SSRP Team Leader will be
guided by the member secretary of the SSDP Technical Committee, in line with the approved
inception report and the institutional contract signed with the Managing Entity. When
requesting for payment or resources, the Team Leader will request approval from the

Nepal Education Sector Analysis
26
Managing Entity through mail. The SSDP Technical Committee will review the timeline and
deliverables stated in the ToR during each meeting.
1.3.1 Supervision of individually recruited Technical Assistance
The day to day coordination of the mobilized TA will be done by the SSDP Secretariat and
Team Leader will coordinate with the TA recruited as specified within this ToR under Phase
I to Phase V (excluding the external appraisal of the SSDP program Document), guided by the
research protocols and work plans that have been approved by the core plan and the TA and
consultation flow chart that has been attached to this ToR as Annex 3. The Team Leader will
do so in close collaboration with the SSDP Technical Committee, of which S/He will be a
member. The required additional Technical Assistance is described in detail in chapter 8;
'Technical Assistance Requirements' below.
1.3.2 Resource Requirements and Sources for Mobilization of Consultants
The consultants will be mobilized through resources from the government and Development
Partners (DPs) interested in supporting the proposed SSDP. In addition, the DP focal point
and the Government will apply for an Education Program Development Grant (EPDG) from
the Global Partnership for Education (GPE) to ensure all identified needs are sufficiently
funded. The provision of resources for TA from the DPs will be aligned through this TA and
a budget, specifying the detailed budget and funding sources and modalities, is presented in
chapter 7.
1.4 Methodology and production modality / process:
The proposed 5 year SSDP for FY2017-FY2021 will continue to consolidate the gains
made from earlier programs and strive to develop an inclusive and high quality school
education system for all children. The SSDP is envisioned to be embedded in the 14th
Periodic Plan of the Nepal Education Sector developed by the National Planning
Commission (NPC), as well as be aligned with the longer-term Education Sector Plan
that will succeed the Education For All National Plan of Action (EFA/NPA; 2000-2015)
and will be guiding Nepal in achieving the Sustainable Development Goals (SDGs) by
2030. Development of the SSDP will be led by the Ministry of Education (MOE) through
a highly consultative process and will both aim to secure the gains made within the
education sector and reflect the emerging priorities and areas for future investment.
Additionally, the Damage and Loss Assessment (DaLA) and identified needs in the Post
Disaster Needs Assessment (PDNA) that has been conducted in May/June 2015 for the
post immediate (1-3 years) and medium (3-6 years) time period will guide the
incorporation of the post disaster recovery plan in the SSDP. The development of the
SSDP will be implemented through a number of phases that are described below:

Nepal Education Sector Analysis
27
Phase 1; Initial Assessment and Preparation (Feb-July 2015); During this phase the
SSDP development infrastructure will be established and the technical assistance to
support this process will be mobilized. After the establishment of the Steering
Committee, Technical Committee and Secretariat, as well as the physical and logistical
arrangements to support this, the secretariat will compile the relevant documentation
and data to inform the background papers developed by the SSDP Thematic Working
Groups (TWGs).
The existing SSRP joint Thematic Working Groups (TWGs) will serve as a base for the
establishment of SSDP Thematic Working Groups (TWGs) to undertake thematic review
and stakeholder consultation (4.3.6) that will result in the development of SSDP
Thematic Option Papers (4.3.7). For this, the existing Terms of Reference of the joint
SSRP TWGs will be revised. The TWGs are envisioned to broaden their participation for
the thematic review and consultation with experts and stakeholder representatives. The
TWGs will undertake documentation review and provide input and guidance to the
thematic specialists (8.2 & 8.3) that are deployed for undertaking background studies
(4.3.2) as part of the sector analysis (4.3).
1.4.1 Education Sector Analysis and Planning Protocol;
Guided by the SSDP Technical Committee (5.1), the SSDP Development support team will develop an inception report that will specify the methodology deployed during the Education Sector Analysis (4.3) and the SSDP development and planning. The inception report will specify the roles and responsibilities of the TA that will be mobilized for the development of the SSDP, as well as which methodologies will be specified during the review and analysis and the undertaking of additional background studies to address identified knowledge gaps. The inception report should provide a roadmap to ensure an aligned process that incorporates the findings of all activities undertaken as part of the process and assures a sector analysis and planning process of international quality standards. The Inception report and sector analysis will have to take the changed context post disaster and the PDNA report into account. The Sector Analysis and SSDP Planning Inception draft Report will be presented to the SSDP Technical Committee (4.1.1 & 5.1) for input and the revised report will be submitted to the SSDP Technical Committee for approval.
SSDP background documentation review and Gap analysis The SSDP Concept Note will
identify the ‘unfinished agenda’ of the SSRP based on the guidance of the NPC and
the SSDP Steering Committee, as well as through reviewing the outcomes of the SSRP
joint reviews and consultations. The SSDP Concept Note will identify key issues and
opportunities within thematic components that will be used as a departure point for
the review and consultation that will be undertaken by the joint Thematic Working
Groups. Furthermore, the SSDP Concept Note will highlight the areas in which
further consultation and focus is needed to address knowledge gaps and to inform

Nepal Education Sector Analysis
28
the Thematic Working Groups for the Development of Option Papers, stakeholder
consultations and through background studies that will be undertaken as part of the
sector analysis to inform the SSDP development.
Phase 2; Joint External Evaluation of the SSRP (April-August 2015)
1.4.2 Development of the joint ToR
The Joint Financing Arrangement (JFA) of the SSRP, signed between the GON and the Pooling DPs has a requirement to conduct a joint independent final evaluation of the SSRP. Key stakeholders such as MoE and the DPs have been actively involved in the planning process of this evaluation, including in the drafting of the TOR. At the overall level the GoN and the pooling DPs have jointly developed the TOR, agreeing that the evaluation process will be funded and managed by the Delegation of the European Union to Nepal (EU) on behalf of the Ministry of Education and the Pooling Development Partners.
1.4.3 SSRP Evaluation
a concise report in English is to be submitted to the EU Delegation within 5 days of the start of the assignment, which will include: a detailed methodology including an evaluation matrix with evaluation questions and select indicators, based on the priorities detailed above; a plan for data collection and a program of work; and a suggested structure for the final report. The evaluation questions can be expanded on as and when necessary during the evaluation. The Inception Report will be discussed with the GON and the DPs before approval by the EU. An Aide Memoire on initial key findings with an analysis was presented to the Stakeholders and a discussion facilitated by the Evaluation team at an ad hoc meeting for this purpose around the middle of the assignment. The draft final report should be submitted to the EU Delegation, who will gather and consolidate the comments / feedback from GON and the DP group. The EU Delegation will provide the consolidated comments not later than 10 calendar days after the submission of the draft report. After receipt of the comments the consultant will finalise and submit the Final Report. The Final Report should include in annex a PowerPoint Presentation, summarizing the methodology, key findings, conclusions and recommendations, to be presented to MoE, DPs and other stakeholders around the time of the Joint Quarterly Meeting (JQM).
1.4.4 Sector Analysis
Sector Analysis Methodology; The SSDP Team Leader and the Sector Analysis and Program planning Expert will support the SSDP Technical Committee and Secretariat in the development of a detailed Sector analysis methodology that encompasses a quantitative analysis to identify statistical trends, a socio-economic and political context analysis, a macro-economic and public finance analysis and projection and a social and economic impact analysis of education. In addition, the Sector Analysis needs to be building on and aligned with the DaLA and PDNA report that will be finalized in June 2015. The design of the overall sector analysis will also specify in what way the thematic background studies,
Nepal Education Sector Analysis
29
stakeholder consultations, Thematic Option Papers, Findings and Outcomes of the SSRP Evaluation will feed into the analysis process. The thematic specialist that will be deployed to undertake the thematic background studies will in close collaboration with the Sector Analysis and Program planning Expert for the design of research protocol and methodology to ensure compatibility in approach and outputs to feed back into the sector analysis. The background studies will be conducted in education sub sectors and thematic areas. Technical Assistance will be mobilized through the deployment of thematic specialist to supplement the review of background documentation and address identified knowledge gaps. The Thematic specialists will work closely with the relevant Thematic Working Group Coordinators and Facilitators to ensure that the stakeholder consultations are providing relevant input to the background studies and support the TWG facilitators and facilitators with the development of the Thematic Option Papers. Where background studies cover an area that has not been embedded within the SSRP, the specialists will also be expected to support the Sector Analysis and Program planning Expert and the sub sector/thematic expert writers with the drafting of the SSDP document. Quantitative Trend Analysis Based on the compiled quantitative data from education statistics (EMIS), household statistics, DaLA & PDNA, and other reviews and assessments, such as NASA and EGRA, a (quantitative) trend analysis of education outcomes will be undertaken by the Sector Analysis and Program Planning Expert to project trend in (quantitative) education outcomes. The quantitative trend analysis will feed into the broader Socio-economic and political context analysis. Socio economic and political context and policy analysis; The context analysis is aimed to flash out future projections of the total population and the school aged population based on past trends, to identify constraints placed by demographics on the education system. For this, the Sector Analysis and Program planning Expert will analyze key social indicators (such as share of population living below poverty line, urban/non-urban/rural/remote trends and projections, demographic density, adult literacy rate, prevalence of disabilities, HDI, etc.) that define the national social development context. The detailed methodology will be shared with the M&E TWG for input and the SSDP TC, Secretariat, and Team Leader for approval and will include analysis of past trends and future projections of the distribution of the total population and the school aged population by age, gender, geographical location, and events that influence this, such as migration, climate related living patterns and geographical and cultural features. Furthermore, the context analysis will include an analysis of the country’s context in political and geographical perspectives and provide an overview of the country’s cultural, ethnical and linguistic composition. A risk assessment in terms of natural disasters and socio economic, cultural and political hazards will also be included in the design of the analysis, informed by the Disaster Risk Reduction and School Safety TWG Option Paper. The analysis will take stock of the EU Development Cooperation assessment, which is expected to be completed in April 2015 and the Joint External SSRP evaluation, of which the initial key findings will be shared in June 2015. Macro-economic and public finance analysis and projection; This part of the sector analysis will be performed by the Education Economist and be informed by the School Education

Nepal Education Sector Analysis
30
Financing Study, the Private education Sector Study, the Governance and Management Study and the Student Financial Assistance/Scholarship Study and will evaluate the current and projected levels of resources available for public education through analysis of past trends in GDP, domestic and external resources and projection of future scenarios for GDP, tax income and public resources. The analysis will include a cost-benefit analysis, including an assessment of resource allocations from an equity perspective, analysis of the overarching finance legislation, policy and management in education and which rationale is used in policy choices regarding public resources (re)distribution are undertaken, education cost sharing between the Government and households, breakdown and assessment of public recurrent unit costs. The analysis will take stock of the work and findings that are expected from the GPE-GRA supported Nepal Education Accounts initiative undertaken by the Ministry of education and UNESCO UIS on determining the total cost and resourcing of Education in Nepal.
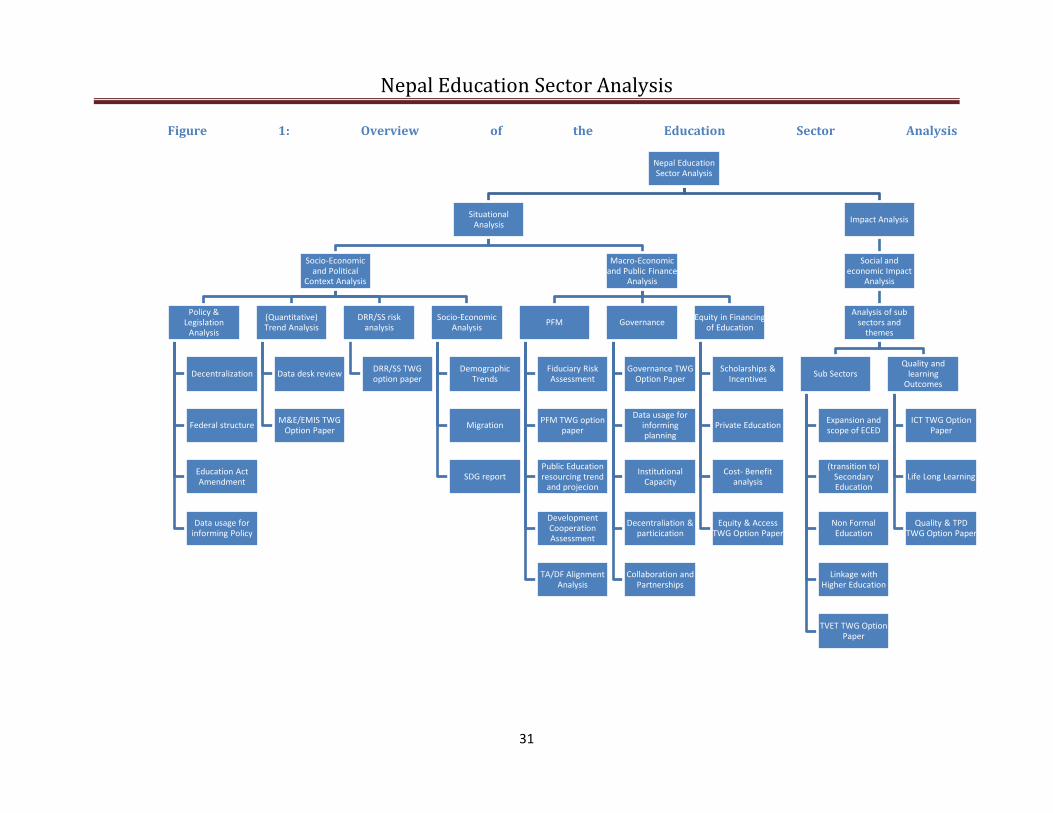
Nepal Education Sector Analysis
31
Figure 1: Overview of the Education Sector Analysis
Nepal Education Sector Analysis
Situational Analysis
Socio-Economic and Political
Context Analysis
Policy & Legislation
Analysis
Decentralization
Federal structure
Education Act Amendment
Data usage for informing Policy
(Quantitative) Trend Analysis
Data desk review
M&E/EMIS TWG Option Paper
DRR/SS risk analysis
DRR/SS TWG option paper
Socio-Economic Analysis
Demographic Trends
Migration
SDG report
Macro-Economic and Public Finance
Analysis
PFM
Fiduciary Risk Assessment
PFM TWG option paper
Public Education resourcing trend
and projecion
Development Cooperation Assessment
TA/DF Alignment Analysis
Governance
Governance TWG Option Paper
Data usage for informing planning
Institutional Capacity
Decentraliation & particication
Collaboration and Partnerships
Equity in Financing of Education
Scholarships & Incentives
Private Education
Cost- Benefit analysis
Equity & Access TWG Option Paper
Impact Analysis
Social and economic Impact
Analysis
Analysis of sub sectors and
themes
Sub Sectors
Expansion and scope of ECED
(transition to) Secondary Education
Non Formal Education
Linkage with Higher Education
TVET TWG Option Paper
Quality and learning
Outcomes
ICT TWG Option Paper
Life Long Learning
Quality & TPD TWG Option Paper

Nepal Education Sector Analysis
1
Stakeholder Consultations; In order to maximize analytical findings into reforms, strong ownership across the system needs to be ensured. For this broad stakeholder consultations, as well as validations are planned to be undertaken through a participatory approach by Government, Development Partners, (I)NGO and CSO networks and at all levels. The stakeholder consultations need to ensure that limited resources are realistically projected and planned in most effective and equitable way through identification of need. By also including high level and key stakeholder consultations, ownership and advocacy at a political level and among groups that have a high level of influence within the education sector is aimed to be ensured. In order to engage with stakeholders in effective and appropriate ways, an SSDP stakeholder consultation guideline will be developed by the SSDP Secretariat, supported by the SSDP Team Leader and with active contribution from the Association of INGOs in Nepal (AIN) and the National Campaign for Education in Nepal (NCE-N), based on the lessons learnt and best practices within these networks. Stakeholder consultations will be undertaken at local, district and regional level by the TWGs with the support of the TWG facilitators and the SSDP Team Leader and the SSDP Secretariat support staff. In addition to these consultations, the SSDP TC will organize round table discussions and key stakeholder representative interviews, as well as high level consultations by the MOE management. As such, the TWGs will support the SSDP development process through providing technical input within the parameters and in response to the guiding questions set out in the SSDP concept note and will submit a proposal to the SSDP Secretariat in which the scope, location and rationale of the stakeholder consultations is specified, for which they will be supported by the TWG facilitators and the appropriate thematic specialists. Development of Thematic Option Papers; In line with the guiding questions stated in the SSDP Concept note, the TWGs will develop Thematic Option Papers, which are based on internal and external discussion that is facilitated and documented by the TWG facilitators. The TWG Coordinators will ensure that there is close collaboration with the thematic specialists in order to ensure there is no discrepancy between the Thematic Option Papers and the Thematic Background Studies that are both expected to inform the Sector Analysis and the development of the SSDP Approach Paper. The SSDP Sub Sector Expert Writer and the SSDP Thematic Expert writer will ensure the consistency within the SSDP Approach Paper during the incorporation of the Thematic Option Papers, under the guidance of the Team Leader. Stock taking of SSRP evaluation main findings; A joint external SSRP Evaluation has been initiated, as is provisioned in the SSRP Joint Financial Arrangement. For this, an external SSRP Evaluation Team has been deployed to evaluate the SSRP on Effectiveness, Efficiency, Relevance, Impact and Sustainability. The SSRP Evaluation and main findings will be presented during the 2015 SSRP Joint Quarterly Meeting and will be reflected in the sector analysis. Social and economic impact analysis of education; The impact analysis will, have a strong equity focus and will be undertaken by Sector Analysis and Program planning Expert, supported by a team of experts from UNICEF Head Quarters that is supporting the Government on the undertaking of the sector analysis as part of the Global Partnership for Education Global and Regional Activities (GPE-GRA) scheme. The analysis will present the social disparities in the appropriation of education resources and provide a benefit incidence analysis, as well as analysis on the conversion of resources into quality/learning outcome results by schools.

Nepal Education Sector Analysis
2
Development of SSDP Approach Paper; The SSDP Approach Paper is aimed to lay out the strategic framework which guides the preparation of the SSDP Framework, building on the Sector Analysis, Thematic Background Studies and Option Papers that reflect the TWG discussions and Stakeholder Consultations. As such, the SSDP Approach paper will have identified the key issues and priorities as well as presenting a range of possibilities and scenarios to mitigate key challenges and capitalize on identified opportunities. The SSDP Approach Paper will be developed by the SSDP Team Leader and the Sector Analysis and Program planning Expert and reviewed by the SSDP Steering Committee and Technical Committee. Communication strategy of the Education Sector Analysis outcomes and implications; the main outcomes and implications of the comprehensive education sector analysis will need to be translated into briefs and presentations appropriate for stakeholders at policy, planning and implementation level within the education sector, as well as decision makers within the Government such as NPC and the Ministry of Finance. SSDP Theory of Change; the Sector Analysis and Program planning Expert will support the SSDP Core Writer Team in the development of an SSDP Theory of Change that is based on the sector analysis and reflected in the SSDP strategies and policy directions, as well as in the SSDP Logical Framework and Result Framework which are all included in the SSDP first draft.

Nepal Education Sector Analysis
3
2. THE THREE IMPERATIVES FOR EDUCATION REFORM
Nepal promulgated its new constitution on 20 September 2015. The constitution
enshrines education as a universal right of all citizens. It commits the State to:
“[make] education scientific, technical, professional, skill-oriented, and
employment and people oriented in order to prepare the human resources to be
competent, competitive, moral, and committed to national interest.” (Article 51 h1).
The constitution’s call for education to be an engine for national development and the
advancement of national interests highlights at least the following three education reform
imperatives: (1) post-disaster and post-conflict reconstruction, (2) exploiting the
demographic dividend, and (3) graduating from LDC status.
2.1 Post Disaster and Conflict Reconstruction
“It is easier to build stronger children than to repair broken men.” Frederick
Douglass1
Nepal straddles the fault line between the Indian and the Eurasian plates making it one of
the world’s most earthquake prone countries. On 25 April 2015, the country was hit by its
strongest quake in 80 years. The death toll surpassed 8,500. Over 35,000 classrooms were
mostly or totally damaged, leaving more than a million children lacking access to a safe,
permanent place to learn (NEC 2015).
In May and June 2015, Save the Children, Plan International, Unicef and World Vision
International interviewed more than 1,800 children about their experiences and needs
after the earthquakes (Plan et al. 2015).2 Education was the second highest priority after
securing a safe shelter. Children wanted to return to school; but they also wanted safe
schools that can withstand future disasters.
From a post-disaster perspective, education reform is a humanitarian imperative because
the failure to build back better schools is likely to exacerbate the already swollen numbers
of out-of-school children3. Better schools emphasize resilient humans in resilient
buildings. This means improved structural design that ensures accessibility for and the
safety of all children including those with disabilities. It also means resilient teachers,
students, and communities who will take steps to ensure that disasters cause as little
damage as possible, take responsibility for the risks associated with disasters, and are
ready to rely on themselves to mitigate damage when disasters hit.
1 Frederick Douglass is a prominent African-American social reformer who became the leader of the abolitionist movement
after escaping slavery. His words are cited in Ward (2000).
2. All quotes are from the Children’s Consultation of Plan et al. (2015)
3 According to Unicef Nepal OOSC study (Unicef Nepal 2015), about 10% to 15% of children of primary and lower secondary
age group currently do not attend school in the primary and lower secondary levels
Nepal Education Sector Analysis
4
Nepal experienced armed conflict from 1996 to 2006. More than 130,000 people were
killed and at least 3,000 disappeared and remain unaccounted for (Vaux 2011). The
warring ideologies that fuelled the conflict were rooted in grievances about poverty,
exclusion, feudalism, and the caste system (ICG 2011). Almost ten years after the end of
the conflict, the country is seeking political consensus around the form of inclusive and
just federalism that ends years of civil strife and political gridlock, and puts the nation
back on a stable track. Education reform should be part of the solution.
The preamble to Nepal’s new constitution preamble commits to embracing multi-caste,
multi-lingual, multi-cultural, and diverse geographical specificities by ending
discrimination relating to class, caste, religion, language, region, and gender, including all
forms of racial untouchability. Schools can often be the grounds where some children are
socialized to feel inferior, undeserving and powerless. They can also be the places where
children thrive as productive and peaceful citizens who are committed to excellence,
equality, rule of law and pluralism. Nepal’s commitment to building back better should
include the far more complex, vital, and urgent task of ensuring that students and out-of-
school children do not grow into broken men and women that are both victims and
perpetuators of conflict. Nepal’s education reform imperative is, therefore, to ensure that
curricula, teacher training, teaching practices, teachers’ supervision, educational
governance, and community engagement are catalysts for building a cohesive, resilient,
and prosperous nation.
2.2 The Ticking Clock of the Demographic Dividend: Use It Or Lose It!
South Asia’s demographic surplus will be key in meeting the labor needs both within
the region and beyond, but only if workers have the right education and training.
(Business Intelligence Unit, January 2014)
There was a sharp decline in the average growth rate of Nepal’s total population in the
2001-2011 period compared to the 1991–2001 period (CBS 2014). In the previous
decade, the average growth rate was 2.25 percent, compared to only 1.35 percent in
2001–2011. If the present population growth rate persists, it will take 51 years to double
the population of 2011. The decline in growth rate was attributed to both a decline in
fertility and the emigration of many young people. The CBS also noted that mortality has
also been declining. Compared to the 2001 mortality rate of 10.3 per thousand, the 2011
rate is estimated at 7.3. Additionally, life expectancy at birth has increased from 49.6 years
in 1981 to 66.6 years in 2011. Finally, the median age of the population and ageing index
show that the population is getting older, and the dependency of older individuals (50
years and over) is increasing.
Current trends show that Nepal, like other South Asian countries, is enjoying a
demographic surplus. Appendix C visualizes Nepal’s shifting demographic make-up and
future projections.

Nepal Education Sector Analysis
5
The remittances of the labor force were estimated to account for 21 percent of GDP in
2012. However, Nepalese working overseas are mainly engaged in low skill and low wage
occupations (ADB 2013). At home, university graduates are the most affected by
unemployment followed by secondary school, then primary school completers (World
Bank 2013).
The projection pyramid for 2025 shows that in 10 years Nepal’s window of opportunity
to cash in on its demographic dividend will be at its widest before it begins to shrink in
2030. According to Lee and Mason (2006), a demographic dividend window of
opportunity opens when fertility rates fall, leading to fewer mouths to feed. In this period,
the labor force grows more rapidly than the population dependent on it. The demographic
dividend, therefore, represents the rate increase of economic growth that results from an
increase in the working age ratio and greater female labor supply (Bailey 2006), which
tends to result in higher savings, more domestic resources.
The size of the demographic dividend opportunity hinges on the productivity of young
adults (Lee and Mason 2006). Like other South Asian countries, the window for the
demographic dividend in Nepal began in the mid-1980s. Herein lies the education reform
imperative. As of 2011, school attainment of Nepal’s youth (15-24-year-olds) does not
indicate that the country has the prepared labor force to optimize its demographic
dividend. Twelve percent have no education, 10 percent have not completed primary
education, and 41 percent have not completed secondary education. This represents 63
percent of youth who do not have the requisite skills to be engaged in gainful jobs of high
added value.
In the coming 10 years, the age of this population will be between 25 and 34 years.
Providing them with the necessary literacy, numeracy and life skills to obtain higher
paying jobs in their prime years should be a national priority. Commenting on the
projected demographic dividend, Khare and Slany (2011) noted that 40 percent of the
population is under the age of 15 years. Their entry into the labor market will result in the
most favorable dependency ratio the country has ever seen. If little is done to integrate
educational reform with change in employment and labor market policies, most of the
new entrants will continue to engage in subsistence agriculture and low paying service
and manufacturing jobs. This means that at least one-third of the workers will not earn
enough to pull themselves above Nepal’s poverty line, while half of those workers will fall
under the international poverty level of US$ 1.25 a day.
Major investment in quality education and training recognizes that highly productive
citizens are the key to enduring national prosperity. The number of young people
emigrating out of the country jumped from 762,181 in 2001 to 1,921,494 in 2011.
Considering the decreasing fertility rate, emigrants’ numbers will gradually dwindle, and
if little is done to improve their skills, their remittances will also dwindle. If the emigrant
host countries are aggressively investing their resources for a future with lower oil
windfalls, Nepal should invest more heavily in ensuring that its human resources are well-

Nepal Education Sector Analysis
6
trained and well compensated for a future where they will be in high demand and in
shorter supply. Given the ticking clock of the demographic dividend window of
opportunity, investing heavily in improving the quality of education and training for all
should be a national security priority.
2.3 Nepal’s Vision for Graduating from LDC Status
“A vision without a plan is a dream. A plan without a vision is just drudgery. But a
vision with a plan can change the world”
Nepal’s vision for graduating from the LDC category should be another driver for
expediting education reform. The Nepal National Planning Commission (NPC) has set the
following seven national development goals:
• rebuilding a resilient nation
• entrepreneurial famers and productive farms
• gender equality with conscious empowered women
• building infrastructure and creating jobs
• policy reforms for growth take off
• connecting communities with markets
• nurturing nature to harness its riches.
Achieving these goals depends on entrepreneurial, productive, and resourceful
individuals who believe in the national vision and have the requisite skills to achieve it.
The NPC identifies improving competency in education, science, and technology as one of
at least nine target areas for graduating the country from LDC category to the status of
developing or middle income country by 2022 (Sainju 2013).
For this vision to be achieved, the per capita gross national income (GNI) must be 20
percent above the threshold for inclusion in the LDC category, the Human Assets Index
(HAI)4 must be 10 percent above the LDC inclusion level and the economic vulnerability
index must be 10 percent below the LDC inclusion level.
Nepal’s Thirteenth Plan adopted graduation from the LDC category by 2022 as its sole
vision and prepared sectoral strategies accordingly. In this regard, the education reform
imperative is twofold:
• The literacy and secondary school Human Assets Index indicators must be at least
10 percent above the LDC inclusion threshold.
4 The HAI comprises percentage of population undernourished, mortality rate for children five years or under, gross
secondary school enrolment ratio, and adult literacy rate.

Nepal Education Sector Analysis
7
• The education sector should show improved student competencies in education,
science, and technology to provide the supply for skilled human capital that is
prepared and ready to help reach NPC’s seven national development goals.
2.4 In Summary
In this chapter, we have established that education sector reform is urgent because it
responds to the immediate need of rebuilding after the earthquakes that hit the country.
We have also established that education reform should be a national priority because the
country is in a state of political transition and the education sector is called to fulfil its
responsibility to empower resilient citizens with a sense of belonging to a socially
cohesive nation. We have demonstrated that reform of the education sector is an
imperative because business as usual in delivering education and training is not helping
graduates who can only demonstrate the minimum literacy, numeracy, and life skills, and
therefore cannot get gainful employment. In the coming 20 years, Nepal’s demographic
dividend will present itself as a growth opportunity. Ensuring that programs are in place
to stimulate children’s intelligence, leadership, and entrepreneurial spirit from cradle to
career will supply the country with the quality workforce it needs to meet and exceed its
development goals. Last, but not least, education reform is an imperative because it is at
the heart of the intervention areas and strategies identified to stimulate sustainable
growth and graduate the country from LDC status by 2022.
In his ‘Building the Bridge As You Walk On It: A Guide for Leading Change’ Robert Quinn5
(2004) talks about leading change as a process that is often difficult because it means
giving up the control and predictability of what’s known and venturing into the risks of
the unknown. To graduate to a developing or middle income country status, Nepal leaders
must make deep changes that meet the benchmarks for graduation in 2022. In this regard,
the analogy of “building the bridge as you walk on it” is an apt description of the transition
situation that the country is facing politically, socially, and economically. Nepal wants to
move forward. Its leaders will make some wise moves, but at times there will be setbacks
and cross-purpose interests. Education leaders’ mission may be the most complex
because it entails transforming current and future young men and women into a
productive workforce while not knowing or controlling all the levers necessary for that
transformation to occur.
As the sector’s leaders and their partners build the knowledge base for the bridge towards
2022, they must have clear lines of command and accountability, they need time to reflect
on their actions, they need to demonstrate full engagement in the change process that is
rooted in fully understanding why it is important, and they must stay positive and focus
on solutions and opportunities. They must also have a shared vision that all levels of the
education sector know, understand, and support, they must be willing to try different
5 Robert E. Quinn is chair of the Department of Organizational Behavior and Human Resource Management at the
University of Michigan School of Business.

Nepal Education Sector Analysis
8
solutions when existing ones fail, they must be able to balance free initiative with
accountability to shared goals and standards of quality performance, and they must model
high expectations from themselves, their colleagues, and their followers to ensure that the
education sector is fulfilling its role of equipping Nepali citizenry with the required skills
to thrive in the 21st century. This sector analysis, therefore, takes the pulse of the
education system to ensure that the proposed plan of action is based on a full
understanding of what can and must be changed. This way when the train of reform is on
track, it moves in the right direction.

Nepal Education Sector Analysis
9
3. NEPAL SITUATIONAL ANALYSIS: DEMOGRAPHIC, ECONOMIC AND SOCIAL
CONTEXT
3.1 Introduction
Nepal is a landlocked country located between India and China. It has three topographic
regions: the southern Terai plains, the middle hills and the Himalayan mountains in the
north. Kathmandu is the capital city.
For most of its history the country had been ruled by monarchs or a ruling family. Reforms
in 1990 established a multiparty democracy within a constitutional monarchy. A Maoist
insurgency broke out in 1996 and the decade-long conflict between the insurgents and
the culminated in a peace accord (2005) and the promulgation of an interim constitution
in 2007. The regime led to the abolition of the monarchy. The Interim Constitution, 2007
declared Nepal as a Federal Democratic Republic. The constitution for a federal Nepal was
effective on 28 May 2008.
The country has great diversity. Its climatic zones range from tropical and subtropical
zones through the temperate zone to sub-arctic and arctic climatic zones. Nepal has a
great variety of birds, animals, and plants. The country is inhabited by people of diverse
social, cultural, and ethnic backgrounds. The 2011 census recorded 126 ethnic groups and
123 languages, of which more than a dozen are in active use by more than one hundred
thousand people (CBS 2011a).
Religion has an integral position in Nepalese life and society. In the early 1990s, Nepal
was the only constitutionally declared Hindu state in the world despite a great deal of
intermingling of Hindu and Buddhist beliefs. The 2001 census recorded 80.6% and 10.7%
Buddhists with the remainder being Muslims, Kirats, Christians and Jains. The Interim
Constitution declared Nepal a secular state.
3.2 Socioeconomic Indicators - Population Density Across Regions and Districts
The 2011 census recorded a population of 26.5 million people. The districts along the
southern border and Kaski, Lalitpur, Kavre Palanchok, and Kathmandu have the highest
population densities (see Figure 2.1). Appendix A gives the population densities by region
and district.
3.2.1 Education – school population
Age Education in Nepal has significant improved in the past few decades. The pre-primary school level consists of early childhood development (ECD) classes for 3-year-olds and pre-primary classes (PPCs) for 4-year-olds. ECDs and PPC classes are provided at school-based ECD centers, community-based ECD centers and privately managed pre-primary classes. About 22% of 4-year-olds are out-of-school (Table 2.1) with no significant difference between girls and boys.
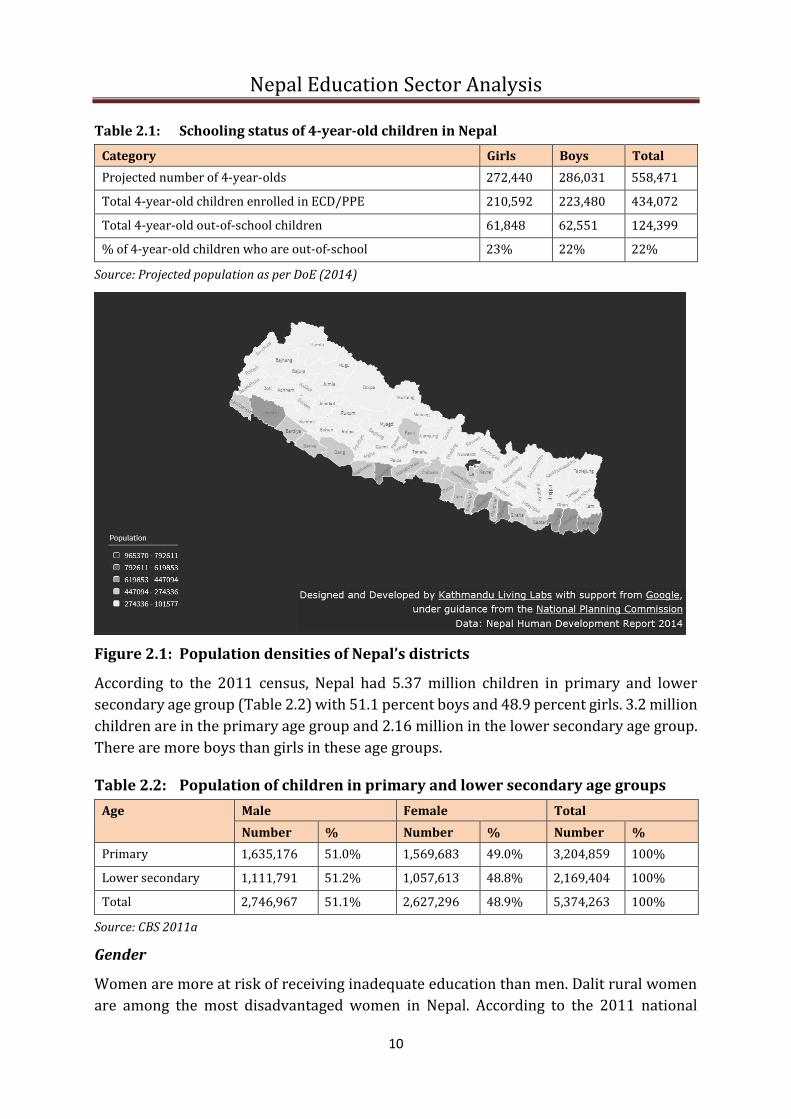
Nepal Education Sector Analysis
10
Table 2.1: Schooling status of 4-year-old children in Nepal
Category Girls Boys Total
Projected number of 4-year-olds 272,440 286,031 558,471
Total 4-year-old children enrolled in ECD/PPE 210,592 223,480 434,072
Total 4-year-old out-of-school children 61,848 62,551 124,399
% of 4-year-old children who are out-of-school 23% 22% 22%
Source: Projected population as per DoE (2014)
Figure 2.1: Population densities of Nepal’s districts
According to the 2011 census, Nepal had 5.37 million children in primary and lower
secondary age group (Table 2.2) with 51.1 percent boys and 48.9 percent girls. 3.2 million
children are in the primary age group and 2.16 million in the lower secondary age group.
There are more boys than girls in these age groups.
Table 2.2: Population of children in primary and lower secondary age groups
Age Male Female Total
Number % Number % Number %
Primary 1,635,176 51.0% 1,569,683 49.0% 3,204,859 100%
Lower secondary 1,111,791 51.2% 1,057,613 48.8% 2,169,404 100%
Total 2,746,967 51.1% 2,627,296 48.9% 5,374,263 100%
Source: CBS 2011a
Gender
Women are more at risk of receiving inadequate education than men. Dalit rural women
are among the most disadvantaged women in Nepal. According to the 2011 national

Nepal Education Sector Analysis
11
census, only 12% of Dalit women are literate (CBS 2011a). Dalit girls are especially
disadvantaged and suffer from the malnutrition, infant mortality and lack of education.
Figure 2.2 shows the proportion of children attending school to those who do not.
Figure 2.2: Percentage of children not attending schools by gender and age group (2011)
Source: Unicef Nepal 2015
The 2011 Census states that girls and women constitute 51.5% of the total population.
However, the proportion of the female population in primary and lower secondary age
groups is only 48.8%. Children not attending schools in primary and lower secondary age
groups are 47.6% boys and 52.4% girls. There are more out-of-school girls than boys
regardless of students’ age (Figure 2.2). And gender disparity is not just about equality in
access or attendance, it is also about girls’ and boys’ experiences while in a school.
Geographical location
In Nepal, mountain areas have the highest proportion (24.3%) of 4-year-old out-of-school
children (Table 2.3). The Terai belt has the highest number of out of school 4-year-olds.
The lowest proportion and number of out-of-school 4-year-olds is in the Kathmandu
Valley. About 22.3% of all 4-year-olds are out-of-school.
Table 2.3: Enrolment status of 4-year-olds by geographic region
Eco belts 4-year age group population
4-year-old children enrolled in ECD/PPCs
Number and % of 4-year-old children out-of-school
Girls Boys Total Girls Boys Total Girls Boys Total %
Mountain 21,220 21,549 42,769 16,064 16,324 32,388 5,156 5,225 10,381 24.3%
Hill 89,779 92,877 182,656 70,468 73,137 143,605
19,311 19,740 39,051 21.4%
0%
10%
20%
30%
40%
50%
60%
70%
80%
90%
100%
Bo
ys
Gir
ls
Tota
l
Bo
ys
Gir
ls
Tota
l
Bo
ys
Gir
ls
Tota
l
Bo
ys
Gir
ls
Tota
l
Bo
ys
Gir
ls
Tota
l
Bo
ys
Gir
ls
Tota
l
Bo
ys
Gir
ls
Tota
l
Bo
ys
Gir
ls
Tota
l
5 Year 6 Year 7 Year 8 Year 9 Year 10 Year 11 Year 12 Year
Out-of-School Attending School

Nepal Education Sector Analysis
12
Kathmand
u Valley
17,734 20,410 38,144 15,121 17,847 32,968 2,613 2,563 5,176 13.6%
Terai 143,707 151,195 294,902 108,939
116,172
225,111
34,768 35,023 69,791 23.7%
Total 272,440 286,031 558,471 210,592
223,480
434,072
61,848 62,551 124,399 22.3%
Note: Projected population as per DoE (2014)
The Terai has the highest proportion of 5-12-year-olds not attending school (Table 2.4).
These children account for 68.5% of all such children not attending school.
Table 2.4: Distribution of children not attending schools across eco belts
Eco Belt 5-9-year-olds 10-12-year-olds Total (primary and lower secondary)
Hill 25.8% 15.1% 23.1%
Mountain 7.2% 3.9% 6.4%
Terai 65.1% 78.6% 68.5%
Kathmandu Valley 1.9% 2.4% 2.0%
Total 100.0% 100.0% 100%
Source: CBS 2011a
Disability
The 2011 census recorded children with special needs (CwSN) only account for 0.7% and
0.8% of the students in age group 3-4 (Tables 2.5 and 2.6) (CBS 2011a). However, there
is reason to believe these statistics greatly underestimate the true population of children
with disabilities in Nepal. Also, note that only 15% of the 2011 census data collected
through the Nepal Living Standard Survey (NLSS) on pre-primary age groups was
analyzed for disability occurrence.
It is estimated that 15% of the world’s population live with disability (WHO and World
Bank 2011). Nepal’s latest census reported only 1.94% of people having disabilities (CBS
2011a). However, Handicap International 2015) characterized the government’s
classification of disability as very restrictive compared to internationally accepted
definitions. The Handicap International report used the World Health Organization’s
estimate of 5.8% of disability prevalence among children from 0 to 14 of age (WHO 2011).
This would translate to a figure of between 250,000 and 735,000 children with disabilities
in Nepal. It notes that many mild disabilities are hardly identified in Nepal including
dyslexia, dyspraxia6, and attention deficit hyperactivity disorder. The report further notes
that there are 650,000 children in primary school who need glasses, and at least 65,000
of those children cannot access them.
6 A brain-based condition that makes it hard to plan and coordinate physical movement.

Nepal Education Sector Analysis
13
According to the classification used in the 2011 census (CBS 2011a), the most common
disability is physical disability (37.0% and 39.4% of 3 and 4-year-olds respectively).
Children who are blind or have low vision accounted for the second highest group (22.0%
and 20.6% of 3 and 4-year-olds respectively) among children with disabilities.
Table 2.6 shows disability among students by age groups with disability incidence
increasing with age.
Table 2.5: Proportion of children with special needs (CwSN) in pre-primary age groups
Category 3-year-olds 4-year-olds
Not CwSN 97.5% 97.5%
Not stated 1.8% 1.7%
CwSN 0.7% 0.8%
Total 100% 100%
Type of disability:
Physically disabled 37.0% 39.4%
Blind/low vision 22.0% 20.6%
Deaf/hard of hearing 7.5% 6.8%
Deaf-blind 1.3% 1.3%
Speech problem 15.1% 14.5%
Mentally disabled 1.4% 2.9%
Intellectually disabled 3.0% 3.5%
Multiple disability 12.7% 10.9%
Total 100% 100%
Source: Census 2011. Note that only 15% of 2011 raw census data was analyzed)
Table 2.6: Proportion of CwSN in primary and lower secondary age groups
Age group (in years)
5 6 7 8 9 10 11 12 Total
Not CwSN 97.5% 97.5% 97.5% 97.4% 97.4% 97.3% 97.3% 97.3% 97.4%
Not Stated 1.7% 1.6% 1.5% 1.6% 1.4% 1.5% 1.5% 1.4% 1.5%
CwSN 0.8% 0.9% 1.0% 1.1% 1.2% 1.2% 1.2% 1.3% 1.1%
Total 100% 100% 100% 100% 100% 100.0% 100.0% 100.0% 100.0%
Source: Census, 2011 (analysis of 15% of data)
Out of school children
The 2011 census reported 0.77 million children not attending school of whom 0.57
million should have been in primary school and 0.19 million in lower secondary school
(Table 2.7). Slightly more primary school age girls were not attending school while the
difference was larger for lower secondary age children.

Nepal Education Sector Analysis
14
Table 2.7: Children not attending schools (2011)
Dimension Boys % Girls % Total
Dimension 2: Primary School Age 280,366 48.8% 294,081 51.2% 574,447
Dimension 3: Lower Secondary Age 85,906 43.9% 109,935 56.1% 195,841
Total 366,272 47.6% 404,016 52.4% 770,288
Source: Census 2011 data from Nepal’s Study within the Global Initiative on out of School Children7
Caste
The caste system still plays a significant role in Nepalese education and life. Gender
differences are very pronounced among children across social groups. Although the total
population of boys is higher than girls across almost all caste groups, there are more out
of school girls than boys across almost all caste groups (Table 2.8).
Table 2.8: Caste, gender and population-wise proportion of children not attending school (5-12 years)8
Caste % boys to total population
% OOSC boys to total OOSC population
% girls to total population
% OOSC girls to total OOSC population
Dom 52.5% 47.7% 47.5% 52.3%
Musahar 51.2% 47.9% 48.8% 52.1%
Dolpo 49.6% 44.6% 50.4% 55.4%
Natuwa 51.5% 48.7% 48.5% 51.3%
Dhunia 51.0% 46.4% 49.0% 53.6%
Halkhor 53.5% 50.7% 46.5% 49.3%
Bin 50.8% 45.5% 49.2% 54.5%
Nuniya 52.3% 45.8% 47.7% 54.2%
Raute 49.0% 41.1% 51.0% 58.9%
Dhankar/Kharikar 52.1% 50.4% 47.9% 49.6%
Mallaha 51.1% 45.0% 48.9% 55.0%
Musalman 51.5% 47.4% 48.5% 52.6%
Kori 52.3% 47.3% 47.7% 52.7%
Dusadh/Pasawan/Pasi 51.0% 46.5% 49.0% 53.5%
Khatwe 50.4% 42.7% 49.6% 57.3%
Chamar/Harijan/Ram 51.3% 46.5% 48.7% 53.5%
Tatma/Tatwa 50.9% 44.9% 49.1% 55.1%
Pattharkatta/Kushwadiy
a
53.7% 54.4% 46.3% 45.6%
7 Unicef Nepal Country Office Final Report 2015
8 The final report of Nepal’s Study within the Global Initiative on Out-of-School Children (Unicef Nepal 2015) did not include
statistics on ethnicity.
Nepal Education Sector Analysis
15
Source: Census 2011 OOSC = out-of-school children
Achievement of Millennium Development Goals
Nepal has made significant progress in achieving the Millennium Development Goals
(MDGs) (NPC 2013). Here is how the country performed in each of the eight goals.
1. Eradicate extreme poverty and hunger
The United Nations seeks to reduce by half the population living on less than one dollar a
day. Nepal has made significant progress in meeting MDG 1. The rate dropped from 33.5%
in 1990 to 19.7% in 2010, and then fell again to 16.4% in 2013. With a rate of change of
about one percent per year, the 17% target was achieved ahead of schedule.
The annual rate of decline in Nepal’s poverty level went from 1.5 percent in 1996–2004
to 2.5 percent in 2004–2011 (World Bank 2013). The declining trend continued even
during the ten-year armed conflict (1996–2006). However, disparities persist with more
poverty in rural areas, where over 80 percent of the population lives, being much higher
than in urban areas.
On reducing hunger, Nepal has met the 2015 target of reducing the prevalence of
underweight children aged 6–59 months to 29 percent as only 28.8 percent of this age
group are underweight. For the target of reducing the population living on below
minimum dietary consumption, Nepal has reduced the proportion to 15.7 percent, well
below the MDG target of 25%.
2. Universal primary education
Nepal has made excellent progress in primary education. The net enrolment rate (NER)
at the primary level has increased from just 64 percent of all age appropriate children in
1990 to 95.3 percent in 2013. This progress has been supported by the increased
enrolment in the bottom consumption quintile — from 51% in 2004 to 76.2% in 2011, an
increase of almost 50% in just seven years.
The schooling survival rate has also increased. An important contributing factor has been
government investment in early childhood development (ECD) and pre-primary
education (PPE). The number of students enrolled in Grade 1 with ECD/PPE experience
increased from 36.2 percent in 2008 (DoE 2008) to 55.6 percent in 2013 (MoE 2012-13).
The transition rate of students from primary to lower secondary increased from 3.9
percent in 2007 to 87.3 percent in 2011.
3. Gender equality and empowerment of women
The 2015 target ratio of girls to boys in primary education has been achieved. The ratio
for gross enrolment is 1.04 and for net enrolment is 1.01. Of total enrolment, girls
represent 50.5% at primary and 50.9% at lower secondary level. However, disparities
persist at higher levels and by caste/ethnicity and geographical location. The gross

Nepal Education Sector Analysis
16
enrolment ratio for Dalits (1.03) is slightly lower than the national average. The ratio of
girls to boys at higher secondary is 0.91 while at tertiary level it is 0.71.
In the workforce, the share of women’s wage employment in the non-agricultural sector
has more than doubled, from 19.9 percent in 2009 to 44.8 percent in 2011. Women’s
employment in the service sector (particularly education) increased significantly
between 2005 and 2013. The proportion of female teachers at the primary and secondary
levels is gradually increasing. Although women are still mostly employed in traditional
sectors, their participation in non-traditional sectors such as the armed forces and
overseas employment has increased rapidly in recent years. In 2006/07, women’s share
of the total official labor force working abroad was only 0.19 percent. By July 2012, this
figure had increased to 5.96 percent.
One important indicator of women’s empowerment is their participation in the political
domain. The Interim Constitution, 2007 requires political parties to ensure that women
constitute at least one-third of the total number of representatives in parliament. The
Constituent Assembly (2008–2012) comprised 32.8 percent women. The share of women
in government and semi-government employment has also increased with women now
making up about 15 percent of this workforce.
However, many barriers remain to gender equality and women’s empowerment. In
education, there are large regional disparities in female teachers at the secondary (Grades
9 and 10) and tertiary levels. 74.8 percent of the unpaid family labor force is female. The
numbers of unreported cases of women’s labor migration and of cases of migration to
restricted countries have increased. In consequence, the exploitation and abuse of Nepali
women in host countries as well as in Nepal by employment agencies and brokers has
reportedly grown. There is also a recognized link between foreign employment and the
trafficking of women.
4. Reduce child mortality
Childhood mortality has declined as between 1990 and 2011, the infant mortality rate
(under 1-year-olds) declined from 108 to 46 and the under-five child mortality rate
(U5MR) from 162 to 54 per 1,000 live births. This represented a 57.4 percent and 66.6
percent decline respectively. However, one in twenty-two Nepali children still die before
the age of one year and one in nineteen before they turn five. There has been a lesser
decline in the neonatal mortality rate (28 days and under). While the neonatal mortality
rate dropped from 43 to 33 per 1,000 between 2001 and 2006, it declined no further
between 2006 and 2011. The decline of the infant mortality rate also slowed in the later
period as its progress was stymied by the stagnant neonatal mortality rate.
Nepal carried out nationwide measles vaccination campaigns in 2005 and 2008, that
resulted in a dramatic decrease in the number of measles-like outbreaks (from 127 to 39)
and laboratory-confirmed measles cases (from 2,857 to 6). The proportion of one-year-
old children immunized against measles through routine immunization more than
Nepal Education Sector Analysis
17
doubled in the last two decades from 42 percent in 1990 to 88 percent in 2011, and was
therefore on track to meet the 2015 target of more than 90%.
5. Improve maternal health
The 2015 MDG maternal health target is to reduce the maternal mortality ratio by three-
quarters. After a drastic decline in the MMR from 850 maternal deaths per 100,000 live
births in 1990 to just 281 in 2006 (MoHP 2006), Nepal was well on track to meet the
target. In fact, according to the maternal mortality and morbidity study found the MMR in
eight districts to be 229 per 100,000 live births, just slightly above the 2015 target of 213
(Suvedi et al 2009). This progress prompted the government to lower its MMR target to
134.
The proportion of women who deliver with the help of a skilled birth attendant (SBA)
increased from 7% in 1990 to 36% in 2011. In mid-2013, it reached 50%, making it likely
Nepal that the target of 60% would be achieved by 2015. Although Nepal has likely
achieved both its MMR and attended-birth goals, there are disparities between rural and
urban settings, across ecological and development regions, and among social and age
groups.
6. Combat HIV/AIDS, malaria, and other diseases
In 2011, there were approximately 55,626 adults and children living with the human
immunodeficiency virus (HIV) in Nepal. The overall HIV prevalence among adults aged
15-49 years was 0.3%, a decrease from the 2007 estimate. The MDG for HIV prevalence
among adults aged 15-49 years was achieved in 2011. For the first time, the National
Centre for AIDS and STD Control (NCASC) rigorously calculated the current national HIV
prevalence among men and women aged 15-24 years and then retrospectively calculated
the rate in 2006 to serve as a baseline. The drop from 0.15 to 0.12 percent signaled
achievement of the goal. To achieve the new target set by NCASC for 2016 (a 0.06
prevalence rate among 15-24-year-olds) the rate of decline will need to be accelerated.
Malaria is almost exclusively confined within 13 high-risk and 18 moderate risk districts.
Ten districts have no risk at all. In 201a/12, the overall national clinical malaria incidence
and annual parasite incidence (API) rates per 1,000 people were 3.28 and 0.08
respectively.
About 45 percent of the total population is infected with tuberculosis with 60 percent of
these cases being adults. Every year, 40,000 people develop active TB. Half of these cases
are infectious. The prevalence and death rates associated with TB per 100,000 people
declined markedly between 1990 and 2011, from 460 to 238 and 43 to 21 respectively.
The proportion of TB cases detected increased slightly, from 70 in 2001 to 73 in 2011.
The proportion of TB cases cured under short course direct observation treatments
(DOTS) was 90 percent in 2011. Even if the number of multi-drug resistant cases is
constant, Nepal is on track to achieve the MDG of 91 percent.
Nepal Education Sector Analysis
18
7. Ensure environmental sustainability
Nepal has made significant progress in reducing the rate of loss of biodiversity. Forests
covered 39.6 percent of Nepal’s total land area when it was surveyed in 1994, 29% of
which was forest land and 10.6% shrub land. Under Nepal’s community forestry program,
about 1.6 million hectares of the total 5.8 million ha of forest has been handed over to
17,808 forest users’ groups, benefiting over 2.19 million people, or over 40% of Nepal’s
total households.
Regarding water consumption, the national average for the proportion of households
using safe drinking water sources was 85% in 2012/13, surpassing the 2015 MDG target
of 73%. However, access to piped water, considered the safest source, has not increased
in the last seven years. Overall, nearly 44.5% of households have access to piped water,
and almost half of these households have private connections. The remaining 55.5%
depend on covered wells (38.5%), open wells (7%), and other unreliable sources like
river and spring water (10%). But almost all households (99%) are located within 30
minutes of a water source and access is uniform during both the rainy and dry seasons.
Disparities across geographical regions and consumption quintiles are minimal.
Sanitation is a key issue in Nepal. Between 2000 and 2011, the national sanitation
coverage more than doubled, from 30% to 62%, and surpassed the 2015 MDG target of
53 percent. However, sanitation is not adequate in schools. Only 80% of community
schools have toilets, and of them, only 65% have separate facilities for girls. The
inadequate levels of sanitation and hygiene and supply of water in many schools cause
children, especially adolescent girls, to leave school during the day and miss crucial
classes. The uneven progress in sanitation has also had negative effects on the incidence
of diarrheal diseases, child mortality, and the proportion of girls in secondary and tertiary
education.
8. Global partnership for development
In Nepal, total foreign aid use increased from NPR 36 billion in 2008-2009 to NPR 58
billion in 2010-2011, and from 3.66% to 4.24% of GDP in the same period. The share of
foreign aid in the total government expenditure rose from 16.5% to 19.6%, and its share
in development expenditure (classified as capital expenditure in the economic surveys
released by the Ministry of Finance [MoF]) increased from 49.73% to 53.80%.
The volatility of the changes in aid on budget over the three years renders any inter-
temporal analysis difficult. However, since the last survey, both the share of aid in the total
budget and the share of loans in aid have increased. These increases are both problematic
in the long run since they increase the burden of interest and dependency on aid. The
increases in the proportion of aid in project support and the sector-wise approach are
positive developments because they mean that accountability for aid and the involvement
of the state in deciding the fate of aid have both risen. This is likely to increase the

Nepal Education Sector Analysis
19
government’s independence in formulating development policy and boost coordination
with donors.
Over the last decade, the share of loans in capital expenditure has declined steadily from
61% to 51%. In the last year, however, there was a slight, anomalous increase in the share
of loans in capital expenditure, from 45.5% in 2009-2010 to 50.7% in 2010-2011.
Notwithstanding a marginal increase in the past few years, the spectacular fall in the debt-
to-GDP ratio, from 60% in 2002-2003 to 30% in 2011/12, is an extremely welcome
development. This decline is largely attributable to the steady decline in outstanding
foreign debt-to GDP ratio, which fell from over 45% to less than 20% in the same period.
This is a positive development for two key reasons: (1) the cost of servicing the loan has
declined in absolute terms (the debt service as a percentage of recurrent expenditure has
more than halved over the last decade), and (2) the confidence of the creditors has risen,
leading to lower interest rates and greater bargaining power of the government.
Other social development indicators
Adult literacy rate
The adult literacy rate refers to the percentage of the population aged 15 years and above
who can, with understanding, read and write a short, simple statement on their everyday
life. The overall index of adult literacy for Nepal is 0.5957. The index is highest among
Terai Brahmans/Chhetris (0.80050), followed by Hill Brahmans (0.7846) and Newars
(0.7649). It is lowest among Terai Dalits (0.2312). There are five groups whose index
scores are below the national average: Muslims, other Terai castes, hill Dalits, Terai
Janajatis, and Terai Dalits (Cemjong 2014).
Urbanization rate
The urbanization rate is the projected average rate of change of the size of the urban
population over time. The percentage of people living in an urban setting is an important
context indicator because demand for education is higher in urban areas than rural ones.
It is also considerably easier to deliver education services to people living in urban areas.
Nepal however, has one of the lowest urbanization rates in the World with only 17 percent
(3.86 million) of the population living in urban areas. Nonetheless, Nepal is urbanizing
rapidly. With a population of 2.5 million people, the Kathmandu Valley is growing at 4
percent annually, making it one of the fastest growing metropolitan areas in South Asia.
This rapid expansion has also been experienced by Pokhara an annual population growth
rates of as high as 5 percent (World Bank 2013).
Fast urbanization can have adverse repercussions in terms of the quality of life. The
annual growth rate in sanitation coverage was 1% in urban areas and 2.7 percent in rural
areas. Rapid population growth and municipal governments’ inattention to the sanitation
needs of informal settlements such as slums and squatter areas partly accounts for slow

Nepal Education Sector Analysis
20
growth in sanitation coverage in urban areas. There is little national-level data on slums
and squatter settlements, so the MDG Progress Report 2010 worked with data from
Kathmandu Valley as an illustrative example. Over the last decade, the number of
squatters has increased from 11,850 in 2000 to 50,000 in 2009. The massive increase in
the valley’s population from 500,000 in 1970 to more than 3 million in 2010 is
characterized by the large-scale migration of the landless to the three major historic cities
in the basin−Kathmandu and Lalitpur.
Migration (external & internal mobility)
Between 2011 and 2015, net migration in Nepal was 372,369 (World Bank 2015). In other
words, after subtracting the number of individuals who leave Nepal (emigrants) from the
number of individuals who come into Nepal (immigrants), emigrants outweigh those
immigrants overall by around 4 million.
Net migration is an important contextual factor to look at because roughly 22 percent of
Nepal’s GDP is comprised of emigrant remittances. Data from 2014 shows that roughly
5.5 billion dollars was sent to Nepal in form of remittances. This source of national income
has been identified as a potential key means to reduce poverty and fund capital
investment, as well as enable citizens to achieve a higher standard of living.
Nepal Multi-Dimensional Social Inclusion Index (NSII)
The Nepal Multi-Dimensional Social Inclusion Index is a composite index of six
dimensions of social inclusion. The NSII is an average of the following six indices; Social
Dimension Index, Economic Dimension Index, Political Dimension Index, Cultural
Dimension Index, Gender Dimension Index and Social Cohesion Index. The NSII shows the
level of social inclusion of caste and ethnic groups in these six major dimensions of
inclusion. The major take away from the NSII is that hill Brahmans, Madhesi
Brahmans/Chhetris, Newars and Hill Chhetris show high levels while Madhesi and Hill
Dalits show low levels of social inclusion (CDSA 2014).
The distribution of values across the 97 caste and ethnic groups shows that there is a wide
variation in the levels of social inclusion experienced by the different groups with index
values ranging from 0.327 (Musahar) to 0.752 (Kayastha). The caste and ethnic groups
with the top ten index values are Kayasthas, hill Brahmans, Thakalis, Thakuris, Newars,
Rajputs, Brahmans-Terai, Chhetris, Sanyassi and Marwadis. All except one of the top ten
groups (Marwadis) are Hill Brahman/Chhetris, hill Janajatis and Madhesi
Brahman/Chhetris.
Hill Brahmans and Newars come out on top of the Social Dimension Index, while Terai
Dalits and Muslims are at the bottom. Terai Brahman/Chhetris and Newars are on top of
the Economic Dimensions Index while Terai and Hill Dalits are at the bottom. Madhesi and
Hill Brahmans/Chhetri are at the top of the Political Inclusion Index, while Terai and Hill
Nepal Education Sector Analysis
21
Dalits are at the bottom. Hill Chhetris and Hill Brahmans have the highest scores on the
Cultural Dimensions Index values with mountain/hill Janajatis and Newar at the bottom.
The Gender Inclusion Index values are generally lower than the values of other indices
except for the Political Inclusion Index. Newari women and mountain/hill Janajati women
enjoy the highest levels of gender inclusion. The lowest levels of gender inclusion are
experienced by Terai Dalit women and women from other Terai castes. The index also
shows high levels of social cohesion (or non-discrimination) enjoyed by hill Brahmans
and Newars but low levels for Terai and hill Dalits.
Disaster risk reduction
On 25 April 2015 Nepal was struck by a massive magnitude 7.6 earthquake. This
earthquake left a trail of destruction, with schools particularly badly affected. The Post
Disaster Needs Assessment (PDNA) recorded more than 27,000 schools that were
destroyed, and more than 26,000 classrooms being partially destroyed. This earthquake
and the many aftershocks have had a huge impact on the economy with the cost to the
education sector recovery estimated to be at almost $415 million dollars (NPC 2015).
Nepal as a disaster-prone country needs disaster risk reduction as a major building block
in its sustainable development strategy.
Disaster risk reduction (DRR) aims to reduce the damage caused by natural hazards like
floods, earthquakes, cyclones and droughts. Disaster risk reduction entails integrating
efforts in disaster management, disaster mitigation and disaster preparedness, and
sustainable development. Safety studies carried out in Nepal estimate that approximately
89 percent of school buildings are made of load-bearing masonry. However, such building
materials are particularly vulnerable to earthquakes in the absence of earthquake
resistant techniques. A 2011 assessment estimated that because of Nepal’s seismic risk,
more than 49,000 schools needed to be retrofitted and another 12,000 schools in need of
demolition and reconstruction (NSET 2012).
In response to these vulnerabilities, the government of Nepal worked with donors,
international financial institutions, and development and humanitarian agencies to form
the Nepal Risk Reduction Consortium (NRRC) in 2011. It is a collaborative approach to
disaster risk management. It is aimed to support the government to better coordinate
disaster management in Nepal both for reducing risk, as well as responding better to
emergencies such as earthquakes. The five priorities of the consortium are school and
hospital safely, emergency preparedness and response, flood risk management, and
finally policy and institutional strengthening (NRRC 2015). School and hospital safety is
about building resilient structures in schools and hospitals through retrofitting, training,
awareness-raising and other measures to improve the safety of building structures and
their ability to withstand major disasters.

Nepal Education Sector Analysis
22
3.3 In Summary
This chapter has shown that progress in MDGs and other social indicators has not ended
caste, ethnicity and gender-based disparities that weaken social, economic, political, and
cultural inclusion. It is also important to note that in addition, Nepal has been under a
severe fuel and commodities blockade since September 2015. The blockade is already
threatening to be a humanitarian disaster that significantly disrupts efforts to rebuild
after the earthquakes. Considering this, having an equally collaborative approach to
political disaster risk management is as urgent as natural disaster risk reduction. Nepal is
still healing from the ten-year armed conflict. Therefore, reaching a national consensus
that secures national unity and addresses local demands for voice, justice, and inclusion
will contribute to the needed threshold of political stability to achieve the post-2015
Sustainable Development Goals. Depending on the magnitude of the losses caused by the
blockade, SSDP prioritization discussions should consider the preparation of an
emergency plan with a disaster risk reduction component that encompasses nurturing
social cohesion, inclusiveness, civic engagement, and peace-building, in addition to
building back better structures that withstand natural disasters.
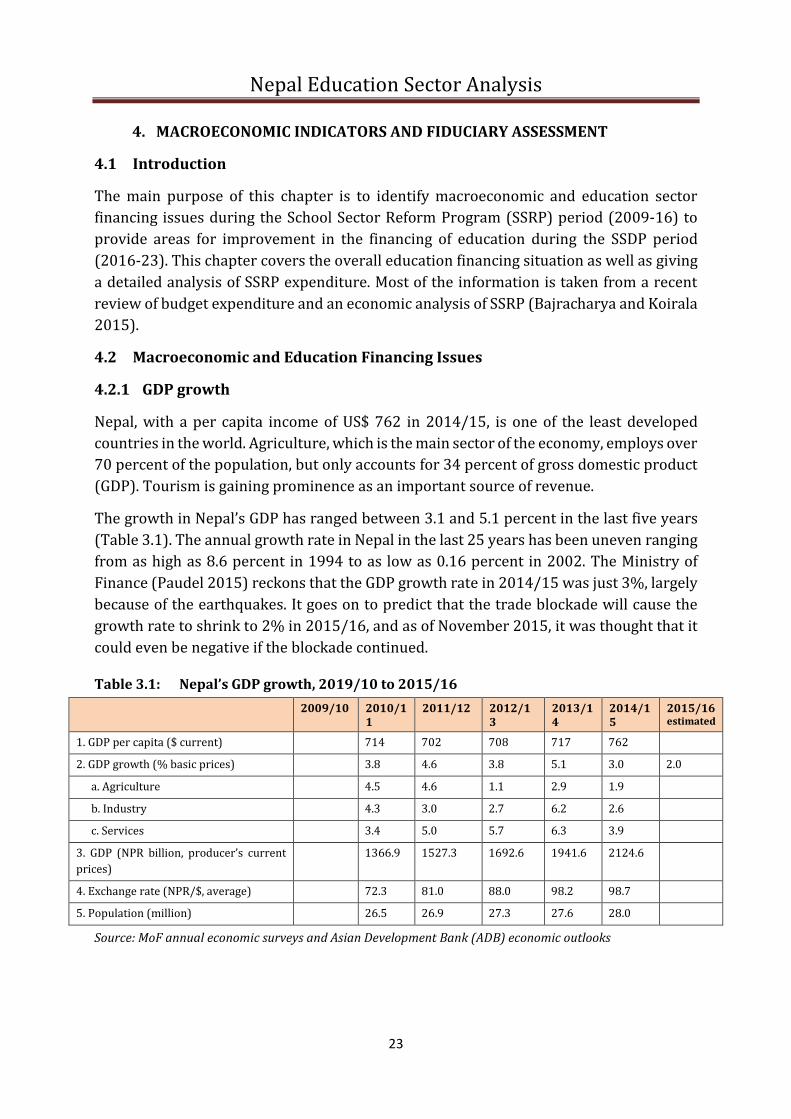
Nepal Education Sector Analysis
23
4. MACROECONOMIC INDICATORS AND FIDUCIARY ASSESSMENT
4.1 Introduction
The main purpose of this chapter is to identify macroeconomic and education sector
financing issues during the School Sector Reform Program (SSRP) period (2009-16) to
provide areas for improvement in the financing of education during the SSDP period
(2016-23). This chapter covers the overall education financing situation as well as giving
a detailed analysis of SSRP expenditure. Most of the information is taken from a recent
review of budget expenditure and an economic analysis of SSRP (Bajracharya and Koirala
2015).
4.2 Macroeconomic and Education Financing Issues
4.2.1 GDP growth
Nepal, with a per capita income of US$ 762 in 2014/15, is one of the least developed
countries in the world. Agriculture, which is the main sector of the economy, employs over
70 percent of the population, but only accounts for 34 percent of gross domestic product
(GDP). Tourism is gaining prominence as an important source of revenue.
The growth in Nepal’s GDP has ranged between 3.1 and 5.1 percent in the last five years
(Table 3.1). The annual growth rate in Nepal in the last 25 years has been uneven ranging
from as high as 8.6 percent in 1994 to as low as 0.16 percent in 2002. The Ministry of
Finance (Paudel 2015) reckons that the GDP growth rate in 2014/15 was just 3%, largely
because of the earthquakes. It goes on to predict that the trade blockade will cause the
growth rate to shrink to 2% in 2015/16, and as of November 2015, it was thought that it
could even be negative if the blockade continued.
Table 3.1: Nepal’s GDP growth, 2019/10 to 2015/16
2009/10 2010/11
2011/12 2012/13
2013/14
2014/15
2015/16 estimated
1. GDP per capita ($ current) 714 702 708 717 762
2. GDP growth (% basic prices) 3.8 4.6 3.8 5.1 3.0 2.0
a. Agriculture 4.5 4.6 1.1 2.9 1.9
b. Industry 4.3 3.0 2.7 6.2 2.6
c. Services 3.4 5.0 5.7 6.3 3.9
3. GDP (NPR billion, producer’s current
prices)
1366.9 1527.3 1692.6 1941.6 2124.6
4. Exchange rate (NPR/$, average) 72.3 81.0 88.0 98.2 98.7
5. Population (million) 26.5 26.9 27.3 27.6 28.0
Source: MoF annual economic surveys and Asian Development Bank (ADB) economic outlooks

Nepal Education Sector Analysis
24
4.2.2 Government expenditure
It is important to break down government expenditure into recurrent expenditure
(operations, wages and salaries, purchases of goods and services, and current grants and
subsidies) and capital expenditure (the creation of fixed assets and acquisition of land,
buildings and other assets). According to MoF (2015), recurrent expenditure has on
average been 70% of total expenditure in the previous five years and had increased
annually by an average of more than 10 percent. Since revenue is not keeping pace with
the increasing expenditure, the deficit is mounting. With the gloomy economic forecast
for 2015/16 and the following year, the deficit is expected to increase further (Table 3.2).
Table 3.2: Nepal government finances, 2008/09 to 2015/16
2008/09
2009/10
2010/11
2011/12
2012/13 2013/14 2014/15 2015/16 estimate
Revenue and grants (% of GDP) 18.3 18.0 18.9 19.7 20.5 24.2
Expenditure (% of GDP) 21.8 21.6 22.2 21.2 22.5 29.1
Overall fiscal surplus (deficit) (% of
GDP)
(3.5) (3.6) (3.4) (1.5) (2.0) (4.9)
Absolute amount (government
expenditure) NPR billion
227.1 257.5 294.9 302.1 435.1 522.6 819.5
Revenue NPR billion 178.0 198.4 244.4 296.0 368.7 393.5 475.0
Annual change in revenues % 33.3 27.2 11.4 23.2 21.1 20.5 9.4
Annual change in government
expenditures %
36.1 18.2 13.7 14.8 5.7 21.1 13.7
Annual change in recurrent expenditure
%
39.7 18.2 12.6 15.8 1.6 22.7 5.2
Annual change in capital expenditure % 36.6 23.5 16.8 8.6 6.2 22.1 31.4
Source: MoF economic surveys and ADB economic outlooks
4.2.3 Government education expenditure
Although the educational budget has increased year on year, its share of government
expenditure has decreased from 20.3% in 2009/10 to 12% in 2015/16 (estimated), which
is lower than the targeted 20%. Moreover, the average annual increase in government
education expenditure has been only 2.8% in real terms and 11.9% in current prices over
the last seven years (Table 3.3). Government education expenditure as a share of GDP has
hovered around 4% in the last seven years.
Table 3.3: Government education expenditure, Nepal, (2009/10 to 2015/16, %)
2009/10 2010/11 2011/12 2012/13 2013/14
2014/15
2015/16 estimated
Average annual growth %
1. Education expenditure at
current prices (NPR billion) 46.2 55.0 62.1 62.5 78.0 78.19 98.64 11.9
a. Share of GDP % 3.87 4.02 4.06 3.69 4.02 3.68 4.26

Nepal Education Sector Analysis
25
b. Share of government
expenditure 20.3 21.4 21.0 20.7 17.9 15.0 12.0
2. Consumer price index
(2008/09 base) 110 120 130 143 156 168 181 8.9
3. Education expenditure at
constant prices 42.16 45.77 47.70 43.72 50.01 46.63 54.47 2.8
4. Annual increase % based on
constant prices -6.3 8.6 4.2 -8.4 14.4 -6.8 16.8
1. Distribution by sub-sector
A decreasing share of education expenditure has gone on basic education and an
increasing share on secondary education in recent years (Table 3.4). However, this data
may be misleading because the salaries of teachers for Grades 6-8, which is for basic
education, is counted as secondary education expenditure. Furthermore, some increase
in secondary education expenditure are due to the recent introduction of government
grants for higher secondary level community schools to finance the salaries of two
teachers in all community schools. If these adjustments are considered, the share of
secondary education in education sector expenditure is estimated to be about 15%. MoE
does not, however, have a separate program budget head for secondary education as the
Joint Financing Arrangement (JFA) with development partners have not required the
presentation of data by levels of education. Lower secondary and secondary teachers’
salaries accounted for 18% of SSRP pooled fund in 2015/16.
While basic and secondary education programs saw a slight decline in the budgetary
allocation against SSRP estimates, other program components significant increased even
if their share in the total estimated costs and budget allocations are relatively small.
Though the budgetary allocation for basic and secondary education is lower than that
envisaged in the SSRP document, increases in other program components, except for
literacy and lifelong learning, will also support basic and secondary education. So, the
reallocation of funds to other components does not necessarily signify reduced efforts for
basic and secondary education.
Table 3.4: Proportion of sub-sector-wise education budgets (2009/10 to 2015/16, %)
Education sub-sector 2009/10 2010/11 2011/12 2012/13 2013/14 2014/15 2015/16
1. ECED - - - - 1.59 1.47
2. Basic education
(Grades 1-8) 63.99 68.86 64.53 60.3 54.41 54.09
3. Secondary education
(Grades 9-12) 16.94 16.69 17.87 18.95 21.08 20.99
4. TVET 3.41 3.62 3.34 3.61 4.68 4.00
5. Tertiary Education 13.79 9.02 9.32 9.09 7.69 8.19

Nepal Education Sector Analysis
26
Education sub-sector 2009/10 2010/11 2011/12 2012/13 2013/14 2014/15 2015/16
6. Education
management and
administration 1.82 1.77 2.54 2.48 2.80 2.29
7. Literacy and lifelong
learning - - - - 1.45 0.40
8. Teacher pensions and
retirement facilities - - - - 5.89 8.47
9. Other 0.05 0.04 2.4 5.56 0.41 0.10
Total 100 100 100 100 100 100
Source: Based on ASIP 2015/16
Note: The sub-sector allocation of government education expenditure based on MoF 2014 figures compiled by
the National Campaign for Education show slightly different estimates.
2. Sources of financing
Education expenditure is financed from internal government sources and funds from
development partners. While education expenditure at current prices has grown by
11.9% from 2009/10 to 2015/16, funding from development partners has remained
around the same level (Table 3.5). The government funded 66% of education expenditure
in 2014/15.
Table 3.5: Sources of financing government education expenditure
2009/10 2010/11 2011/12 2012/13 2013/14 2014/15 2015/16 estimate
Growth %
1. Education expenditure,
current prices (NPR billion) 46.2 55.0 62.1 62.5 78.0 78.19 98.64 11.9
2. Government 34.7 39.4 49.3 51.1 55.9 65.7 74.6
3. Development partners 11.5 8.6 12.8 11.4 13.1
• Grants 8.7 8.4 12.2 11.4 12.8
• Loans 2.8 0.2 0.6 0.0 0.3
3. Scope of SSRP
SSRP covered access, quality, and management issues at all levels of school education, and
literacy and lifelong learning activities. The target was to allocate 85% of the education
budget for the program. SSRP covers programs funded with pooled development partner
funds, discrete projects supported by non-pooled development partners and activities
funded by the government. The Joint Financing Arrangement (JFA) between the
government and the pooled development partners has 13 budget heads for reporting
progress against. These heads define eligible expenditure programs (EEP) for pooled
donor funding. The JFA did not restrict to implementing discrete projects and some such
projects funded by development partners were added after the signing of the SSRP JFA.
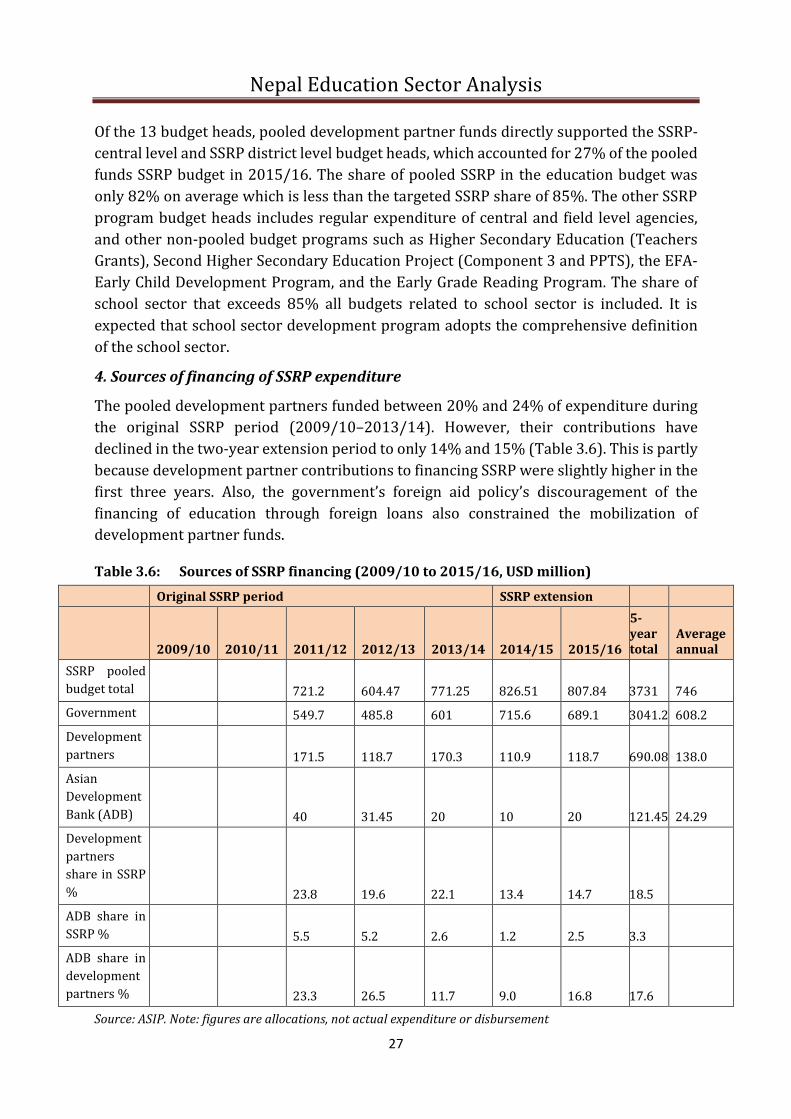
Nepal Education Sector Analysis
27
Of the 13 budget heads, pooled development partner funds directly supported the SSRP-
central level and SSRP district level budget heads, which accounted for 27% of the pooled
funds SSRP budget in 2015/16. The share of pooled SSRP in the education budget was
only 82% on average which is less than the targeted SSRP share of 85%. The other SSRP
program budget heads includes regular expenditure of central and field level agencies,
and other non-pooled budget programs such as Higher Secondary Education (Teachers
Grants), Second Higher Secondary Education Project (Component 3 and PPTS), the EFA-
Early Child Development Program, and the Early Grade Reading Program. The share of
school sector that exceeds 85% all budgets related to school sector is included. It is
expected that school sector development program adopts the comprehensive definition
of the school sector.
4. Sources of financing of SSRP expenditure
The pooled development partners funded between 20% and 24% of expenditure during
the original SSRP period (2009/10–2013/14). However, their contributions have
declined in the two-year extension period to only 14% and 15% (Table 3.6). This is partly
because development partner contributions to financing SSRP were slightly higher in the
first three years. Also, the government’s foreign aid policy’s discouragement of the
financing of education through foreign loans also constrained the mobilization of
development partner funds.
Table 3.6: Sources of SSRP financing (2009/10 to 2015/16, USD million)
Original SSRP period SSRP extension
2009/10 2010/11 2011/12 2012/13 2013/14 2014/15 2015/16
5-year total
Average annual
SSRP pooled
budget total 721.2 604.47 771.25 826.51 807.84 3731 746
Government 549.7 485.8 601 715.6 689.1 3041.2 608.2
Development
partners 171.5 118.7 170.3 110.9 118.7 690.08 138.0
Asian
Development
Bank (ADB) 40 31.45 20 10 20 121.45 24.29
Development
partners
share in SSRP
% 23.8 19.6 22.1 13.4 14.7 18.5 ADB share in
SSRP % 5.5 5.2 2.6 1.2 2.5 3.3 ADB share in
development
partners % 23.3 26.5 11.7 9.0 16.8 17.6
Source: ASIP. Note: figures are allocations, not actual expenditure or disbursement

Nepal Education Sector Analysis
28
** 2011/12 to 2015/16
5. Private sector financing
Many parents spend considerable amounts on the education of their children even when
they go to government schools. It is estimated that the total expenditure of all Nepali
households on education in fiscal year (FY) 2010/11 amounted to NPR 49.1 billion, or 3.6
percent of the GDP (World Bank 2014). The Nepal Living Standard Survey (NLSS) (CBS
2011b) found that households spent 5 percent of their total consumption on education
(food expenditure accounts for 62%). Households spent 3.5% of their remittance
amounts on education. Note that out-of-pocket education expenditure in real terms
decreased in community schools between 2003 and 2010 (Table 3.7). This decline can be
partly attributed to the provision of free textbooks and the abolition of school fees.
If both public and private expenditure on education are considered, Nepal’s expenditure
on education was about 7.6% GDP in 2010/11. However, this figure does not include
community contributions. Preliminary findings of education national accounts prepared
by MoE National Commission for UNESCO also show similar estimate.
Table 3.7: Average annual out-of-pocket spending on community schooling and college education
Year Primary Lower secondary
Secondary Higher Tertiary National
Nominal out-of-pocket expenditure (NPR)
2003 1,319 2,568 5,047 8,913 11,395 2,509
2010 1,332 2,504 5,386 10,398 13,914 3,329
Real out-of-pocket expenditure (at 2003 NPR)
2003 1,319 2,568 5,047 8,913 11,395 2,509
2010 740 1,392 2,993 5,777 7,730 1,394
Source: Nepal Report on Human Development 2013, SASED, South Asia. The World Bank.
Exchange rate as of February 2016: NPR 108: $1
The share of private schools in terms of the proportion of students and the number of
schools increases at higher levels of education (Table 3.8). However, since the pupil–
teacher ratio is higher in public schools, the share of private school students is lower. In
any case, many families incur significant expenses sending their children to private
schools.
Table 3.8: Share of private schools and students of total schools and students
Share of private schools
Share of private school students
ECD 14.5%
Primary 15.6% 15.4%

Nepal Education Sector Analysis
29
Lower secondary 25.7% 15.9%
Secondary 31.9% 19.1%
Higher secondary 26.3% 29.6%
Tertiary 61.3%
Source: DoE 2014a
6. Efficiency of the education system
The internal efficiency of the public education system has improved in recent years.
Repetition rates have lowered, and survival rates and completion rates have improved
(Table 3.9). However, there is still room for big improvements, especially in Grade 1.
Table 3.9: Repetition, survival and completion rates and coefficient of internal efficiency of schooling in Nepal (2008/09 to 2014/15)
Indicators 2007/08 2008/09 2009/10 2010/11 2011/12 2012/13 2013/14 2014/15
Repetition rate
Grade 1, % 28 18 26.5 22.6 21.3 19.9 17.5 15.2
Grade 5, % 7 6.7 5.7 5.4 5.3 5.3 5.3
Grade 8, % 13 11 6.5 6.6 6 5.7 5.1 4.5
Survival rate by re-constructive cohort method
Grade 5, % 54 58 77.9 80.6 82.8 84.1 85.4 86.8
Grade 8, % 37 41 62 66 67.5 69.4 72.2 74.6
Completion rate (primary and basic level)
Primary level (Grade 5),
% 75 77.6 79.7
Basic level (G 8), % 60.8 63.8 66.7
Coefficient of internal efficiency
Basic education 0.46 0.49 0.61 0.65 0.68 0.71 0.73
Source: ASIP 2015/16
External efficiency is related to employment and earnings. The wage rates received by
employees are usually positively related to the education level completed (Table 3.10).
Compared to 2003, the average annual wage employees receive has increased for all levels
except for those who completed tertiary education.
Table 3.10: Average annual real wage by education level for all employed workers (in 2003 NPR)
Education completed Wage in 2003 Wage in 2010
No education 8,520 12,839
Primary level completed 17,651 24,528
Lower secondary completed 33,681 44,220
Secondary completed 58,981 67,841

Nepal Education Sector Analysis
30
Tertiary (bachelors and higher) completed 172,436 99,695
Average for Nepal 24,776 29,282
Source: Nepal Report on Human Development 2013, SASED, South Asia. The World Bank.
7. Absorptive capacity
The comparison of allocated budget and actual expenditure shows that most allocated
funds have been spent (except for 2014/15) indicating that the system is efficient. Actual
expenditure has been quite close to annual budget allocations between different budget
heads as the viring of funds has been 2% or less of total annual allocated funds for most
recent years except for FY 2009/10, for which it was about 7% (though Red Book figures
indicate otherwise). Virement has taken place for almost all major budget items but more
regularly for primary, lower secondary and secondary education and SSRP districts
(recurrent). However, this data does not show the real picture as MoE reports the transfer
of funds to school accounts as expenditure. This allows MoE to retain the funds allocated
for education rather than surrendering them to MoF at the end of the fiscal year. There
are problems in the effective use of funds especially at the school level because of the
commonplace delays in budget release to schools (note that more than 47% budget are
released in the third and final 4-month semester) and many schools require months and
even years to complete activities that involve improving physical facilities. These factors
provide room for leakages and malpractices. One initiative to reduce leakages has been
DoE starting to transfer scholarship funds to the bank accounts of eligible students
through DEOs. However, DEOs have faced several difficulties in implementing this
scheme.
8. Equity in education financing
To enhance access and improve equity, the government has 16 different types of
scholarships in place that target specific population groups such as conflict-affected,
disabled, girls, Dalits, and poor and talented students. Many of these scholarships are not
as such targeted to students who are weak financially. Thus, many of these benefits are
skewed in favor of females who are in the richest consumption quintile (World Bank
2014). The Terai ethnic groups also do not benefit much from these initiatives. Further
details on these scholarships are provided in Section 3.3.
The poor sections of society benefit the most from the primary level budget while the
richest quintile benefit the most from tertiary education (Table 3.11).
Table 3.11: Share of educational budget by consumption quintiles
Primary Secondary Higher secondary
Tertiary Total
Quintile 1 34.0 16.6 6.0 1.1 27.1
Quintile 2 26.7 22.1 10.1 4.0 23.3
Quintile 3 20.1 23.9 17.9 14.5 20.3
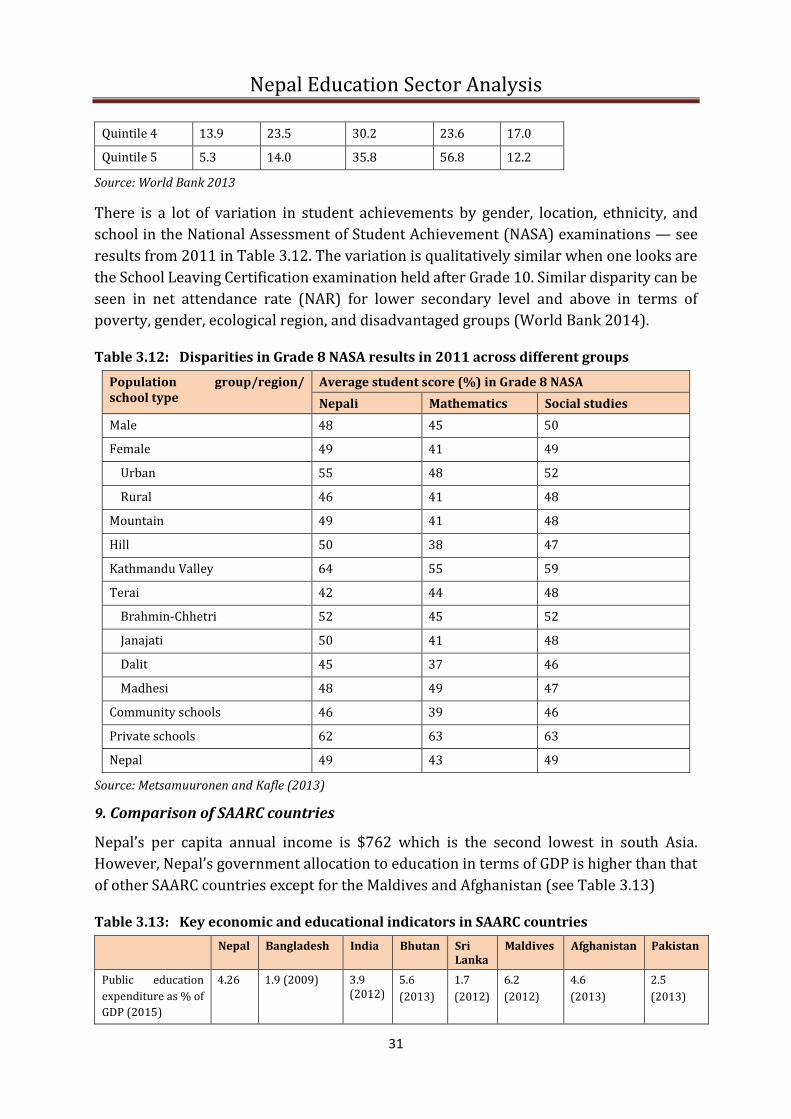
Nepal Education Sector Analysis
31
Quintile 4 13.9 23.5 30.2 23.6 17.0
Quintile 5 5.3 14.0 35.8 56.8 12.2
Source: World Bank 2013
There is a lot of variation in student achievements by gender, location, ethnicity, and
school in the National Assessment of Student Achievement (NASA) examinations — see
results from 2011 in Table 3.12. The variation is qualitatively similar when one looks are
the School Leaving Certification examination held after Grade 10. Similar disparity can be
seen in net attendance rate (NAR) for lower secondary level and above in terms of
poverty, gender, ecological region, and disadvantaged groups (World Bank 2014).
Table 3.12: Disparities in Grade 8 NASA results in 2011 across different groups
Population group/region/ school type
Average student score (%) in Grade 8 NASA
Nepali Mathematics Social studies
Male 48 45 50
Female 49 41 49
Urban 55 48 52
Rural 46 41 48
Mountain 49 41 48
Hill 50 38 47
Kathmandu Valley 64 55 59
Terai 42 44 48
Brahmin-Chhetri 52 45 52
Janajati 50 41 48
Dalit 45 37 46
Madhesi 48 49 47
Community schools 46 39 46
Private schools 62 63 63
Nepal 49 43 49
Source: Metsamuuronen and Kafle (2013)
9. Comparison of SAARC countries
Nepal’s per capita annual income is $762 which is the second lowest in south Asia.
However, Nepal’s government allocation to education in terms of GDP is higher than that
of other SAARC countries except for the Maldives and Afghanistan (see Table 3.13)
Table 3.13: Key economic and educational indicators in SAARC countries
Nepal Bangladesh India Bhutan Sri Lanka
Maldives Afghanistan Pakistan
Public education
expenditure as % of
GDP (2015)
4.26 1.9 (2009) 3.9 (2012)
5.6
(2013)
1.7
(2012)
6.2
(2012)
4.6
(2013)
2.5
(2013)

Nepal Education Sector Analysis
32
Public education
expenditure as % of
total government
expenditure (2015)
12 14 (2009) 14.2
(2012)
15.6
(2013)
8.8
(2012)
15.3
(2012)
18.5
(2013)
11.6
(2013)
GDP per-capita
(current $)
762 1,092 1,596 2,381 3,631 8,484 659 1,334
Adult literacy (%) 59.6 59.7 69.3 52.8
(2005)
91.1 98.4 31.7 56.8
Access to safe water 91.6 86.9 94.1 100 95.6 98.6 55.3 91.4
Source: World Development Indicators (2015)
10. Medium term expenditure framework
The government produces medium term expenditure frameworks (MTEF) for forward
planning for three years for the fiscal account to inject resources into prioritized sectors.
The latest MTEF is for 2014/15-16/17. In the education sector the MTEF has however not
been effective to guide annual planning and the budgeting process because the estimates
tend not to be realistic and MoF has not followed MTEF guidelines.
11. Budgeting process
The annual process of preparation of budget allocation requests by MoE to MoF and the
National Planning Commission (NPC) and the production of budget estimates by MoF is
sub-optimal as indicated by the planned estimates, allocation, release, and expenditure
trends. The budget process for MoE has tended to be quite arbitrary with allocations
usually being incremental, i.e., based on the previous years’ spending and not on targets
or needs of the sector. Annual strategic implementation plans (ASIP) and annual
workplans and budgets (AWPB) are finalized after the MoF red book is published, which
allows for adjusting available funds based on priorities. The weak annual planning and
budgeting process has meant that the SSRP budget has not been tightly linked to the
program’s outputs, targets, and outcomes.
12. Funding modality
Different funding modalities have been used to mobilize development partner support in
Nepal. The common modality is the project approach. To harmonize development partner
funding and coordinated interventions, the second Basic and Primary Education Project
(BPEP 2) used the basket funding approach whereby participating development partners
were required to deposit the agreed amounts in one basket and funds were received by
the government using the reimbursement method. The Education for All Program and the
School Sector Reform Program used a special type of treasury funding approach with
development partner funds mobilized as agreed in a JFA. Global Partnership for Education
(GPE) support was recently received based on the deliverable linked incentives (DLI)
approach while ADB supported the extended period of SSRP using tranche conditions. The
sector wide approach (SWAp) adopted under SSRP helped improve donor harmonization
and reduced the government transaction costs. The SWAp also provided the flexibility of
earmarking some funds to specific program activities by creating separate line items and

Nepal Education Sector Analysis
33
having specific key performance indicators. However, development partner transaction
costs still appear high.
Based on their past experiences, the government and development partners have shown
their commitment to adopt a results-based approach based on DLI to support SSDP. MoE
is preparing SSDP with clear expected key results, which will be the basis for mobilizing
development partner funds. ADB and the government have agreed to adopt the results
based lending approach to finance the first three years of SSDP.
13. Flow of funds
The achievement of results depends largely on the performance of MoE institutions. The
DoE is the main implementing agency of SSDP and many key institutions such as the
Curriculum Development Centre (CDC), the National Centre for Educational Development
(NCED) and the Office of Controller of Examinations (OCE) are outside DoE while the
Higher Secondary Education Board (HSEB) is a semi-autonomous institution. SSRP’s
central budget is managed by DoE, which channels funds to central level agencies. This
arrangement is not effective as these institutions report to MoE directly and thus agencies
do not own the DoE financed programs. Similarly, a simplified fund flow mechanism needs
to be developed and adopted to ensure that funds are disbursed to school level
beneficiaries on time.
14. Public private partnerships
No SSRP pooled funds are allocated to the private sector.
15. Education Management Information System
Because of the provision of school grants based on per capita funding, many schools
inflate the number of students (as suggested by the generally poor student attendance).
To minimize reporting errors, DoE plans to introduce a student tracking system with
unique codes for students. Also, integrated Education Management Information System
(EMIS) system which allows tracking of the utilization of school grant funds has been
developed.
4.3 SSRP Budget and Expenditure Analysis
4.3.1 SSRP classification
SSRP budget heads: The Joint Financing Arrangement (JFA) identified 13 budget heads
under its Eligible Expenditure Program (EEP). These include primary and lower
secondary, secondary teacher’s salary (higher secondary teacher’s salary excluded), non-
formal education (recurrent and capital), teacher record office, special education, teacher
pensions, capacity development (regular and capital) and SSRP (central and district).
Program line items: SSRP budget heads are grouped into the five categories of teacher
salaries, construction, total school grant, program cost and management and
Nepal Education Sector Analysis
34
administration for reporting purposes. Financial monitoring reports (FMRs) provide
information by these items.
Thematic components: The SSRP was designed by activities which are classified into nine
thematic components to prioritize and allocate pooled resources to achieve the SSRP’s
objectives.
Education sub-sectors: The education sub-sectors envisaged in SSRP are ECD, basic
education (Grades 1-8), secondary education (Grades 9-12), TVET, tertiary education,
education management and administration, literacy and lifelong learning, and teacher
pension and retirement facilities.
The classification of the thematic components overlaps with budget heads. The JFA
defined budget heads are mainly for reporting and funding purposes whereas program
and plan documents present the budget in terms of thematic components (access, quality,
and management by levels). This confusion between the thematic program components
and the Eligible Expenditure Program remained among policy making and
implementation levels. This is mainly because JFA did not elaborate this issue.
The following sub-section analyses SSRP budget and expenditure by program line items
and thematic components. It is not possible to analyses SSRP expenditure by levels of
education as SSRP reporting arrangement do not follow the school restructuring reform
initiative.
4.3.2 SSRP budget allocation by program line items
There is currently a heavy emphasis upon the inputs for improving quality. For example,
priority minimum enabling conditions (PMECs) for improving quality include providing
teachers, classrooms, textbooks, sets of reference books for book corners, and separate
girls’ toilets, with little support for classroom learning processes. The first major program
item is teachers’ salaries (both for permanent positions, temporary positions [rahat] and
provident fund). This item accounted for between 51% in FY 2009/10 to more than 62%
in 2012/13. The total school grants are the second major item within which are the
earmarked school grants for the costs of textbooks, the construction of physical
infrastructure, and other non-salary per capita funding (PCF). Scholarships account for
another significant share of the grants. Teachers’ salaries and total school grants have
accounted for between 80% and more than 90% of actual SSRP pooled expenditure.
District level recurrent and capital expenditures together accounted for about 30% of
total pooled SSRP expenditures with accounting for 28% in FY 2013/14.
Teachers’ salaries
Teachers’ salaries and pensions accounted for more than 65% of SSRP’s budget including
the salaries that come from school grants (42,225 temporary [rahat] positions and PCF
non-teaching positions). In the absence of a government policy to rationalize teacher
positions based on needs (based on number of students and required subject teachers), it
Nepal Education Sector Analysis
35
is not clear what will happen to these temporary positions and teachers deployed in these
positions.
Salaries of community school teachers: In five years of SSRP, the beginning salary scale
for various classes of teachers increased by between 56% and 67%. In the third year of
SSRP (FY 2011/12) alone, there was an increase in the salary scale of between 32% and
42%. That put the average annual increment of 10% to 15% for different classes of the
teachers in the SSRP period.
Remuneration for facilitators and motivators: Facilitators are used for program
activities for which there are no permanent positions, and for program activities such as
community-run ECED centers that change their venues. Facilitators, and motivators in the
case of adult literacy programs, are employed for running programs like ECED, school
outreach programs, flexible schooling and adult literacy. The remuneration of ECED
facilitators varies between the ecological regions it being higher in mountain areas. The
salaries of facilitators are about 20% to 25% of the basic salary of primary level teachers.
The reasons for this low remuneration are the expectation of the contribution from local
government bodies and local communities.
Construction
Some of the physical facilities under this heading are the construction of classrooms,
school buildings and separate girls’ toilets. The construction of school buildings is a
standard two-year program with a grant of NPR 2.4 million to community schools
provided in instalments of NPR 1 million and NPR 1.4 million in the first and second years.
In the case of separate girls’ toilet, NPR 100,000 is provided for one unit and each school
is expected to have two such units.
As the construction of physical infrastructure in community schools is undertaken from
their grants, the amount spent on construction is reported as grants rather than
construction expenditure. MoE in close coordination with MoF has recently managed to
create a separate line item for construction. School level construction works are
undertaken more as a matching grant rather than earmarked grants because the per unit
cost norms for improving physical facilities are less than needed by design as local
communities are expected to contribute. This arrangement often allows the community
schools to build larger structures sometimes by compromising on the quality of
construction. Schools usually mobilize other resources and build physical facilities that
would not be been possible from the earmarked grants alone. However, this has
implications on the quality of construction and its timely completion.
Total school grants
SSRP has provided three types of grants:
• Block grants have not been operationalized. However, there is a strong argument in
favor of block grants for allowing schools to have their own programs for improving
quality. Although bottom-up planning through school improvement plans (SIPs),
Nepal Education Sector Analysis
36
VEPs and DEPs are being more highlighted, field level planning, funding and
monitoring processes need to be strengthened to operationalize the block grant tool.
• Earmarked grants are provided mainly to support textbooks, physical infrastructures,
and non-salary PCF.
• Textbook grants are provided to community schools to provide textbooks to all
targeted students including to all students up to Grade 8 in community schools, and
to all girl and Dalit students of Grades 11 and 12 in community schools. At the given
prices, both the semi-governmental Janak Education Materials Centre and private
printers are publishing and distributing textbooks with private sector printers. The
prices of textbooks ranged between NPR 140 and NPR 730 per set for different grades
in FY 2009/10, which increased to NPR 170 to NPR 1,000 in FY 2014/15 – an increase
of between 21% and 37%.
• Non-salary per capita funding per year is provided to community schools for
procuring teaching materials and other necessities for improving quality, while
similar support is provided to the schools per level per annum for meeting their
operational and stationery costs. The per center and per school support for procuring
teaching materials and stationery remained unchanged for the whole SSRP period,
and in some cases, particularly the non-PCF support for this purpose decline in the
second year of SSRP and was unchanged for the remaining period.
Scholarships
Student scholarships are a large component of school grants. Incentives and support
mainly include scholarships for basic and secondary education and a few support
activities for science, ICT and establishing libraries.
Basic level: Various types of basic level scholarship programs including for meeting living
expenses, meeting hostel costs and incentive payments are included under SSRP and
scholarship funds are provided to schools as grants and schools distribute them to
beneficiaries. There are girls’ scholarships for all girl students of basic level in community
schools, basic level students in the Karnali Zone, and for students from 22 specified
Janajati and marginalized communities. All target should receive the same amount of NPR
400 per year.
Secondary level: There are different types of scholarships for secondary students and the
amounts vary. Target groups include martyrs’ children, Kamlaris [bonded laborer’s]
students, conflict affected children, children from remote mountain areas, Dalit students,
differently abled students, science students of Grades 11 and 12, and deserving students.
There are also scholarships for providing residential facilities.
There was a significant rise in the scholarships amount in the initial years due to an
increase in the coverage (50% girls’ scholarships now made 100% girls scholarships), and
increase in the amount particularly for secondary students — increase of scholarship
amount by more than 64% over the previous year.

Nepal Education Sector Analysis
37
However, scholarship funds have often not been effectively used and their impact has
been limited because the money has not been distributed according to DoE guidelines,
which means that some eligible students have been excluded, ineligible students have
received scholarships and some entitled students have not received the full amounts.
The blanket targeting of students for some scholarships, particularly at the basic level,
and the scholarship amounts are often questioned for their relevance and usefulness.
Better targeting could help increase the amounts within the existing available resources.
DoE piloted a pro-poor targeted student scholarship program, but it was not replicated.
As out-of-school children are mostly from the poorest of the poor families, there is a
strong argument for targeting basic level scholarships to such households and increasing
the amounts to help such students to also meet some of their livelihood expenses.
Other program costs
The increasing share of ‘other program costs’ from the initial 2.4% in FY 2009/10 to
10.7% in FY 2013/14 is a positive trend.
Administrative costs
The share of management and administration costs has expanded in recent years.
3. SSRP expenditure by thematic components
SSRP has nine thematic components to prioritize and allocate pooled resources to achieve
its objectives. The annual budget allocation for each of these components is made for
central and district level SSRP recurrent and capital costs (which accounted for about
27% of pooled budget in 2015/16). Program activities of other JFA budget heads are
cross-cutting in nature for these different thematic components.
Basic and secondary education programs saw a slight decline in the budgetary allocation
as against the SSRP estimates, while the other program components (ECED, monitoring
and evaluation, and program management) have shown a significant increase. Given that
the largest share of SSRP was allocated for primary, lower secondary and secondary
teachers’ salaries (18% in 2015/16) less than planned budgetary allocation to these sub-
sectors, SSRP implemented limited interventions particularly to improve secondary
education quality. Improving access to school education, and enhancing quality
components have received similar budget allocations. However, support has been input-
based for quality improvement without putting much emphasis upon the classroom
teaching learning process.
1. Early childhood education and development (component 1) obtained an average 5.5%
of the SSRP budget under four budget line items. The largest share (almost 30%) has
gone to ensuring access to school education closely followed by enhancing educational
quality with an average share of 23% in the last six years of SSRP.
2. Ensuring access to school education includes alternative provisions for basic and
secondary education inclusive education programs, grants to religious schools, free

Nepal Education Sector Analysis
38
and compulsory basic education, curriculum reforms, and other physical facility
improvement measure.
MoE has made alternative provisions for regular basic and secondary education school
programs in the form of flexible programs, open schools and support to religious
schools. Such institutions are provided with per student or per institution grants or
both for their operations. There are also non-formal education opportunities for
housewives (many of whom will not have attended school as girls) at basic and
secondary levels covering the costs of facilitators and other running costs and the
provision for awarding schools if a sizeable number of students pass the Grade 8 and
SLC examinations.
3. Literacy and continuing education:
4. Enhancing educational quality: Major activities include the grants for free textbooks,
midday meals in selected districts, the execution of the continuous assessment system
(CAS), NASA, flash reporting, achievement-based incentives to teachers, resource
persons, school supervisors and DEOs, and recent program coverage on reading skills.
Except for CAS, there are limited activities for improving classroom teaching learning
process. Activities for improving classroom teaching and learning are covered under
teacher education and development. Besides teachers’ professional development,
teacher education and development includes various other training activities for
traditional schools, CAS, leadership development, and special needs children. The
budget allocated for this purpose varied between 0.68% in FY 2009/10 to almost 4%
in FY 2013/14.
A few small activities are important for educational reform. These include grants for
managing multi-grade teaching, for multi-lingual education, CAS, and for midday
meals in two sets of program districts.
5. Teacher education and development: Teacher training activities are included under
this theme.
6. Capacity development for effective service delivery: School capacity building and
community school capacity building are the budget heads for Technical and Vocational
Education and Training (TEVT) soft skills with the former being for recurrent and the
latter for capital expenses. These heads were introduced to monitor financial progress
on the TEVT soft skills component.
7. School management and monitoring: Similar amounts are provided to lead resource
centers (LRCs), resource centers, and community schools for managing LRCs,
strengthening resource centers for monitoring the schools, and the conducting of
school audits. These amounts are often reported to be inadequate for carrying out
these tasks and the amounts have not changed over the years. The grades covered and
the numbers of students are the basis for providing the grants managing staff in
community schools. The granted money is expected to cover the expenditure on

Nepal Education Sector Analysis
39
facilitators and a school assistant. Various amounts provided for the same type of staff
indicate that these jobs could be a part time job for other staff of the schools.
8. Incentives and support includes scholarship funds.
9. PCF non-salary grant support to schools is to cover the cost of education materials.
4. SSRP financial sustainability
About 98% of SSRP’s budget has been used for recurrent activities. Many development
and capacity building programs such as teacher training, the construction of school
building and classrooms and other school physical facilities are covered under recurrent
expenditure. The share of recurrent expenditure would be less than 98% if it was properly
defined.
SSRP liabilities include the salaries of 42,225 rahat (temporary) teachers, and more than
30,000 ECD facilitators. The JFA does not have any sustainability strategy and it is not
clear whether the government will be able to absorb SSRP activities under its future
regular program. Clearly these on-going costs are to be included in SSDP with
rationalization and there is a need to include a strategy to sustain these on-going costs in
the regular system during or after SSDP.
4.4 Implications for SSDP
The above review findings and their implications for SSDP are summarized in Table 3.14.
Table 3.14: Findings and implications of review findings for SSDP
Areas Current situation Implications for SSDP
1. Government
allocation to
education
The declining trend in terms of the share of
total government expenditure.
Need to allocate at least 20% of government
expenditure as per the constitutional
provision of free secondary education
(Grades 9-12).
Ensure that the government’s education
budget increases in real terms in a
situation of low GDP growth and high
inflation.
2. Share of
development
partners
The share of development partners funding
of the education sector has declined during
the extended period of SSRP.
Mobilize both grants and loan resources
from development partners
3. Scope of
program
SSRP scope is led by agreed eligible budget
heads rather than the nature of the activities
to achieve sector results
Separate program result areas and
eligible expenditure program in the
spirit of the DLI approach
4. Budget process Sub-optimal budgeting processes as
indicated by planned estimates, allocations,
release, and expenditure trends.
Strengthen planning and budgeting
processes
5. Funding
modalities
The inadequate focus on results Adopt a fully result-based approach by
using the DLI approach for development
partner fund disbursement

Nepal Education Sector Analysis
40
Areas Current situation Implications for SSDP
6. Flow of funds Inadequate ownership of central level
agencies on programs implemented through
funds channeled through DoE
Need to revisit fund flows at school level
with a view to using commercial banks in
disbursements as much as possible
Fully integrate SSDP funding from
development partners into the treasury
system.
7. Secondary
education
financing
Secondary education, especially higher
secondary education is under-funded
Ensure adequate funding to meet the
salaries of subject teachers (math,
English and science) and quality
interventions with a focus on science
8. Cost estimates Costing based on input, processes and
activities, and not results
Estimate costs by result areas
Ensure that adequate funds are
allocated for results linked with
disbursement linked indicators (DLIs)
9. EMIS Problem of data reliability due to inflated
enrolment figures by schools to get PCF
funds
Introduce student tracking system
Carry out sample surveys to validate
self-reported data.
Link sample survey findings to
disbursement
10. Reporting of
financial
information
Financial reports are prepared by 13 budget
heads and 5 program line items, not by
thematic components and education sub-
sectors
Agree reporting to meet financial
management requirements as well as to
facilitate analysis by results and
education sub-sectors
11. Scholarships Basic level scholarship program is not
targeted; secondary level scholarship is
targeted by type of beneficiary.
Implement poverty targeted
scholarship program
12. Construction Problem of quality of construction and
timely completion of work because of the
use of matching grants for the community
led construction of classrooms
Review the system of matching grants
and adopt a new construction policy to
ensure the quality of construction.
13. School grants Lack of information on the use of school
grants
Rationalize items for school grants and
develop a mechanism to track the
disbursement and use of such grants.
Encourage the use of commercial banks
in disbursement and obtain
reconciliation statement from them.
Carry out periodic sample surveys to
validate flash report information.
14. Remuneration
of ECD facilitators
The low remuneration of ECD facilitators
(school and community-based)
Revise the salary levels of school based
one year ECD facilitators (assuming this
level as 0 grade) and support
community based ECD based on
contracts ensuring that communities
pay reasonable salaries
Nepal Education Sector Analysis
41
Areas Current situation Implications for SSDP
15. Financial
sustainability
On-going SSRP activities, especially
financing temporary teacher positions, need
to be sustained
Include a strategy to rationalize teacher
and facilitator positions and absorb
them in the regular government
program
4.5 SSDP Fiduciary Management
Public financial management (PFM) is defined as the system by which financial resources
are planned, directed and controlled to enable and influence the efficient and effective
delivery of public service goals. The government is responsible to its citizens, taxpayers
and external fund providers for implementing effective PFM systems and for using those
systems to safeguard, and ultimately enhance, the country’s economic sovereignty. Good
PFM ensures that public money is well used for its intended purpose to realize
development objectives.
There is a growing consensus about the importance of PFM at the national and sectoral
levels. Nepal has made substantial progress on deepening the structures and processes of
PFM, particularly using information technology (IT). Various PFM reform initiatives are
being undertaken in the education sector. However, various studies have shown the
challenges that hinder the proper implementation of reforms to minimize fiduciary risks.
National and international studies have identified the eight key elements in Box 3.1 that
are necessary to create a comprehensive and coherent system of PFM.
Box 3.1: The eight elements needed to create a comprehensive and coherent PFM system
1) Climate for reform: Recognition and acknowledgment, at all levels, that change is
required and the commitment from key persons to affect necessary reforms.
2) Legal and institutional framework: A well-defined legal and regulatory framework
including appropriate institutions and a set of recognized codes, standards and
practices.
3) Values system: An open, honest and responsible approach to the way services are
planned, executed and reported with an intent to work in the public interest.
4) Fiscal and policy framework: A credible budget reflecting the expected financial impact
of the government’s policies and its use of resources.
5) Performance management: The budget must be well managed, monitored and reported
to achieve anticipated outcomes, with value for money, the efficient and effective
delivery of services and financial compliances.
6) Reporting: Appropriate and transparent reporting against planned outcomes for
government accountability for its fiscal actions.
7) Scrutiny and assurance: Subjecting information to effective scrutiny and assurance,
thus generating confidence on its veracity.
8) Capacity and capability: Appropriate resources are available to support the application
of each aspect of PFM, in terms of people and systems.
Nepal Education Sector Analysis
42
Source: Confederation of Asian Pacific Accountants/Improving Financial Management in the
Public Sector.
This section proposes an initial financial management framework for the education sector
under the six core dimensions of PFM9. The framework is intended to facilitate further
improvements in MoE’s program and service delivery through a roadmap for
implementing reform initiatives. The following elaborates the five key areas of the
proposed financial management framework:
4.5.1 Links with overarching legal documents
The framework will be implemented under the following legal and other documents and must therefore comply with and support them:
• Audit Act, 1991
• Financial Procedural Act/Rules, 1999
• Local Self Governance Act and Rules, 1999
• Education Act and Rules, 2001/02
• Public Procurement Act and Rules, 2007
• Good Governance (Management and Operation) Act, 2008
• Directives, circulars and guidelines issued by MoE and DoE
• The Joint Financing Arrangement with development partners
• Financial Risks Governance and Improvement Action Plan (draft), 2015
• The Constitution of the Federal Democratic Republic of Nepal, 2015
4.5.2 Resilience and risk mitigation
The level of risk that the education sector can adopt involves a trade-off between: • excessively funding regular activities such as teachers’ salaries, text-books, the
blanket funding of scholarships, unplanned physical infrastructure development,
which will endanger the long-term viability and sustainability of education
funding; and
• undertaking insufficient investments in program related activities to achieve
objectives such as enhancing capacity and improving the quality of service delivery
(teaching).
An important role of MoE is thus to determine the ‘right’ level of risk and to set the overall
risk management framework within which education funding should operate. This may
involve setting values for key risk parameters, such as:
• teachers’ salaries not to exceed 40-50% of total school budget;
9 The six core PFM Dimensions are: i) planning and budgeting, ii) budget execution, iii) procurement and distribution, iv)
financial reporting, v) auditing and assurance, and vi) legislature scrutiny and actions
Nepal Education Sector Analysis
43
• 2 to 3-year rotational system for purchase of new text books;
• 100% scholarships only for students from needy and disadvantaged groups;
• the planned development of infrastructure; and
• 10-20% investment in capacity enhancement at school level (for information
technology (it) and human resources).
It is recommended that MoE/DoE periodically review the risk monitoring data that shows
actual levels of financial risks assumed by the sector to enable it to carry out necessary
course corrections in funding approvals and management.
4.5.3 Identification and management of risk factors and sources
Studies show that the main financial risks assumed by the education sector are as follows:
i) Adequate resource mobilization to meeting costs: The risk here is the non-availability
of funds for all the activities related to the education sector. This may be due to the
limitation of the national budget as well as development partners’ priorities. Hence, it
is necessary that the required resources are regularly assessed and additional sources
of funding are identified to meet the costs of education.
ii) Effective allocation and management of expenses: To meet the over increasing demand
for educational activities and avoid mismatches between available resources and
demand, it is necessary to fund the right mix of activities based on reliable data and
clear cut priorities. The allocation of resources should be 1) based on reliable primary
data from and 2) be within the parameter of approved plans and strategies. It is also
necessary to keep in mind the implications of funding such that the funding of one
activity does not happen at the costs of the funding of other activities, without proper
justification and analysis.
iii) Tracking fund flow from center to schools: To ensure the proper use of funds, a
mechanism is needed to track expenditure against approved budgets and plan. This
should be done at least for major activities. The need is to establish sound accounting
and reporting systems that meets the minimum conditions of data integrity of
timeliness.
iv) Commitment to comply with rules, regulations and financial reporting, and their due
observance is vital to ensure value for money and effective service delivery. This
requires not only producing policies and guidelines but also commitment from top to
bottom of the system to ensure full compliance and accountability to the public
interest. This necessitates rewarding best performance and stringent action against
wrong-doers.
v) Technical and human resource capacities and capabilities: While the proper
functioning of the above four areas should ensure expected result; their operational
effectiveness will depend upon the technology and human resources supporting them.
Thus, it is vital that adequate attention is given to strengthening information

Nepal Education Sector Analysis
44
technology and human resources to enable the latter to discharge their duties
effectively and efficiently.
4.5.4 Fiduciary risk mitigation policies
The fundamental financial risk mitigation policies of the education sector should be as
follows:
i) All key stakeholders are committed to effect necessary changes and there is
widespread recognition and acknowledgement that changes are needed and essential
for the public interest.
ii) All resources received and disbursed by MoE/DoE are managed in accordance with
the government’s financial rules and regulations, procurement laws and the JFA with
development partners.
iii) Resource maximization is achieved through theme-based allocation as per the
approved plan or strategy and external grant and loan contributions are directed only
to core program related activities.
iv) Participation in planning and budget execution is ensured as far as practicable.
v) Education funds are used through identified entities with expenditure according to
implementation guidelines for central level agencies, districts and schools. These
guidelines should be prepared in line with approved plans and strategies.
vi) To minimize cross-subsidization risks, all school level funding should be made
through the government’s budgetary/treasury system and the consolidation of school
level investments at the center by DoE.
vii) Standard procurement, accounting and auditing practices should be followed, and
these should be strengthened in collaboration concerned agencies.
viii) Appropriate information technology should be used for collecting and interfacing
education and financial data to improve quality and timeliness and to achieve better
results.
ix) MoE and DoE should have sufficient flexibility and authority to manage education
budgets. They will ensure ex-ante internal controls while executing budgets.
x) Transparency is promoted by regularly publishing information related to
authorizations, budget and expense, and study reports and social auditing in the public
domain.
xi) Adequate provision for technical support is provided to schools for the initial years (1
to 2 years) to support the maintenance of financial records and reporting and for
overseeing construction activities.
xii) The Audit Committee at MoE level and the Audit Observations Regularization Team at
DoE level will be made functional and responsible for regularly monitoring controls
and for recommending appropriate actions against wrong-doers and changes in the
system and procedures.

Nepal Education Sector Analysis
45
xiii) The minimum conditions for financial management performance will be set to
provide additional financial incentives and establish a fair competitive environment.
The school grants operational manual and directives, 2004 will be revised and
implemented for better internal controls in schools.
xiv) A single door capacity enhancement technical assistance pool should be
established for providing technical support in the areas of PFM, procurement, M&E,
capacity development and participation in national level reform undertakings.
4.5.5 The framework
The financial management framework should have the following elements:
Planning and budgeting
i) Threshold: MoE and DoE will develop a medium-term expenditure framework
(MTEF) based on the approved plan document and hold discussions with MoF and
NPC on the allocation of sufficient resources on an annual basis during the
implementation of SSDP.
DoE provides district level ceilings based on MTEF allocation as agreed with
MoF/NPC and recent flash data so that planning and budgeting workshops focus
on prioritizing activities rather than conventional incremental budget preparation.
The budget for activities added because changes in policies or priorities will be
identified separately while preparing annual strategic implementation plans and
annual work plans and budget (ASIPs, AWPBs).
ii) Timing: MoE and DoE follow MoF and NPC directives on timing for the preparation
and submission of plans and budget for each fiscal year. A planning and budgeting
calendar with final deadlines is prepared and circulated to spending units.
iii) Approval: MoE and DoE seek approval of the education program each year from
NPC on a national and district-wise basis so that the subsequent approval of
programs is not required after the passing of the budget by the legislative
parliament. Subsequent changes will only be forwarded for their approval.
iv) Links: ASIPs and AWPBs will have links with the SSDP document and MoF’s budget
head economic classification. Major program activities will have current MoF
economic head (line item) classifications10 and only recurrent block grants will be
provided under line items 26412 and 26413. Similarly, the plan document and
ASIP/AWPB will clear distinguish which activities are to be carried out by the
various central level agencies.
10 For instances, line item code 22313 for text books and other education materials, 27211 for scholarship and 26423 for
construction.
Nepal Education Sector Analysis
46
Budget execution
i) Budgetary control: MoE/DoE should be intimately involved with forecasting
trimesterly expenditure in accordance with annual appropriations and plans.
District units should be fully responsible for planning disbursement to schools in
accordance with norms and standards and verified education data and in
accordance with the School Grants Operational Manual and directives.
MoE and DoE hold the authority for variations in approved budgets under any
economic or programmatic heads and will carry out analysis and approval process
in advance. All variations more than 5% of allotted budget of any specific heads
will require justification from spending units and prior approval from MoE/DoE.
DoE will carry out periodic (trimesterly) budget variance analysis and take
appropriate actions to regularize variations.
ii) Authority and disbursement: MoE will ensure the timely release of approved
budgets and hence provide authorizations to DoE within a week of the date of
receipt of authorizations from MoF. DoE will subsequently provide budget
authorizations and release authorizations within 15 days to all spending units. The
actual date of release of authorizations will be publicly announced on MoE’s and
DoE’s websites.
Budget release will be based on fund request from spending units at central,
district and school level, submitted in line with updated trimester plans and
budgets and updated flash data. Disbursement to schools shall be accounted for as
an advance to head-teachers and the settlement of these advances shall be based
on the submission of periodic statements of expenditure and compliances.
iii) Internal controls: MoE/DoE will liaison with Public Expenditure and Financial
Accountability (PEFA) Secretariat for development of internal control guidelines
and implement the same within its jurisdiction.
DoE will draft and send program implementation guidelines together with the
budget authorizations to spending units for each year. The School Grants
Operational Manual/Directives, 2004 will be revised to incorporate recent
developments and with minimum controls provided to schools together with first
trimester budget release information.
Financial monitoring plans (for central and district levels) with standardized
templates will be prepared and implemented. There will be periodic as well as for
case-based financial monitoring. Status reporting of financial monitoring will be
done to the audit committee each trimester.
Responsible officers at spending units will be awarded for not only clearing
backlogs of audit observations but also steps shall be taken to minimize audit
observations and increase compliance with rules and regulations.
iv) Decentralization: MoE/DoE will hold talks with the Local Body Fiscal Commission
to streamline the flow of education budgets to schools and strengthen their roles

Nepal Education Sector Analysis
47
in exercising budgetary control and monitoring school level funding. This should
smoothen education budget management through local bodies in the new national
federal structure.
v) Capacity enhancement: The financial management information system (FMIS)
cannot be run without adequate and appropriate resources. DoE will ensure that
spending units are fully equipped with necessary logistics and required skills for
maintaining sound financial management system by providing physical facilities,
technologies, training and fulfilling adequate human resources at spending units
(central or districts or schools).
Procurement and distribution
i) Procurement plan: MoE/DoE will prepare a procurement plan for central and
district levels each year together with the ASIP and AWPB in accordance with
public procurement laws and regulations. Districts will also require the
submission of simplified procurement plans from schools together with their first
trimester fund requests. DEOs and DoE and will report on the status of
procurement each trimester to MoE and make the information available through
respective websites.
ii) Technical support to schools: DoE will ensure that school construction activities
follow specified standards and are comply with MoE’s standard technical
specifications by providing technical support like drawings in easily
understandable form, by providing human technical resources for supervision and
public participation during construction processes.
iii) Private sector involvement: MoE/DoE will promote the involvement of the private
sector for printing and distributing education materials and manage contracts
with them.
Financial reporting
i) Application of Nepal Public Sector Accounting Standards (NPSAS): MoE and DoE
commit to adopt NPSAS and implement it as a priority for recording and reporting
financial information for public consumption and meeting their statutory
obligations. MoE and DoE work closely with the PEFA secretariat for its
implementation and training staff. MoE and DoE commit to preparing annual
financial reports in line with the NPSAS.
ii) Standardization and simplification of financial record keeping: MoE and DoE ensure
that adequate and appropriate records are maintained to facilitate the adoption of
NPSAS and financial monitoring. For this purpose, DoE requires central level
agencies and DEOs to maintain financial records of disbursements as per the Office
of Auditor General (OAG) formats (at least forms 8 [budget sheets], 13 [monthly
expense statements], 14 [outstanding advances], 17 [annual financial statements],
18 [payables] and 47 [non-expendable inventory]) and the programmatic record
as per ASIP and AWPB heads.

Nepal Education Sector Analysis
48
To simplify financial record keeping at schools, MoE, using the authority provided
by the Education Rules (Rule 194), will amend Schedule 23 of the Education Rules
and simplify financial record keeping at school.
iii) Capacity enhancement: Management and staff in charge of reporting functions
should be qualified to produce high quality, timely reports and identify
inconsistencies or potential issues. This can be achieved through the provision of
technical support and targeted training and a strengthened information system. A
skilled person should be provided at each resource center to support all head
teachers under the jurisdiction of and through DoE’s technical cooperation pool.
iv) Automation and coherence: An integrated system is necessary to increase
timeliness and accuracy of financial reporting. This will cover planning, budgeting,
budget execution including procurement, inventory management, payroll and
reporting. Hence a simplified financial reporting system needs to be developed and
linked with education data system.
Financial reports received from schools will be consolidated at district level and a
national level consolidation will be carried out at DoE level on a quarterly basis
after the automation of the financial reporting system. Before automation at
central and district levels, a link will be established with the Financial Comptroller
General Office (FCGO) to obtain data from their FMIS system to prepare and submit
financial monitoring reports. Self-developed reporting systems will be phased out
once the MoF/FCGO’s Computerized Government Accounting System (CGAS) is
fully functional.
v) Timely reporting: MoE will meet the government’s reporting deadlines and the JFA
by establishing necessary systems and facilities. DEOs will liaise with their district
treasury and control offices (DTCOs) for timely and accurate recording in the
FCGO’s FMIS monthly and send the specified OAG forms to DoE on time.
MoE/DoE will ensure that financial reports are prepared and analyzed periodically
to help control the budget and provide grounds for taking corrective actions and
to guide future budgeting.
Auditing and assurance
i) Towards a risk based audit approach: MoE and DoE will work closely with OAG and the
Institute of Chartered Accountants of Nepal (ICAN) for the adoption of suitable
auditing standards in conducting audit of MoE, DoE, central level agencies, DEO and
school accounts:
o MoE will liaise with OAG and ICAN to improve audit practices by focusing on
potential systemic issues and the prioritization of audit findings.
o MoE and DoE will work closely with FCGO and the PEFA Secretariat to revise
the internal audit manual and incorporate a risk based approach.

Nepal Education Sector Analysis
49
o MoE and DoE will take steps for the amendment of the Education Laws on
carrying out audits, applying NSA70011 to selected risky schools annually, and
on a rotational basis (say every 3 to 5 years) for all other schools. In the
meantime, the auditing of less risky schools will be conducted by applying
NSA440013.
ii) Audit guidelines and planning: MoE and DoE will work closely with OAG to plan the
auditing of agencies other than schools and ensure timeliness in producing final audit
reports within the deadlines agreed with development partners in the JFA:
o MoE will work closely with ICAN to revise school audit guidelines in line with
the risk-based approach and compliance with school grant operation manual
and directives.
o DoE will develop and provide standard terms of reference for school auditors
and make it compulsory to include all resources received by schools in their
audited financial statements.
o Emphasis will be given to produce audit reports that clearly show what needs
to change, why it must change and how improvements can be made, using plain
language.
o School inspectors and supervisors will be made responsible to facilitate social
auditing by schools.
iii) Audit follow-up action plans and settlements: DEOs and central level agencies will
submit preliminary audit reports together with audit follow-up action plan within a
week of receipt of the same from the OAG team to the Audit Observations Settlement
Team at DoE.
o DoE will prepare a consolidated status report on audit follow-up action plans
and submit reports to MoE’s Audit Committee.
o The Audit Committee will fix the amounts of ineligible audit observations
within one month from the receipt of the consolidated status of audit follow-
up action plans.
o MoE and DoE will establish a mechanism to reward staff for reducing non-
compliances and audit observations and clearing backlogs of audit
observations. Staff will be held responsible for audit observations related to
them, even after their transfer away from the concerned office.
o DEO will be made responsible for reviewing audit reports submitted by schools
and will be given authority to stop funding concerned schools until serious
audit observations are resolved.
iv) Capacity enhancement of auditors and stakeholders: MoE and DoE will liaise with ICAN
for trainings school auditors on the revised school audit guidelines and monitoring the
conduct of audits by reviewing audit reports.

Nepal Education Sector Analysis
50
o School inspectors and supervisors will be given additional responsibility to
guide school, SMC and PTA members on the conducting of social audits as per
the social audit guidelines. Resource persons will oversee the proper conduct
of social audits as per these guidelines and submit reports on each audit to the
DEO.
Legislative scrutiny
This is a three-pronged process of policy dialogue, legislative change and framing an
education communication strategy.
Policy dialogue: To ensure the allocation of the education budget in priority areas, MoE
will engage relevant policy makers, including relevant parliament committees, MoF,
NPC and major political parties in discussions and presentations on the SSDP. MoE will
liaise with the Parliament Secretariat and provide technical support to improve
legislatures’ ability to debate technical issues and analyses proposed budgets.
i) Change in legislation: MoE will establish stringent actions against wrongdoers by
making the Education Act an overarching act that covers all financial duties,
accountability and possible penalties and by providing for actions to be initiated by
identifying perpetrators and areas of non-compliances, intentional frauds, loss of
assets, etc. MoE will take necessary steps to suggest amendments to the Education Act
for this purpose.
ii) Education communication strategy: MoE and DoE will amend Education
Communication Strategy 2063 (2007) to incorporate recent developments and policy
and procedures for making different reports for public consumption and enhancing
transparency in the budgeting and spending.
Fiduciary risk governance
Fiduciary risk refers to the risk that funds are not used for the intended purposes; do not
achieve value for money; and are not properly accounted for. The realization of fiduciary
risk can be due to a variety of factors, including lack of capacity, competency or
knowledge; bureaucratic inefficiency; and active corruption (DFID 2011). Table 3.15 gives
an overview of the roles and responsibilities of the various actors related to education
sector financial risk governance.
Table 3.15: Roles and responsibilities for fiduciary risk governance in Nepal’s education sector
Authorities/ areas
Roles and responsibilities Timetable/frequency
1. Parliament
Legislative
scrutiny
1. Budget analysis and approval
During budget discussion and
approval/each year
Within a month of start of fiscal
year
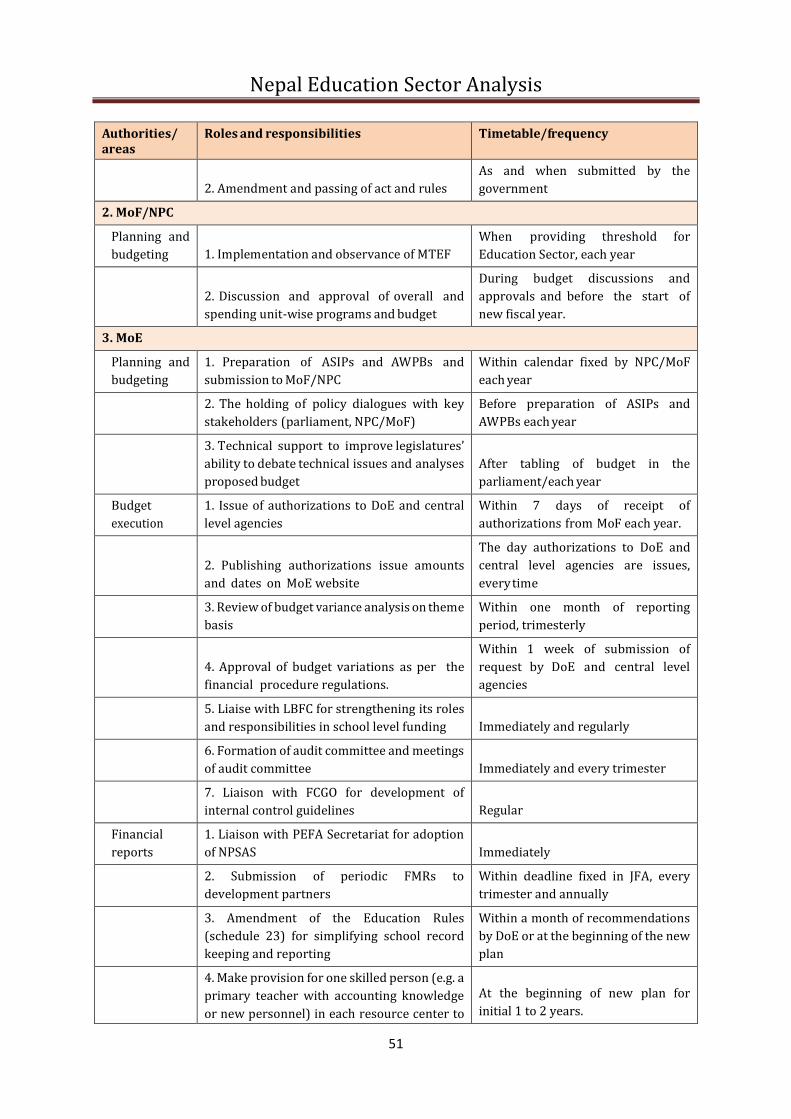
Nepal Education Sector Analysis
51
Authorities/ areas
Roles and responsibilities Timetable/frequency
2. Amendment and passing of act and rules
As and when submitted by the
government
2. MoF/NPC
Planning and
budgeting 1. Implementation and observance of MTEF
When providing threshold for
Education Sector, each year
2. Discussion and approval of overall and
spending unit-wise programs and budget
During budget discussions and
approvals and before the start of
new fiscal year.
3. MoE
Planning and
budgeting
1. Preparation of ASIPs and AWPBs and
submission to MoF/NPC
Within calendar fixed by NPC/MoF
each year
2. The holding of policy dialogues with key
stakeholders (parliament, NPC/MoF)
Before preparation of ASIPs and
AWPBs each year
3. Technical support to improve legislatures’
ability to debate technical issues and analyses
proposed budget
After tabling of budget in the
parliament/each year
Budget
execution
1. Issue of authorizations to DoE and central
level agencies
Within 7 days of receipt of
authorizations from MoF each year.
2. Publishing authorizations issue amounts
and dates on MoE website
The day authorizations to DoE and
central level agencies are issues,
every time
3. Review of budget variance analysis on theme
basis
Within one month of reporting
period, trimesterly
4. Approval of budget variations as per the
financial procedure regulations.
Within 1 week of submission of
request by DoE and central level
agencies
5. Liaise with LBFC for strengthening its roles
and responsibilities in school level funding Immediately and regularly
6. Formation of audit committee and meetings
of audit committee Immediately and every trimester
7. Liaison with FCGO for development of
internal control guidelines Regular
Financial
reports
1. Liaison with PEFA Secretariat for adoption
of NPSAS Immediately
2. Submission of periodic FMRs to
development partners
Within deadline fixed in JFA, every
trimester and annually
3. Amendment of the Education Rules
(schedule 23) for simplifying school record
keeping and reporting
Within a month of recommendations
by DoE or at the beginning of the new
plan
4. Make provision for one skilled person (e.g. a
primary teacher with accounting knowledge
or new personnel) in each resource center to
At the beginning of new plan for
initial 1 to 2 years.
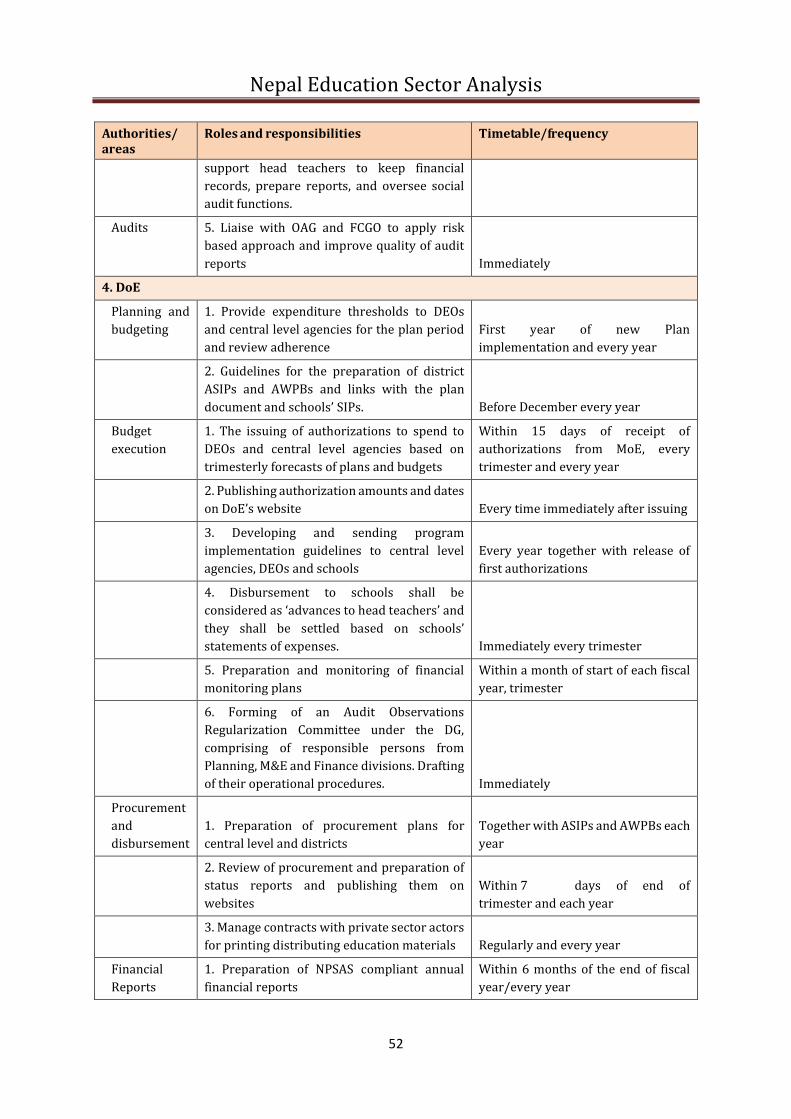
Nepal Education Sector Analysis
52
Authorities/ areas
Roles and responsibilities Timetable/frequency
support head teachers to keep financial
records, prepare reports, and oversee social
audit functions.
Audits 5. Liaise with OAG and FCGO to apply risk
based approach and improve quality of audit
reports Immediately
4. DoE
Planning and
budgeting
1. Provide expenditure thresholds to DEOs
and central level agencies for the plan period
and review adherence
First year of new Plan
implementation and every year
2. Guidelines for the preparation of district
ASIPs and AWPBs and links with the plan
document and schools’ SIPs. Before December every year
Budget
execution
1. The issuing of authorizations to spend to
DEOs and central level agencies based on
trimesterly forecasts of plans and budgets
Within 15 days of receipt of
authorizations from MoE, every
trimester and every year
2. Publishing authorization amounts and dates
on DoE’s website Every time immediately after issuing
3. Developing and sending program
implementation guidelines to central level
agencies, DEOs and schools
Every year together with release of
first authorizations
4. Disbursement to schools shall be
considered as ‘advances to head teachers’ and
they shall be settled based on schools’
statements of expenses. Immediately every trimester
5. Preparation and monitoring of financial
monitoring plans
Within a month of start of each fiscal
year, trimester
6. Forming of an Audit Observations
Regularization Committee under the DG,
comprising of responsible persons from
Planning, M&E and Finance divisions. Drafting
of their operational procedures. Immediately
Procurement
and
disbursement
1. Preparation of procurement plans for
central level and districts
Together with ASIPs and AWPBs each
year
2. Review of procurement and preparation of
status reports and publishing them on
websites
Within 7 days of end of
trimester and each year
3. Manage contracts with private sector actors
for printing distributing education materials Regularly and every year
Financial
Reports
1. Preparation of NPSAS compliant annual
financial reports
Within 6 months of the end of fiscal
year/every year

Nepal Education Sector Analysis
53
Authorities/ areas
Roles and responsibilities Timetable/frequency
2. Liaison with PEFA Secretariat for training
on NPSAS Regularly
3. Require the maintenance and submission of
reports on specified OAG formats (at least
forms no. 8, 13, 14, 17, 18 and 47) by DEO and
central level agencies
Within the period specified in the
Financial Administration
Regulations, every reporting period
and every year
4. Establish linkages with FCGO and prepare
FMRs based on data available from the FCGO’s
FMIS
Immediately until successful
implementation of own financial
management software
5. Develop financial management software for
use in central level agencies and DEOs. Within 6 months of start of new Plan
6. Interface financial management software
with EMIS at the center Within 6 months of start of new Plan
Audits 1. Participate in audit planning meetings with
the OAG and discuss audit methodology and
collect preliminary audit reports By end of October every year
2. Liaise with ICAN on revising school audit
guidelines and training school auditors
Immediately and in September every
year
3. Liaison with ICAN on monitoring schools’
audit performance Immediately and in March every year

Nepal Education Sector Analysis
54
5. NEPAL EDUCATION SECTOR: PROGRESS AND CHALLENGES
5.1 National Education Progress and Challenges
Nepal’s history of education reform is a story of remarkable accomplishments in
expanding access to education alongside almost intractable challenges in improving both
equity and quality. This is as much a global challenge as a Nepal specific issue.
Nepal has come a long way since 1951 when there were only 9,000 students in primary
schools 1,700 in secondary school, and a little over 100 students in the two undergraduate
colleges (Mathema 2007). This section highlights the overall progress on the major
education indicators. Table 4.1 shows the progress made between 2001 and 2012 and the
targets for 2015 while the rest of this chapter summarizes the progress made.
Table 4.1: General education indicators, Nepal (2001 to 2012)
Source: Joint Evaluation of Nepal’s School Sector Reform Plan Program, p 33.
** The literacy rate for age group 6+ years is 77.5% for males and 58.4% for females. The adult literacy rate is
75.2% for males and 51.9% for females.
Indicator Achievements Targets 2015 2001 2006 2012
1 Gross enrolment rate of ECD/pre-primary education 12.8 41.4 73.7 80
2 % of new entrants at Grade 1 with ECD/PPE experiences 7.8 18.3 55.6 80
3 Gross intake rate at Grade 1 122.9 148 137.7 102
4 Net intake rate at Grade 1 86 91.2 98
5 Gross enrolment rate of primary level 124.7 138.8 130.1 105
6 Net enrolment rate of primary level 81.1 87.4 95.3 100
7 % GNP channeled to primary education 1.8 2.0 2.0 2.5
8 % of education budget to primary education 56.7 60 60
9 % of teachers with required qualification and training 15 60 98.4 100
10 % of teachers with required certification/license 100 100 100
11 Pupil–teacher ratio 39.9 46.0 26.9 30
12 Repetition rate in Grade 1 38.7 29.8 19.9 10
13 Repetition rate in Grade 5 9 10.4 5.3 8
14 Survival rate to Grade5 65.8 80.3 84.1 90
15 Coefficient of efficiency 60.0 80
16 Percentage of Learning Achievement at Grade 5 40 80
17 Literacy rate for age group 15–24 70 84.7 95
18 Literacy rate for age group 6+ years 54 67.2** 90
19 Adult literacy rate (15+ years) 40.7 62.2 ** 75
20 Literacy gender parity index (15+ years) 0.6 0.7 1.0
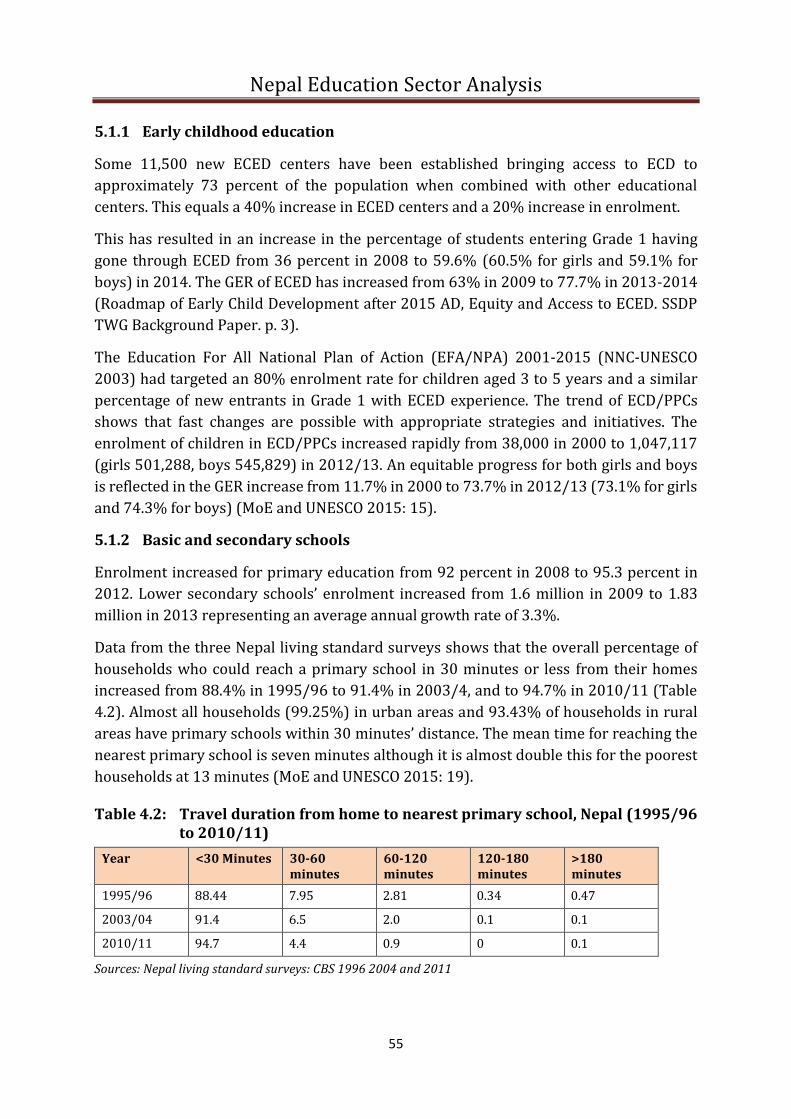
Nepal Education Sector Analysis
55
5.1.1 Early childhood education
Some 11,500 new ECED centers have been established bringing access to ECD to
approximately 73 percent of the population when combined with other educational
centers. This equals a 40% increase in ECED centers and a 20% increase in enrolment.
This has resulted in an increase in the percentage of students entering Grade 1 having
gone through ECED from 36 percent in 2008 to 59.6% (60.5% for girls and 59.1% for
boys) in 2014. The GER of ECED has increased from 63% in 2009 to 77.7% in 2013-2014
(Roadmap of Early Child Development after 2015 AD, Equity and Access to ECED. SSDP
TWG Background Paper. p. 3).
The Education For All National Plan of Action (EFA/NPA) 2001-2015 (NNC-UNESCO
2003) had targeted an 80% enrolment rate for children aged 3 to 5 years and a similar
percentage of new entrants in Grade 1 with ECED experience. The trend of ECD/PPCs
shows that fast changes are possible with appropriate strategies and initiatives. The
enrolment of children in ECD/PPCs increased rapidly from 38,000 in 2000 to 1,047,117
(girls 501,288, boys 545,829) in 2012/13. An equitable progress for both girls and boys
is reflected in the GER increase from 11.7% in 2000 to 73.7% in 2012/13 (73.1% for girls
and 74.3% for boys) (MoE and UNESCO 2015: 15).
5.1.2 Basic and secondary schools
Enrolment increased for primary education from 92 percent in 2008 to 95.3 percent in
2012. Lower secondary schools’ enrolment increased from 1.6 million in 2009 to 1.83
million in 2013 representing an average annual growth rate of 3.3%.
Data from the three Nepal living standard surveys shows that the overall percentage of
households who could reach a primary school in 30 minutes or less from their homes
increased from 88.4% in 1995/96 to 91.4% in 2003/4, and to 94.7% in 2010/11 (Table
4.2). Almost all households (99.25%) in urban areas and 93.43% of households in rural
areas have primary schools within 30 minutes’ distance. The mean time for reaching the
nearest primary school is seven minutes although it is almost double this for the poorest
households at 13 minutes (MoE and UNESCO 2015: 19).
Table 4.2: Travel duration from home to nearest primary school, Nepal (1995/96 to 2010/11)
Year <30 Minutes 30-60 minutes
60-120 minutes
120-180 minutes
>180 minutes
1995/96 88.44 7.95 2.81 0.34 0.47
2003/04 91.4 6.5 2.0 0.1 0.1
2010/11 94.7 4.4 0.9 0 0.1
Sources: Nepal living standard surveys: CBS 1996 2004 and 2011

Nepal Education Sector Analysis
56
NLSS 3 (2010/11) reported that almost 71.5% of households had a primary school within
30 minutes’ distance while 56.3 percent of households were within 30 minutes of a
secondary or higher secondary school.
Seventy-six-point two percent of all schools offered primary education from Grade I to 5
in 2012 while 36 percent of all schools offered basic education from Grade 1 to 8. The
latter figure was an increase of 6.8 percent from 2010. This rise in the number of schools
offering primary/basic education was the major factor reducing the duration of travel
time between home and schools.
In secondary schools, enrolment increased from 40.8 percent in 2009 to 56.1 percent in
2014. The average growth rate was 54.6 percent for girls and 55.1 percent for boys in
2014 (DoE 2013a, 2014b and 2014a).
From an equity perspective, the last ten years have witnessed concrete progress in closing
regional disparities in terms of net enrolment in primary, lowest secondary, and
secondary schools with the net enrolment rates being much more similar across all
development regions in 2014/15 compared to 2004, especially for primary schooling
(Figures 4.1 and 4.2).
Figure 4.1: Net enrolment rate by development region in 2004, Nepal
Source: Unicef Equity Study (2007)
Figure 4.2: Net enrolment rate by development region in 2014/2015, Nepal
7462
85 8074
30 30 3321 2419 14 14 13 15
East Central West Mid West Far West
Net Enrolment Rate by Development Region 2004
primary lower secondary secondary

Nepal Education Sector Analysis
57
Source: NASA 2014/2015
5.1.3 Private education
In recent years, the extent of private schooling in Nepal has grown rapidly despite the
solid presence of public education. According to MoE, enrolment in private schools nearly
doubled at all levels between 2005 and 2010 — from 6 to 13 percent at primary level,
from 7.6 to 15 percent at lower secondary and from 9.7 to 17 percent at secondary level.
Moreover, according to the Private and Boarding Schools Organization of Nepal
(PABSON), nearly 20 percent of total enrolments in school education have been in private
schools.
In 2013 private schools accounted for approximately 14% of the student population (an
increase of 2% since 2011) while public schools accounted for 84% (a decrease from 87%
in 2011) (Table 4.3).
Table 4.3: Number students enrolled in community and private schools, Nepal, 2011 to 2013
Year Enrolled in public (community) schools Enrolled in private schools Totals
2011 7,444,134 1,077,654 8,521,788
2012 7,153,270 1,130,512 8,283,782
2013 7,127,050 1,131,335 8,258,385
5.1.4 Non-formal education
Nepal has adopted four strategies for mitigating the challenges of providing non-formal
education:
• Flexible schooling, alternate schooling and open schooling to support those who
never enrolled in a school or could not complete their school education.
96.2 96.4 96.6 95.4 95.9
75.266.2
80.4 81 82.7
57.852.7
60.753.5
58.5
East Central West Mid West Far West
Primary Lower seconday Secondary

Nepal Education Sector Analysis
58
• Curriculum reform and teacher training to incorporate relevant life skills and
appropriate learning in school education.
• Different NFE programs for youths and adults covering the wider needs of basic
literacy, functional literacy, and literacy integrated in income generation, social
mobilization (e.g., mother’s group) and others.
• Job oriented technical and vocational education. (MoE and UNESCO 2015).
The government adopted non-formal education policy (NFEC 2006) outlines
comprehensive guidelines for increasing literacy, life skills education and continuous
learning.
Community learning centers (CLCs) are used to provide life skills and appropriate
learning needs for youths and adults. Additionally, the non-formal education policy
emphasizes expanding NFE resource centers and technical vocational schools. The
policies and directives concerning CLCs describe the provisions for continuing education
and lifelong learning through non-formal means. In collaboration with UNESCO, efforts
have also been made by NFEC to establish NFE equivalency programs in the country.
The establishment of CLCs started in Nepal in 2002 with five pilot programs that were
supported by the UNESCO Office in Kathmandu. The Tenth National Development Plan
(2002-2007) included establishment of 205 CLCs, with one in each electoral constituency.
MoE and UNESCO (2015: 25) reports that 2,199 CLCs have been established and are in
operation.
Finally, MoE has recently initiated the Literate Nepal Mission (LINEM) 2012-2015 with
the goal of freeing every community from illiteracy. Given current trends, the country is
likely to have achieved or at least come close to the 95 percent target for youth literacy in
2015 (Joint Evaluation of Nepal’s School Sector Reform Plan Program, pg. 33.).
5.1.5 Challenges
Quality
The pass rates of the School Leaving Examinations (SLC), which are administered at the
end of Grade 10, have ranged between 30 percent and 60 percent, with only 47% of
students passing their SLC in 2011. Likewise, the pass rates for the Grade 11 and 12 exams
in 2011 were 38.2 percent and 47.5 percent respectively.
The Nepal Early Grade Reading Assessment (RTI 2014) found that 34 percent of second
graders and 19 percent of third graders could not read a single word of Nepali! This is
consistent with earlier studies reported by MoE (2014) on the abilities of students from
different grades to read. Some of the findings were as follows:
• Grade 5 students scored 51 out of 100 on their ability to read Nepali, with high
standard deviations of 15 or more, and no significant improvement in scores over
time.

Nepal Education Sector Analysis
59
• Students mean score in writing was 30 out of 50 (in regards to dictation, creative
writing, and letter writing).
Other sources report that:
• only 43 percent of Grade 2 students could read all the letters correctly (Room to
Read 2009); and
• 36 percent of native Nepali speakers in Grade 3 could not read a single word of
Nepali “Grade 3 text” (EQUIP 2 2010).
Only around a half of students in Grades 3, 5 and 8 meet the NASA criteria for science,
math and English (Figures 4.3, 4.4 and 4.5). They also show girls lagging boys. The
percentage of achievers slightly decreases in Grades 5 and 8.
Figure 4.3: Percentage students meeting NASA achievement criteria in science in Grades 3, 5 and 8 (2013/14)
Figure 4.4: Percentage students meeting NASA achievement criteria in math in Grades 3, 5 and 8 (2013/14)
Figure 4.5: Percentage students meeting NASA achievement criteria in English in Grades 3, 5 and 8 (2013/14)
52.9
48.847.4
53.5
49.5 49.4
Grade 3 Grade 5 Grade 8
Science F Science M
51.3
49.7
45.7
51.750.6
46.3
Grade 3 Grade 5 Grade 8
Math F Math M

Nepal Education Sector Analysis
60
And the 2011 and 2013 data shows that around 60% of Grade 5 students did not achieve
the achievement criteria for mathematics (Figure 4.6).
Figure 4.6: Achievements of math NASA criteria in Grade 5, (2011 to 2013)
In summary, the above data signals red flags that begin with reading difficulties in the
early grades and expand to less than half of students achieving at expected levels in Grade
8 math, science, and English. Students’ performances in all these subjects show that
performance in one has a bearing on the performance in the others. Figure 4.7 illustrates
the correlation between English, math, and science. More student level data should help
demonstrate the extent to which performance in reading in one subject would predict
performance in the others, or whether the three subjects share common denominator
competencies that need to be acquired for learning to occur.
51.5
49.1 49
51.8
50.3
49.5
Grade 3 Grade 5 Grade 8
English F English M
33
53
3938
54
43
2011 2012 2013
Girls Boys
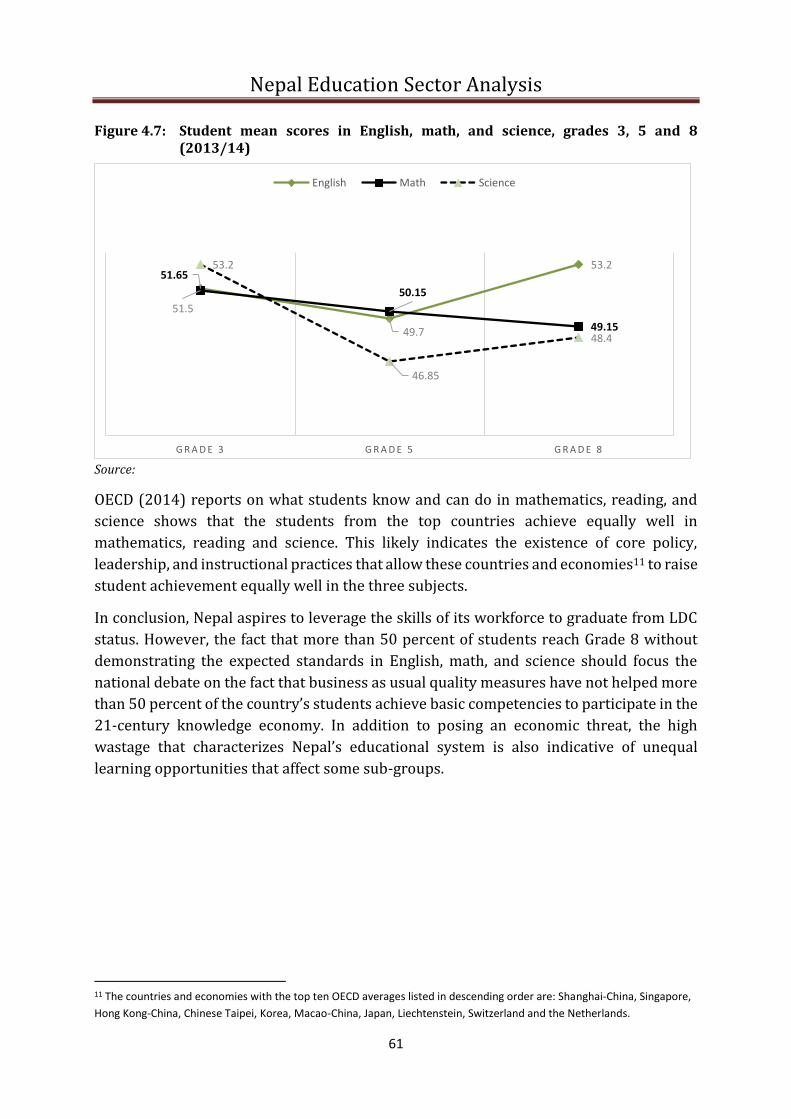
Nepal Education Sector Analysis
61
Figure 4.7: Student mean scores in English, math, and science, grades 3, 5 and 8 (2013/14)
Source:
OECD (2014) reports on what students know and can do in mathematics, reading, and
science shows that the students from the top countries achieve equally well in
mathematics, reading and science. This likely indicates the existence of core policy,
leadership, and instructional practices that allow these countries and economies11 to raise
student achievement equally well in the three subjects.
In conclusion, Nepal aspires to leverage the skills of its workforce to graduate from LDC
status. However, the fact that more than 50 percent of students reach Grade 8 without
demonstrating the expected standards in English, math, and science should focus the
national debate on the fact that business as usual quality measures have not helped more
than 50 percent of the country’s students achieve basic competencies to participate in the
21-century knowledge economy. In addition to posing an economic threat, the high
wastage that characterizes Nepal’s educational system is also indicative of unequal
learning opportunities that affect some sub-groups.
11 The countries and economies with the top ten OECD averages listed in descending order are: Shanghai-China, Singapore,
Hong Kong-China, Chinese Taipei, Korea, Macao-China, Japan, Liechtenstein, Switzerland and the Netherlands.
51.65
49.7
53.2
51.5
50.15
49.15
53.2
46.85
48.4
G R A D E 3 G R A D E 5 G R A D E 8
English Math Science
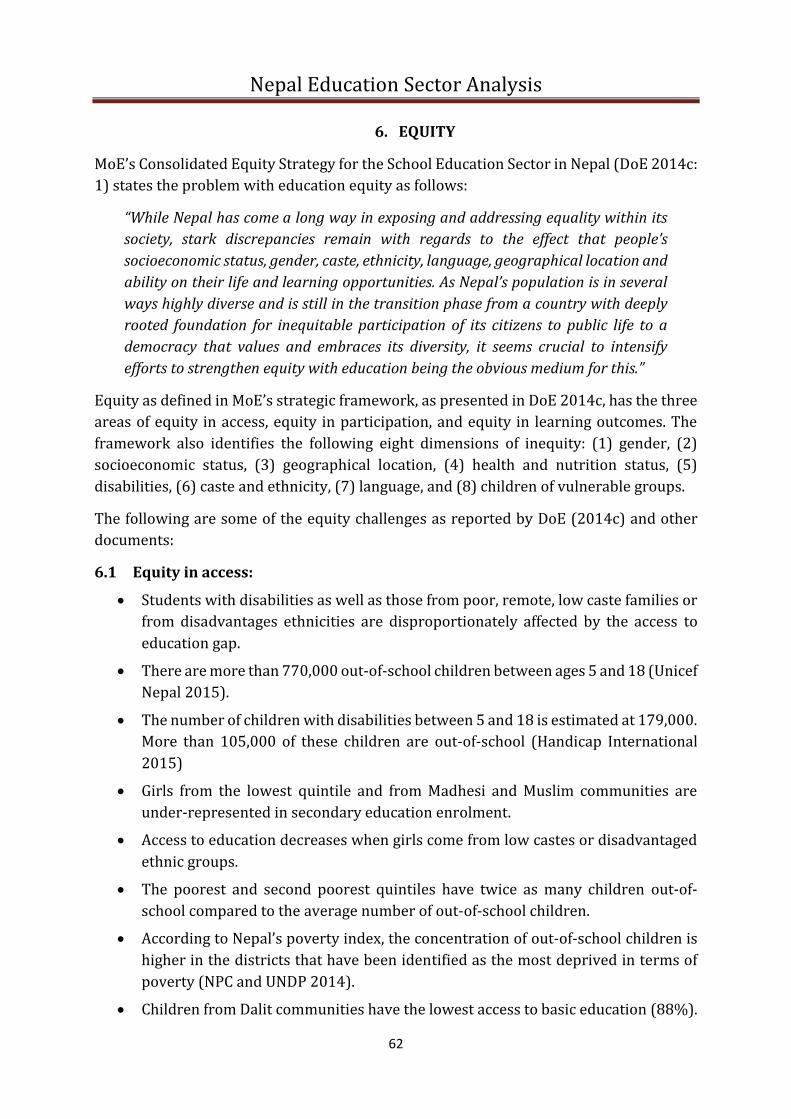
Nepal Education Sector Analysis
62
6. EQUITY
MoE’s Consolidated Equity Strategy for the School Education Sector in Nepal (DoE 2014c:
1) states the problem with education equity as follows:
“While Nepal has come a long way in exposing and addressing equality within its
society, stark discrepancies remain with regards to the effect that people’s
socioeconomic status, gender, caste, ethnicity, language, geographical location and
ability on their life and learning opportunities. As Nepal’s population is in several
ways highly diverse and is still in the transition phase from a country with deeply
rooted foundation for inequitable participation of its citizens to public life to a
democracy that values and embraces its diversity, it seems crucial to intensify
efforts to strengthen equity with education being the obvious medium for this.”
Equity as defined in MoE’s strategic framework, as presented in DoE 2014c, has the three
areas of equity in access, equity in participation, and equity in learning outcomes. The
framework also identifies the following eight dimensions of inequity: (1) gender, (2)
socioeconomic status, (3) geographical location, (4) health and nutrition status, (5)
disabilities, (6) caste and ethnicity, (7) language, and (8) children of vulnerable groups.
The following are some of the equity challenges as reported by DoE (2014c) and other
documents:
6.1 Equity in access:
• Students with disabilities as well as those from poor, remote, low caste families or
from disadvantages ethnicities are disproportionately affected by the access to
education gap.
• There are more than 770,000 out-of-school children between ages 5 and 18 (Unicef
Nepal 2015).
• The number of children with disabilities between 5 and 18 is estimated at 179,000.
More than 105,000 of these children are out-of-school (Handicap International
2015)
• Girls from the lowest quintile and from Madhesi and Muslim communities are
under-represented in secondary education enrolment.
• Access to education decreases when girls come from low castes or disadvantaged
ethnic groups.
• The poorest and second poorest quintiles have twice as many children out-of-
school compared to the average number of out-of-school children.
• According to Nepal’s poverty index, the concentration of out-of-school children is
higher in the districts that have been identified as the most deprived in terms of
poverty (NPC and UNDP 2014).
• Children from Dalit communities have the lowest access to basic education (88%).
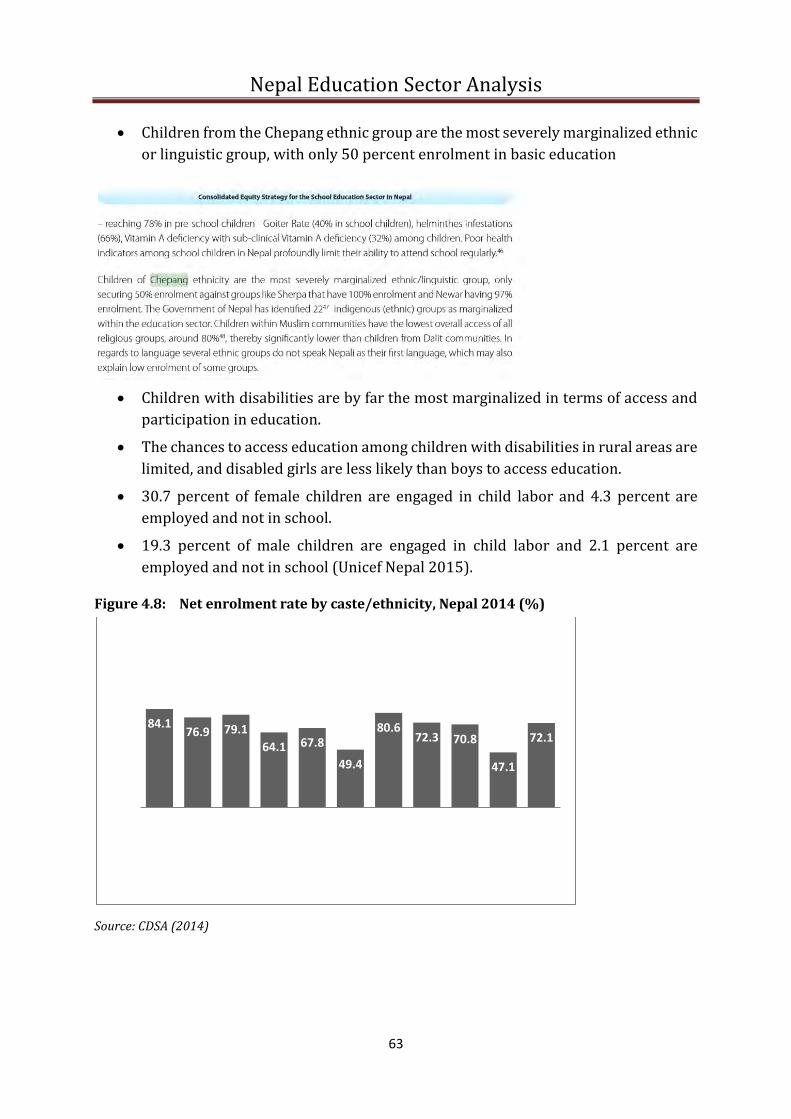
Nepal Education Sector Analysis
63
• Children from the Chepang ethnic group are the most severely marginalized ethnic
or linguistic group, with only 50 percent enrolment in basic education
• Children with disabilities are by far the most marginalized in terms of access and
participation in education.
• The chances to access education among children with disabilities in rural areas are
limited, and disabled girls are less likely than boys to access education.
• 30.7 percent of female children are engaged in child labor and 4.3 percent are
employed and not in school.
• 19.3 percent of male children are engaged in child labor and 2.1 percent are
employed and not in school (Unicef Nepal 2015).
Figure 4.8: Net enrolment rate by caste/ethnicity, Nepal 2014 (%)
Source: CDSA (2014)
84.176.9 79.1
64.1 67.8
49.4
80.672.3 70.8
47.1
72.1
Net enrolment in % by caste/ethnicity

Nepal Education Sector Analysis
64
6.2 Equity in participation
Following are some of the main lingering issues that demonstrate inequity in
participation in Nepal’s education system:
• The high repetition rates in Grade 1 and the low level of transition from basic to
secondary levels, which disproportionately affect marginalized groups.
• While the difference between boys and girls may not seem major in terms of
repetition rates, it is striking that throughout Grades 3, 5, 8, and 9, and with few
exceptions, girls repetition rates are consistently higher than boys’ (see Figure ?).
• In Nepal students go to school for an average of six years, with the richest students
staying for eight years and the poorest leaving after only three years.
• Young women who have never been married remain in school longer than women
who get married at an early age.
• There is a high prevalence of child marriage among Terai ethnic groups.
• The net attendance rate is lowest for households in the poorest and the second
poorest quintiles.
• Poor health indicators profoundly limit children’s ability to attend school
regularly. Diseases such as diarrhea, parasitic worm infections, skin diseases and
trachoma reduce children’s ability to access education.
• Seventy-eight percent of pre-school children have anemia, 40 percent have goiter,
while 66 percent of children have helminths and 32 percent have Vitamin A
deficiency.
• Only resource teachers in integrated schools receive a 45-day mandatory training
in working with children with a specific type of disability (Handicap International
2015).
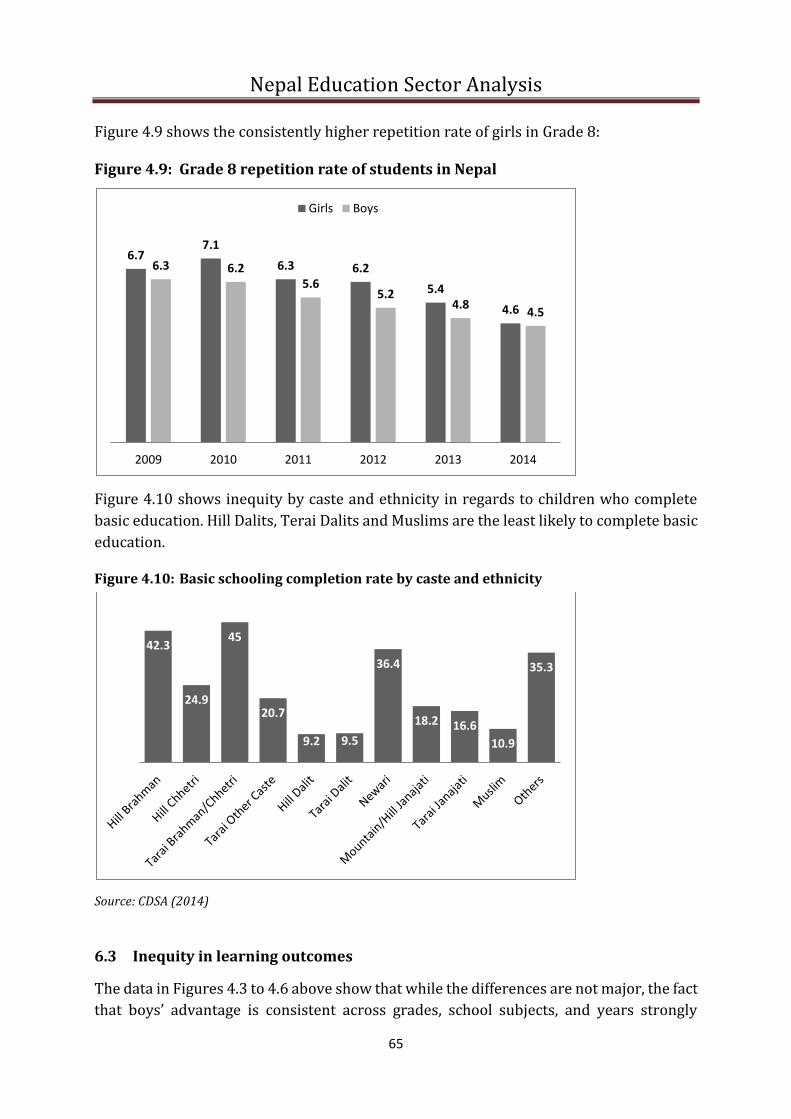
Nepal Education Sector Analysis
65
Figure 4.9 shows the consistently higher repetition rate of girls in Grade 8:
Figure 4.9: Grade 8 repetition rate of students in Nepal
Figure 4.10 shows inequity by caste and ethnicity in regards to children who complete
basic education. Hill Dalits, Terai Dalits and Muslims are the least likely to complete basic
education.
Figure 4.10: Basic schooling completion rate by caste and ethnicity
Source: CDSA (2014)
6.3 Inequity in learning outcomes
The data in Figures 4.3 to 4.6 above show that while the differences are not major, the fact
that boys’ advantage is consistent across grades, school subjects, and years strongly
6.77.1
6.3 6.2
5.4
4.6
6.3 6.25.6
5.24.8
4.5
2009 2010 2011 2012 2013 2014
Girls Boys
42.3
24.9
45
20.7
9.2 9.5
36.4
18.2 16.6
10.9
35.3

Nepal Education Sector Analysis
66
suggests that the opportunities to learn are more favorable to boys than girls. The new
constitution commits that:
“Women shall have the right to special opportunity in the spheres of
education…based on positive discrimination.”
The results indicate that more efforts are needed on advocacy, training, the laws and
regulation to promote a culture that provides equitable opportunities to learn for girls
and boys in their communities, homes, schools, and universities.
Figure 4.11 shows data on adult literacy by caste and ethnicity — another dimension of
inequity in learning outcomes. Only 23.1 percent of Terai Dalits and 35.4 percent of
Muslims are literate, compared to 80 percent of Terai Brahmans. This is consistent with
AASSO 2015 Medium of Instruction and Languages for Education Study which reports
that the NASA results for Grade 8 (2013) for the Nepali language were lower than
international standards for equivalent national languages. The scores were even lower for
children who did not use Nepali as their home language. Similar results were confirmed
when conducting the early grade reading assessment (EGRA).
Figure 4.11: Adult literacy % by caste and ethnicity
Source: CDSA (2014)
In summary, inequity has serious moral, ethical, and political implications. Lack of equity
jeopardizes the sense of belonging to a community or the whole nation because it strips a
sub-set of the population from its constitutionally protected rights of quality education.
In the first chapter, we argued that building a cohesive society is a post-conflict
imperative. When a segment of the society does not receive equitable attention in
education, the country is not only losing human potential, but it risks the alienation of
bitter and disenfranchised individuals whose marginalization represents a lasting threat
to the nation’s peace and cohesion.
78.5
66.4
80
4551.8
23.1
76.5
61.554.1
35.4
78

Nepal Education Sector Analysis
67
6.4 Efficiency
MoE and UNESCO (2015) says that while Nepal has steadily improved the efficiency of its
educational system, efficiency is still a challenge. This section discusses the internal and
external dimension of education inefficiency in Nepal.
6.4.1 Internal inefficiency
The EFA National Plan of Action (NPA) targeted an 80% efficiency rate by 2015 in Nepal’s
education system. Survival rates to Grade 5 for primary education and transition rates to
upper levels of education, i.e. from primary to lower secondary, lower secondary to
secondary and secondary to higher secondary, are still low, and overall the internal
efficiency of the school education system is low. Khare and Slaney (2011) reported that in
2008 only 43 percent of students attained the primary education level, 32.6 percent
attained secondary education level and 3.7 percent attained a university degree.
Table 4.4 presents the results of efficiency indicators reported by MoE in 2012. Available
data indicates that the survival rates, coefficient of internal efficiency, and cohort
graduation rates may fall short of meeting the EFA National Plan for Action targets. The
efficiency indicators are better for primary education than lower secondary where only
69.5 percent of students who survived through Grade 5 reach Grade 8. This is consistent
with the cohort completion rate where only 58.8 percent of the students who begin
primary school end up graduating from Grade 8.
Table 4.4: Efficiency indicators for Nepal’s public school system
Grade 5 Grade 8
Survival rates Girls 84.3 69.5
Boys 81.7 66.2
Total 82.8 67.5
EFA national plan survival rate target for Grade 5 90%
Coefficient of internal efficiency Primary Lower secondary
Girls 74.9 67.1
Boys 74.8 66
Total 75.2 66.5
The EFA national plan target efficiency rate by 2015 80%
Cohort graduation rates Girls 75.8 60.2
Boys 72.6 57.7
Total 73.6 58.8
The EFA national plan target completion rate by
2015
100% 100% (Grade 8)
Source: MoE (2012), and MoE and UNESCO (2015)
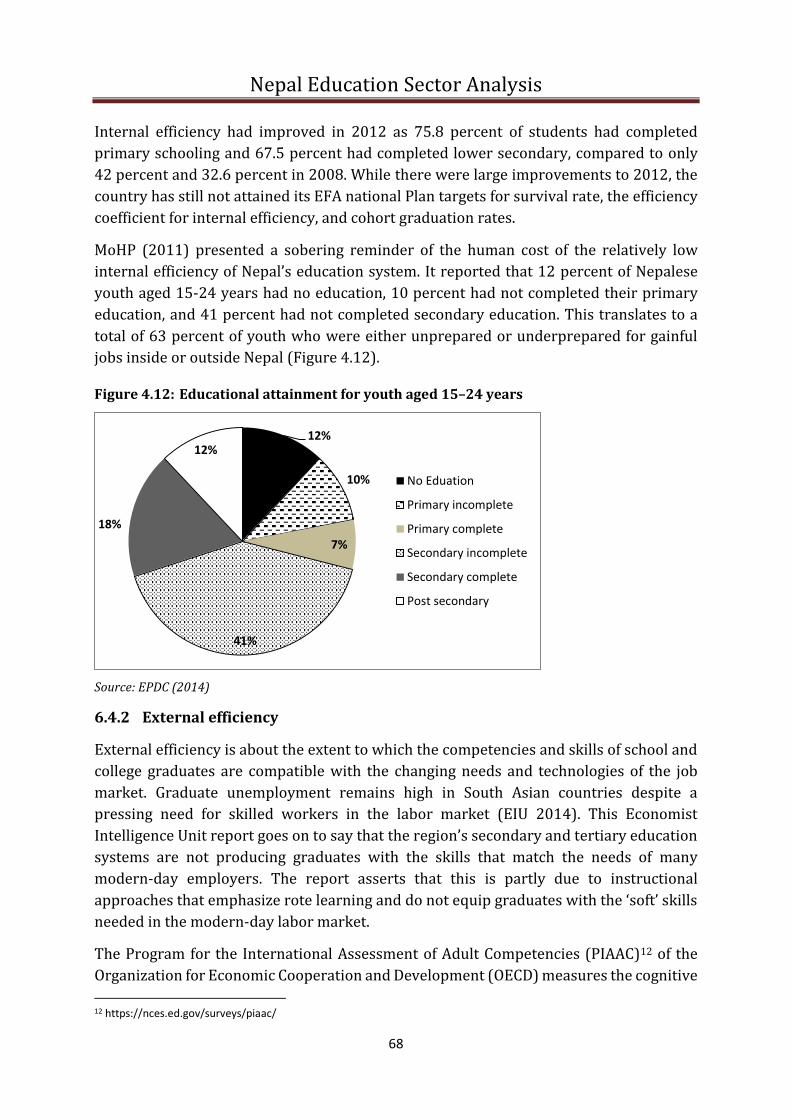
Nepal Education Sector Analysis
68
Internal efficiency had improved in 2012 as 75.8 percent of students had completed
primary schooling and 67.5 percent had completed lower secondary, compared to only
42 percent and 32.6 percent in 2008. While there were large improvements to 2012, the
country has still not attained its EFA national Plan targets for survival rate, the efficiency
coefficient for internal efficiency, and cohort graduation rates.
MoHP (2011) presented a sobering reminder of the human cost of the relatively low
internal efficiency of Nepal’s education system. It reported that 12 percent of Nepalese
youth aged 15-24 years had no education, 10 percent had not completed their primary
education, and 41 percent had not completed secondary education. This translates to a
total of 63 percent of youth who were either unprepared or underprepared for gainful
jobs inside or outside Nepal (Figure 4.12).
Figure 4.12: Educational attainment for youth aged 15–24 years
Source: EPDC (2014)
6.4.2 External efficiency
External efficiency is about the extent to which the competencies and skills of school and
college graduates are compatible with the changing needs and technologies of the job
market. Graduate unemployment remains high in South Asian countries despite a
pressing need for skilled workers in the labor market (EIU 2014). This Economist
Intelligence Unit report goes on to say that the region’s secondary and tertiary education
systems are not producing graduates with the skills that match the needs of many
modern-day employers. The report asserts that this is partly due to instructional
approaches that emphasize rote learning and do not equip graduates with the ‘soft’ skills
needed in the modern-day labor market.
The Program for the International Assessment of Adult Competencies (PIAAC)12 of the
Organization for Economic Cooperation and Development (OECD) measures the cognitive
12 https://nces.ed.gov/surveys/piaac/
12%
10%
7%
41%
18%
12%
No Eduation
Primary incomplete
Primary complete
Secondary incomplete
Secondary complete
Post secondary

Nepal Education Sector Analysis
69
and workplace skills needed for successful participation in the 21st century society and
the global economy. Under the domains of literacy, numeracy, and problem solving, PIAAC
assesses educational background, workplace experience and skills, occupational
attainment, use of information and communications technology, and cognitive skills.
Between 2000 and 2011, Nepal increased its public budget for higher education from NPR
1.68 billion ($16.9m) to NPR 4.6 billion ($46.4m) and managed to more than double the
percentage of its secondary school graduate enrolled in higher education (Figure 4.13).
Nepal, like its neighboring South Asian countries, has witnessed a significant growth of its
service sector between 15 and 20 percentage points Noland et al. (2012). The growth in
the labor market has not, however, been accompanied with a growth in employment.
According to EIU (2014: 10), university graduate unemployment is estimated at more
than 20%.
Figure 4.13: Percentage of secondary graduates who enroll in higher education
Source: EIU (2014)
Unemployment in Nepal is defined as the share of the labor force that is without work but
available for and seeking employment (Index Mundi 2016). Note that this definition does
not encompass workers who are skilled but working in different jobs, or working part-
time and would prefer to work full-time. Table 4.5 and Figure 4.14 provide a more
detailed picture of unemployment and underutilized labor that also has implications to
the efforts needed to improve education external efficiency.
Nepal 13th Three Year Plan for 2014–2016 identifies three key growth sectors, tourism,
infrastructure, and hydroelectricity. Describing the disconnect between the course and
curriculum offered in schools and the employment market, EIU (2014) quotes Dr.
Bhawani Shankar Subedi, the Executive Director of the Training Institute for Technical
Instruction, who explains that sectors such as tourism, hotel management and banking
services have “tremendous scope for expansion and growth” but, there are few degree
programs offered to fill them.
1.3
5.7
11.2
6.4
3.33.7
13.2
23.2
14.5
8.3
14.4
Afghanistan Bangladesh India Nepal Pakistan Sri Lanka
2004 2011

Nepal Education Sector Analysis
70
Table 4.5: Breakdown of youth (age 15–29 years) under-utilization in Nepal’s labor market (%)
Unemployment Time related unemployment
Inadequate earnings
Skills mismatch
Total underused
Nepal 3.6 7.2 8.8 20.4 40
Male 4.2 8.3 12.8 24.1 49.4
Female 3.1 6.4 5.8 17.6 33
Urban 12.6 6.8 13.6 30.2 63.3
Rural 2.1 7.3 8 18.8 36.3
Source: UN 2016
Figure 4.14: Unemployment in Nepal by level of education, 2010–2011
Source: World Bank (2015)
It is estimated that about one third of Nepal’s population benefit from remittances from
abroad (CBS 2014). These remittances accounted for 15.5 to 25% of Nepal’s GDP.
However, Nepalese workers have a low per capita rate of earning. According to World
Bank data, Indian workers earn approx. $5.5 per unit of labor while Nepalese workers
earn only $3.5 per unit of labor (EIU 2013). CBS (2014) identified low levels of skills, and
hence low salaries and poor professional development as major contributing factors to
the low average low earnings of Nepalese workers.
In 2010, around 40 percent of Nepal’s labor force had no education, around 30 percent
had completed primary education, and roughly 28 percent had completed secondary
education. In 2030, EIU (2014) projects that less than 20 percent of Nepal’s labor force

Nepal Education Sector Analysis
71
will have no education, primary school education attainment will be more than 20
percent, 55 percent of the labor force will complete secondary school, and 5 percent will
have a tertiary education degree.
Measures to improve external efficiency thus must start as early as primary education.
And given the projected 20 percent of laborers without education, career readiness
through TVET, non-formal education and lifelong learning need to be prioritized to
maximize the productivity of Nepal’s labor force and thus improve the external efficiency
of Nepal’s education system.
6.5 Impact of Education: The Large Untapped Potential
Education has many social and economic benefits (see Table 4.6).
Table 4.6: The social and economic benefits of education
Economic Social
Public Private Public Private
Increased tax revenues Higher salaries and
benefits
Reduced crime rates Improved health and
life expectancy
Greater productivity Employment Increased charitable
giving and community
service
Improved quality of life
for offspring
Increased consumption Higher savings levels Increased quality of
civic life
Better consumer
decision making
Increased workforce
flexibility
Improved working
conditions
Social cohesion and
appreciation of
diversity
Increased personal
status
Decreased reliance on
government financial
support
Improved personal and
professional mobility
Improved ability to
adapt and to use
technology
More hobbies and
leisure activities
Source: Forest and Altback (1998)
The economic impact carried out for this sector analysis principally gauged the private
economic gains as they apply to salaries and employment. For the social benefits, this
analysis presents the literature on the effect of education on health and life expectancy,
the improved ability to adapt to and use technology, and social cohesion.
6.5.1 Economic impacts
A team of economists working on behalf of the Government of Nepal and the Millennium
Challenge Corporation (MCC) conducted a study of the main constraints to economic
growth in Nepal (MCC and GoN 2014). Using data from the 2010-2011 Nepal Living
Standards Survey (CBS 2011b) it was calculated that for Nepal one additional year of
schooling would lead to a 13 percent increase in GDP per capita. Compared to a 2006
estimate, which had calculated that the return on an additional year of school was a 6
Nepal Education Sector Analysis
72
percent increase in GDP per capita, analysis of the 2010-2011 data represents a 7-
percentage point gain in five years.
According to MCC and GoN (2014), between 1996 and 2011, the marginal return to
primary education has increased from 6% to 14%. It has also increased from 4% to 10%
in secondary education. However, the marginal return to tertiary education has remained
the same. The stagnant marginal return for tertiary education is consistent with the
higher unemployment and under-employment levels among university graduates. This,
as noted under the write-up on external inefficiency above, is due to the mismatch
between university training and the different competencies and skills needed in the labor
market, and to the limited gainful (high added value) job opportunities.
In summary, MCC and GoN (2014) demonstrates that the return to primary and secondary
education is worth the cost it incurs. The 70 percent of youths aged between 15 and 24
years who have not attained secondary education represent a great reservoir of untapped
potential that the government and its partners need to reach with programs of non-formal
education, lifelong learning, and TVET to boost the country’s economic growth.
About tertiary education, the smaller marginal benefits are an indicator that the skills and
competencies of Nepali university graduates need to be retooled to respond to twenty
first century enterprises both within Nepal and abroad. According to EIU (2014), this is
contingent on a partnership between policy makers, universities, and employers that
improve the quality and relevance of university education and the links between work
and school that promote college and career readiness as early as primary school.
6.5.2 The social impacts of education
Reporting on success factors for women’s and children’s health in Nepal, the World Health
Organization, (WHO 2015) reports that women’s educational status has been inversely
linked with maternal and neonatal mortality in Nepal. The same report notes that
between 1996 and 2011, the proportion of women with no education reduced by 50
percent, and that the female literacy rate for the population aged 15 and above tripled by
2011. Women became more empowered and more aware of their health thus. Finally, the
report points to clear evidence that the percentage of women aged 15–19 years who did
not marry rose to 71 percent of their population in 2011. Key informant interviews
indicate that education has led to changes in attitudes about early marriage and teenage
pregnancy. Finally, the report cites women’s education through literacy programs as a
contributing factor for reducing neonatal mortality. Similar findings were reported by
Ghimire and Samuels (2014) finding that positive changes in higher education enrolment
coupled with the increasing age of marriage have had positive impact on girls’ access to
education. The report also found that strong female role models inspire young adolescent
girls who look upon them as agents of change.
Jamison and Moock (1984) found a positive effect of education on efficiency for the
cultivation of three major crops. The efficiency here refers to (1) the increased output per

Nepal Education Sector Analysis
73
change in education, (2) ability to acquire and process information about the cost and
productive characteristics of other inputs, and (3) the willingness of individuals to adopt
profitable new technologies. Calculations from the results suggest that a one-standard
deviation improvement in the numeracy test score had a present value in efficiency gains
in farming that was high relative to the probable cost of effecting such an improvement.
Education and improved civic engagement is another instance of social benefits that
would be highly valued in Nepal. The French philosopher Pierre Bourdieu used the
concept of symbolic violence to refer to the tacit and almost unconscious forms of cultural
and social domination often intended to reinforce existing hierarchical structures of
ruling and dominated classes. He designated education as one socialization institution
that serves to perpetrate symbolic violence by reproducing the same social norms
governing gender, socioeconomic status, caste, religion, geographical area, and disability.
In other words, education is often a potent vehicle for socializing individuals to know and
accept their places in society. In this regard, education can be as much a tool for inclusion
as it is for division and exclusion.
The little anecdotal evidence about the role of education in peace building in Nepal is from
a Unicef Nepal case study on the role of education in peace building (Vaux 2011). The
study showcases the peace building role of schools as zones of peace (SZOP) as an example
of the potential of schools to reduce violence in times of conflict. Another manifestation
of the impact of education on civic engagement is Nepal’s civil society. Dahal (2001)
argues that the “third wave” of democracy in the 1980s sparked a global associational
revolution. He also argued that to support democracy in Nepal, education has a decisive
role to play in encouraging political participation and strengthening power and influence
of citizens in national and local governance. Bîrzéa (2000) further expands the concept of
the civic engagement potential of education to encompass the cultivation of experiential
learning, collaborative learning, intercultural learning, action learning, and contextual
learning. Bîrzéa argues that learning to live together in a diverse society necessitates an
education system where students have the space to learn by doing (experiential), to learn
from and with each other (collaborative), acquire the ability to empathize with other
cultures (intercultural), encourage learners to understand their own actions through
reflection (action learning), and foster a global vision of themselves and their societies
that is rooted in understanding their values and identities (contextual learning).
The fact that civil society is vibrant in Nepal is a testimony to the social impact of
education. It remains to be seen, however, that the education received is fostering unity,
pluralism, and cohesion through the five dimensions of citizenship learning listed by
Bîrzéa.
Finally, Nepal experienced armed conflict from 1996 to 2006. It is currently going through
a difficult political transition to reinvent itself as a multiparty democracy that is
committed to ending all forms of discrimination and oppression created by the previous
feudal, autocratic, centralized and unitary system. Political activism in the country is rich

Nepal Education Sector Analysis
74
and vibrant, but can also be highly contentious and divisive. When this results in political
gridlock and unrest, it can turn into moving sands that jeopardize the country’s stability
and ability to provide basic services to its citizens. It is important to note in this regard,
that at the time of the preparation of this sector analysis, the country has been
experiencing the fourth month of an economic blockade that threatens to reverse the
socioeconomic gains made after the end of the decade long conflict. In this regard, civic
education is critical because it teaches individuals the rights and obligations inherent in
being a citizen or a resident in a sovereign country. It is, therefore, fair to claim that
students who are raised to understand what it means to be a citizen, to live in a
democracy, to treat people equally, to be accountable, to demand transparency, and to
uphold the rule of law are more likely to promote social cohesion than those who don’t. A
diverse, pluralistic, and unified Nepal is, undoubtedly, a social benefit all policy makers,
educators, and students should strive to achieve.
6.6 Cross cutting issues underlying problems with access, quality, equity, and
efficiency
Many of the cross-cutting issues affecting access, quality, equity, and efficiency are
captured by the questions posed in Koirala (n.d.). Inquiring about who to hold accountable
for the quality of education quality, Dr. Koirala framed the questions as follows:
“Here comes the question of accountability for quality education: is this the
business of the teachers? Is this the absence of monitoring from the immediate
supervisor? Is this the professional colleague? Is this the incompetent
School/College graduates who have been involved in teaching business? Is this the
parents who seek the betterment of their children? Is this the SMC/PTA members
who are supposed to improve school system? Is this the employer who hired the low-
quality graduate’s teachers? Is this the university/college/school who certified such
candidates as successful? Is this the local community elites who are obliged to take
care of the education of the children in their catchments? Is this the head
teacher/principal who is supposed to mobilize the human, money, and material
resources? Is this the rules and regulation providing agencies? Is this the evaluating
agency (ies)?” (Koirala n.d.: 9)
The short answer to the question is that all the above contribute to the problem and can
contribute to the solution; but the magnitude of their respective responsibilities varies
depending on their power, influence and engagement, or lack thereof.
MoE and UNESCO (2015) attributes some of the problems of access, equity, quality, and
efficiency to the low literacy levels of parents in rural areas, low awareness among
parents, and lack of capacity in school management committees and parent teacher
associations to implement appropriate interventions. MoE (2015a) described system
factors and factors related to teaching and learning contributing to problems in access,
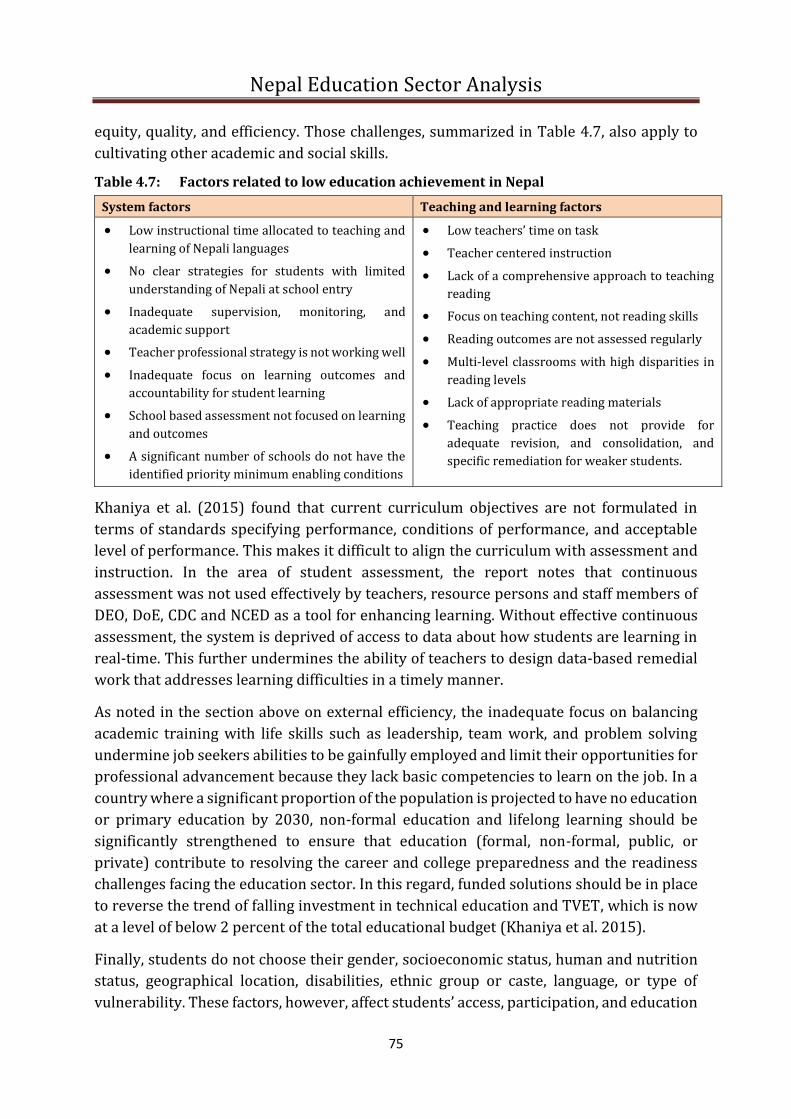
Nepal Education Sector Analysis
75
equity, quality, and efficiency. Those challenges, summarized in Table 4.7, also apply to
cultivating other academic and social skills.
Table 4.7: Factors related to low education achievement in Nepal
System factors Teaching and learning factors
• Low instructional time allocated to teaching and
learning of Nepali languages
• No clear strategies for students with limited
understanding of Nepali at school entry
• Inadequate supervision, monitoring, and
academic support
• Teacher professional strategy is not working well
• Inadequate focus on learning outcomes and
accountability for student learning
• School based assessment not focused on learning
and outcomes
• A significant number of schools do not have the
identified priority minimum enabling conditions
• Low teachers’ time on task
• Teacher centered instruction
• Lack of a comprehensive approach to teaching
reading
• Focus on teaching content, not reading skills
• Reading outcomes are not assessed regularly
• Multi-level classrooms with high disparities in
reading levels
• Lack of appropriate reading materials
• Teaching practice does not provide for
adequate revision, and consolidation, and
specific remediation for weaker students.
Khaniya et al. (2015) found that current curriculum objectives are not formulated in
terms of standards specifying performance, conditions of performance, and acceptable
level of performance. This makes it difficult to align the curriculum with assessment and
instruction. In the area of student assessment, the report notes that continuous
assessment was not used effectively by teachers, resource persons and staff members of
DEO, DoE, CDC and NCED as a tool for enhancing learning. Without effective continuous
assessment, the system is deprived of access to data about how students are learning in
real-time. This further undermines the ability of teachers to design data-based remedial
work that addresses learning difficulties in a timely manner.
As noted in the section above on external efficiency, the inadequate focus on balancing
academic training with life skills such as leadership, team work, and problem solving
undermine job seekers abilities to be gainfully employed and limit their opportunities for
professional advancement because they lack basic competencies to learn on the job. In a
country where a significant proportion of the population is projected to have no education
or primary education by 2030, non-formal education and lifelong learning should be
significantly strengthened to ensure that education (formal, non-formal, public, or
private) contribute to resolving the career and college preparedness and the readiness
challenges facing the education sector. In this regard, funded solutions should be in place
to reverse the trend of falling investment in technical education and TVET, which is now
at a level of below 2 percent of the total educational budget (Khaniya et al. 2015).
Finally, students do not choose their gender, socioeconomic status, human and nutrition
status, geographical location, disabilities, ethnic group or caste, language, or type of
vulnerability. These factors, however, affect students’ access, participation, and education
Nepal Education Sector Analysis
76
outcomes. The education sector has a legal, ethical, and moral responsibility to ensure
that these conditions do not impede students’ opportunities to learn, thrive, and improve
their human and social condition. The equity lens must, therefore, be front and center in
SSDP to break the cycle of vulnerability and marginalization and ensure that the diverse
inhabitants of Nepal enjoy their full citizenship rights, and contribute in their turn to
creating a more cohesive and prosperous society. There is no doubt that the intentions to
achieve access, equity, quality, and efficiency goals are positive. The question to pose is
the extent to which the existing system has the capacity to achieve results that reflect
positive intensions.

Nepal Education Sector Analysis
77
7. READINESS FOR EDUCATION REFORM
Nepal’s public education system has accumulated a wealth of experience, expertise, and
institutional knowledge. There have been great accomplishments in expanding access to
education largely due to the efforts and resourcefulness of teachers, school
administrators, and regional and central offices, often acting with limited resources. This
system is analyzed here to figure out how to better support teachers and administrative
staff to execute reforms. Many of the system’s leaders share the realization of the need for
reform. They must improve school sector effectiveness under the new federal structure.
Nepal is going through a transition with many voices demanding political, macro-
economic, and social change. The need is to decide on a direction to meet the multiple
demands of its citizens. The new direction will likely entail deep changes that may be
difficult to sell as they do not seem to immediately fix pressing problems. In this regard,
the challenge is to make a compelling case about prioritization that immediately
addresses urgent problems, and produces a long-term plan for addressing structural and
cultural issues. An important exercise in informing prioritization is to assess if it is
possible to carry out needed changes. This is what this chapter is about.
At the systems level, factors contributing to student performance are interrelated. Barber
and Mourshed (2009) summarized world class-education in terms of 12 building blocks
(Figure 5.1). This shows that high quality human capital alone will not improve an
education system. Of equal importance to improving student performance are the quality
of standards and system accountability, and the support provided by organizational
structures. In this chapter, we discuss readiness for education reform from two angles:
• the extent to which the policy framework provides needed legal backing for SSDP;
and
• the extent to which the current system has the capacity quality standards,
functional systems of accountability, effective human capital, and a result-focused
structure and organization to support the implementation of SSDP. (This question
is discussed under ‘system readiness’.)

Nepal Education Sector Analysis
78
Figure 5.1: The building blocks of world-class education
7.1 Policy Framework
Nepal’s new constitution, the current Three Year National Development Plan, the
Education Act, and the School Sector Reform Plan encapsulate the mission, goals,
strategies, culture, and national appetite for investing in education reform. The following
write-ups examine the extent to which these documents support a shared vision for
further developing Nepal’s education sector.
7.1.1 Nepal Constitution
Nepal promulgated its new constitution on 20 September 2015. The new law of the land
defines the State of Nepal as an “independent, indivisible, sovereign, secular, inclusive,
democratic, socialism-oriented federal democratic republican state.” (p.1). It enshrines
education as a right in articles 31, 38, 39, 40, and 42 (see Box 5.1). It highlights the basic
right to education with special references to the rights of women, children and persons
with disabilities.
The constitution provides special rights for Dalits. Article 40 says that Dalit students shall
be provided with free education through scholarships from primary to higher education.
It also has a provision to enable Dalits to pursue higher education in technical and
professional subjects.
Article 42 provides for special opportunity and facilities to be provided to citizens who
are very poor and for whose communities are on the verge of extinction. Other
Standards and accountability
Human capitalStructure and organization
Globally benchmarked standards
Recruit great people and train them well
Effective, enabling central department and
agencies
Good, transparent data
Continuous improvement of
pedagogical skills and knolwedge
Operational responsibility and
budgets significantly devolved to school level
Every child on the agenda in order to
challenge inequality
Great leadership at school level
Capacity to manage change and engage
communities at every level

Nepal Education Sector Analysis
79
populations identified by the constitution as special groups that shall be prioritized for
access to education are the families of martyrs, families of those who disappeared in the
conflict, persons who fought for democracy, victims of conflict, and displaced persons.
Box 5.1: Rights to education in Nepal’s constitution, 2015
31. Right to education:
(1) Every citizen shall have the right to access to basic education. (2) Every citizen shall have the right to compulsory and free basic education, and free education up to secondary level. (3) The physically impaired and citizens who are financially poor shall have the right to free higher education as provided for in law. (4) Visually impaired persons shall have the right to free education with the medium of brail script. (5) Every Nepali community living in Nepal shall have the right to acquire education in its mother tongue up to the secondary level, and the right to open and run schools and educational institutions as provided for by law.
38. Rights of women:
(5) Women shall have the right to special opportunity in the spheres of education, health, employment and social security based on positive discrimination.
39. Rights of children:
(2) Every child shall have the right to education, health care nurturing, appropriate upbringing, sports, recreation and overall personality development from family and the State. (3) Every child shall have the right to formative child development, and child participation.
The constitution describes the following policies to be implemented to fulfil the basic
educational needs of citizens as follows:
• Make education scientific, technical, professional, skill-oriented, and employment
and people-oriented to prepare human resources that are competent, competitive,
moral, and committed to national interest.
• Increase the investment of the State in the educational sector, and regulate and
manage the private sector investment in it to make education service oriented.
• Make higher education easily available, high quality and accessible, and gradually
make it free.
• Establish and promote information centers and libraries for the personality
development of citizens.
The following social justice and inclusion policies of the constitution is tied to education:
“(7) [Provide] appropriate opportunities to youths for their contribution to the all-
round-development of the State by increasing their participation in it, through the
creation of an atmosphere for them to use their political, economic, social and
cultural rights, and by providing special opportunities in educational, health and
employment sector through their personality development for their empowerment
and all-round-development.”
Nepal Education Sector Analysis
80
The new constitution thus establishes a clear and compelling vision about a right based
education system that serves the national and human development goals of the country.
It also represents a watershed in education delivery in Nepal because it institutionalizes
the transition from a unitary system of education delivery to a federal system. The
provisions, however, are only as real as the laws and policies that enforce them. This is
discussed follow.
7.1.2 National Development Plan
Education reform should be integrated within the broader vision of national
development. Nepal’s national development plans represent the cross-sectoral road maps
to meet the overarching development goals. However, education is not one of the five
priorities of the 13th National Development Plan (2014/15 to 2016/17) (Box 5.2).
Education, together with health, and the other Millennium Development Goals seems to
compete for space under the priority area of social services and social protection. Related
to this the website of the National Planning Commission1314 sets seven goals of:
• rebuilding a resilient nation
• entrepreneurial farmers and productive farms
• gender equality with conscious empowered women
• policy reform for growth take off
• nurturing nature to harness its riches
• connecting communities with markets
• building infrastructure and creating jobs.
Equitable access to quality education is a prerequisite for the achievement of the above
seven goals. However, it is not explicitly given as a national priority.
The fact that education is not given as a national development priority highlights what
may be a mismatch between what education reform architects and other government
decision makers believe is most urgent. This, in turn, is perhaps rooted in an
organizational mismatch in perceptions of:
• the need for education reform;
• the fit with other sector-specific programs (infrastructure, agriculture, tourism,
health, social protection and social services, and governance and public financial
management);
• needed and available resources;
• evidence to support the urgency of education reform;
13 http://www.npc.gov.np/en
14 The NPC is the apex advisory body of the Government of Nepal for formulating a national vision, periodic plans and
policies for development.

Nepal Education Sector Analysis
81
• the readiness to work across sectors to support educational improvement; and
• the capacity of government leadership to synergize all its programs so they are
mutually supportive, and converge to achieve the overarching national
development goals.
Box 5.2: Nepal’s Three-Year Plan
The objective of Nepal’s current Three-Year Plan (FY 2014–FY 2016) is to achieve sustainable, broad-
based, inclusive economic growth. It has five priority areas.
1. Infrastructure
Develop energy, transport, and urban services infrastructure as a means to underpin growth and
inclusion. Large sections of the population lack access to services and economic opportunities:
i) Energy. Nepal lacks energy security in both its rural and urban areas. The plan calls for a build-up of
electricity generation capacity, mainly through storage dam hydropower and renewable energy
schemes, as well as expansion of transmission and distribution systems. A rural electrification
program is a priority and based on renewable sources (solar, wind, and hybrids) and mini run-of the
river hydro plants. Nepal also intends to become an exporter of hydroelectricity, with India as the
initial target market. This effort is being conducted under the South Asia Sub-regional Economic
Cooperation program.
ii) Transport. The plan aims to expand the strategic and rural road networks and air transport capacity
to increase connectivity, provide greater access to basic services and markets, and promote tourism
and trade. The South Asia Sub-regional Economic Cooperation program will be the platform for
strengthening cross-border connectivity, an effort matched by work on trade facilitation, including
customs modernization.
iii) Urban services. The plan aims to improve such basic services as water supply, wastewater
management, and urban transport in large, medium, and small urban centers. Water and sanitation
quality and service levels are poor. Several projects will be given priority, including the completion
of the Melamchi Water Supply Project to address the water shortage in Kathmandu Valley).
2. Agriculture
Increase agricultural productivity and transformation. Productivity is affected mainly by poor water
management and incomplete irrigation systems. It is also affected by ineffective input supply
arrangements and low quality extension services, limited processing, and high post-harvest losses. The
plan envisages investments in rural roads, water management, and reforms around input supply and
extension.
3. Tourism
Modernize infrastructure (airports) and create conditions for private sector investment. The latter
efforts will include improvements in governance and public financial management (PFM). The sector
needs more and better-skilled workers, especially from the young entering the labor market.
4. Social Services and Social Protection
Invest in health, education, and skills. The plan also includes gender actions to improve equality. Other
activities will focus on improving the indicators in areas under the Millennium Development Goals where
Nepal lags behind the rest of the region. A food and employment program will also be put in place.
5. Governance and Public Financial Management
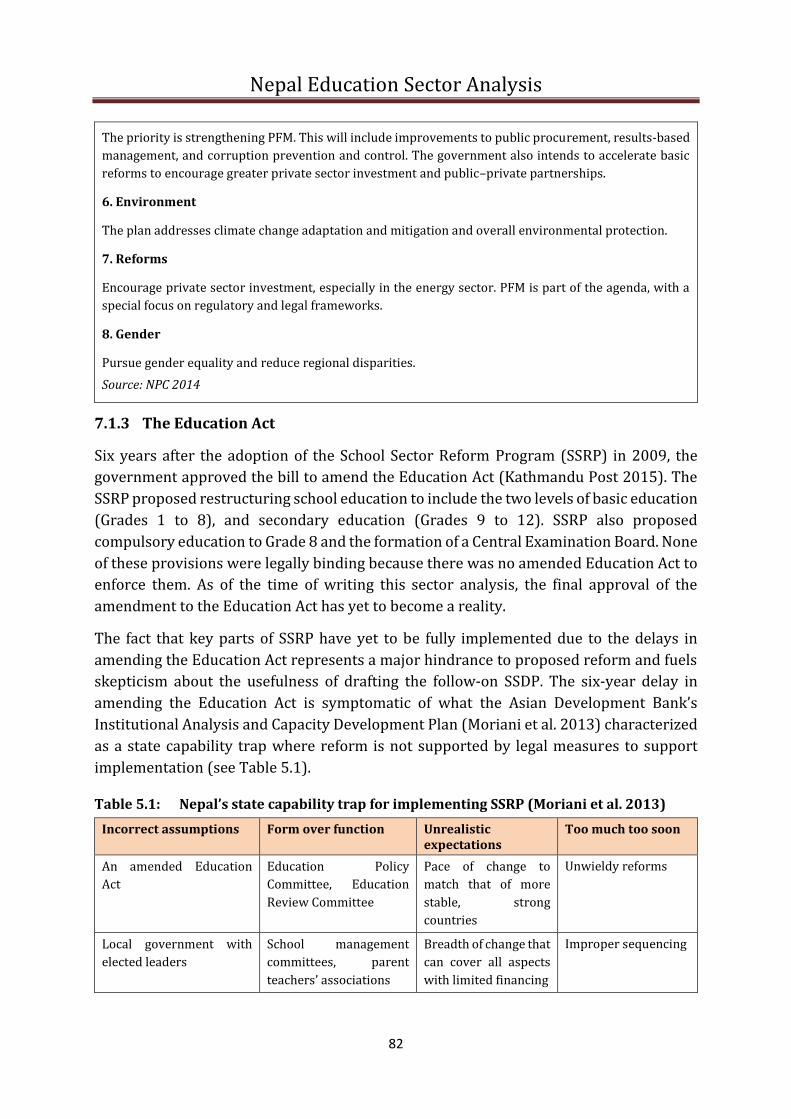
Nepal Education Sector Analysis
82
The priority is strengthening PFM. This will include improvements to public procurement, results-based
management, and corruption prevention and control. The government also intends to accelerate basic
reforms to encourage greater private sector investment and public–private partnerships.
6. Environment
The plan addresses climate change adaptation and mitigation and overall environmental protection.
7. Reforms
Encourage private sector investment, especially in the energy sector. PFM is part of the agenda, with a
special focus on regulatory and legal frameworks.
8. Gender
Pursue gender equality and reduce regional disparities.
Source: NPC 2014
7.1.3 The Education Act
Six years after the adoption of the School Sector Reform Program (SSRP) in 2009, the
government approved the bill to amend the Education Act (Kathmandu Post 2015). The
SSRP proposed restructuring school education to include the two levels of basic education
(Grades 1 to 8), and secondary education (Grades 9 to 12). SSRP also proposed
compulsory education to Grade 8 and the formation of a Central Examination Board. None
of these provisions were legally binding because there was no amended Education Act to
enforce them. As of the time of writing this sector analysis, the final approval of the
amendment to the Education Act has yet to become a reality.
The fact that key parts of SSRP have yet to be fully implemented due to the delays in
amending the Education Act represents a major hindrance to proposed reform and fuels
skepticism about the usefulness of drafting the follow-on SSDP. The six-year delay in
amending the Education Act is symptomatic of what the Asian Development Bank’s
Institutional Analysis and Capacity Development Plan (Moriani et al. 2013) characterized
as a state capability trap where reform is not supported by legal measures to support
implementation (see Table 5.1).
Table 5.1: Nepal’s state capability trap for implementing SSRP (Moriani et al. 2013)
Incorrect assumptions Form over function Unrealistic expectations
Too much too soon
An amended Education
Act
Education Policy
Committee, Education
Review Committee
Pace of change to
match that of more
stable, strong
countries
Unwieldy reforms
Local government with
elected leaders
School management
committees, parent
teachers’ associations
Breadth of change that
can cover all aspects
with limited financing
Improper sequencing

Nepal Education Sector Analysis
83
High bureaucratic
efficiency
Social and financial
audits
Inadequate financing
for critical elements.
A shared vision
The School Sector Reform Program (SSRP, 2009–2016) is the latest of a series of national
education programs implemented by the Government of Nepal since the 1990s — Basic
Primary Education Projects I and II (1992-1998 and 1999-2004), Community School
Support Program (CSSP, 2003–2008), Secondary Education Support Program (SESP,
2003-2009), and Education for All (EFA, 2004, 2009).
Landmark reforms pursued include:
• the devolution of decision making powers to communities and school
management;
• the expansion of demand-side intervention schemes to bring children from
marginalized groups to schools through per student financing and scholarships;
• the decentralization of teacher hiring through the provision of teacher salary
grants;
• opening the textbook printing and distribution system to the private sector in
selected regions in Nepal; and
• focusing support from development partners on a set of coherent and common
education objectives.
We began this sector analysis report by noting that Nepal is currently at a crossroads
marked by post-earthquake reconstruction, the rollout of the federal system established
under the new constitution, the transition to the Sustainable Development Goals, and a
national goal to graduate from least developed country status by 2022. When the process
of designing SSRP implementation began in 2009, the country was also at a crossroads. A
comprehensive peace agreement had recently been signed, a new Constituent Assembly
had been elected in 2008, the country was declared a Federal Democratic Republic, and
the monarchy abolished. SSRP represented the educational roadmap for (1) expanding
access and equity, (2) improving quality and relevance, and (3) strengthening the
institutional capacity of the entire school system. Some notable reforms under SSRP
include (1) organizing school education into basic (1-8) and secondary levels (9-12); (2)
resetting the minimum qualifications of teachers; (3) revising the curriculum for the
integrated secondary education, and (4) revising the examination system to reflect the
proposed new basic secondary education structure. Unfortunately, none of these reforms
have materialized because the requisite amendments in the Education Act and related
regulations have yet to be approved.
In summary, the low prominence of education reform in the Three Year National
Development Plan, delays in amending the Education Act, and the resulting delays in
implementing key reform provisions of SSRP suggest that the mission, goals and
strategies in the constitution and SSRP are not adequately supported by national and

Nepal Education Sector Analysis
84
sector specific policies that would elevate education sector reform from a sector specific
to a national priority.
SSDP is not just an educational priority; it also represents the vision for the education
system that will graduate Nepal from LDC status by 2022. Unless the proposed reforms
are accompanied by legislative measures that allow it to be implemented fully and deeply,
it is unlikely to be taken seriously and will be dismissed as another example of the state
capability trap that will fizzle out as it is based on incorrect implementation assumptions.
Successful policies and compelling strategies depend on adequate system capacity to
implement change with integrity and fidelity.
7.2 Institutional and system readiness
Kingdon (2003) argues that policies only become prominent in the political arena if they:
• respond to problems that should and can be solved
• provide solutions that are technically sound and financially feasible
• garner political support by building wide coalitions that advocate for them.
The fact that important provisions of SSRP have not been implemented because the
Education Act has not been amended begs the question about what has been done to build
the political pressure for the full implementation of SSRP and to ensure that SSDP
provisions do not go the same way.
As SSDP’s architects make the political case for its full implementation, the following are
some big issues that will need to be unpacked and operationalized in terms of policies and
programs:
a) The transition from a unitary to a federal education delivery structure in the Constitution
Except for describing which type of education falls under which jurisdiction, the
Constitution only broadly indicates how federalism will be implemented in the education
sector.
For example:
• Schedule 6 lists higher education under provincial powers and jurisdiction.
• Schedule 8 lists basic and secondary education under the powers and jurisdiction
of the local level — referring to village and town executives.
• Schedule 9 lists education under the concurrent power/jurisdiction of the
Federation, provincial and local levels.
After the elections to the first Constituent Assembly in 2008, the transition from a unitary
to a federal system was the subject of wide national debate among policy makers,
politicians, academics, and non-state organizations. In 2009, UNESCO’s Kathmandu office
facilitated the establishment of a “Federalism and Education Support Group” made up of
leading scholars in the education sector. The Support Group members authored thematic

Nepal Education Sector Analysis
85
papers around free and compulsory education, private schooling, language issues, student
pathways, teacher management, and financing education (AASAMAN Nepal 2014). In
2009, the papers were disseminated to Constituent Assembly members, political party
leaders, government officials, and development partners through a workshop at the
Centre for Constitutional Dialogue, a National Symposium on Federalism and Education,
and in the weekly newspaper Aajako Shiksha.
The Federalism and Education Support Group (FESG) then authored four papers around
the transition to federalism in higher and tertiary education. In 2011, the group produced
four papers about (1) curriculum for Federal Nepal, (2) higher education governance, (3)
financing of higher education, and (4) open and distance higher education in Nepal. These
papers inform the tertiary education strategy about transitioning from a unitary to a
federal education delivery structure.
b) Lingering challenges to transition from a unitary to a federal education structure
National debates on federalism and education have tackled the following challenges. The
overarching gap is to translate proposed solutions into a road map for transitioning from
a unitary structure to a federal structure. This road map should articulate feasible plans
that address:
1. Free and compulsory education for all as a shared responsibility of federal, provincial,
and local governance structures (Parajuli and Acharya 2014).
2. The regulation and management of private schools, including the issue of ensuring
free education in private schools (Bhatta 2014).
3. Issues of language instruction and languages of instruction in a federal Nepal (Aryal
2014).
4. Providing student pathways that ensures equitable access to quality education for all,
5. The modalities of teacher recruitment and appointment in the federal structure (Lal
Bhomi and Suwal 2014).
6. Equitable financing of the transition that spells out how resources should be equitably
distributed at the federal, provincial, and local levels (Lohani 2014).
c) Policy considerations to support the transition toward a federal education system
Coming up with a strategy that addresses the above six areas fits under the policy
directions and the strategies of the SSDP as described in its concept note (MoE 2015b). As
SSDP implementers work on reforming rules and regulations to align school governance
and management with the Federal constitutional mandate, part of the transition challenge
is to propose a plan with policies that, according to Kingdon (2003), demonstrate the
following criteria for survival:
1. Technical feasibility: Do the policies reflect understanding of the mechanisms by which
they will be implemented in practice? Have these mechanisms been tried before?

Nepal Education Sector Analysis
86
What is the evidence that the proposed policies succeeded or will succeed? Are there
adequate staff at federal, provincial, and local levels who understand the proposed
changes and will implement them successfully?
2. Value acceptability: Are the proposed changes compatible with the values of the
subject matter specialists? Among the many value laden issues about which
specialists’ values may collide are: language(s) of instruction; role of government in
education; type of school governance; efficiency vs. equity; public vs. private; student
assessment; and school to career pathways. Reflecting on value compatibility, Aryal
(2014) wonders how the Nepali school and educational system, which is linked to the
political ideology of Panchayat, will handle the federal implications of history content,
language use, school management and financing, and religious schools. The challenge
with value acceptability is that, if not addressed, it can result in policies that are too
polarizing to implement.
3. Tolerable costs: The rights, educational policies, and social justice articles in the
Constitution are equity concerns with cost implications. An essential component of the
financial feasibility of the SSDP rests on the proposal of actionable and fundable
strategies that politicians, interest groups, and funding organizations will support.
4. Political viability: Kingdon (2003) argues that many reform agendas either achieve
prominence or are shelved because of the direction of the political winds. These winds
often reflect the public mood, pressure group agendas, election results, and the
ideological positions of political stakeholders. Education reform architects should be
able to argue that SSDP reflects public aspirations about equitable and quality
education. The preamble to the constitution commits to
“ending all forms of discrimination and oppression created by feudal, autocratic,
centralized, and unitary system. It further commits to … ending discrimination
relating to class, caste, region, language, religion, and gender.”
Making the case in the public arena that SSDP contributes to achieving these ideals is
an important step in security its political viability.
7.3 Capacity to Undertake SSDP
Using the lens of the dimensions of system capacity described we operationalize system
capacity in terms of nine dimensions to assess system capacity in the Nepal education
sector. Figure 5.2 and Table 5.2 visualizes how they are related using an example from the
health sector.

Nepal Education Sector Analysis
87
Figure 5.2: A hierarchy of needs of system capacity building:
Source: Potter and Brough (2004)
Table 5.2: The nine dimensions of capacity in systems
System component
Description
1.
Performance
capacity:
Are the tools, money, equipment, consumables, etc. available to implement SSDP? Regardless
of how well trained they may be, teachers or administrative staff need minimum enabling
material conditions to fulfil their roles.
2. Personal
capacity:
Are staff sufficiently knowledgeable, skilled and confident to perform properly? Do they need
training, experience, or motivation? Are they deficient in technical skills, managerial skills,
interpersonal skills, gender-sensitivity skills, or specific role-related skills?
3. Workload
capacity:
Are there enough staff with broad enough skills to cope with the workload? Are job
descriptions practicable? Is the skill mix appropriate?
4.
Supervisory
capacity:
Are reporting and monitoring systems in place? Are there clear lines of accountability? Can
supervisors physically monitor the staff under them? Are there effective incentives and
sanctions available?
5. Facility
capacity:
Are training centers big enough, with the right staff in sufficient numbers? Are classrooms of a
suitable size to cope with the student workload? Are there enough offices for administrative
support staff?
6. Support
service
capacity:
Are there training institutions, education materials supply organizations, research facilities,
and quality control services? These services may be provided by the private sector, but they
are all required.
7. Systems
capacity:
Do the flows of information, money and managerial decisions function in a timely and effective
manner? Can purchases be made without lengthy delays for authorization? Are proper filing
and information systems in use? Are staff transferred without consulting with local managers?
Can private sector services be contracted out as required? Is there good communication with
local communities? Are there sufficient links with NGOs?
8. Structural
capacity:
Are there decision-making forums where inter-sectorial discussions occur, decisions are made,
records are kept, and individuals are held accountable for non-performance?

Nepal Education Sector Analysis
88
9. Role
capacity:
This applies to individuals, to teams and to structures such as committees. Have they been
given the authority and responsibility to make the decisions essential to effective performance,
whether regarding schedules, money, or staff appointments, etc.?
Source: Adapted from Potter and Brough (2004)
7.3.1 Performance capacity:
‘Performance capacity’ assesses the extent to which the educational system has the
minimum enabling tools, money, equipment and consumables available to implement
SSDP. Realistic estimates of what it will cost to implement SSDP is foundational to
determining whether the country can raise the needed resources. Discussing the financing
of SSDP, the authors of SSDP’s concept note listed five policy directions and five strategies
to achieve them (see Boxes 5.3 and 5.4 for details). These policies and strategies represent
assumptions about the financial viability of SSDP.
Box 5.3: Policy directions for financing SSDP
1. The government to bear the cost of school education including one year’s PPE/ECED.
2. Cost-sharing between central and provincial governments.
3. Schools to be the standard cost unit for government education grants and provisions to
ensure minimum standards.
4. Enhance the roles of the private and public sector to fund educational programs.
5. External support in education to focus on major areas of investment.
Box 5.4: Strategies for implementing policy directions for financing SSDP
1. Adopt a formula based allocation of resources such as basic/committed grants, incentive
grants, and special package grants.
2. Adopt the results-based resource allocation system.
3. Develop an overall investment framework for education to harmonies the roles and
responsibilities of federal, provincial, and local governments.
4. Develop standard types of schools, such as large, residential and special schools, and use
approved minimum standards for these types of schools as standard units for cost estimates
and disbursing education block grants. Develop a system for cost-benefit and output
analyses to help ensure value for money.
5. Maintain financial discipline and good governance by carrying out public expenditure
tracking surveys, service delivery surveys, regular monitoring, and public hearings and by
administering report cards.
It is important to investigate whether the financial viability assumptions in Boxes 5.3 and
5.4 are correct. This could include, among other things, a detailed account of how
proposed policies and strategies are or will be implemented to ensure that SSDP is
financially viable. In the meantime, here are a few cautionary notes on current
performance capacity:

Nepal Education Sector Analysis
89
Using data from the Government’s Medium Term Expenditure Framework (MTEF), under
any scenario, the costs of SSRP have been substantially higher than envisioned in 2009
(Cumming et al. 2012). The Asian Development Bank estimated the cost to be 57 percent
higher than originally planned. Cumming et al. (2012) made a separate estimate that
included development partner funding. There has been an increasing gap between
resources and costs beginning in 2012/2013 with a gap between resources and costs of
$232.9 million dollars in 2015/2016 (Figure 5.3). More current cost and resources data
will help provide more accurate figures about the gap.
Figure 5.3: SSRP financing gap in $ million according to mid-term review (Cumming et al. 2012)
Starting in 2014/2015, the gap between the resources available for SSRP and the costs of
implementing it have significantly widened. As Nepal transitions from SSRP to SSDP, it is
crucial to find out if the financing gap is indicative of real needs in performance capacity
rather than symptomatic of an inefficient system that will not necessarily be fixed with
more money. The other dimensions of capacity indicate potential areas of inefficiency.
On a positive note, the SSRP Extension Plan for 2014/15–2015/16 (MoE 2014)
highlighted the joint financing agreement among development partners as the most
important achievement of SSRP. The implication of the sector wide approach (SWAp) lies
in the introduction of a holistic perspective for school sector reform, and providing the
framework and the demand for a coherent and sector-wide development approach to
education that consolidated development partner’s sub-sectoral interests.
487.8
582.6
737.6687.1
725.4713.2
789.3
491.2
622.7
741.1
773.9869.3
932.7
1,022.20
400
500
600
700
800
900
1000
1100
09/10 10/11 11/12 12/13 13/14 14/15 15/16
Mill
ion
USD
Resources Costs

Nepal Education Sector Analysis
90
In summary — does the country have the performance capacity to provide adequate
resources for SSDP? The answer depends on:
• what measures are taken to close the existing resource gap;
• the costing of SSDP activities and how this informs financing priorities;
• the ability to diversify and augment sources of funding from non-government
sources; and
• the overall performance of the country’s economy.
Regarding the fourth condition, NRB (2015) predicted that the country’s economic
growth could contract to minus 0.9 percent in the current fiscal year (2015/16) due to
the fuel and commodity shortage caused by the blockade imposed by India from 23 since
September 2015, and the protests in the Terai region. NRB predicted growth of minus 0.9
if the blockade continued until January when in fact the blockade continued until
February. The macroeconomic implications of the loss in revenue has direct implications
on the budget available to expand the performance capacity of SSDP in, at least, the short
term.
7.3.2 Personal capacity
This section looks at the extent to which staff are sufficiently knowledgeable, skilled, and
confident to perform properly and at staff needs in terms of training, experience, and
motivation. Some of the skills examined in a personal capacity assessment include
technical skills, managerial skills, interpersonal skills, gender-sensitivity skills and
specific role-related skills (roles of teachers, administrative support staff, principals, local,
provincial, and central ministry leaders and support staff).
As Nepal transitions to the federal education delivery structure, the challenge is to:
• train and support teachers to provide high quality instruction; and
• ensure that the human resources at the central, provincial, local, and school level
provide effective and enabling support to teachers, students, parents and local
communities.
Personal capacity of teachers and head teachers
During SSRP, good progress has been made on increasing the number of qualified
teachers. The backlog of untrained primary teachers has been cleared and significant
advances have been made in clearing the backlog of untrained lower secondary teachers
(Cumming et al. 2012). By 2014, 94.4 percent of primary school teachers, 80.6 percent of
lower secondary teachers, 90.4 percent of secondary school teachers, and 67.6 percent of
high secondary teachers were trained.
While good progress has been made on increasing the number of trained teachers, student
results (see Section quality section at 4.1.3) cast doubt about teachers’ capacity to deliver
quality instruction. In this regard, Poyck et al. (2016: 44) concluded: “Even though the

Nepal Education Sector Analysis
91
percentage of trained teachers has increased significantly in recent years, it appears that
the training is not being translated into classroom practice.”
Regarding head teachers, Moriani et al. (2013) describes the roles of head teachers as
largely managerial. However, their qualifications do not align with their managerial roles
since they are sourced from teaching staff. The above report continues to note that there
is hardly any investment in improving the managerial capacities of head teachers. And
while management is important, it is only one of the many competencies an effective
school leader should demonstrate to lead a twenty-first century school. In this regard,
leading Nepal into the future requires expanding the list of head teachers’ competencies
to include, in addition to effective management, (1) visionary leadership, (2) instructional
improvement, (3) inclusive practice, (4) ethical leadership, (5) and understanding the
socio-political context. For an illustrative example of what each of these competencies
means, please consult the competencies of effective educational leadership in
Massachusetts DoESE (2016) in Appendix B2.
Personal capacity of support services at central, provincial, and local levels
Discussion about personal capacity often focuses on teachers, when, in fact, there are
crucial staff at all levels of education delivery who support teachers. Examples are staff in
charge of curriculum development, testing services, non-formal education, monitoring
and evaluation, planning, human resources, capacity building, TEVT, information and
communication technology, school supervision, and community outreach.
At the personal capacity level, De Grauwe and Calliods (2014) identified three areas for
urgent consideration in building the capacity of support services at federal, provincial,
and local levels:
• Stronger knowledge and deeper insights into the implications of the new federal
structure to the organization of educational administration.
• Strengthening the skills of provincial and local officials in educational planning,
management, and budgeting.
• Developing clear professional profiles and recruitment criteria to ensure that staff
in the provincial and districts levels have the competencies necessary to fulfil their
duties successfully.
The three above areas are consistent with the results of the rapid assessment survey of
Moriani et al (2013)15. At the level of personal capacity mid-to-senior managers viewed
human resource capacity as partially developed in (1) engaging in multi-stakeholder
dialogue, (2) analyzing a situation and creating vision, (3) formulating policy and strategy,
(4) budgeting, management, and implementation, and (5) monitoring and evaluation.
15 Note that the response rate to this rapid assessment was reported to be very low, so the findings should be treated as
only illustrative of some of the personal capacity needs, rather than representative of the full scale of those needs.
Nepal Education Sector Analysis
92
They also stressed the need for investing in developing the leadership and management
skills of district education officers.
Aryal (2014) and De Grauwe and Calliods (2014) noted that decentralized local
governance structures have a long history in Nepal. In the education administration, the
central ministry is at the top of a hierarchical structure that comprises regional education
directorates, district education offices, resource centers and schools. District and village
education committees play a central role in approving the education plans prepared by
their DEOs, resource centers and schools. This shows that the decentralized governance
of educational services is not new. The challenge is to ensure that staff at provincial,
district, and local levels have the personal capacity to improve local educational
governance and demonstrate the ability to resolve local educational issues better than
business-as-usual in the unitary education system. As noted earlier, Moriani et al (2013)
identified the following competencies for targeting further capacity building:
• leadership and management skills
• stakeholder engagement
• situation analysis
• vision creation
• policy and strategy formulation
• budgeting management
• program implementation
• monitoring and evaluation.
From an education standpoint, this sector analysis reaffirms the centrality of these
competencies, but cautions that these areas of personal capacity should be centered on
ensuring that all students in Nepal get equitable access to quality education. If we tie this
to the building blocks of world class education detailed in Box 5.5, personal capacity for
educational administrators should ensure that they understand and demonstrate the
standards for effective administrators. These include:
• clarity about educational outcomes;
• ability to use data to track progress;
• commitment to promoting equity and ensuring that all children have equitable
opportunities to learn;
• understanding the competencies needed in effective teachers;
• supporting teachers and head teachers to improve their instructional practices;
and
• communicating effectively with teachers, teacher unions, parents, interest groups,
and community members to capitalize on existing assets and address challenges
before they become disruptive.

Nepal Education Sector Analysis
93
The quality of administrative support staff at the federal, provincial, and local levels
should be defined by the same standards to promote coherence in performance within
the envisioned administrative layers of the federal structure.
Box 5.5: Examples of standards for professional practice in education
The six domains for administrator professional practice:
1. Setting a widely-shared vision for learning.
2. Developing a school culture and instructional program conducive to student learning and
staff professional growth.
3. Ensuring effective management of the organization, operation, and resources for a safe,
efficient, and effective learning environment.
4. Collaborating with faculty and community members, responding to diverse community
interests and needs and mobilizing community resources.
5. Acting with integrity and fairness and in an ethical manner.
6. Understanding, responding to and influencing the political, social, legal and cultural context.
Source: Oregon DoE (n.d.).
See detailed description at Appendix B1
In Nepal, the challenge is not just to increase the number of young people who meet the
required competencies that enable them to be successful and productive citizens. There
is a much more fundamental challenge that partly accounts for the protracted political
transition since the Comprehensive Peace Agreement, 2006. This challenge is to affirm
diversity and protect social cohesion, pluralism and unity. Educational administrative
staff are at the forefront of this battle because of their central role in children’s
socialization. Ensuring that personal capacity balances management and interpersonal
skills with commitment to access to equitable quality education is crucial in strengthening
their readiness for SSDP.
Workload capacity
Workload capacity has quantitative and efficiency dimensions. The first dimension is
simply about the availability of staff to fulfil their job requirements. The second-
dimension measures whether staff have the appropriate mix of skills to undertake
multiple assignments efficiently. We look at the teacher/student ratio as the quantitative
indicator of workload capacity. For the efficiency capacity, we use measures of workers’
productivity as a proxy for the workload capacity of teachers and administrative staff.
Pupil-teacher ratios
In 2014, Nepal’s primary school pupil-teacher ratio was estimated at 24 (Consolidated
Report III Paper 2070). Nepal’s primary student-teacher teacher ratio has been steadily
decreasing compared to neighboring countries in South Asia (Figure 5.4). The ratio has

Nepal Education Sector Analysis
94
decreased across Nepal’s five development regions, and for the most part in primary,
lower secondary, and secondary schools (see Figures 5.5, 5.6 and 5.7).
Figure 5.4: Primary school pupil-teacher ratio in South Asia
Source: World Bank (2016)
While the trend of lower pupil-teacher ratios is consistent across all development regions,
some regions seem to have higher workloads than others, on average. The Mid-Western
region has the highest pupil-teacher ratio, while the Western region has the lowest. Of
concern is the more than 50 pupil-teacher ratio in lower secondary schools in the Mid-
Western Region. This ratio has hardly decreased since 2009/2010. NPC and UNDP (2014)
ranked the Mid-Western Region as having the highest rate of poverty. This high rate of
poverty reflects deprivations in health, education and sanitation. These factors would
probably also explain the difficulty in attracting teaching staff to the Mid-Western region,
especially in lower secondary and secondary schools.
In summary, data about teacher-pupil ratios suggests that the workload capacity,
especially in primary schools, is within the norm of countries in South Asia, which is an
average of 24.8. Nepal’s average secondary school teacher-pupil ratio is 27.4. This is also
not too far from the South Asian average of 25.6 in 2013 (World Bank 2016). However,
primary and secondary teacher-pupil ratio averages belie significant regional disparities,
especially in lower secondary schools. These range from a ratio of 30 pupils per teacher
in Western region to 52 pupils per teacher in the Mid-Western region.
0
5
10
15
20
25
30
35
40
45
50
2008 2009 2010 2011 2012
Afghanistan Bangladesh Bhutan Maldives
Nepal Pakistan Sri Lanka

Nepal Education Sector Analysis
95
Figure 5.5: Student–teacher ratio in primary schools by Nepal’s development regions (%)
Figure 5.6: Student teacher ratio in Nepal’s lower secondary by development region (%)
2009/10 2010/11 2011/12 2012/13 2013/14
Eastern Dev 35 29 28 24 22
Central Dev 33 32 31 30 28
Western Dev 25 23 20 18 17
Mid Western 40 36 34 32 30
Far Western 32 31 28 27 25
0
5
10
15
20
25
30
35
40
45
STU
DEN
T TE
AC
HER
RA
TIO
2009/10 2010/11 2011/12 2012/13 2013/14
Eastern Dev 48 42 41 38 37
Central Dev 33 31 32 32 31
Western Dev 37 34 31 30 30
Mid Western 55 51 56 52 52
Far Western 44 41 41 41 41
0
10
20
30
40
50
60
STU
DEM
T TE
AC
HER
RA
TIO

Nepal Education Sector Analysis
96
Figure 5.7: Student teacher ratio in Nepal’s secondary schools by development region (%)
Productivity and capacity
As explained in the previous section, high teacher-pupil ratios are often associated with
other forms of deprivation pertaining to health, education and sanitation. This in turn
affects the hiring conditions under which teachers are recruited and the conditions in
which they work. It is important to note here that, according to a 2015 evaluation, over
half of teachers work under various forms of temporary status contracts with lower
salaries, weaker benefits, and fewer opportunities for training (CfBT Education Trust and
EU 2015). This is consistent with Cumming et al. (2012) that characterized the variation
in teachers’ salaries and conditions of employment as a bewildering recipe for industrial
unrest. Little is known, however, about the productivity of education support staff at all
levels of education administration. Many of the existing administrative structures will be
used to transition to the federal education delivery system. Learning about the workload
capacity of the existing administrative workforce will help inform realistic expectations
about what they can accomplish and their training needs to maximize their productivity.
Assessing workload capacity requires a systematic study of indicators of administrative
staff productivity, and to investigate the extent to which staff at all levels of the education
structure fulfil these indicators. In the absence of such a study, we use findings from
Moriani et al. (2013) to illustrate the state of workload capacity at MoE, DoE and DEOs.
We emphasize that the findings are only illustrative because of the low response rate to
the rapid assessment survey. Figure 5.8 displays a few indicators of education employees’
2009/10 2010/11 2011/12 2012/13 2013/14
Eastern Dev 34 28 28 27 27
Central Dev 21 19 20 19 19
Western Dev 25 22 20 20 19
Mid Western 41 34 36 37 36
Far Western 35 32 32 35 36
0
5
10
15
20
25
30
35
40
45
STU
DEN
T TE
AC
HER
RA
TIO
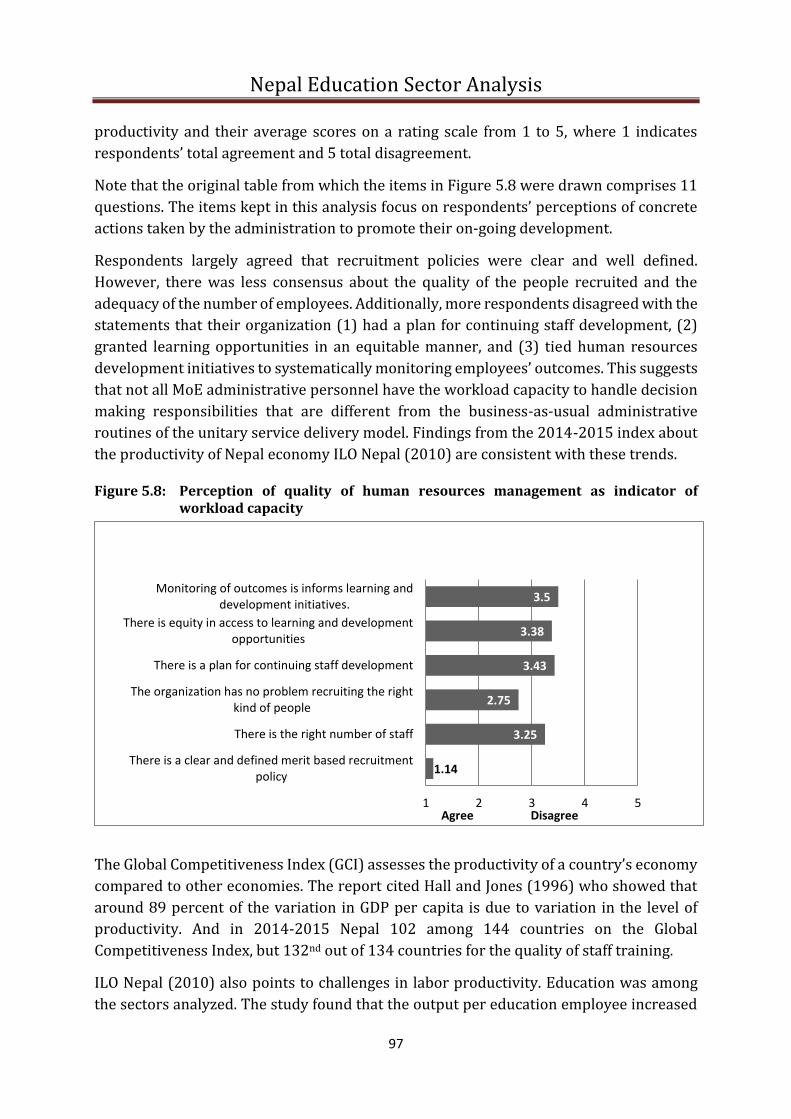
Nepal Education Sector Analysis
97
productivity and their average scores on a rating scale from 1 to 5, where 1 indicates
respondents’ total agreement and 5 total disagreement.
Note that the original table from which the items in Figure 5.8 were drawn comprises 11
questions. The items kept in this analysis focus on respondents’ perceptions of concrete
actions taken by the administration to promote their on-going development.
Respondents largely agreed that recruitment policies were clear and well defined.
However, there was less consensus about the quality of the people recruited and the
adequacy of the number of employees. Additionally, more respondents disagreed with the
statements that their organization (1) had a plan for continuing staff development, (2)
granted learning opportunities in an equitable manner, and (3) tied human resources
development initiatives to systematically monitoring employees’ outcomes. This suggests
that not all MoE administrative personnel have the workload capacity to handle decision
making responsibilities that are different from the business-as-usual administrative
routines of the unitary service delivery model. Findings from the 2014-2015 index about
the productivity of Nepal economy ILO Nepal (2010) are consistent with these trends.
Figure 5.8: Perception of quality of human resources management as indicator of workload capacity
The Global Competitiveness Index (GCI) assesses the productivity of a country’s economy
compared to other economies. The report cited Hall and Jones (1996) who showed that
around 89 percent of the variation in GDP per capita is due to variation in the level of
productivity. And in 2014-2015 Nepal 102 among 144 countries on the Global
Competitiveness Index, but 132nd out of 134 countries for the quality of staff training.
ILO Nepal (2010) also points to challenges in labor productivity. Education was among
the sectors analyzed. The study found that the output per education employee increased
1.14
3.25
2.75
3.43
3.38
3.5
1 2 3 4 5
There is a clear and defined merit based recruitmentpolicy
There is the right number of staff
The organization has no problem recruiting the rightkind of people
There is a plan for continuing staff development
There is equity in access to learning and developmentopportunities
Monitoring of outcomes is informs learning anddevelopment initiatives.
Agree Disagree

Nepal Education Sector Analysis
98
by 1.45 percent between 1999 and 2008. It would have been more informative if there
was trend data about growth in education employees’ productivity, and a regional
benchmark against which to measure staff productivity. That said, it is still sobering to
note that the country was found to lag the four-other selected South Asian countries on
the contribution per worker to GDP (Figure 5.9).
Figure 5.9: GDP per worker in five South Asian countries (current US $)
Source: ILO Nepal (2010)
In summary, this section shows that except for within country regional disparities in
lower secondary schools in the Mid-Western region, teacher-pupil ratios are, on average,
within the South Asian norms for primary education but less so for secondary education.
While this ratio is a measure of the time teachers can dedicate to individual students, it
does not necessarily predict workload capacity in terms of teachers’ productivity.
The information available from Moriani et al. (2013) about educational staff productivity,
coupled with broader information about labor productivity in Nepal casts doubt on the
extent to which existing staff, especially at the provincial and local levels, can handle
education management issues that were part of the central government prerogatives
under the unitary education system. While more focused investigation will help gauge the
extent to which such capacity exists, provisions to enhance existing capabilities, especially
at provincial and local levels should be a core component of the SSDP.
Supervisory capacity
Supervisory capacity refers to the reporting and monitoring systems in place. It is also
about the extent to which there are clear lines of accountability that designate (1) who is
responsible for what, (2) what are the sanctions or rewards in place to ensure action,
compliance, and performance, and (3) the extent to which the mechanisms for reward and

Nepal Education Sector Analysis
99
sanction are enforceable and effective. Operational rigidities, weak public disclosure,
weak governance, and weak public finance management are manifestations of weak
supervisory capacity. Institutional innovations such as the Education Policy Committee,
the Education Review Committee, parent teachers’ associations and school management
committees seldom meet. They are not acting as independently as they were intended to
be are inadequately funded. This has been the case throughout SSRP implementation. This
is symptomatic of weak supervisory capacity, where such problems are known about, but
little seems to be done to solve them.
Facility capacity
Facility capacity is about the availability and quality of existing facilities to function as safe
child-friendly spaces for quality instruction that are accessible to all children and are
conducive to learning. On 25 April 2015, a 7.8 magnitude quake struck Nepal causing
devastation across the nation. MoE estimates the value of the damage caused by the quake
and its aftershocks to the education sector at NPR 28,064 million ($280.6 million). Table
5.3 gives a breakdown of estimated damage to infrastructure and physical assets
according to the MoE post-disaster needs assessment (PDNA, 2015) report.
Prior to the earthquake, the SSRP extension plan for 2014/2015-2015/2016 (MoE 2014),
identified the enhancement of facility capacity as a priority area in early childhood
education and development (ECED), and in basic and secondary education. This includes
the provision of ECED facilities in sparsely populated areas, and meeting priority
minimum enabling conditions in all schools, with the provision of library corners. The
estimated damage caused by the earthquake is presented in Table 5.3 and points to facility
capacity gaps in ECD, basic and secondary education, TVET, and NFE/lifelong learning
(NFE/LLL).
Table 5.3: Estimated damage to infrastructure and physical assets by April and May 2015 earthquakes
ECD Schools
(Grades 1-12) TVET Higher
education NFE/LLL
No. of classrooms/rooms fully
destroyed
784 26,090 356 1,292 40
Number of classrooms/rooms
partially destroyed
- 26,080 184 3,040 7
Number of toilets and wash
facilities
- 4,416 - - -
Number of compound walls
destroyed and damaged
-- 1,791 - 6 -
Equipment destroyed and
damaged (in NPR million)
- 140.4 90.0 155.5 -
Furniture destroyed and
damaged (in NPR million)
- 1,867.6 4.5 5.6 0.6
Nepal Education Sector Analysis
100
Other assets destroyed and
damaged (textbooks, education
materials, uniforms)
(in NPR million)
9.8 2,086.5 1.3 16.7 0.4
Source: Ministry of Education Post Disaster Needs Assessment (2015).
MoE together with its development partners are committed to the principle of ‘building
back better.’ The PDNA defines this as:
• resilient building with safe and adequately sized staircases;
• proper exits;
• furnishing and equipment installed to minimize potential harm to school
occupants;
• displays and equipment for early warning and evacuation;
• clean water drinking supplies;
• separate sanitation facilities for girls and boys;
• energy and communication connectivity;
• libraries, laboratories and playgrounds.
• Safe schools that are inclusive in terms of access, acoustics and light.
It is important to note that PDNA (2015) summarizes the vision of what’s needed, and not
the current reality. The reference to inclusive education measures comes under a separate
section on inclusion of children with disabilities. As the country prepares for the SSDP,
providing access to quality education for all should mean that all students and the
interests of excluded groups should be front and center in the ‘building back better’
commitment. These include girls, individuals with disabilities, Dalits, Janajatis, Madhesis,
Muslims, conflict-affected children, street children, child victims of sexual exploitation
and trafficking, child laborer’s, children suffering from poverty, children in prison,
orphans, sick children, and students in remote areas (DoE 2010; Asian Development Bank
and World Bank, 2012).
Facility capacity should also be gauged by the extent to which principles of universal
design are used in building, reconstructing, or retrofitting new facilities. An example of
this is the design principles of the US Department of Education (see Box 5.6)
Box 5.6: Accessibility and design principles of the OCTAE, U.S Department of Education
• Equitable use: The design is useful and marketable to people with diverse abilities.
• Flexibility in use: The design accommodates a wide range of individual preferences and
abilities.
• Simple and intuitive: Use of the design is easy to understand regardless of the user’s
experience, knowledge, language, skills, or concentration level.
Nepal Education Sector Analysis
101
• Perceptible information: The design communicates necessary information effectively to
the user, regardless of the user’s sensory abilities.
• Low physical effort: The design can be used efficiently and comfortably with a minimum
of fatigue.
Source: OCTAE 2016 — Office of Career, Technical, and Adult Education
One policy challenge that may limit the government’s ability to implement principles of
universal design to improve its facilities may stem from the current understanding of the
many facility-wise barriers faced by marginalized children that prevent them from
accessing schools and learning in school. One example is the government definition of
disability and its prevalence.
According to Handicap International’s (2015) assessment of inclusive education, the
quality of data on people with disabilities is poor in Nepal. The 2011 national census
reported 1.94 percent of people living with disabilities while the World Disability Report
(WHO and World Bank 2011) estimated the proportion at around 15 percent of the
world’s population. The Handicap International assessment said that the government
classification of disability was much narrower than internationally accepted definitions
of disability. Handicap International (2015) used the World Health Organization estimate
of 5.8% of disability prevalence among children from 0 to 14 years of age that. This would
translate to a figure between 250,000 and 735,000 children with disabilities in Nepal.
Handicap International notes that many mild disabilities are hardly identified in Nepal.
These include dyslexia, dyspraxia, and attention deficit hyperactivity disorder. And
Handicap International estimates that 650,000 primary school children need glasses, of
whom at least 65,000 cannot access them.
In summary, MoE formally adopted the National Framework of Child-Friendly Schools
(CFS) for Quality Education in 2010 (DoE 2010). The framework is very clear on the
centrality of inclusiveness as a hallmark of child-friendly schools. As the country rebuilds
after the earthquake, and considering the new constitution and the new federal education
structure, the CFS National Framework should be implemented at the new levels of
education delivery to existing and projected plans to improve facility capacity. In that
regard, building back better should be based on proper understanding of access barriers
for marginalized children. This understanding is also contingent on more fine-tuned
classifications of how various conditions of marginalization deprive children from their
constitutional right to quality education.
Support service capacity
This section covers Nepal’s education training institutions and the capacity of training
facilities to support research that improves learning in the Nepali cultural context. There
is a huge need for evidence-based practices that improve student achievement. The
following practices were identified as priorities for teacher professional development and
management by the SSRP extension plan (MoE 2014):
Nepal Education Sector Analysis
102
• Understanding how reading skills are acquired and effectively taught in early
grades.
• Understanding how to support struggling readers.
• Providing language teachers in early grades.
• Teaching in line with the child friendly schools’ framework (DoE 2010).
• Induction training for all teachers.
Other areas that require support services include:
• evidence based practices in inclusive education, including children with
disabilities and all other vulnerable minorities.;
• effective assessments;
• effective course design;
• effective school management and leadership;
• education policies;
• data driven decision making;
• multilingual and multicultural learning; and
• the effective delivery of education in a federal system.
The above list of proposed topics illustrates the breadth of support needed to secure a
national knowledge base for effective education delivery. Appendices B1 and B2 show the
competences that teachers and administrators need to fulfil their professional roles in the
USA.
The National Centre for Educational development (NCED) conducts certification and
recurrent training courses for primary and secondary education teachers through
education training center (ETCs) and other training providers (MoE 2014). NCED
provides a one year teacher training course, in addition to the minimum academic
qualification for teacher posts. A question here is whether the minimum academic
qualification plus the one year teacher training course is adequate to produce teachers
who exemplify the standards for effective practice detailed in Appendix B.
The need to base educational practice on science begs the question about the absence of
Nepal’s big universities as partners in strengthening education support service capacity.
The implementation matrix in the SSRP extension plan (MoE 2014) makes no mention of
a flagship university role in training ECED, basic, or secondary education teachers. As
institutions of instruction and research, they are naturally placed to strengthen support
service capacity by 1) gathering evidence about what works and does not work, 2)
training the trainers, and 3) providing in-service and pre-service training. Not including
universities as partners in capacity building cuts MoE from an important provider of
Nepal Education Sector Analysis
103
support services, which will weaken the sustainability and innovativeness of its support
services in the long term.
Systems, structural, and role capacity
The three facets of the capacity of entities and people are highly interdependent:
• System capacity indicates the extent to which information, money, and decisions
flow in a timely and effective manner.
• Structural capacity captures the extent to which individuals and units within an
organization have structures that facilitate communication, cooperation,
coordination, and collaboration (the 4 Cs).
• Role capacity describes the extent to which individuals, teams and committees
have the authority and responsibility to make decisions essential to effective
performance.
These three dimensions of capacity are interdependent because the flow of information,
money, and decision making is contingent on clear structures for the 4 Cs. In turn the 4 Cs
are meaningful and authentic when the individuals or entities involved have the requisite
decision making authority and demonstrate the necessary accountability for the
effectiveness of their actions because of the ownership inherent in empowering them with
authority and responsibility.
A “state capability trap” is the phrase used by the IACD plan (Moriani et al. 2013) to
describe the school sector’s problems with capacity at the level of systems, structures, and
roles in general and SSRP (see Section 5.1.3 for earlier discussion and Box 5.7 for
manifestations of the trap).
Box 5.7: Manifestations of the capability trap
1. Political issues and bureaucracy led solutions
2. Operational rigidities that curb innovations in institutional design
3. Weak horizontal and vertical institutional coordination
4. Weak public disclosure
5. Redundancies in structures and processes
6. Underfunded institutional innovations
7. Issues with teacher management
8. Dependence on other institutional reforms
9. Challenges with integrating the development partners’ agenda within a sector-wide
national development agenda
10. Solutions that do not address the root causes of problems with service quality
11. Weaknesses in the governance of central agencies

Nepal Education Sector Analysis
104
12. Challenges in public finance
13. Untapped resources of informal institutions
14. Asymmetric structures and roles
15. Red tape and cumbersome procedures.
These challenges are symptomatic of broader public administration governance issues
that affect the quality of public services, and have implications on the nation’s
attractiveness as an investment destination. The Global Competitiveness Report (Schwab
2014) points to comparable system challenges identified by business executives that are
consistent with the 15 factors listed by IACD. Figure 5.10 summarizes those views.
Figure 5.10: Most problematic factors for doing business in Nepal (% of responses) (Schwab 2014)
To address the limitations of system, structure, and roles capacity, the IACD Plan (Moriani et al. 2013) recommends a mix of solutions that challenge the incremental approach to reform, are integrated in on-going or planned change initiatives, and consider current capabilities and political economy. In this regard, the new constitution, post-earthquake reconstruction and the transition to federal governance, represent critical junctures at which the education sector must break with the ‘broken’ unitary system and top-heavy education delivery. It helps here
0.5
1
2
2.2
2.4
2.7
4
4.4
4.6
6.6
10.2
10.7
11.9
13.5
23.4
0 5 10 15 20 25
Poor public health
Foreign currency regulations
Tax rates
Access to financing
Crime and theft
Inadequately educated workforce
Restrictive labor regulations
Tax regulation
Inflation
Poor work ethic in national labor force
Inadequate supply of infrastructure
Ineffcient Government bureaucracy
Corruption
Policy instability
Government instability/coups
Percent of responses

Nepal Education Sector Analysis
105
to be clear about what the indicators of a functional education system are, and to use these as result indicators to plan needed interventions through backward mapping. Table 5.4 illustrates some result indicators for a well-managed education system. Table 5.4: Indicators of effective management of an education system
1. Indicators of effective system level management (central ministry level): a) Textbooks are produced in sufficient numbers and distributed to schools on time b) Instructional supplies are delivered to schools on time c) Supply of qualified teachers meets demand d) Teachers are appropriately assigned/deployed to schools e) Teachers’ salaries are paid on time f) Schools have copies of syllabuses g) The ministry knows the location of schools throughout the country h) Schools are appropriately located across the country i) A national plan is available which provides vision and focus for education activities.
2. Indicators of effective intermediate level management (regional and district levels): a) Teachers are appropriately assigned/deployed to schools b) School inspection occurs on an appropriate and regular basis c) Teachers receive instructional supervision d) Questions from head teachers and teachers receive timely responses e) Ministry information flows to schools in a timely way f) School information is conveyed to the ministry in a timely way g) Staff development activities for school personnel are well designed and implemented.
3. Indicators of effective school-level management: a) Instructional supplies are ordered on time b) Teachers come to school on time c) Teacher absenteeism is low d) School facilities are in good repair e) Teachers have copies of syllabuses f) Teachers receive instructional supervision g) Each school has a functioning parent-teacher association h) Parents know how their children are progressing in their studies.
Source: Chapman (2002)

Nepal Education Sector Analysis
106
8. ANALYSIS OF EDUCATIONAL SUBSECTORS AND THEMES
In Chapter 4, we provided a holistic summary of the state of the education sector in Nepal.
In this chapter, we delve into the specific challenges of each sub-sector. We also elaborate
on cross-cutting themes such as links with higher education, Teacher management and
capacity building, and information and communication technology. Given the complexity
of the whole sector, it is important to highlight issues specific to each sub-sector to
understand the whole system, and generate solutions that fit the realities of the system
and the students it serves.
8.1 Early Childhood Education and Development
Background and context
One of the main strategies to achieve the EFA goals was to increase the number of early
childhood development centers (ECDCs) to ensure access for the most vulnerable and
marginalized children. A total of 35,121 early childhood education and development
(ECED) centers are operating in Nepal (flash report 2014-15). Of these, 30,034 (85.5%)
are running as community-based ECDCs and community school-based ECDCs/pre-
primary classes (PPCs). The remaining 5,087 (14.5%) operate within institutional
schools. Although there is an increasing number of ECD/PPCs (DoE 2015), equitable
access is still a problem. Table 6.1 disaggregates the 3–5-year-olds population by gender
and age.
Table 6.1: Composition of Nepal’s 3–5-year-old population, 2011
3-5-year-old children in Nepal
% of total population
% male % female % aged 3 % aged 4 % aged 5
1,809,867 6.8 51.5 48.5 30 33 37
Source: CBC 2011a.
National ECD initiatives
Nepal’s educational policy has been reviewed several times to develop high quality public
schools with equity and accessibility (Bhatta 2009). The Ministry of Education (MoE),
under its Basic and Primary Education Program (BPEP) in 1997 started to take initiatives
to open PPCs to separate under age children from Grade 1 students, and improve the
teaching and learning situation in primary grades. After the adoption of early childhood
care and education as the first goal of EFA, the concept of PPCs also changed. The focus
shifted to the holistic development of children at ECD programs (ECD Curriculum; ECD
strategy; 2004, ELDS; Minimum Standard). Although the concepts and practices regarding
early childhood development and pre-primary education emerged as important
foundations for further education and developments, they were still not part of the formal
education structure.
The EFA National Plan of Action and the EFA Core Document 2004-2009 programs in
Nepal (NNC-UNESCO 2003 and MoES 2003) committed to expanding and improving ECD

Nepal Education Sector Analysis
107
opportunities throughout the country. Additionally, an ECD Strategic Plan was
implemented in 2005 by the Ministry of Education and Sports to support primary grade
learning. The ECD strategy paper (2004) and the SSRP (MoE 2009) set the target to
provide ECD services to 80 percent of 3–5-year-old children by 2015. The ECD strategy
also targeted to have 80 percent of new entrants at Grade 1 with ECD exposure by 2015.
The government’s Tenth Five-Year Plan (2002–2007) and the three-year interim plan
(2007/08–2009/10) had ECD centers as a strategy for increasing school enrolment,
retention and reducing repetition and dropout rates of students.
Analysis of the current situation of ECED (PPC) centers
Even though Nepal has an excellent ECD policy, it has not been sufficiently implemented
to address the development needs of children aged five years and below. The
implementation of ECED programs need to be speeded up in line with the national policy
and strategic framework for the holistic development of Nepal’s children. The following
analysis is the result of consultations with stakeholders at district and grassroots levels.
1. Access: Although the number of ECED centers has increased the current distribution
of ECED centers as quotas does not reach the vulnerable and disadvantaged groups.
There is uneven distribution of ECED centers in the districts. Fair access has not been
achieved because of too few service delivery points, unavailability of appropriate
services, cultural barriers to using services, poor quality services, geographical
barriers and limited capacity of service providers.
2. Quality: The quality of ECED provision needs to be addressed to fit the socio-cultural,
economic, and geographic contexts of communities where it is implemented. The
blanket approach in training and operation without proper support and monitoring
has not worked well. Most ECD centers lack adequate facilities and service providers.
The centers do not meet minimum standards and the early learning and development
standards are not being followed. Access to all children is limited and the quality of
services is questionable. Only an estimated 39.5% of children (Flash report,
2014/015) between 3 to 5 years of age attend ECED centers (DoE 2014; CBS 2011).
The situation is worse for girls, children with special needs, orphans, children on the
streets, and other vulnerable children. Most ECED centers lack adequate facilities
(Unicef 2014). Many centers are characterized by poor ventilation, dusty rooms, poor
lighting, temporary structures and the absence of child-friendly sanitary facilities.
These issues need to be addressed if ECED is to have a positive impact on the education
and socioeconomic development. Finally, there are no age appropriate government
run facilities for children below three years of age at schools (PPCs and kindergartens)
and no parenting awareness programs conducted to support these children at home.
Also, ECED programs are not linked with Grade 1, creating a gap in teaching learning
approach between ECED centers and Grade 1.
3. ECED management: The ECED operation guidelines mention the formation of
management committees in school and community based centers. Almost all

Nepal Education Sector Analysis
108
community-based ECED centers have management committee but many school based
pre-primary classes have not formed such committees. School management
committees also take responsibilities for managing PPCs. However, most management
committee members are unaware of their roles and responsibilities. The provision of
mother schools has been made for monitoring and supporting community based ECED
centers. However, the lack of clear guidelines for mother schools on the management
of ECED centers means that the role of head teachers is usually limited to certifying
facilitators’ attendance with none or very little supervision and monitoring.
4. Facilitators’ (teachers) competency: The ECD operation guidelines, 2061 give the
qualification of ECED facilitators as a Grade 8 pass with pre-and in service trainings.
Many teachers in the private schools are untrained. Even if facilitators/teachers are
trained, most have only attended short courses which are not adequate for the
development of productive competencies (NCE Nepal 2015) or for maintaining
program quality. Also, there is a low level of motivation for facilitators as they receive
low remuneration and their jobs are temporary and lack long term benefits. Finally,
there is no proper and timely monitoring of facilitators’ performance.
5. Curriculum and curricular materials: The ECED curriculum was introduced in 2004.
However, the lack of proper infrastructure and learning materials prevents facilitators
from applying proper pedagogical approaches and most ECED centers do not follow
the curriculum (Unicef 2014). Early learning and development standards are not being
used. Also, ECED programs are not linked with Grade 1, creating a gap in teaching
learning approach. The conventional approach of teaching and learning is used in most
ECED/PPCs and private schools.
6. Resources and capability: There are only limited human and financial resources for
Nepal’s ECED programs. The ECED minimum standards are not implemented and
service providers are not properly coordinated or regulated. There is a lack of
coordination for resource allocation and minimizing duplication. There have been ad
hoc budget allocations from the ministry of local development via district
development committees (DDCs), municipalities and village development committees
(VDCs) to support ECED programs. The lack of resources means that the whole ECED
system relies heavily on unqualified and under-qualified volunteers (NCE 2015, Unicef
2014, strategic framework for ECD) and quality is compromised.
7. Institutional arrangements (leadership): ECD is a multidisciplinary program that
requires a multi-sectoral approach. The key ministries for ECED services are
education, health and population, and local development. Other stakeholders include
the private sector, international organizations (INGOs), NGOs, community based-
organizations, non-state actors and local communities. MoE is the lead ministry for
ECED even though it is not included in the education structure. DoE has the role of
bringing all these concerned line agencies under one umbrella. The National Council
for ECED has been formed under the National Planning Commission (NPC).
Nepal Education Sector Analysis
109
DEO’s are responsible for bringing together concerned line agencies at the district
level. However, DEOs are unable to fully carry out their leadership and coordination
roles as they lack robust ECED sections and lack adequate staff and resources. District
ECED boards, which are supposed to be responsible for networking and collaboration
among ECED implementers, have neither the mandate nor the resources to steer ECED
activities or to bring plans into operation. ECED coordination and networking
structures are weak at community and district.
Several development partners have supported ECED programs. Their efforts and
resources are not fully coordinated as DoE and DEOs do not control how partners
allocate their resources. Thus, there is some duplication and some concentration of
services, leaving other areas poorly served. The basket funding of ECED services and
improved coordination would improve ECED quality and equity.
8. Advocacy and awareness: The lack of advocacy for ECED means that many
stakeholders do not priorities the development of ECED while the lack of and
awareness of the benefits of ECED means that many parents do not value it. Early
stimulation and holistic development are abstract ideas for many parents. The limited
dissemination of the ECED policy and guidelines, the lack of a budget line for ECED in
DDC and VDC budgets, and the lack of district-level events on ECED results in low
support for ECED. Urgent action is needed to develop a communication strategy that
will improve public awareness about the importance of ECED at household,
community, district, and national levels.
9. Age groups: The dual structure of ECED programs confuses the general public. The
community-based ECED program is a two-year program that enrolls children of three
years of age. The school based PPC program is a one year program that enrolls four-
year-olds. However, under-age children (two years and below) enroll in ECED/PPCs
and private school kindergarten. There is also the practice of making academically
weak students who enroll in Grade 1 participate in ECED programs. There are no age
appropriate facilities for these children at schools (PPCs and kindergartens) and no
parenting awareness programs conducted to support these children at home.
10. Monitoring and evaluation: Constant monitoring and support is needed to improve
ECED services from community to district levels. But M&E is only being carried out on
some INGO supported programs. District ECED boards and DEOs have yet to develop
M&E systems for ECED programs. Good M&E systems provide evidence for decision-
making and designing demand driven ECED programs. And the few M&E tools that are
developed and implemented must be linked with the EMIS to generate knowledge that
could be used for improving ECED programming.
Recommendations on improving ECED
1. Enhance access and quality of ECD services:

Nepal Education Sector Analysis
110
• Increase access to ECED entails building structures in urban and rural areas to
make it accessible to all children and especially for marginalized, deprived,
disabled, and geographically distant students.
• Run both home-based and center-based programs.
• Include ECED centers within the school structure.
• Map ECED provision as the basis for possibly redistributing provision.
2. Increase competency of facilitators, care givers and teachers (private schools):
• Make an SLC pass the minimum qualification for ECED facilitators.
• All facilitators, caregivers and teachers must receive pre- and in-service training.
• Revise the training package to contain a blend of knowledge and skills.
• Carry out periodic evaluations of facilitators, care givers and teachers
• Provide refresher training for facilitators.
• Start discussions about running motivational packages like exposure visits,
meetings, supportive supervision, rewards and punishment, and additional
remuneration.
3. Allocate resources and enhance capability:
• The DoE, as the coordinating body at the national level, should re-form the national
ECD network comprising of development partners, ECD experts and practitioners,
academicians, and implementing I/NGOs representatives.
• DEOs, as the coordinating bodies at district level with the responsibility for
training ECD providers at district and community levels should, in coordination
with MoFALD, mobilize DDCs to initiate budgets and create ECED funds in their
districts. These funds should be used for advocacy, quality and support for
infrastructures, learning and appropriate play materials.
4. Raise advocacy and awareness:
• Develop an advocacy and communication strategy to raise awareness at all levels
about the benefits of ECED. This can also be an important tool for advocacy for
other concerned line ministries, line agencies (health staff, teachers, SMCs, health
facility management and operation committees, VCPC), local authorities, corporate
sectors and international organizations to invest in ECED.
• Run special events and activities to advocate for and raise awareness about ECED.
5. Strengthen collaboration:
• Strengthen leadership, partnership and coordination by establishing a forum for
key stakeholders (including government, civil society and development partners).
• Strengthen the capacity of the ECD council and district ECED board to play a lead
role in policy development, coordination and collaboration.

Nepal Education Sector Analysis
111
• Start the sharing and joint planning of ECED programs in coordination with
I/NGOs.
• The ECD council should take a leadership role for upgrading, updating and
periodically revising of the policy, strategy and operational guidelines.
6. Enhance monitoring and evaluation, and research for ECD:
• Establish a strong M&E system for ECED with clear targets and indicators
• Conduct annual multi-sectoral planning and reviews of ECED provision.
• Carry out research to improve ECD services
• Carry out M&E and research to inform evidence-based decision-making and for
designing demand driven ECD programs.
• establish a national ECED research forum to set the research agenda and
disseminate results.
8.2 Basic Education: Gains and Issues
In Nepal, basic education refers to education provided from Grades 1 through 8. The
prime objective of SSRP (2009–2016) is to ensure equitable access to and quality of basic
education for all children ages 5 and 12 years old. In Chapter 4, we noted that significant
progress has been attained in access. The targeted net enrolment rate of 88 percent was
achieved by 2014. However, disaggregating the data by gender and socioeconomic status
reveals persistent inequities.
According to Flash Report 2010–2014, by 2014 the net intake rate (NIR)16 in Grade 1
reached 93 percent. This is four percentage points higher than it was in 2010. However,
Nepal failed to achieve SSRP’s 2014 target of 96 percent. The trend data demonstrates
consistent inequities by gender and caste. The primary net enrolment rate has also
increased, even if it failed to meet SSRP’s 2014 target. Primary net enrolment continues
to show gender and caste gaps, where girls, especially those from marginalized groups,
have less opportunities enroll in primary education.
Regarding efficiency, the 2010-2014, Flash Report shows the encouraging gains of
decreasing repetition rates and improving survival rate to Grades 5 and 8. The gains in
efficiency, however, fell short of the SSRP targets for 2014. Figures 6.1 and 6.2 show the
trends in repetition and survival rates from 2010 to 2015. As the country embarks on a
new phase of education reform, it is crucial to emphasize that efficiency and quality are
interrelated. In other words, a system with high survival rates and low repetition and
dropout rates will be inefficient if students are not able to demonstrate the literacy,
numeracy and life skills outcomes for which they went to school.
16 Number of new entrants in the first grade of primary education who are of official primary school-entrance age,
expressed as a percentage of the population of the same age.

Nepal Education Sector Analysis
112
Figure 6.1: Percentage growth in repetition rate (Grades 1 and 8, 2010 to 2015)
Source: Flash Report 2010-2014
Figure 6.2: Percentage gains in survival rate, 2010 to 2015
Source: Flash Report 2010-2014
As demonstrated in Chapter 3, quality and equity data show entrenched gaps pertaining
to who benefits from education services and the lost learning opportunities for students
enrolled in basic education. In Grade 5 for example, only 35.5 percent of students passed
the National Assessment of Student Achievement (NASA) in mathematics. While this
percentage improved to 53.3 percent in 2012, it fell again to 41 percent in 2013. In Grade
8, 49 percent passed NASA in Nepali in 2011 compared to 48 percent in 2013. Similarly,
43 percent passed NASA in mathematics in 2011, compared to 35 in 2013. The declining
trend is itself alarming. However, the fact that more than 50 percent of Grade 8 students
do not demonstrate the necessary competencies to pass the Grade 8 assessment in Nepali
and mathematics poses a serious threat to the country’s chances to graduate from LDC
status and benefit from its demographic dividend. In starker terms, the country will not
be able to produce the necessary human resources to fuel a high valued added knowledge
22.621.3
19.917.5
15.212.3
6.6 6 5.7 5.1
4.54.1
2010 2011 2012 2013 2014 2015
Repetition rate in grade 1 Repetition rate in grade 8
2014 SSRP target of 10% in Grade 1
2014 SSRP target of 2% in Grade 8
80.6 82.8 84.185.4
86.8 89.4
6667.5
69.4 72.2 74.6 77.2
2010 2011 2012 2013 2014 2015
2014 SSRP target 76% to Grade 8
2014 SSRP target 90% to Grade 5
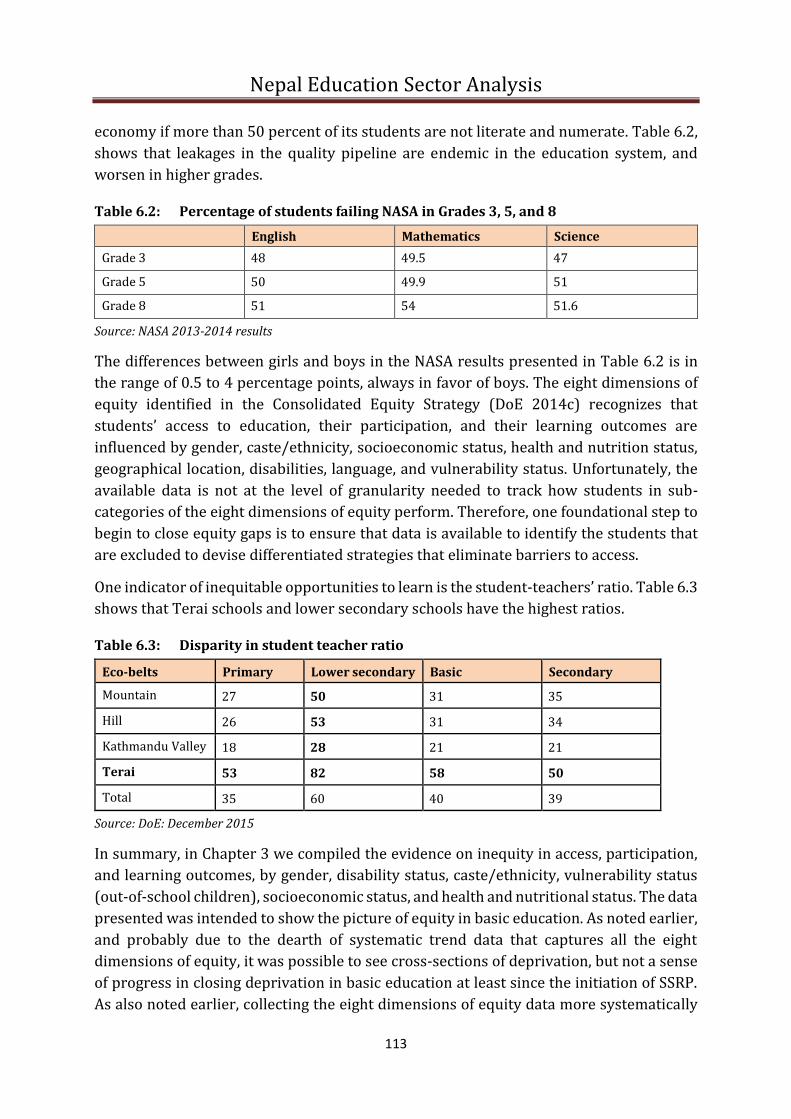
Nepal Education Sector Analysis
113
economy if more than 50 percent of its students are not literate and numerate. Table 6.2,
shows that leakages in the quality pipeline are endemic in the education system, and
worsen in higher grades.
Table 6.2: Percentage of students failing NASA in Grades 3, 5, and 8
English Mathematics Science
Grade 3 48 49.5 47
Grade 5 50 49.9 51
Grade 8 51 54 51.6
Source: NASA 2013-2014 results
The differences between girls and boys in the NASA results presented in Table 6.2 is in
the range of 0.5 to 4 percentage points, always in favor of boys. The eight dimensions of
equity identified in the Consolidated Equity Strategy (DoE 2014c) recognizes that
students’ access to education, their participation, and their learning outcomes are
influenced by gender, caste/ethnicity, socioeconomic status, health and nutrition status,
geographical location, disabilities, language, and vulnerability status. Unfortunately, the
available data is not at the level of granularity needed to track how students in sub-
categories of the eight dimensions of equity perform. Therefore, one foundational step to
begin to close equity gaps is to ensure that data is available to identify the students that
are excluded to devise differentiated strategies that eliminate barriers to access.
One indicator of inequitable opportunities to learn is the student-teachers’ ratio. Table 6.3
shows that Terai schools and lower secondary schools have the highest ratios.
Table 6.3: Disparity in student teacher ratio
Eco-belts Primary Lower secondary Basic Secondary
Mountain 27 50 31 35
Hill 26 53 31 34
Kathmandu Valley 18 28 21 21
Terai 53 82 58 50
Total 35 60 40 39
Source: DoE: December 2015
In summary, in Chapter 3 we compiled the evidence on inequity in access, participation,
and learning outcomes, by gender, disability status, caste/ethnicity, vulnerability status
(out-of-school children), socioeconomic status, and health and nutritional status. The data
presented was intended to show the picture of equity in basic education. As noted earlier,
and probably due to the dearth of systematic trend data that captures all the eight
dimensions of equity, it was possible to see cross-sections of deprivation, but not a sense
of progress in closing deprivation in basic education at least since the initiation of SSRP.
As also noted earlier, collecting the eight dimensions of equity data more systematically

Nepal Education Sector Analysis
114
will help map where barriers are most concentrated to inform MoE and its partners where
technical and financial support can make the most difference in closing the equity gap in
access, participation, and learning outcomes in basic education.
The architects of SSDP put together an issues and recommendations matrix to organize
their thoughts. Table 6.4 is a shortened version of this matrix.
Table 6.4: Basic education issues and recommendation matrix as of 2015
Theme Issue Recommendations
Data on out-of-school
children (OOSC) and
barriers they face
Lack of comprehensive data on OOSC and
further mapping of barriers to education for
OOSC needed (DoE 2014c)
• Data should be integrated from
different sources (EMIS, CBS, studies)
(Unicef 2014)
• Micro planning and social mapping
should be done at school catchment
level to validate OOSC data and
understand the barriers.
• District plans should be developed
based on micro planning and social
mapping (Unicef 2014).
Insufficient and inaccurate data on access to
education for CwDs and the barriers to
education they face (DoE 2014c).
• Use appropriate tools to assess
children’s disability (Unicef 2014)
• Explore whether additional research
on CwD and the barriers they face are
needed and what the scope and
methodology should be (HRW 2011).
Decreasing access to
education of some
OOSC
• Several OOSC have progressed beyond
the point of being likely to be enrolled in
formal education regardless of
intervention (Unicef 2014).
• High dropout numbers in early grades
are responsible for the majority of OOSC
(Unicef 2014).
• Strengthen alternative and flexible
programs to targeted populations and
in areas with high proportion of OOSC,
ensuring relevance to local contexts
(Unicef 2014)
• Strengthen accountability at school
level in terms of social mapping of
OOSC in their catchment areas and
including strategy in their SIPs to
enroll them (DoE 2013b)
• Expansion of ECED should be
targeted, focusing on areas with low
educational and life outcomes and
high numbers of OOSC and basic
education drop out/ retention rates.
Addressing economic
barriers to education
Children from deprived Dalit groups remain
out-of-school due to poverty and perceived
loss of opportunity of income when sending
children to school DoE 2014c.
• Need-based and targeted
scholarships to counter economic
barriers.
• Provision of midday meals in food
deficient areas (Chettiparambil-
Rajan, 2007).
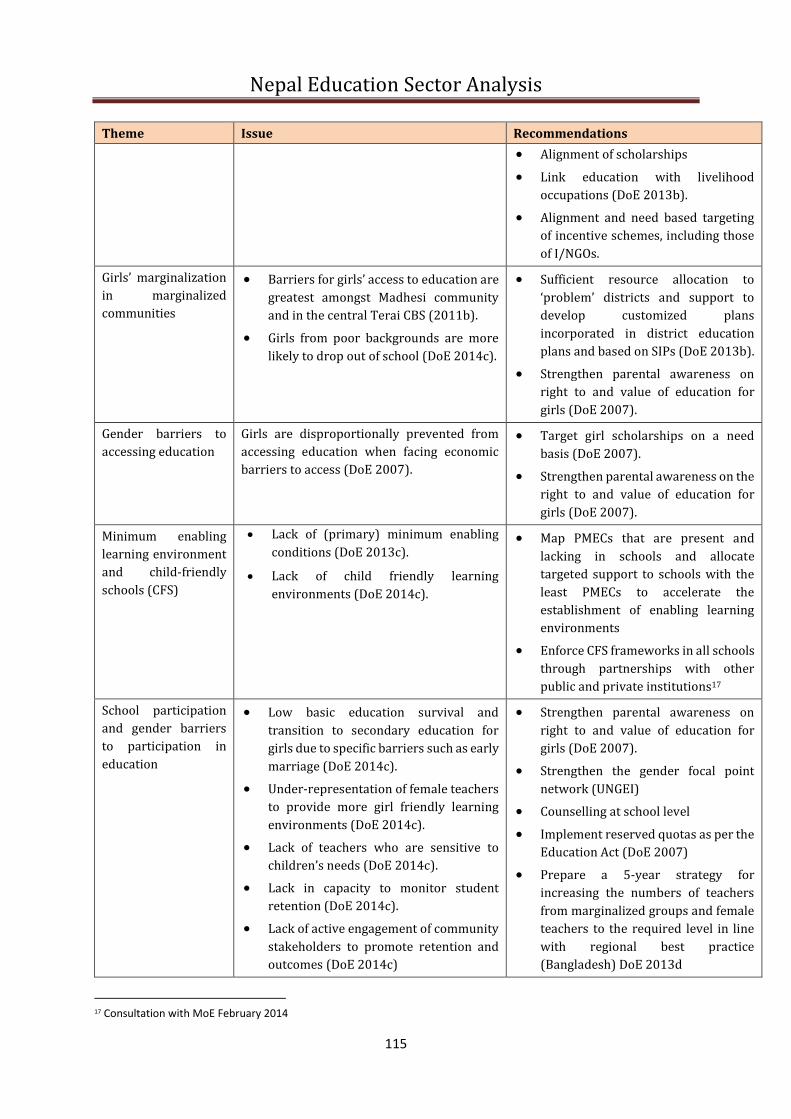
Nepal Education Sector Analysis
115
Theme Issue Recommendations
• Alignment of scholarships
• Link education with livelihood
occupations (DoE 2013b).
• Alignment and need based targeting
of incentive schemes, including those
of I/NGOs.
Girls’ marginalization
in marginalized
communities
• Barriers for girls’ access to education are
greatest amongst Madhesi community
and in the central Terai CBS (2011b).
• Girls from poor backgrounds are more
likely to drop out of school (DoE 2014c).
• Sufficient resource allocation to
‘problem’ districts and support to
develop customized plans
incorporated in district education
plans and based on SIPs (DoE 2013b).
• Strengthen parental awareness on
right to and value of education for
girls (DoE 2007).
Gender barriers to
accessing education
Girls are disproportionally prevented from
accessing education when facing economic
barriers to access (DoE 2007).
• Target girl scholarships on a need
basis (DoE 2007).
• Strengthen parental awareness on the
right to and value of education for
girls (DoE 2007).
Minimum enabling
learning environment
and child-friendly
schools (CFS)
• Lack of (primary) minimum enabling
conditions (DoE 2013c).
• Lack of child friendly learning
environments (DoE 2014c).
• Map PMECs that are present and
lacking in schools and allocate
targeted support to schools with the
least PMECs to accelerate the
establishment of enabling learning
environments
• Enforce CFS frameworks in all schools
through partnerships with other
public and private institutions17
School participation
and gender barriers
to participation in
education
• Low basic education survival and
transition to secondary education for
girls due to specific barriers such as early
marriage (DoE 2014c).
• Under-representation of female teachers
to provide more girl friendly learning
environments (DoE 2014c).
• Lack of teachers who are sensitive to
children’s needs (DoE 2014c).
• Lack in capacity to monitor student
retention (DoE 2014c).
• Lack of active engagement of community
stakeholders to promote retention and
outcomes (DoE 2014c)
• Strengthen parental awareness on
right to and value of education for
girls (DoE 2007).
• Strengthen the gender focal point
network (UNGEI)
• Counselling at school level
• Implement reserved quotas as per the
Education Act (DoE 2007)
• Prepare a 5-year strategy for
increasing the numbers of teachers
from marginalized groups and female
teachers to the required level in line
with regional best practice
(Bangladesh) DoE 2013d
17 Consultation with MoE February 2014

Nepal Education Sector Analysis
116
Theme Issue Recommendations
• Redeploy teachers on a need base to
targeted schools and areas
• Strengthen roles and responsibilities
of SMCs, resource persons and school
supervisors (Unicef 2014).
• Improve the data management
system for marginalized groups. Use
Consolidated Equity Strategy (DoE
2014c)
Inclusive education Lack of inclusion of CwDs in regular
education. Flash data shows decline in
retention and completion of CwDs in basic
education (DoE 2014c).
• Train and support parents of CwDs to
exchange information and provide
peer support (HRW 2011).
• Develop appropriate curricula for
children with intellectual or
developmental disabilities and in sign
language and braille (HRW 2011).
• strengthen TPD on CwDs (HRW
2011).
Medium of
instruction (MoI) and
barriers to mother
tongue education
(MTE) and
professional
development
• 35% of schools do not use a MoI that
most students understand. In most of
these schools children belong to two or
more language groups18
• 45% of teachers believe that it is better
to learn Nepali first and mother tongue
as a second language (RTI and New ERA
2014).
• 32% of teachers do not share the same
language as the students in their classes
(RTI and New ERA 2014).
• Although curricula have been developed
in 22 mother tongue languages, teacher
professional development and pedagogy
have not been developed and rolled out
accordingly (CDC 2013)
• Undertake a study on language of MoI
in education and the mother tongue
language and effects on learning
outcomes for children with a mother
tongue other than Nepali.19
• Ensure that the development of a
comprehensive language policy is
informed by the outcomes of the
above MoI study, as well as findings
from the EGRA and NASA report.
Barriers to learning
outcomes • Low performing students are
concentrated in certain schools and
districts. Children performing paid work
score statistically lower than other
children on learning outcomes (DoE
2014c).
• Further research is needed to identify
barriers to learning outcomes
• Involve child clubs and PTAs for
assessing enabling learning
environments.
18 57% of all schools had most students having not or little understanding of Nepali language at time of joining (RTI and New
ERA 2014)
19 SSRP Quality Thematic Working Group, 2014
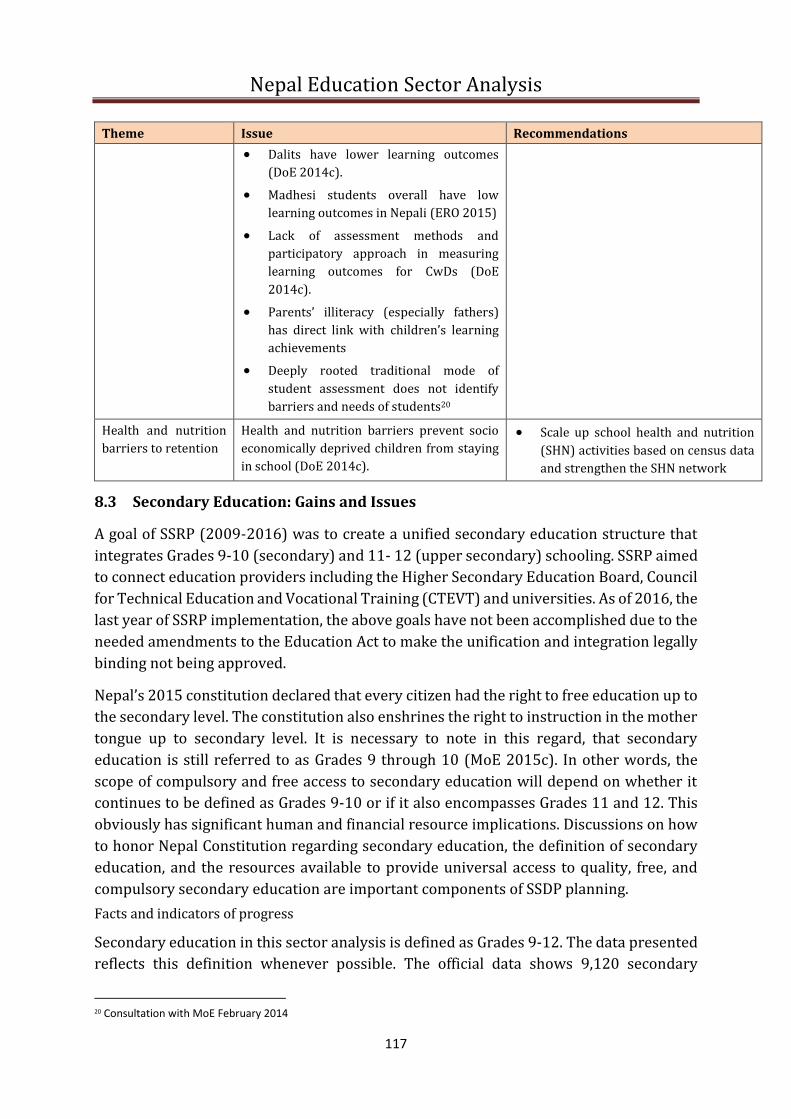
Nepal Education Sector Analysis
117
Theme Issue Recommendations
• Dalits have lower learning outcomes
(DoE 2014c).
• Madhesi students overall have low
learning outcomes in Nepali (ERO 2015)
• Lack of assessment methods and
participatory approach in measuring
learning outcomes for CwDs (DoE
2014c).
• Parents’ illiteracy (especially fathers)
has direct link with children’s learning
achievements
• Deeply rooted traditional mode of
student assessment does not identify
barriers and needs of students20
Health and nutrition
barriers to retention
Health and nutrition barriers prevent socio
economically deprived children from staying
in school (DoE 2014c).
• Scale up school health and nutrition
(SHN) activities based on census data
and strengthen the SHN network
8.3 Secondary Education: Gains and Issues
A goal of SSRP (2009-2016) was to create a unified secondary education structure that
integrates Grades 9-10 (secondary) and 11- 12 (upper secondary) schooling. SSRP aimed
to connect education providers including the Higher Secondary Education Board, Council
for Technical Education and Vocational Training (CTEVT) and universities. As of 2016, the
last year of SSRP implementation, the above goals have not been accomplished due to the
needed amendments to the Education Act to make the unification and integration legally
binding not being approved.
Nepal’s 2015 constitution declared that every citizen had the right to free education up to
the secondary level. The constitution also enshrines the right to instruction in the mother
tongue up to secondary level. It is necessary to note in this regard, that secondary
education is still referred to as Grades 9 through 10 (MoE 2015c). In other words, the
scope of compulsory and free access to secondary education will depend on whether it
continues to be defined as Grades 9-10 or if it also encompasses Grades 11 and 12. This
obviously has significant human and financial resource implications. Discussions on how
to honor Nepal Constitution regarding secondary education, the definition of secondary
education, and the resources available to provide universal access to quality, free, and
compulsory secondary education are important components of SSDP planning.
Facts and indicators of progress
Secondary education in this sector analysis is defined as Grades 9-12. The data presented
reflects this definition whenever possible. The official data shows 9,120 secondary
20 Consultation with MoE February 2014
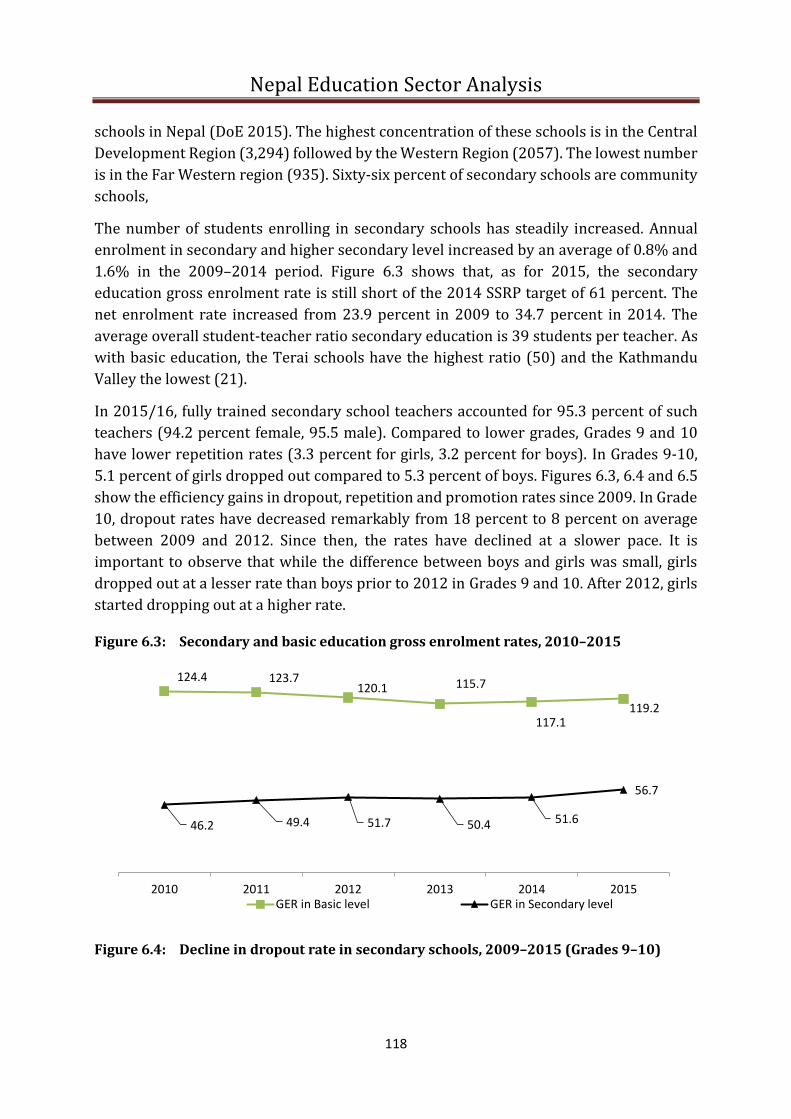
Nepal Education Sector Analysis
118
schools in Nepal (DoE 2015). The highest concentration of these schools is in the Central
Development Region (3,294) followed by the Western Region (2057). The lowest number
is in the Far Western region (935). Sixty-six percent of secondary schools are community
schools,
The number of students enrolling in secondary schools has steadily increased. Annual
enrolment in secondary and higher secondary level increased by an average of 0.8% and
1.6% in the 2009–2014 period. Figure 6.3 shows that, as for 2015, the secondary
education gross enrolment rate is still short of the 2014 SSRP target of 61 percent. The
net enrolment rate increased from 23.9 percent in 2009 to 34.7 percent in 2014. The
average overall student-teacher ratio secondary education is 39 students per teacher. As
with basic education, the Terai schools have the highest ratio (50) and the Kathmandu
Valley the lowest (21).
In 2015/16, fully trained secondary school teachers accounted for 95.3 percent of such
teachers (94.2 percent female, 95.5 male). Compared to lower grades, Grades 9 and 10
have lower repetition rates (3.3 percent for girls, 3.2 percent for boys). In Grades 9-10,
5.1 percent of girls dropped out compared to 5.3 percent of boys. Figures 6.3, 6.4 and 6.5
show the efficiency gains in dropout, repetition and promotion rates since 2009. In Grade
10, dropout rates have decreased remarkably from 18 percent to 8 percent on average
between 2009 and 2012. Since then, the rates have declined at a slower pace. It is
important to observe that while the difference between boys and girls was small, girls
dropped out at a lesser rate than boys prior to 2012 in Grades 9 and 10. After 2012, girls
started dropping out at a higher rate.
Figure 6.3: Secondary and basic education gross enrolment rates, 2010–2015
Figure 6.4: Decline in dropout rate in secondary schools, 2009–2015 (Grades 9–10)
124.4 123.7120.1 115.7
117.1119.2
46.2 49.4 51.7 50.4 51.6
56.7
2010 2011 2012 2013 2014 2015GER in Basic level GER in Secondary level
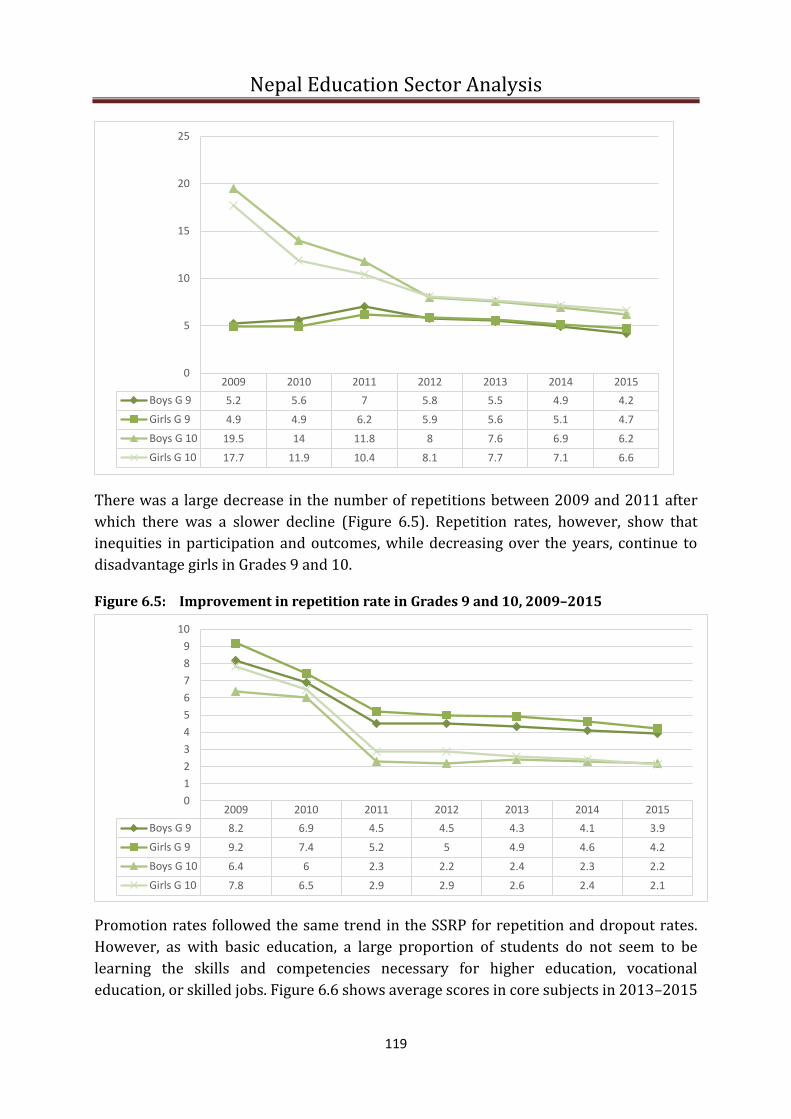
Nepal Education Sector Analysis
119
There was a large decrease in the number of repetitions between 2009 and 2011 after
which there was a slower decline (Figure 6.5). Repetition rates, however, show that
inequities in participation and outcomes, while decreasing over the years, continue to
disadvantage girls in Grades 9 and 10.
Figure 6.5: Improvement in repetition rate in Grades 9 and 10, 2009–2015
Promotion rates followed the same trend in the SSRP for repetition and dropout rates.
However, as with basic education, a large proportion of students do not seem to be
learning the skills and competencies necessary for higher education, vocational
education, or skilled jobs. Figure 6.6 shows average scores in core subjects in 2013–2015
2009 2010 2011 2012 2013 2014 2015
Boys G 9 5.2 5.6 7 5.8 5.5 4.9 4.2
Girls G 9 4.9 4.9 6.2 5.9 5.6 5.1 4.7
Boys G 10 19.5 14 11.8 8 7.6 6.9 6.2
Girls G 10 17.7 11.9 10.4 8.1 7.7 7.1 6.6
0
5
10
15
20
25
2009 2010 2011 2012 2013 2014 2015
Boys G 9 8.2 6.9 4.5 4.5 4.3 4.1 3.9
Girls G 9 9.2 7.4 5.2 5 4.9 4.6 4.2
Boys G 10 6.4 6 2.3 2.2 2.4 2.3 2.2
Girls G 10 7.8 6.5 2.9 2.9 2.6 2.4 2.1
0
1
2
3
4
5
6
7
8
9
10

Nepal Education Sector Analysis
120
while Figure 6.7 shows the decreasing proportion of students passing the SLC with more
girls than boys failing.
Figure 6.6: Average scores in core subjects, 2013–2015
Source: DoE flash Reports 2013-2015
Figure 6.7: Percentage of students passing SLC, 2009–2015
Except for the Central and Western regions, the percentage of students passing the SLC in
2012-2015 was less than 50 percent (Figure 6.8). And girls remain less likely than boys
to pass the SLC (Figure 6.9). Disaggregating regional percentages by gender shows a wide
gender gap between boys and girls.
Figure 6.8: Students passing SLC by five development regions, 2012 to 2015
English Nepalese Math ScienceSocial
Studies
2013 31 45 38 26 39
2014 30.26 44.79 36.4 26.9 39.49
2015 31.31 44.02 35.31 25.76 37.89
Max score 75 100 100 75 100
75
100
100
75
100
0102030405060708090
100
2009 2010 2011 2012 2013 2014 2015
Average 68.5 64.3 55.5 47.2 41.36 43.92 33.74
Girls 64.3 60.6 51.44 43.63 42.56 38.27 28.25
Boys 72 67.6 59.12 56.36 57.43 49.43 39.85
0
10
20
30
40
50
60
70
80

Nepal Education Sector Analysis
121
Source: Flash Reports 2012 - 2015
Figure 6.9 shows that the wide gender gap disadvantaging girls in the five regions. The
gap is slightly narrower in the central region, but the gap has not decreased since 2012.
The Mid-Western and Far Western Regions have the widest gender gap in passing the SLC.
Figure 6.9: Gender gap in passing SLC exams, 2012 and 2015
Other issues related to secondary education
The following other issues were identified by the secondary education working group.
Most of the problems identified have implications in terms of access to secondary
education (including Grades 11 and 12), quality, efficiency, equity, and equity.
1. Secondary schools are established based on demand — The equity vs. efficiency
conundrum. Populations in remote areas have limited access to secondary education
services. Conversely, when secondary schools are established, there is low demand
due to low student population.
35
.4
59
.1
53
.3
31
.5
41
.9
31
.9
52
.53
49
.85
26
.8 29
.6434
.17
55
.05
49
.84
37
.08
25
.44
40
.08
59
.6
53
.07
35
.54
31
.3
E A S T C E N T R A L W E S T M I D W E S T F A R W E S T
2012 2013 2014 2015
East Central West Mid West Far West
Boys 12 55.67 54.96 55.71 59.68 62.14
Girls 12 44.32 45.03 44.28 40.32 37.85
Girls 15 33.33 54.48 46.28 28.54 22.88
Boys 15 47.39 64.54 59.83 42.92 39.29
0
20
40
60
80
100

Nepal Education Sector Analysis
122
2. Curriculum issues: There is no unified curriculum structure at secondary level;
secondary schools may not offer subjects that students want; and subjects such as
science and math are not delivered properly because schools lack the necessary
infrastructure. The science and mathematics curricula need to be revisited to be
accessible to the majority of students. This also applies to vocational subjects.
Textbooks are lacking in vocational streams. Part of the curriculum redesign should
include providing pathways that allow students in academic streams to take
vocational classes and vice versa. ‘Multiple pathways’ have not been created at the
higher secondary level.
3. Implementing free secondary education: There is a need for more effective
management to focus scarce resources (scholarships) to achieve free secondary
education to benefit those who need this support the most.
4. Private schools and equity: Private schools have expanded access to secondary
education, but at the expense of community schools. More efforts are thus needed to
promote social responsibility among private schools, and ensure that their expansion
does not prevent children who cannot afford private school fees from accessing
secondary education.
5. Quality, relevance, and effectiveness: Exam scores in Grades 9, 10, 11, and 12
demonstrate that gains in access have not been accompanied with gains in quality of
learning. Problems with instructional quality are rooted in problems in access to
skilled and dedicated teachers, the dearth of appropriate instructional infrastructure,
ineffective school management, and a lack of student motivation. Secondary education
is perceived as largely irrelevant to the country’s social and economic development. It
preparing many educated and unemployed youth.
6. Teacher management: Secondary education lacks a dedicated teacher commission for
recruiting, preparing, and inducting secondary school teachers. Secondary schools
operate without the needed expert subject teachers (in regular academic subjects and
vocational steams). Teacher preparation programs need to equip head teachers with
the skills to manage schools effectively. The provision of part-time expert teachers can
help address the lack of expert subject teachers.
7. Continuous professional development (CPD): CPD is an essential step in continuously
updating teachers’ knowledge and skills. In addition to helping them teach better, CPD
enhances their professionalism and encourages more dedication.
8. Infrastructure: Compulsory infrastructure such as classrooms, libraries, computers,
science labs and playgrounds are not available in many schools. This makes it difficult,
if not impossible, to deliver instruction that requires experimentation and hands-on
practice, as in the vocational stream. Students who do not benefit from rich learning
experiences lack the practical skills that qualify them for jobs.
9. Financing secondary education: Secondary education has been declared free and
compulsory, but the government’s resources are insufficient to pay for universal
Nepal Education Sector Analysis
123
secondary education. Local contributions to supporting education are either weak or
non-existent. Generating more funds optimizing existing infrastructure and grouping
students in sparsely populated areas in bigger schools are some of the proposed
solutions to address the funding shortage. Given that for many students, secondary
education (including higher secondary) is a terminal degree, employers need to be
involved in partnerships that incentivize them to contribute to support special
streams, and hence, contribute to financing secondary education. Finally,
notwithstanding all the efforts to promote partnerships, cost-sharing, and cost-saving
in financing secondary education, the government remains the ultimate agent for
funding its transformation to an efficient system that promotes students’
socioeconomic well-being and provides the necessary supply of qualified graduates to
help the economy grow. Part of the case for more financial support for secondary
education is to win political champions who will push for more and diverse funding,
and will work with MoE to ensure that secondary education staff are well trained, well
supported, and held accountable for improving student educational outcomes.
8.4 Non-formal Education and Lifelong Learning
The distinction between formal and non-formal education is often based on where
learning takes place. Formal education primarily occurs in training establishments and
often leads to recognized outcomes and qualifications. Non-formal education has
intended learning outcomes, but the learning often happens in places where teaching is
not the primary business. In the face of a situation in Nepal of high school dropout rates,
high numbers of out-of-school children, and a high percentage of low skilled workers, and
the low fit between tertiary education and labor market needs, non-formal education and
lifelong learning are increasingly important in Nepal. The ability of Nepalese to adapt their
knowledge and skills to the needs of the modern labor market at home and abroad will
significantly determine the extent to which they can secure gainful jobs and break the
cycle of economic vulnerability.
Most non-formal education happens through labor market programs, on-the-job training,
professional associations, work experience and volunteer organizations. Informal
education comprises learning that comes because of participations in clubs, libraries,
museums, family activities, playground activities, volunteering and other arenas.
In Nepal, it seems that technical education and vocational training (TVET) is conflated
with non-formal education and lifelong learning. While, the overlap is justified in the cases
of non-formal settings, it is important to underscore that when TVET is delivered as part
of vocational streams in formal learning institutions, it is really a part of formal education.
The main challenges facing TVET in Nepal are the need for more funding, more up-to-date
curricula, better teacher training, more vocational stream choices that are relevant to the
job market have. There is, however, little information on the potential of leveraging
existing non-formal and informal channels to supplement formal education efforts in

Nepal Education Sector Analysis
124
providing courses in literacy, numeracy, and social skills that equip Nepalese of all ages
with the life skills to function independently at the personal and professional levels.
An overall priority for the educational sector has been to reduce illiteracy. To achieve this,
there has been a focus on increasing the rate of enrolment at all levels of formal education.
The focus on students graduating to the next levels of formal education has led to much
less attention on supporting students who fall out of the formal system. This has left leaves
few resources for targeting drop-out students by providing basic skills training at the
secondary level where drop-out is significant. The consequence is that students who have
dropped out enter the labor market as unskilled or low-skilled labor as they only possess
‘school knowledge’ that is not easily transformed into skills that are directly usable for
employers. The large group of unskilled labor has resulted in the falling productivity of
the economy and low quality of services. It also makes it difficult for the individuals within
the group to raise their income level and qualify for higher-level jobs.
8.5 Links with Higher Education
The ageing trend of the Nepalese population represents the ticking clock of Nepal’s
demographic dividend opportunity that must be fully seized if the country is to graduate
from the least developed category status. We have already noted that the key to cashing
on the demographic dividend is to maximize the productivity of the available human
resources. One of the means to this end is educating students to prepare them for college
and a career. The reform vision of the DoE is to produce citizens who are committed to
democracy, human rights, lifelong learning, a positive disposition toward labor and self-
employment, community participation, and active participation in solving local and
national challenges in the twenty-first century.
Higher education is often the place where these skills and dispositions are tested and
honed. However, there was no reference to links of school education with higher
education in the vision or the goals of the SSRP (MoE 2009). Thus, of the 14.5 percent of
secondary graduates who enrolled in higher education, we know very little about the
extent to which they have the dispositions necessary to succeed in higher education.
According to Conley (2003), these skills include critical and analytical thinking, problem
solving, inquisitiveness, the initiative to take advantage of university resources, openness
to trying new things and being willing to fail at tasks the first time, and the ability to accept
critical feedback and adjust accordingly. These skills are critical to achieving the DoE
vision. However, without deliberate policies and programs that link education reform to
the broader goal of preparing children who are ready for college and employment, it will
be difficult to translate DoE’s vision into an implementable and realistic strategy.
8.6 Technical and Vocational Education and Training
Another area where the connection between DoE’s vision and existing programs needs to
be strengthened is TVET. The relevant part of DoE’s vision here is citizens who have a
positive perception of labor, are oriented towards employment, and have the agency to
Nepal Education Sector Analysis
125
be active citizens. To achieve this vision, the common view of TVET as a path of second
choice needs to change. Parajuli (2013) notes that only two percent of secondary and
higher secondary students choose TVET, and that this sub-sector receives little more than
two percent of the national education budget. From a management perspective, TVET
programs need to be integrated under one structure instead of being fragmented into
multiple programs under various ministries and offices. The country has yet to have a
vocational qualifications framework even if recognition of the importance of such a
framework began as early as the 1980s. Last, but not least, there is an urgent need to
strengthen the TVET information management system.
TVET in Nepal needs strengthening in the following ways:
• Attach more importance to the knowledge heritage by documenting traditional
methods of skill and knowledge transfer and promoting an apprenticeship system
where localized knowledge, skills, and craft are passed to younger generations;
• Connect the various actors in TVET to create pathways for further development of
TVET participants; and
• Align the TVET curriculum with the demands and needs of the labor market. The
curricula are about 15 years old. They need to be modernized and connected with
modern technology, there needs to be a robust monitoring and evaluation system
that enforces uniform quality standards, and there need to be stronger links with
potential employers to ensure that the curricula and the training fit the labor
market needs.
• Institute a national vocational qualification framework that has clear and urgent
needs, demonstrates compelling benefits, and accounts for Nepal’s financial
constraints and capacities.
The taking forward of these approaches require:
• political and bureaucratic support;
• a clear line of command with an ultimate agency responsible for implementation;
• an appreciation of the multiplicity of the necessary interventions; and
• building coordination and flexible pathways that connect formal and non-formal
systems of TVET, reducing barriers to access to TVET,
• an integrated system of credit, planning, management, marketing, logistical,
support, technical support, and
• networking with TVET private and public stakeholders that will make TVET
relevant and responsive to market demands.
All these changes are contingent on a functional TVET information management system
that helps identify needs, disaggregates services and beneficiaries, better tracks the use

Nepal Education Sector Analysis
126
of resources, and hence strengthen the governance of TVET, and thus its attractiveness to
private investors.
8.7 ICT in Education
The vision of the Information and Communication Technology (ICT) in Education Master
Plan (2013 – 2017) (MoE 2013) is the extensive use of ICT in the education sector and
using ICT as a means of access to and enhancing the quality of education. The mission is
to narrow down the digital divide through the development of ICT infrastructure, human
resources, digital content and education system enhancement. According to UNESCO’s
Institute of Statistics (2012), only 6 percent of primary schools and 24 percent of
secondary schools are connected to the electricity grid. One percent of primary school and
6 percent of secondary schools have internet connections. And only 0.5 percent of primary
schools and 4 percent of secondary schools use computer-assisted instruction. These data
indicate that the digital divide is rather daunting to solve in a short time.
ICT needs to be integrated within the National Information Communication Technology
policy to speed up the penetration of ICT in education. Given the large amount of funding
needed to increase the penetration of ICT in Nepal’s schools, efforts are needed to
mobilize the private sector, telecommunication operators, and civil society to contribute
to support the closing of the digital divide in schools. This should include adopting local
solutions to the generation of electricity and partnerships with local entrepreneurs (cyber
café owners) to improve access to the internet. MoE-led solutions should also include
strategies aimed at funding the ICT infrastructure in pilot schools (with support for
electricity and internet connections, computers, trained staff and digital media),
modelling the use of technology in instruction, training teachers in the use of technology
and demonstrating how ICT can be used to reduce teachers’ workload and improve
students focus, retention, and learning. Last, but not least, efforts to support ICT in
education should benefit from efforts to expand the TVET infrastructure as ICT in schools
will help fulfil the goal of improving access to quality education while planting the seeds
for interest in one area of TVET early in children’s lives.
8.8 Teacher Management and Capacity Development
At the national level, the Teacher Service Commission (TSC) is ultimately responsible for
licensing and selecting permanent teachers. However, the district level is primarily
responsible for teacher management with DEOs playing a crucial role in recruiting,
deploying and redeploying teachers. SMCs are responsible for the recruitment of
temporary teachers in their respective schools.
The National Centre for Educational Development (NCED) manages in-service training for
both lower secondary and secondary teachers. Trainings are offered in educational
training centers under the overall supervision of NCED. The standard teacher training
program lasts ten months through separate packages: the first package is for 2.5 months,
the second for five months, and the third for 2.5 months. Participation in training courses

Nepal Education Sector Analysis
127
is taken into consideration in teachers’ career development. DEOs consult with SMCs
regarding in-service teacher training. There are no institutionalized in-service teacher
training opportunities for higher secondary teachers.
Applicants must have twelve years of education to be eligible to teach at lower secondary
level. Candidates whose major subject was not education have to take the ten-month
teacher training program. These programs are offered by training institutions at the
higher secondary level, with NCED being overall responsible for these courses.
Secondary school teachers need a bachelor’s degree (equivalent to fifteen years of
education) and must complete the ten-month teacher training course if their major
subject was not education. In addition, all applicants need to pass a teacher licensing
examination (administered annually by TSC) to be eligible for recruitment. These licenses
are permanently valid. Applicants are also required to complete practicum training for
one to one-and-a-half months for both lower secondary and secondary level teaching.
There is no teacher licensing system for higher secondary teachers.
In general, teacher training in Nepal’s universities has not produced skilled teachers. MoE
operates in-service teacher training mainly to achieve quantitative targets. However,
many evaluators of the training programs see no significant difference between the
teaching of trained teachers and untrained teachers.
In 2008, the teaching behavior of trained teachers indicated that the existing pre-service
and in-service training system needed thoroughly reforming. NCED is the apex body to
advise the government on all aspects of teacher development. However, it has not been
equipped with the caliber of professionals needed to carry out such an important task.
NCED does not have a mechanism to use professional institutions and individuals to
develop plans and programs on teacher development. In 2008, secondary teacher training
in Nepal was in a chaotic state. The 2008 emergence of a few new universities and the
unplanned expansion of teacher training campuses of Tribhuvan University changed the
scenario of secondary teacher training. The government established NCED as the entity
to coordinate teacher training. However, the new entity was not equipped with adequate
professional staff and it has been overwhelmed with implementing the in-service training
of primary and secondary teachers. It is recommended that studies are carried out to
identify the status of secondary teacher training as a basis for policy and plan formulation
and to assess the teaching behaviors of trained teachers.
In 2010, MoE introduced the Teacher Development Policy Guideline (NCED 2010) as an
implementation tool for policies envisioned under SSRP’s teacher development
component. The plan had already laid down indicative policies on teacher development
concerning i) selection and recruitment; ii) qualification requirement; iii) teachers’
preparation; iv) in-service teachers’ development; v) career path and promotion; vi)
specialized teaching cadres; vii) teacher performance monitoring; and viii) head teacher
selection and training requirement.

Nepal Education Sector Analysis
128
The third policy, teachers’ preparation and professional development, is designed to
create a framework and modalities for in-service teacher training programs. Besides,
policy action devoted to create multiple opportunities for teachers having different terms
of tenure are the main content in this section. It is ensured by policy that teachers
designated for different assignments can access appropriate specialized training courses
rather than just attending the conventional, one-fits-all-package. Under this policy, every
teacher working in government aided schools will be provided access to a one-month
teacher professional development (TPD) course by 2015. Furthermore, multiple avenues
of teacher development will be introduced for the continuous professional development
of the teachers. Orientation courses (of up to two weeks) will also be made available
through the NCED system for those teachers who are assigned for additional teaching
responsibilities such as teaching in open schools, non-formal classes, alternative and
flexible classes. Lastly, teachers designated for teaching through ICT methodologies will
be provided with 1-3 months of intensive capacity building training under education
training centers. In regards to “inclusive teachers”, separate training provision will be
made for the requirement of teaching multilingual students, special needs' students, and
multi-grade classes. For example, permanent arrangements will be created under NCED
system to provide 1-3 months' capacity building training for the identified teaching
cadres.
There has been a noticeable improvement in teacher capacity and development between
2008 and 2015. In 2009, only 73% of primary teachers had been trained with a further
14 percent partially trained and 13 percent untrained. The greatest improvement
happened between 2009 and 2011 probably due to the introduction of the Teacher
Development Policy Guidelines. These guidelines introduced reforms to improve the
capacity, training, and development of teachers. There was a marked improvement in the
proportion of trained teachers in 2011 — by about 20 percentage points (Figure 6.10).
Since then the proportion of trained teachers has steadily improved with a concomitant
fewer untrained and partially trained teachers.
Figure 6.10: Teacher training status in primary schools (2009-2014)

Nepal Education Sector Analysis
129
The emergence of new educational establishments and the unplanned expansion of
teacher training campuses under Tribhuvan University in 2008 may have been
responsible for the low percentage of secondary teachers trained teachers in 2009 (57
percent) (Figure 6.11). From 2009 to 2010 and 2010 to 2011, the percentage of trained
teachers improved by 7% and 14% respectively with the associated declines in the
proportion of partially trained and untrained teachers. There has been a slow and steady
increase since then in the proportion of trained teachers.
Figure 6.11: Percentage of trained teachers employed in secondary schools (2009-2014)
Staffing levels have increased dramatically over the past 10 years; the overall student–
teacher ratio has fallen from 42:1 in 2004 to 25:1 in 2014. However, there are still huge
regional disparities with ratios ranging from 49:1 in the central Terai and 39:1 in the Far
Western Terai to 5:1 in the Western Mountains. These disparities are linked in part to
varying service conditions, salaries and benefits under which teachers are hired. As MoE
has shifted the responsibility for hiring teachers to SMCs, over a half of teachers have been
0
10
20
30
40
50
60
70
80
90
100
2009 2010 2011 2012 2013 2014
Per
cen
t o
f Tr
ain
ed T
each
ers
Trained
Partially Trained
Untrained
0
10
20
30
40
50
60
70
80
90
2009 2010 2011 2012 2013 2014
Per
cen
t o
f Tr
ain
ed T
each
ers
Trained
Partially Trained
Untrained

Nepal Education Sector Analysis
130
hired under temporary status contracts, which provide lower salaries, fewer benefits and
fewer opportunities for training. At the same time, it is acknowledged that there are
widespread problems in the transparency and quality of local hires under SMCs.
At least 90% of all teachers had been fully trained as of 2012 (Figure 6.12) across all five
development regions. This indicates that training capacity is fairly distributed across the
country. The proportion of partially trained and untrained teachers is also similar across
the country indicating that all the regions share common challenges in the training
teachers.
Figure 6.12: Primary school teachers' training at development region, (%) 2012
Despite the large advances, there is still a lack of effective performance management or
clear career paths and incentives for teachers. In 2013, a Teacher Management Study was
undertaken, covering recruitment, transfer and deployment, equity and quotas, a Teacher
Management Information System (TMIS), job descriptions and performance
management. Based on its findings, a teacher competency framework is being developed
to re-establish the critical link between teacher management and classroom learning, and
to rekindle a sense of professionalism.
8.9 Capacity Development
The Human Resource Development Plan (2002–2006) considered capacity development
program as a very important target towards providing education for all by 2015. The SSRP
contained several programs for improving the efficiency of service distribution and set
targets for building capacity in the sector through a work plan. SSRP’s mid-term
evaluation (Cumming et al. 2012) found that many capacity development activities had
been carried out including:
• national work structure prepared for capacity development by MoE;
• SMCs and guardians trained;
• teacher training conducted to build up their professionalism;
0.0
10.0
20.0
30.0
40.0
50.0
60.0
70.0
80.0
90.0
100.0
Eastern Dev Central Dev Western Dev Mid Western Far Western
Fully Trained
Partial Trained
Nepal Education Sector Analysis
131
• short term training conducted for several levels of staffs by educational human
resource development centers.
However, these activities have been insufficient to build up the level of capacity envisaged
in the SSRP.
Human resource development occurs at the individual, organizational and system levels.
Key SSRP provisions have not been fully implemented because of capacity development
weaknesses at the individual, organizational and system levels. The SSDP working group
has proposed a 50-point capacity building scenario for Nepal’s education sector under
these three levels:
• Individual level — improve technical skills to execute tasks, use the curriculum,
plan, monitor, supervise and document using ICT.
• Organizational level — create appropriate environments for executing tasks
through better work conditions, more cooperation and team work, action learning,
and promoting higher exchange and coordination between branches and
authorities within the school sector.
• Systems levels — improve staff selection, assign tasks, prepare rules and
regulations, develop work details, conduct evaluations and institute transparent
systems of promotion.

Nepal Education Sector Analysis
132
9. IMPACT ANALYSIS OF THE EVENTS IN 2015/16 ON NEPAL'S SCHOOL
SECTOR
9.1 Background and Context
Background to Nepal's School Education Subsector
The government of Nepal has initiated a series of large scale reforms in the school
education sub-sector beginning in the early 1990s. These include the Basic and Primary
Education Programs (BPEP I and II; 1992-2004), the Education for All Program (EFA;
2004-2009), and the School Sector Reform Plan (SSRP; 2009-2016). The School Sector
Reform Plan (SSRP) was completed in July 2016, and preparations for the successor
program (School Sector Development Plan or SSDP) were initiated from 2015. The SSDP
is being implemented over a seven-year period beginning from July 2016. As a result of
reforms undertaken during the implementation of previous education sector plans, Nepal
has made impressive gains particularly in expanding access and improving participation
at all levels of the school education, including early childhood education and development,
and to a limited extent in enhancing quality and relevance and learning outcomes21.
The SSDP is based on a Theory of Change that was informed by the education sector
analysis (MoE 2016). This analysis considered the rich qualitative and quantitative data
accumulated within the Nepal education sector over the past decade, supported by
supplementary thematic studies to address knowledge gaps identified through the
consultations within SSDP’s thematic working groups (TWGs) and with stakeholders and
experts. Based on the analyses of context, progress, remaining challenges and constraints,
imperatives and key result areas were identified as components of the Plan’s Theory of
Change (ToC) to bring about transformative change and the envisioned results and
outcomes of the SSDP as stated in Chapter 2. Improvements in each focus area need to be
sustained through various strategies, interventions and activities from ECED/PPE
through to the secondary education phase. It is essential that progress is made in all focus
areas across the various phases and on all plan components. The cumulative effect of
success in each strategic priority area will fulfill the SSDP’s purpose to improve equity,
quality, efficiency, governance and management, and resilience of the education sector.
Context for Impact Analysis
The year 2015-16 was historic in both positive and negative terms. In addition to the
earthquake and the economic blockade, there were developments at the political level
that are expected to have an impact on the trend and projections of education outcomes
in Nepal. Nepal promulgated a new Constitution in September 2015, with federalism and
state restructuring at its core. The same year, the government initiated the formulation of
the SSDP for the next seven years. More recently the long awaited eighth amendment of
21Poyck, Maria Catharina, BidhyanathKoirala, Prem Narayan Aryal and Nanda Kishore Sharma. 2016. Joint Evaluation of
Nepal's School Sector Reform Program 2009-2016. Final Report.

Nepal Education Sector Analysis
133
the Education Act was approved in June 2016, paving the way for some of the most critical
reforms envisaged by the SSRP and the SSDP, including the legal restructuring of the
school system into basic (covering ECED-grade 8) and secondary (grades 9-12) education.
As such, 2015-16 has presented a unique set of challenges and events that have
significantly impacted the education sector context and its outcomes. Therefore, the
impact of these events on the education sector, especially on the key performance targets,
and strategic and programmatic priorities of the SSDP, require further analysis and
projection for the medium and long term, as recommended in the 2015 Post Disaster
Needs Assessment (PDNA). It is in such a context that this impact analysis has been
undertaken.
The ESA has been undertaken to ensure a strong evidence base on which the SSDP is being
developed. However, the trend analysis and projections that were done to inform the
development of the SSDP Program and Result Framework were largely done when the
events in 2015, described above occurred. This created the need to scrutinize those
findings and ensure that our assumptions and projections were still valid. Especially as
the equity strategy shows that defined groups suffer from multi-dimensional barriers that
affect them disproportionally in terms of access, participation and learning outcomes. The
events will have had stronger impact on certain dimensions than others and as such
affected certain groups and children stronger than others. The goal therefore is to
scrutinize the work done to establish an evidence base for the development of the SSDP
by taking the immediate short term effect and the assumed medium and long term effect
of the events into consideration against the pre-existing resilience and vulnerabilities of
groups that were affected by the disaster through undertaking a mixed method analysis
of available secondary data.
9.2 Objectives of the Impact Analysis
The specific objectives of this task are as follows:
• Validate the preliminary calculations and analyses on impact of the (i) 2015
earthquake, (ii) 2015-16 economic constraints and political agitation, (iii) 2015
adoption of Nepal's constitution, and, (iv) 2016 amendment of the education act,
against the SSDP Key Performance Indicators and outcomes
• Project the medium (3 year) and long term (7 year) impact and implications of the
events on the SSDP KPIs, with desegregation of these for specific groups identified
against the dimensions of the Consolidated equity strategy for the school
education sector in Nepal.
• Produce a report of the analyses.
• Produce a shorter brief of analyses and policy recommendations based on the full
report properly laid out with the concerned tables and figures for general
population.

Nepal Education Sector Analysis
134
9.3 Methodology
As the purpose of this impact diagnosis is to ensure the credibility of the assumptions and
data based on which the education sector pan was developed, within the context of the
data that would be needed to allow a full-fledged impact analysis yet to become available,
the methodological framework developed for this impact diagnosis attempts to allow for
comparing the events that took place in 2015 in terms of the impact they had on the
education outcomes and will have on the short (2 years) and medium (5 years) time to
enable to scrutinize the outcomes and recommendations made as a result of the
undertaken education sector analysis and the baseline that was stashed at the end of the
SSRP as these form the foundation on which the SSDP results framework, targets and
strategies have been developed. In addition, the impact of the 2015 events is to be seen
against pre-existing vulnerabilities.
To establish a theoretical framework, international literature on impact of disruption of
education and on pre-existing vulnerabilities was reviewed, as well as additional
literature and data on the impact of the events in Nepal. Based on this, two groups were
assembled with the first one constituting events that disrupted education either directly
or indirectly (the earthquake and the blockade) and the second group being events that
impacted education indirectly (the promulgation of the constitution and the amendment
of the education act), as has been displayed below in Figure 1.
Figure 1: Impact on Education Outcomes Model
To measure the impact against pre-existing vulnerabilities, the theoretical framework of the Consolidated Equity Strategy for the School education sector in Nepal (Equity Strategy) was used (Figure 2). The framework is based on the work by Sen, Nussbaum and others on the capability approach, and therefore builds on the concept of identification and removal of constraints and barriers to people’s capability sets (or freedoms as Sen brands these). Furthermore, the Equity Strategy’s framework considers disparities at all times be of a multi-dimensional nature. This means that children are not unable to access school just because they are a girl, from an ethnic minority, living in a
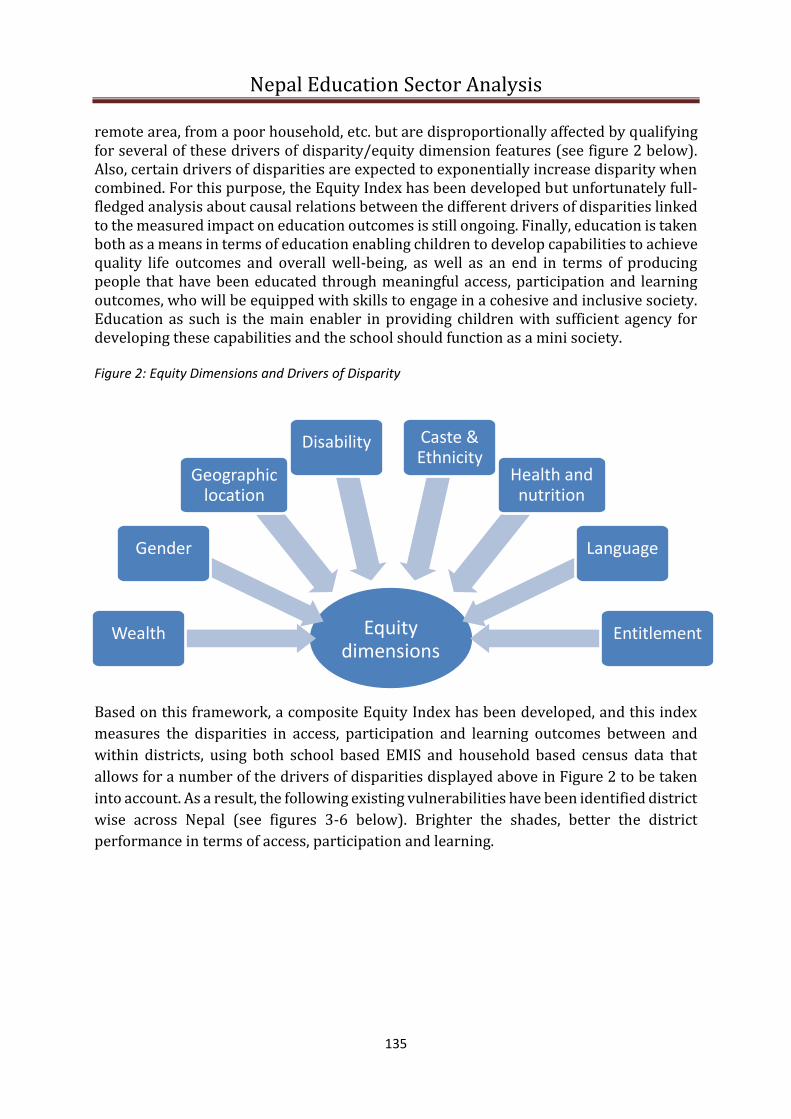
Nepal Education Sector Analysis
135
remote area, from a poor household, etc. but are disproportionally affected by qualifying for several of these drivers of disparity/equity dimension features (see figure 2 below). Also, certain drivers of disparities are expected to exponentially increase disparity when combined. For this purpose, the Equity Index has been developed but unfortunately full-fledged analysis about causal relations between the different drivers of disparities linked to the measured impact on education outcomes is still ongoing. Finally, education is taken both as a means in terms of education enabling children to develop capabilities to achieve quality life outcomes and overall well-being, as well as an end in terms of producing people that have been educated through meaningful access, participation and learning outcomes, who will be equipped with skills to engage in a cohesive and inclusive society. Education as such is the main enabler in providing children with sufficient agency for developing these capabilities and the school should function as a mini society. Figure 2: Equity Dimensions and Drivers of Disparity
Based on this framework, a composite Equity Index has been developed, and this index
measures the disparities in access, participation and learning outcomes between and
within districts, using both school based EMIS and household based census data that
allows for a number of the drivers of disparities displayed above in Figure 2 to be taken
into account. As a result, the following existing vulnerabilities have been identified district
wise across Nepal (see figures 3-6 below). Brighter the shades, better the district
performance in terms of access, participation and learning.
Equity dimensions
Wealth
Gender
Geographic location
Disability Caste & Ethnicity
Health and nutrition
status
Language
Entitlement

Nepal Education Sector Analysis
136
Figure 3: Equity in Access across 75 districts of Nepal
Figure 4: Equity in Participation across 75 districts of Nepal
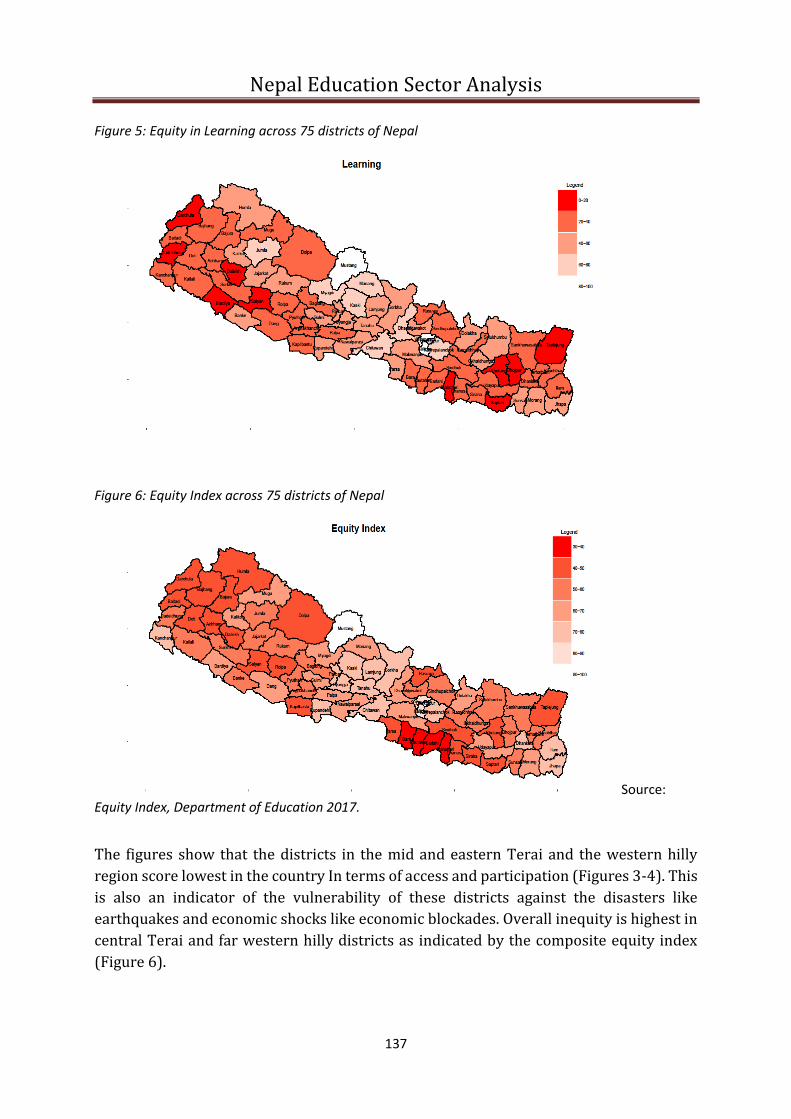
Nepal Education Sector Analysis
137
Figure 5: Equity in Learning across 75 districts of Nepal
Figure 6: Equity Index across 75 districts of Nepal
Source: Equity Index, Department of Education 2017.
The figures show that the districts in the mid and eastern Terai and the western hilly
region score lowest in the country In terms of access and participation (Figures 3-4). This
is also an indicator of the vulnerability of these districts against the disasters like
earthquakes and economic shocks like economic blockades. Overall inequity is highest in
central Terai and far western hilly districts as indicated by the composite equity index
(Figure 6).

Nepal Education Sector Analysis
138
Model for Measuring Impact of Disruption of Education
Available literature suggests that disasters may affect the education of children in at least
four ways. These include: (i) psychological impacts, including post-traumatic stress
disorders, (ii) increased incidence of child labour, (iii) constrained accessibility as a result
of damages to education infrastructure, and, (iv) increased incidence of poverty (CCD et
al, 2016). Likewise, literature on how conflicts affect education shows that: (i) Relatively
minor shocks to educational access can lead to significant and long-lasting detrimental
effects on individual human capital formation in terms of educational attainment, health
outcomes and labour market opportunities; (ii) Destruction of infrastructure, the absence
of teachers and reductions in schooling capacity affect secondary schooling
disproportionately; and, (iii) Exposure of households to violence results in significant
gender differentials in individual educational outcomes (Justino 2010). Further, such
literature also suggests that the most vulnerable group after any natural disaster are
children aged 15-18, in particular girls, and those who are poorest and are at the bottom
of the social class or caste category (Baez 2009).
In terms of impact due to disruption of the education sector as a result of the earthquake
and the economic blockade in 2015, the literature review included models used to
converge disruptions of education into impact. For this, literature on both the impact of
political crisis and conflict on education was reviewed, taking models developed for
Kenya, Syria (UNICEF 2015), and Iraq (Andrew J. & Farjo B.A., 2011), as well as literature
that modelled the impact of the economic sanctions on education (Mujahid M., 2014 et
al.). The main cross cutting method applied was to measure the impact of disruptions and
sanctions of education in terms of economic loss (both in terms of loss of income and in
terms of loss of opportunity), identifying loss of income both as a cause and an effect of
reduced education outcomes in terms of immediate loss of income (for example through
imposed economic sanctions) leading to reduced access, participation and learning
outcomes, disproportionally affected certain groups, as well as disruption of education
leading to loss of opportunity and income on the longer term due to lower education
outcomes translating into less opportunities in the labour market (see Figure 7).
Figure 7: Impact of Crisis, Disaster and Sanctions
Loss of income
Disaster/ conflict
Restriction/ sanctions
Disruption of education
Reduced education outcomes
Loss of opportunity

Nepal Education Sector Analysis
139
Based on this understanding, the available literature was reviewed related to impact of
the Nepal 2015 earthquake and economic blockade, taking the analysis presented in the
2015 Post Disaster Needs Assessment (PDNA) as a starting point. With regard to
emerging vulnerabilities, the PDNA observed that disasters affect different segments of
society in disproportional ways. Nepal is a highly diverse country in terms of geography,
demography, language and socio-economic status, and certain areas and groups tend to
be more vulnerable to disasters than others. The vulnerabilities are likely to be
exacerbated due to internal displacement and increased risks of flooding and landslides
in the rainy season.
The PDNA used pre-disaster indicators to predict education-related vulnerabilities (out-
of-school, dropout, repletion and non-completion) in the most affected, affected and
minor affected districts. It shows that there is relatively lower risk at the primary level
and higher risk at the basic level in the most affected districts, whereas there is a reversed
pattern in the minor affected districts (Table 1). Likewise, analysis of vulnerabilities in
the affected districts shows that they have a high number of children with disabilities in
ECED, requiring a special focus on this group and their transition to the primary level.
However, regarding basic and secondary level, a higher level of vulnerability is observed
in the minor affected areas, emphasizing the need for a balanced focus that accommodates
historic vulnerabilities with emerged needs. Given that the internal efficiency of the most
affected districts is higher at primary level than the secondary one, it can be concluded
that special attention needs to be paid to girls and minority groups dropout and learning
outcomes at the secondary level.
Table 1: Prediction of Internal Efficiency in the Earthquake Affected Districts
Dropout predictors
Grade 1 Grade 8
Dropout Promotion Repetition Dropout Promotion Repetition
Rate Rank Rate Rank Rate Rank Rate Rank Rate Rank Rate Rank
National 6.5 78.4 15.2 6.0 89.5 4.5
Most Affected Districts
5.7 Low 79.4 High 14.9 Low 6.9 High 87.9 Low 5.2 High
Major Affected Districts
7.2 High 76.8 Low 30.4 High 5.8 Low 89.3 Low 5.0 High
Minor Affected Districts
7.1 High 78.8 Low 14.1 Low 5.8 Low 88.1 Low 6.2 High
Table 2: Educational Vulnerabilities in the Earthquake Affected Districts
Drop-out predictors
Equity dimension
Sub group
Indicator type
Most affected
districts Major affected
districts Minor affected
districts
Children with
disabilities ECD
Percentage
7.8 9.9 6.6 6.9
Ranking High Low Low

Nepal Education Sector Analysis
140
Primary
Percentage
1.5 1.0 1.1 2.0
Ranking Low Low High
Secondary
Percentage
1.1 0.9 0.9 1.5
Ranking Low Low High
Total
Percentage
0.013
1.0 1.1 1.8
Raking Low Low High
Total age wise
Janajatis Total not attending
in the schools
5-9 Year
Percentage
11.5 14.2 10.7 18.0
Ranking High Low High
10-12 Year
Percentage
7.1 5.3 4.7 6.8
Ranking Low Low Low
13-14 Year
Percentage
9.8 8.7 7.2 8.7
Ranking Low Low Low
15-16 Year
Percentage
19.5 19.1 17.9 20.7
Ranking Low Low High
Total age wise Dalits Total not attending
in the schools
5-9 Year
Percentage
20.2 13.1 13.4 23.3
Ranking Low Low High
10-12 Year
Percentage
15.4 5.3 6.7 11.1
Ranking Low Low Low
13-14 Year
Percentage
18.2 10.7 11.9 15.2
Ranking Low Low Low
15-16 Year
Percentage
32.8 23.8 25.3 29.8
Ranking Low Low Low
Total age wise
Janajatis Total
currently attending
in the schools
5-9 Year
Percentage
88.5 85.8 89.3 82.0
Ranking Low High Low
10-12 Year
Percentage
92.9 94.7 95.3 93.2
Ranking High High High
13-14 Year
Percentage
90.2 91.3 92.8 91.3
Ranking High High High
15-16 Year
Percentage
80.5 80.9 82.1 79.3
Ranking High High Low
Total age wise Dalits
Total currently attending
in the schools
5-9 Year
Percentage
79.8 86.9 86.6 76.7
Ranking High High Low
10-12 Year
Percentage
84.6 94.7 93.3 88.9
Ranking High High High

Nepal Education Sector Analysis
141
13-14 Year
Percentage
81.8 89.3 88.1 84.8
Ranking High High High
15-16 Year
Percentage
67.2 76.2 74.7 70.2
Ranking High High High
Female age school population
Primary
Percentage
49.0 49.2 49.3 49.1
Rank High High High
Secondary
Percentage
49.2 49.6 49.8 49.4
Rank High High High
Tertiary
Percentage
50.8 51.9 52.2 51.0
Rank High High High
Female population
out-of school
Primary
Percentage
53.7 54.7 50.5 48.5
Rank High Low Low
Secondary
Percentage
49.6 47.7 46.8 49.0
Rank Low Low Low
Tertiary
Percentage
51.4 50.2 50.2 52.5
Rank Low Low High
Model for Measuring Impact of Disruption of Education and of Legal Provisions and Frameworks
With regard to the second group of events (the promulgation of the constitution and the
amendment of the education act), the impact of these events has been reviewed in terms
of opportunities these events provision. In this regard, the SSDP states the following
(p.19):
The Constitution of Nepal (2015) demands a thorough reorientation of the education system through structural and functional reforms including the policy and regulatory frameworks. The constitution guarantees the fundamental right to education and lays down the directive principles of the federal state, provinces and local bodies on education and the right to education. The Eighth Amendment of the 1971 Education Act (GoN 2016) ensures compatibility between and among educational institutions and paves the way for reforms in line with the new constitutional mandate.
More specifically, the SSDP states (p.34) that the Eight Amendment of the Education Act
includes the following provisions:
The eighth amendment of the Education Act (GoN 2016) has strengthened the enabling environment for school education by providing the basis for structural and functional reforms. It has also realigned the school structure into basic (ECED/PPE to grade 8) and secondary (grade 9 to 12) levels of education. Other key amendments are (i) the establishment of a National Education Council (NEC), led by the minister for education with the mandate to review education policies and make recommendations to the Government of Nepal, (ii) examination reform through the establishment of a National Examination Board (NEB) and the

Nepal Education Sector Analysis
142
standardization of exams at national, provincial and district levels, (iii) the institutionalization of the Education Review Office (ERO), (iv) the reformation of SMCs, as the appointment of roles/positions within the SMC will now be undertaken by its members, and (v), the strengthening of teacher management through the rationalization of teacher positions and types. The Education Act gives SMCs major responsibilities for governing and managing schools. However, the extended roles bestowed on local bodies (VDCs and municipalities) by the new constitution make it necessary to realign SMCs’ roles and responsibilities. Their roles also need realigning by reactivating and strengthening village education committees (VECs). While SMCs need to focus more on school level planning, head teachers will have an increased focus on instructional leadership including reviewing teacher performance, monitoring teachers' time on task and building the teacher capacity. SMCs and PTAs are responsible for the internal management and day-to-day functioning of schools while VDCs and municipalities and mostly responsible for ‘external’ administrative and logistical functions, including financing and accountability to provide access to quality education.
Based on these, the model on impact of education outcomes can be elaborated as below
in Figure 8. This model also takes stock of the imperatives that were identified during the
education sector analysis and builds on international research in how disruption of
education and impact on livelihoods impacts education outcomes differently for different
groups within the society. In support of the latter, the dimensions that have been
identified in the theoretical framework of the equity strategy have been adopted to allow
for this to be adequately reflected. This means that the theoretical framework that guides
this impact diagnosis is based on a number of key convictions. The first is that although
the events that occurred in 2015, although very different in nature, can be translated into
how they have affected and will affect education outcomes, in a way that allows these
impacts to be compared and consolidated. Secondly, events do not impact people in equal
manners, and therefore should be always seen together with pre-existing vulnerabilities.
Figure 8: Impact of Crisis, Disaster and Sanctions and new Legislative Provisions
Methods for Quantitative and Qualitative Analysis
This Impact Analysis uses a mixed method approach consisting of quantitative and
qualitative analyses. In carrying out the quantitative analysis of the impact of the 2015
Disaster/ conflict
Restriction/ sanctions
Disruption of education
Reduced/ increased education outcomes
Loss/gain of income
Loss/gain of opportunity
Provisions in Constitutional and regulation

Nepal Education Sector Analysis
143
events on the key performance indicators for the SSDP, we looked at the major indicators
related to access and participation only, namely net enrolment rates (NERs), promotion
and dropout rates because it was difficult to ascertain the impacts on learning
achievements given the paucity of data as well as the fact that it takes some time to see
the impact on learning outcomes. To assess the impact of the events of the year 2015, a
significant dip in the trend of KPIs and related variables are searched for. By significant,
it is meant that the dip is higher than the dips in historical data prior to the events of 2015.
This kind of dip is assumed to be the necessary condition (not sufficient though) for the
events of 2015 to have any effect on these KPIs. The NER projection exercise is done by
using the univariate time series data from 2003 to 2015 using beta regression model.
Unlike generally used linear trend model based on Normality assumption, the beta
distribution is chosen so as to take into account the fact that NER is always between 0 and
100%. Model specification is done so that all the residuals of the model are adequately
random. The estimation is done using betareg command in R and the forecasting is
produced recursively.
The qualitative analysis is based on a review of literature mainly related to how disasters
and political conflicts affect education participation and outcomes, especially for children
attending school education. It has looked at available global literature on how disasters
and political conflicts affect the participation and learning, and used them to predict and
extrapolate possible effects on Nepal's school education based on whatever empirical
evidence is available till date. These include published and unpublished reports of the
Government, Development Partners, I/NGOs, media houses and other actors. However,
the qualitative analysis did not conduct any first hand fieldwork on how the earthquake
and the economic blockade impacted upon individuals in the most affected areas of Nepal.
9.4 Limitations
This impact analysis is undertaken to validate the outcomes of the education sector
analysis against the impact of the events that took place in 2015, at a time when the full
extent and effects of these events is yet to be seen. As such, this analysis should be
regarded as a preliminary impact diagnosis of the SSDP program and results framework
that will need to be closely monitored during its implementation. As this preliminary
diagnosis was undertaken as an additional exercise at a moment when the education
sector analysis was completed and the SSDP was finalized, the authors are aware that the
implications will need to inform future reviews of the program and the annual
implementation plans rather than a substantive revision to the SSDP document itself.
With regard to the data and literature used to inform the impact analysis, it should be
noted that this exercise did not include any empirical research on how the earthquake
and the economic blockade impacted upon individuals in the most affected areas of Nepal
and that it is too early to extrapolate the effects of these events on the overall school
system. Nonetheless, this analysis is expected to provide guidance to, as well as opening

Nepal Education Sector Analysis
144
the door to conducting a full-fledged impact analysis in the future when more data and
information becomes available, such as during the mid-term review of the program.
9.5 Analysis of Impacts on Access, Participation and Outcomes in Education
This section focuses on describing and analysing the impact of the events in 2015
(earthquake and the Terai unrest and economic blockade, and promulgation of the new
constitution that also led to the Terai unrest) on the education outcomes of Nepali
children. However, before analysing the impacts on education outcomes, it is useful to
review the major macro-economic impacts of these events that were forecasted both in
the context of the earthquake and the unrest and blockade. According to the PDNA report
for the Nepal earthquake, the total value of disaster effects (damages and losses) caused
by the earthquakes was NPR 706 billion (equivalent to US$ 7 billion). Likewise, an
additional 700,000 people (between 2.5%-3.5% of the total population) were pushed into
poverty as a result of the earthquake. Analysis of the impact of the Earthquake suggests
that there was a net loss of nearly 25% of the GDP, and the annual economic growth rate
declined from 4.6% to 3.0%.22 Likewise, according to the white paper issued by the
Ministry of Finance in November 2015 in response to the Terai unrest and the economic
blockade, the protests and blockade that started from September 2015 resulted in
economic losses to the tune of NPR 200 billion and pushed the economic, social and
education, among other sectors. Annual economic growth rate was estimated to fall to 2%,
and inflation expected to increase to more than 8%.23 The PDNA stated that the
earthquake disproportionately affected the poorer, rural locations relative to the urban
and less poor areas, thus further exacerbating their already existing vulnerabilities.
Likewise, the whitepaper stated that as a result of the Tarai unrest "daily lives of women,
physically challenged people, Dalits, poor and marginal community are getting
increasingly difficult and riskier".24 In other words, the poorest and the most
marginalized households and communities were also the most vulnerable to these events
and likely underwent the most severe impact.
9.5.1 Impact on Access and Participation
According to the PDNA education sector report, the extent of damages and losses was the
highest in school education, with the subsector accounting for 88.8% of the total damages
and losses faced by the entire education sector. More specifically, 8,242 community
(public) schools were affected by the earthquake: 25,134 classrooms were fully destroyed
and another 22,097 were partially damaged. In addition, 4,416 toilets, and water,
sanitation and hygiene (WASH) facilities, and 1,791 compound walls were damaged. The
damage to ECED centres, furniture, libraries and laboratories, computers and other
22 National Planning Commission. 2015. Post Disaster Needs Assessment: Volume A: Key Findings. Kathmandu: National
Planning Commission, Government of Nepal.
23 Ministry of Finance. 2015. White Paper on the Current Economic Situation and Immediate way Forward. 24 Ibid.

Nepal Education Sector Analysis
145
equipment was proportional to the damage faced by the schools. In all, the school
education subsector faced total damages and losses amounting to NPR 27.8 billion.
However, no major damage to the teachers and MOE's service delivery infrastructure was
reported, making it easier for the quick resumption of education services.25 No damage
to education infrastructure was reported due to the events unleashed by the Tarai unrest
and the subsequent economic blockade (although there were reports of damages to
private school buses in three districts).
However, the unrest led to prolonged closure of schools particularly in the most affected
districts, and the economic blockade caused severe shortages of supplies and led to
significant delays in the rehabilitation and reconstruction efforts, including of schools
damaged by the earthquake. While the exact statistics may be difficult to verify, the
earthquake and the Terai unrest had a huge impact on a large number of children.
According to a report by Save the Children (which in turn was based on information from
the Nepal Education Cluster), "an estimated 3.2 million children were directly affected
both physically and mentally by the earthquake. Of these, around 870,000 children were
left without permanent classrooms and an additional half a million required support to
return to learning".26 Schools in the districts that were highly affected by the earthquake
were completely closed for 35 days, and when they reopened subsequently, the majority
of schools opened only for few hours in the absence of the requisite infrastructure to
accommodate all children. Similarly, according to the whitepaper issued by the Ministry
of Finance, education was obstructed in all 20 districts of the Terai (especially in Bara,
Parsa, Rautahat, Siraha, Saptari, Mahottari, Dhanusha and Sarlahi districts), where nearly
3.5 million children were badly affected.27 The extent of the impact of the blockade is also
best seen in the UNICEF press release which warned that “more than three million
children under the age of five at risk of death or disease during the harsh winter months
due to a severe shortage of fuel, food, medicines and vaccines".28 According to some
reports, more than 14,000 schools across the Terai belt were directly affected by the
unrest, leading to loss of teaching days for more than four months, affecting students of
all grades. But the highest number of children affected by the Terai unrest and the
economic blockade were from the primary grades (1-5) because they constituted the
biggest share of the total student size in the Terai region.29 The Terai unrest and
economic blockade had far greater impact on the country than the earthquake because its
reach was more national than the earthquake, and its timing was the harsh winter months.
25 National Planning Commission. 2015. Post Disaster Needs Assessment: Volume B: Sector Reports. Kathmandu: National
Planning Commission, Government of Nepal.
26 Save the Children. 2016. Education Disrupted. Disaster impacts on education in the Asia-Pacific region 2015.
27Ministry of Finance. 2015. White Paper on the Current Economic Situation and Immediate way Forward. 28 Available at: http://www.unicef.org/infobycountry/media_86394.html
29 For further details, see http://www.madhesiyouth.com/analysis/impact-of-tarai-unrest-in-southern-nepal/

Nepal Education Sector Analysis
146
It was widely expected that the earthquake and the Terai unrest and the economic
blockade would result in significant losses in education participation and outcomes as a
result of the severe disruptions in education services. According to the PDNA Report, the
effects on enrolment, attendance and internal efficiency could lead to an increase in the
number of out-of-school children. The report stated that:
There could also be an increase in the number of children with disabilities or significant injuries for whom the temporary or transitional learning centres (TLCs) could be less than accessible. With the demand for additional labour both at home and in the market, it is reasonable to assume that some children, particularly in the higher grades, might be less regular or drop out eventually, and there might also be a decrease in their motivation to learn...... It is, however, impossible at the moment to gauge the effects of the quake on these parameters and quantify the resulting efficiency losses.30
Likewise, monitoring report of the National Human Rights Commission related to the
Terai unrest stated that the students of the agitated districts were being deprived from
education due to a lack of regular functioning of the schools, and that the students of these
areas would fall behind in all kinds of competitions in the future compared to students
from other districts of the nation.31
In order to ascertain the quantitative effects of these events on education access,
participation and outcomes, we looked at the major indicators related to access and
participation, namely net enrolment rates (NERs), promotion and dropout rates.
However, given the paucity of data as well as the fact that it takes some time to see the
impact on learning outcomes, we could not do statistical analysis in order to ascertain the
impacts on learning outcomes. In hindsight, it can be stated that the full impacts of these
events were not fully reflected in the MOE's EMIS, mainly because the EMIS was not
geared to capturing such information.
Net Enrolment Rates: The quantitative analysis of the FLASH I data (2015/16) on the
impact of the events of 2015 showed that no evidence for the effect can be detected in
NER for Nepal as a whole, for the 14 most affected districts by the earthquake and for the
Terai region affected by the unrest and the economic blockade. Figure 9 shows that the
NER for both boys and girls does not fall in 2015 for both primary and secondary level.
The pre-existing upward trend is maintained even after the events of 2015. As can be seen
in the Figure 10, no dip in the NER for secondary level can be observed in year 2015
despite the fact that some of the massive dips have been observed for Kathmandu and
Bhaktapur in 2006, Eastern Terai in 2008 and Central Terai in 2004. Heavily affected by
the earthquake, Gorkha, Dolakha and Sindhupalchowk have maintained the pre-existing
30 National Planning Commission. 2015. Post Disaster Needs Assessment: Volume B: Sector Reports. Kathmandu: National
Planning Commission, Government of Nepal.
31 National Human Rights Commission Nepal. 2015. Human Rights Situation during the Agitation before and after Promulgation of the Constitution of Nepal: Monitoring Report.
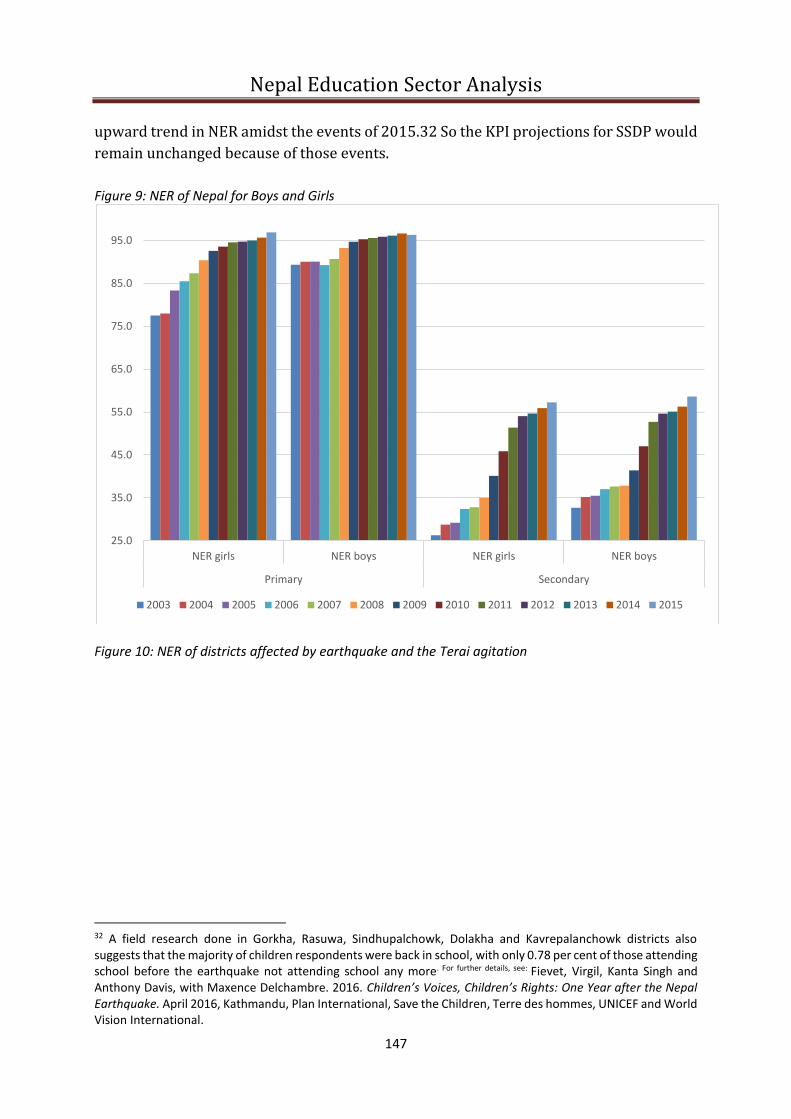
Nepal Education Sector Analysis
147
upward trend in NER amidst the events of 2015.32 So the KPI projections for SSDP would
remain unchanged because of those events.
Figure 9: NER of Nepal for Boys and Girls
Figure 10: NER of districts affected by earthquake and the Terai agitation
32 A field research done in Gorkha, Rasuwa, Sindhupalchowk, Dolakha and Kavrepalanchowk districts also suggests that the majority of children respondents were back in school, with only 0.78 per cent of those attending school before the earthquake not attending school any more. For further details, see: Fievet, Virgil, Kanta Singh and Anthony Davis, with Maxence Delchambre. 2016. Children’s Voices, Children’s Rights: One Year after the Nepal Earthquake. April 2016, Kathmandu, Plan International, Save the Children, Terre des hommes, UNICEF and World Vision International.
25.0
35.0
45.0
55.0
65.0
75.0
85.0
95.0
NER girls NER boys NER girls NER boys
Primary Secondary
2003 2004 2005 2006 2007 2008 2009 2010 2011 2012 2013 2014 2015
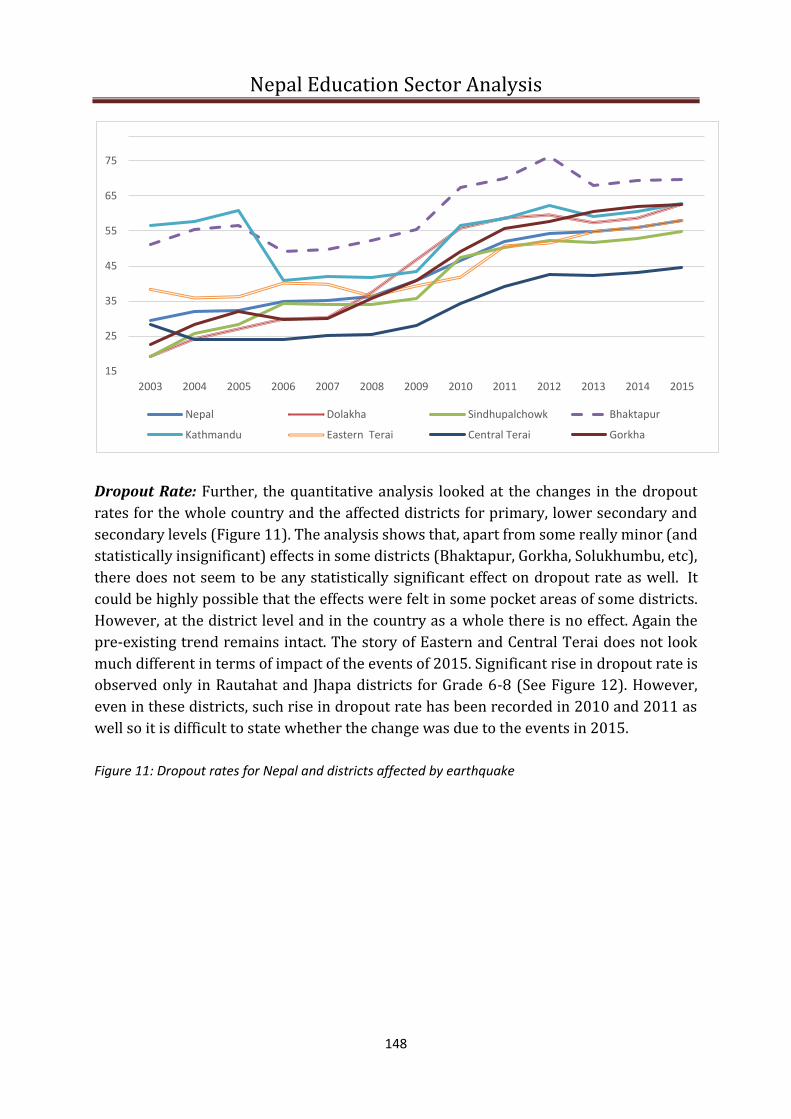
Nepal Education Sector Analysis
148
Dropout Rate: Further, the quantitative analysis looked at the changes in the dropout
rates for the whole country and the affected districts for primary, lower secondary and
secondary levels (Figure 11). The analysis shows that, apart from some really minor (and
statistically insignificant) effects in some districts (Bhaktapur, Gorkha, Solukhumbu, etc),
there does not seem to be any statistically significant effect on dropout rate as well. It
could be highly possible that the effects were felt in some pocket areas of some districts.
However, at the district level and in the country as a whole there is no effect. Again the
pre-existing trend remains intact. The story of Eastern and Central Terai does not look
much different in terms of impact of the events of 2015. Significant rise in dropout rate is
observed only in Rautahat and Jhapa districts for Grade 6-8 (See Figure 12). However,
even in these districts, such rise in dropout rate has been recorded in 2010 and 2011 as
well so it is difficult to state whether the change was due to the events in 2015.
Figure 11: Dropout rates for Nepal and districts affected by earthquake
15
25
35
45
55
65
75
2003 2004 2005 2006 2007 2008 2009 2010 2011 2012 2013 2014 2015
Nepal Dolakha Sindhupalchowk Bhaktapur
Kathmandu Eastern Terai Central Terai Gorkha
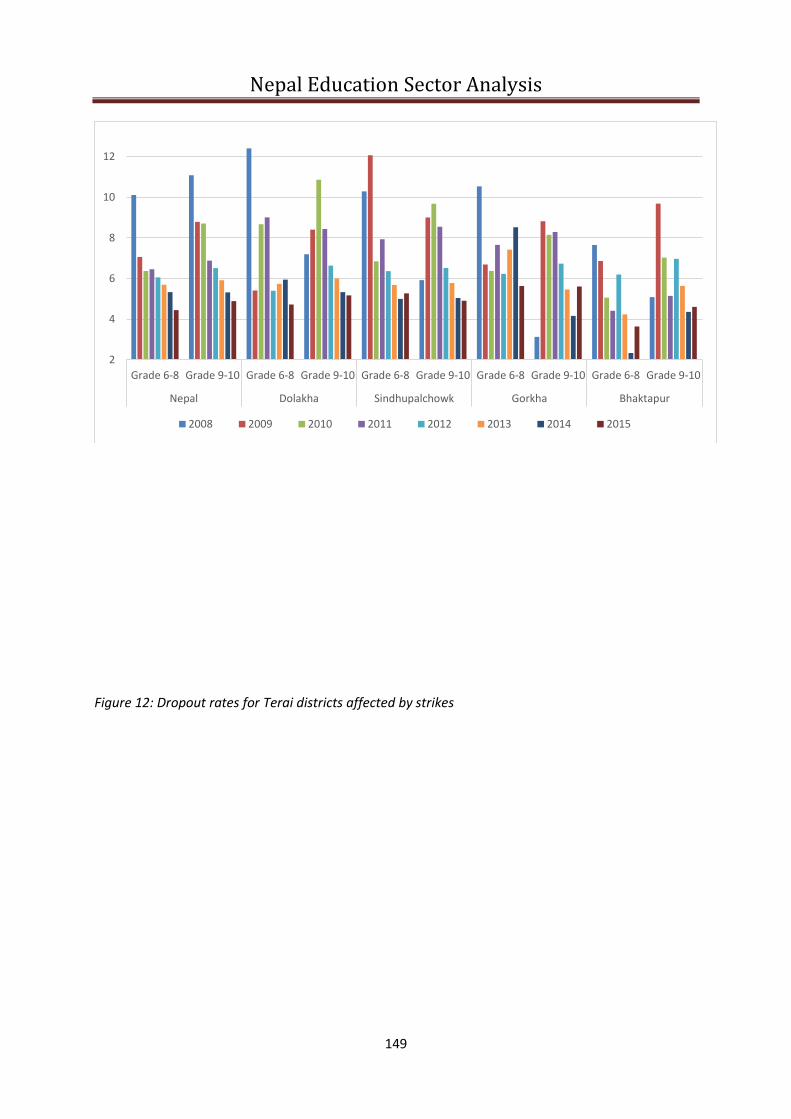
Nepal Education Sector Analysis
149
Figure 12: Dropout rates for Terai districts affected by strikes
2
4
6
8
10
12
Grade 6-8 Grade 9-10 Grade 6-8 Grade 9-10 Grade 6-8 Grade 9-10 Grade 6-8 Grade 9-10 Grade 6-8 Grade 9-10
Nepal Dolakha Sindhupalchowk Gorkha Bhaktapur
2008 2009 2010 2011 2012 2013 2014 2015

Nepal Education Sector Analysis
150
Promotion Rate: The proposition of no impact on some of the KPIs related to access and participation is supported by the trend of promotion rate as well (see Figure 13). The promotion rate for lower secondary level continues to have upward trend in Nepal as a whole as well as Central Terai, Eastern Hill and Central Hill districts with no significant change in the rate of increase. This indicates little or no impact on internal efficiency of the schools. This can be due to liberal grading measures adopted during times of emergency to ensure the promotion of students despite significant dip in attendance during affected period. Further analyses of FLASH II data that were recently shared by the MOE are ongoing to ascertain further impacts on the efficiency related indicators at the end of the school year in 2015/16.33 Figure 13: Promotion rate of lower secondary in selected regions of the country
33 According to the EMIS of the MOE, there is a slight dip in the grade 8 completion rate in 2016/17 compared to 2015/16
(decline from 69.4% to 68.4%). However, it is too preliminary to suggest that this was due to the events of 2015.
2
4
6
8
10
12
14
16
18
20
Grade 6-8 Grade 9-10 Grade 6-8 Grade 9-10 Grade 6-8 Grade 9-10 Grade 6-8 Grade 9-10 Grade 6-8 Grade 9-10
Eastern Terai Jhapa Cetral Terai Rautahat Parsa
2008 2009 2010 2011 2012 2013 2014 2015
79
81
83
85
87
89
91
Nepal Central Terai Eastern Hill Central Hill
2008 2009 2010 2011 2012 2013 2014 2015

Nepal Education Sector Analysis
151
Updated NER Projections: As discussed above, there have been no significant effects by
gender on the SSDP KPIs related to access and participation. Therefore, the SSDP
projections related to NERs continue to remain valid. The three, five and seven year
projections with the confidence interval are shown in Table 3 below.
Table 3: Projection of NER using beta regression model
Projection 3 years 5 years 7 years
NER (Primary Level: Nepal) 97.4% 97.6% 97.8%
NER (Secondary Level: Nepal) 69.1% 70.6% 72.3%
NER (Secondary Level: Central Terai) 59.1% 61.3% 63.8%
9.5.2 Impact on Learning
Both of the events were expected to negatively affect student learning outcomes in the
concerned years. However, due to the lack of data on student learning outcomes captured
through EMIS, we were not able to do a quantitative analysis of the effects of these events
on student learning outcomes in the affected districts. The indicators related to internal
efficiency (which often act as proxy for quality) do suggest that there was no major
aggregate impact on promotion rates, indicating that children continued to meet the
grade-specific learning standards. A widely used indicator of the quality of education in
Nepal is the annual School Leaving Certificate (SLC) results. The SLC results of 2016 show
that there was no apparent change in the overall pattern of the results compared to the
previous years, both in terms of the average pass rates and the subject-wise performance
of the students.34 The lack of changes noted in efficiency related indicators (especially
the dropout and promotion rates) suggests that the local interpretations of existing
policies related to continuous assessment system and liberal promotion policies, coupled
with the difficult educational context unleashed by the earthquake and the blockade, may
have prompted schools to promote all students by relaxing the student assessment and
evaluation procedures that they would employ during normal times.
However, prolonged closure of schools in the affected districts led to decline in student
attendance and delays in distribution of textbooks. The FLASH II data for academic year
2015/16 shows some decline in the attendance for children at all grades compared to the
previous year (Table 4).35 This was expected given that schools remained closed for a
34 Bhatta, Pramod. 2016. Use of Letter Grading in the SLC: Quality will not Improve Automatically (in Nepali). Shikshak 9(102):
30–33.
35 Empirical research in some of the districts most affected by the earthquake shows that there was a statistically significant
decline in students' attendance after the earthquake, which was higher for the boys compared to girls. For further details, see: Fievet,
Virgil, Kanta Singh and Anthony Davis, with Maxence Delchambre. 2016. Children’s Voices, Children’s Rights: One Year after
the Nepal Earthquake. April 2016, Kathmandu, Plan International, Save the Children, Terre des hommes, UNICEF and World
Vision International.

Nepal Education Sector Analysis
152
significant period of time in the aftermath of the earthquake and during the Terai unrest
and economic blockade. At the same time, timely availability of textbooks was affected by
the earthquake, leading to significant delays compared to the previous years (Table 5).
Table 4: Average Attendance of Students, Grades 1–10
Level 2014/15 2015/16
Basic (Grades 1-5) 184 178
Basic (Grades 6-8) 193 185
Secondary (grades 9-10) 199 186
Total (Grades 1–10) 190 182
Source: EMIS, DOE. Table 5: Timely Availability of Textbooks, 2011–2015
Level 2011 2012 2013 2014 2015
Basic (grades 1-5) 69.4 72.1 73.1 81.1 76.1
Basic (grades 6-8) 68.5 73 77.6 80.6 77.7
Secondary( grades 9-10) 59.9 74.2 76.5 79.4 73.2
Total (Grades 1–10) 68.1 72.5 74.6 80.8 76.1
Source: EMIS, DOE.
Some empirical research done in the earthquake affected districts suggests that everyday
teaching-learning was severely disrupted, leading to possible decline in student learning
outcomes. Slower than expected recovery and reconstruction of education services has
meant that everyday teaching-learning in the earthquake affected districts continues to
happen in unsafe classrooms or temporary learning centers,36 that has in turn led to
reduced confidence, particularly amongst grade 8-10 students in passing the annual
examinations. 37 Therefore, even if no immediate direct evidence of reduced learning
outcomes can be seen, it is plausible to assume that student learning will continue to be
affected and that such effects on student learning need to be monitored more closely
during the SSDP.
9.5.3 Impact on Equity
From the quantitative analysis of the MOE's EMIS data, it is evident that there were no
aggregate impacts (at both national and district levels) on some of the SSDP key
performance indicators such as those related to access, enrolments and participation.
36 Ibid; See also the Nepal Education Cluster updates. The number of TLCs that were established in the affected districts
remained at 77% of the targets by April 2016., and that students in the affected areas continued to suffer from lack of proper
classrooms, WASH facilities and other aspects of an enabling environment for effective teaching-learning.
37 Ibid.

Nepal Education Sector Analysis
153
This was largely expected given that the enrolment rates are simply a reflection of
entering the name of the child in the school register, not de facto attendance per se38, and
that the majority of school-age children were already enrolled in the schools prior to the
earthquake and the Terai unrest. Further, it is highly likely that student assessment and
evaluation procedures were relaxed given the extraordinary circumstances, which could
have masked the effects of these events at the grassroots.
However, as shown in Figure 6 above, the districts that were severely affected by the Terai
unrest and the economic blockade already had high disparities in access, participation
and learning outcomes and are ranked very low in the Equity Index as well as the Human
Development Index (HDI).39 Further, according to the CBS data, even if the average
income poverty in the Terai is lower compared to the hills and mountains, the extent and
severity of human poverty is higher in the Terai, with the region containing large
population deprived from education and health.40 Against such a backdrop, it is highly
likely that severe educational effects were felt in the districts of Central Terai (Rautahat,
Mahottari, Siraha, Sarlahi, Dhanusha, Saptari, Bara and Parsa) that already accounted for
the majority of out-of school children, lower mean years of schooling and higher
educational disparities by gender and caste/ethnicity even before the political unrest.41
Further, within these districts, it is highly likely that specific caste/ethnic groups,
especially the Terai Dalits and Muslims, and to a lesser extent the Terai middle castes were
more affected by the unrest than others.
The districts most affected by the earthquake (districts in the Central Hills) had relatively
better HDI than the Terai and also had relatively higher ranking in the Equity Index. In
other words, the earthquake affected districts had lower proportions of out of school
children, higher enrolment and completion rates and higher mean years of schooling.42
Nonetheless, the earthquake affected districts also accounted for the majority of
marginalized and highly marginalized43 ethnic groups (such as Tamang in
Sindhupalchowk and Rasuwa, and Jirel, Sunuwar and Thami in Dolakha) that are
underrepresented in education. However, some of these districts had also made
38 When we compare the Flash I and Flash II data on enrolments and attendance for any given academic year, we find that
the attendance is always lower than enrolments, which is also evident in the Nepal Living Standard Survey (NLSS) data.
39 National Planning Commission and UNDP. 2014. Nepal Human Development Report 2014: Beyond Geography: Unlocking
Human Potential. Kathmandu, Government of Nepal, National Planning Commission and UNDP Nepal.
40 Pokharel, Trilochan. 2015. Poverty n Nepal: Characteristics and Challenges. Journal of Poverty, Investment and
Development 11: 44–55.
41 MOE, UNICEF and UNESCO. 2016. Global Initiative on Out-of-School Children: Nepal Country Study. July 2016, UNICEF,
Kathmandu, Nepal.
42 Earthquake affected districts such as Rasuwa also had made dramatic improvements in HDO due to increase in
education-related indicators. Please refer to UNDP. 2014. Nepal Human Development Report 2014.
43 Bhatta,Pramod et al. 2008. Structures of Denial: Student Representation in Nepal's Higher Education. Studies in Nepali
History and Society 13(2): 235–263.

Nepal Education Sector Analysis
154
significant gains in HDI in recent years (mainly because of the gains made in mean years
of schooling), which, unfortunately, are likely to be stalled due to the earthquake.
Media also reported increased incidence of child trafficking from some of the highly-
affected districts such as Sindhupalchowk, Rasuwa and Dhading, which already used to
have high rates of trafficking of girls and children even before the earthquake.44 Concerns
over increased incidence of child labour and other forms of exploitation, increased
incidence of child marriage, as well as increase in the number of street children in urban
areas have also been expressed. Further, there were also reports of children involved in
cross-border smuggling and selling of fuel and other supplies. According to MICS 2014,
there is a high incidence of child labour and engagement of children in economic activities
in Nepal, especially for the poorest income and consumption quintile, in which nearly
61% of children are involved in labour and economic activities.45 However, more
empirical research is needed to ascertain the incidence of such events following the
earthquake and the Terai unrest before anything more conclusive can be stated. In other
words, such potential impacts need to be monitored more closely in the future and
appropriate remedies be charted out to minimize the negative consequences on the
education sector.
44Please see: https://www.theguardian.com/global-development/2015/oct/25/nepal-earthquake-six-month-anniversary-
children-orphans-people-traffickers; See also: http://www.spotlightnepal.com/News/Article/POST-QUAKE-CONCERN-
Taming-Trafficking
45 MOE, UNICEF and UNESCO. 2016. Global Initiative on Out-of-School Children: Nepal Country Study. July 2016, UNICEF,
Kathmandu, Nepal.

Nepal Education Sector Analysis
155
10. CONCLUSIONS
To untangle the education system from the state capability trap (Moriani et al. 2013),
SSDP architects and national decision makers (NPC, MoF, other ministries and
development partners) must have a shared vision of the national development goals, the
role of education in achieving those goals, and the budget parameters that determine what
can be achieved with current and projected resources. This can only happen if education
reform has political champions inside and outside MoE. Their support can be won by
presenting them with compelling cases of Nepal’s educational problems, what happens if
these problems are not solved, what needs be done to solve them and the responsibilities
of stakeholders in contributing to solutions. Follow-up mechanisms need to be in place to
ensure that stakeholders follow through on commitments they make.
Finding and supporting champions who support reform is also a political and a
managerial challenge. Politically, proposed reforms often depend on the public mood,
pressure group agendas, election results, and ideological positions of stakeholders
(Kingdon, 2003). Champions will be more likely to support reforms if SSDP’s architects
can demonstrate that proposed reforms are supported by pressure groups that advocate
for SSDP and maintain the pressure to ensure that it is supported and implemented as
intended by MoE. A 2011 survey reported by Nepal Monitor (2011) found that 58% of
Nepalese chose education as the most important issue in their personal lives. This is a
powerful indicator that the public mood yearns for quality education. The onus is on
decision makers to support reform that reflects public aspirations.
This sector analysis report has taken the pulse of Nepal’s education system.
Breakthroughs in enrolment indicate a national commitment to expanding equitable
access to education. However, student results show that a large proportion of children are
still not learning. At the current juncture where the country has been under an economic
blockade and is struggling to bounce back from a destructive earthquake, investing in
improving school quality is more urgent than ever. It is the key to raising a generation of
resilient citizens who will break the cycle of poverty, reduce civil and political conflict and
lead the nation to tap the fullest potential of its demographic dividend.
So how did natural disasters and political conflicts in 2015 affect the education outcomes
of children in Nepal? It is difficult to predict long term impacts of these events on the
overall economy and other socio-political arrangements, which may be better explained
by the long-pertaining socio-structural arrangements rather than disasters and conflicts
per se.46 Evidence from quantitative analysis of the EMIS data suggests that no
statistically significant changes were noted in enrolment, dropout and completion rates
for the districts that were affected by the events, meaning that the impact on key
education indicators such as those related to access and participation were minimal or
insignificant. In this regard, Nepal's education sector is often described as resilient.
46Poudyal, Niraj. Not dated. Myths of Economic Consequences of Maoists Civil War in Nepal. Unpublished article.

Nepal Education Sector Analysis
156
Despite the decade-long Maoist conflict (that systematically targeted government schools,
curricula and textbooks, and teachers) and the ongoing political transition since 2006, the
growth in education sector has been robust, as shown by steady growth in the number of
education facilities, enrolments, and improvements in the education indicators related to
internal efficiency of the system. It is our understanding that this strong resilience of the
sector emanates from the deep-rooted belief and faith in the power of formal education.
However, does this mean that the events had no impact on the education outcomes of
children residing in the affected districts? Even if no visible impact on access and
participation was seen at the aggregate district and national levels, it can be said with
certainty that the pre-existing vulnerabilities that were exacerbated by the earthquake
and the Terai unrest have had very localized effects, ascertaining which was beyond the
scope of this analysis. National and district level disaggregation masked local impacts;
however, such lack of evidence at the national and district levels does not mean that there
was no impact. In the case of the earthquake, these effects were felt in the districts that
were severely affected (such as Sindhupalchowk, Dolakha, Rasuwa and Gorkha (which are
largely inhabited by ethnic groups with low HDIs). Likewise, the severe effects of the Terai
unrest and the economic blockade were felt by the districts in the Central Terai (which
already have poor education outcomes as measured by the Equity Index, and which have
a strong concentration of Madhesi Dalits and Muslims, and huge disparities between high
and low castes). Research evidence from Nepal also suggests that the quality of public
service delivery (including schools) decreases with inaccessibility and that the
accessibility to public services presents various forms of disparities—both across space
and across socioeconomic groups.47 In other words, inaccessible areas are also the most
marginalized, be they in the Terai or the hills and mountains. Therefore, in the aftermath
of the earthquake and the Terai unrest, it is likely that the quality of such service delivery
further deteriorated, particularly for those who used to be served by poor quality services
in the past as well. Therefore, there is a need to do further empirical research and analysis
at the local level, amongst families and households that bore the brunt of the impact.
Given that disasters and conflicts are likely to increase the incidence of poverty in
vulnerable groups and communities, which in turn lead to increased incidence of
education discontinuity, it is essential that further steps be taken to monitor and follow-
up the changes in existing incidences and levels of poverty in these districts with regard
to identifying the most vulnerable groups and setting up the specific support mechanisms
therein. This would include identifying specific children (and families) that were pushed
into poverty and perhaps out of school either through the loss of family members and
assets or through the induction of injuries that rendered them disabled and therefore to
the loss of income opportunities, and providing subsidies to such children and their
families. This provides a good opportunity to use the Equity Index to identify intra-district
47 KC, Shyam. 2009. Socio-Economic Distribution of Geographical Accessibility in Nepal. Studies in Nepali History and Society 14(1): 3-34. See also, Tiwari, Shailesh. 2016. Moving Up the Ladder: Poverty Reduction and Social Mobility in Nepal. Kathmandu, World Bank and UK Aid.

Nepal Education Sector Analysis
157
inequities and vulnerabilities, and the use of equity strategy implementation plans to
overcome inequities and disparities in educational access, participation and learning
outcomes.
There is also a need to further strengthen the DRR initiatives in the SSDP. Current DRR-
related programs in SSDP focus mainly on three pillars: (i) safe infrastructure, (ii)
strengthened disaster risk management and (iii) strengthening resilience in
communities.48 While these pillars are intended to strengthen school safety from a
supply perspectives, the SSDP does not envision any specific programs for the educational
recovery of children who will continue to affected by disasters and conflicts, such as safety
cushions during emergencies for both teachers and students to continue their educational
engagement in the aftermath of the disaster. At the same time, this would require
continued focus on protecting schools from political conflicts, and calls for continued
advocacy for the implementation of the 'schools as zones of peace' initiative that had
already gained wide momentum during the Maoist insurgency. This is also in line with the
recommendation made by Save the Children which stresses the importance of a thorough
analysis of known and expected hazards and risks, action to reduce these, and planning
for educational continuity to safeguard education.49
Finally, the impacts of the promulgation of the new Constitution and the amendments to
the Education Act are yet to seen as new legislative provisions envisaged therein remain
to be fully implemented in the absence of the establishment of local governments and the
formulation of new education regulations, respectively. In principle, the new legislative
provisions are expected to enhance participation in education by guaranteeing the right
to free and compulsory basic education, including ECED. As per the new constitution, the
provision and management of school education is the sole jurisdiction of local
governments. However, how such provision will affect equity in education is unclear,
because in most parts of the world, equity in education (and in other sectors as well) is
promoted through a strong involvement and engagement of the central government.
This chapter gives an overview of Nepal’s macroeconomic situation in relation to funding
for the public education sector. This includes information about the country’s GDP,
government expenditure and sources of revenue, government education expenditure and
sources of funding, and a detailed description of SSRP expenditures and sources of
financing. The chapter also sheds light on efficiency indicators of the education system, its
absorptive capacity, and equity in financing. In the second part, we described SSRP budget
allocation by program line items and thematic components, and discussed SSRP financial
sustainability. Lessons from SSRP are included in a separate section on implications for
SSDP. The final part consisted of a discussion of fiduciary management for SSDP.
48 Ministry of Education, Government of Nepal. 2016. School Sector Development Plan (FY 2016/17–2022/23). Kathmandu: Ministry of Education. 49 Save the Children. 2016. Education Disrupted. Disaster impacts on education in the Asia-Pacific region 2015.

Nepal Education Sector Analysis
158
The overarching takeaways from this chapter are the following:
1. Available funds were insufficient to cover the costs of SSRP.
2. National GDP is anticipated to further shrink because of the on-going fuel and
commodity shortages.
3. Without taking measures to improve efficiency and generate more revenue, education
decision makers must determine what to prioritize to ensure that SSDP is financially
viable.
4. The state of fiduciary management reinforces the observation that the trouble with
the educational financial picture in Nepal is not just shortage of funds, but is also the
need to strengthen safeguards to ensure that resources are spent efficiently. Installing
the necessary safeguards described in this chapter is an essential measure that will
also require funding.
In a nutshell, there are multi-layered demands on Nepal’s education system. At the center
of these demands are to provide safe schools for students whose schools were damaged
or destroyed by the 2015 earthquakes, and places for the many marginalized children
who either do not have access to school, or have low survival rates. Student results in
basic and secondary education indicate that a sizable proportion of students are not
achieving their learning outcomes. On the supply side, teachers and educational leaders
need training and adequate quantities and quality of textbooks and teaching aids to
provide learning opportunities to students. The fiduciary analysis highlights that without
safeguards to ensure that resources are well distributed and well accounted for, there is
a high risk of the inefficient use of the already scarce resources. While drafting the SSDP,
education sector decision makers need to determine the non-negotiables in terms of what
is absolutely needed, how they will pay for these non-negotiables, and how to ensure and
assure stakeholders that the resources raised will be used wisely as intended.
At the beginning of this chapter it was noted that the country’s GDP growth was projected
to shrink to 2 percent because of the on-going shortages. It is important to caution that
growth may be even lower because, as of February 2016, there are still serious fuel
shortages. The Nepal Rastra Bank (NRB 2015) predicted that economic growth could
contract to minus 0.9 percent in the current fiscal year (2015/16) if the blockade
continued until January (which it has). The macroeconomic implications of the resulting
revenue losses will have direct implications on the budget available to expand the
performance capacity of SSDP in, at least, the short term. To capture the effects of the
earthquake and the on-going blockade on the education sector, this chapter should be
supplemented with an impact analysis to measure the true scope of the economic and
political shocks to further focus the SSDP prioritization process.
Earlier in this chapter we presented the building blocks of world class education (Figure
5.1), which fit under the following three overarching drivers:

Nepal Education Sector Analysis
159
• Standards and accountability create a common language around shared goals, and
determine who is ultimately responsible for achieving them.
• Human capital acknowledges that the quality of the whole education system is
contingent on the quality of its teachers (Mckinsey and Company 2007).
• Structure and organization provide the institutional framework and leadership
necessary to recruit and train the right teachers, set standards and demand
accountability, and ensure the smooth flow of information, resources, and
decisions making that allow the educational system to demonstrate the indicators
of quality shown in Table 5.4.
Our analysis indicates that all three drivers need considerable strengthening under the
proposed SSDP.
Nepal Education Sector Analysis
160
REFERENCES
AASAMAN Nepal (2014). A Resource Material on Education and Federalism in Nepal: Education for
Peace. Lalitpur: UNESCO. Accessed 17 February 2016 at:
http://unesdoc.unesco.org/images/0023/002309/230932e.pdf
ADB (2013). Proposed Grant Nepal: Skills Development Project. Project Number: 38176. June 2013.
Asian Development Bank. Accessed 10 February 2016 at:
http://adb.org/sites/default/files/projdocs/2013/38176-015-nep-rrp.pdf
Bailey, M. (2006). ‘More Power to the Pill: The Impact of Contraceptive Freedom on Women’s
Labour Supply’. Quarterly Journal of Economics, Vol. 121, 2006.
Bajracharya B and S Koirala (2015) ** add title of report Draft Report submitted to ADB,
Kathmandu Nepal.
Barber, M, and Mourshed, M. (2009). Shaping the future: How good systems can become great in
the decade ahead. Report on the International Education Roundtable: 7 July 2009, Singapore.
CBS (1996) Nepal Living Standards Survey, Volumes I and II. Kathmandu: National Planning
Commission, Central Bureau of Statistics.
CBS (2004) Nepal Living Standards Survey 2003/04, Statistical Report. Volumes 1 and 2.
Kathmandu: National Planning Commission, Central Bureau of Statistics.
CBS (2011a). Population census 2011; national report. Kathmandu: Central Bureau of Statistics,
National Planning Commission Secretariat.
CBS (2011b). Nepal Living Standard Survey 3, Volumes I and II. Kathmandu: Central Bureau of
Statistics, National Planning Commission, Government of Nepal.
CBS (2014). Population Monograph of Nepal (2014). Kathmandu: Central Bureau of Statistics
CDSA (2014). The Nepal Multidimensional Social Inclusion Index: Diversity and Agenda for Inclusive
Development. Kathmandu: Central Department Of Sociology/Anthropology, Tribhuvan
University. Accessed 16 February 2016 at: http://idsn.org/wp-
content/uploads/2014/12/Nepal-Inclusion-Index-Tribuvan.pdf
CfBT Education Trust and EU (2015). Evaluation of the Current EU Budget Support and
Formulation of the Next EU Budget Support Program to Education Sector in Nepal. Final
Report. Kathmandu: CfBT Education Trust and European Union.
Chettiparambil-Rajan, A (2007). INDIA: A desk review of the Mid-Day Meals Program. July 2007.
World Food Program NCED (2010). Teacher Development Policy Guideline 2009-2015.
Bhaktapur: National Centre for Educational Development.
Conley, DT (ed.) (2003). Understanding university success: A report from Standards for Success, a
project of the American Association of American Universities and The Pew Charitable Trusts.
Oregon: Centre for Educational Policy research, University of Oregon.
Cumming C; S Acharya, F Moriani, D Shakya, V Levine and S Koirala (2012). Mid-Term Evaluation
of the School Sector Reform Program. March 2012. Kathmandu: Mid-Term Evaluation Team.
Accessed January 2016 at:

Nepal Education Sector Analysis
161
http://www.ncf.org.np/upload/files/1095_en_SSRP%20MTR%20Evaluation%20Main%2
0Report.pdf
Dahal DR (2001). Civil Society in Nepal: Opening the Ground for Questions. Kathmandu: Center for
Development & Governance. Accessed 16 February 2016 at:
http://www.nepaldemocracy.org/civic_education/civil_society_in_nepal.PDF
Chapman D (2002). Management and Efficiency Education: Goals and Strategies. Education in
Developing Asia, Volume 2. Asian Development Bank, Comparative Education Research
Centre, The University of Hong Kong. Accessed 18 February 2016 at:
http://cerc.edu.hku.hk/wp-content/uploads/2013/11/Vol2_chapman_bookletr4.pdf
De Grauwe, A and F Calliods (2014). Education in a Federal Context in Nepal. Pp 11-130 in
AASAMAN Nepal (2014). A Resource Material on Education and Federalism in Nepal:
Education for Peace. Lalitpur: UNESCO. Accessed 17 February 2016 at:
http://unesdoc.unesco.org/images/0023/002309/230932e.pdf
DFID (2011). Managing Fiduciary Risk when Providing Financial Aid. DFID How to Note. Accessed
14 February 2016 at:
https://www.gov.uk/government/uploads/system/uploads/attachment_data/file/67488
/how-to-fiduciary-fin-aid.pdf
DoE (2010). National Framework of Child-friendly Schools for Quality Education. Bhaktapur:
Department of Education. Accessed 18 February 2016 at:
http://www.nnfsp.gov.np/PublicationFiles/2000a101-a51e-43d3-859e-
70a363a5a729.pdf
DoE (2013a). Annual Educational Status Report FY (2013-2014). Bhaktapur: Department of
Education.
DoE (2013b). Strategy and Action Plan on bringing out of school children into basic education.
Bhaktapur: Department of Education. Available as pp 35–42 of Annex 1 of DoE (2014c).
Consolidated Equity Strategy for the School Education Sector.
DoE (2013c). Joint Consultative Meeting Aide Memoire. Kathmandu:
DoE (2013d): Comprehensive teacher management study
DoE (2014a). Flash report 1, 2071 (2014/15). Bhaktapur: Department of Education.
DoE (2014b). Flash report 2, 2070 (2013/14). Bhaktapur: Department of Education.
DoE (2014c). Consolidated Equity Strategy for the School Education Sector. Bhaktapur: Department
of Education. Available at:
http://www.doe.gov.np/SoftAdmin/content/Consolidated_Equity_Strategy_20711.pdf
(accessed 18 January 2016)
DoE (2015). Compilation of Flash Report I 2015-2016, Consolidated Report 2014-2015, and Flash
Report II, 2014-2015. Bhaktapur: Department of Education
EIU (2013). Skills Development in South Asia: Trends in Afghanistan, Bangladesh, India, Nepal,
Pakistan and Sri Lanka. September 2013. Economist Intelligence Unit report for the British
Council. Accessed 16 February 2016 at:
https://www.britishcouncil.org/sites/default/files/south-asia-skills-report-summary.pdf
Nepal Education Sector Analysis
162
EIU (2014). High university enrolment, low graduate employment. Analysing the paradox in
Afghanistan, Bangladesh, India, Nepal, Pakistan and Sri Lanka. Economist Intelligence Unit
report for the British Council. Accessed February 2016 Accessed at:
https://www.britishcouncil.in/sites/default/files/british_council_report_2014_jan.pdf
EPDC (2014). National Education Profile: 2014 Update. Overview. Education Policy and Data Center
(FHI) Analysis of NDHS 2011 data. Accessed 16 February 2016 at:
http://www.epdc.org/sites/default/files/documents/EPDC%20NEP_Nepal.pdf
EQUIP 2 (2010). Using Opportunity to learn and Early Grade Reading Fluency to Measure School
Effectiveness in Nepal. Kathmandu: Academy for Educational Development. Accessed 15
February 2016 at: http://www.equip123.net/docs/e2-School_Effectiveness_Nepal-CS.pdf
ERO (2015). Report on National Assessment of Student Achievement (NASA) 2013 (Grade 8:
Mathematics, Nepali and Science). Kathmandu: Education Review Office.
Fullan, M (2001). The new meaning of educational change (3rd ed). New York: Teachers College
Press.
Ghimire A and F Samuels (2014). Change and continuity in social norms and practices around
marriage and education in Nepal. Overseas Development Institute. Accessed on 16 February
2016 at: http://www.odi.org/sites/odi.org.uk/files/odi-assets/publications-opinion-
files/9181.pdf
Hall, R. E. and C. I. Jones (1996). The Productivity of Nations. NBER Working Paper W5812. National
Bureau of Economic Research.
HRW (2011). Futures Stolen: Barriers to Education for Children with Disabilities in Nepal. Human
Rights Watch.
ICG (2011). Nepal: Identity Politics and Federalism. Asia Report N°199 – 13 January 2011. Brussels.
International Crisis Group. Accessed 10 February 2016 at:
http://www.crisisgroup.org/~/media/Files/asia/south-asia/nepal/199%20Nepal%20-
%20Identity%20Politics%20and%20Federalism.pdf
ILO Nepal (2010). Labour and Social Trends in Nepal 2010. Kathmandu: International Labour
Organisation. Accessed 17 February 2016 at: http://www.ilo.org/wcmsp5/groups/public/-
--asia/---ro-bangkok/---ilo-kathmandu/documents/publication/wcms_151322.pdf
Index Mundi (2016). Nepal - Unemployment (definition). Accessed 16 February 2016 at:
http://www.indexmundi.com/facts/nepal/unemployment
Jamison, D and P Moock (1984). ‘Farmer education and farm efficiency in Nepal: the role of
schooling, extension services, and cognitive skills’. World Development, vol. 12, no. 1, pp. 67-
86. Available at:
http://documents.worldbank.org/curated/en/1984/01/1555725/farmer-education-
farm-efficiency-nepal-role-schooling-extension-services-cognitive-skills
Kathmandu Post (2015) “Amendment to Education Act: Decks cleared for SSRP”. The Kathmandu
Post, 20 October 2015. Accessed 17 February 2016 at:
http://kathmandupost.ekantipur.com/news/2015-10-20/decks-cleared-for-ssrp.html

Nepal Education Sector Analysis
163
Khare S and A Slaney (2011). The Dynamics of Employment, the Labour Market and the Economy in
Nepal. Employment Working Paper No. 76. Geneva: International Labour Organisation.
Accessed 10 February 2016 at:
http://www.ilo.org/wcmsp5/groups/public/@ed_emp/documents/publication/wcms_15
1826.pdf
Kingdon, J. (2003). Agendas, alternatives, and public policies (2nd ed.). New York: HarperCollins
Publishers.
Lee R and A Mason (2006). What Is the Demographic Dividend? Finance and Development 43(3).
International Monetary Fund. Accessed 10 February 2016 at:
http://www.imf.org/external/pubs/ft/fandd/2006/09/basics.htm
Massachusetts DoESE (2016). Education Laws and Regulations: Standards and Indicators of
Effective Teaching Practice. Massachusetts Department of Elementary and Secondary
Education. Accessed on 17 February 2016 at:
http://www.doe.mass.edu/lawsregs/603cmr35.html?section=03
Mathema KB (2007). Crisis in Education and Future Challenges for Nepal. Accessed 19 February
2016 at:
http://himalaya.socanth.cam.ac.uk/collections/journals/ebhr/pdf/EBHR_31_04.pdf
MCC and GoN (2014). Nepal Growth Diagnostic: May 2014. Washington USA and Kathmandu:
Millennium Challenge Corporation and Government of Nepal. Accessed January 2016 at:
http://www.mof.gov.np/ieccd/pdf/Nepal_CA_report.pdf
Metsämuuronen, J and Kafle, BR (eds). (2013). Where are we now? Student achievement in
mathematics, Nepali and social studies in 2011. Kathmandu: Education Review Office.
MoE (2009). School Sector Reform Plan: 2009–2016. Kathmandu: Ministry of Education,
Government of Nepal. Accessed 16 January 2016 at:
http://planipolis.iiep.unesco.org/upload/Nepal/Nepal_School_Sector_Reform_2009.pdf
MoE (2012). Nepal Education in Figures, 2012: At a Glance. Kathmandu: Ministry of Education,
Research and Education Information Management Section. Accessed 16 February 2016 at:
http://www.moe.gov.np/assets/uploads/files/nepal_education_in_figures_2012.pdf
MoE (2013). Information and Communication Technology (ICT) in Education Master Plan 2013-
2017. Kathmandu: Ministry of Education. Accessed 18 January 2016 at:
https://www.google.com/search?q=Nepal+in+Education+Master+Plan+&ie=utf-
8&oe=utf-8 ().
MoE (2014). School Sector Reform Program/Sector Wide Approach Extension Plan, 2014/15-
2015/16. Final document. Kathmandu: Ministry of Education. Accessed 17 February 2016
at: http://www.globalpartnership.org/sites/default/files/SSRPExtensionPlan_0.pdf
MoE (2015a). National Early Grade Reading Program Document, 2014. Kathmandu: Ministry of
Education.
MoE (2015b). School Sector Development Plan (SSDP) 2016-2022: Concept Paper. Kathmandu:
Ministry of Education.

Nepal Education Sector Analysis
164
MoE (2015c). Nepal Education in Figures, 2015: At a Glance. Kathmandu: Ministry of Education,
Research and Education Information Management Section. Accessed 19 February 2016 at:
http://www.moe.gov.np/article/520/nepal-education-in-figures-2015.html
MoE and UNESCO (2015). Education for All National Review Report 2001-2015. 1 July 2015.
Kathmandu: Ministry of Education and UNESCO Kathmandu Office.
MoES (2003). Education for All 2004-2009: Core Document. November 2003. Kathmandu: Ministry
of Education and Sports. Accessed 18 February 2016 at:
http://www.moe.gov.np/article/177/education-for-all-2004-2009-core-document.html
MoF (2015). “Economic Survey FY 2014-15 (2071/72).” Singha Durbar: Ministry of Finance,
Government of Nepal.
MoHP (2006). Nepal Demographic and Health Survey, 2006. Kathmandu: Ministry of Health and
Population, New Era and Macro International Inc.
MoHP (2011). Nepal Demographic and Health Survey 2011. Kathmandu: Ministry of Health and
Population, New Era and Macro International Inc.
Moriani, F, B Bajracharya, Pramod Bhatta and S Mainali (2013). School Sector Reform Plan Nepal:
Institutional Analysis and Capacity Development Plan. Kathmandu: Asian Development Bank.
NCE Nepal (2015). Competencies of ECD facilitators for holistic development of children: A study
of Surkhet and Parsa districts. Lalitpur: National Campaign for Education Nepal
NEC (2015). Nepal Earthquake Cluster Briefs, June and July 2015. Kathmandu: Nepal Education
Cluster.
Nepal Monitor (2011). Gallup South Asian Democratic Forum, 2011 South Asian Survey. Following
link no longer active: http://www.nepalmonitor.com/2011/10/nepali_public_opinion.html
NFEC (2006). Non-Formal Education Policy. Bhaktapur: Non Formal Education Committee
NNC-UNESCO (2003). Education for All National Plan of Action, 2003. Kathmandu: Nepal National
Commission for UNESCO. Accessed 15 February 2016 at:
http://un.org.np/sites/default/files/report/tid_188/Education-for-all-National-Plan-of-
Action-2002-2015.pdf
Noland M, D Park, and GB Estrada (2012). Developing the Service Sector as Engine of Growth for
Asia: An Overview. ADB Economics Working Paper 12-18. Manila: Asian Development Bank.
Accessed 16 February 2016 at: http://www.iie.com/publications/wp/wp12-18.pdf
NPC (2013). Nepal Millennium Development Goals: Progress Report 2013. Kathmandu: National
Planning Commission, Government of Nepal.
NPC (2014) Thirteenth Development Plan, Government of Nepal. (Three Year Plan 2013–16).
Kathmandu: National Planning Commission.
NPC and UNDP (2014). Nepal Human Development Report 2014. Kathmandu: Nepal Planning
Commission and United Nations Development Program.
NRRC (2015). Nepal Risk Reduction Consortium. Accessed 16 November 2015 at:
http://un.org.np/coordinationmechanism/nrrc

Nepal Education Sector Analysis
165
OCTAE (2016). Accessibility and Universal Design. Office of Career, Technical, and Adult Education,
U.S Department of Education. Accessed 18 February 2016 at:
http://www2.ed.gov/about/offices/list/ovae/pi/AdultEd/disaccess.html
OECD (2014). PISA 2012 Results: What Students Know and Can Do – Student Performance in
Mathematics, Reading and Science (Volume I, Revised edition, February 2014 ). Program for
International Student Assessment. Organisation for Economic Co-operation and
Development, OECD Publishing. Accessed 15 February 2016 at:
http://www.oecd.org/pisa/keyfindings/pisa-2012-results-volume-I.pdf
Oregon DoE (n.d.). Oregon Education Leadership/Administrator Standards. Oregon Department of
Education. Accessed 17 February 2016 at:
http://www.ode.state.or.us/wma/teachlearn/educatoreffectiveness/or-admin-
standards.pdf
Paci-Green, R, B Pandey and R Friedman (2015). Post-earthquake comparative assessment of
school reconstruction and social impacts in Nepal. RISK RED. Accessed 16 November 2015
from: http://riskred.wix.com/riskrednepal#!reports/c1qbl
Parajuli, M.N. (2013). Rhetoric of developing technical and vocational education and training
(TVET) in Nepal: Analysis of the financing of the sub-sector. Technical and Vocational
Education and Training Development Journal, 13(1), 58-68.
Paudel BP (2015). White Paper on the Current Economic Situation and Immediate Way Forward.
Bishnu Prasad Paudel, Finance Minister, 24 November 2015. Kathmandu: Ministry of
Finance. Accessed 10 February 2016 at:
http://www.mof.gov.np/uploads/document/file/White_papaer_final_20151125100100.p
df
Potter, C. and Brough, R. (2004). System capacity building: A hierarchy of needs. Health Policy and
Planning, 19 (5), 336–345.
Poyck et al. (2016). Independent joint evaluation of SSRP (December 2015)
Quinn R (2004). Building the Bridge As You Walk On It: A Guide for Leading Change. San Francisco:
John Wiley & Sons.
Room to Read (2009). Baseline Study of the Reading Ability of Grade 2 students in community
schools of Nawalparasi, Pyuthan, and Dhading districts of Nepal. Nepal: Room to Read
RTI (2014). Nepal Early Grade Reading Assessment, Education Management Efficiency Study and
Teacher Observation Study (April 2014). Kathmandu: USAID.
RTI and New ERA (2014) Preliminary EGRA findings
Sainju RS (2013). Nepal's Graduation Strategy from LDC Status by 2022. Kathmandu: National
Planning Commission Secretariat, Government of Nepal. Presented at Economic and Social
Commission for Asia and The Pacific’s Asia-Pacific Regional Workshop on Graduation
Strategies from the Least Developed Country Category as part of the Implementation of the
Istanbul Program of Action for the LDCs. 4 – 6 December 2013, Cambodia. Accessed 10
February 2016 at: http://www.unescap.org/sites/default/files/CaseStudy-Nepal.pdf

Nepal Education Sector Analysis
166
Schwab K ed. (2014). The Global Competitiveness Report 2014-2015. World Economic Forum.
Accessed 7 February 2016 at:
http://www3.weforum.org/docs/WEF_GlobalCompetitivenessReport_2014-15.pdf
Suvedi BK, A Pradhan, S Barnett, M Puri, S Rai Chitrakar, P Poudel, S Sharma and L Hulton (2009).
Nepal Maternal Mortality and Morbidity Study 2008/2009: Summary of Preliminary Findings.
Kathmandu: Family Health Division
UN 2016). Under and Unemployed Youth (15-29 years). United Nations Nepal Information Platform.
Data derived from CBS 2008 Nepal Labour Force Survey. Accessed 16 February 2016 at:
http://un.org.np/oneun/undaf/unemployed
Unicef (2014). Baseline Study: Quality Mapping of Early Childhood Education and Development
(ECED) Services in Eight Districts of Nepal. Kathmandu: Unicef.
Unicef (2014). Situational analysis of OOSC in 15 districts Kathmandu: Unicef 2014)
Unicef Nepal (2015). Nepal’s Study within the Global Initiative on Out-of-School Children, Final
Report. (28 October 2015). Kathmandu: UNICEF Nepal Country Office
Vaux, T (2011). The Role of Education in Peacebuilding. Kathmandu: Unicef. Accessed 10 February
2016 at:
http://www.unicef.org/education/files/EEPCT_Peacebuilding_CaseStudy_Nepal.pdf
Ward, J.V. (2000). The Skin we are in: Teaching our children to be emotionally strong, socially smart,
and spiritually connected. New York: The Free Press.
WHO and World Bank (2011). World report on Disability. World Health Organisation and the
World Bank. Accessed 11 February 2016 at:
http://www.who.int/disabilities/world_report/2011/en/
Word Bank (2016). World Databank, Education Statistics. Accessed 17 February 2016 at:
http://databank.worldbank.org/data/reports.aspx?source=education-statistics-~-all-
indicators
World Bank (2013). Nepal Report on Human Development: Access Equity, and Quality in the
Education, Health and Social Protection Sectors. Washington, DC: The World Bank
World Bank (2014). “Public Expenditure Tracking and Quantitative Service Delivery Surveys in
Nepal’s Education Sector.” Report No. ACS8283. Human Development Unit, South Asia
Region. Washington, DC: The World Bank.
World Bank (2015) Date: Net Migration. Accessed 10 February 2016 at:
http://data.worldbank.org/indicator/SM.POP.NETM
World Bank (nd). World DataBank. Available at: http://databank.worldbank.org/data/home.aspx

Nepal Education Sector Analysis
167
Appendix A: Population density by region and district
Area Households* Population Area in sq. mm.
Average HH size
Sex ratio
Pop. density
Total Male Female
Nepal 5,427,302 26,494,504 12,849,041
13,645,463 147,181 4.88 94.2 180
Urban/rural
Urban 1,047,297 4,523,820 2,306,049 2,217,771 3,276.28 4.32 104.0 1,381
Rural 4,380,005 21,970,684 10,542,992
11,427,692 143,904.72
5.02 92.3 153
Ecological belts
Mountain 364,120 1,781,792 862,592 919,200 51,817 4.89 93.8 34
Hill 2,534,430 11,394,007 5,440,067 5,953,940 61,345 4.50 91.4 186
Terai 2,528,752 13,318,705 6,546,382 6,772,323 34,019 5.27 96.7 392
Development regions
Eastern 1,231,505 5,811,555 2,790,483 3,021,072 28,456 4.72 92.4 204
Central 1,964,045 9,656,985 4,841,624 4,815,361 27,410 4.92 100.5 352
Western 1,066,362 4,926,765 2,292,597 2,634,168 29,398 4.62 87.0 168
Mid-West 695,419 3,546,682 1,706,450 1,840,232 42,378 5.10 92.7 84
Far-Western 469,971 2,552,517 1,217,887 1,334,630 19,539 5.43 91.3 131
Eco-development regions
Eastern Mountain 84,918 392,089 186,977 205,112 10,438 4.62 91.2 38
Eastern Hill 346,571 1,601,347 756,522 844,825 10,749 4.62 89.5 149
Eastern Terai 800,016 3,818,119 1,846,984 1,971,135 7,269 4.77 93.7 525
Central Mountain 122,154 517,655 246,829 270,826 6,277 4.24 91.1 82
Central Hill 1,016,181 4,431,813 2,221,717 2,210,096 11,805 4.36 100.5 375
Central Terai 825,710 4,707,517 2,373,078 2,334,439 9,328 5.70 101.7 505
Western
Mountain
4,834 19,990 10,754 9,236 5,819 4.14 116.4 3
Western Hill 677,498 2,811,135 1,260,376 1,550,759 18,319 4.15 81.3 153
Western Terai 384,030 2,095,640 1,021,467 1,074,173 5,260 5.46 95.1 398
Mid-West Mountain 68,902 388,713 195,827 192,886 21,351 5.64 101.5 18
Mid-Western Hill 332,153 1,687,497 800,229 887,268 13,710 5.08 90.2 123
Mid-Western
Terai
294,364 1,470,472 710,394 760,078 7,317 5.00 93.5 201
Far-West Mountain 83,312 463,345 222,205 241,140 7,932 5.56 92.1 58
Far-Western Hill 162,027 862,215 401,223 460,992 6,762 5.32 87.0 128
Far-Western Terai 224,632 1,226,957 594,459 632,498 4,845 5.46 94.0 253
District populations
Taplejung 26,509 127,461 60,552 66,909 3,646 4.81 90.5 35
Panchthar 41,196 191,817 90,186 101,631 1,241 4.66 88.7 155
Ilam 64,502 290,254 141,126 149,128 1,703 4.50 94.6 170
Jhapa 184,552 812,650 385,096 427,554 1,606 4.40 90.1 506
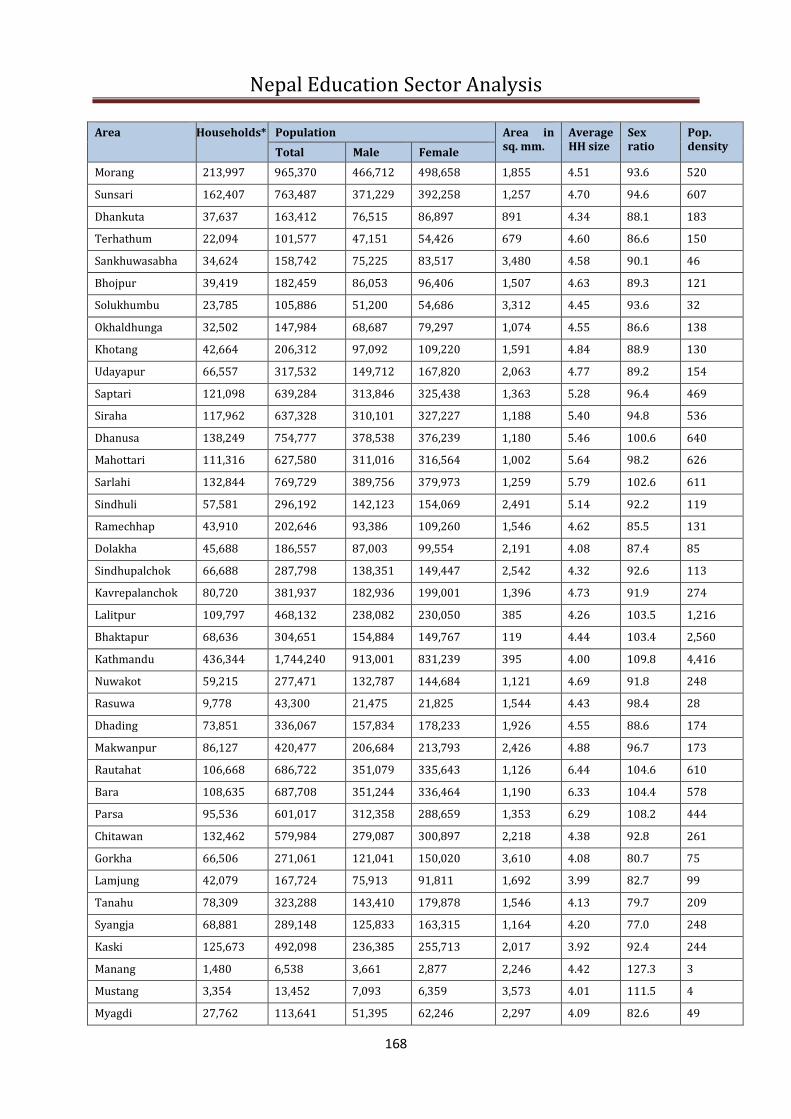
Nepal Education Sector Analysis
168
Area Households* Population Area in sq. mm.
Average HH size
Sex ratio
Pop. density
Total Male Female
Morang 213,997 965,370 466,712 498,658 1,855 4.51 93.6 520
Sunsari 162,407 763,487 371,229 392,258 1,257 4.70 94.6 607
Dhankuta 37,637 163,412 76,515 86,897 891 4.34 88.1 183
Terhathum 22,094 101,577 47,151 54,426 679 4.60 86.6 150
Sankhuwasabha 34,624 158,742 75,225 83,517 3,480 4.58 90.1 46
Bhojpur 39,419 182,459 86,053 96,406 1,507 4.63 89.3 121
Solukhumbu 23,785 105,886 51,200 54,686 3,312 4.45 93.6 32
Okhaldhunga 32,502 147,984 68,687 79,297 1,074 4.55 86.6 138
Khotang 42,664 206,312 97,092 109,220 1,591 4.84 88.9 130
Udayapur 66,557 317,532 149,712 167,820 2,063 4.77 89.2 154
Saptari 121,098 639,284 313,846 325,438 1,363 5.28 96.4 469
Siraha 117,962 637,328 310,101 327,227 1,188 5.40 94.8 536
Dhanusa 138,249 754,777 378,538 376,239 1,180 5.46 100.6 640
Mahottari 111,316 627,580 311,016 316,564 1,002 5.64 98.2 626
Sarlahi 132,844 769,729 389,756 379,973 1,259 5.79 102.6 611
Sindhuli 57,581 296,192 142,123 154,069 2,491 5.14 92.2 119
Ramechhap 43,910 202,646 93,386 109,260 1,546 4.62 85.5 131
Dolakha 45,688 186,557 87,003 99,554 2,191 4.08 87.4 85
Sindhupalchok 66,688 287,798 138,351 149,447 2,542 4.32 92.6 113
Kavrepalanchok 80,720 381,937 182,936 199,001 1,396 4.73 91.9 274
Lalitpur 109,797 468,132 238,082 230,050 385 4.26 103.5 1,216
Bhaktapur 68,636 304,651 154,884 149,767 119 4.44 103.4 2,560
Kathmandu 436,344 1,744,240 913,001 831,239 395 4.00 109.8 4,416
Nuwakot 59,215 277,471 132,787 144,684 1,121 4.69 91.8 248
Rasuwa 9,778 43,300 21,475 21,825 1,544 4.43 98.4 28
Dhading 73,851 336,067 157,834 178,233 1,926 4.55 88.6 174
Makwanpur 86,127 420,477 206,684 213,793 2,426 4.88 96.7 173
Rautahat 106,668 686,722 351,079 335,643 1,126 6.44 104.6 610
Bara 108,635 687,708 351,244 336,464 1,190 6.33 104.4 578
Parsa 95,536 601,017 312,358 288,659 1,353 6.29 108.2 444
Chitawan 132,462 579,984 279,087 300,897 2,218 4.38 92.8 261
Gorkha 66,506 271,061 121,041 150,020 3,610 4.08 80.7 75
Lamjung 42,079 167,724 75,913 91,811 1,692 3.99 82.7 99
Tanahu 78,309 323,288 143,410 179,878 1,546 4.13 79.7 209
Syangja 68,881 289,148 125,833 163,315 1,164 4.20 77.0 248
Kaski 125,673 492,098 236,385 255,713 2,017 3.92 92.4 244
Manang 1,480 6,538 3,661 2,877 2,246 4.42 127.3 3
Mustang 3,354 13,452 7,093 6,359 3,573 4.01 111.5 4
Myagdi 27,762 113,641 51,395 62,246 2,297 4.09 82.6 49
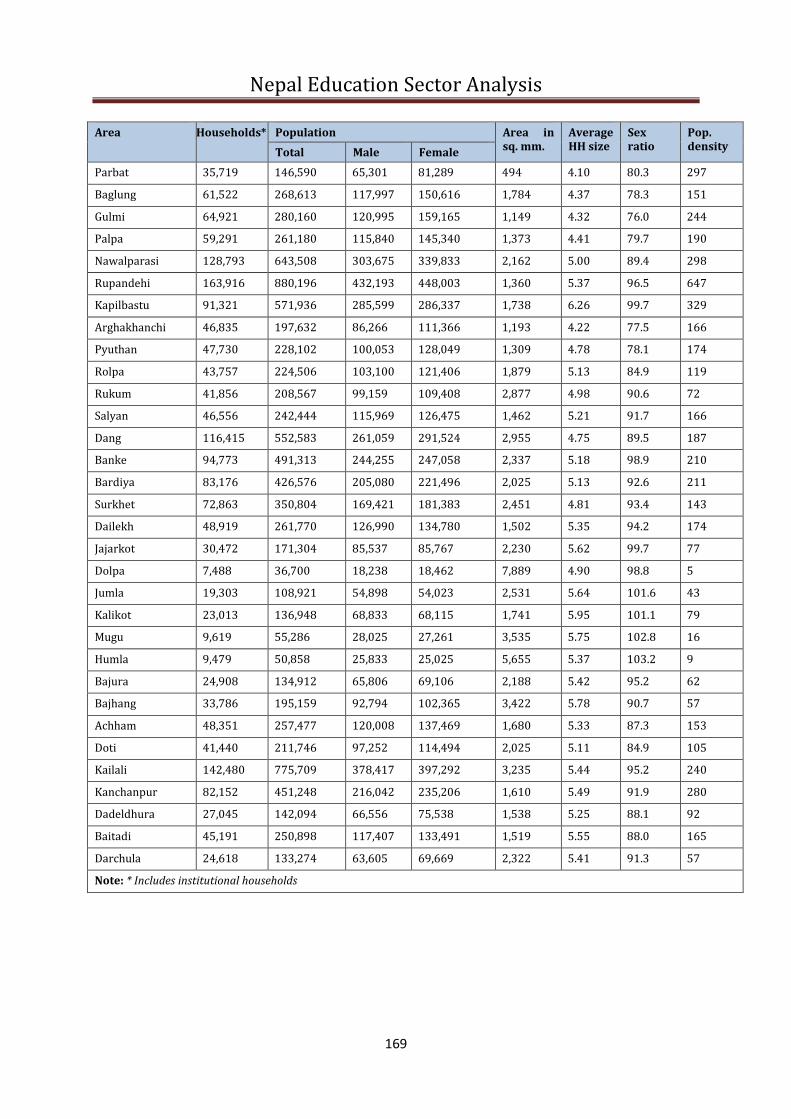
Nepal Education Sector Analysis
169
Area Households* Population Area in sq. mm.
Average HH size
Sex ratio
Pop. density
Total Male Female
Parbat 35,719 146,590 65,301 81,289 494 4.10 80.3 297
Baglung 61,522 268,613 117,997 150,616 1,784 4.37 78.3 151
Gulmi 64,921 280,160 120,995 159,165 1,149 4.32 76.0 244
Palpa 59,291 261,180 115,840 145,340 1,373 4.41 79.7 190
Nawalparasi 128,793 643,508 303,675 339,833 2,162 5.00 89.4 298
Rupandehi 163,916 880,196 432,193 448,003 1,360 5.37 96.5 647
Kapilbastu 91,321 571,936 285,599 286,337 1,738 6.26 99.7 329
Arghakhanchi 46,835 197,632 86,266 111,366 1,193 4.22 77.5 166
Pyuthan 47,730 228,102 100,053 128,049 1,309 4.78 78.1 174
Rolpa 43,757 224,506 103,100 121,406 1,879 5.13 84.9 119
Rukum 41,856 208,567 99,159 109,408 2,877 4.98 90.6 72
Salyan 46,556 242,444 115,969 126,475 1,462 5.21 91.7 166
Dang 116,415 552,583 261,059 291,524 2,955 4.75 89.5 187
Banke 94,773 491,313 244,255 247,058 2,337 5.18 98.9 210
Bardiya 83,176 426,576 205,080 221,496 2,025 5.13 92.6 211
Surkhet 72,863 350,804 169,421 181,383 2,451 4.81 93.4 143
Dailekh 48,919 261,770 126,990 134,780 1,502 5.35 94.2 174
Jajarkot 30,472 171,304 85,537 85,767 2,230 5.62 99.7 77
Dolpa 7,488 36,700 18,238 18,462 7,889 4.90 98.8 5
Jumla 19,303 108,921 54,898 54,023 2,531 5.64 101.6 43
Kalikot 23,013 136,948 68,833 68,115 1,741 5.95 101.1 79
Mugu 9,619 55,286 28,025 27,261 3,535 5.75 102.8 16
Humla 9,479 50,858 25,833 25,025 5,655 5.37 103.2 9
Bajura 24,908 134,912 65,806 69,106 2,188 5.42 95.2 62
Bajhang 33,786 195,159 92,794 102,365 3,422 5.78 90.7 57
Achham 48,351 257,477 120,008 137,469 1,680 5.33 87.3 153
Doti 41,440 211,746 97,252 114,494 2,025 5.11 84.9 105
Kailali 142,480 775,709 378,417 397,292 3,235 5.44 95.2 240
Kanchanpur 82,152 451,248 216,042 235,206 1,610 5.49 91.9 280
Dadeldhura 27,045 142,094 66,556 75,538 1,538 5.25 88.1 92
Baitadi 45,191 250,898 117,407 133,491 1,519 5.55 88.0 165
Darchula 24,618 133,274 63,605 69,669 2,322 5.41 91.3 57
Note: * Includes institutional households

Nepal Education Sector Analysis
170
Appendix B: Standards of USA Education Departments for Teacher and Administrator Competencies
Appendix B1: Oregon DoE’s Educational Leadership and Administrator Standards
Source: Oregon DoE (n.d.)
Oregon’s educational leadership/administrator standards embed cultural competency and
equitable practice in each standard. These standards guide administrative preparation, licensure
and job performance. Oregon’s educational leadership/administrator standards align with the
Interstate School Leaders Licensure Consortium (ISLLC) and the Educational Leadership
Constituents Council (ELCC) 2009 standards for Educational Leadership.
Oregon was very explicit and intentional about highlighting the importance of cultural
competency and equitable practices in the administrator standards. See link below for accessing
Performance Standards and Indicators for Education Leaders (ISLLC-Based Models):
http://www.ccsso.org/Documents/2008/Peformance_Indicators_2008.pdf
Standard #1: Visionary Leadership — An educational leader integrates principles of cultural
competency and equitable practice and promotes the success of every student by facilitating the
development, articulation, implementation, and stewardship of a vision of learning that is shared
and supported by stakeholders.
Educational Leaders:
a) Collaboratively develop and implement a shared vision and mission;
b) Collect and use data to identify goals, assess organizational effectiveness, and promote
organizational learning;
c) Create and implement plans to achieve goals;
d) Promote continuous and sustainable improvement; and
e) Monitor and evaluate progress and revise plans.
Standard #2: Instructional Improvement — An educational leader integrates principles of
cultural competency and equitable practice and promotes the success of every student by
sustaining a positive school culture and instructional program conducive to student learning and
staff professional growth. Educational Leaders:
a) Nurture and sustain a culture of collaboration, trust, learning and high expectations;
b) Create a comprehensive, rigorous and coherent curricular program;
c) Create a personalized and motivating learning environment for students;
d) Supervise and support instruction;
e) Develop assessment and accountability systems to monitor student progress;
f) Develop the instructional and leadership capacity of staff;
g) Maximize time spent on quality instruction;
h) Promote the use of the most effective and appropriate technologies to support teaching and
learning; and

Nepal Education Sector Analysis
171
i) Monitor and evaluate the impact of instruction.
Standard #3: Effective Management — An educational leader integrates principles of cultural
competency and equitable practice and promotes the success of every student by ensuring
management of the organization, operation, and resources for a safe, efficient, and effective
learning environment.
Educational Leaders:
a) Monitor and evaluate the management and operational systems;
b) Obtain, allocate, align and efficiently use human, fiscal and technological resources;
c) Promote and protect the welfare and safety of students and staff;
d) Develop the capacity for adaptive leadership; and
e) Ensure teacher and organizational time is focused to support quality instruction and student
learning.
Standard #4: Inclusive Practice — An educational leader integrates principles of cultural
competency and equitable practice and promotes the success of every student by collaborating
with faculty and community members, responding to diverse community interests and needs, and
mobilizing community resources in order to demonstrate and promote ethical standards of
democracy, equity, diversity, and excellence, and to promote communication among diverse
groups.
Educational Leaders:
a) Collect and analyses data pertinent to equitable outcomes;
b) Understand and integrate the community’s diverse cultural, social and intellectual resources;
c) Build and sustain positive relationships with families and caregivers; and
d) Build and sustain productive relationships with community partners.
Standard #5: Ethical Leadership — An educational leader integrates principles of cultural
competency and equitable practice and promotes the success of every student by acting with
integrity, fairness, and in an ethical manner.
Educational Leaders:
a) Ensure a system of accountability for every student’s academic and social success;
b) Model principles of self-awareness, reflective practice, transparency and ethical behavior;
c) Safeguard the values of democracy, equity and diversity;
d) Evaluate the potential ethical and legal consequences of decision-making; and
e) Promote social justice and ensure that individual student needs inform all aspects of
schooling.
Standard #6: Socio-Political Context — An educational leader integrates principles of cultural
competency and equitable practice and promotes the success of every student by understanding,
responding to, and influencing the larger political, social, economic, legal, and cultural context.
Educational Leaders:

Nepal Education Sector Analysis
172
a) Advocate for children, families and caregivers;
b) Act to influence local, district, state and national decisions affecting student learning; and
c) Assess, analyses and anticipate emerging trends and initiatives in order to adapt leadership
strategies.
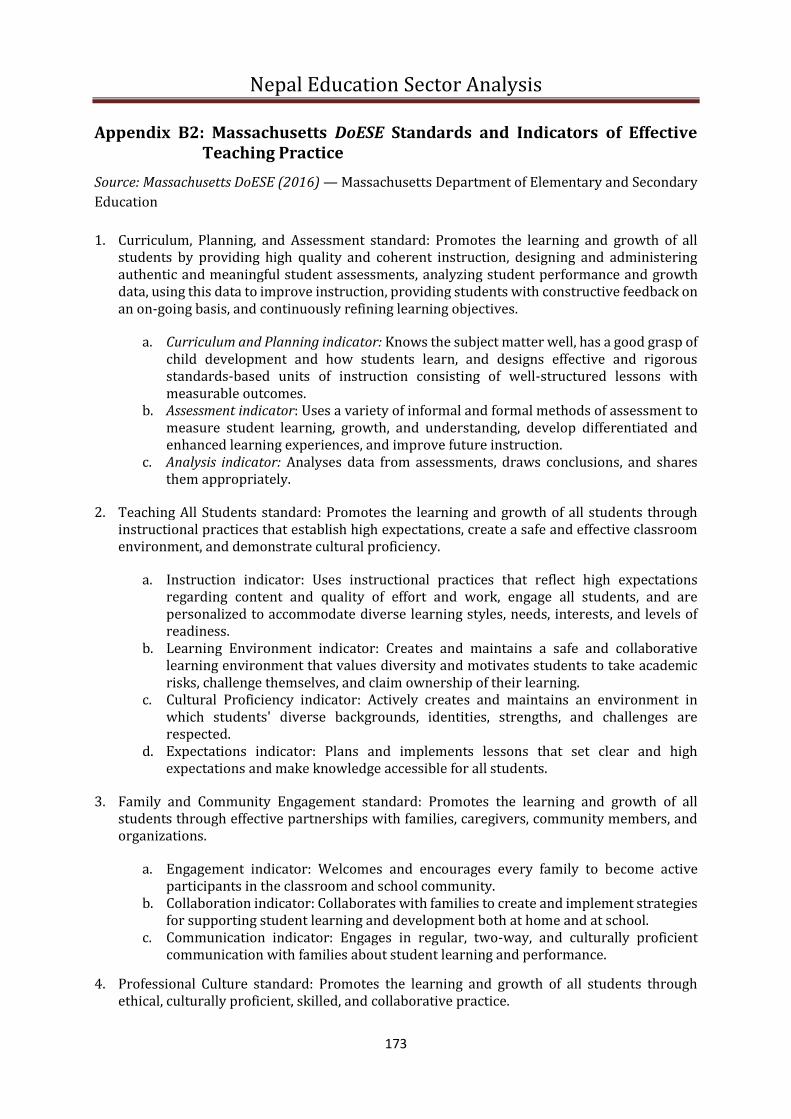
Nepal Education Sector Analysis
173
Appendix B2: Massachusetts DoESE Standards and Indicators of Effective Teaching Practice
Source: Massachusetts DoESE (2016) — Massachusetts Department of Elementary and Secondary
Education
1. Curriculum, Planning, and Assessment standard: Promotes the learning and growth of all students by providing high quality and coherent instruction, designing and administering authentic and meaningful student assessments, analyzing student performance and growth data, using this data to improve instruction, providing students with constructive feedback on an on-going basis, and continuously refining learning objectives.
a. Curriculum and Planning indicator: Knows the subject matter well, has a good grasp of child development and how students learn, and designs effective and rigorous standards-based units of instruction consisting of well-structured lessons with measurable outcomes.
b. Assessment indicator: Uses a variety of informal and formal methods of assessment to measure student learning, growth, and understanding, develop differentiated and enhanced learning experiences, and improve future instruction.
c. Analysis indicator: Analyses data from assessments, draws conclusions, and shares them appropriately.
2. Teaching All Students standard: Promotes the learning and growth of all students through instructional practices that establish high expectations, create a safe and effective classroom environment, and demonstrate cultural proficiency.
a. Instruction indicator: Uses instructional practices that reflect high expectations regarding content and quality of effort and work, engage all students, and are personalized to accommodate diverse learning styles, needs, interests, and levels of readiness.
b. Learning Environment indicator: Creates and maintains a safe and collaborative learning environment that values diversity and motivates students to take academic risks, challenge themselves, and claim ownership of their learning.
c. Cultural Proficiency indicator: Actively creates and maintains an environment in which students' diverse backgrounds, identities, strengths, and challenges are respected.
d. Expectations indicator: Plans and implements lessons that set clear and high expectations and make knowledge accessible for all students.
3. Family and Community Engagement standard: Promotes the learning and growth of all students through effective partnerships with families, caregivers, community members, and organizations.
a. Engagement indicator: Welcomes and encourages every family to become active participants in the classroom and school community.
b. Collaboration indicator: Collaborates with families to create and implement strategies for supporting student learning and development both at home and at school.
c. Communication indicator: Engages in regular, two-way, and culturally proficient communication with families about student learning and performance.
4. Professional Culture standard: Promotes the learning and growth of all students through ethical, culturally proficient, skilled, and collaborative practice.
Nepal Education Sector Analysis
174
a. Reflection indicator: Demonstrates the capacity to reflect on and improve the educator's own practice, using informal means as well as meetings with teams and work groups to gather information, analyses data, examine issues, set meaningful goals, and develop new approaches in order to improve teaching and learning.
b. Professional Growth indicator: Actively pursues professional development and learning opportunities to improve quality of practice or build the expertise and experience to assume different instructional and leadership roles.
c. Collaboration indicator: Collaborates effectively with colleagues on a wide range of tasks.
d. Decision-making indicator: Becomes involved in school-wide decision-making, and takes an active role in school improvement planning.
e. Shared Responsibility indicator: Shares responsibility for the performance of all students within the school.
f. Professional Responsibilities indicator: Is ethical and reliable, and meets routine responsibilities consistently.

Nepal Education Sector Analysis
175
Appendix C: Evolution of the Demographic Dividend Window of Opportunity in Nepal
-20 -10 0 10 20
00-04
05-09
09-14
15-19
20-24
25-29
30-34
35-39
40-44
45-49
50-54
55-59
60-64
65+
1971 Population Pyramid
Female Male
-20 -10 0 10 20
00-04
05-09
09-14
15-19
20-24
25-29
30-34
35-39
40-44
45-49
50-54
55-59
60-64
65+
1991 Population Pyramid
Female Male
-15 -10 -5 0 5 10 15
00-04
05-09
09-14
15-19
20-24
25-29
30-34
35-39
40-44
45-49
50-54
55-59
60-64
65+
2011 Population Pyramid
Female Male
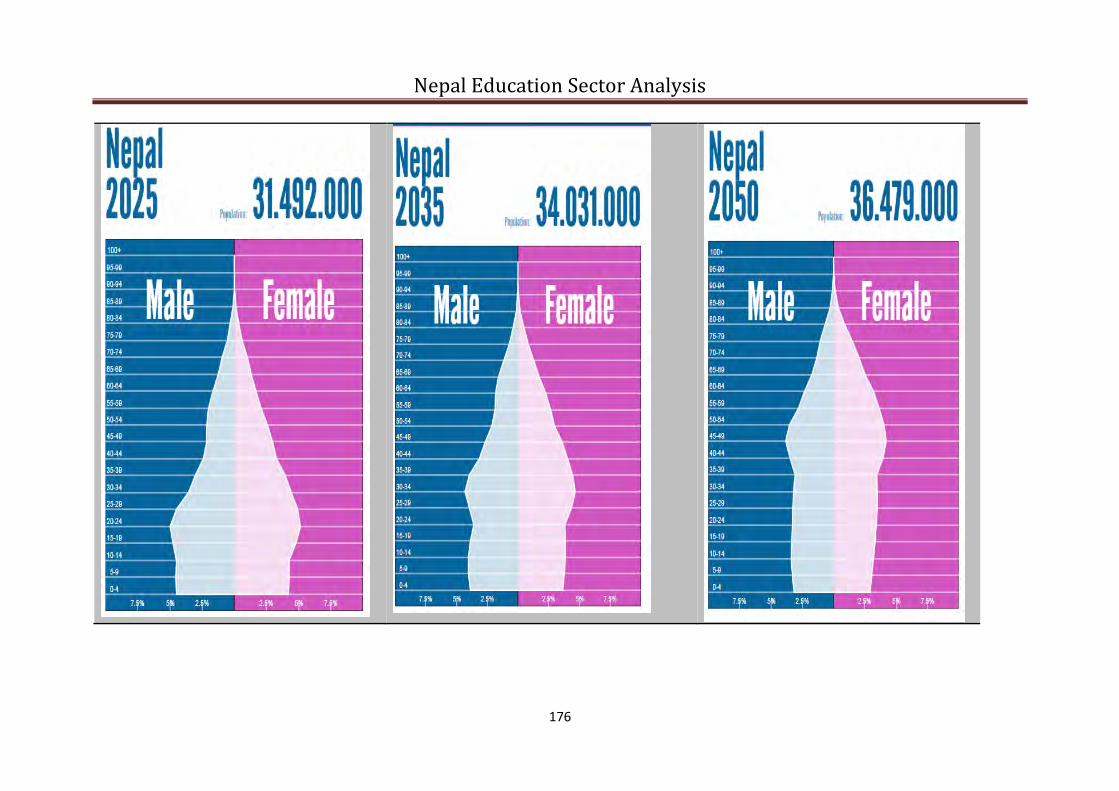
Nepal Education Sector Analysis
176

Nepal Education Sector Analysis
177

Nepal Education Sector Analysis
178
Appendix D: Strategic Roadmap for Early Childhood Development
Strategic outcomes Strategic outputs Activities
1. Enhance access and
quality of ECD services
1.1. Increase access to ECED
centers
1.1.1 Determine the requirement of ECD centers
(baseline)
1.1.2 Deliver training on child development and learning,
parents’ roles, and inclusive practices to FCHVs, parents,
child clubs
1.1.3. Establish new ECED centers
Implement home-based ECCD program
1.2 Improve physical
infrastructure
1.2.1 Support exterior infrastructure improvements
(upgrade and build) for ECED centers to minimum
standards
1.2.2 Support interior infrastructure improvements
(sitting arrangements, learning areas) to minimum
standards
1.2.3 Support access to safe drinking water at ECED
centers
1.3. Enhance quality of ECED
centers
1.3.1. Upgrade current 35,121 ECD/PPC centers according
to minimum standards
1.3.2. Build an ECD resource center in each district and
encourage to develop model centers (in each VDC and in
municipality)
1.3.3 Implement Early Learning and Development
Standards and ECD curriculum in ECD centers and PPCs
(private and public)
1.3.4 Provide multipurpose materials (kit box) according
to minimum standard
1.3.5. Coordinate with MoH and mobilize district health
offices, health posts and sub health posts to ensure basic
health services (deworming, immunization, growth
monitoring, etc.)
1.4. Improve ECED
management capacity
1.4.1. Redefine the composition of management
committees and form and reform ECED committees
accordingly
1.4.2. Train ECED management committee members on
leadership and management skills and orientate them on
their roles and responsibilities.
1.4.3. Encourage ECED management committees to
perform regular monitoring of ECED centers
1.5.Improve understanding
of importance of ECED
among parents and
community members
1.5.1 Implement parenting education program
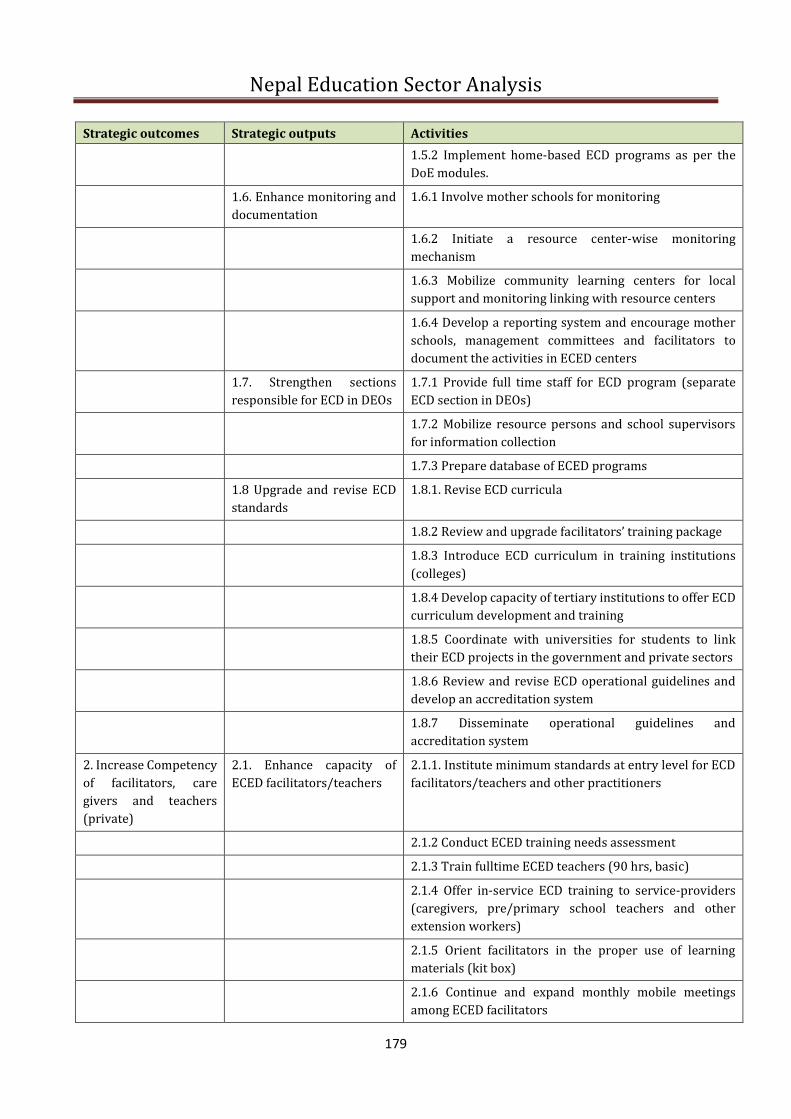
Nepal Education Sector Analysis
179
Strategic outcomes Strategic outputs Activities
1.5.2 Implement home-based ECD programs as per the
DoE modules.
1.6. Enhance monitoring and
documentation
1.6.1 Involve mother schools for monitoring
1.6.2 Initiate a resource center-wise monitoring
mechanism
1.6.3 Mobilize community learning centers for local
support and monitoring linking with resource centers
1.6.4 Develop a reporting system and encourage mother
schools, management committees and facilitators to
document the activities in ECED centers
1.7. Strengthen sections
responsible for ECD in DEOs
1.7.1 Provide full time staff for ECD program (separate
ECD section in DEOs)
1.7.2 Mobilize resource persons and school supervisors
for information collection
1.7.3 Prepare database of ECED programs
1.8 Upgrade and revise ECD
standards
1.8.1. Revise ECD curricula
1.8.2 Review and upgrade facilitators’ training package
1.8.3 Introduce ECD curriculum in training institutions
(colleges)
1.8.4 Develop capacity of tertiary institutions to offer ECD
curriculum development and training
1.8.5 Coordinate with universities for students to link
their ECD projects in the government and private sectors
1.8.6 Review and revise ECD operational guidelines and
develop an accreditation system
1.8.7 Disseminate operational guidelines and
accreditation system
2. Increase Competency
of facilitators, care
givers and teachers
(private)
2.1. Enhance capacity of
ECED facilitators/teachers
2.1.1. Institute minimum standards at entry level for ECD
facilitators/teachers and other practitioners
2.1.2 Conduct ECED training needs assessment
2.1.3 Train fulltime ECED teachers (90 hrs, basic)
2.1.4 Offer in-service ECD training to service-providers
(caregivers, pre/primary school teachers and other
extension workers)
2.1.5 Orient facilitators in the proper use of learning
materials (kit box)
2.1.6 Continue and expand monthly mobile meetings
among ECED facilitators

Nepal Education Sector Analysis
180
Strategic outcomes Strategic outputs Activities
2.1.7 Provide opportunities to increase the minimum
qualification of already appointed facilitators through
open school system.
2.1.8 Attach at least a supervisor and a lead facilitator to
ECED centers within resource centers/VDC
2.1.9 Create a cadre of ECD trainers in each district
2.1.10 Develop a holistic one-year diploma in ECD
3. Allocate resources
and enhance capability
3.1 Mobilize local, internal and
external sources of revenue
3.1.1 Form technical working groups for advocacy and
resource mobilization at national and district levels
3.1.2 Hold a national workshop and roundtable discussion
with multi-donor/stakeholder resource mobilization
3.1.3 Organize national and district level workshops for
multi sector investment in ECD programming
3.1.4 Coordinate MoFALD to encourage DDCs, VDCs and
municipalities to allocate at least 5% budget for ECD
3.1.5 Encourage businesses to contribute to ECD as per
their corporate social responsibility
3.2 Build human capacity to
design develop and
implement ECD program
3.2.1 Carry out district level ECD training needs
assessments
3.1.2 Conduct ECD ToT trainings (basic, refresher,
consultation workshop, learning sharing field visit)
3.2.3 Develop master level ECD trainer (ECD specialists)
and create and train ECD supervisors
3.2.4 Encourage secondary schools to include ECD
subjects in Grade 9 and 10
3.2.5 Encourage universities to initiate academic
(graduate level) course on ECD
4. Raise advocacy and
awareness
4.1 Develop an advocacy and
communication strategy for
ECD
4.1.1 Commission a multisectoral task force to develop the
communication strategy
4.1.2 Hold a workshop to draft ECED communication
strategy and develop messages
4.1.3 Consult stakeholders about the communication
strategy
4.2 Conduct advocacy
campaign on ECD
4.2.1 Sensitize the general public, teachers (private and
public), policy makers and technocrats on the importance
of ECD
4.2.2 Encourage MoF, MoFALD, donors and corporate
sectors to invest in ECD
4.2.3 Activate the National Council for ECD
4.2.4 Develop and disseminate IEC materials on ECD
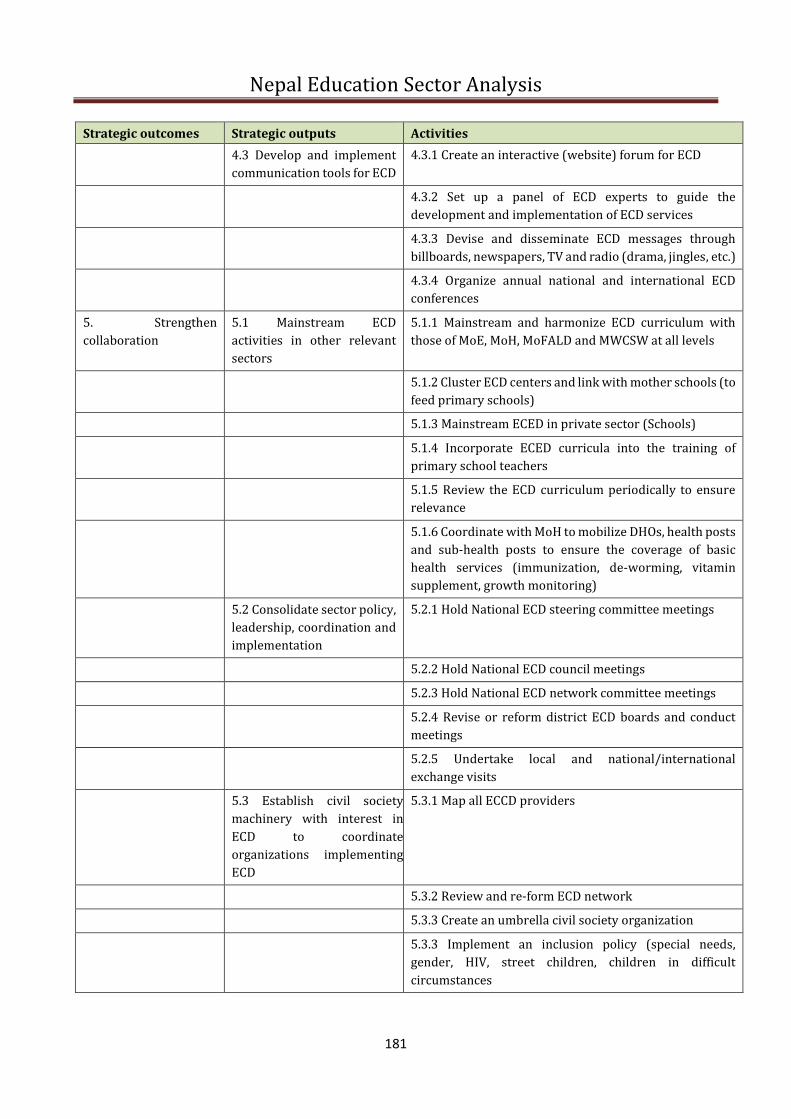
Nepal Education Sector Analysis
181
Strategic outcomes Strategic outputs Activities
4.3 Develop and implement
communication tools for ECD
4.3.1 Create an interactive (website) forum for ECD
4.3.2 Set up a panel of ECD experts to guide the
development and implementation of ECD services
4.3.3 Devise and disseminate ECD messages through
billboards, newspapers, TV and radio (drama, jingles, etc.)
4.3.4 Organize annual national and international ECD
conferences
5. Strengthen
collaboration
5.1 Mainstream ECD
activities in other relevant
sectors
5.1.1 Mainstream and harmonize ECD curriculum with
those of MoE, MoH, MoFALD and MWCSW at all levels
5.1.2 Cluster ECD centers and link with mother schools (to
feed primary schools)
5.1.3 Mainstream ECED in private sector (Schools)
5.1.4 Incorporate ECED curricula into the training of
primary school teachers
5.1.5 Review the ECD curriculum periodically to ensure
relevance
5.1.6 Coordinate with MoH to mobilize DHOs, health posts
and sub-health posts to ensure the coverage of basic
health services (immunization, de-worming, vitamin
supplement, growth monitoring)
5.2 Consolidate sector policy,
leadership, coordination and
implementation
5.2.1 Hold National ECD steering committee meetings
5.2.2 Hold National ECD council meetings
5.2.3 Hold National ECD network committee meetings
5.2.4 Revise or reform district ECD boards and conduct
meetings
5.2.5 Undertake local and national/international
exchange visits
5.3 Establish civil society
machinery with interest in
ECD to coordinate
organizations implementing
ECD
5.3.1 Map all ECCD providers
5.3.2 Review and re-form ECD network
5.3.3 Create an umbrella civil society organization
5.3.3 Implement an inclusion policy (special needs,
gender, HIV, street children, children in difficult
circumstances

Nepal Education Sector Analysis
182
Strategic outcomes Strategic outputs Activities
5.4 Build the capacity of key
institutions to design,
develop and implement ECD
programs
5.4.1.Assess the institutional and technical capacity of
organizations that implement ECD
5.4.2 Draw up a capacity development plan
5.4.3 Monitor implementation of capacity development
plan
6. Enhance Monitoring
and evaluation and
research for ECD
6.1 Establish an M&E system 6.1.1 Review existing M&E tools on ECD
6.1.2 Develop a comprehensive M&E system
6.1.3 Train officers and stakeholders on new system
6.1.4 Develop an ECED database
6.2 Hold regular planning
and review meetings
6.2.1 Regularize (annual/ biannual) national stakeholder
meetings
6.2.2 Regularize district stakeholder meetings
6.2.3 Compile and disseminate ECD implementation
reports
6.3 Strengthen research and
development capacity for
ECD
6.3.1 Develop research agenda and initiate (action)
research for ECD
6.3.2 Commission research including action research
6.3.3 Create a forum to regularly disseminate ECD
research findings