NEMETSCHEK GROUP Financial Results Q1 2016 · PDF fileNEMETSCHEK GROUP Financial Results Q1...
17
NEMETSCHEK GROUP Financial Results Q1 2016 April 29 th , 2016 University of Minnesota, Minneapolis, USA Antoine Predock Architect | Image: Tim Hursley | realized with Vectorworks
Transcript of NEMETSCHEK GROUP Financial Results Q1 2016 · PDF fileNEMETSCHEK GROUP Financial Results Q1...

NEMETSCHEK GROUPFinancial Results Q1 2016
April 29th, 2016
University of Minnesota, Minneapolis, USAAntoine Predock Architect | Image: Tim Hursley | realized with Vectorworks
2APRIL 2016 FINANCIAL RESULTS Q1 2016
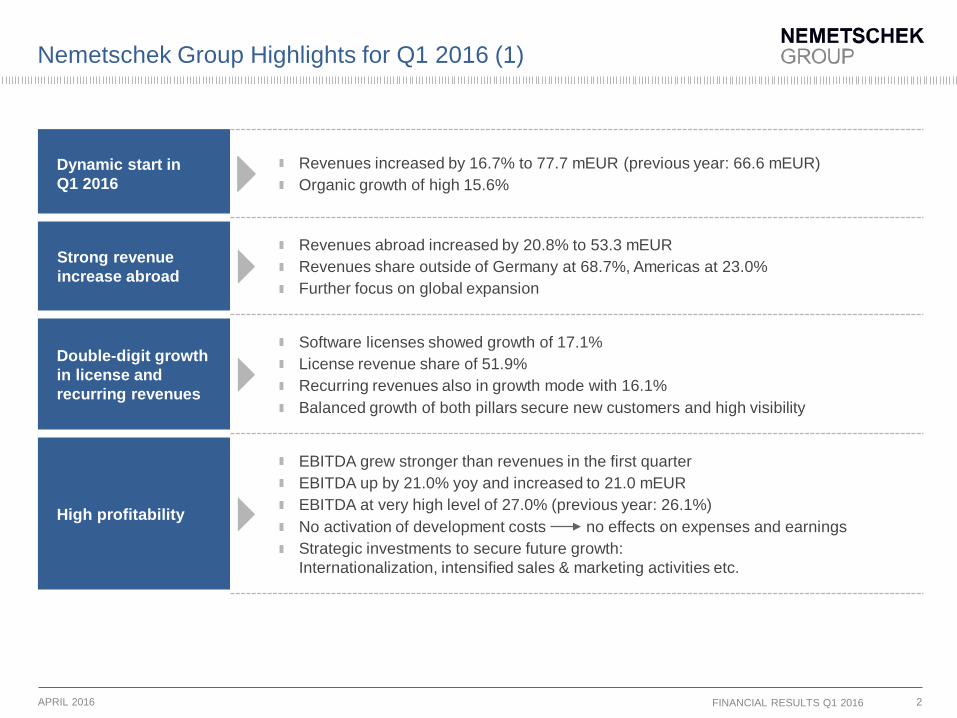
Nemetschek Group Highlights for Q1 2016 (1)
Dynamic start in Q1 2016 Revenues increased by 16.7% to 77.7 mEUR (previous year: 66.6 mEUR)
Organic growth of high 15.6%
Strong revenue increase abroad
Revenues abroad increased by 20.8% to 53.3 mEURRevenues share outside of Germany at 68.7%, Americas at 23.0%Further focus on global expansion
Double-digit growth in license and recurring revenues
Software licenses showed growth of 17.1%License revenue share of 51.9%Recurring revenues also in growth mode with 16.1%Balanced growth of both pillars secure new customers and high visibility
High profitability EBITDA grew stronger than revenues in the first quarterEBITDA up by 21.0% yoy and increased to 21.0 mEUREBITDA at very high level of 27.0% (previous year: 26.1%)No activation of development costs no effects on expenses and earnings Strategic investments to secure future growth: Internationalization, intensified sales & marketing activities etc.
3
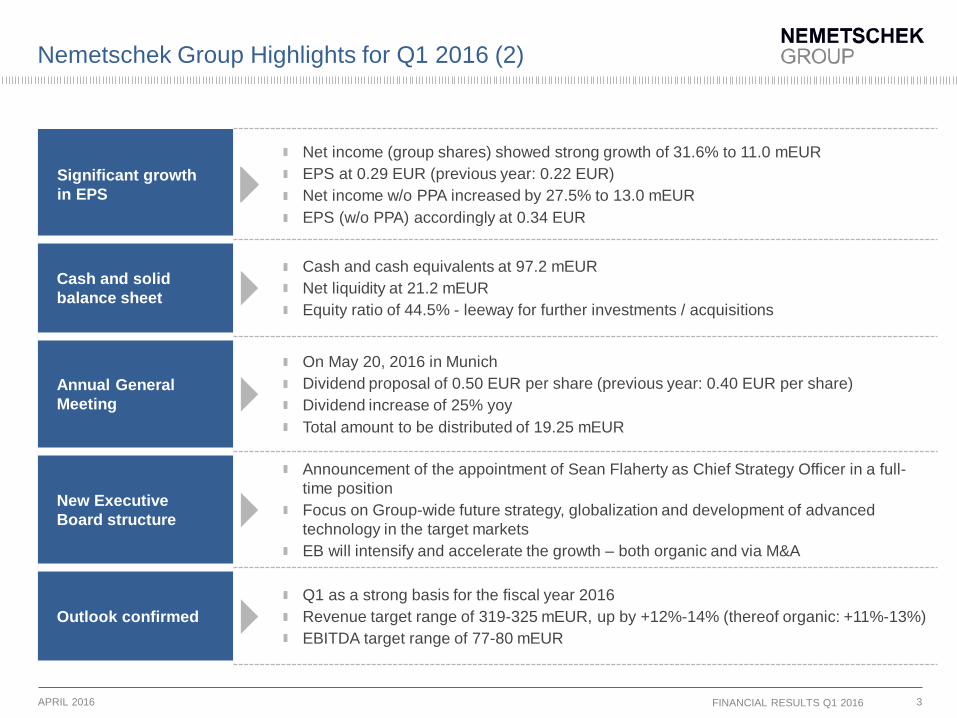
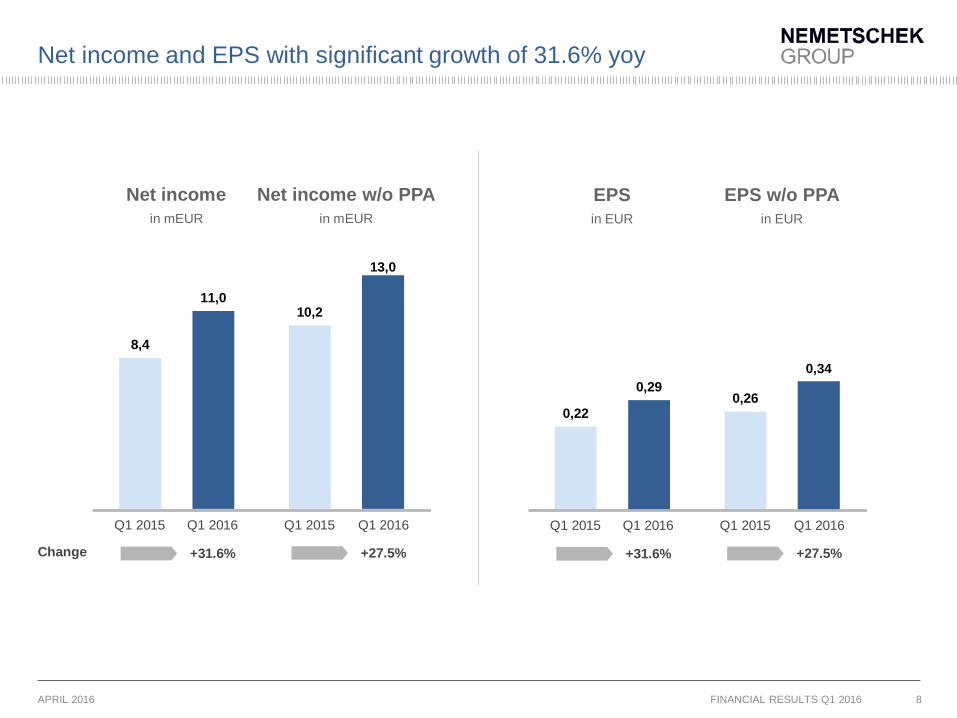
Significant growth in EPS
Net income (group shares) showed strong growth of 31.6% to 11.0 mEUREPS at 0.29 EUR (previous year: 0.22 EUR)Net income w/o PPA increased by 27.5% to 13.0 mEUREPS (w/o PPA) accordingly at 0.34 EUR
Cash and solid balance sheet
Cash and cash equivalents at 97.2 mEURNet liquidity at 21.2 mEUREquity ratio of 44.5% - leeway for further investments / acquisitions
Annual General Meeting
On May 20, 2016 in MunichDividend proposal of 0.50 EUR per share (previous year: 0.40 EUR per share)Dividend increase of 25% yoyTotal amount to be distributed of 19.25 mEUR
New Executive Board structure
Announcement of the appointment of Sean Flaherty as Chief Strategy Officer in a full-time positionFocus on Group-wide future strategy, globalization and development of advanced technology in the target marketsEB will intensify and accelerate the growth – both organic and via M&A
Outlook confirmed Q1 as a strong basis for the fiscal year 2016Revenue target range of 319-325 mEUR, up by +12%-14% (thereof organic: +11%-13%)EBITDA target range of 77-80 mEUR
Nemetschek Group Highlights for Q1 2016 (2)
APRIL 2016 FINANCIAL RESULTS Q1 2016

Revenues: Excellent start in the fiscal year 2016
APRIL 2016 FINANCIAL RESULTS Q1 2016 4
66,6
68,6
70,7
79,377,7
+16.7%
Revenues in mEUR
Q1 2016 revenues increased strongly by 16.7% to 77.7 mEURSolibri contributed revenues of around 1 mEUROrganic growth of high 15.6% yoy
Q1 2015 Q2 2015 Q3 2015 Q4 2015 Q1 2016

International growth accelerated
APRIL 2016 FINANCIAL RESULTS Q1 2016 5
Germany31%
Europe w/oGermany
37%
Americas23%
Asia/Pacific8%
RoW1%
Strong growth of 20.8% abroad Growth markets: - Americas- Asia- NordicsFurther growth potential abroad
Revenues split Q1 2016 in %

Software licenses and recurring revenues shows double-digit growth
APRIL 2016 FINANCIAL RESULTS Q1 2016 6
Software licenserevenues
51,9%
Recurringrevenues*
42,8%
Consulting &Hardware
5,3%
Software license revenuesUp by 17.1% to 40.3 mEURNew customers winsIncreasing customer baseConsequently recurring revenues will follow
Recurring revenues*Up by 16.1% to 33.3 mEURIncreasing visibility
Revenues split Q1 2016 in %
* Software services, subscripton
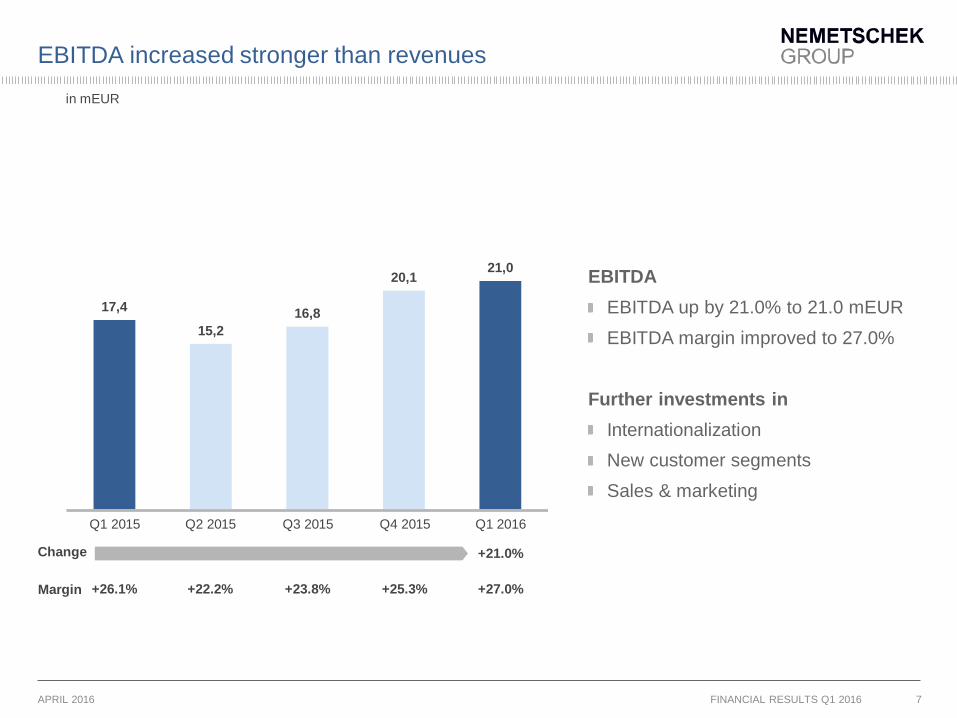
EBITDA increased stronger than revenues
APRIL 2016 FINANCIAL RESULTS Q1 2016 7
17,4
15,216,8
20,121,0
+21.0%
in mEUR
EBITDAEBITDA up by 21.0% to 21.0 mEUREBITDA margin improved to 27.0%
Further investments inInternationalizationNew customer segmentsSales & marketing
Change
Q1 2015 Q2 2015 Q3 2015 Q4 2015 Q1 2016
Margin +26.1% +22.2% +23.8% +25.3% +27.0%
Net income and EPS with significant growth of 31.6% yoy
APRIL 2016 FINANCIAL RESULTS Q1 2016 8
8,4
10,211,0
13,0
+31.6%
Net income Net income w/o PPAin mEUR in mEUR
Change
Q1 2015 Q1 2016 Q1 2015 Q1 2016
+27.5%
0,220,26
0,290,34
+31.6%
EPS EPS w/o PPAin EUR in EUR
Q1 2015 Q1 2016 Q1 2015 Q1 2016
+27.5%
Segment overview
APRIL 2016 FINANCIAL RESULTS Q1 2016 9
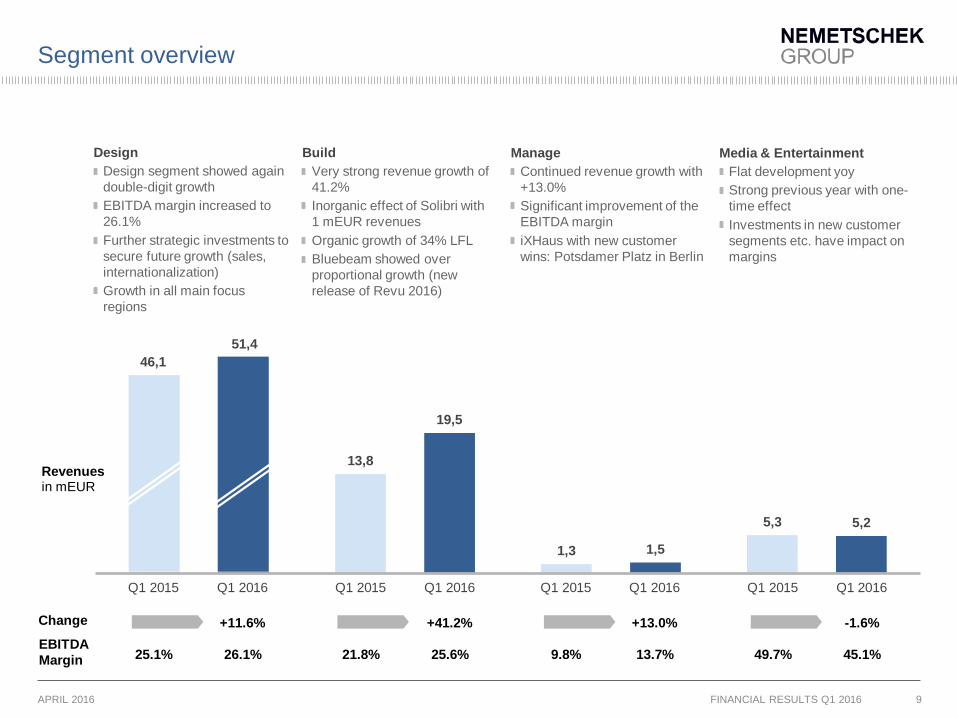
20,0
13,8
1,3
5,3
30,0
19,5
1,5
5,2
Revenuesin mEUR
EBITDAMargin
Change
DesignDesign segment showed again double-digit growth EBITDA margin increased to 26.1%Further strategic investments to secure future growth (sales, internationalization)Growth in all main focus regions
BuildVery strong revenue growth of 41.2%Inorganic effect of Solibri with 1 mEUR revenuesOrganic growth of 34% LFLBluebeam showed over proportional growth (new release of Revu 2016)
ManageContinued revenue growth with +13.0%Significant improvement of the EBITDA marginiXHaus with new customer wins: Potsdamer Platz in Berlin
Media & EntertainmentFlat development yoyStrong previous year with one-time effect Investments in new customer segments etc. have impact on margins
Q1 2015 Q1 2016 Q1 2015 Q1 2016 Q1 2015 Q1 2016 Q1 2015 Q1 2016
25.1% 26.1% 21.8% 25.6% 9.8% 13.7% 49.7% 45.1%
+11.6% +41.2% +13.0% -1.6%
46,151,4

Cash flow situation
APRIL 2016 FINANCIAL RESULTS Q1 2016 10
in mEUR
EBITDA+21.0% yoy
Operating cash flow+7.2% to 21.3 mEUR
Investing cash flowCapex of 1.9 mEURPrevious year: Investment in distribution partner
Cash flow from financing activitiesRepayment of bank loan (-4.6 mEUR)
Net liquidity situationLeeway to grow organically and via acquisitions
Conversion rate** Strong conversion rate of 102% (previous year: 115%)
3,3
-4,8
-2,6
19,9
17,4
21,2
-4,8
-1,8
21,3
21,0EBITDA
Operating cash flow
Investing cash flow
Cash flow from financing activities
Net liquidity
Q1 2016Q1 2015
** Operating cash flow / EBITDA
*
* End of FY 2015
Optimistic outlook 2016 confirmed
APRIL 2016 FINANCIAL RESULTS Q1 2016
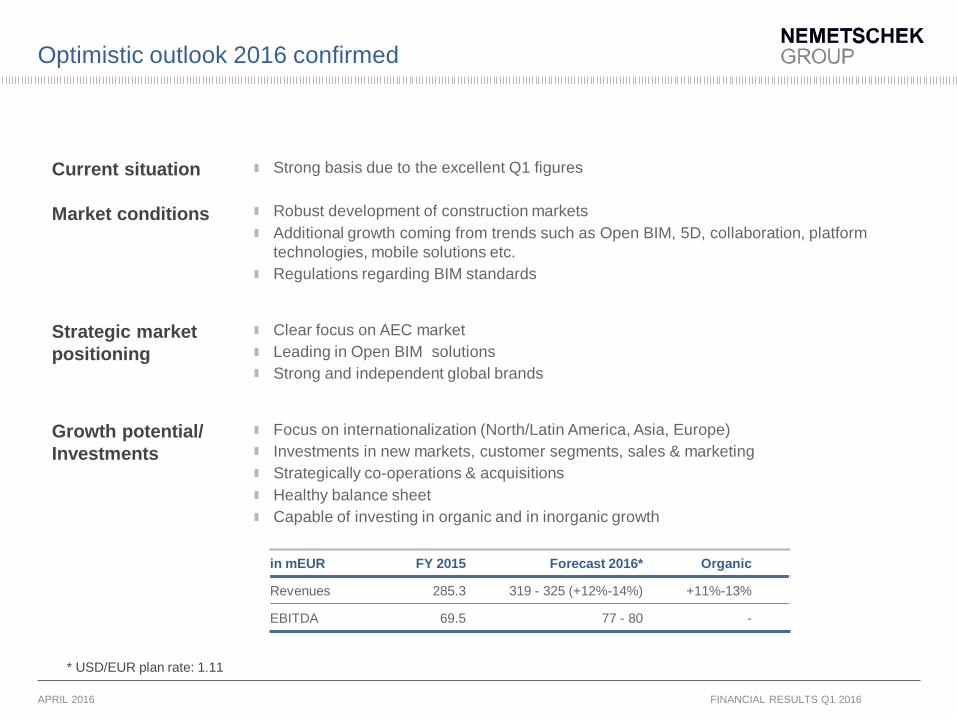
Current situation
Market conditions
Strong basis due to the excellent Q1 figures
Robust development of construction marketsAdditional growth coming from trends such as Open BIM, 5D, collaboration, platform technologies, mobile solutions etc. Regulations regarding BIM standards
Strategic market positioning
Clear focus on AEC marketLeading in Open BIM solutionsStrong and independent global brands
Growth potential/ Investments
Focus on internationalization (North/Latin America, Asia, Europe)Investments in new markets, customer segments, sales & marketing Strategically co-operations & acquisitionsHealthy balance sheetCapable of investing in organic and in inorganic growth
in mEUR FY 2015 Forecast 2016* Organic
Revenues 285.3 319 - 325 (+12%-14%) +11%-13%
EBITDA 69.5 77 - 80 -
* USD/EUR plan rate: 1.11

APRIL 2016 FINANCIAL RESULTS Q1 2016 12
Appendix
Auth
ority
for U
rban
Dev
elop
men
t and
the
Envi
ronm
ent,
Ham
burg
, Ger
man
yN
BK K
eram
ik G
mbH
| Im
ages
: And
reas
Lec
htap
e | r
ealiz
ed w
ith A
llpla
n

13
P+L statement Q1 comparison
mEUR Q1 2016 Q1 2015 % YoY
Revenues 77.7 66.6 +16.7%
Own work capitalized/ other operating income 1.2 2.2 -47.7%
Operating income 78.8 68.8 +14.6%
Cost of materials/ purchased services -2.4 -2.0 +19.2%
Personnel expenses -35.0 -30.0 +16.7%
Other operating expenses -20.5 -19.4 +5.3%
Operating costs -57.9 -51.4 +12.5%
EBITDA 21.0 17.4 +21.0%
Margin 27.0% 26.1%
Depreciation of PPA and amortization -4.4 -4.1 +6.9%
t/o PPA -2.7 -2.5 +6.0%
EBITA (normalized EBIT) 19.3 15.8 +22.3%
EBIT 16.6 13.2 +25.4%
Financial result -0.2 0.0
EBT 16.4 13.3 +23.4%
Income taxes -4.8 -4.4 +9.0%
Non-controlling interests -0.5 -0.5
Net income (group shares) 11.0 8.4 +31.6%
EPS in EUR 0.29 0.22* +31.6%
* for better comparability, earnings per share has been presented after the stock split
APRIL 2016 FINANCIAL RESULTS Q1 2016
14
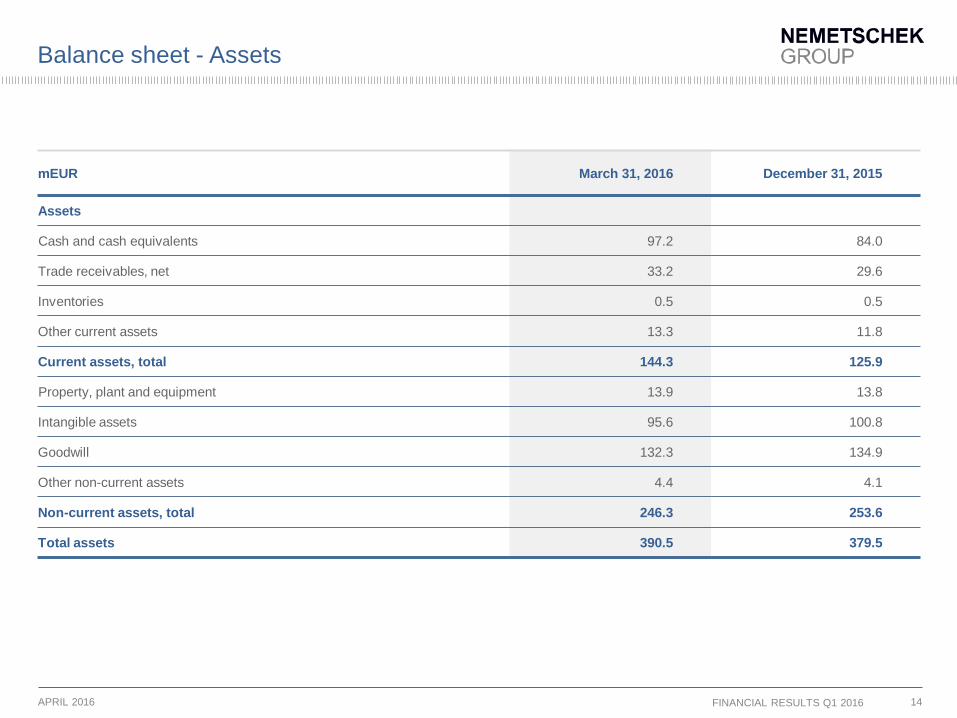
Balance sheet - Assets
mEUR March 31, 2016 December 31, 2015
Assets
Cash and cash equivalents 97.2 84.0
Trade receivables, net 33.2 29.6
Inventories 0.5 0.5
Other current assets 13.3 11.8
Current assets, total 144.3 125.9
Property, plant and equipment 13.9 13.8
Intangible assets 95.6 100.8
Goodwill 132.3 134.9
Other non-current assets 4.4 4.1
Non-current assets, total 246.3 253.6
Total assets 390.5 379.5
APRIL 2016 FINANCIAL RESULTS Q1 2016

15
Balance sheet – Equity and liabilities
mEUR March 31, 2016 December 31, 2015
Equity and liabilities
Short-term borrowings and current portion of long-term loans 18.6 18.6
Trade payables & accrued liabilities 24.8 32.2
Deferred revenue 56.6 42.0
Other current assets 15.7 11.4
Current liabilities, total 115.7 104.1
Long-term borrowings without current portion 57.5 62.1
Deferred tax liabilities 23.4 24.3
Other non-current liabilities 20.2 22.1
Non-current liabilities, total 101.0 108.5
Subscribed capital and capital reserve 51.0 51.0
Retained earnings 127.3 116.3
Other comprehensive income -7.0 -2.5
Non-controlling interests 2.5 2.1
Equity, total 173.8 166.9
Total equity and liabilities 390.5 379.5
APRIL 2016 FINANCIAL RESULTS Q1 2016

16
Cash flow statement
mEUR March 31, 2016 March 31, 2015 % YoY
Cash and cash equivalents at the beginning of the period 84.0 57.0 +47.4%
Cash flow from operating activities 21.3 19.9 +7.2%
Cash flow from investing activities -1.8 -2.6 -30.4%
t/o CapEX -1.9 -1.1 +70.7%
t/o Cash paid for business combinations 0.0 -1.4
Cash flow from financing activities -4.8 -4.8 +0,7%
t/o Repayment of borrowings -4.6 -3.0
FX-effects -1.5 4.0
Cash and cash equivalents at the end of the period 97.2 73.5 +32.3%
Free cash flow(1) 19.5 17.3 +12.8%
(1) Operating cash flow - Investing cash flow
APRIL 2016 FINANCIAL RESULTS Q1 2016

ContactNEMETSCHEK SEInvestor RelationKonrad-Zuse-Platz 181829 [email protected]
DisclaimerThis presentation contains forward-looking statements based on the beliefs of NEMETSCHEK SEmanagement. Such statements reflect current views of NEMETSCHEK SE with respect to futureevents and results and are subject to risks and uncertainties. Actual results may vary materially fromthose projected here, due to factors including changes in general economic and business conditions,changes in currency exchange, the introduction of competing products, lack of market acceptance ofnew products, services or technologies and changes in business strategy. Nemetschek SE does notintend or assume any obligation to update these forward-looking statements.
Eco
Hou
se 3
.0 ,
Cas
téllo
n, S
pain
NO
EM |
Imag
e: M
eritx
ell A
rjala
guer
| re
aliz
ed w
ith G
RAP
HIS
OFT