Neli Esipova and Anita Pugliese Gallup World Poll April 4, 2013 MANY FACES OF GLOBAL MIGRATION.
38
-
Upload
lenard-pearson -
Category
Documents
-
view
223 -
download
3
Transcript of Neli Esipova and Anita Pugliese Gallup World Poll April 4, 2013 MANY FACES OF GLOBAL MIGRATION.

Neli Esipova and Anita Pugliese
Gallup World Poll
April 4, 2013
MANY FACES OF GLOBAL MIGRATION

3
COPYRIGHT STANDARDS
This document contains proprietary research, copyrighted materials, and literary property of Gallup, Inc. It is for the guidance of your company only and is not to be copied, quoted, published, or divulged to others outside of your organization. Gallup®, and Gallup Poll® are trademarks of Gallup, Inc. All other trademarks are the property of their respective owners.
This document is of great value to both your organization and Gallup, Inc. Accordingly, international and domestic laws and penalties guaranteeing patent, copyright, trademark, and trade secret protection protect the ideas, concepts, and recommendations related within this document.
No changes may be made to this document without the express written permission of Gallup, Inc.
Copyright © 2012 Gallup, Inc. All rights reserved.
4
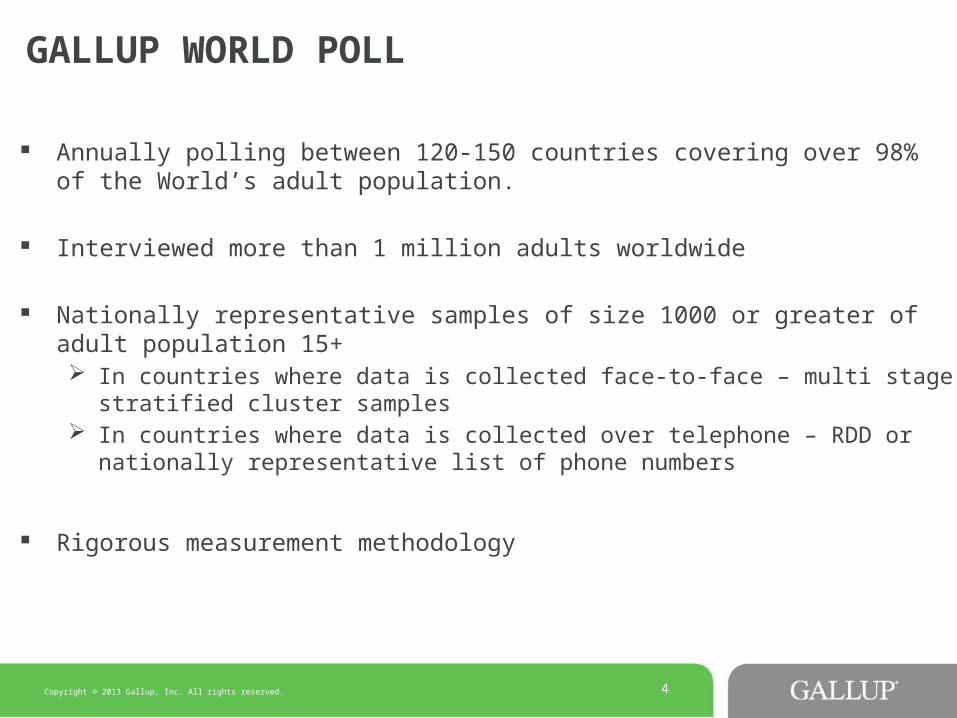
GALLUP WORLD POLL
Annually polling between 120-150 countries covering over 98% of the World’s adult population.
Interviewed more than 1 million adults worldwide
Nationally representative samples of size 1000 or greater of adult population 15+ In countries where data is collected face-to-face – multi stage stratified
cluster samples In countries where data is collected over telephone – RDD or nationally
representative list of phone numbers
Rigorous measurement methodology
Copyright © 2013 Gallup, Inc. All rights reserved.
5
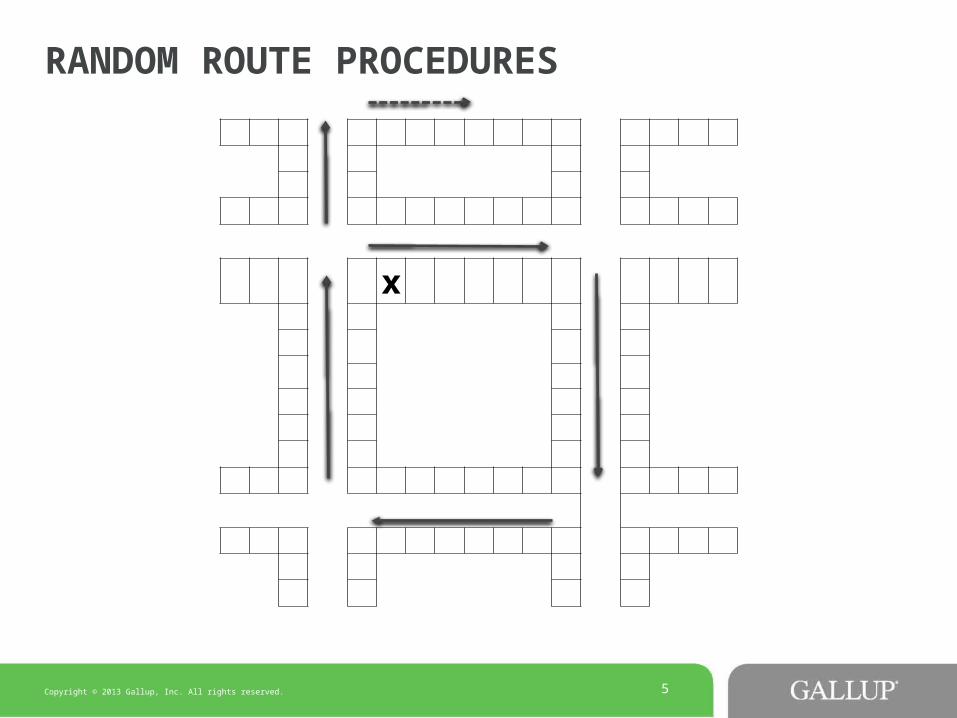
RANDOM ROUTE PROCEDURES
x
Copyright © 2013 Gallup, Inc. All rights reserved.
6
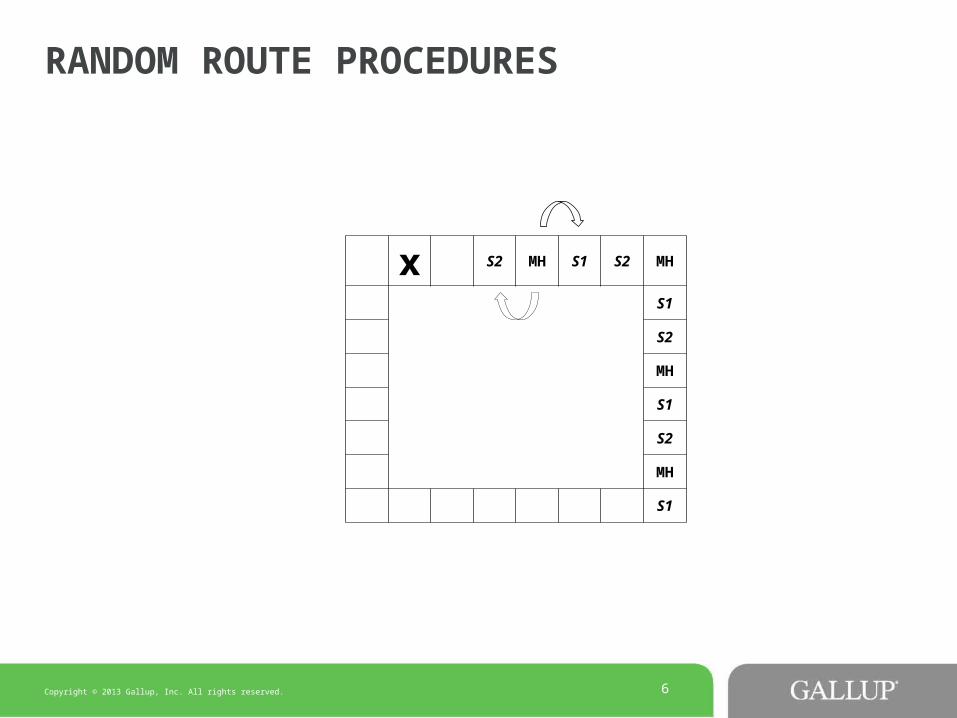
RANDOM ROUTE PROCEDURES
x
S2 MH S1 S2 MH
S1
S2
MH
S1
S2
MH
S1
Copyright © 2013 Gallup, Inc. All rights reserved.

7
Wellbeing
Law and Order
Governance
Economics
Jobs/employment
Entrepreneurship
Community Attachment
Migration and remittances
Food and Shelter
Infrastructure
Health
Social Networks
Civic Engagement
Country Stability
Environment
CORE TOPICS
Copyright © 2013 Gallup, Inc. All rights reserved.

8
HOUSEHOLD INCOME
Percent of population holding cumulative HH income
5th quintile (highest)
3.5%
4th quintile 8%
3rd quintile 14%
2nd quintile 22%
1st quintile (lowest)
53%• Avg across 132 countries, data collected in 2008-2012 to date
• HH income in real 2010 International Dollars (World Bank ppp), survey interviews ranked by HH income per capita within country
• On average, 53% of a country’s population account for the lowest 20% of income.
Copyright © 2013 Gallup, Inc. All rights reserved.

9
EMPLOYMENT
Labor Force Participation Rate 61%
Employed full time for Employer (among workforce)42%
Unemployed (among workforce) 8%
Underemployed (among workforce)18%
Copyright © 2013 Gallup, Inc. All rights reserved.
10
GALLUP STUDIES APPROACH THE MIGRATION TOPIC FROM MULTIPLE PERSPECTIVES
Residents’ desire/plan/preparation to go abroad for temporary work and study, or to move away permanently
Wellbeing of first generation migrants Personal gains and losses of migration Diaspora Labor migration flow (registered and unregistered) Social networks abroad Attitudes toward migrants in destination countries Remittances Internal migration Second generation migrants
Copyright © 2013 Gallup, Inc. All rights reserved.
11
FUTURE OF MIGRATION
Copyright © 2013 Gallup, Inc. All rights reserved.
Desire Ideally, if you had the opportunity, would you like to
move permanently to another country, or would you prefer to continue living in this country?
1. Like to move to another country2. Like to continue living in this country3. (Don’t Know)4. (Refused)
The analysis of adults’ desire to move to another country permanently is based on 501,366 interviews aggregated across multiple surveys (2010 – 2012) in 154 countries.

12
APPROXIMATELY 630 MILLION ADULTS WORLDWIDE (13% OF ADULT POPULATION) WOULD LIKE TO MOVE ABROAD PERMANENTLY*
U.S. tops desired destination countries *Projected numbers based on percentages expressing a desire to move to a
specific country.
Copyright © 2009-2010 Gallup, Inc. All rights reserved.Copyright © 2013 Gallup, Inc. All rights reserved.
13
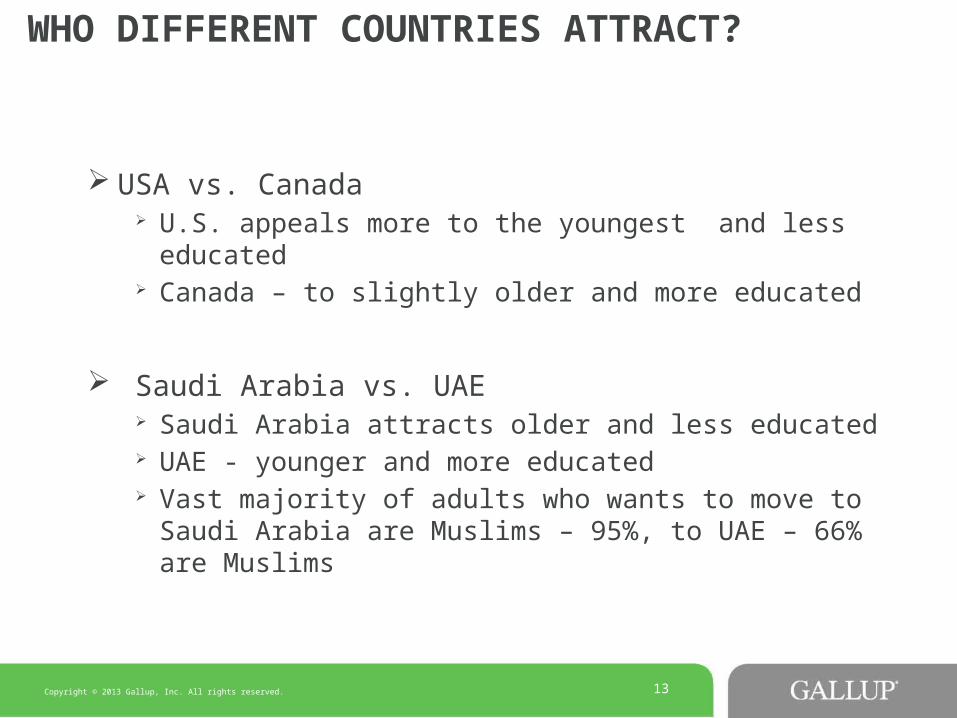
WHO DIFFERENT COUNTRIES ATTRACT?
USA vs. Canada U.S. appeals more to the youngest and less educated Canada – to slightly older and more educated
Saudi Arabia vs. UAE Saudi Arabia attracts older and less educated UAE - younger and more educated Vast majority of adults who wants to move to Saudi
Arabia are Muslims – 95%, to UAE – 66% are Muslims
Copyright © 2013 Gallup, Inc. All rights reserved.
14
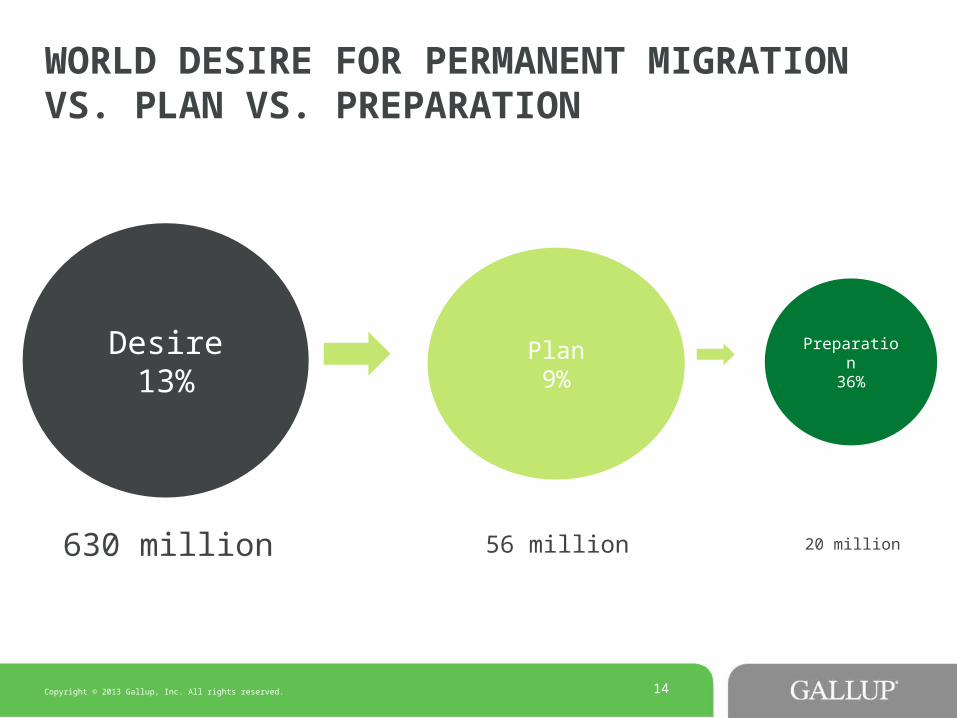
WORLD DESIRE FOR PERMANENT MIGRATION VS. PLAN VS. PREPARATION
Desire13%
Plan9%
Preparation36%
630 million 56 million 20 million
Copyright © 2013 Gallup, Inc. All rights reserved.

DK/RF
Other reason
Because of environmental problems in your country
To live in a country with less crime
To live in a country where human rights are protected
To be closer to family
Because of social benefits (retirement, medical benefits, etc)
To get a good job/cannot find a job
For your children's future
Improve standard of living
-10% 0% 10% 20% 30% 40% 50% 60%
12%
2%
1%
1%
3%
3%
4%
10%
13%
52%
15
CIS COUNTRIES: MAIN REASON FOR DESIRE TO MOVE TO ANOTHER COUNTRY PERMANENTLY
Copyright © 2013 Gallup, Inc. All rights reserved.

16
WELLBEING OF MIGRANTS
Copyright © 2013 Gallup, Inc. All rights reserved.
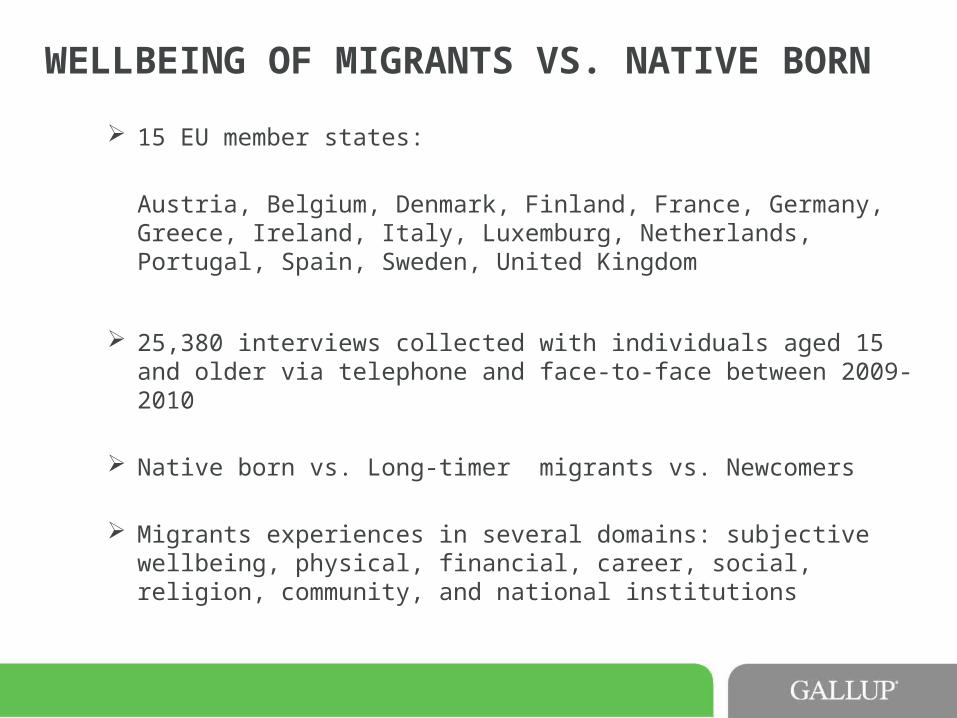
WELLBEING OF MIGRANTS VS. NATIVE BORN
15 EU member states:
Austria, Belgium, Denmark, Finland, France, Germany, Greece, Ireland, Italy, Luxemburg, Netherlands, Portugal, Spain, Sweden, United Kingdom
25,380 interviews collected with individuals aged 15 and older via telephone and face-to-face between 2009-2010
Native born vs. Long-timer migrants vs. Newcomers
Migrants experiences in several domains: subjective wellbeing, physical, financial, career, social, religion, community, and national institutions
18
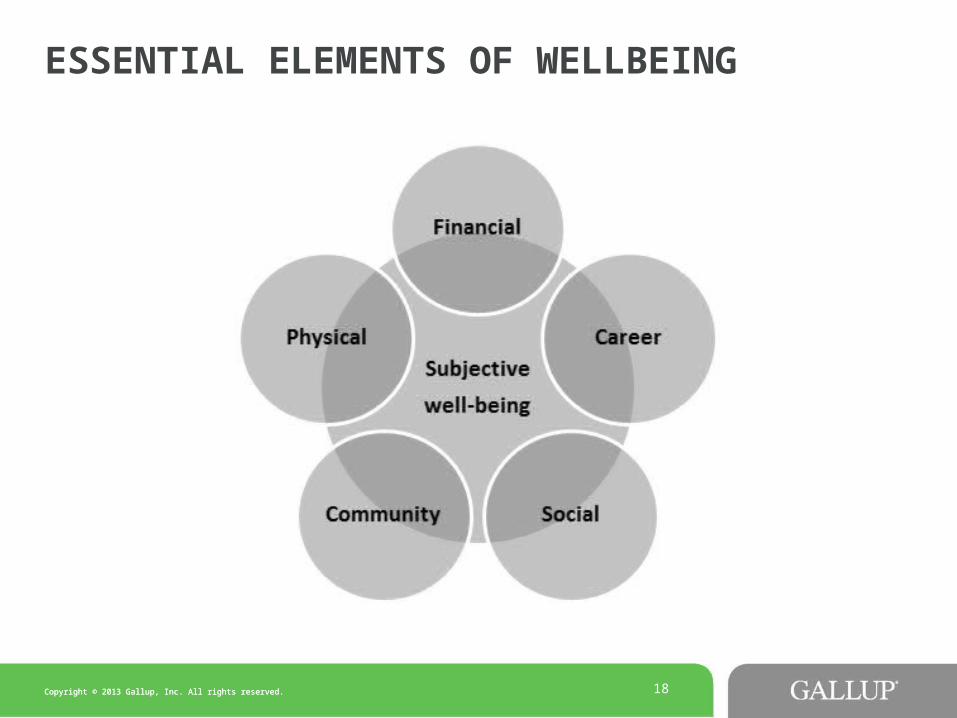
ESSENTIAL ELEMENTS OF WELLBEING
Copyright © 2013 Gallup, Inc. All rights reserved.Copyright © 2013 Gallup, Inc. All rights reserved.

SUBJECTIVE WELLBEING: EU MIGRANTS’ SUBJECTIVE WELLBEING LOWER THAN NATIVE BORN
Native Born Longtimers Newcomers5.0
5.5
6.0
6.5
7.0
7.5
8.0
6.6
6.05.9
7.0
6.76.8
Life Today Life in 5 Years
The Cantril Self-Anchoring Striving Scale
Copyright © 2013 Gallup, Inc. All rights reserved.

CAREER: WHILE JOB SATISFACTION IS HIGH FOR ALL GROUPS, EU MIGRANTS ARE FAR LESS LIKELY TO SAY THEIR JOB IS IDEAL
Satisfaction with the job Ideal Job0%
20%
40%
60%
80%
100%88%
72%
84%
57%
85%
51%
Native Born Longtimers Newcomers
Copyright © 2013 Gallup, Inc. All rights reserved.
23
Gains and Losses of Migration to EU Countries
The purpose of this analysis was to try and predict how different the life experiences would have been for the migrants had they stayed back in their home countries.
Copyright © 2013 Gallup, Inc. All rights reserved.

GAINS AND LOSSES OF MIGRATION TO EU: LIFE TODAY
HDI 1 HDI 2 HDI 3/45.0
5.5
6.0
6.5
7.0
6.5
5.9 5.9
6.4
5.7
5.2
EU Motherland
The Cantril Self-Anchoring Striving Scale
Copyright © 2013 Gallup, Inc. All rights reserved.
25
INTERNAL MIGRATION
Copyright © 2013 Gallup, Inc. All rights reserved.
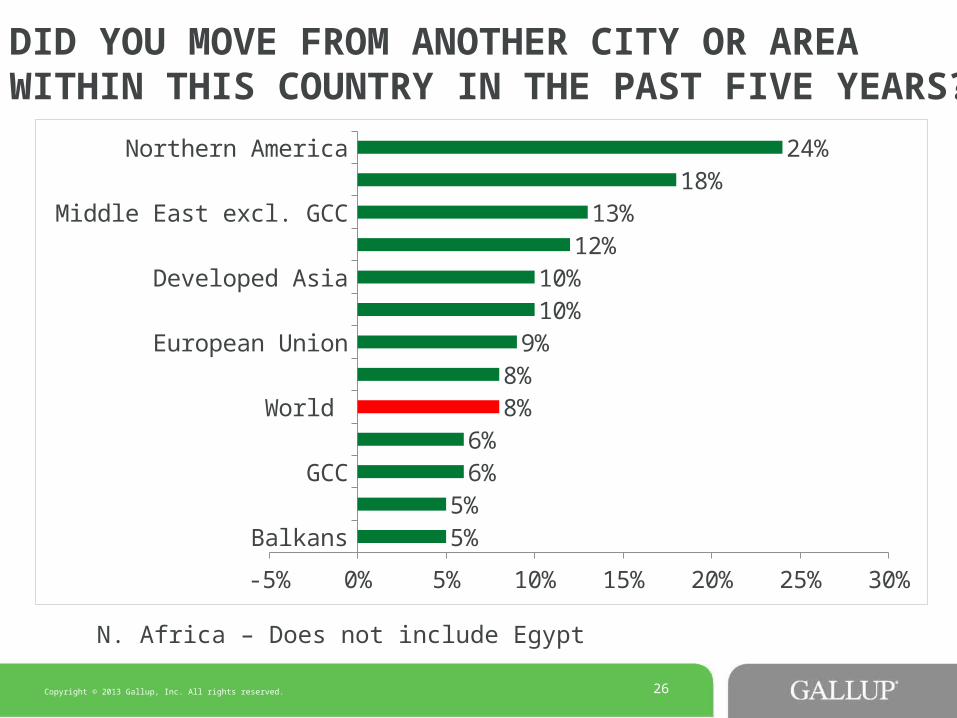
BalkansDeveloping Asia
GCCCIS
World North Africa
European UnionLatin America
Developed AsiaSub-Saharan Africa
Middle East excl. GCCAustralia/New Zealand
Northern America
-5% 0% 5% 10% 15% 20% 25% 30%
5%5%
6%6%
8%8%
9%10%10%
12%13%
18%24%
26
DID YOU MOVE FROM ANOTHER CITY OR AREA WITHIN THIS COUNTRY IN THE PAST FIVE YEARS?
N. Africa – Does not include Egypt
Copyright © 2013 Gallup, Inc. All rights reserved.

Across regions the following groups are more likely to move within the country: Younger people Educated people Those who receive financial help within the country First generation migrants (19% vs. 8%)
Internal migrants: More likely to move again in the next 12 months More likely to desire to permanently move abroad More likely to have though about starting a business and
to be planning to start a business
27
INTERNAL MIGRATION
Copyright © 2013 Gallup, Inc. All rights reserved.

28
ESTIMATION OF LABOR MIGRATION IN CIS COUNTRIES
Copyright © 2013 Gallup, Inc. All rights reserved.

TAJIKISTAN: NUMBER OF TEMPORARY WORKERS ABROAD 2008-2012
634,000553,000
640,000732,000 773,000
0
200,000
400,000
600,000
800,000
1,000,000
2008 2009 2010 2011 2012
29
Thousands
14% 13% 15% 17% 18% percent of adult population
Copyright © 2013 Gallup, Inc. All rights reserved.
30
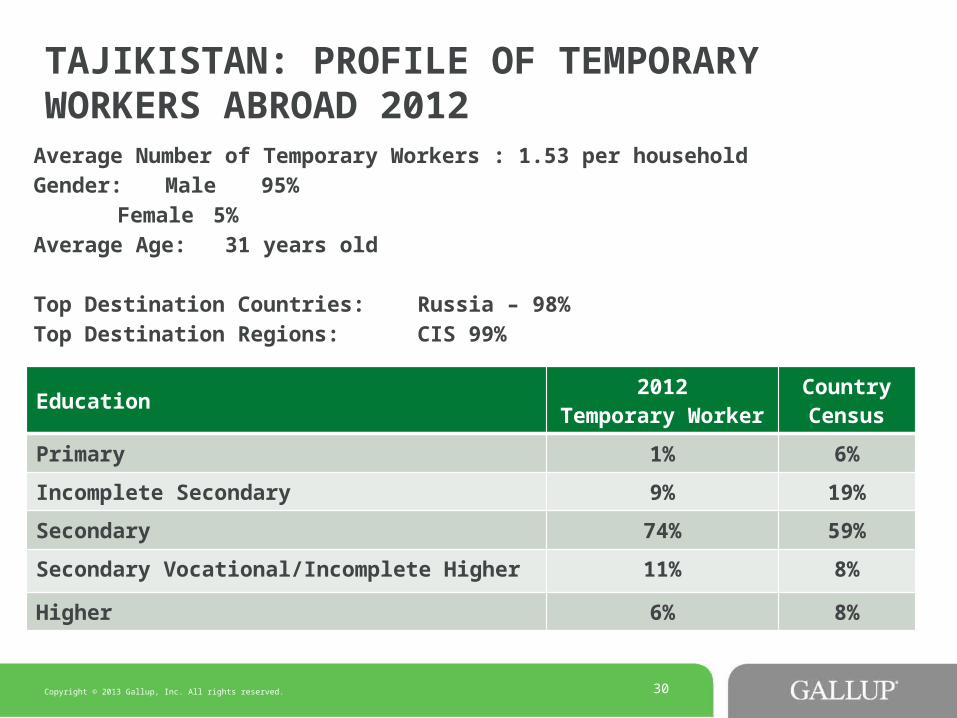
TAJIKISTAN: PROFILE OF TEMPORARY WORKERS ABROAD 2012
Average Number of Temporary Workers : 1.53 per household Gender: Male 95%
Female 5%Average Age: 31 years old
Top Destination Countries: Russia – 98%Top Destination Regions: CIS 99%
Education2012
Temporary Worker
Country Census
Primary 1% 6%
Incomplete Secondary 9% 19%
Secondary 74% 59%
Secondary Vocational/Incomplete Higher 11% 8%
Higher 6% 8%
Copyright © 2013 Gallup, Inc. All rights reserved.

31
Reality DesireCountry Census
AGE 31 29
GENDER
Male 95% 74% 50%
Female 5% 26% 50%
EDUCATION
Primary/Incomplete Primary/No Education
1% 3% 6%
Incomplete Secondary 9% 20% 19%
Secondary 74% 56% 59%
Secondary Vocational/Incomplete Higher
11% 13% 8%
Higher 6% 8% 8%
TAJIKISTAN: PROFILE OF TEMPORARY WORKERS ABROAD AND THOSE WHO DESIRE TO MOVE 2012
Copyright © 2013 Gallup, Inc. All rights reserved.

32
TAJIKISTAN: GAP BETWEEN WHERE PEOPLE WANT TO GO FOR TEMPORARY WORK AND WHERE THEY ACTUALLY GO – 2012
Reality Desire
Russia98%
USA1%
Other1%
Russia76%
USA9%
Other15%
Copyright © 2013 Gallup, Inc. All rights reserved.

33
REMITTANCES
Copyright © 2013 Gallup, Inc. All rights reserved.

34
PERCENTAGE RECEIVING INTERNATIONAL REMITTANCES
Copyright © 2013 Gallup, Inc. All rights reserved.
In the past 12 months, did this household receive help in the form of money or goods from another individual living inside this country, living in another country, both, or neither?
Copyright © 2013 Gallup, Inc. All rights reserved.
35
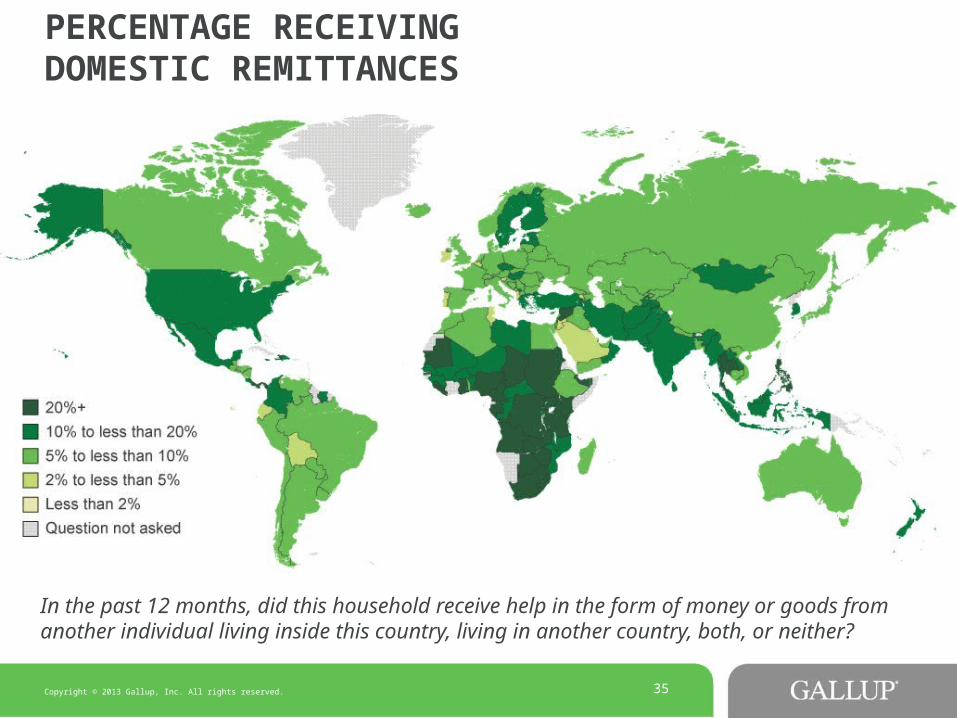
PERCENTAGE RECEIVING DOMESTIC REMITTANCES
Copyright © 2013 Gallup, Inc. All rights reserved.
In the past 12 months, did this household receive help in the form of money or goods from another individual living inside this country, living in another country, both, or neither?

COUNTRIES WHERE MORE THAN 20% RECEIVE INTERNATIONAL REMITTANCES
0%
10%
20%
30%
40%
50%
60%
32%35%
27%
20% 21%24% 24%
15%
20% 21%23% 22%
0.55
0.44
0.31
0.27
0.22 0.22
0.31
0.25 0.26
0.15 0.14
Rural/Small town (populations under 50,000) Urban (50,000 residents or more)
Copyright © 2013 Gallup, Inc. All rights reserved.
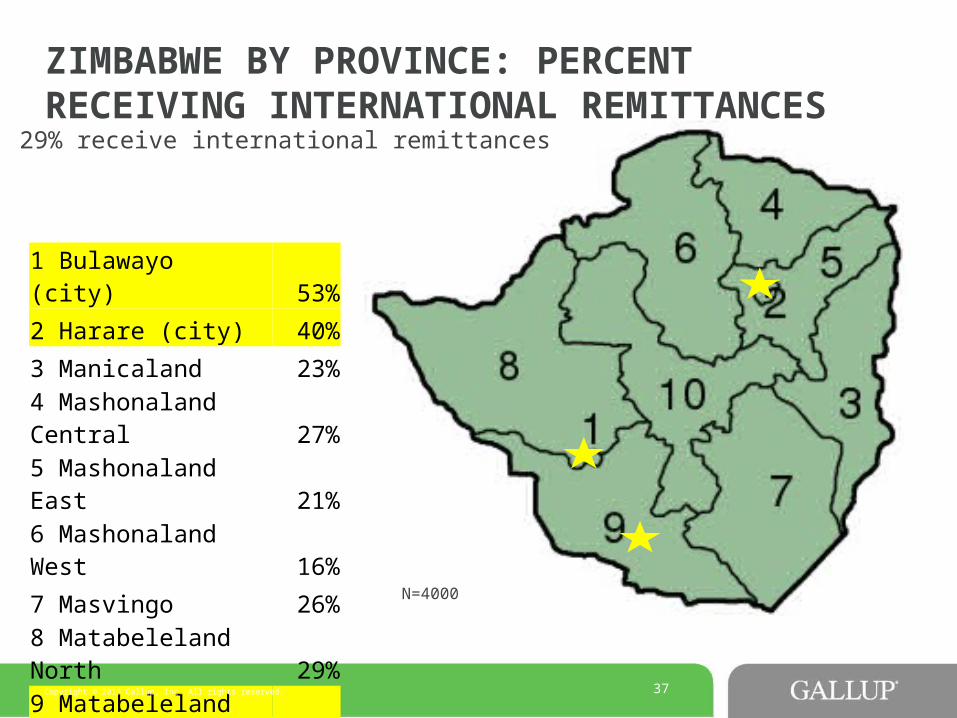
ZIMBABWE BY PROVINCE: PERCENT RECEIVING INTERNATIONAL REMITTANCES
37
1 Bulawayo (city) 53%
2 Harare (city) 40%
3 Manicaland 23%
4 Mashonaland Central 27%
5 Mashonaland East 21%
6 Mashonaland West 16%
7 Masvingo 26%
8 Matabeleland North 29%
9 Matabeleland South 39%
10 Midlands 25%
29% receive international remittances
N=4000
Copyright © 2013 Gallup, Inc. All rights reserved.

RECEIVING INTERNATIONAL REMITTANCES - CHANNELS
Money through a bankMoney through money transfer serviceMoney through friends, family, or other peopleBring money themselvesParcels or goodsSome other way
Copyright © 2013 Gallup, Inc. All rights reserved.
39
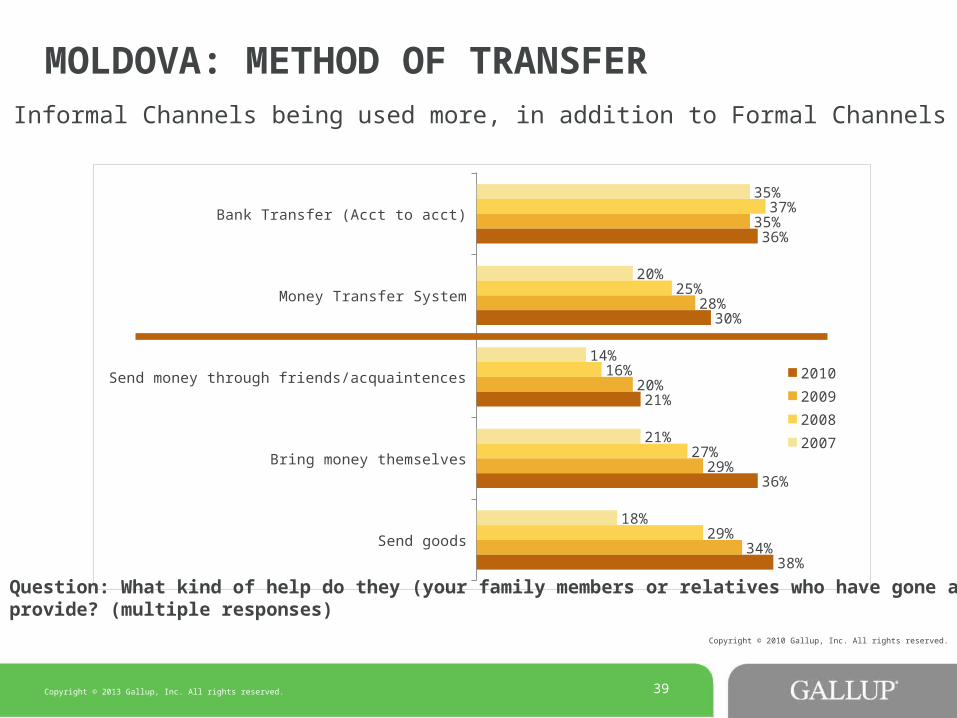
MOLDOVA: METHOD OF TRANSFER
Bank Transfer (Acct to acct)
Money Transfer System
Send money through friends/acquaintences
Bring money themselves
Send goods
35%
20%
14%
21%
18%
37%
25%
16%
27%
29%
35%
28%
20%
29%
34%
36%
30%
21%
36%
38%
2010
2009
2008
2007
Informal Channels being used more, in addition to Formal Channels
Copyright © 2010 Gallup, Inc. All rights reserved.
Question: What kind of help do they (your family members or relatives who have gone abroad) provide? (multiple responses)
Copyright © 2013 Gallup, Inc. All rights reserved.

SENDING INTERNATIONAL REMITTANCES – MIGRANTS AND NATIVE BORN
Migrants Native Born
20% 2%
In the past 12 months, did this household SEND help in the form of money or goods from another individual living
inside this country, living in another country, both, or neither?
Copyright © 2013 Gallup, Inc. All rights reserved.