NEIGHBOURHOOD AND FAMILY INFLUENCES ON THE … · neighbourhood and family influences on the...
36
NEIGHBOURHOOD AND FAMILY INFLUENCES ON THE COGNITIVE ABILITY OF CHILDREN IN THE BRITISH NATIONAL CHILD DEVELOPMENT STUDY 1 Andrew McCulloch 1 ([email protected]), Heather, E. Joshi 2 ([email protected]). 1 Institute for Social and Economic Research, University of Essex, Wivenhoe Park, Colchester, CO4 3SQ. 2 Centre for Longitudinal Studies, Institute of Education, London, WC1H 0AL. 1 Funded under ESRC Programme Children 5-16: Growing into the 21st Century, Grant L129251027. Telephone: 01206-873901. Fax: 01206-873151.
Transcript of NEIGHBOURHOOD AND FAMILY INFLUENCES ON THE … · neighbourhood and family influences on the...
NEIGHBOURHOOD AND FAMILY INFLUENCES ON THE COGNITIVEABILITY OF CHILDREN IN THE BRITISH NATIONAL CHILD
DEVELOPMENT STUDY1
Andrew McCulloch1 ([email protected]), Heather, E. Joshi2
([email protected]).1Institute for Social and Economic Research,
University of Essex, Wivenhoe Park, Colchester, CO4 3SQ.2Centre for Longitudinal Studies, Institute of Education, London, WC1H 0AL.
1 Funded under ESRC Programme Children 5-16: Growing into the 21st Century, Grant L129251027.Telephone: 01206-873901.Fax: 01206-873151.

ABSTRACT
This paper investigates the association between family poverty, the level of
deprivation in electoral wards and children’s cognitive test scores using data
from the second generation in the 1991 sweep of the British National Child
Development Study (1958 birth cohort). Family poverty has a significant
association with lower test scores in children of all ages (4-18 years).
Neighbourhood poverty has a significant association with lower test scores in
children aged 4-5 years which, though somewhat attenuated, is independent
of other socioeconomic indicators. Among children aged between 6 and 9
years, the association with neighbourhood deprivation is statistically
accounted for by individual characteristics. Among children aged between 10
and 18 years, levels of neighbourhood deprivation were for the most part
statistically insignificant. The family poverty – test score association among
children aged between 10 and 18 years was mediated by the home
environment. Mediated effects were stronger for family poverty – test score
associations than for neighbourhood poverty. Explanations for the links
between family poverty and test scores range from the effects of long-term
material disadvantage in poor families to problematic parenting behaviours
resulting from the multiple stresses of living in poverty. Explanations for the
influence of neighbourhoods on young children range from the resources and
services available in less deprived neighbourhoods to the kinds of role
models that more affluent neighbourhoods might provide. The size of the
estimated effects of neighbourhood conditions are much smaller than the
estimated effects of family level conditions. Thus, it appears that families still
should be viewed as the key agents in promoting positive development in
children.

NON-TECHNICAL SUMMARY
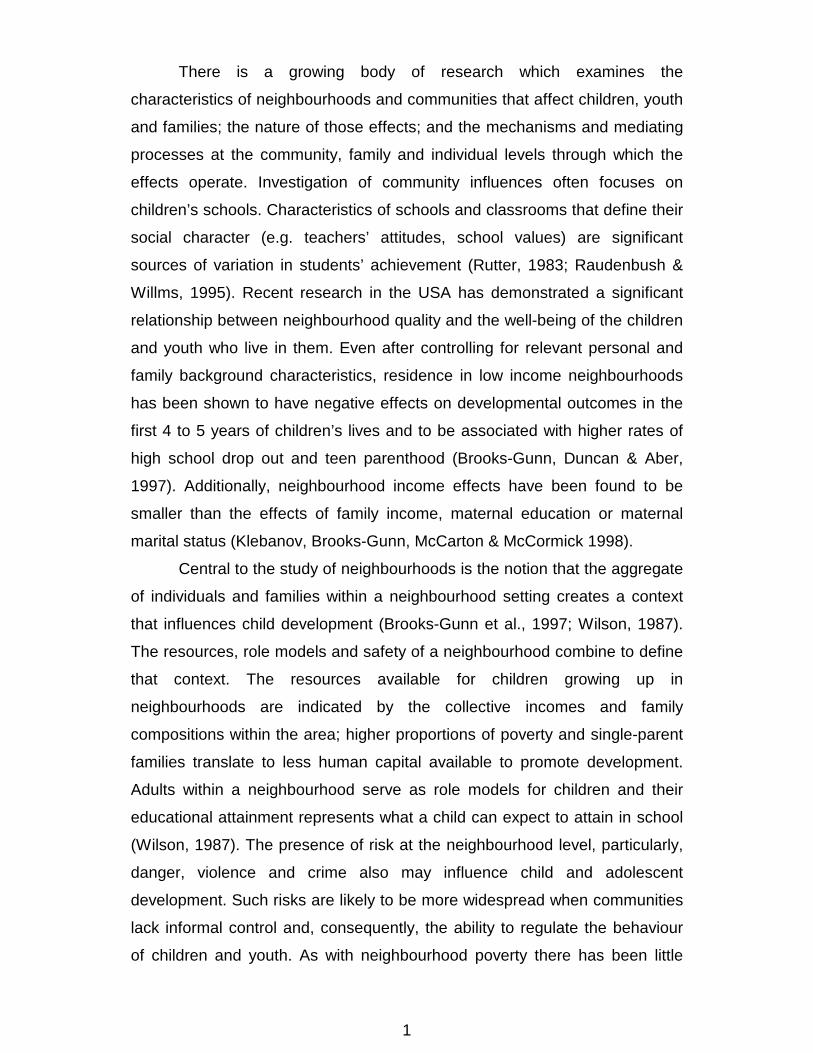
There is a growing body of research which examines the
characteristics of neighbourhoods and communities that affect children, youth
and families; the nature of those effects; and the mechanisms and mediating
processes at the community, family and individual levels through which the
effects operate. Recent research in the USA has demonstrated a significant
relationship between neighbourhood quality and the well-being of the children
and youth who live in them. Even after controlling for relevant personal and
family background characteristics, residence in low income neighbourhoods
has been shown to have negative effects on developmental outcomes in the
first 4 to 5 years of children’s lives and to be associated with higher rates of
high school drop out and teen parenthood (Brooks-Gunn, Duncan & Aber,
1997). Additionally, neighbourhood income effects have been found to be
smaller than the effects of family income, maternal education or maternal
marital status (Klebanov, Brooks-Gunn, McCarton & McCormick 1998).
In this paper we use data from the second generation in the 1991
sweep of the British National Child Development Study (NCDS) to examine
whether local concentrations of deprived households, along with the
associated economic and social neighbourhood disadvantage, have an affect
on children’s scores on a cognitive test. We examine whether neighbourhood
poverty is mediated by family structures and processes, or whether it exerts a
separate and powerful influence on children’s lives, over and above individual
family influences.
Family poverty has a significant association with lower test scores in
children of all ages (4-18 years). Neighbourhood poverty has a significant
association with lower test scores in children aged 4-5 years which, though
somewhat attenuated, is independent of other socioeconomic indicators.
Among children aged between 6 and 9 years, the association with
neighbourhood deprivation is statistically accounted for by individual
characteristics. Among children aged between 10 and 18 years, levels of
neighbourhood deprivation were for the most part statistically insignificant.
The family poverty – test score association among children aged between 10

and 18 years was mediated by the home environment. Mediated effects were
stronger for family poverty – test score associations than for neighbourhood
poverty. Explanations for the links between family poverty and test scores
range from the effects of long-term material disadvantage in poor families to
problematic parenting behaviours resulting from the multiple stresses of living
in poverty. Explanations for the influence of neighbourhoods on young
children range from the resources and services available in less deprived
neighbourhoods to the kinds of role models that more affluent
neighbourhoods might provide. The size of the estimated effects of
neighbourhood conditions are much smaller than the estimated effects of
family level conditions. Thus, it appears that families still should be viewed as
the key agents in promoting positive development in children.
1
There is a growing body of research which examines the
characteristics of neighbourhoods and communities that affect children, youth
and families; the nature of those effects; and the mechanisms and mediating
processes at the community, family and individual levels through which the
effects operate. Investigation of community influences often focuses on
children’s schools. Characteristics of schools and classrooms that define their
social character (e.g. teachers’ attitudes, school values) are significant
sources of variation in students’ achievement (Rutter, 1983; Raudenbush &
Willms, 1995). Recent research in the USA has demonstrated a significant
relationship between neighbourhood quality and the well-being of the children
and youth who live in them. Even after controlling for relevant personal and
family background characteristics, residence in low income neighbourhoods
has been shown to have negative effects on developmental outcomes in the
first 4 to 5 years of children’s lives and to be associated with higher rates of
high school drop out and teen parenthood (Brooks-Gunn, Duncan & Aber,
1997). Additionally, neighbourhood income effects have been found to be
smaller than the effects of family income, maternal education or maternal
marital status (Klebanov, Brooks-Gunn, McCarton & McCormick 1998).
Central to the study of neighbourhoods is the notion that the aggregate
of individuals and families within a neighbourhood setting creates a context
that influences child development (Brooks-Gunn et al., 1997; Wilson, 1987).
The resources, role models and safety of a neighbourhood combine to define
that context. The resources available for children growing up in
neighbourhoods are indicated by the collective incomes and family
compositions within the area; higher proportions of poverty and single-parent
families translate to less human capital available to promote development.
Adults within a neighbourhood serve as role models for children and their
educational attainment represents what a child can expect to attain in school
(Wilson, 1987). The presence of risk at the neighbourhood level, particularly,
danger, violence and crime also may influence child and adolescent
development. Such risks are likely to be more widespread when communities
lack informal control and, consequently, the ability to regulate the behaviour
of children and youth. As with neighbourhood poverty there has been little

2
investigation of whether effects of risk at the neighbourhood level change as
children move through childhood and then adolescence.
In Britain there has been a widening of the gap between rich and poor
since the 1970’s (Hills, 1996). In particular, there has been an increasing
polarization of income and wealth at the local level, producing both a greater
spatial segregation between better-off and poorer areas (Green, 1996), and a
growth in concentrated poverty amongst communities within urban areas
(Noble & Smith, 1996). In this paper we use data from the British National
Child Development Study (NCDS) to examine whether local concentrations of
deprived households, along with the associated economic and social
neighbourhood disadvantage, places children at risk. We examine whether
neighbourhood poverty is mediated by family structures and processes, or
whether it exerts a separate and powerful influence on children’s lives, over
and above individual family influences.
Of importance is the fact that neighbourhoods may operate differently
across developmental epochs (Aber, Gephart, Brooks-Gunn, Connell &
Spencer, 1997). In early childhood the specific processes that lead to positive
outcomes involve primarily transactions in the home that directly affect
children. Even when young children encounter contexts outside the home,
such as through a trip to the neighbourhood playground, parents limit and
qualify the nature and extent of a child’s experience. As children spend less
time at home and more time at school and with peers, the quality of
interactions with teachers and fellow students becomes a major contributor to
the course of development during middle childhood. The epoch from about
ten to sixteen years of age encompasses the transition from childhood to
adolescence. In addition to parents, peers and school, early adolescents
become directly involved in a host of contexts, from formal youth
organisations to informal neighbourhood groups. We hypothesize that the
effects of neighbourhoods on development during early childhood will be
primarily indirect, through the effects of neighbourhoods on the quality of the
home environment. Further we hypothesise that by middle childhood and
early adolescence, (1) children will come into increasingly direct contact with
neighbourhoods, so that neighbourhood effects should increase in
3
magnitude, and (2) new processes will mediate the effects of neighbourhoods
on development, in particular, children’s perceptions of their home, peer, and
school environments, as well as their self-perceptions (Klebanov, Brooks-
Gunn, Chase-Landsdale & Gordon, 1997). Accordingly, we examine different
developmental epochs: early childhood (4-5 years), middle childhood (6-9
years), and late childhood and adolescence (10 to 18 years). Each age group
encompasses at least one major transition in a child’s life, such as school
entrance or exit, biological development and possible role shifts. The
developmental challenges during these periods are relatively universal and
require new modes of adaptation to biological, psychological or social
changes (Graber & Brooks-Gunn, 1996). The following section will review the
empirical evidence on how neighbourhood factors affect the development of
children. Studies reviewed will be limited to those examining individual-level
outcomes, rather than outcomes aggregated at the neighbourhood level.
NEIGHBOURHOODS AND CHILDREN
Increasingly research is finding that community and neighbourhood
factors play a role in decisions to marry, have children (in or out of marriage)
(South & Crowder, 1999), family stability as well as children's psychological
well-being and educational achievement (Brooks-Gunn, Duncan, Klebanov &
Sealand, 1993; Brooks-Gunn et al., 1997; Leventhal & Brooks-Gunn. 2000).
A growing body of empirical research in the USA has directed attention to the
impact of the geographic concentration of socioeconomic disadvantage on
outcomes for children and families. Most research on neighbourhood poverty
has focused on adolescents or young adults. Adolescents who grow up in
affluent neighbourhoods or neighbourhoods with a higher percentage of
affluent families complete more years of school and have lower school
dropout rates than adolescents from similar families who grow up in poor
neighbourhoods or neighbourhoods with proportionately fewer affluent
families (Brooks-Gunn et al., 1993, 1997). The presence of affluent
neighbours was associated with higher intelligence test scores at 5 years of
age, in regressions also controlling for family income, family structure,

4
maternal education, age and ethnicity (Brooks-Gunn et al. 1997). Similar
findings have been reported for verbal ability of 5 and 6 year olds using data
from the National Longitudinal Study of Youth (Chase-Lansdale, Gordon,
Brooks-Gunn & Klebanov, 1997). In another study, Klebanov, Brooks-Gunn &
Duncan (1994) examined the effects of neighbourhood and family poverty on
maternal psychological and behavioural characteristics and on the quality of
the home environment. They found that residing in a poor neighbourhood was
associated with a worse physical environment in the home and with less
maternal warmth toward the children. Together, these studies suggest that
adolescents and children who reside in poorer neighbourhoods are more
likely to experience worse outcomes than adolescents and children who
reside in more affluent neighbourhoods. These results provide further
evidence that the effects of neighbourhoods on preschool children are likely
to be mediated in part by parental behaviour. A number of recent observers
have pointed to socioeconomic status as a feature of the community that may
influence adolescents behaviours through its relationship to both the
opportunities for attainment that teenagers perceive as open to them, and to
the normative patterns of behaviour that they observe in the adults around
them.
The quality of life in neighbourhoods and the safety of the physical
environment are critical to healthy child development. Within the community,
children can interact with their peers and with adults who can help them
develop trust, autonomy and initiative. Factors such as the distance between
houses, access to public facilities such as parks, the density of the child
population, and safety all influence measures of children’s social activity such
as the number of friends, the formality and rigidity of children’s friendship
patterns, and the spontaneity of their play patterns (Parke & Bhavnagri,
1989). Thus, the kind of neighbourhoods in which children and families live
exerts a critical influence on children’s social participation. Communities
provide a context where shared values and expectations are developed, and
they are host to networks of formal and informal services in health, education,
social services, housing and recreation. Neighbourhoods that offer child
safety, social support and access to good facilities can contribute positively to
5
children's readiness to learn as they enter school and to their achievements in
school. The crime within a child’s neighbourhood serves as another
community characteristic influencing development. Research has found that
children who live in neighbourhoods that are unsafe or that lack services face
greater risks of developing problem behaviours such as hyperactivity,
aggression or withdrawal, regardless of the quality of their family life (Peeples
& Loeber, 1994).
Several theoretical perspectives suggest links between children’s well-
being and characteristics of the communities in which they grow up. A
number of recent observers have pointed to socioeconomic status as a
feature of the community that may influence adolescents behaviours through
its relationship to both the opportunities for attainment that teenagers
perceive as open to them, and to the normative patterns of behaviour that
they observe in the adults around them. Wilson (1991) argued that the
increasing concentrations of male joblessness, poverty and female-headed
households in American cities in the 1970’s and 1980’s may have led to
social isolation and a shift in neighbourhoods social and cultural norms.
Wilson argues that the presence of disadvantaged neighbours encourages
out-of-wedlock childbearing and other non-normative or undesirable
behaviours because high-poverty neighbourhoods lack “mainstream role
models that help keep alive the perception that education is meaningful, that
steady employment is a viable alternative to welfare and that family stability is
the norm, not the exception (1987, p. 56)”. According to this view, families
who live in deprived neighbourhoods may establish family routines that may
be less conducive to the development of skills associated with school and
work. Parents who feel that they lack personal control over their own lives
may lack daily planning or organisation skills that help success in school or
employment. In contrast, families living in more affluent neighbourhoods,
where more parents have access to jobs, may reinforce family practices
conducive to future success. Deprived neighbourhoods may also be
characterised by social disorganisation (Sampson & Groves, 1989). The
central idea in social disorganisation theory is that the impact of communities
is found primarily in the factors that facilitate or inhibit networks of social

6
support and value consensus. According to this view, the degree of social
organisation in a community, or the degree to which residents are able to
realise common goals and exercise social control, reflects the establishment
of social relationships in the community and the content and consensus of
values. Community-level structural factors that are thought to impede social
organisation include residential instability, family disruption and high ethnic
heterogeneity. These factors may lead to a weakening of adult friendship
networks and value consensus in the neighbourhood and increase the
likelihood of deviant behaviour.
The concept of social capital (Coleman, 1988) overlaps with social
disorganisation theory in the emphasis on the nature of social ties and
community values. Social capital, which is derived from the density and
quality of social ties, exists within families, as well as neighbourhoods and
communities. Neighbourhoods, communities, and schools often serve as
institutions that promote transfers of social capital, as they constitute social
structures which tie people together. Having strong neighbourhood or
community connections can provide an environment that reinforces school
commitment and helps children remain engaged in school. Exchanges and
support between parents, schools, and children are particular areas that can
provide increased resources necessary for improving children's well-being.
Sampson (1992) argued that the lack of social capital is one of the
distinguishing features of individuals in socially disorganised communities.
The lack or absence of social capital in a community is thus a further link
between the structure of communities and the development of children.
A key issue in research on neighbourhoods and communities is how to
conceptualise and measure the geographic and / or social units used to
define and circumscribe them (Macintyre, Maciver & Sooman, 1993;
Glennester, Lupton, Noden & Power, 1999). In the sense of knowing your
neighbours areas are very small. In the sense of the catchment area for local
shops, a primary school, the GP, areas may be much bigger. Some facilities
like health centres or secondary schools may cover much wider catchment
areas. Areas have different boundaries for different purposes, and these
boundaries overlap. Increasing travel-to-work distances and increasing
7
mobility more generally are a cause of major changes in perceptions of
neighbourhoods. Despite the elusiveness and geographical imprecision of the
neighbourhood concept, research indicates that neighbourhoods operate as
significant constraints on parents approaches and strategies of family
management and on children’s and adolescents’ economic and social paths.
While there are a number of studies that find clear community and
neighbourhood effects, there is a smaller literature which does not (Evans,
Oates & Schwab, 1992). On some topics the mechanisms linking community
and family variables are not well understood. Place of residence is likely to be
a proxy for physical features of the environment, features of the domestic and
working environment and for inequalities in the provision and / or use of
services (Macintyre et al., 1993). Contextual effects on children’s outcomes
may be location specific and difficult to identify using aggregate census
indicators (Duncan, Connell & Klebanov, 1997). Researchers have examined
a number of mechanisms by which communities and neighbourhoods may
affect families and children. They include community norms, economic
opportunities, reference groups, relative deprivation, and social support
networks. However, in many studies the mechanisms are not clearly
delineated.
Nevertheless in the USA (Blos, Huston, Granger, Duncan, Brock &
McLoyd, 1999; Ludwig, Duncan & Hirschfield, 1998), and since the election of
the Labour Government in May 1997 in the UK (Glass, 1999), there has been
a significant increase in area-based initiatives to deal with problems that
appear to have their roots in community organisation. While some programs
have achieved results, others have not. Whether the mixed results are due to
program design or to the fact that it is not the community but some other
factor at work is not clear. Differences in motivation, emotional health, self-
efficacy, literacy and so on could account for any observed neighbourhood
effects (Duncan et al. 1997). In summary, we have heavy investments both in
research and programs based on the idea that communities affect families
and children and at the same time questions about the validity of the link
between communities, children and families. Understanding the extent to
which geographically concentrated social and economic problems reinforce

8
one another in leading to further negative outcomes is clearly a key issue in
assessing whether or not specific area targeting is particularly effective.
DATA
The National Child Development Study (NCDS) is a study of over
17,000 people in Britain born between the 3rd and 9th of March in 1958.
Follow-up sweeps took place in 1965, 1969, 1974, 1981 and 1991. The 1991
NCDS follow-up obtained information not only from the cohort member, but
from the children of 1 in 3 cohort members and from the mother of these
children (Ferri, 1993). In this paper we use data from both children who had a
mother who was an NCDS cohort member and children who had a father who
was an NCDS cohort member. The data are more representative of children
with teenaged mothers, and hence less educated mothers than a full cross-
section of children. This relatively disadvantaged sample of women and
children also more closely resembles the population that is most often
targeted for public policy intervention, although comparison with the Office of
National Statistics Longitudinal Study suggests that the teenage children of
lone mothers are disproportionately involved in loss to follow-up. The sample
is restricted to children resident in England and Wales in 1991.
In this paper we use performance on the Peabody Picture Vocabulary
Test (PPVT) as an indicator of children’s cognitive functioning (Dunn &
Markwardt, 1970). The PPVT is an individually administered test of hearing
vocabulary which contains 175 test items arranged in order of increasing
difficulty. Each item has four simple, black and white illustrations arranged in
a multiple choice format. The subject’s task is to select the picture considered
to illustrate best the meaning of a stimulus word presented orally by the
examiner. The test is designed for persons between the ages of 2.5 and 40
years. It can be used as a scholastic aptitude test since vocabulary is a strong
predictor of school success and literacy. Testing requires only 10 to 20
minutes, because the subject must answer only about 35 to 45 items of
suitable difficulty. Items which are found to be far too easy or hard during an
initial probing session are not administered. The PPVT was standardised

9
nationally (in USA) on a sample of 4200 children and adolescents and 828
adults. Raw scores are usually converted to age-referenced norms. We have
however used raw scores in our analyses because of concern about the
suitability of the available norms for our ‘abnormal’ sample of older children.
The test score is calculated by dividing the highest correct score given by the
child by the total number of items in the test. The test scores range between a
minimum of 0.19 and a maximum of 0.98 and have a standard deviation of
0.12. We include age and age squared in the regressions to control for age,
and we always also include a dummy variable for child gender. Measures of
children’s behavioural adjustment were also examined but are not discussed
because the coefficients of the neighbourhood deprivation score were
insignificant.
We examine the association of a range of indicators of socioeconomic
position including indicators of material disadvantage with children’s cognitive
functioning. As an indicator of the family’s economic status we include the
current employment status of the mother interacted with the presence of a
father. In our analyses we are unable to use family income for the year of
interview as a measure of the family’s economic resources because of the
nonresponse of approximately one third of the cases. We therefore examine
the association of the behavioural dimensions and two independent indicators
of family poverty: living in social housing (i.e. rented from council or housing
association) and having no access to a car. The latter is commonly used
together with tenure as an indicator of deprivation (Townsend, Phillimore &
Beattie, 1989) and both these measures are certainly related strongly to
income (Davies, Joshi & Clarke, 1997)2.
The link between family poverty and children’s test scores appears to
be mediated partly by the quality of children’s home environments. The home
environment refers both to how parents organise the physical environment in
the home and to how parents interact with their children in the home; both the
physical environment (e.g., books and other learning material in the home)
2 We have not attempted to impute missing income on this occasion, though we have done so for
another analyses (Joshi, Cooksey, Wiggins, McCulloch, Verropoulou & Clarke, 1999; McCulloch &
Joshi, 1999). The latter suggested that car access and housing tenure were more systematically related
to child outcomes than current family income per person.

10
and the social environment of the child (e.g., joint activities involving parents
and children such as reading books together) are expected to influence the
development of the child. As a direct assessment of mediating influences
(Smith, Brooks-Gunn & Klebanov, 1997) we therefore also considered the
rating of the quality of the child’s home learning environment as assessed
using the cognitive stimulation subscale from the short form of the HOME
inventory (Sugland, Zaslow, Smith, Brooks-Gunn, Coates, Blumenthal et al.
1995). Each item on the HOME inventory is scored in a binary fashion; a
score of 1 indicates the presence of a developmentally supportive aspect of
the environment, and a score of 0 otherwise at the time of the assessment.
The emotional support subscale from the HOME inventory, which measures
the warmth of mother-child interactions, was not used because it has been
found not to meet adequate internal consistency levels (Klebanov et al. 1997).
Some factors that influence development indirectly, via parenting behaviour,
may also have an effect on development that parenting practices do not
mediate. For example, family poverty may influence the child’s experiences in
the home, but it may also influence the child’s experiences in other contexts
such as the neighbourhood and schools.
Factors other than material resources and home environment are likely
to contribute to individual differences in children’s achievement. The cohort
member parents general ability test score at age 11 was included as a
predictor of children’s cognitive scores. We expected to find a strong relation
between the cohort member’s test score and children’s achievement
reflecting cultural or biosocial inheritance. We also wanted to explore the
possibility that other contextual factors such as number of children, level of
income, and mother’s level of education would also be predictive of
achievement test scores when home environment and maternal intellectual
ability were controlled.
In this analysis the definition of neighbourhood is dictated by the
geographical units for which data are available. Wards are the constituency
for local government elections. Being based on political boundaries, it is
arbitrary, but nevertheless represents a useful framework for analysis. Their
average population is around 5500, but this varies considerably. They are on
11
average roughly the size that children are likely to think of and experience as
their neighbourhood (Matthews 1987), but the boundaries of local
communities do not necessarily coincide with those of wards. All else equal,
studies of contextual effects are best conducted using data collected from
participants living in very diverse contexts. In the case of neighbourhood
variation, this argues for samples drawn from many diverse neighbourhoods.
Because the NCDS is an unclustered sample, its design is close to optimal for
estimating effect sizes via regression coefficients. The design provides
however no information about variation within and between contexts.
An important measurement issue in research on community and
neighbourhood influences is whether to use measures of single
neighbourhood characteristics or construct composite indices of underlying
dimensions of neighbourhood organisation. In this paper we use the
Townsend indicator of deprivation to bring a geographical dimension to the
explanation of children’s test scores. The Townsend index is composed of
four components, each measured for the ward of residence at the 1991
census (Townsend et al., 1989). These components are (i) the proportion of
the labour force unemployed, (ii) the proportion of households with no car
access, (iii) the proportion of households with 1 person per room and over,
and (iv) the proportion of households not owning their own home. The
indicators for levels of unemployment and overcrowding were logged, and the
index was standardised into Z-scores. For the purpose of analysis the score
was categorised into quintile groups at a national level. Notwithstanding the
debate about the various merits and demerits of these scores (Lee, 1999),
they have the advantage of simplicity in allowing areas to be ranked against
each other for statistical comparisons.
This paper is the first to use the area statistics from the 1991 Census
in conjunction with the child test scores, and is among the relatively few data
sources combining individual with ecological variables. The data contains
2290 children who come from 1532 families. We have not been able to study
family effects because of the low numbers of children per family. The age of
the child is strongly related to the child’s family structure (Table 1). Children
aged 10 and over are more likely than children aged 4 to 5 years or 6 to 9

12
years to have been born outside partnerships or to have experienced a
change in the family situation (Clarke, Di Salvo, Joshi & Wright, 1997). Table
1 shows that children in older age groups are more likely than younger
children to have a cohort member parent with low educational qualifications,
to have low family incomes or to live in social housing (i.e. rented from council
or housing association). There are also differences in home environment
between children of different age. Children aged 10 to 18 years are more
likely than younger children to live in homes lacking cognitive stimulation.
Children aged 10 to 18 years are also more likely than younger children to live
in neighbourhoods having higher deprivation scores. These findings may be
due to the nature of the NCDS sample. Older children were more likely to be
born to younger mothers with fewer years of education and thus to be reared
in more disadvantaged circumstances. All indicators of individual material and
social deprivation increased in prevalence from the lowest to the highest ward
deprivation score quintile (Table 2). Different aspects of social and economic
deprivation tend to co-exist in a geographically concentrated way. Poor
families are more likely to live in neighbourhoods with other poor families.
Poor children may be disadvantaged in large part because of their
communities of residence, not just because of their family situations.
RESULTS
The results from estimating ordinary least squares regression models
for different predictors are presented in Tables 3 to 5. The analyses were
organised as follows. First, analyses were conducted in order to look at the
effect of neighbourhood deprivation in predicting child and adolescent
outcomes also controlling for child age and gender. Then, regressions with
family-level variables added were run, to see whether neighbourhood effects
were independent of these family-level variables. Finally an additional set of
analyses was run in order to look at whether any of the observed
neighbourhood or family effects operated through the home environment. The
comparison of results from this sequence of models allows us to see how far
PPVT scores are associated with neighbourhood deprivation. It also allows us

13
to see how far any association might be accounted for, or mediated by the
social and human capital available to the child, the material disadvantage
associated with the child’s family circumstances, and the mode of parenting
such resources may permit.
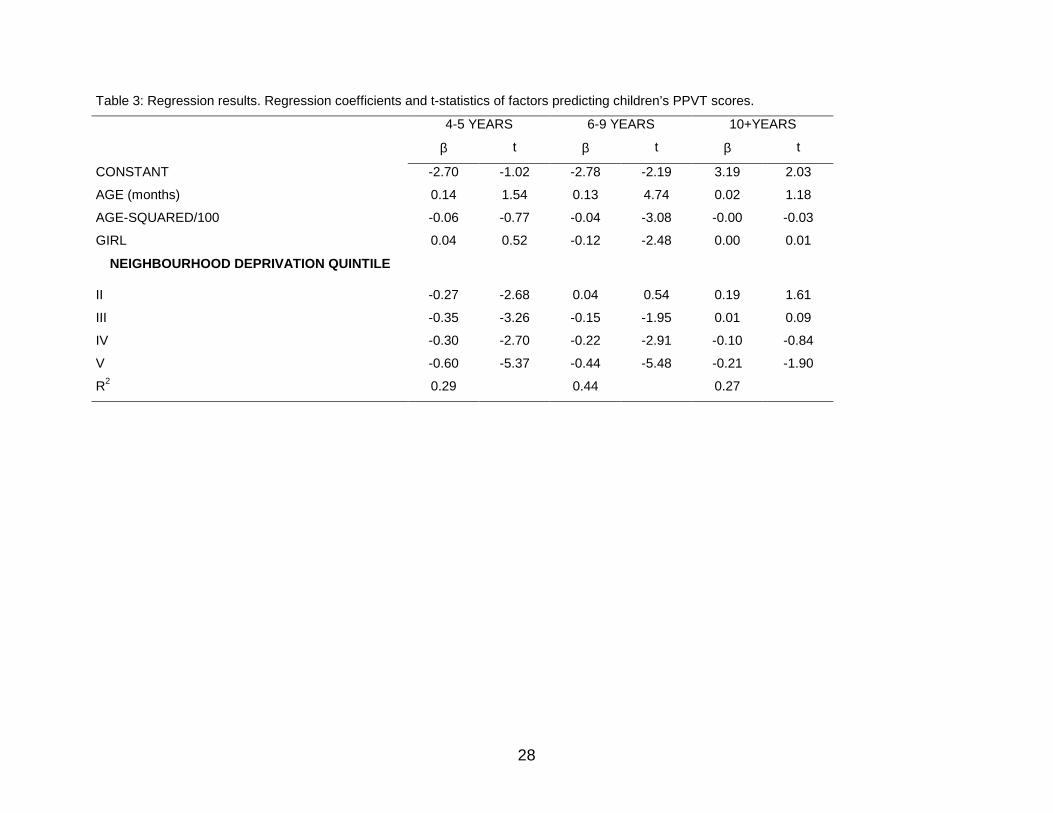
We find that the index of neighbourhood deprivation is associated with
lower cognitive test scores among children between the ages of 4 and 5 years
controlling for child age and gender (Table 3). Children with higher test scores
were more likely to be resident in an affluent neighbourhood than children
with lower test scores. The coefficients are of a modest order of magnitude:
children living in the topmost quintile of deprived neighbourhoods show a
decrease of 6 percentage points in their test scores compared to children
living in the bottom quintile of deprived neighbourhoods. This is not large in
comparison with the age-adjusted standard deviation of PPVT at 23
percentage points. For children between the ages of 6 and 9 years the
statistically significant impact of neighbourhood deprivation on test scores is
restricted to the three most deprived quintiles. 6 to 9 year old children in the
most deprived quintile of deprived neighbourhoods have test scores 3 to 4
percentage points lower than children in the least deprived quintile of
neighbourhoods. This extreme move in neighbourhood deprivation is
equivalent to a quarter of an age standardised standard deviation in PPVT. In
children aged 10 to 18 years the neighbourhood deprivation coefficients are
statistically insignificant. The total amount of variance accounted for by the
models ranges from 27% for children aged 10 to 18 years to 44% for children
aged 6 to 9 years.
In children aged 4 to 5 years the introduction of terms describing the
structure of the family, the mothers employment and family poverty confine
the statistically significant difference in neighbourhood deprivation to a
comparison between the most and least deprived quintile. In children aged 6
to 9 years the neighbourhood deprivation coefficients are statistically
insignificant. The 2nd most deprived quintile of the neighbourhood deprivation
score is positively related to test scores in children between 10 and 18 years.
The coefficients of the neighbourhood deprivation score are somewhat
attenuated for all age groups in comparison to the previous model.
14
The model terms for the structure and number of earners in the family
do not predict much systematic advantage to having two natural parents, nor
to having mother in employment. Children aged between 6 and 9 years in
step-families are at a disadvantage if the mother is employed, but children
aged between 6 and 9 years in lone mother families are at a disadvantage if
the mother does not work. The measures of more permanent living standards
and social status – educational qualifications, social housing, car access and
age of the cohort member at first birth – show that children of all ages from
deprived circumstances are at a disadvantage compared to children from
more affluent backgrounds. Both the cohort member’s general ability at age
11 and highest educational qualification were consistently related to children’s
achievement. The coefficients are sizeable. The correlation of the test scores
of cohort members and their children lies in the range between 0.2 and 0.3 ,
suggesting considerable immobility, or that children's chances for success
depend in a significant way on the success of their parents. The amount of
variance the models accounted for ranged from 39 to 53%.
The addition of the cognitive stimulation sub-scale from the HOME
inventory to the model (Table 5) results in little change in sign or statistical
significance in the coefficients of the neighbourhood deprivation score in
comparison to the previous model. In all age groups investigated, the quality
of the home environment - its opportunities for learning and the physical
condition of the home - is positively associated with test scores. Children
between the ages of 4 and 5 in the most deprived neighbourhoods do worse
for a given level of learning experience in the home than children in more
affluent neighbourhoods. The addition of the HOME cognitive stimulation sub-
scale to the model results in some changes in statistical significance in the
coefficients in comparison to the previous model. The introduction of the
cognitive stimulation scale attenuates the coefficient of the social housing
indicator which is now statistically insignificant for children aged 10 to 18
years. Among children between the ages of 6 and 9 years and 10 and 18
years maternal qualifications were not related to children’s achievement when
the quality of the home environment was controlled. The remaining
statistically significant associations between family poverty and test scores
15
are still present. Overall, the predictor variables accounted for between 42
and 53% of the variance in the achievement scores of children.
To investigate whether the weak relationships between PPVT test
scores and neighbourhood deprivation was the result of a strong correlation
between individual residence in council housing and area deprivation
characteristics, the models were estimated omitting the social housing
indicator. The coefficient of the Townsend score remained unchanged
strengthening the conclusion of a weak relationship between children’s PPVT
test scores and area deprivation. To investigate differences in average PPVT
test scores by ward deprivation, residuals from the regressions of test scores
on the child and family predictors in Table 4 but omitting the Townsend score
are broken down by Townsend quintile in Table 6. Nonzero values indicate
the presence of systematic error in the estimates. Positive values indicate
PPVT scores that on average were underestimated by the predictor variables,
and negative values show the categories where overestimates were made.
The discrepancy between actual and predicted test scores is modest
indicating that average test scores are only weakly related to ward
deprivation. Children aged 4 to 5 years living in the most deprived quintile of
wards have test scores which are higher than might be expected from
measures of deprivation as is also the case for children aged 10 to 18 years
living in the least deprived quintile wards. No evidence of significant
underestimation of PPVT test scores was found although mean predicted
PPVT test scores of children aged 10 to 18 years living in the 2nd quintile of
ward deprivation were lower than actual values but only by 1 to 2%.
To test the hypothesis that neighbourhood deprivation and family
poverty operate through psychological as well as family interaction
dimensions, the HOME cognitive stimulation subscale was regressed on
neighbourhood and family variables. It was expected that mothers would
provide higher quality home environments if they had higher levels of
education. Adolescent mothers were expected to provide lower quality home
environments for their children than were mothers who delayed childbearing.
Many factors that put adolescents at risk for early childbearing (e.g. poor
family relationships, poor school performance) could also put them at risk for

16
providing relatively unsupportive home environments. A large number of
children were expected to contribute to higher levels of stress and
consequently less supportive home environments.
Table 7 presents the results of separate regression analyses of the
HOME cognitive stimulation score for each age group. The percentage of
variance in HOME scores accounted for by the models ranged from 21 to
23%. Consistent with expectations, mothers who provided better quality home
environments, were older at the time of their first births, were more highly
educated and scored higher on the test of general ability at age 11. Moreover,
as shown in Table 5, the regression controlling for the home environment
resulted in a reduction of the effect of highest educational qualification on
PPVT test scores (among children aged between 6 and 9 and 10 and 18
years), whereas the home environment was associated with higher PPVT test
scores. Thus, the association between highest educational qualification and
test scores appears to be mediated by the home environment. The gender of
the child made a modest unique contribution to predicting HOME scores. Girls
appear to have more cognitively stimulating home environments than do
boys. Children’s home environments were however only weekly associated
with neighbourhood deprivation. At the neighbourhood level, local
characteristics were only associated with less cognitively stimulating homes
net of all other effects in the case of children 4-5 years living in the most
deprived neighbourhoods. The Townsend score of the neighbourhood of
residence does not appear to influence socialization and norms for parenting
(Wilson 1991; Sampson, Raudenbush & Earls, 1997) independently of family
poverty, family structure and mother’s employment. The contextual factors
that contributed uniquely to home scores were presence of spouse or partner
in the home among children between 4 and 5 years of age and residence in
social housing among children aged 6 to 9 years and 10 to 18 years. Mothers
who lived in better quality accomodation and a spouse or partner in the home
provided more supportive environments.

17
DISCUSSION
Bearing caution in mind, we arrive at the following general conclusions.
First, the presence of concentrated poverty in the neighbourhood seemed to
be associated with poor child outcomes for at least some children between
the ages of 4 and 5 years. Children from more deprived neighbourhoods have
lower test scores than children from more affluent neighbourhoods,
suggesting that the effects of neighbourhood deprivation are not accounted
for by the number of other risk factors present in our analyses. Second, the
size of the estimated effects of neighbourhood conditions was usually much
smaller than the estimated effects of family level conditions. For example,
family-level measures such as residence in social housing and maternal
schooling were almost always fairly powerful predictors of children’s cognitive
development. In contrast, both the size and statistical significance of
coefficients on the neighbourhood measures were usually smaller than those
of family-level measures. Thus, it appears that families still should be viewed
as the key agents in promoting positive development in children.
This paper can be viewed as outlining a framework regarding potential
neighbourhood influences on young children. Further work should be
conducted in order to understand the extent to which neighbourhood
variables are proxies for ongoing neighbourhood-level processes. While one
conclusion to draw from our results is that family effects on children
overshadow neighbourhood effects, the potential remains for uses of
neighbourhood variables that are different from the factors presented here or
based on different neighbourhood boundaries and for examining additional
area characteristics more pertinent to children, such as quality of health
services or school quality, that may moderate neighbourhood effects. In
addition in depth knowledge of neighbourhood characteristics either from
ethnographic studies or from the refined observational methods of
developmental psychology is needed not only to understand mechanisms of
neighbourhood influences but also to pursue the bidirectional influences
between families and their neighbours. Since the neighbourhood effects net
18
of family characteristics are modest in this paper, a future emphasis on
variation within neighbourhoods is suggested.
Our results are similar to those of Brooks-Gunn et al. (1997). In both
studies neighbourhood conditions are significant predictors of developmental
outcomes around the time of transition to school. We had assumed that the
scope for neighbourhood effects would grow as children pass from early to
middle childhood and from middle childhood to adolescence. Implicit in this
view is the assumption that neighbourhood influences are direct and that they
depend on the amount of time children spend away from parents and homes.
Theoretical discussion points to potentially important indirect effects of
neighbourhood contexts on young children through daycare; the safety and
stimulation of parks, playgrounds, and other neighbourhood resources and
the parenting practices within children’s homes. Even throughout the school
years, when hypothesised indirect effects of neighbourhoods are thought to
operate through peers and schools, parents still supervise much of older
children’s and adolescents’ time. The educational attainment of parents also
has a very significant impact on children’s own achievements. The size of this
intergenerational transmission is large. It demonstrates that an important part
of an individual’s achievements is shaped by the achievements of their
parents (Dearden, Machin & Reed, 1997).
In our analyses the effects of neighbourhood deprivation did not
appear to be mediated by the home environment. HOME scores did mediate
the effects of family poverty and cohort member educational qualifications on
child test scores in children aged 10 and over. Families with young children
living in better standard accomodation and with more educated cohort
member parents were associated with better home environments, which in
turn are associated with higher test scores. The mediation effect is not due to
the HOME scores being correlated with other family factors, such as maternal
education or teenage motherhood. It is likely that poor parents, given the
stresses in their lives, spend less time in provision of so-called learning
experiences. Other aspects of parental behaviour, such as responsiveness,
control and harshness, may also mediate the relationship between family
19
poverty and child test scores (Conger, Elder, Lorenz, Conger, Simons,
Whitbeck et al., 1990).
The effect of family poverty on the test scores of children in early
childhood, with children from more deprived families doing worse on tests,
may be attributed in part to the effects of poverty on parental behaviour which
may then have an effect on children. Our results showed that the home
learning environment played a mediating role. Other theoretically driven
measures of process – for example, paternal supervision or monitoring, family
organisation, consistency in routines, parental self-efficacy – were not
available in our data set, preventing us from estimating the mediated models
needed to provide a convincing explanation of how neighbourhood effects
work. This research joins the existing literature suggesting that family
characteristics matter most to child development. This research supports
continued efforts to develop new forms of family level and individual level
intervention that are likely to help low income children who live in urban
neighbourhoods. This research does not suggest any reasons to cease
neighbourhood oriented (or community oriented) programmes that help low-
income children who live in deprived neighbourhoods. The significant linkages
found between family poverty and the home environment and between the
home environment and children’s test scores suggest policies to improve
parenting and relieve family poverty would improve the test scores of children.
One might argue that priority should be given to factors that are likely to have
multiple benefits, particularly if they influence child development from an early
age. One feature of early life worthy of serious consideration is preschool
care and education, which could be justified on the grounds that preschool
child development programmes are associated, in particular, with improved
school readiness, from which other benefits follow, including improved
adolescent socioemotional functioning, and thereafter educational
achievement and adult social position.
Our study has several limitations. Most significantly we are unable to
distinguish non-random selection processes from genuine neighbourhood
effects. Sociologists have worried about the fact that the family-level variables
often measured in neighbourhood studies do not control for unmeasured

20
differences in families who reside in one neighbourhood versus another thus
neighbourhood effects may simply be a reflection of the families who come to
live in certain neighbourhoods (Tienda, 1991; Duncan et al. 1997). If
important unmeasured characteristics of individuals lead them both to choose
certain kinds of neighbourhoods and to have different outcomes, then the
apparent effects of neighbourhoods that we estimate in our models could
either over- or understate true effects. It is difficult to predict the likely
direction in which the selection process might bias estimates of
neighbourhood influences. However, individuals especially ill-equipped to
handle bad neighbourhoods probably are most likely to live in them because
these individuals lack the (partly unmeasured) wherewithal to move to better
neighbourhoods. In this case, the coincidence of a poor neighbourhood and
individuals poor outcomes results from the inability to avoid either, thus
leading to an overestimation of current neighbourhood conditions’ effects.
Conversely neighbourhood choices may be dominated by considerations of
economic and social consequences. If this capacity is not captured in
measured characteristics, then the coincidence of positive outcomes and
living in a better neighbourhood would be misattributed to current
neighbourhood conditions and lead to an overestimation of neighbourhood
effects.
Another limitation of the analyses is that the neighbourhood
characteristics are not those considered most relevant to neighbourhood
effects on individuals by most researchers investigating neighbourhood
effects. Although the decennial census provides a detailed characterisation of
the sociodemographic characteristics of electoral wards, these characteristics
bear weak relations to the theoretical concepts of interest (Duncan et al.,
1997). For example, there are no measures of the social capital that binds
neighbourhoods together or other key neighbourhood compositional factors
such as the level of violence and substance abuse in the neighbourhood. As
far as teenagers are concerned the electoral ward may be a poor substitute
for measurements on school and peer groups. Given these concerns, we
must be cautious about drawing firm conclusions regarding the size and
nature of neighbourhood effects. Despite these limitations, the study provides

21
useful information on the determinants of parenting and child outcomes,
which earlier studies with smaller samples could not provide.
REFERENCES
Aber, J.L., Gephart, M., Brooks-Gunn, J., Connell, J. Spencer, M.B. (1997).
Neighborhood, family and individual processes as they influence child and
adolescent outcomes. In J. Brooks-Gunn, G. Duncan and J.L. Aber (Eds.),
Neighbourhood Poverty: Context and Consequences for Development (pp.
44-61). New York: Russell Sage Foundation.
Blos, H., Huston, A., Granger, R., Duncan, G.J., Brock, T. and McLoyd, V.
(1999). Can anti-poverty programs improve family functioning and enhance
children’s well-being. Joint Centre for Poverty Research, Northwestern
University, Working Paper 103.
Brooks-Gunn, J., Duncan, G.J., Klebanov, P.K. and Sealand, N. (1993). Do
neighborhoods affect child and adolescent development? American
Journal of Sociology, 99, 353-395.
Brooks-Gunn, J., Duncan, G. and Aber, J.L. (Eds.) (1997). Neighborhood
Poverty: Context and Consequences for Development. New York: Russell
Sage Foundation.
Chase-Lansdale, P.L., Gordon, R., Brooks-Gunn, J. and Klebanov, P.K.
(1997). Neighborhood and family influences on the intellectual and
behavioural competence of preschool and early school-age children. In J.
Brooks-Gunn, G. Duncan and J.L. Aber (Eds.), Neighborhood Poverty:
Context and Consequences for Development (pp. 79-118). New York:
Russell Sage Foundation.
Clarke, L., Di Salvo, P., Joshi, H. and Wright, J. (1997). Stability and
instability in children’s lives: longitudinal evidence from Great Britain,
Research Paper 97-1, Centre for Population Studies, London School of
Hygiene and Tropical Sciences.
Coleman, J. (1988). Social capital in the creation of human capital. American
Journal of Sociology 94 (Supplement), S95-S120.

22
Conger, R.D., Elder, G.H., Lorenz, F.O., Conger, K.J., Simons, R.L.,
Whitbeck, L.B., Huck, S. and Melby, J.N. (1990). Linking economic
hardship to marital quality and instability. Journal of Marriage and the
Family, 52, 643-656.
Davies, H., Joshi, H. and Clarke, L. (1997). Is it cash the deprived are short
of? Journal of the Royal Statistical Society, Series A, 160, 107-126.
Dearden, L., Machin, S. and Reed, H. (1997). Intergenerational mobility in
Britain. Economic Journal, 107, 47-66.
Duncan. G.J., Connell. J.P. and Klebanov, P.K. (1997). Conceptual and
methodological issues in estimating causal effects of neighborhoods and
family conditions on individual development. In J. Brooks-Gunn, G. Duncan
and J.L. Aber (Eds.), Neighborhood Poverty: Context and Consequences
for Development (pp. 219-250). New York: Russell Sage Foundation.
Dunn, L. and Markwardt, C. (1970). Peabody Individual Achievement Test
Manual. Circle Pine, Minnesota, American Guidance Service.
Evans, W.N., Oates, W.E. and Schwab, R.M. (1992). Measuring peer group
effects: a study of teenage behaviour. Journal of Political Economy, 100,
966-991.
Ferri, E. (1993). Life at 33: the Fifth Follow-up of the National Child
Development Study, National Children’s Bureau, London.
Glass, N. (1999). Sure Start: the development of an early intervention
programme for young children in the United Kingdom. Children and
Society, 13, 257-264.
Glennester, H., Lupton, R., Noden, P. and Power, A. (1999). Poverty, Social
Exclusion and Neighbourhood: Studying the area bases of social
exclusion. CASEPaper 22, Centre for the Analysis of Social Exclusion,
London School of Economics.
Graber, J.A. and Brooks-Gunn, J. (1996). Transitions and turning points.
Navigating the passage from childhood through adolescence.
Developmental Psychology, 32, 768-776.
Green, A. (1996). Aspects of the changing geography of poverty and wealth.
In: J. Hills (Ed.) New Inequalities: The Changing Distribution of Income and
Wealth in the United Kingdom. Cambridge: Cambridge University Press.

23
Hills, J. (1996). New Inequalities: The Changing Distribution of Income and
Wealth in the United Kingdom. Cambridge: Cambridge University Press.
Joshi, H., Cooksey, E., Wiggins, R.D., McCulloch, A., Verropoulou, G. and
Clarke, L. (1999). Diverse family living situations and child development: a
multi-level analysis comparing longitudinal evidence from Britain and the
United States. International Journal of Law, Policy and the Family, 13, 292-
314.
Klebanov, P.K., Brooks-Gunn, J., and Duncan, G.J. (1994). Does
neighborhood and family poverty affect mothers’ parenting, mental health
and social support? Journal of Marriage and the Family, 56, 441-455.
Klebanov, P.K., Brooks-Gunn, J., Chase-Landsdale, P.L. and Gordon, R.A.
(1997). Are neighborhood effects on young children mediated by features
of the home environment ? In J. Brooks-Gunn, G. Duncan and J.L. Aber
(Eds.), Neighbourhood Poverty: Context and Consequences for
Development (pp. 119-145). New York: Russell Sage Foundation.
Klebanov, P.K., Brooks-Gunn, J., McCarton, C. and McCormick, M.C. (1998).
The contribution of neighborhood and family income to developmental test
scores over the first three years of life. Child Development, 69, 1420-1436.
Lee, P. (1999) Where are the deprived ? Measuring deprivation in cities and
regions. In D. Dorling and S. Simpson (Eds.), Statistics in Society : The
Arithmetic of Politics (pp. 172-180). London. Arnold.
Leventhal, T. and Brooks-Gunn, J. (2000). The neighborhoods they live in:
the effects of neighborhood residence on child and adolescent outcomes.
Psychological Bulletin, 126, 309-337.
Ludwig, J., Duncan, G.J. and Hirschfield, P. (1998). Urban poverty and
juvenile crime: evidence from a randomized housing-mobility experiment.
Joint Centre for Poverty Research, Northwestern University, Working
Paper 55.
Macintyre, S., Maciver, S. and Sooman, A. (1993). Area, class and health:
should we be focusing on places or people. Journal of Social Policy, 22,
213-234.
Matthews, M. (1987). Gender, home range and environmental cognition.
Transactions Institute of British Geographers, 12, 43-56.

24
McCulloch, A. and Joshi, H. (1999). Child development and family resources:
an exploration of evidence from the second generation of the 1958 British
birth cohort. Institute of Social and Economic Research, University of
Essex, Working Paper 99-15.
Noble, M. and Smith, G. (1996). Changing patterns of income and wealth in
two contrasting areas. In: Hills, J. (Ed.) New Inequalities: The Changing
Distribution of Income and Wealth in the United Kingdom. CUP.
Parke, R.D. and Bhavnagri, N.P. (1989). Parents as managers of children’s
peer relationships. In: Belle, D. (Ed.) Children’s Social Networks and Social
Supports pp. 241-259 New York, John Wiley & Sons.
Peeples, F. and Loeber, R. (1994). Do individual factors and neighborhood
context explain ethnic differences in juvenile delinquency? Journal of
Quantitative Criminology, 10, 141-157.
Raudenbush, S.W. and Willms, J.D. (1995). The estimation of school effects.
Journal of Educational and Behavioural Statistics, 20, 307-335.
Rutter, M. (1983). School effects on pupil progress: Research findings and
policy implications. Child Development, 54, 1-29.
Sampson, R.J. (1992). Family management and child development: Insights
from social disorganization theory. In: McCord, J. (Ed.) Facts, Frameworks
and Forecasts: Advances in Criminological Theory Vol. 3 pp. 63-93 New
Bruswick, NJ: Transaction Publishers.
Sampson, R.J. and Groves, W.B. (1989). Community structure and crime:
Testing the social disorganization theory. American Journal of Sociology,
94, 774-802.
Sampson, R.J., Raudenbush, S.W. and Earls, F. (1997). Neighborhoods and
violent crime: A multilevel study of collective efficacy. Science, 277, 918-
924.
Smith, J.R., Brooks-Gunn, J. and Klebanov. P.K. (1997). Consequences of
living in poverty for Young Children’s cognitive and verbal ability and early
school achievement. In Duncan and Brooks-Gunn (Eds.) Consequences of
growing up poor (pp. 132-189). New York, Russell Sage Foundation.

25
South, S.J. and Crowder, K.D. (1999). Neighborhood effects on family
formation: concentrated poverty and beyond. American Sociological
Review, 64, 113-132.
Sugland, B., Zaslow, M., Smith, J., Brooks-Gunn, J., Coates, D., Blumenthal,
C., Moore, K., Griffin, T. and Bradley, R. (1995). The early childhood HOME
Inventory and HOME Short Form in differing racial/ethnic groups: are there
differences in underlying structure, internal consistency of subscales, and
patterns of prediction. Journal of Family Issues, 16, 632-663.
Tienda, M. (1991). Poor people and poor places: Deciphering neighborhood
effects on poverty outcomes. In Huber, J (Ed.) Macro-micro linkages in
sociology (pp. 244-267). Thousand Oaks, CA: Sage.
Townsend, P., Phillimore, P. and Beattie, A. (1989). Health and Deprivation.
London: Routledge.
Wilson, W.J. (1987). The Truly Disadvantaged: the Inner City, the
Underclass, and Public Policy. Chicago: Chicago University Press.
Wilson, W.J. (1991). Studying inner-city social dislocations: The challenge of
public agenda research. American Sociological Review, 56, 1-14.

26
Table 1. Means of variables for children of different age groups.
CHILD AGE
4-5 YEARS 6-9 YEARS 10+ YEARS
CHILD AGE (MONTHS) 59.41 94.25 146.18
GIRL 0.50 0.52 0.51
NUMBER OF CHILDREN 2.30 2.33 2.44
AGE FIRST BIRTH (YEARS) 26.01 23.84 20.271COHORT MEMBERS HIGHEST QUALIFICATION 2.53 2.23 1.54
SOCIAL HOUSING 0.14 0.22 0.39
CAR ACCESS 0.88 0.88 0.81
HOME: COGNITIVE STIMULATION 12.84 10.89 9.90
PPVT TEST SCORE 0.32 0.51 0.66
TOWNSEND DEPRIVATION SCORE -0.03 0.28 1.422NET HOUSEHOLD INCOME / MONTH 321.35 309.50 279.64
COHORT MEMBERS GENERAL ABILITY AGE 11 47.06 44.73 39.84
COHORT MEMBERS PARENTS SEPARATED 0.14 0.16 0.24
INTACT FAMILY + NON WORKING MOTHER 0.46 0.38 0.28
INTACT FAMILY + WORKING MOTHER 0.49 0.49 0.39
STEP FAMILY + NON WORKING MOTHER 0.004 0.02 0.08
STEP FAMILY + WORKING MOTHER 0.008 0.04 0.13
LONE MOTHER + NON WORKING 0.02 0.03 0.04
LONE MOTHER + WORKING 0.02 0.04 0.07
NUMBER OF CASES 609 1057 7601Cohort members’s highest educational qualification: 0 = none to 5 = degree.2Number of cases for which net income is available are respectively: 440, 752 and 556.

27
Table 2. Means of variables for quintiles of Townsend deprivation score (I least deprived to V most deprived).
TOWNSEND QUINTILE
I II III IV V
CHILD AGE (MONTHS) 91.07 98.07 102.30 106.28 112.25
GIRL 0.50 0.49 0.50 0.53 0.51
NUMBER OF CHILDREN 2.24 2.29 2.47 2.27 2.51
AGE FIRST BIRTH (YEARS) 24.53 23.69 22.98 22.96 22.00
COHORT MEMBERS HIGHEST QUALIFICATION 2.59 2.30 1.93 1.96 1.56
SOCIAL HOUSING 0.07 0.18 0.24 0.24 0.43
CAR ACCESS 0.96 0.91 0.88 0.84 0.74
HOME: COGNITIVE STIMULATION 11.66 11.27 11.04 10.86 10.25
PPVT TEST SCORE 0.49 0.51 0.51 0.52 0.521NET INCOME 364.64 317.35 298.52 286.61 255.12
COHORT MEMBERS GENERAL ABILITY AGE 11 48.20 47.25 43.33 40.50 37.84
COHORT MEMBERS PARENTS SEPARATED 0.15 0.19 0.19 0.19 0.20
INTACT FAMILY + NON WORKING MOTHER 0.42 0.44 0.37 0.36 0.34
INTACT FAMILY + WORKING MOTHER 0.51 0.44 0.51 0.45 0.43
STEP FAMILY + NON WORKING MOTHER 0.02 0.01 0.02 0.04 0.05
STEP FAMILY + WORKING MOTHER 0.02 0.04 0.05 0.07 0.06
LONE MOTHER + NON WORKING 0.01 0.03 0.02 0.03 0.07
LONE MOTHER + WORKING 0.02 0.04 0.03 0.05 0.06
NUMBER OF CASES 437 449 479 479 4831Number of cases for which net income is available are respectively: 305, 306, 344, 358, 356.
28
Table 3: Regression results. Regression coefficients and t-statistics of factors predicting children’s PPVT scores.
4-5 YEARS 6-9 YEARS 10+YEARS
β t β t β t
CONSTANT -2.70 -1.02 -2.78 -2.19 3.19 2.03
AGE (months) 0.14 1.54 0.13 4.74 0.02 1.18
AGE-SQUARED/100 -0.06 -0.77 -0.04 -3.08 -0.00 -0.03
GIRL 0.04 0.52 -0.12 -2.48 0.00 0.01
NEIGHBOURHOOD DEPRIVATION QUINTILE
II -0.27 -2.68 0.04 0.54 0.19 1.61
III -0.35 -3.26 -0.15 -1.95 0.01 0.09
IV -0.30 -2.70 -0.22 -2.91 -0.10 -0.84
V -0.60 -5.37 -0.44 -5.48 -0.21 -1.90
R2 0.29 0.44 0.27

29
Table 4: Regression Results.
4-5 YEARS 6-9 YEARS 10+YEARS
β t β t β t
CONSTANT -3.09 -1.11 -5.29 -3.95 -2.15 -1.21
AGE (months) 0.10 1.09 0.14 5.31 0.05 2.41
AGE-SQUARED/100 -0.03 -0.36 -0.05 -3.52 -0.01 -0.81
GIRL 0.05 0.68 -0.10 -2.02 0.02 0.39
NEIGHBOURHOOD DEPRIVATION QUINTILE
II -0.18 -1.77 0.08 1.12 0.28 2.39
III -0.17 -1.48 0.00 -0.02 0.17 1.48
IV -0.08 -0.72 -0.05 -0.70 0.13 1.14
V -0.32 -2.66 -0.07 -0.81 0.15 1.34
INTACT FAMILY + WORKING MOTHER 0.08 1.06 -0.01 -0.19 0.10 1.26
STEP FAMILY + NON WORKING MOTHER − − 0.22 1.34 0.13 1.06
STEP FAMILY + WORKING MOTHER − − -0.35 -2.61 -0.07 -0.66
LONE MOTHER + NON WORKING 0.16 0.56 -0.37 -2.27 0.09 0.61
LONE MOTHER + WORKING 0.15 0.49 -0.09 -0.59 0.17 1.24
COHORT MEMBERS HIGHEST QUALIFICATION 0.09 2.81 0.05 2.44 0.08 2.47
COHORT MEMBERS GENERAL ABILITY AGE 11 0.01 2.89 0.01 6.02 0.01 5.51
NUMBER OF CHILDREN 0.03 0.64 -0.01 -0.52 -0.03 -1.12
AGE FIRST BIRTH (YEARS) 0.03 1.64 0.04 2.98 0.10 3.65
SOCIAL HOUSING -0.39 -3.01 -0.12 -1.72 -0.14 -2.08
CAR ACCESS -0.01 -0.05 0.11 1.32 0.13 1.44
COHORT MEMBERS PARENTS SEPARATED -0.05 -0.46 -0.07 -1.14 0.10 1.39
R2 0.39 0.53 0.41

30
Table 5: Regression Results.
4-5 YEARS 6-9 YEARS 10+YEARS
β t β t β t
CONSTANT -3.22 -1.18 -5.09 -3.82 -2.35 -1.35
AGE (months) 0.07 0.81 0.13 4.97 0.05 2.34
AGE-SQUARED/100 -0.01 -0.07 -0.04 -3.20 0.00 -0.70
GIRL 0.02 0.32 -0.11 -2.31 -0.01 -0.18
NEIGHBOURHOOD DEPRIVATION QUINTILE
II -0.18 -1.82 0.08 1.12 0.29 2.50
III -0.18 -1.62 -0.01 -0.18 0.15 1.28
IV -0.09 -0.80 -0.06 -0.77 0.11 1.04
V -0.29 -2.50 -0.07 -0.87 0.15 1.39
INTACT FAMILY + WORKING MOTHER 0.10 1.40 -0.01 -0.20 0.08 1.06
STEP FAMILY + NON WORKING MOTHER − − 0.22 1.36 0.11 0.94
STEP FAMILY + WORKING MOTHER − − -0.31 -2.35 -0.10 -0.92
LONE MOTHER + NON WORKING 0.27 0.94 -0.36 -2.18 0.17 1.16
LONE MOTHER + WORKING 0.32 1.06 -0.07 -0.48 0.17 1.29
COHORT MEMBERS HIGHEST QUALIFICATION 0.07 2.22 0.04 1.92 0.05 1.66
COHORT MEMBERS GENERAL ABILITY AGE 11 0.01 2.46 0.01 5.71 0.01 5.27
NUMBER OF CHILDREN 0.03 0.73 -0.01 -0.35 -0.02 -0.86
AGE FIRST BIRTH (YEARS) 0.02 1.30 0.04 2.64 0.08 3.01
SOCIAL HOUSING -0.37 -2.88 -0.11 -1.50 -0.09 -1.36
CAR ACCESS -0.03 -0.22 0.09 1.03 0.14 1.50
COHORT MEMBERS PARENTS SEPARATED -0.03 -0.30 -0.07 -1.04 0.09 1.28
HOME: COGNITIVE STIMULATION 0.10 4.24 0.04 2.78 0.08 5.04
R2 0.42 0.53 0.43

31
Table 6: Mean observed minus predicted values and 95% confidence limits for children’s PPVT scores by quintile of Townsend deprivation score.
4-5 YEARS 6-9 YEARS 10+ YEARS
TOWNSEND
QUINTILE
MEAN 95%
CONFIDENCE
INTERVAL
MEAN 95%
CONFIDENCE
INTERVAL
MEAN 95%
CONFIDENCE
INTERVAL
I 0.9 -0.5 − 2.3 0.1 -0.9 − 1.2 -1.5 -3.3 − 0.4
II -0.6 -2.0 − 0.7 0.9 -0.1 − 1.9 1.3 -0.1 − 2.6
III -0.6 -2.4 − 1.2 0.0 -1.0 − 1.1 0.2 -1.2 − 1.6
IV 0.5 -1.1 − 2.0 -0.4 -1.3 − 0.5 -0.2 -1.5 − 1.0
V -1.8 -3.7 − 0.1 -0.6 -1.8 − 0.6 -0.0 -1.1 − 1.1

32
Table 7: Regression Results. Regression coefficients and t-statistics of factors predicting HOME Cognitive Stimulation scores.
4-5 YEARS 6-9 YEARS 10+YEARS
β t β t β t
CONSTANT 80.91 4.03 -51.08 -1.45 39.16 0.84
AGE (months) 0.75 1.12 2.31 3.31 0.18 0.34
AGE-SQUARED/100 -0.57 -0.91 -1.16 -3.16 -0.07 -0.42
GIRL 2.19 1.83 3.65 2.90 4.66 2.91
NEIGHBOURHOOD DEPRIVATION QUINTILE
II -0.38 -0.22 0.16 0.08 -0.31 -0.10
III -0.15 -0.08 3.21 1.66 3.80 1.25
IV -0.94 -0.50 1.47 0.76 0.87 0.30
V -4.24 -2.15 1.18 0.54 0.16 0.05
INTACT FAMILY + WORKING MOTHER -2.33 -1.91 0.17 0.12 1.45 0.73
STEP FAMILY + NON WORKING MOTHER − − -0.62 -0.15 2.13 0.69
STEP FAMILY + WORKING MOTHER − − -8.76 -2.54 1.85 0.66
LONE MOTHER + NON WORKING -12.89 -2.59 -3.97 -0.91 -9.62 -2.50
LONE MOTHER + WORKING -14.10 -2.77 -4.24 -1.11 -0.51 -0.15
COHORT MEMBERS HIGHEST QUALIFICATION 2.29 4.62 2.79 4.94 3.28 4.14
COHORT MEMBERS GENERAL ABILITY AGE 11 0.16 3.30 0.15 3.05 0.07 1.23
NUMBER OF CHILDREN -0.97 -1.46 -1.12 -1.68 -0.90 -1.33
AGE FIRST BIRTH 0.53 1.97 1.33 3.35 2.04 2.84
SOCIAL HOUSING -2.95 -1.26 -4.02 -2.18 -6.66 -3.70
CAR ACCESS 1.13 0.50 6.37 2.85 -0.92 -0.38
COHORT MEMBERS PARENTS SEPARATED -0.56 -0.34 -1.78 -1.04 0.65 0.34
R2 0.23 0.21 0.21